
Modification Mechanism of Glass Fibers on Ordinary Portland Cement and Sulphoaluminate Cement Composites

Abstract
1. Introduction
2. Experiments
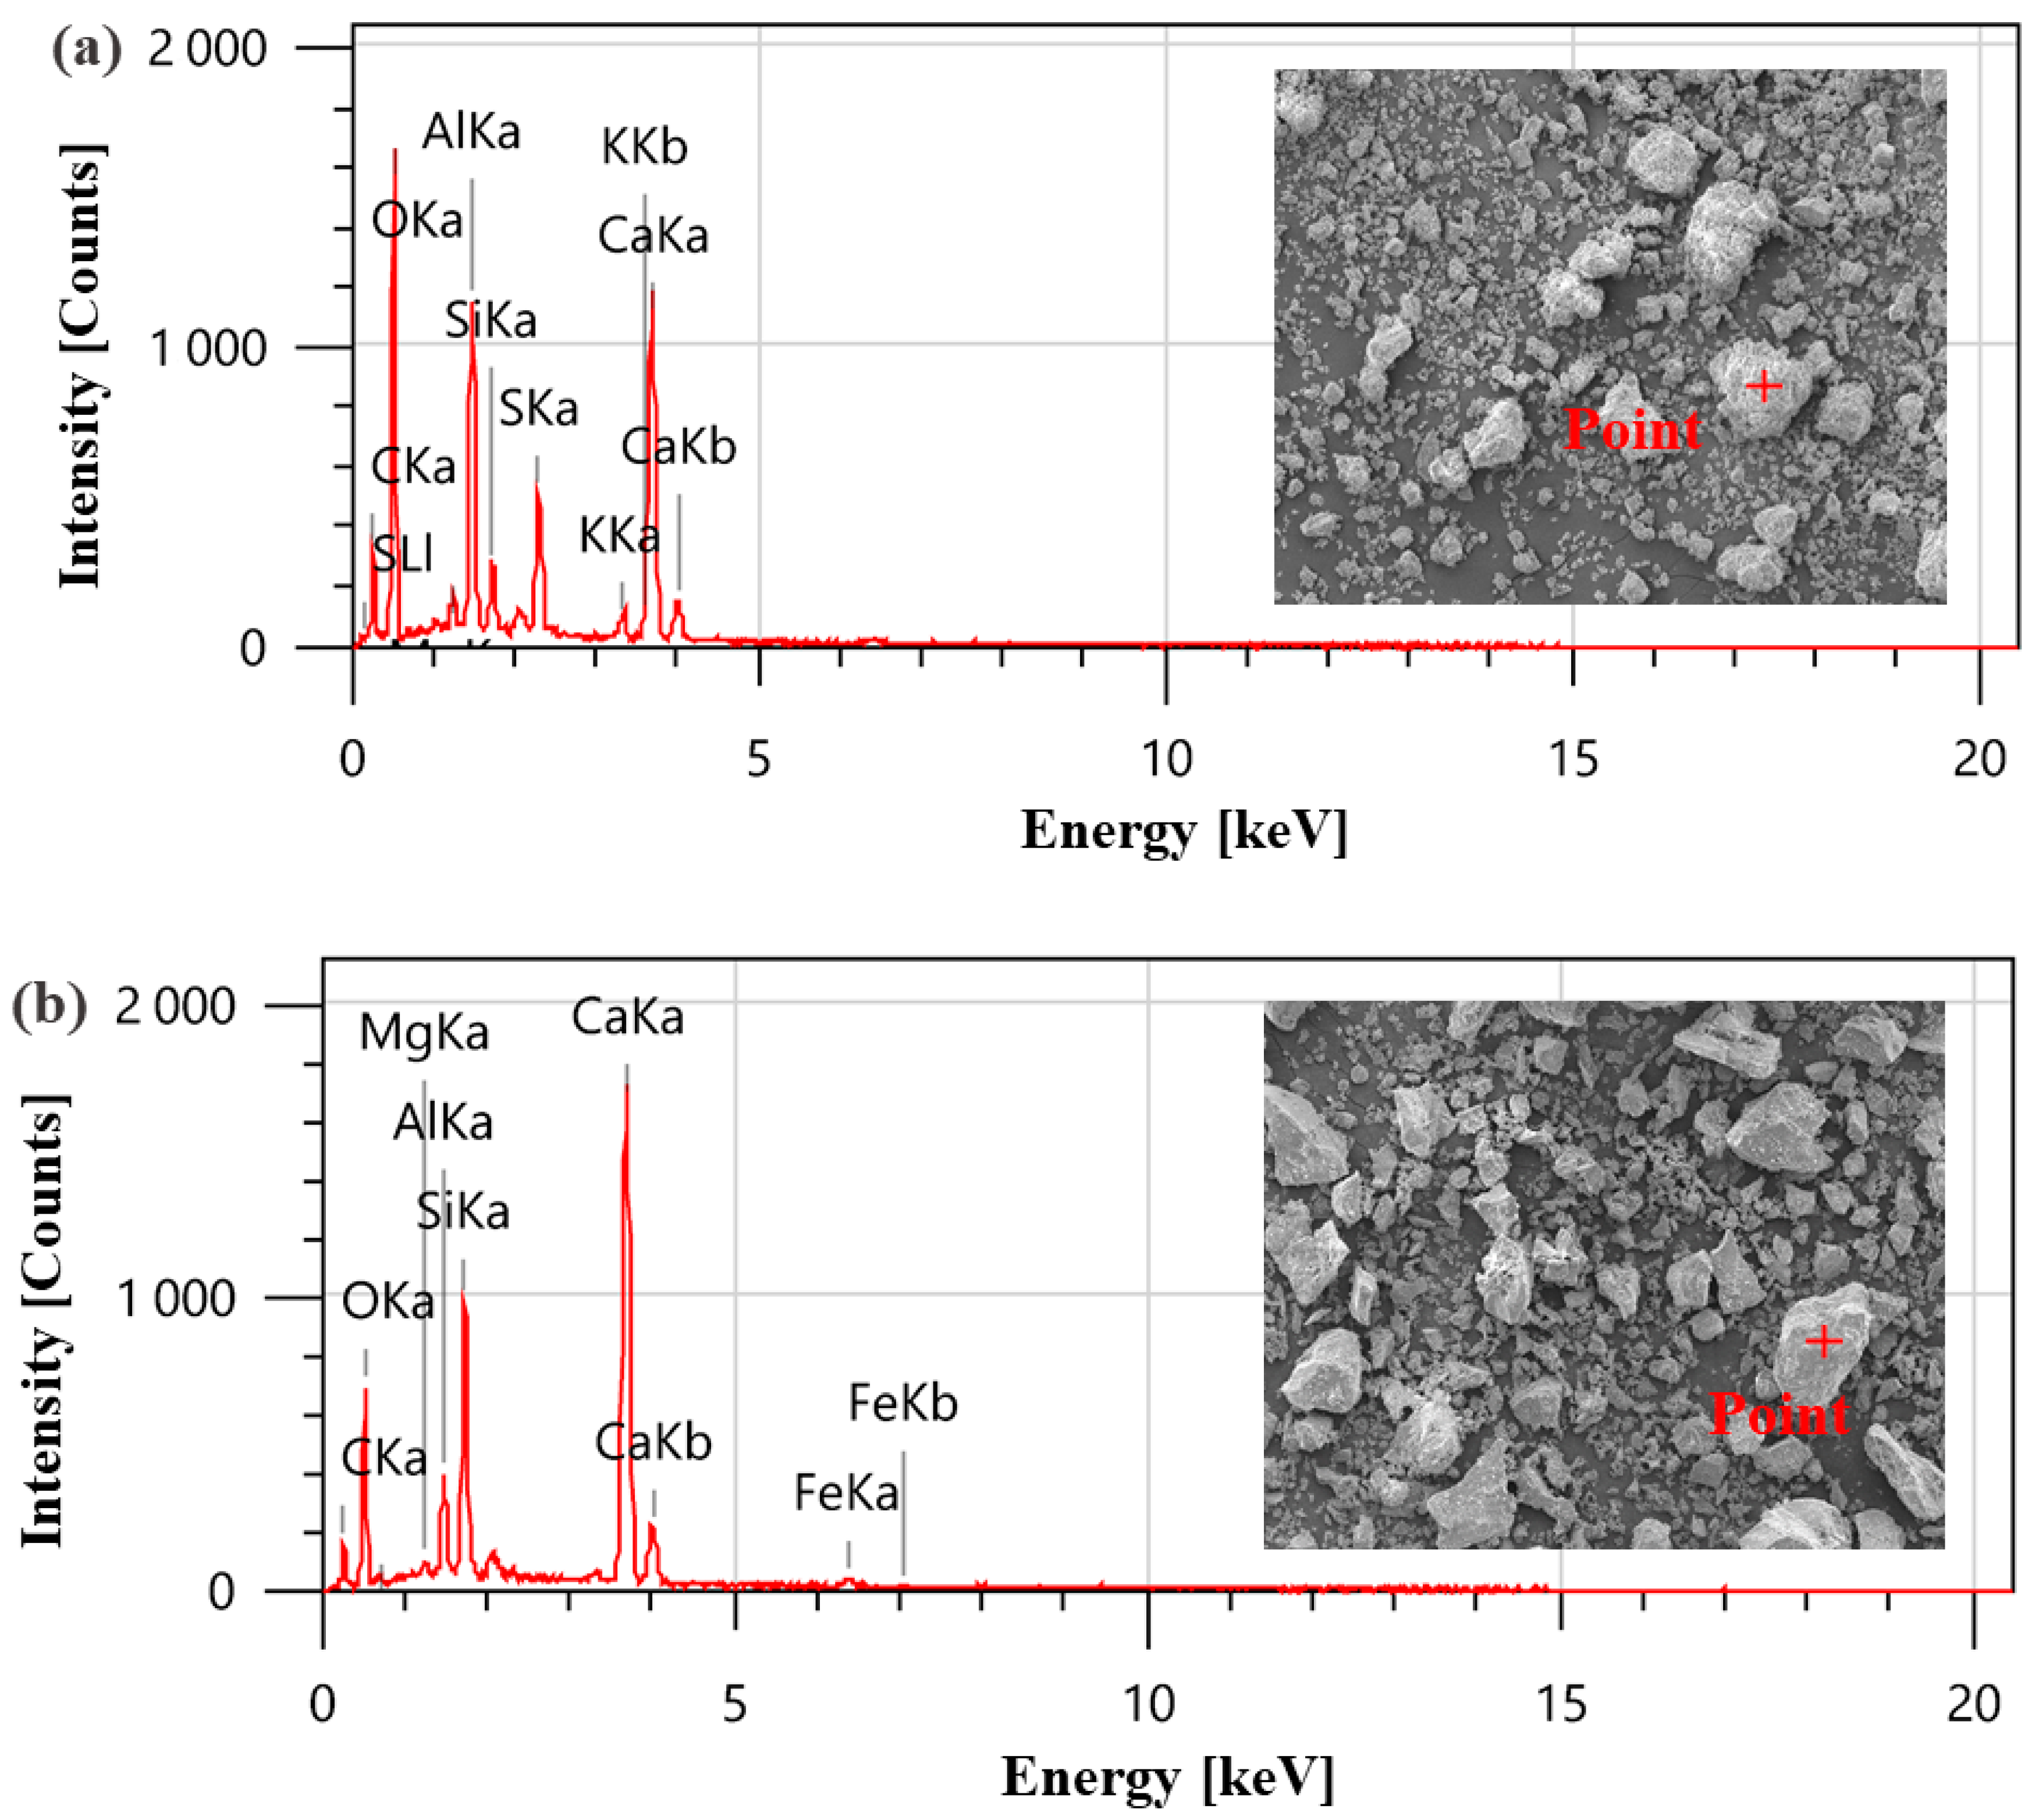
2.1. Raw Materials
2.2. Specimen Preparation
2.3. Test Methods
2.3.1. Fluidity Test
2.3.2. Mechanical Property Test
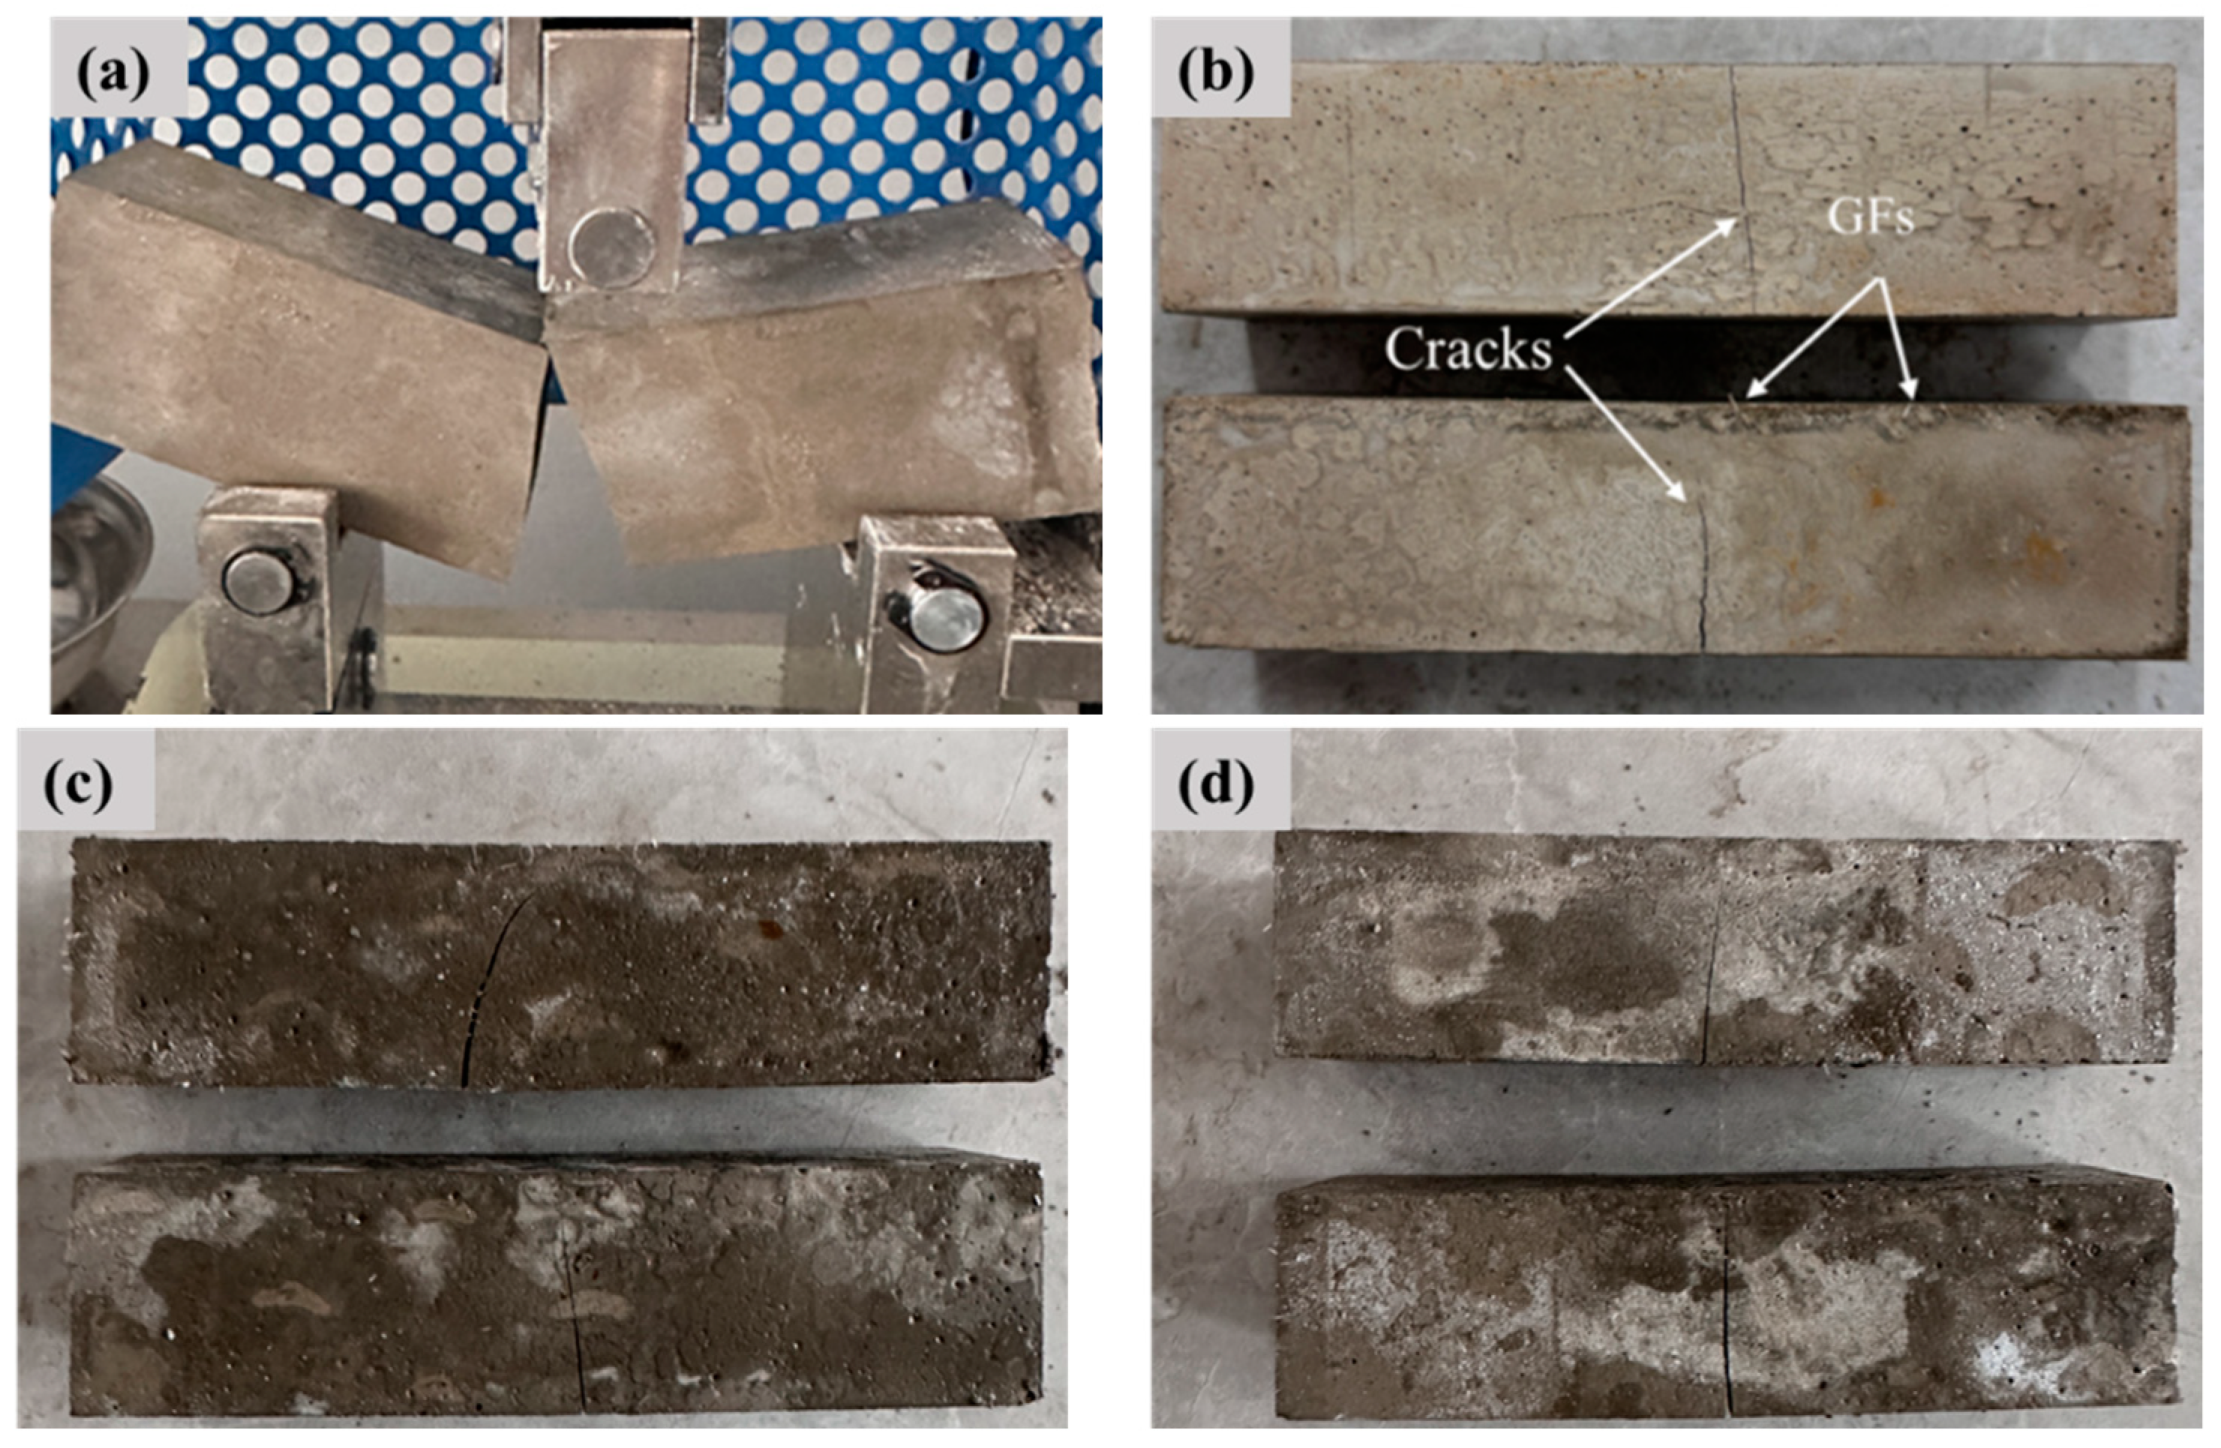
2.3.3. Bond Property Test
2.3.4. Dry Shrinkage Property Test
2.3.5. Microstructure Characterization
3. Results and Discussion
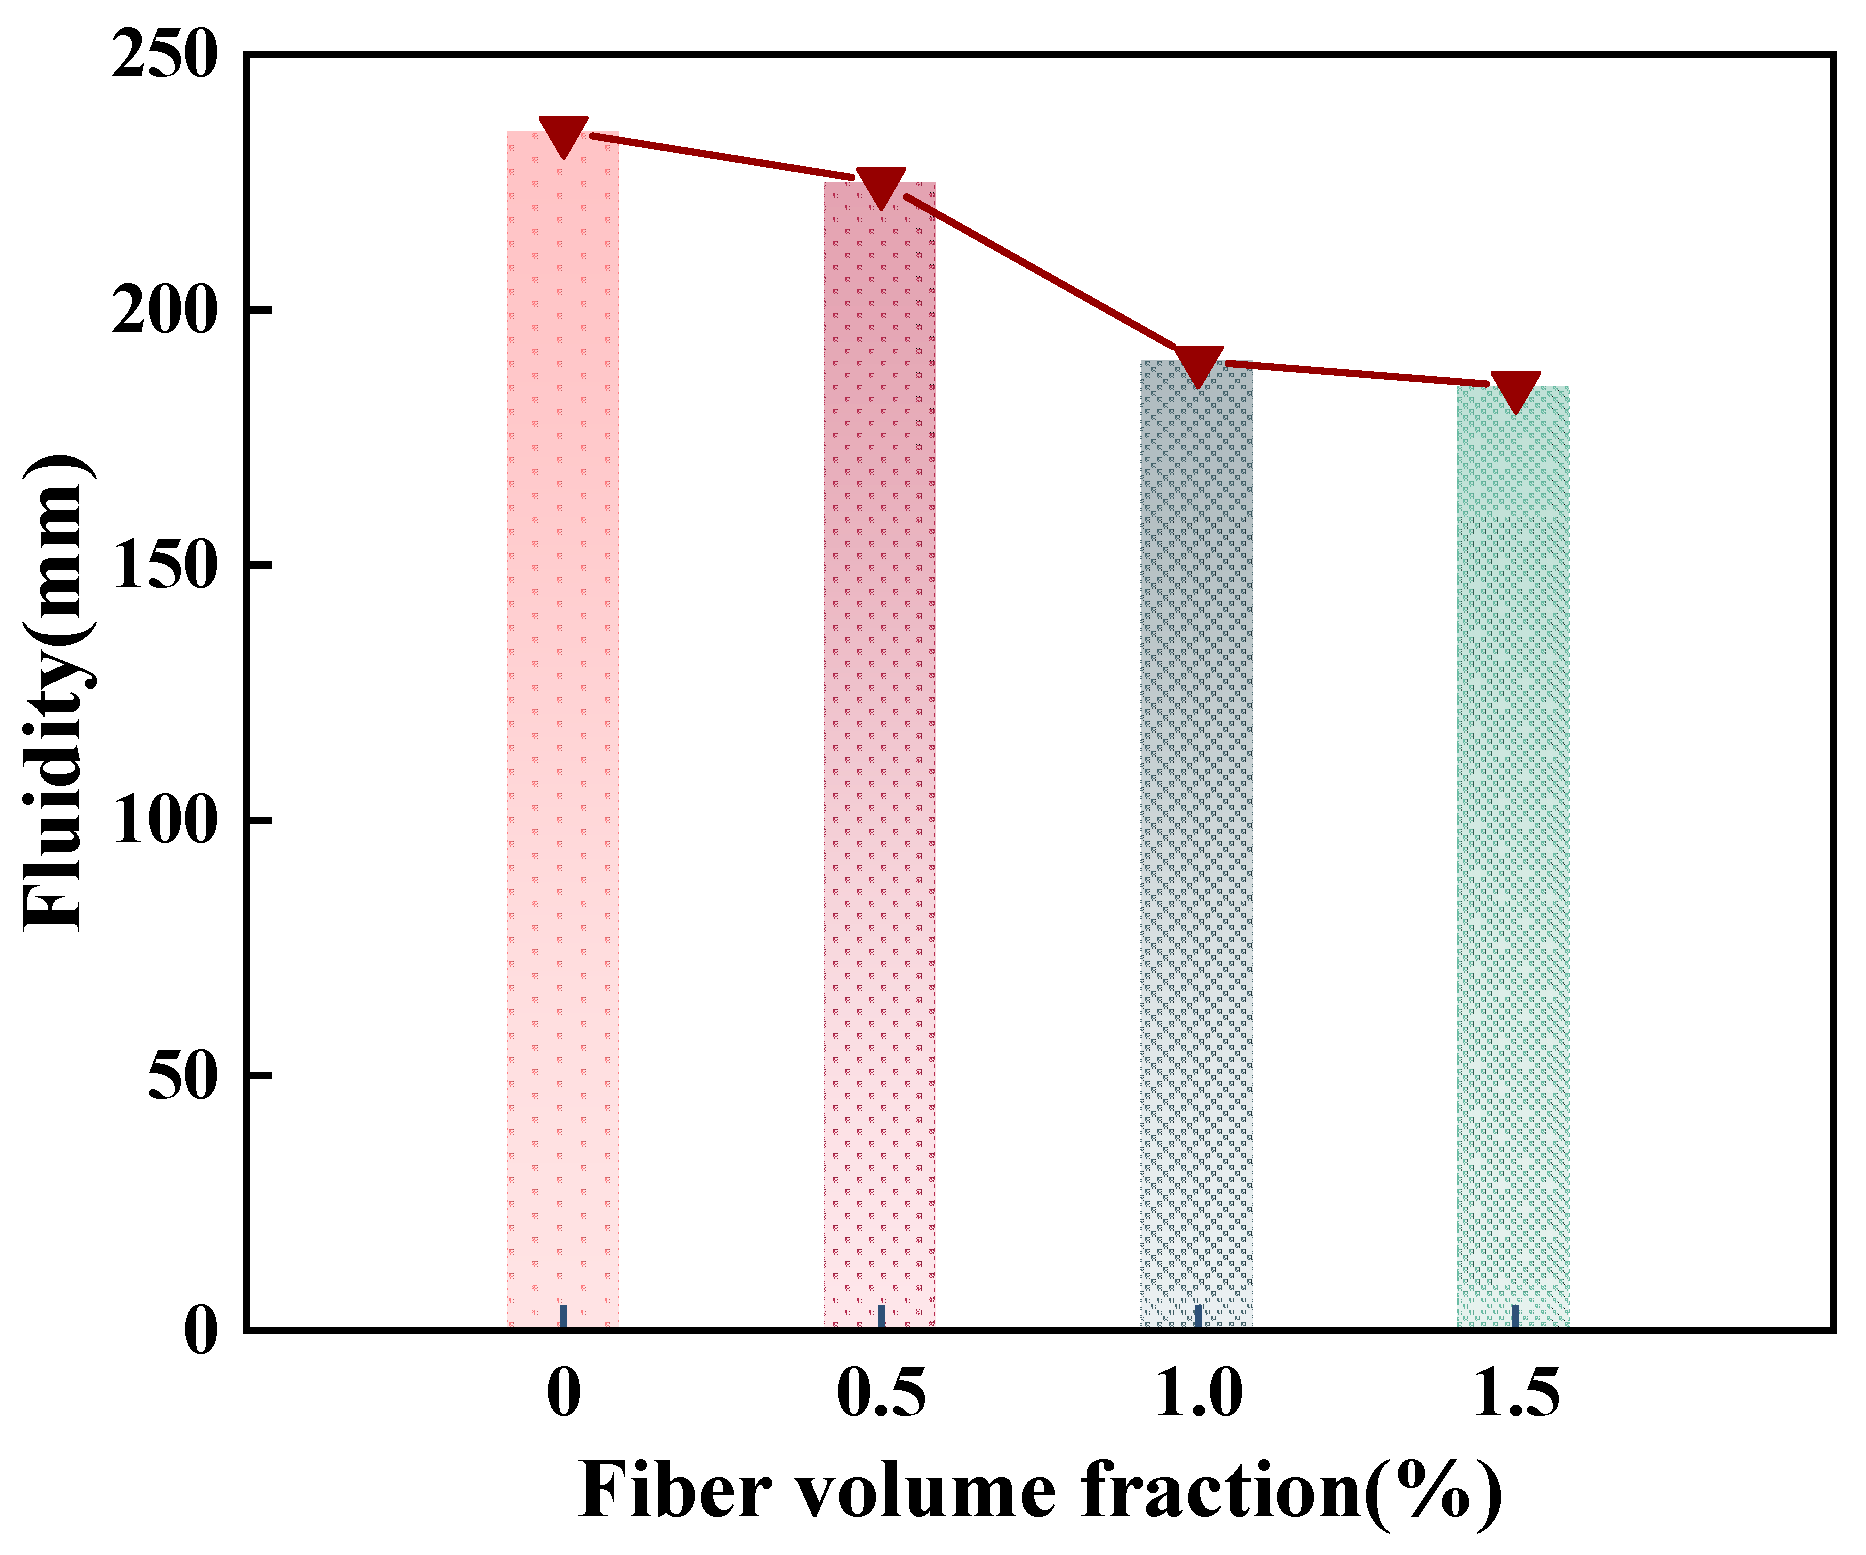
3.1. Fluidity of Ordinary Portland Cement and Sulphoaluminate Cement (OPC-SAC) Composites Containing Glass Fibers (GFs)
3.2. The Mechanical Properties of Ordinary Portland Cement and Sulphoaluminate Cement (OPC-SAC) Composites Containing Glass Fibers (GFs)
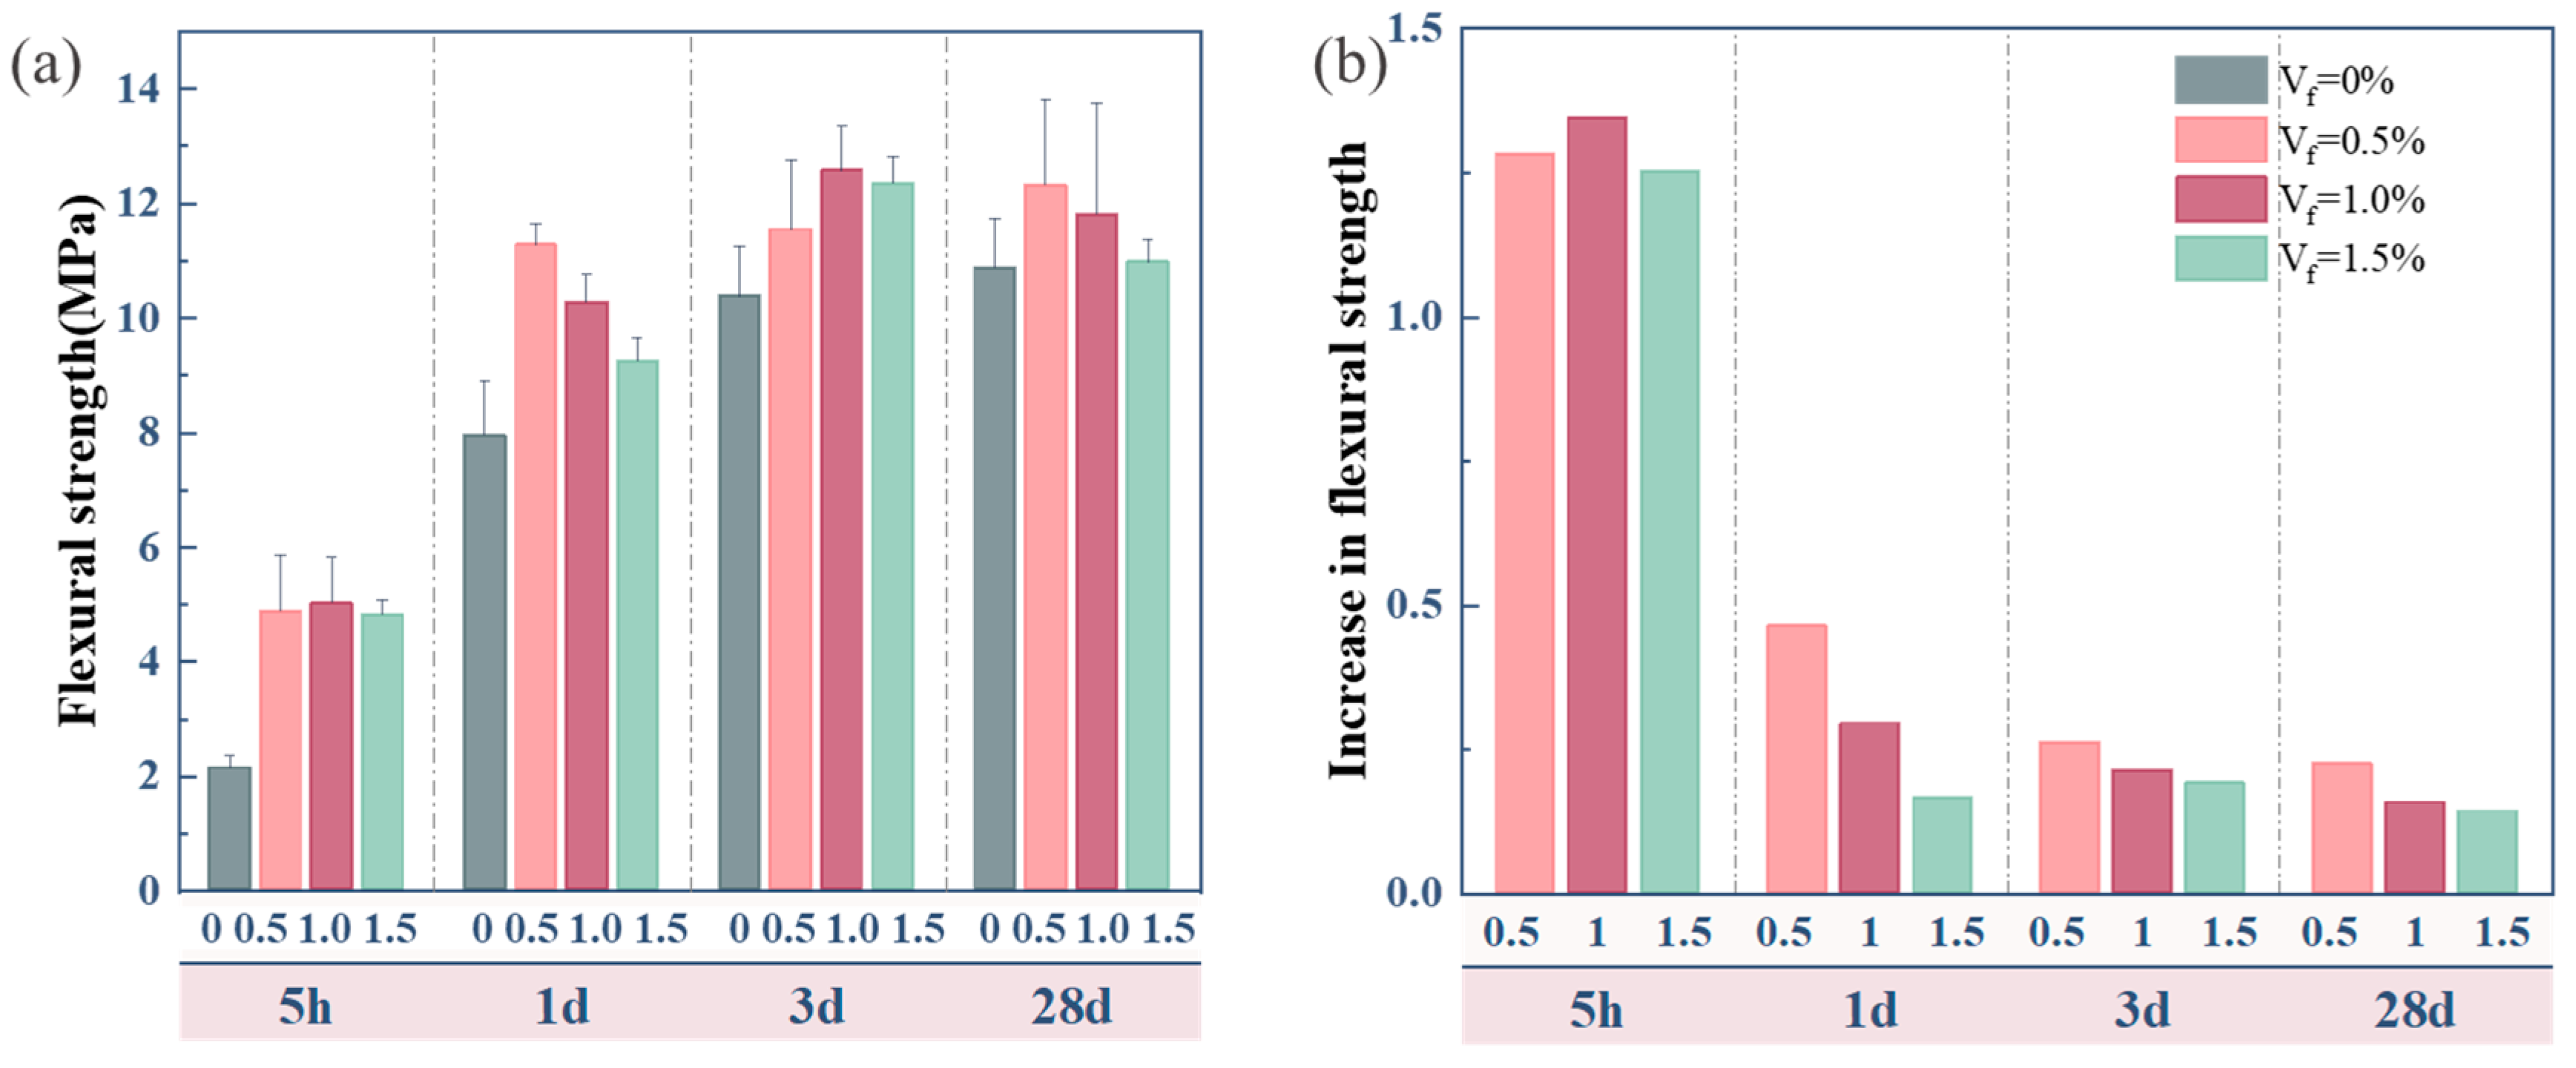
3.2.1. Flexural Strength
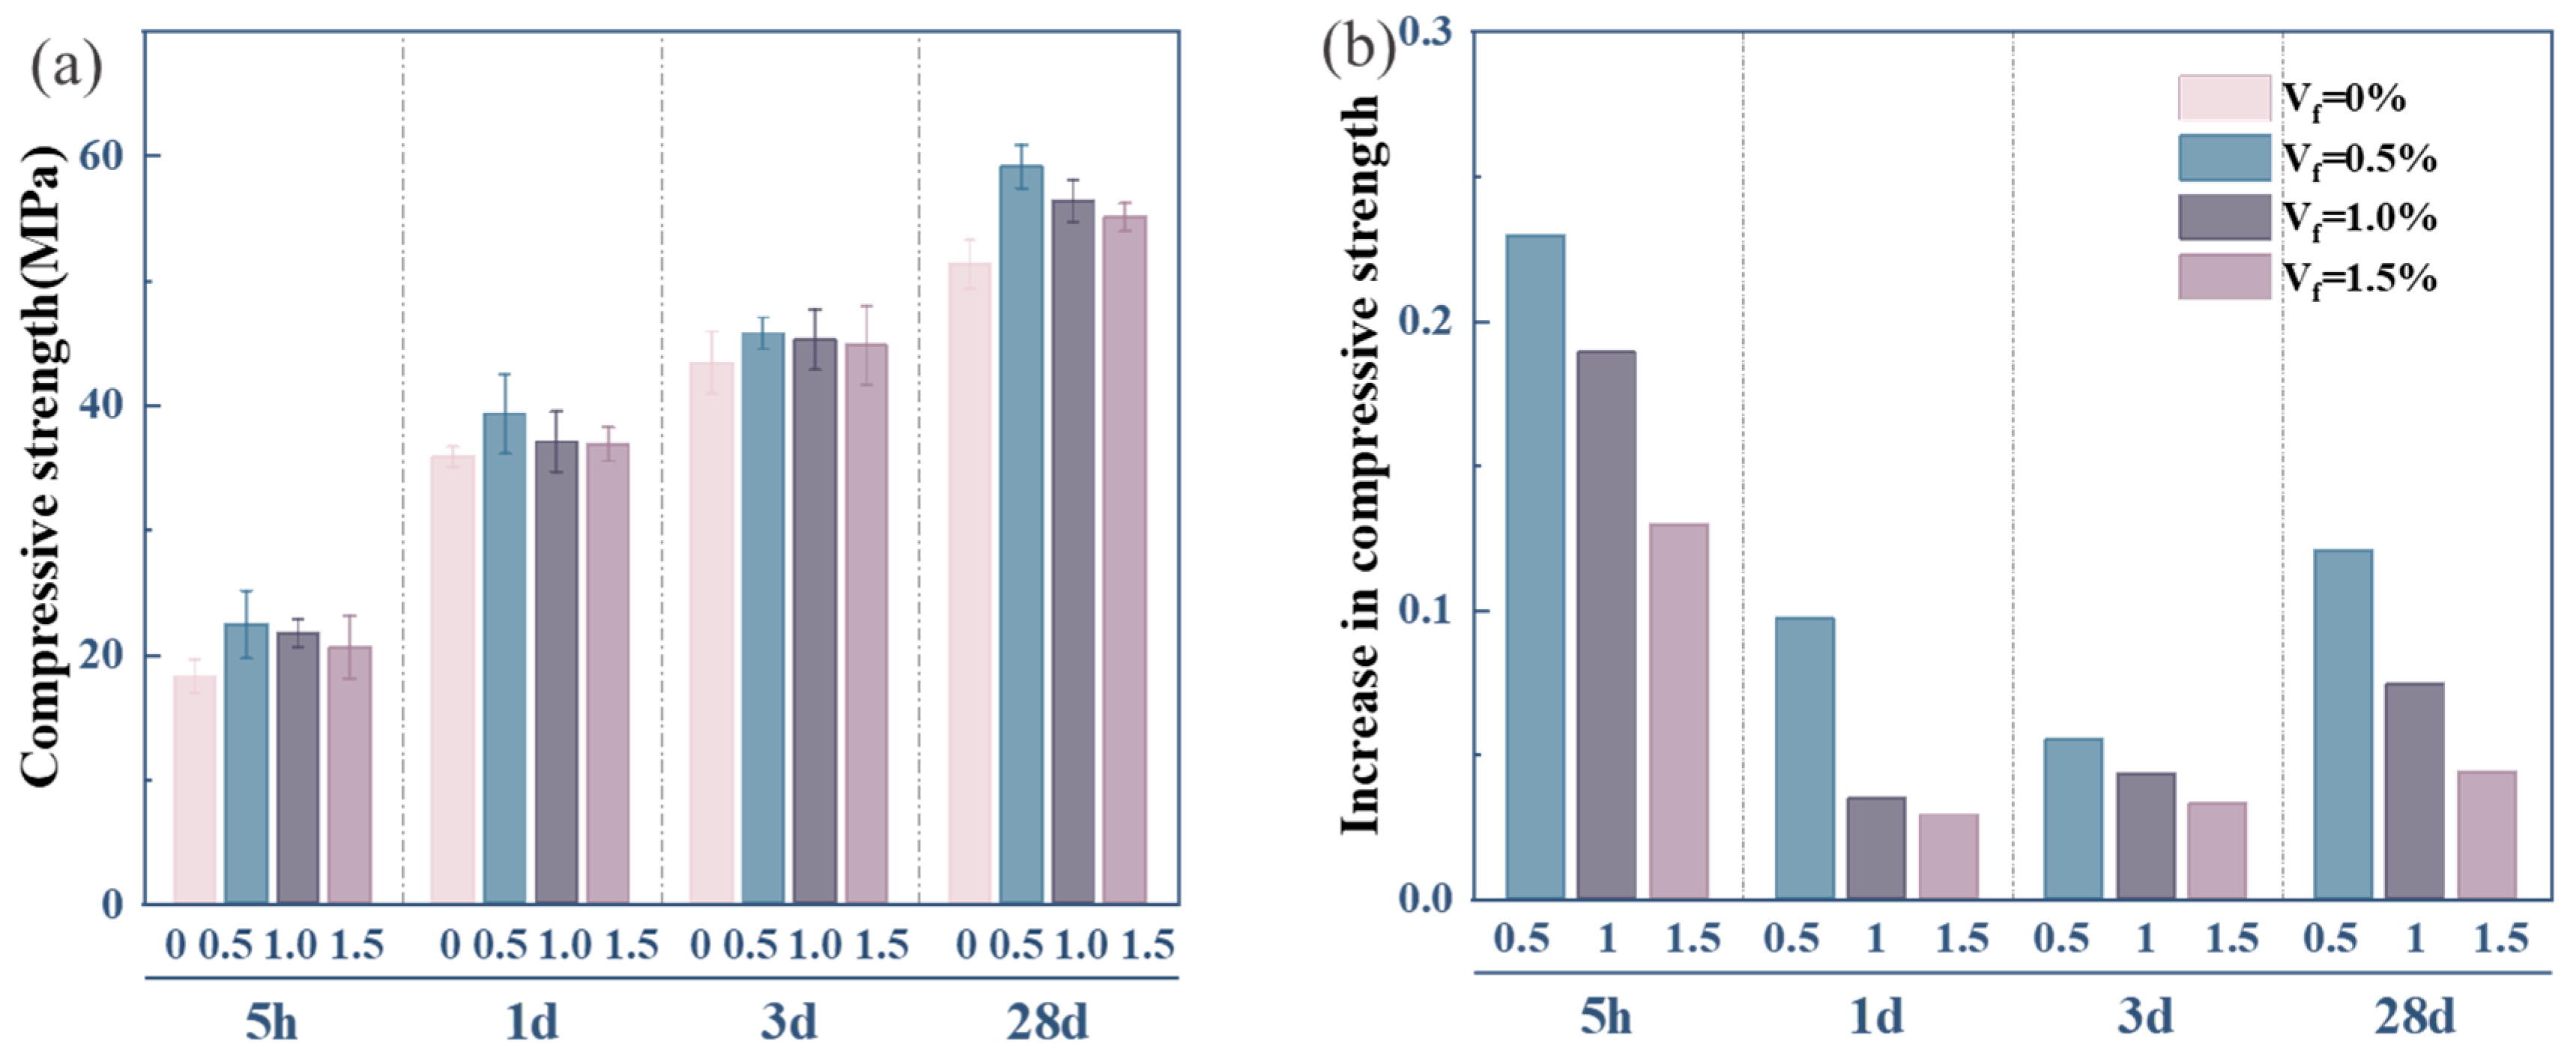
3.2.2. Compressive Strength
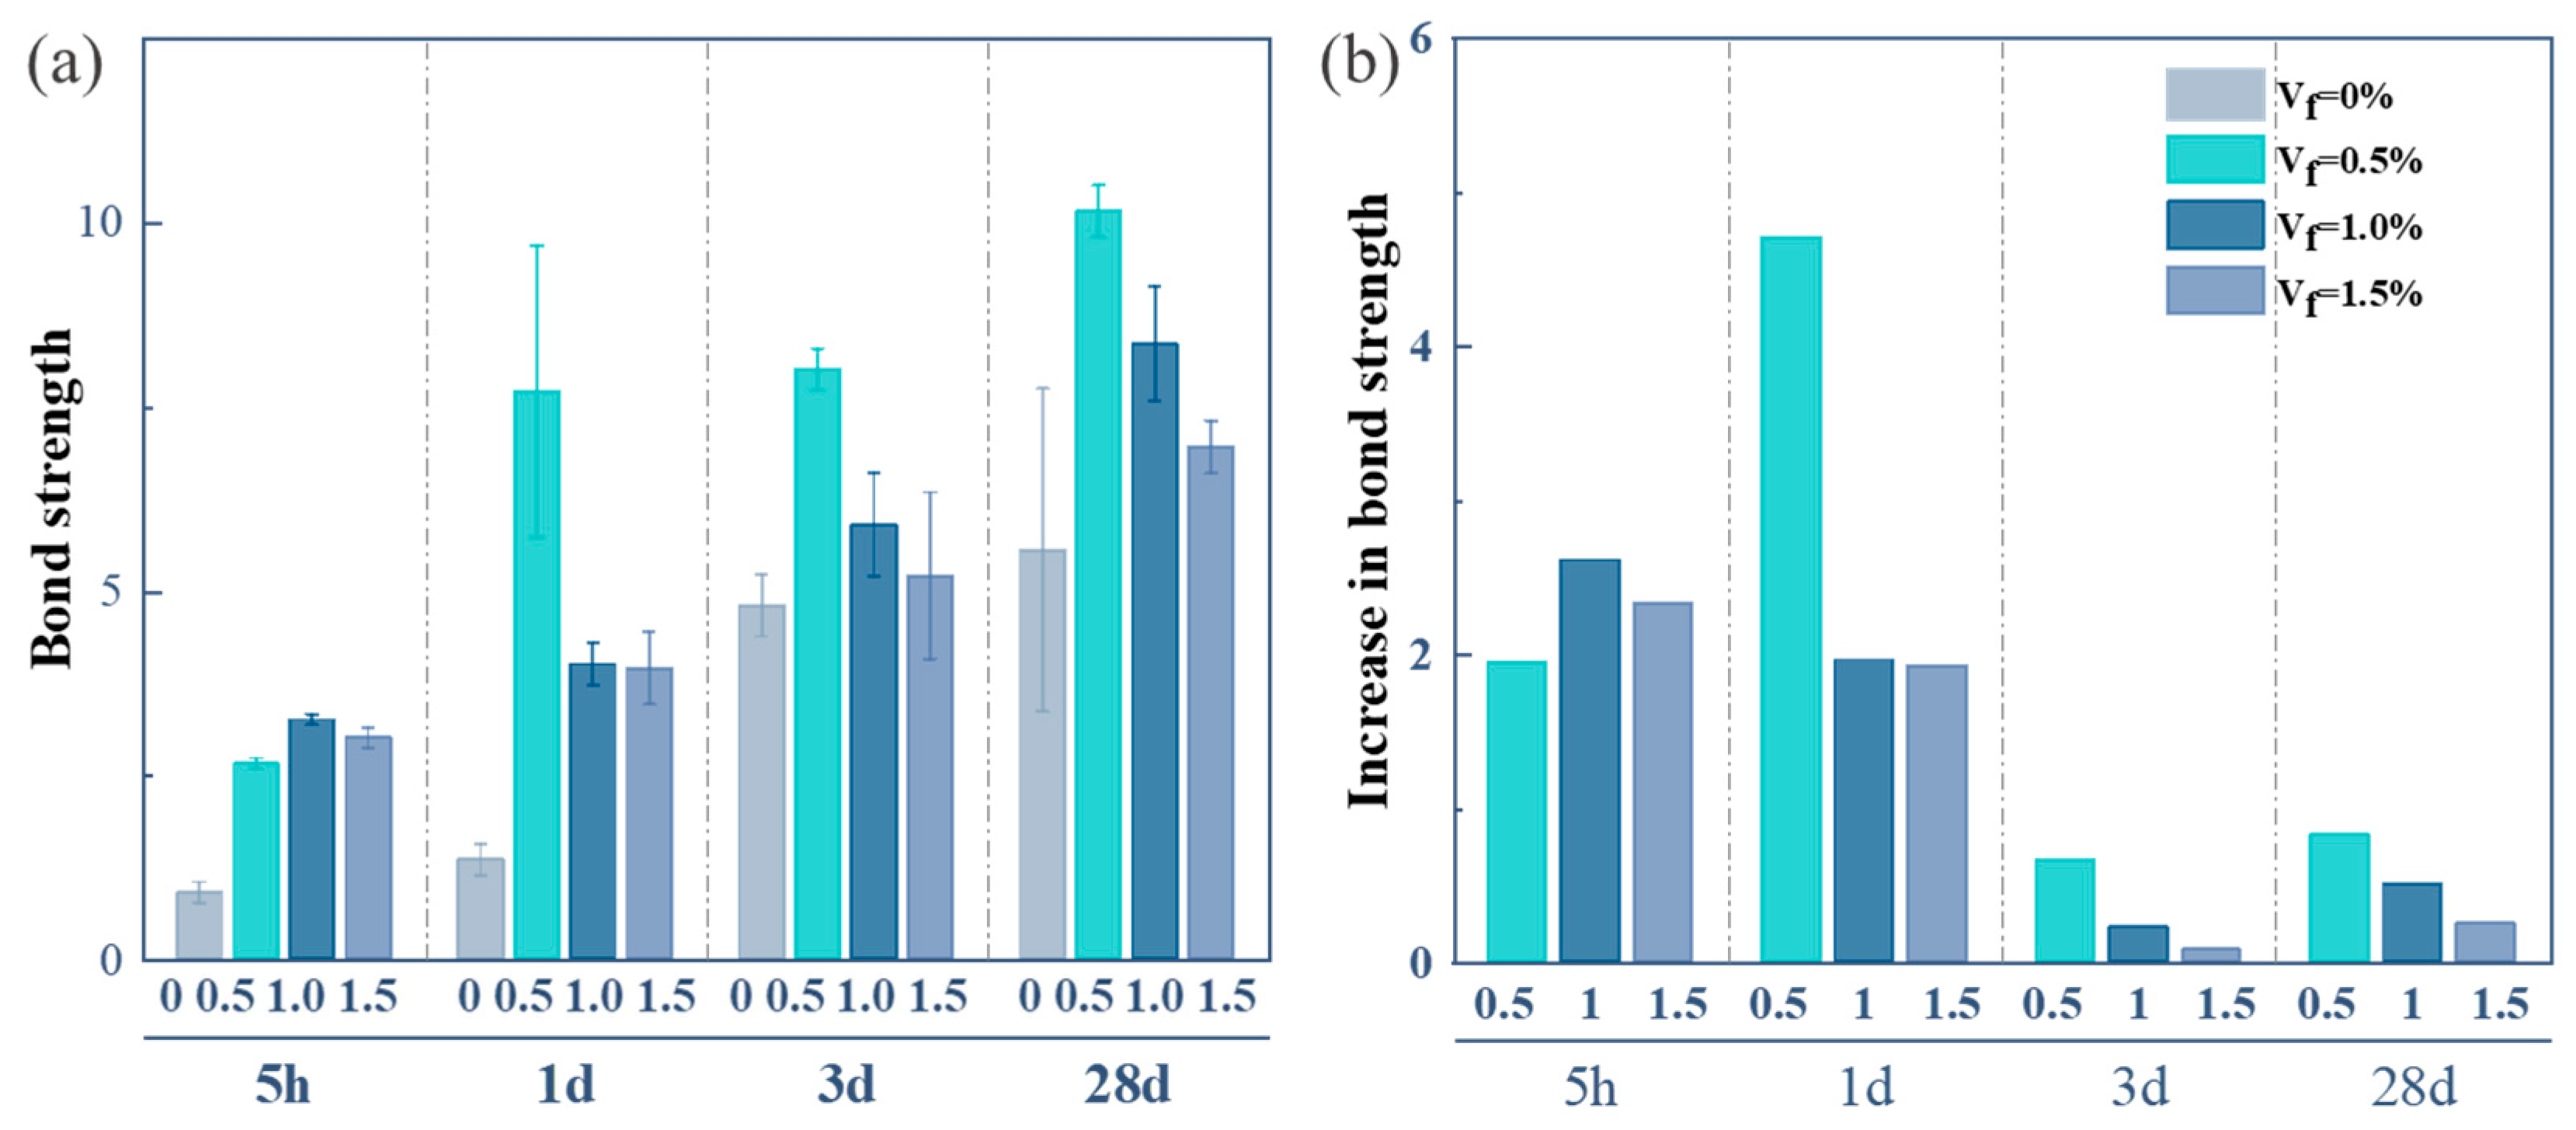
3.3. Effect of Glass Fiber (GF) Contents on Bond Property Between Composites and Old Portland Cement Mortar Matrix (OPCM)
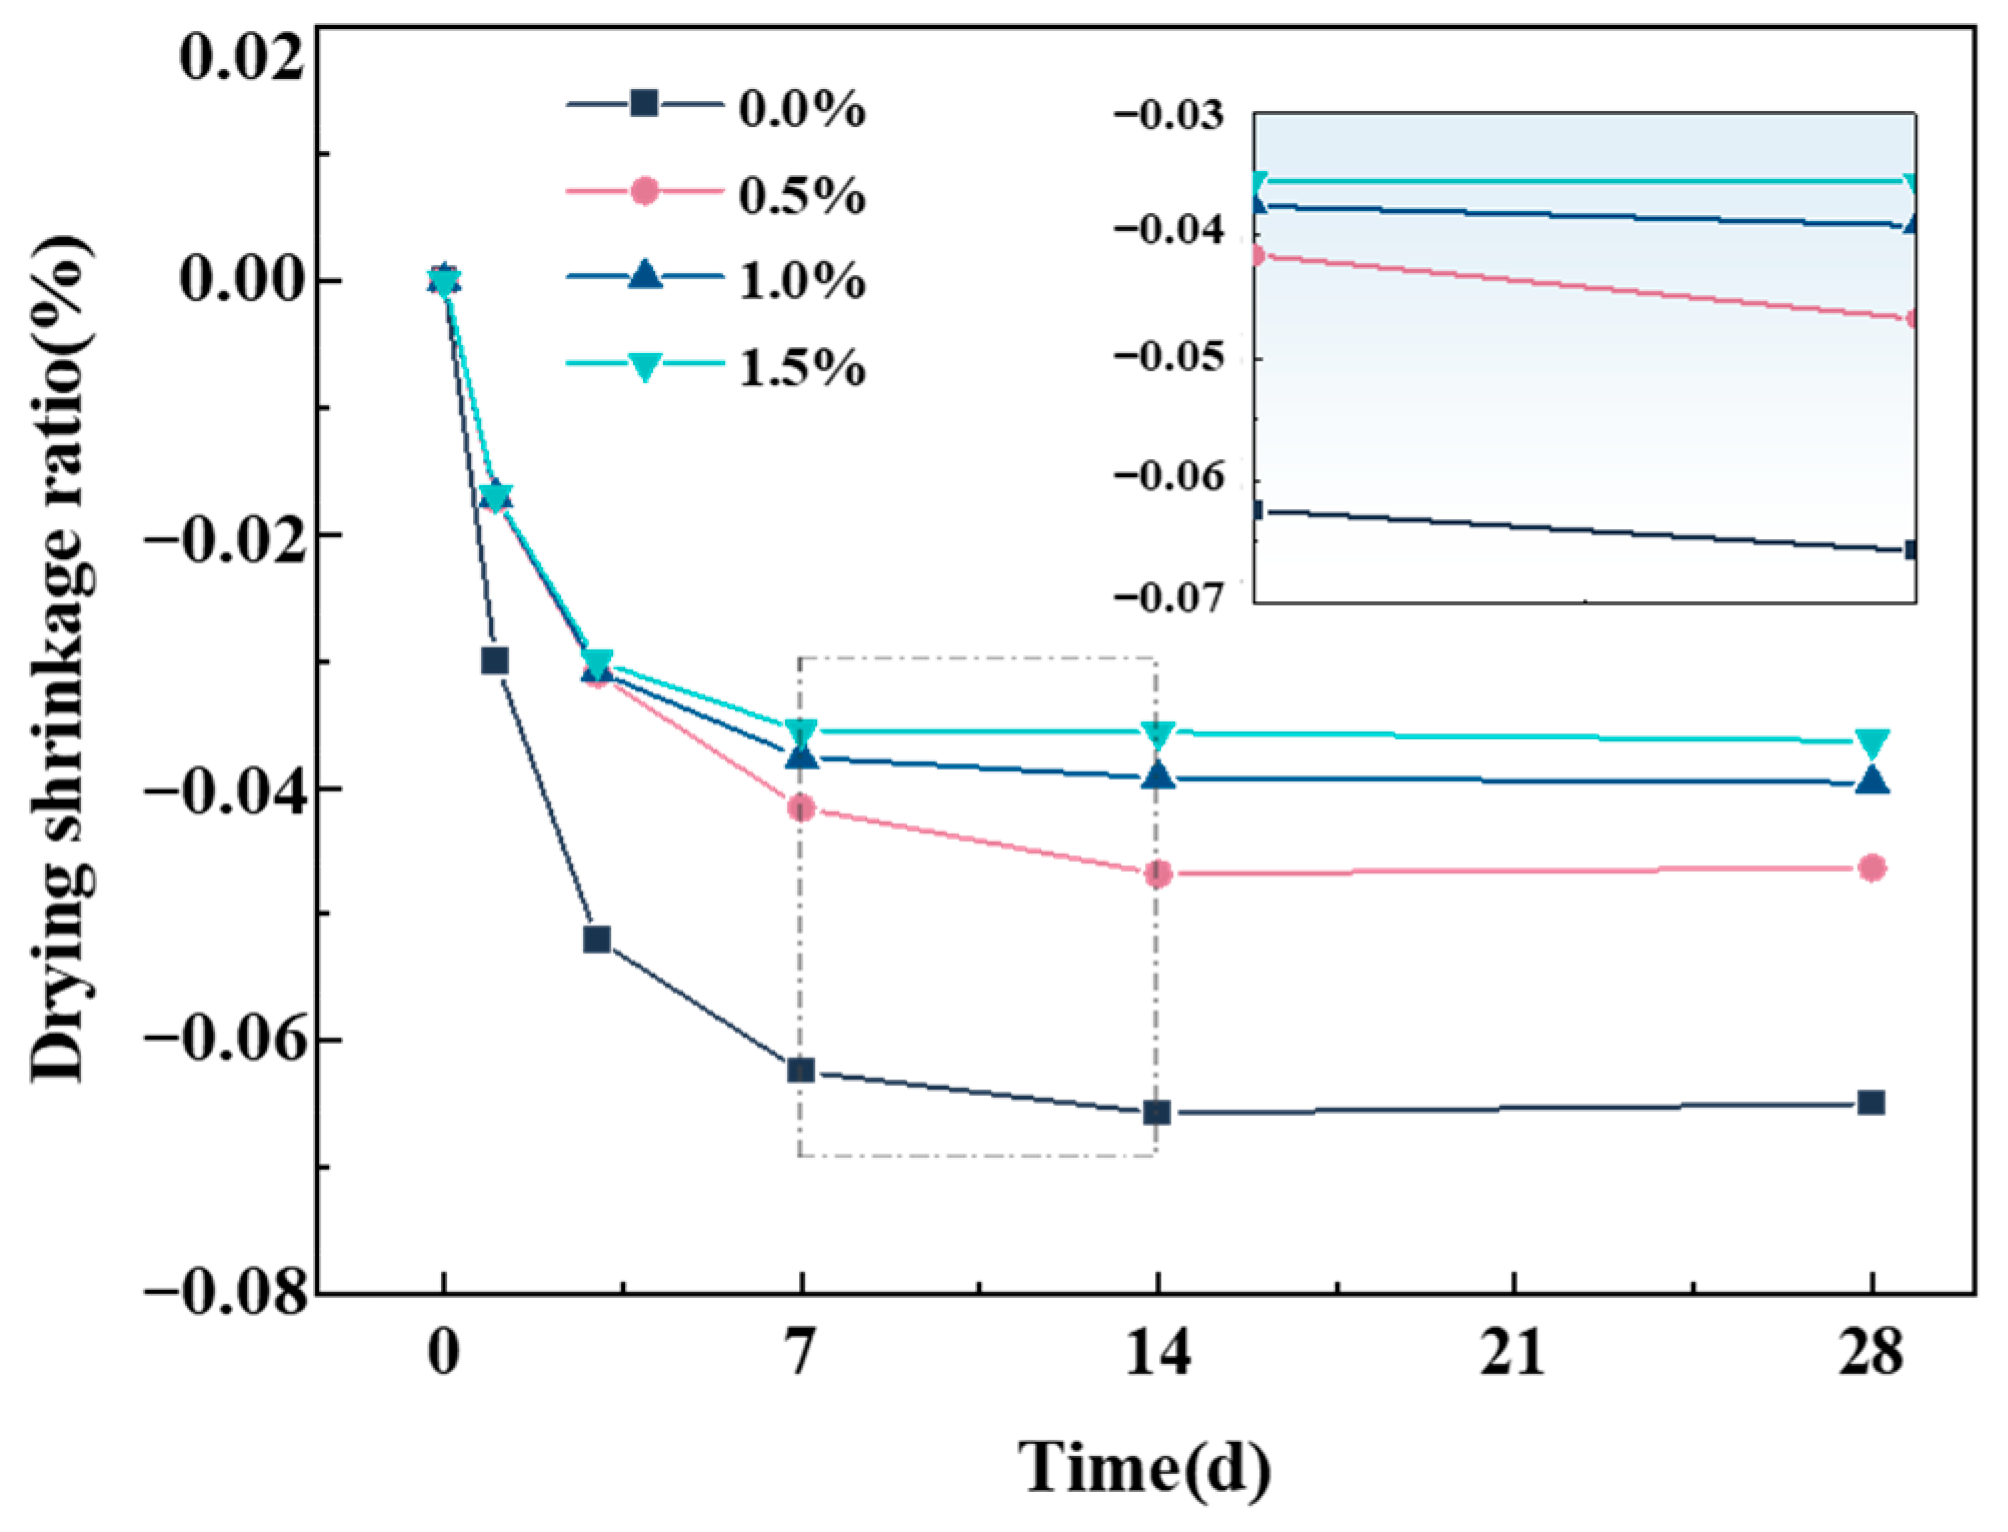
3.4. Effect of Glass Fiber (GF) Contents on the Shrinkage Properties of Ordinary Portland Cement and Sulphoaluminate Cement (OPC-SAC) Composites
3.5. Microstructure of Ordinary Portland Cement and Sulphoaluminate Cement (OPC-SAC) Composites
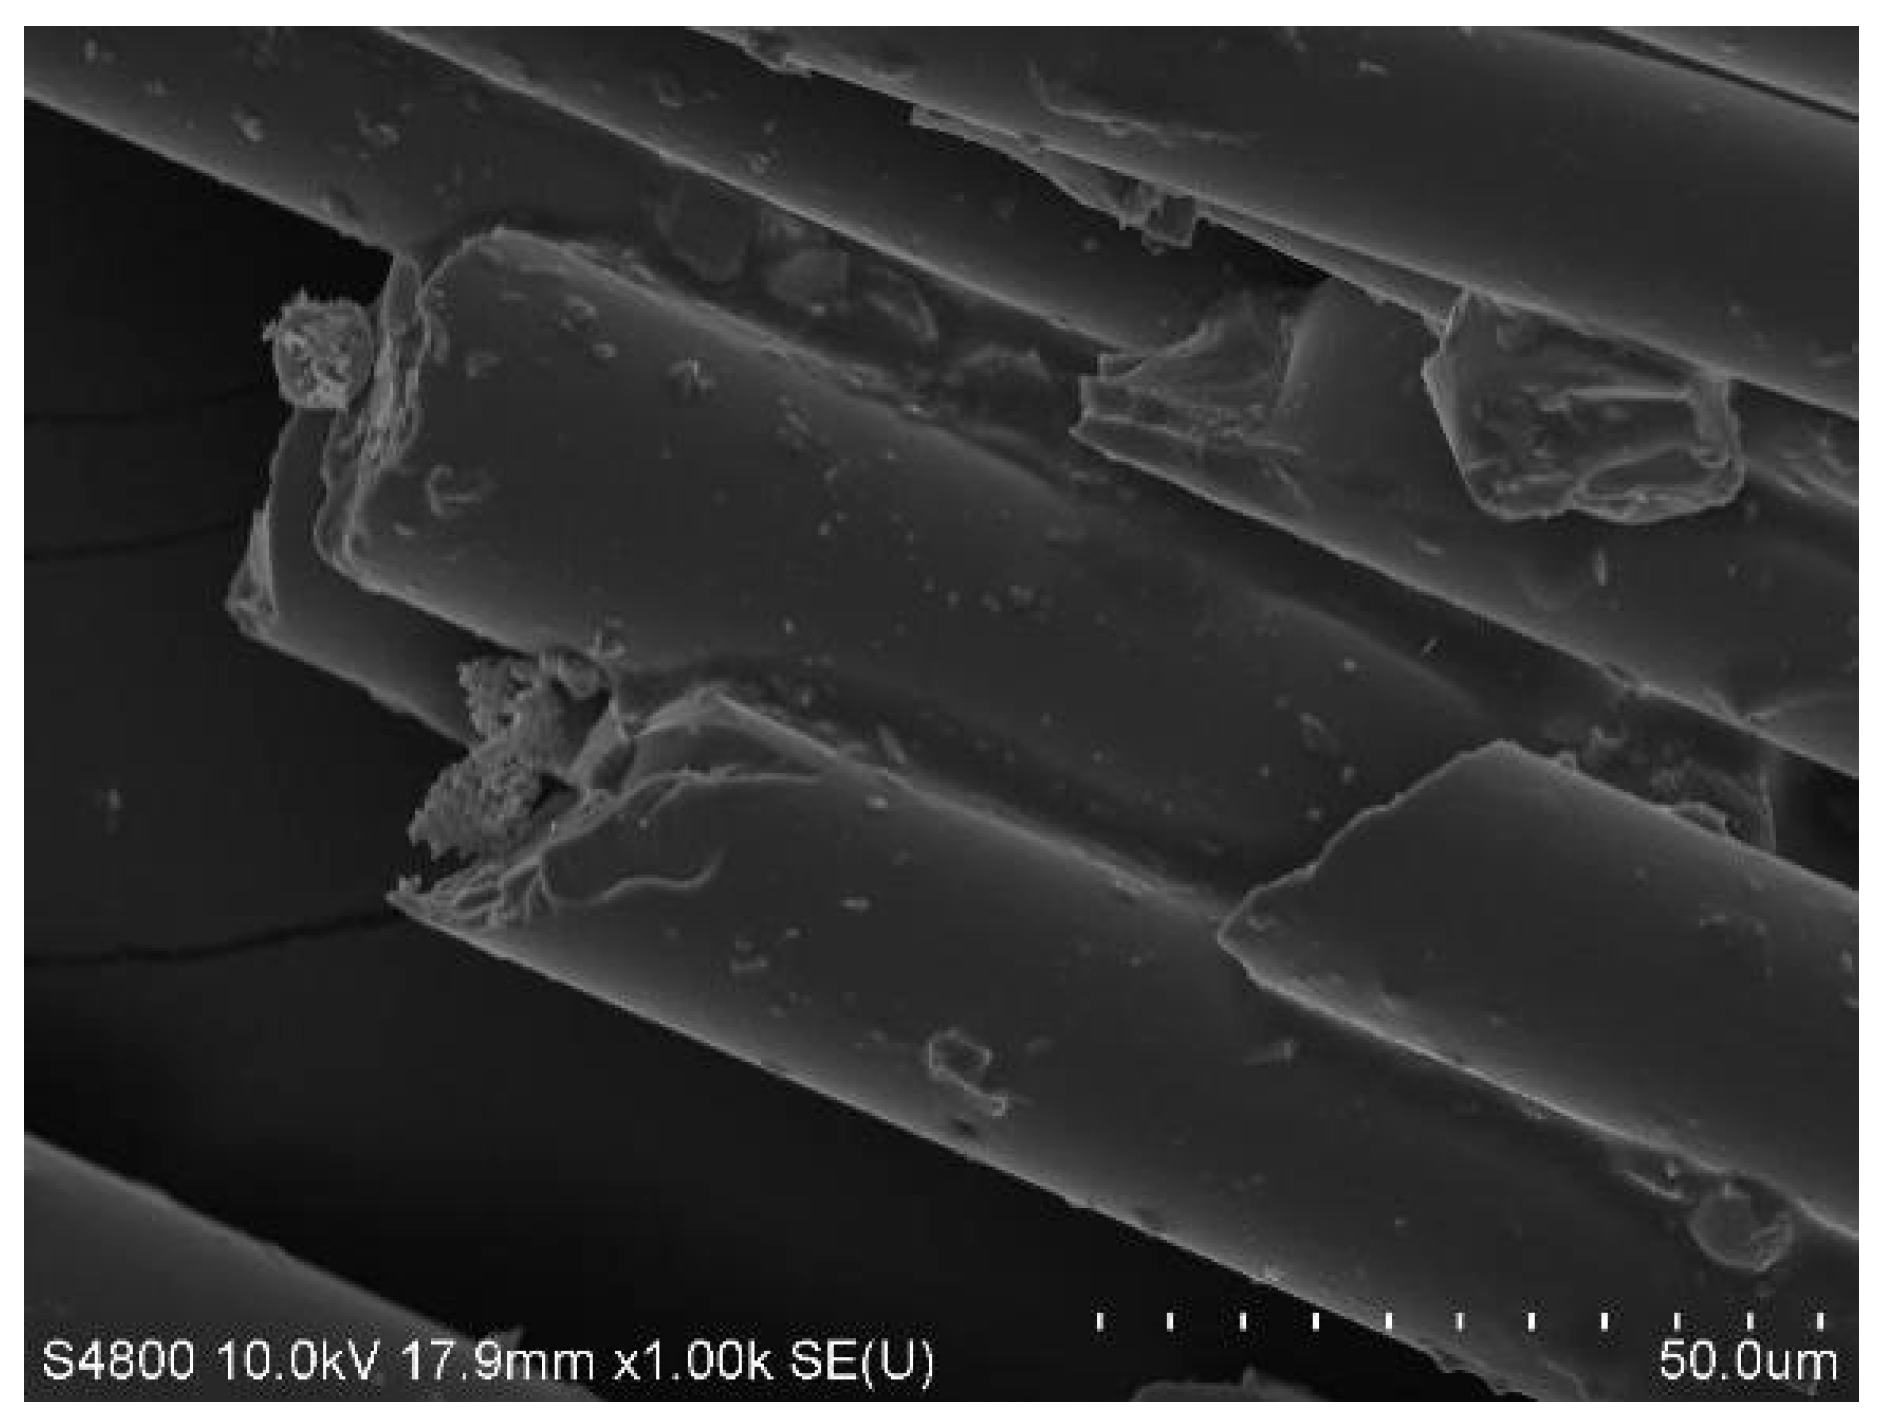
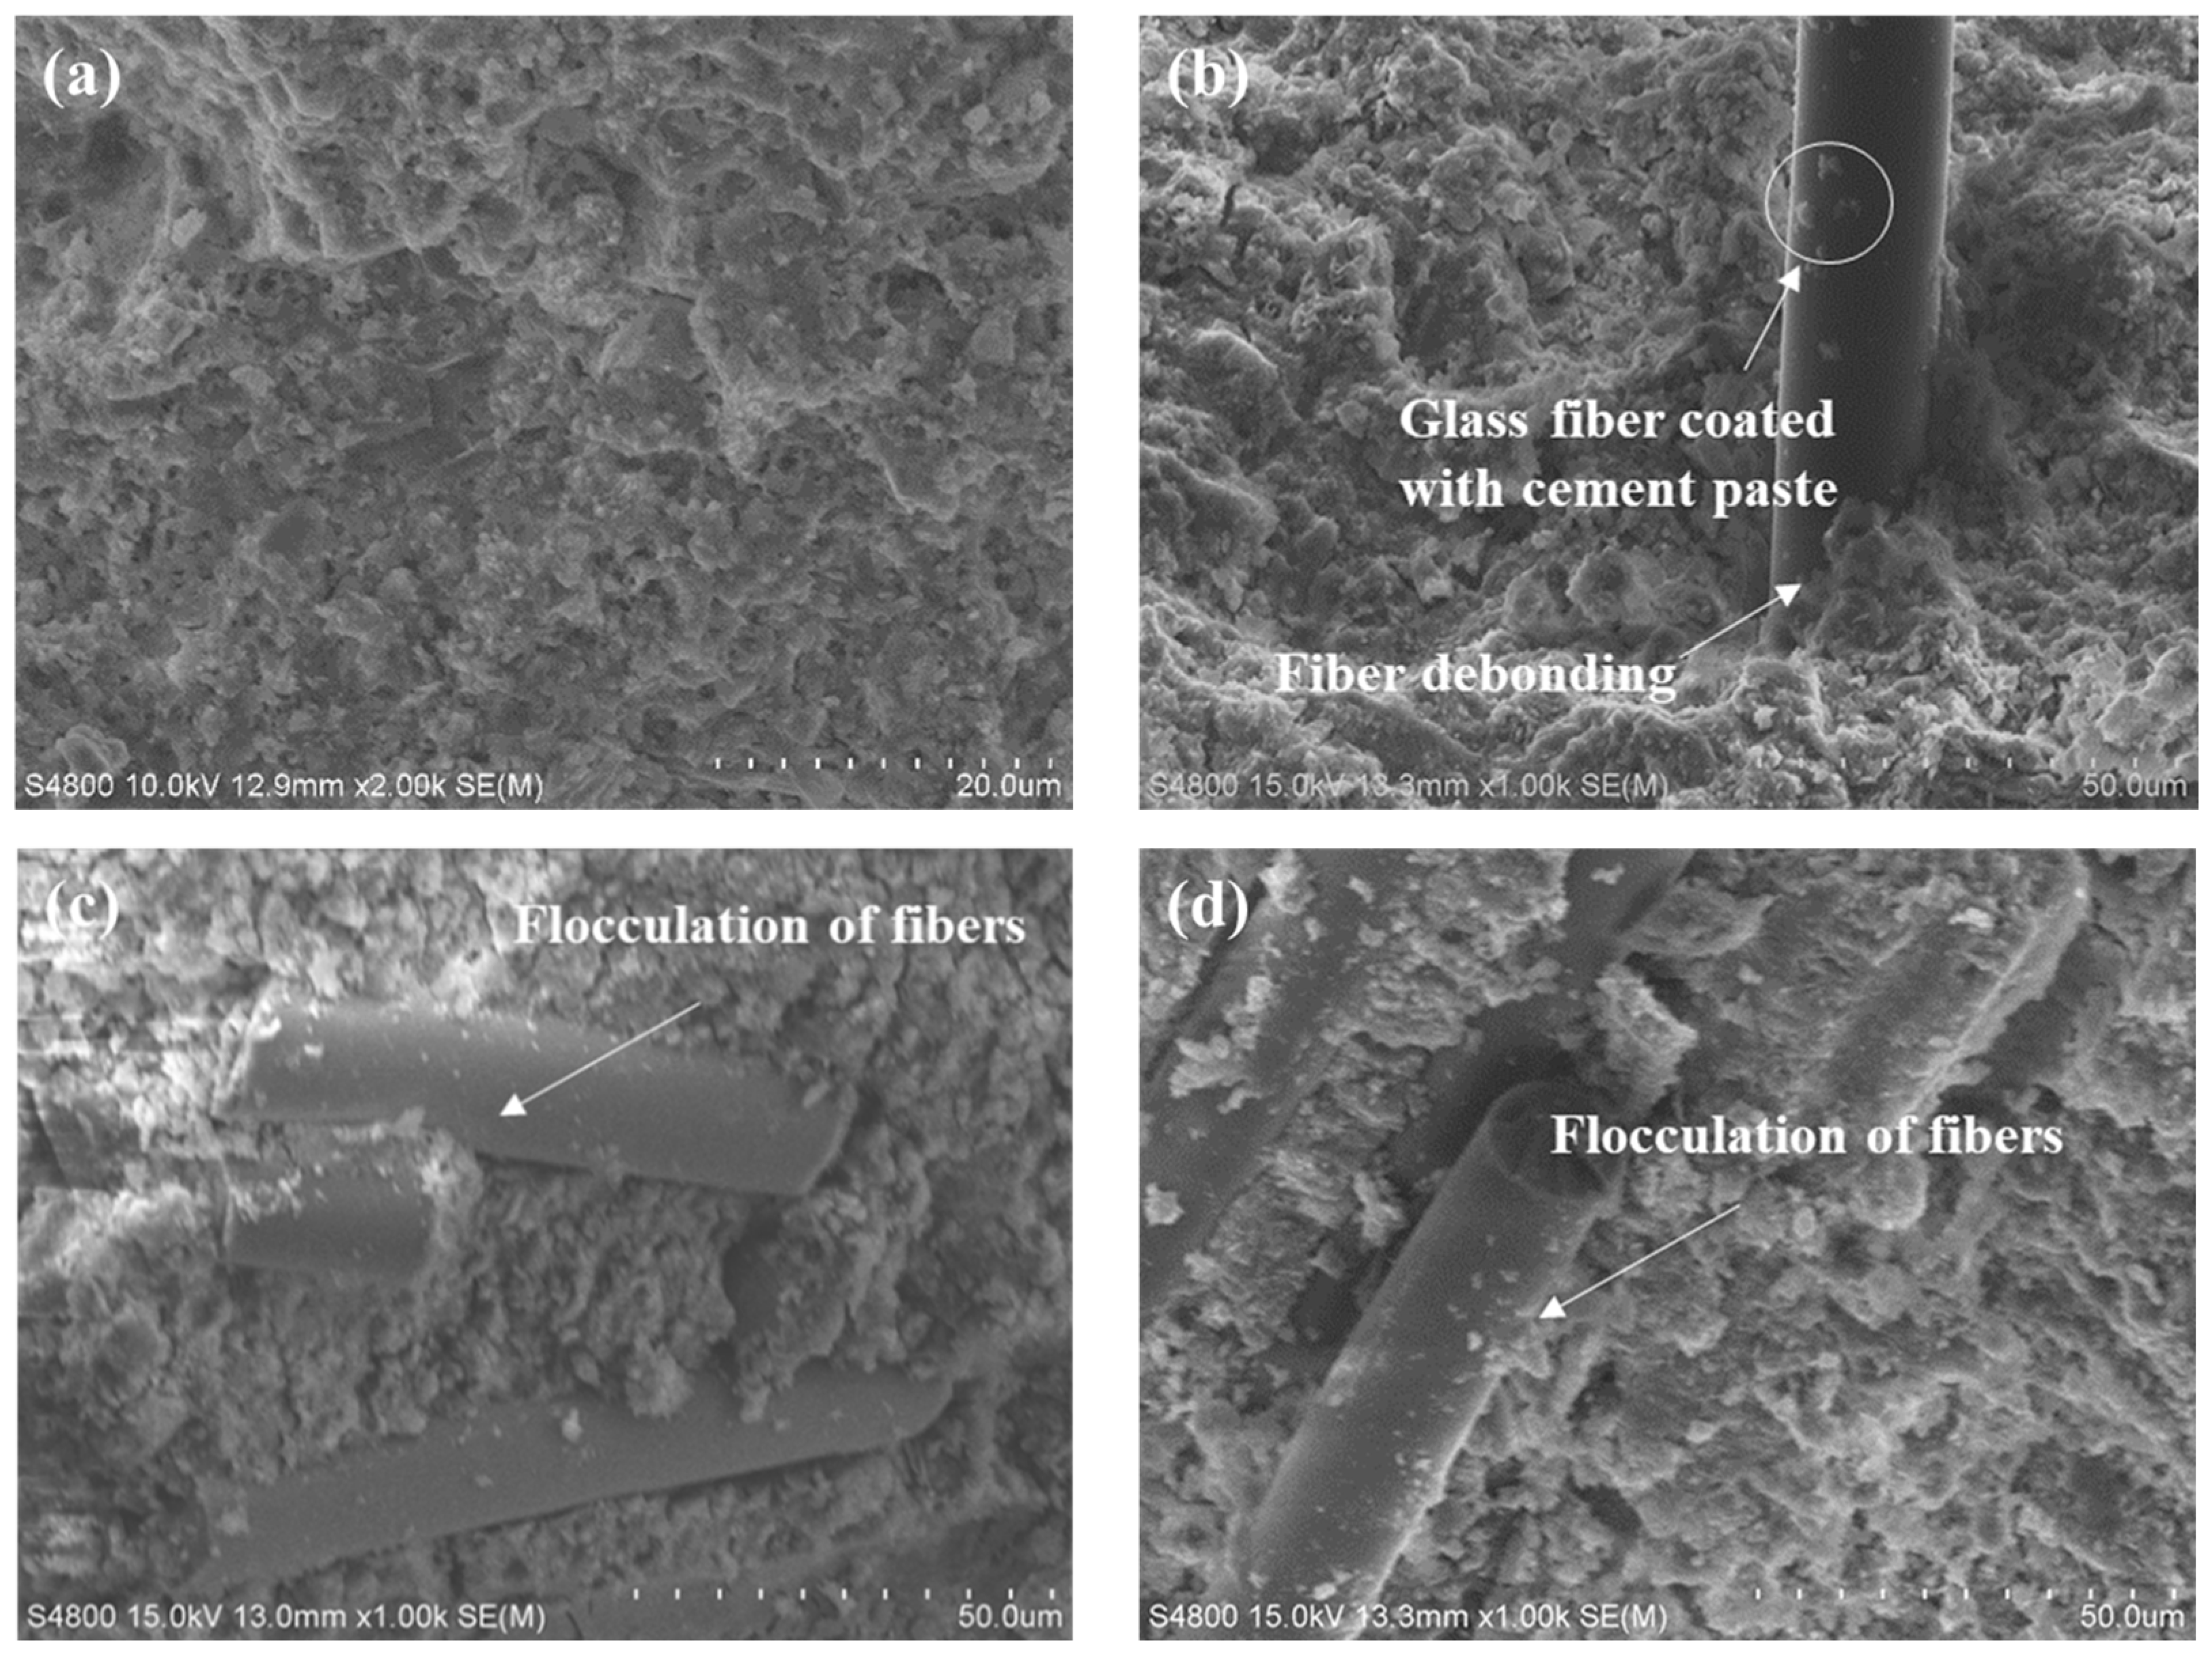
3.5.1. Glass Fibers (GFs)–Matrix Interface Microstructure
3.5.2. Pore Structure of Ordinary Portland Cement and Sulphoaluminate Cement (OPC-SAC) Composites
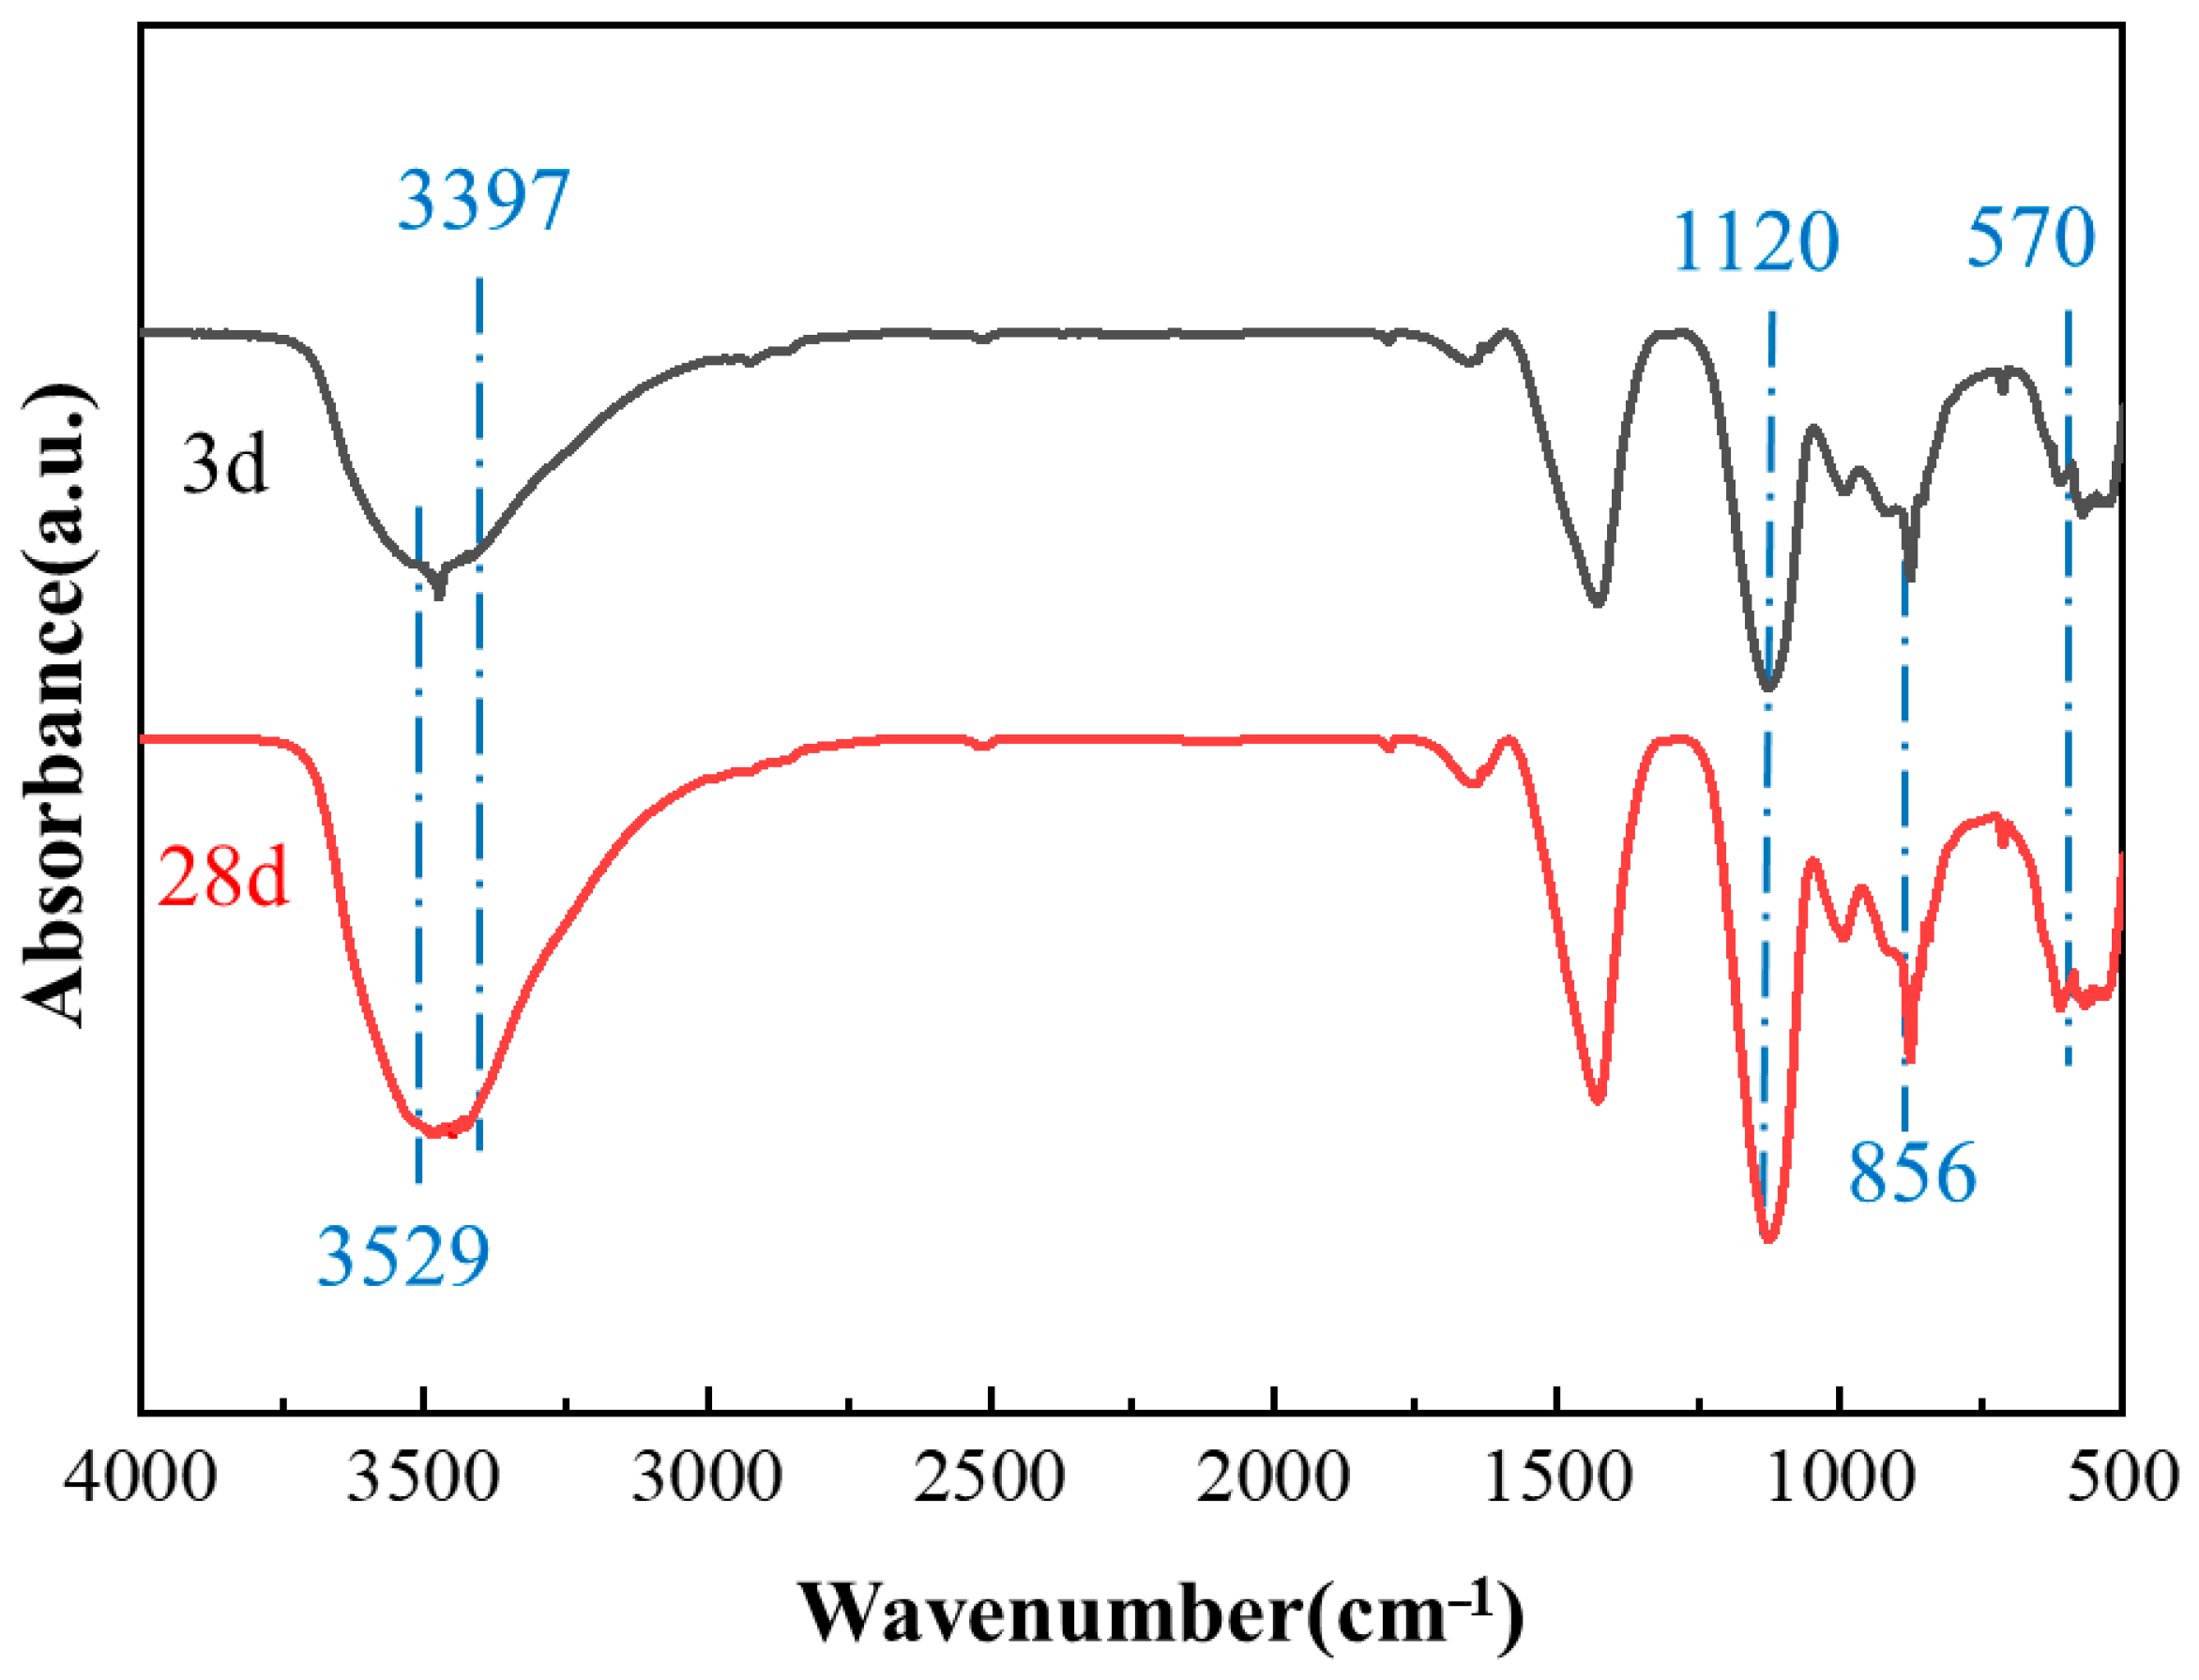
3.5.3. Hydration Products of Ordinary Portland Cement and Sulphoaluminate Cement (OPC-SAC) Composites
4. Conclusions
5. Further Research
Author Contributions
Funding
Institutional Review Board Statement
Informed Consent Statement
Data Availability Statement
Acknowledgments
Conflicts of Interest
References
- Mohan, M.K.; Rahul, A.V.; Dam, B.V.; Zeidan, T. Performance criteria, environmental impact and cost assessment for 3D printable concrete mixtures. Resour. Conserv. Recycl. 2022, 181, 106255. [Google Scholar] [CrossRef]
- Guan, Y.; Gao, Y.; Sun, R.; Won, M.C.; Ge, Z. Experimental study and field application of calcium sulfoaluminate cement for rapid repair of concrete pavements. Front. Struct. Civ. Eng. 2017, 11, 338–345. [Google Scholar] [CrossRef]
- Coppola, L.; Coffetti, D.; Crotti, E.; Pastore, T. CSA-based Portland-free binders to manufacture sustainable concretes for jointless slabs on ground. Constr. Build. Mater. 2018, 187, 691–698. [Google Scholar] [CrossRef]
- Park, S.; Jeong, Y.; Moon, J.; Lee, N. Hydration characteristics of calcium sulfoaluminate (CSA) cement/portland cement blended pastes. J. Build. Eng. 2021, 34, 101880. [Google Scholar] [CrossRef]
- Trauchessec, R.; Mechling, J.M.; Lecomte, A.; Roux, A.; Le Rolland, B. Hydration of ordinary Portland cement and calcium sulfoaluminate cement blends. Cem. Concr. Compos. 2015, 56, 106–114. [Google Scholar] [CrossRef]
- Zhang, J.; Li, G.; Ye, W.; Chang, Y.; Liu, Q.; Song, Z. Effects of ordinary Portland cement on the early properties and hydration of calcium sulfoaluminate cement. Constr. Build. Mater. 2018, 186, 1144–1153. [Google Scholar] [CrossRef]
- Li, J.; Huang, Y.; Liu, Y.; Wang, H.; Guo, Y.; Li, Q. Mechanical properties and impermeability strength evolution of the consolidated body of fiber-modified coal-based solid wastes grouting materials. Constr. Build. Mater. 2024, 450, 138556. [Google Scholar] [CrossRef]
- Chaunsali, P.; Mondal, P. Physico-chemical interaction between mineral admixtures and OPC–calcium sulfoaluminate (CSA) cements and its influence on early-age expansion. Cem. Concr. Res. 2016, 80, 10–20. [Google Scholar] [CrossRef]
- Kothari, A.; Tole, I.; Hedlund, H.; Ellison, T.; Cwirzen, A. Partial replacement of OPC with CSA cements—Effects on hydration, fresh and hardened properties. Adv. Cem. Res. 2022, 35, 207–224. [Google Scholar] [CrossRef]
- Li, G.; Bai, Z.; Zhang, G.; Wu, Y. Study on properties and degradation mechanism of calcium sulphoaluminate cement-ordinary Portland cement binary repair material under seawater erosion. Case Stud. Constr. Mater. 2022, 17, e01440. [Google Scholar] [CrossRef]
- Wang, Z.; Wang, X.; Zhang, Z.; Du, J.; Zou, Y.; Cucuzza, R.; Yang, J. Influence of fiber orientation and hybrid ratios on tensile response and hybrid effect of hybrid steel fiber-reinforced cementitious composites. Constr. Build. Mater. 2024, 449, 138377. [Google Scholar] [CrossRef]
- Jun, H.M.; Seo, D.J.; Lim, D.Y.; Park, J.G.; Heo, G.H. Effect of Carbon and Steel Fibers on the Strength Properties and Electrical Conductivity of Fiber-Reinforced Cement Mortar. Appl. Sci. 2023, 13, 3522. [Google Scholar] [CrossRef]
- Addis, L.B.; Sendekie, Z.B.; Satheesh, N. Degradation Kinetics and Durability Enhancement Strategies of Cellulosic Fiber-Reinforced Geopolymers and Cement Composites. Adv. Mater. Sci. Eng. 2022, 2022, 1981755. [Google Scholar] [CrossRef]
- Ngo, T.T.; Tran, N.T.; Kim, D.J.; Pham, T.C. Effects of corrosion level and inhibitor on pullout behavior of deformed steel fiber embedded in high performance concrete. Constr. Build. Mater. 2021, 280, 122449. [Google Scholar] [CrossRef]
- Liu, J.; Lv, C. Durability of cellulosic-fiber-reinforced geopolymers: A review. Molecules 2022, 27, 796. [Google Scholar] [CrossRef]
- Wu, Y.; Song, Y.; Wu, D.; Mao, X.; Yang, X.; Jiang, S.; Guo, R. Recent progress in modifications, properties, and practical applications of glass fiber. Molecules 2023, 28, 2466. [Google Scholar] [CrossRef] [PubMed]
- Ahmad, J.; González-Lezcano, R.A.; Majdi, A.; Kahla, N.B.; Deifalla, A.F.; El-Shorbagy, M.A. Glass fibers reinforced concrete: Overview on mechanical, durability and microstructure analysis. Materials 2022, 15, 5111. [Google Scholar] [CrossRef]
- Fang, Y.; Chen, B.; Oderji, S.Y. Experimental research on magnesium phosphate cement mortar reinforced by glass fiber. Constr. Build. Mater. 2018, 188, 729–736. [Google Scholar] [CrossRef]
- Yu, H.; Wu, L.; Liu, W.V.; Pourrahimian, Y. Effects of fibers on expansive shotcrete mixtures consisting of calcium sulfoaluminate cement, ordinary Portland cement, and calcium sulfate. J. Rock Mech. Geotech. Eng. 2018, 10, 212–221. [Google Scholar] [CrossRef]
- Zhang, C.; Zhu, Z.; Wang, S.; Zhang, J. Macro-micro mechanical properties and reinforcement mechanism of alkali-resistant glass fiber-reinforced concrete under alkaline environments. Constr. Build. Mater. 2023, 368, 130365. [Google Scholar] [CrossRef]
- JTG 3420-2020; Testing Methods of Cement and Concrete for Highway Engineering. Ministry of Transport of the People’s Republic of China. Chinese Standard Press: Beijing, China, 2020.
- GB/T 2419-2005; Test Method for Fluidity of Cement Mortar. National Cement Standardization Technical Committee. Chinese Standard Press: Beijing, China, 2005.
- GB/T 17671-2021; Test Method of Cement Mortar Strength (lSO Method). National Cement Standardization Technical Committee. Chinese Standard Press: Beijing, China, 2021.
- JC/T 2381-2016; Repairing Mortar. Ministry of Industry and Information Technology. Chinese Standard Press: Beijing, China, 2016.
- Chen, H.; Wang, P.; Pan, J.; Lawi, A.S.; Zhu, Y. Effect of alkali-resistant glass fiber and silica fume on mechanical and shrinkage properties of cement-based mortars. Constr. Build. Mater. 2021, 307, 125054. [Google Scholar] [CrossRef]
- Wang, P.; Wu, H.L.; Li, W.W.; Leung, C.K. Mechanical properties and microstructure of glass fiber reinforced polymer (GFRP) rebars embedded in carbonated reactive MgO-based concrete (RMC). Cem. Concr. Compos. 2023, 142, 105207. [Google Scholar] [CrossRef]
- Lin, C.; Kanstad, T.; Jacobsen, S.; Ji, G. Bonding property between fiber and cementitious matrix: A critical review. Constr. Build. Mater. 2023, 378, 131169. [Google Scholar] [CrossRef]
- Tran, N.P.; Gunasekara, C.; Law, D.W.; Houshyar, S.; Setunge, S.; Cwirzen, A. A critical review on drying shrinkage mitigation strategies in cement-based materials. J. Build. Eng. 2021, 38, 102210. [Google Scholar] [CrossRef]
- Hannawi, K.; Bian, H.; Prince-Agbodjan, W.; Raghavan, B. Effect of different types of fibers on the microstructure and the mechanical behavior of ultra-high performance fiber-reinforced concretes. Compos. Part B Eng. 2016, 86, 214–220. [Google Scholar] [CrossRef]
- Zhang, B. The Failure Process of Concrete in Different Erosion Environment Based on Industrial CT Technology. Ph.D. Dissertation, Harbin Institute of Technology, Harbin, China, 2013. [Google Scholar]
- Sonat, C.; He, S.; Li, J.; Unluer, C.; Yang, E.H. Strain hardening magnesium-silicate-hydrate composites (SHMSHC) reinforced with short and randomly oriented polyvinyl alcohol microfibers. Cem. Concr. Res. 2021, 142, 106354. [Google Scholar] [CrossRef]
- Simões, T.; Costa, H.; Dias-da-Costa, D.; Júlio, E.N.B.S. Influence of fibres on the mechanical behaviour of fibre reinforced concrete matrixes. Constr. Build. Mater. 2017, 137, 548–556. [Google Scholar] [CrossRef]
- Torabian, I.; Li, W.; Redaelli, E. Dispersion of multi-walled carbon nanotubes and its effects on the properties of cement composites. Cem. Concr. Compos. 2016, 74, 154–163. [Google Scholar] [CrossRef]
- Tang, S.W.; Zhu, H.G.; Li, Z.J.; Chen, E.; Shao, H.Y. Hydration stage identification and phase transformation of calcium sulfoaluminate cement at early age. Constr. Build. Mater. 2015, 75, 11–18. [Google Scholar] [CrossRef]
- Kim, T.; Kuppusamy, M.; Velmurugan, K.; Park, S.D.; Kim, S.W.; Park, S.S.; Kim, W.J. Study of CO2 absorption by cement paste containing amine compounds: A comparative study of diethylamine, dimethylamine and isopropylamine. Innov. Infrastruct. Solut. 2025, 10, 15. [Google Scholar] [CrossRef]
- Yang, F.; Xie, J.; Wang, W.; Wang, Z. The role of nano-TiO2 on the mechanical properties and hydration behavior of C2S, C3S and . Constr. Build. Mater. 2023, 388, 131558. [Google Scholar] [CrossRef]
- Telesca, A.; Marroccoli, M.; Pace, M.L.; Tomasulo, M.; Valenti, G.L.; Monteiro, P.J.M. A hydration study of various calcium sulfoaluminate cements. Cem. Concr. Compos. 2014, 53, 224–232. [Google Scholar] [CrossRef]
- Jaime, S.K.Y.; Michael, C.H.Y.; Wong, Y.L. 1-Year development trend of concrete compressive strength using Calcium Sulfoaluminate cement blended with OPC, PFA and GGBS. Constr. Build. Mater. 2019, 198, 527–536. [Google Scholar] [CrossRef]
- Cuesta, A.; Álvarez-Pinazo, G.; Sanfélix, S.G.; Peral, I.; Aranda, M.A.G.; De La Torre, A.G. Hydration mechanisms of two polymorphs of synthetic ye’elimite. Cem. Concr. Res. 2014, 63, 127–136. [Google Scholar] [CrossRef]


| Constituents | SiO2 | Al2O3 | CaO | MgO | Fe2O3 | SO3 | Others |
|---|---|---|---|---|---|---|---|
| SAC | 12.3 | 27.5 | 43.6 | 1.6 | 1.9 | 11.5 | 1.6 |
| OPC | 18.4 | 5.2 | 64.5 | 1.3 | 3.4 | 2.1 | 5.1 |
| Properties | Diameter (μm) | Length (mm) | Tensile Strength (MPa) | Elastic Modulus (GPa) | Specific Gravity (g·cm−3) |
|---|---|---|---|---|---|
| GFs | 12.00 | 12.00 | 1700.00 | 70.00 | 2.180 |
| Group | Mass Ratio (%) | Cement/Sand Ratio | W/C | Volume Fraction of GFs (%) | |
|---|---|---|---|---|---|
| OPC | SAC | ||||
| OPCM | 1.0 | 0 | 1:3 | 0.5 | 0 |
| Ref. | 0.2 | 0.8 | 1:2.5 | 0.5 | 0 |
| GFs-0.5 | 0.2 | 0.8 | 1:2.5 | 0.5 | 0.5 |
| GFs-1.0 | 0.2 | 0.8 | 1:2.5 | 0.5 | 1.0 |
| GFs-1.5 | 0.2 | 0.8 | 1:2.5 | 0.5 | 1.5 |
| Specimen | Ref. | GFs-0.5 | GFs-1.0 | GFs-1.5 |
|---|---|---|---|---|
| Porosity (%) | 8.75 | 8.17 | 9.05 | 9.34 |
| Variance | 0.71 | 0.63 | 0.78 | 0.87 |
Disclaimer/Publisher’s Note: The statements, opinions and data contained in all publications are solely those of the individual author(s) and contributor(s) and not of MDPI and/or the editor(s). MDPI and/or the editor(s) disclaim responsibility for any injury to people or property resulting from any ideas, methods, instructions or products referred to in the content. |
© 2025 by the authors. Licensee MDPI, Basel, Switzerland. This article is an open access article distributed under the terms and conditions of the Creative Commons Attribution (CC BY) license (https://creativecommons.org/licenses/by/4.0/).
Share and Cite
Li, J.; Shao, T.; Guo, H.; Wang, Z.; Zhang, T.; Zhai, J.; Lei, Y. Modification Mechanism of Glass Fibers on Ordinary Portland Cement and Sulphoaluminate Cement Composites. Materials 2025, 18, 1785. https://doi.org/10.3390/ma18081785
Li J, Shao T, Guo H, Wang Z, Zhang T, Zhai J, Lei Y. Modification Mechanism of Glass Fibers on Ordinary Portland Cement and Sulphoaluminate Cement Composites. Materials. 2025; 18(8):1785. https://doi.org/10.3390/ma18081785
Chicago/Turabian StyleLi, Jiaxin, Tingquan Shao, Haoyan Guo, Zhenjun Wang, Ting Zhang, Jianliang Zhai, and Yu Lei. 2025. "Modification Mechanism of Glass Fibers on Ordinary Portland Cement and Sulphoaluminate Cement Composites" Materials 18, no. 8: 1785. https://doi.org/10.3390/ma18081785
APA StyleLi, J., Shao, T., Guo, H., Wang, Z., Zhang, T., Zhai, J., & Lei, Y. (2025). Modification Mechanism of Glass Fibers on Ordinary Portland Cement and Sulphoaluminate Cement Composites. Materials, 18(8), 1785. https://doi.org/10.3390/ma18081785