
Data Processing of 2060-T8 Alloy Fatigue Test Results Using Statistical Methods to Improve Reliability and Accuracy


Abstract
1. Introduction
2. Fatigue Testing
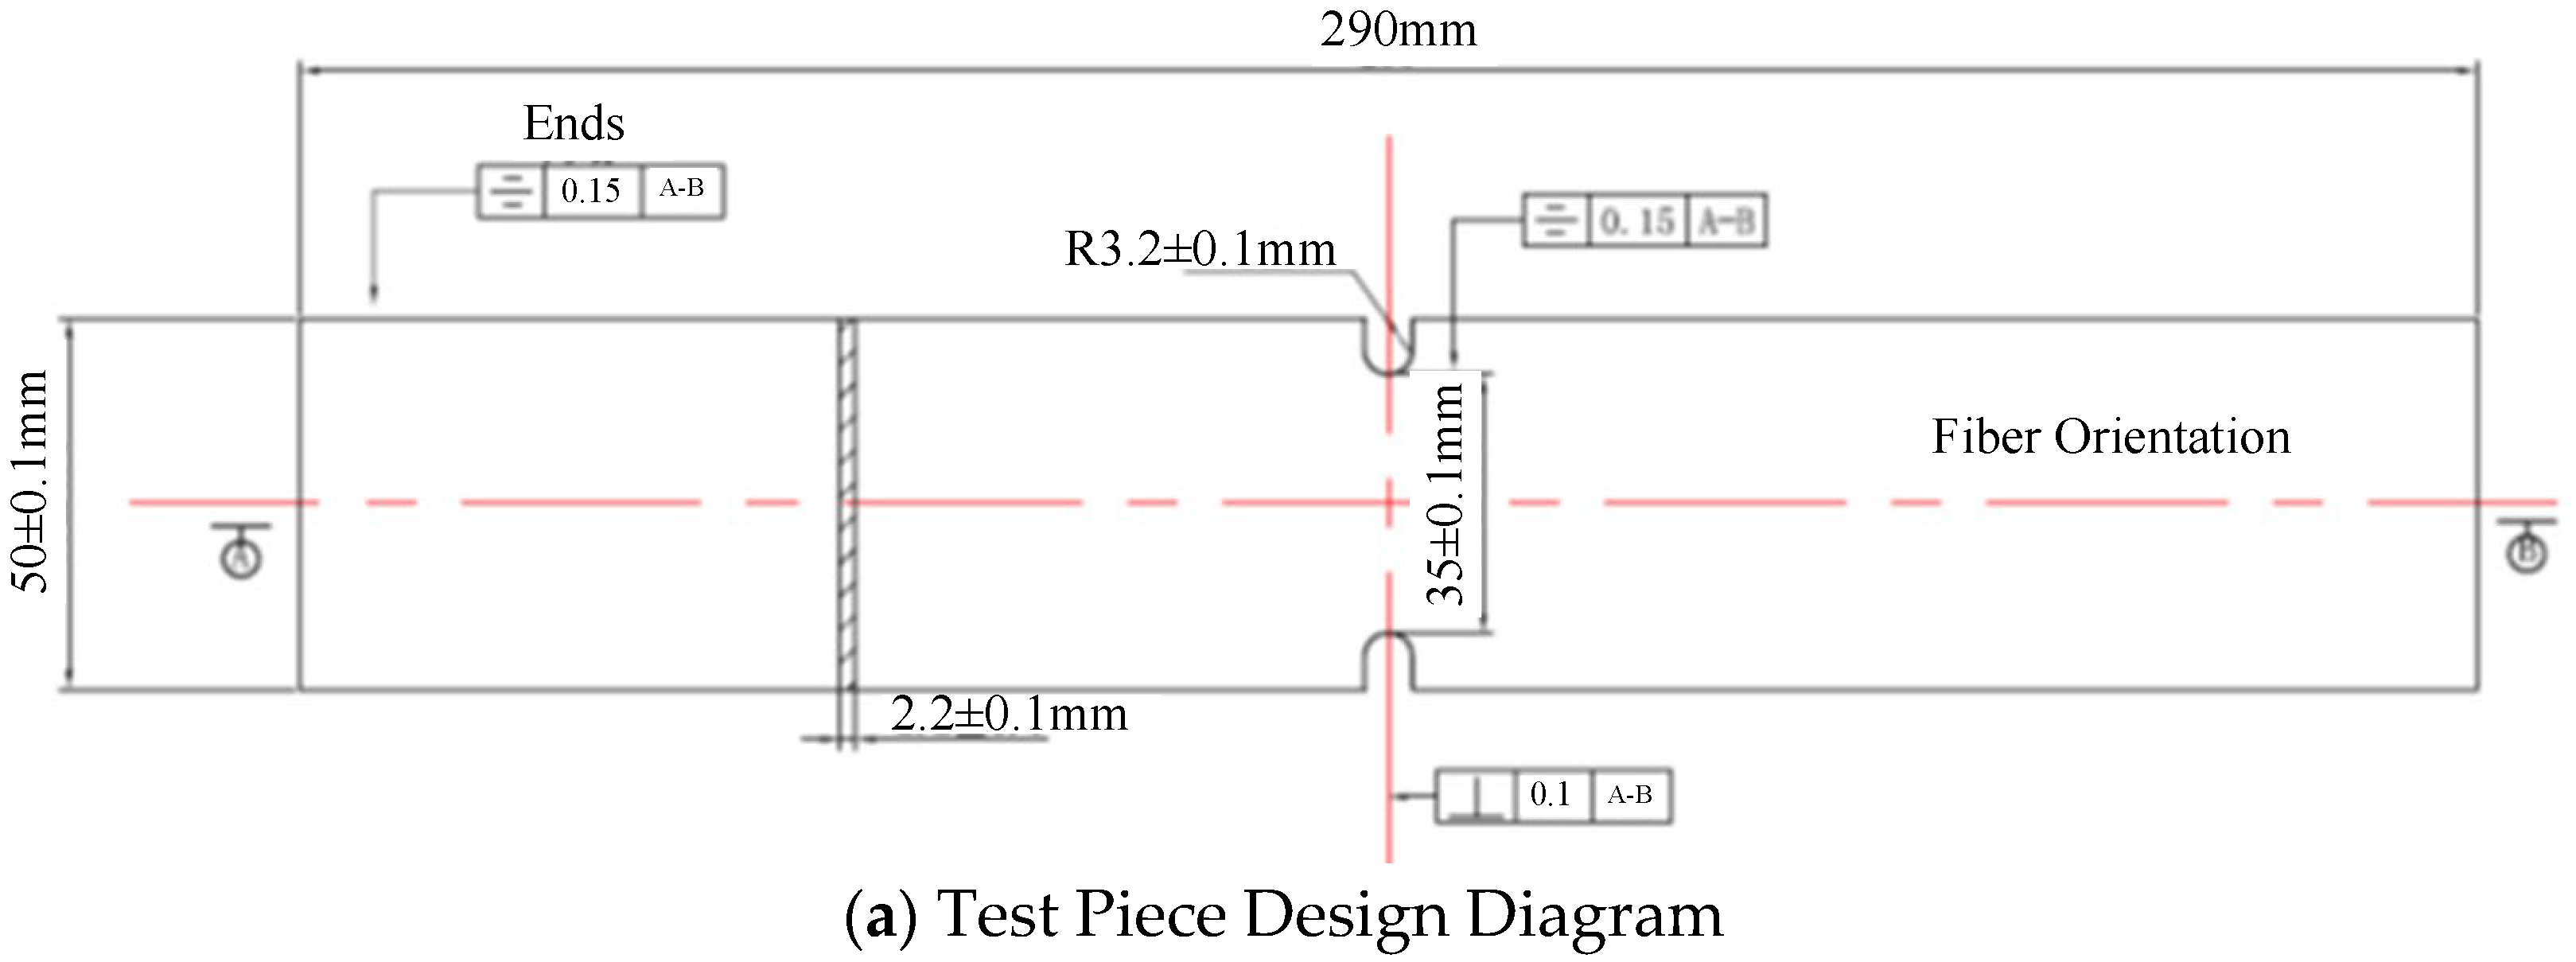
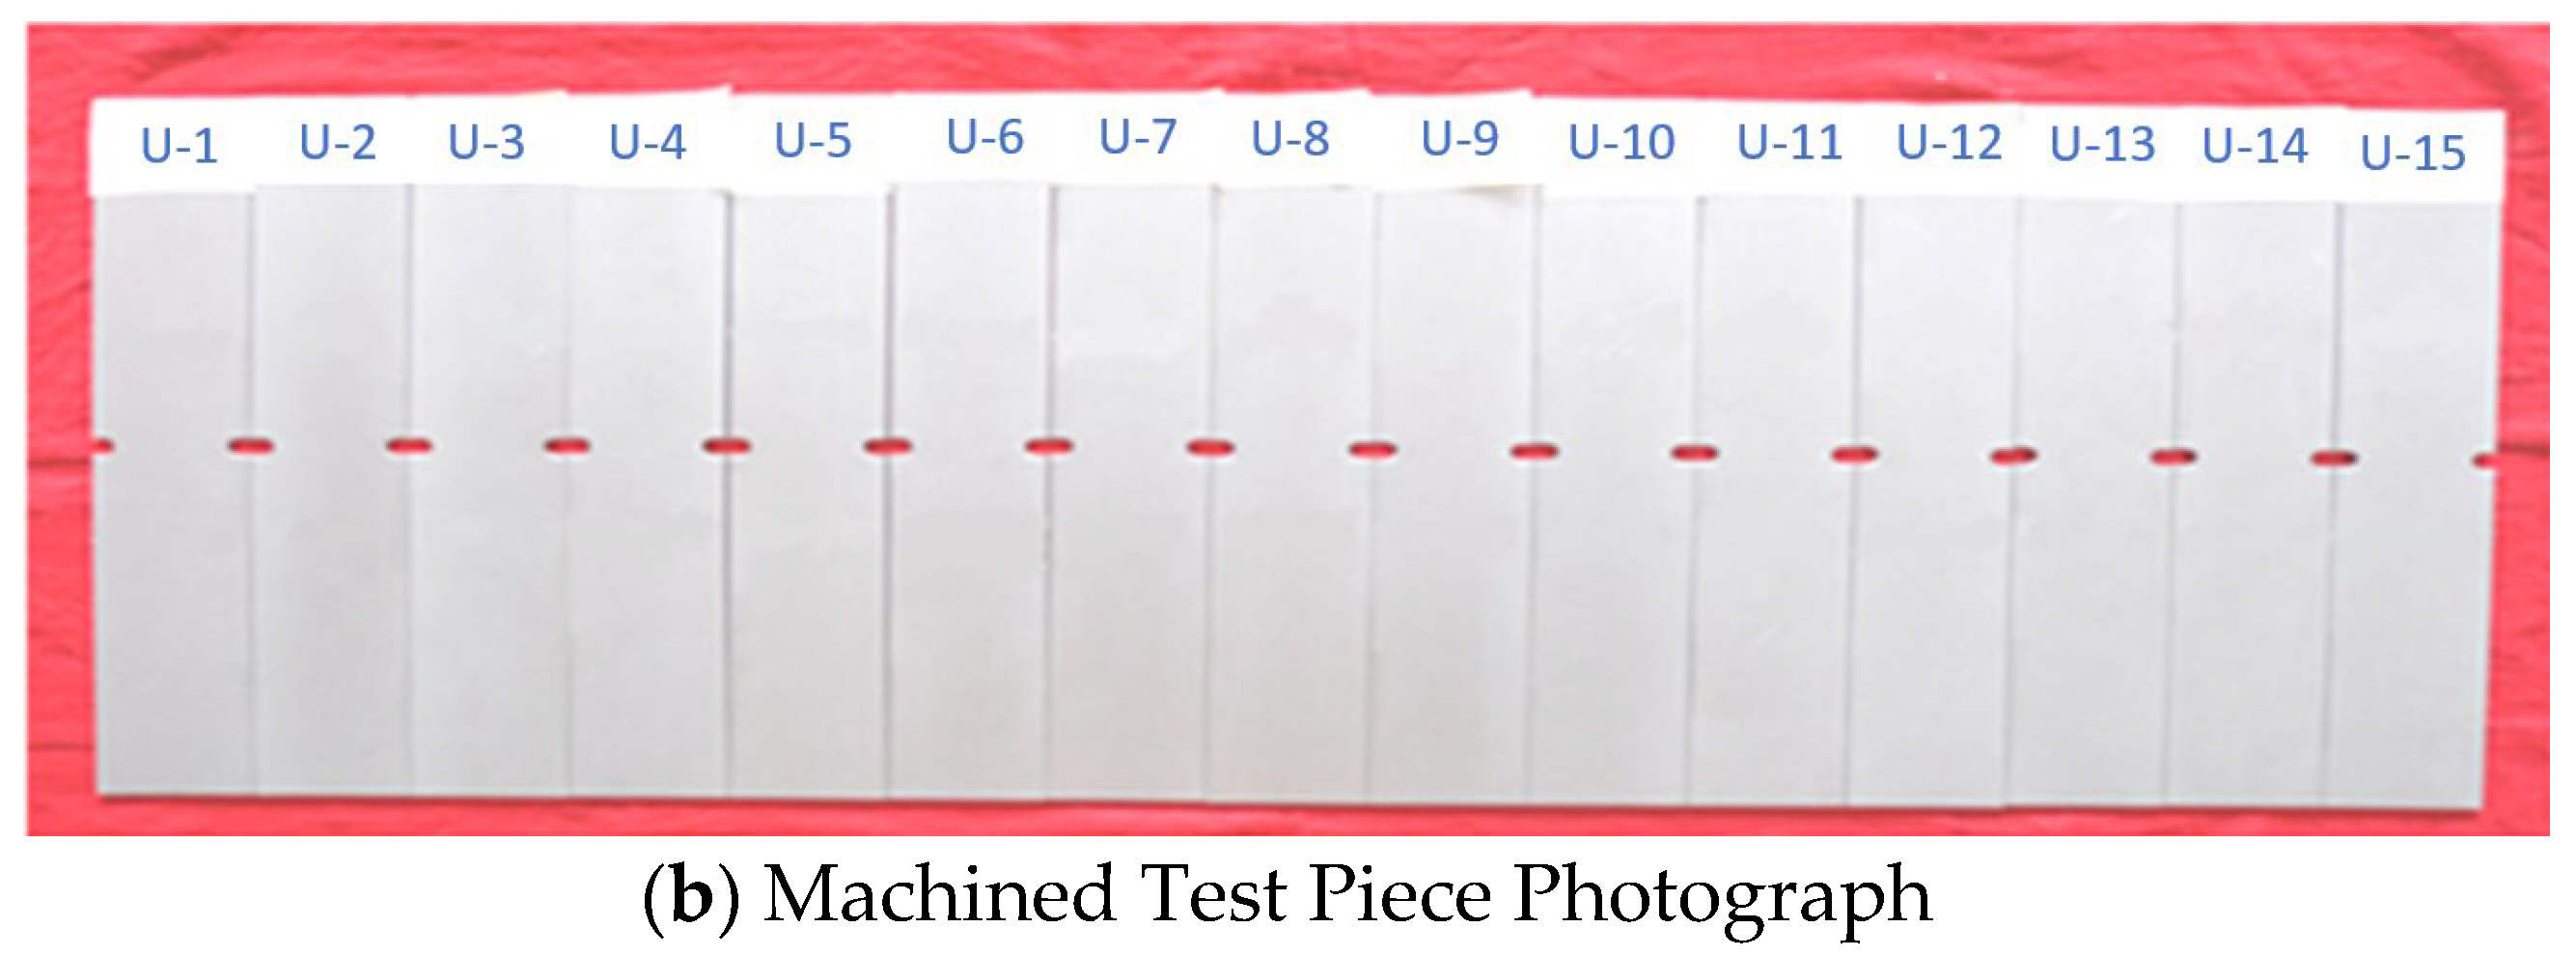
2.1. Specimen Design and Testing Method
2.2. Test Results
3. Analysis and Processing of Fatigue Test Data
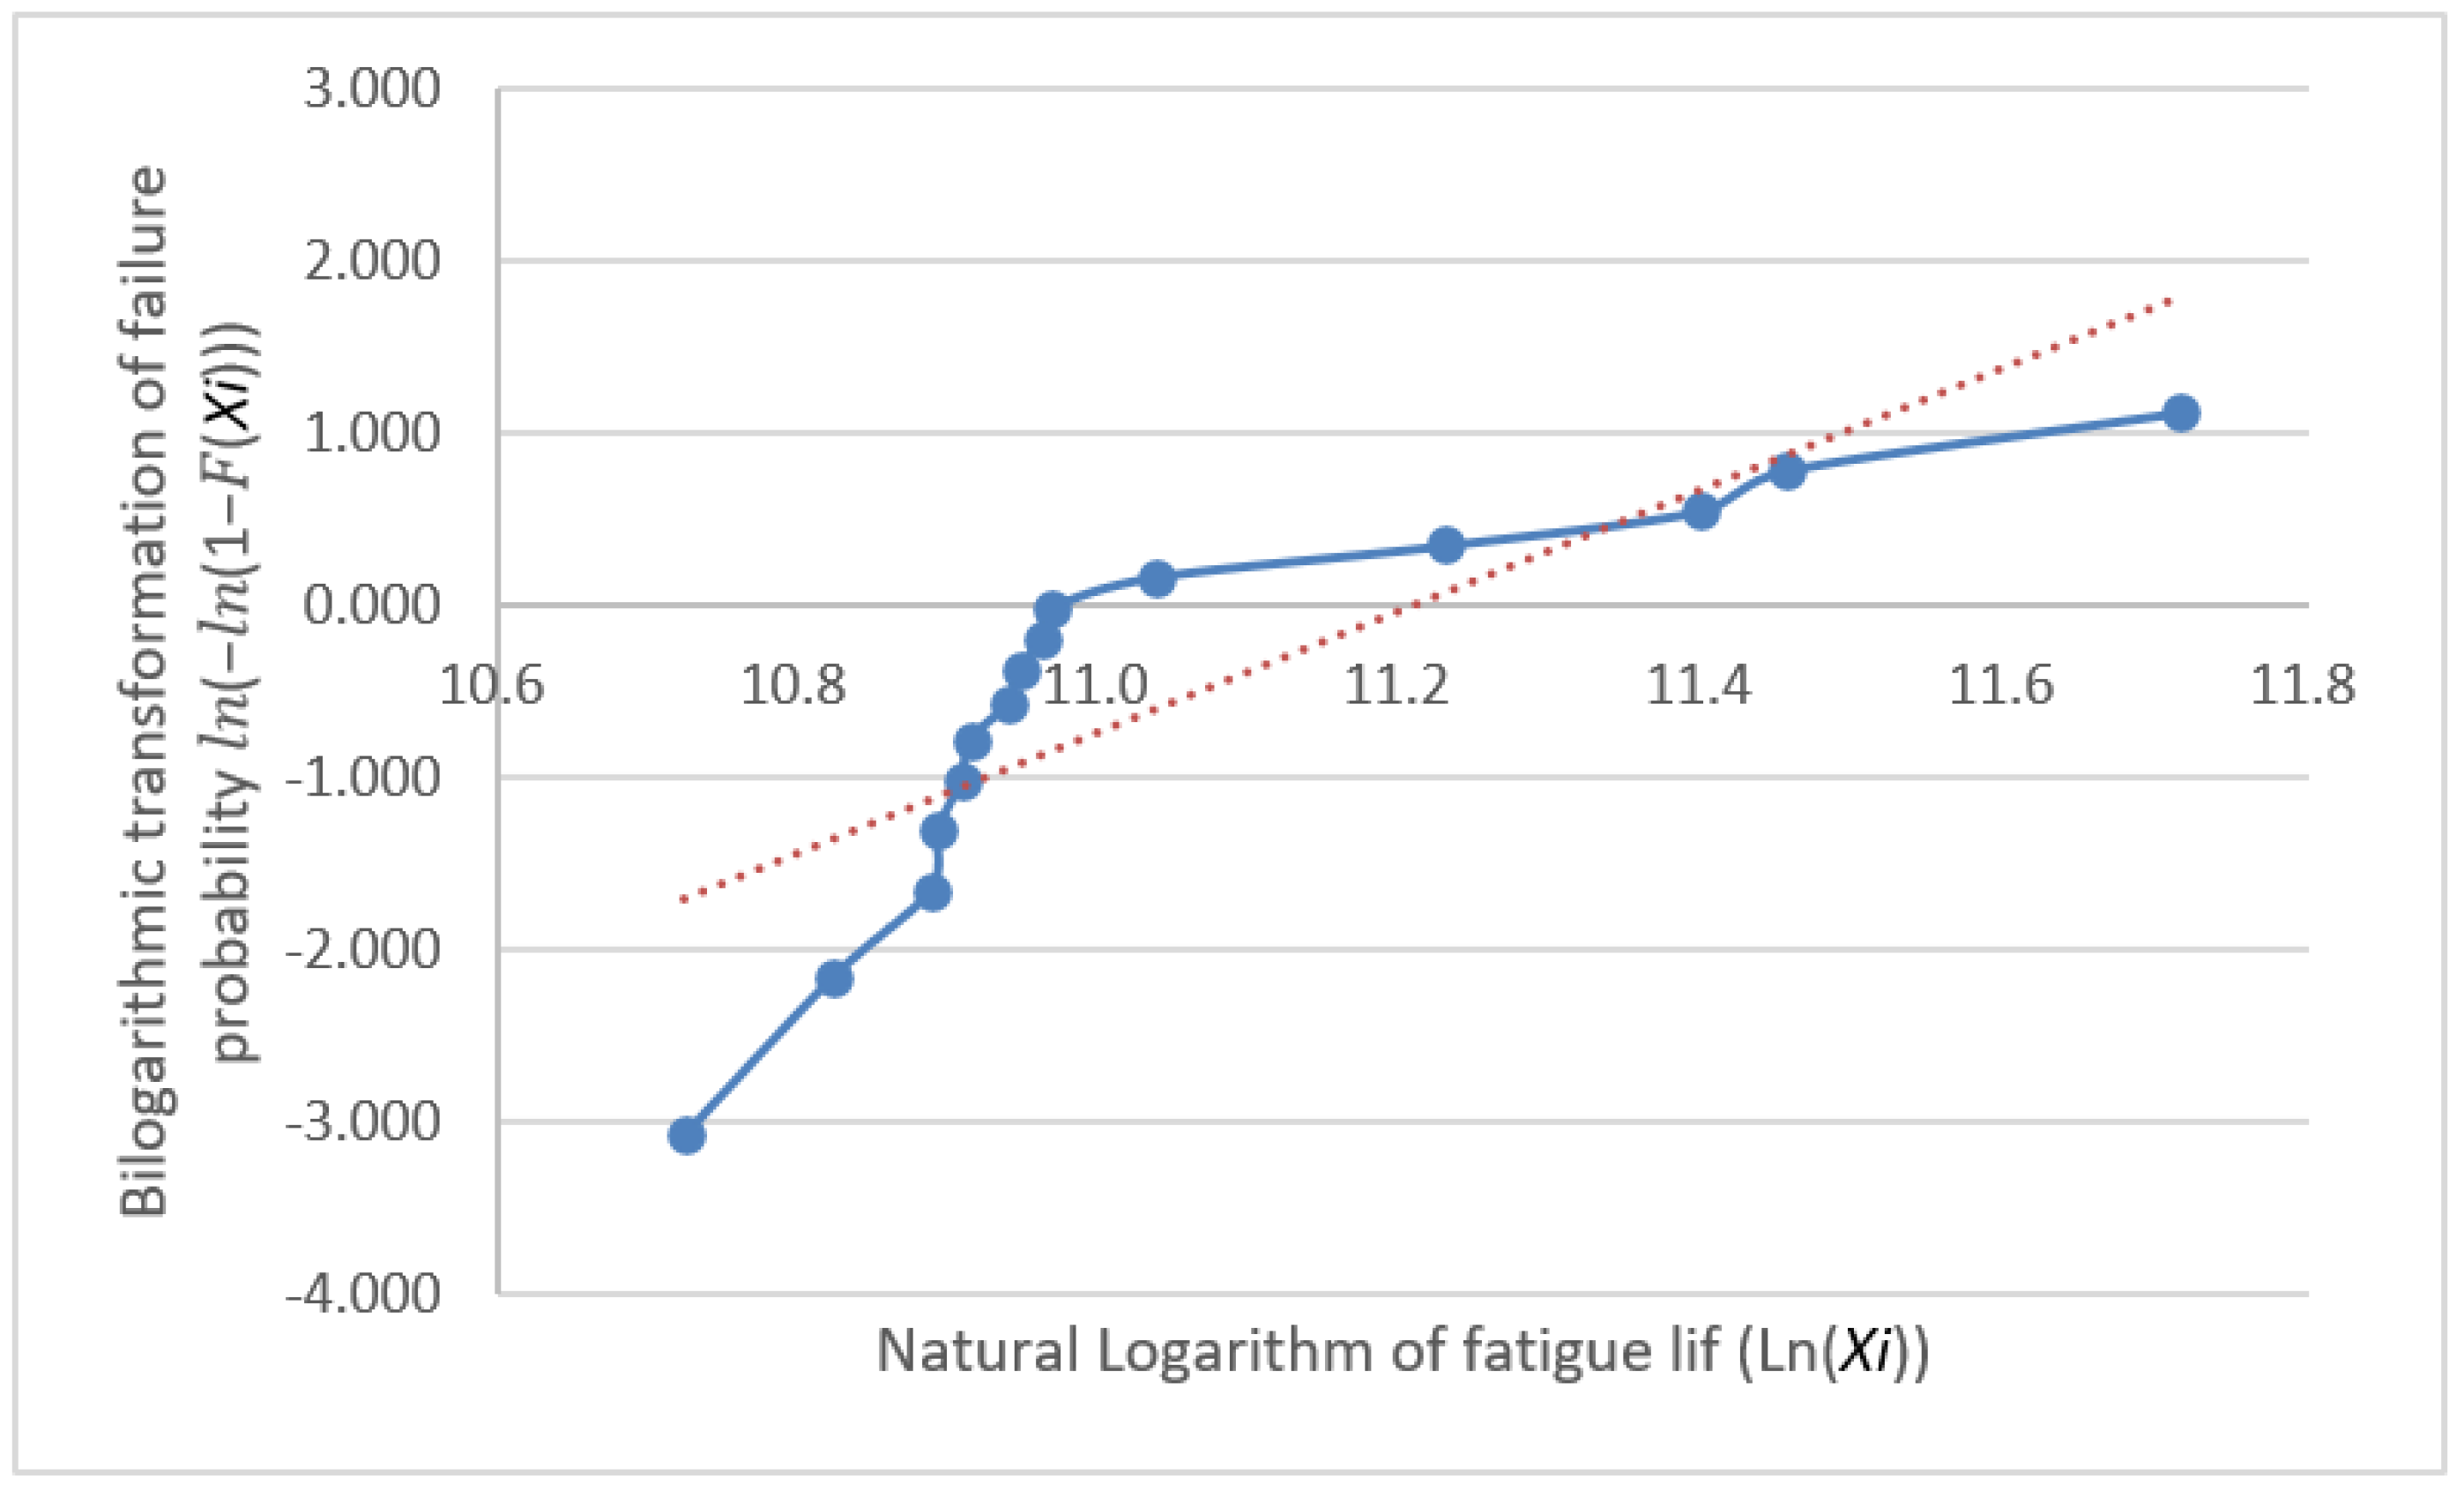
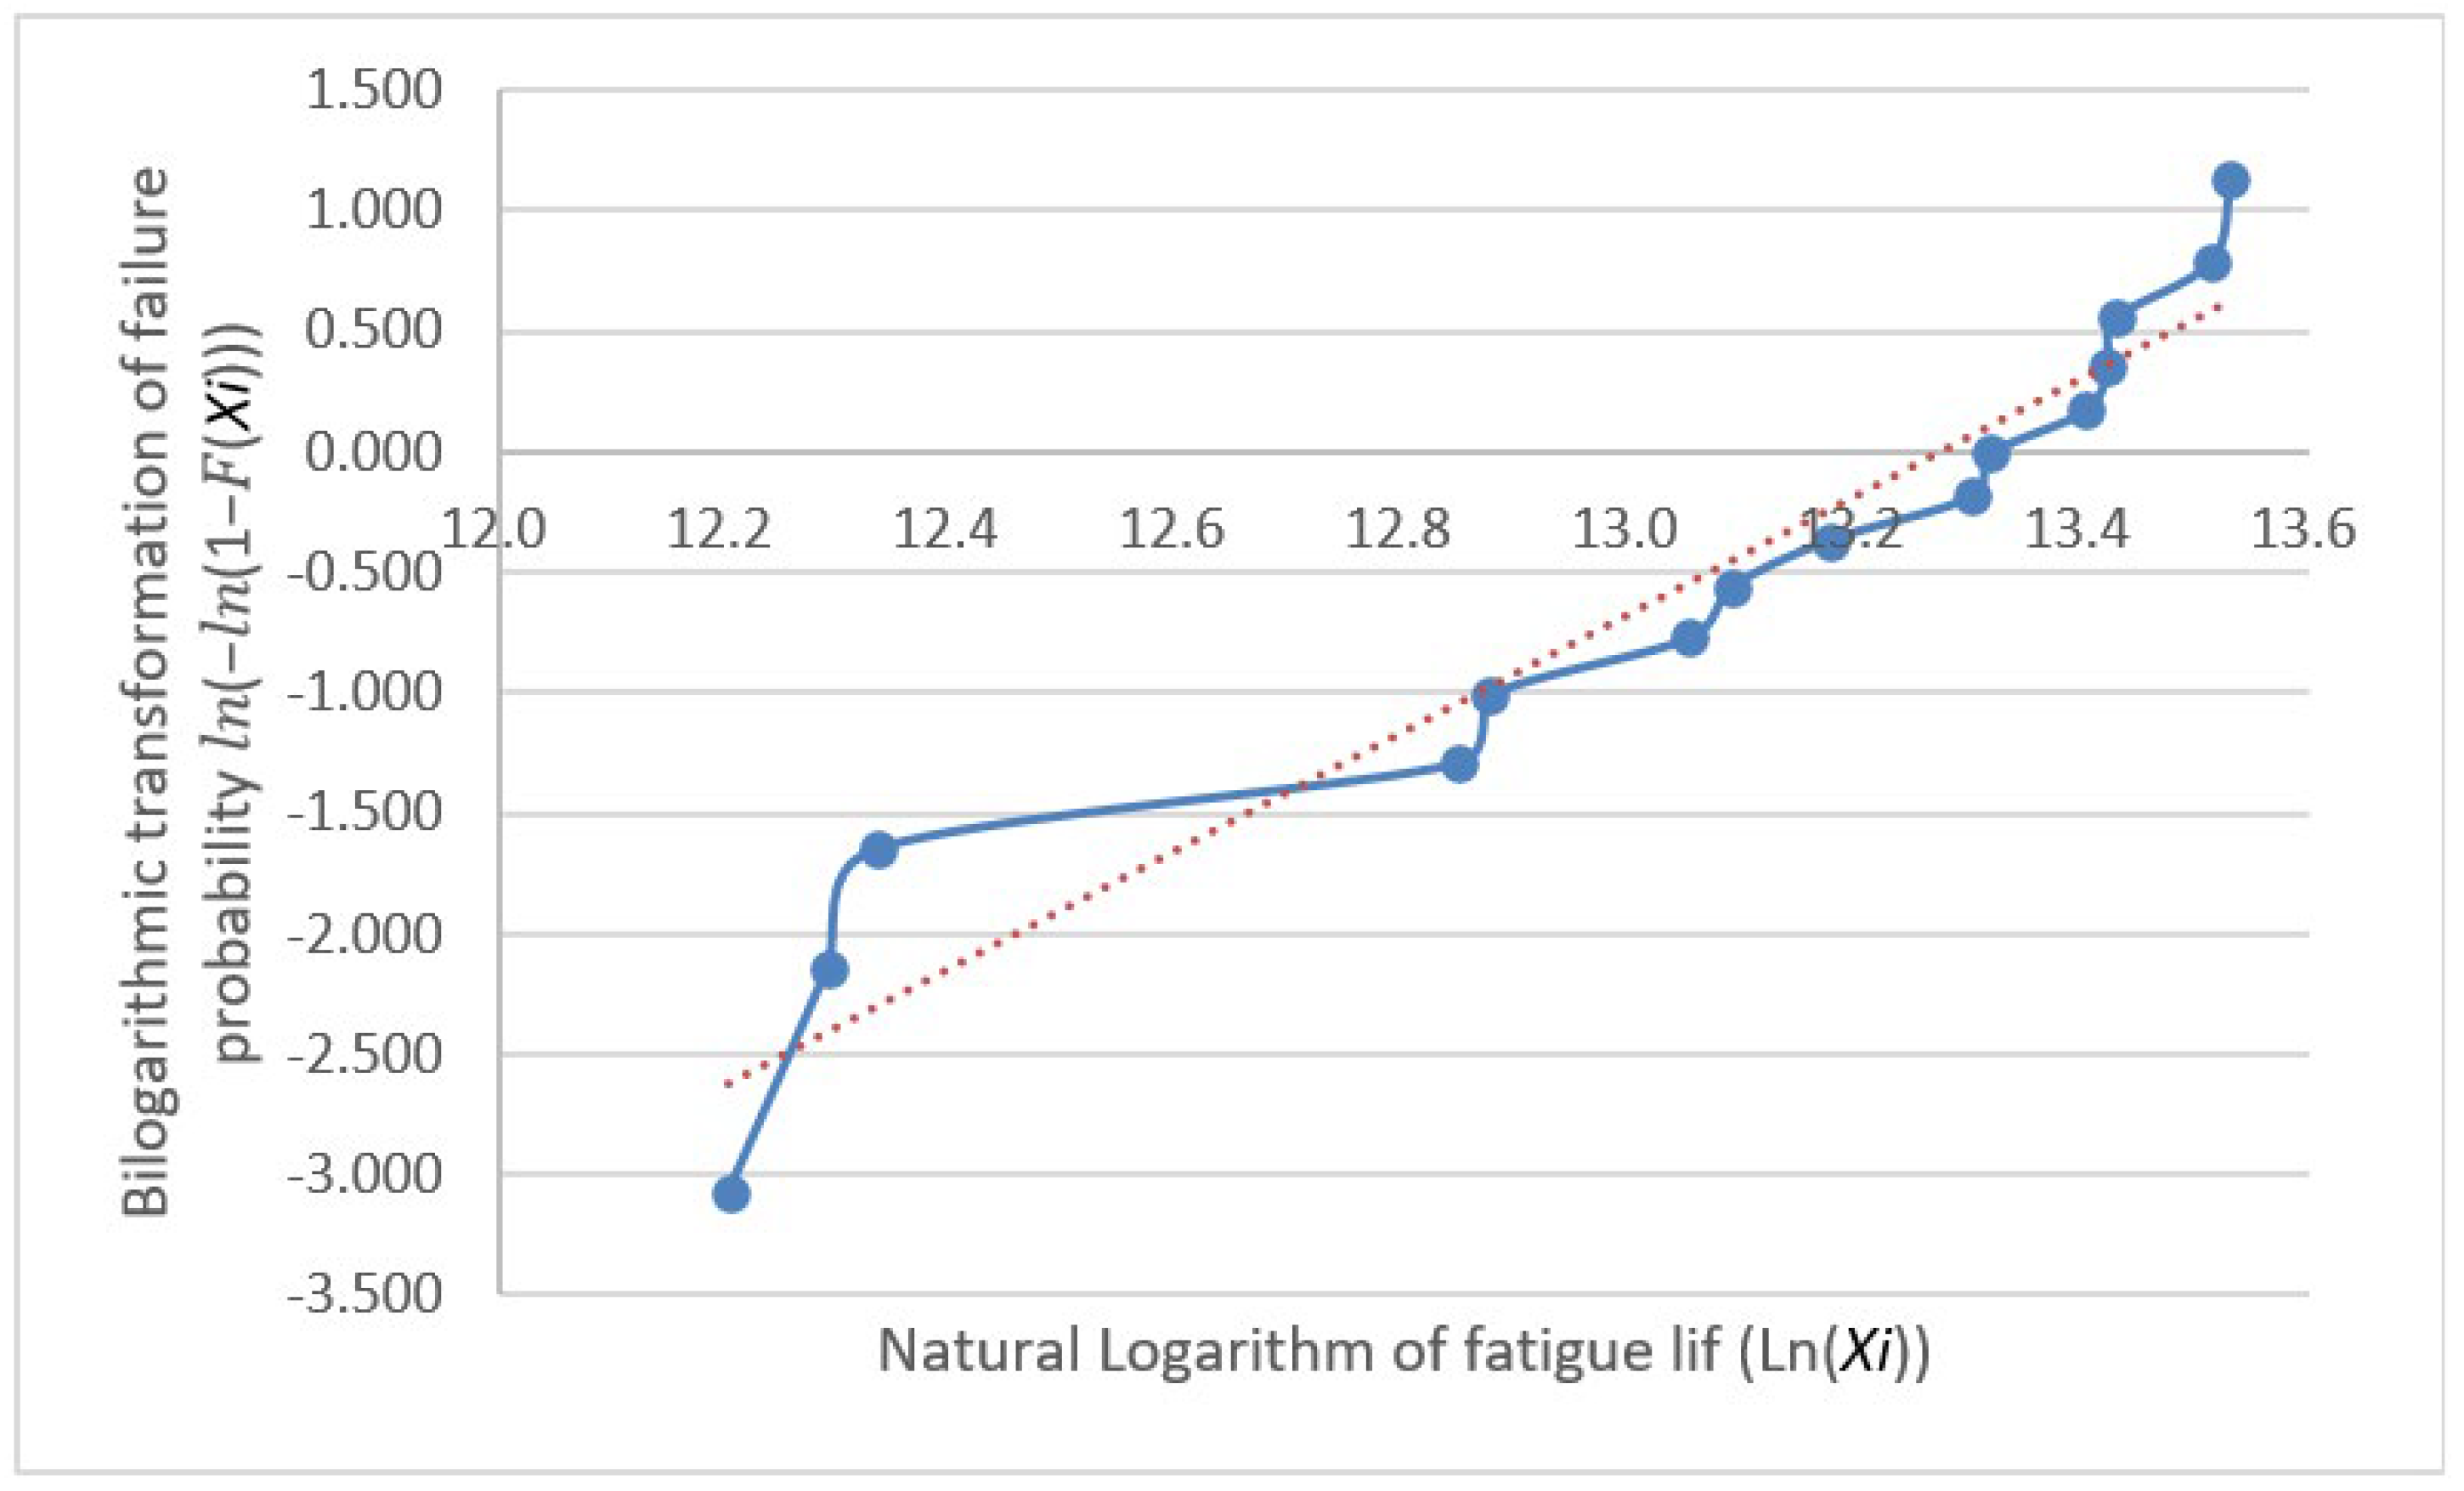
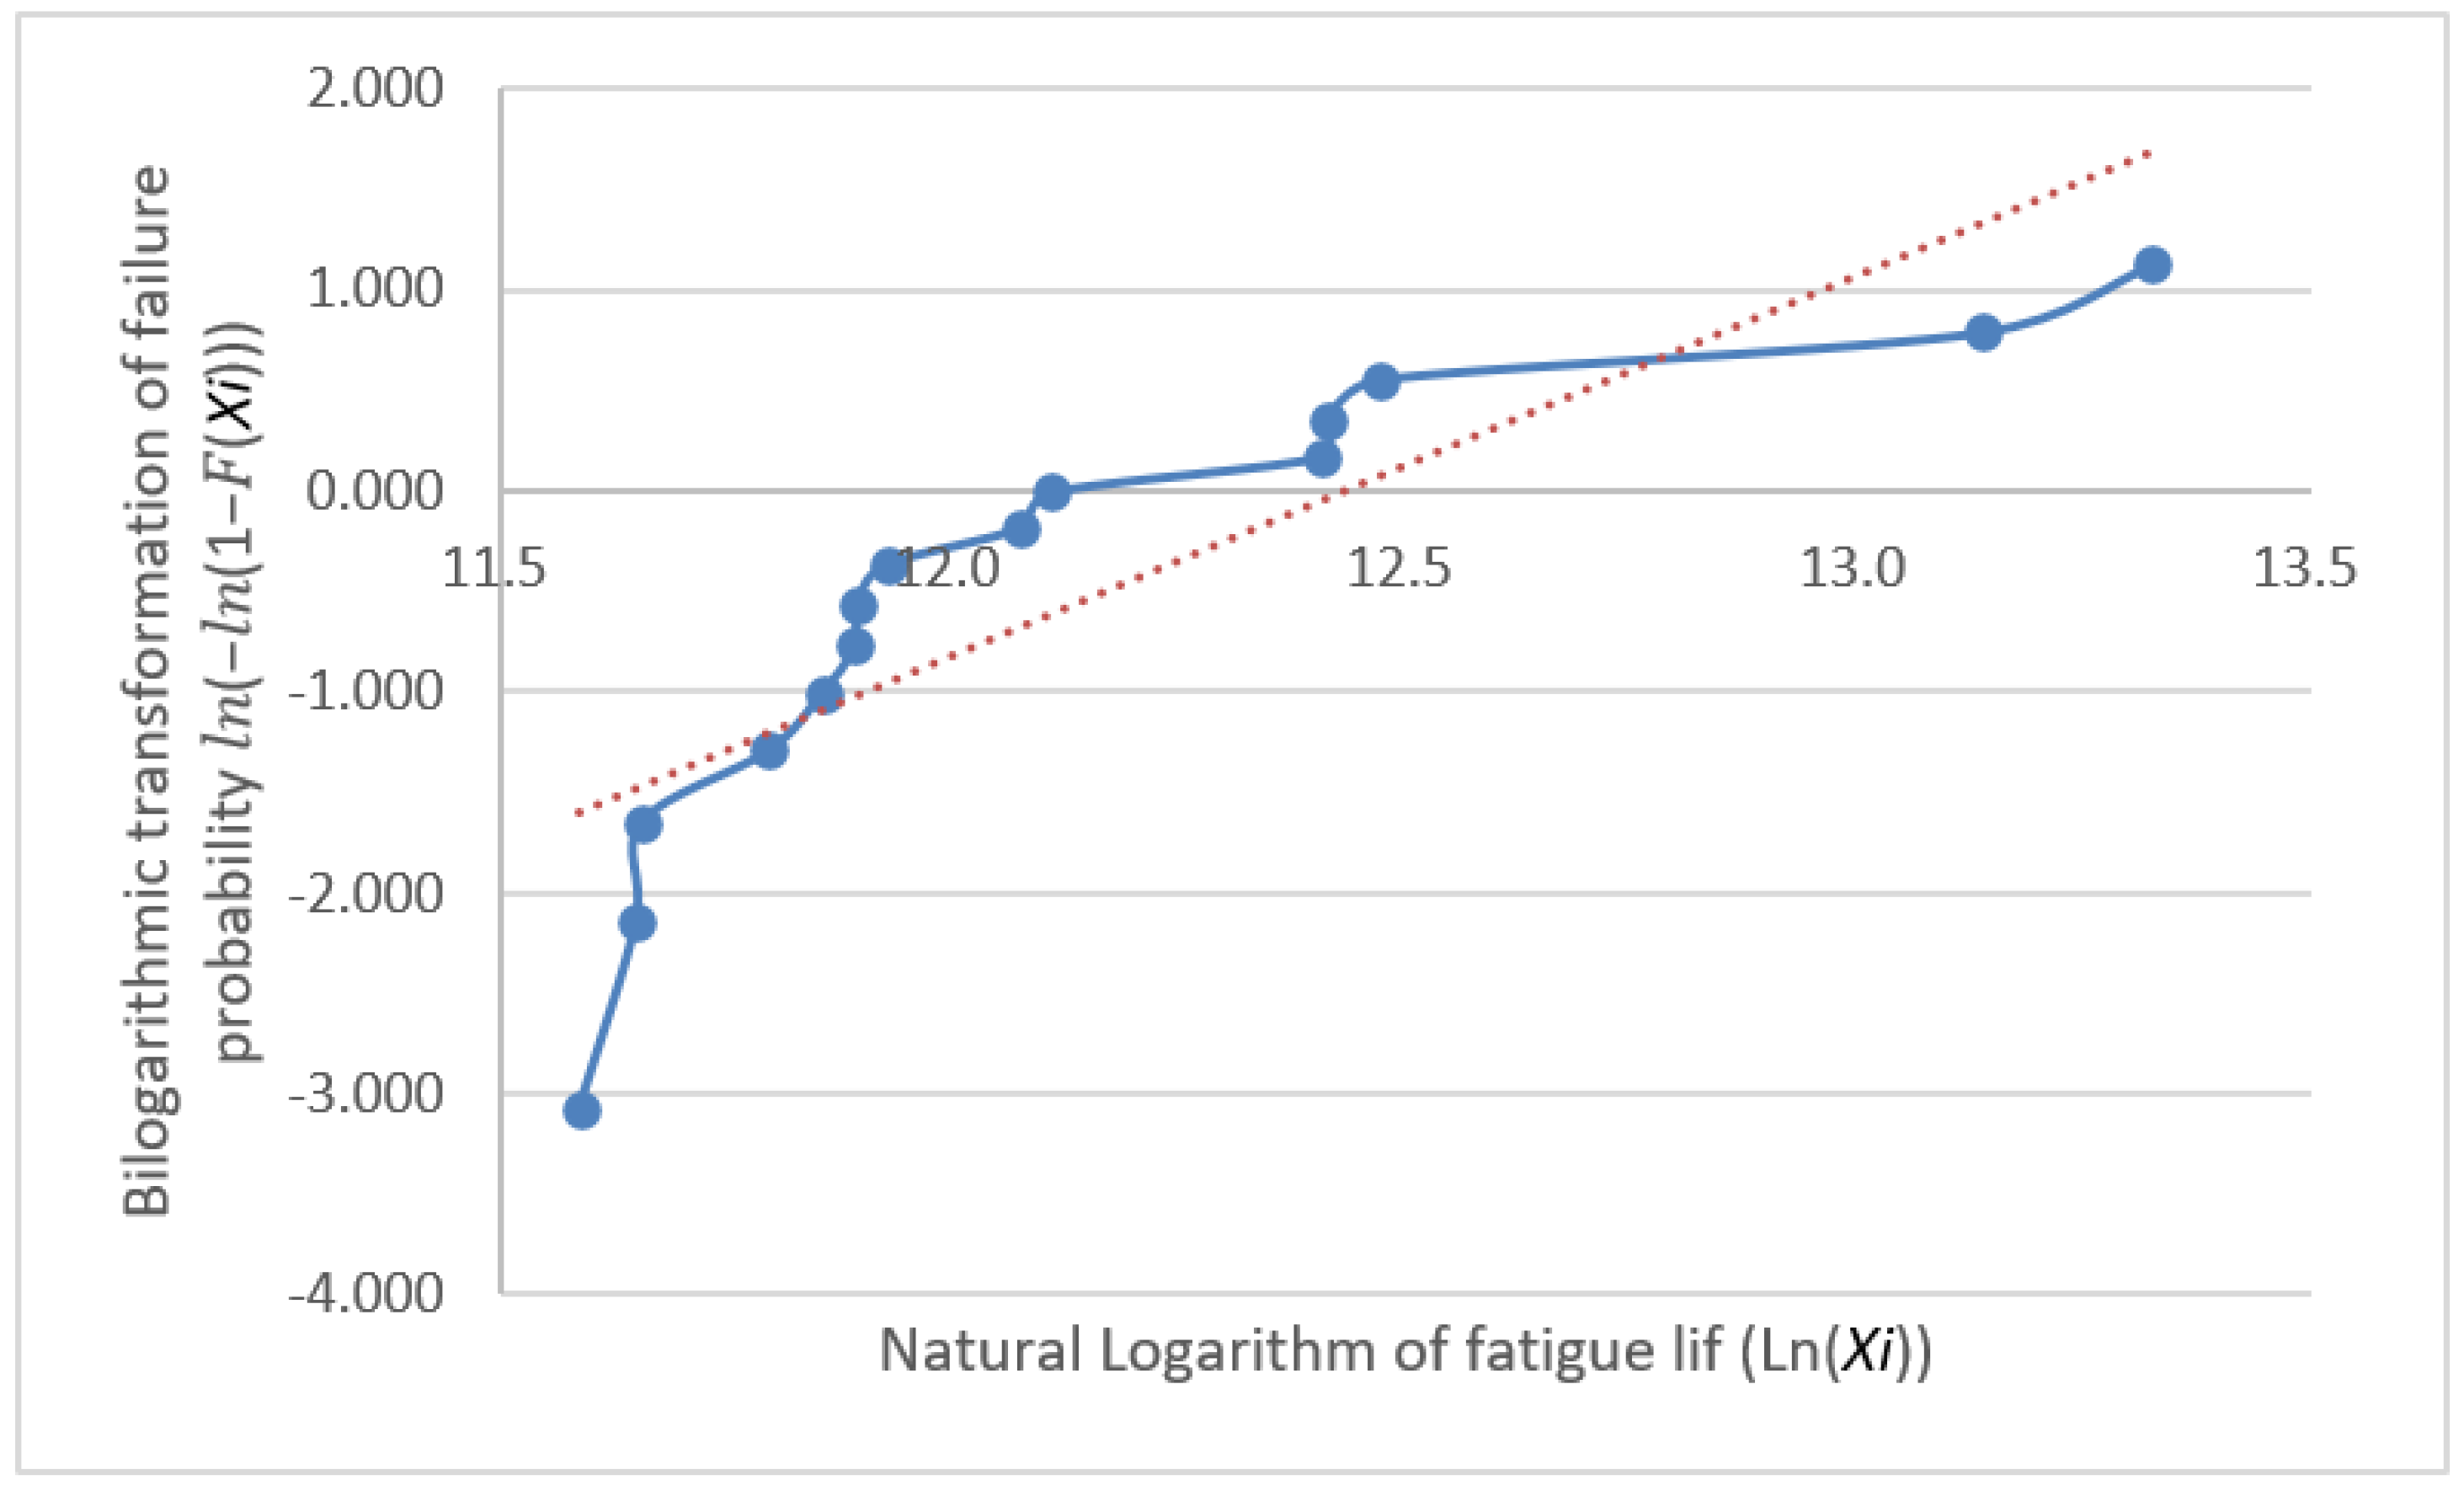
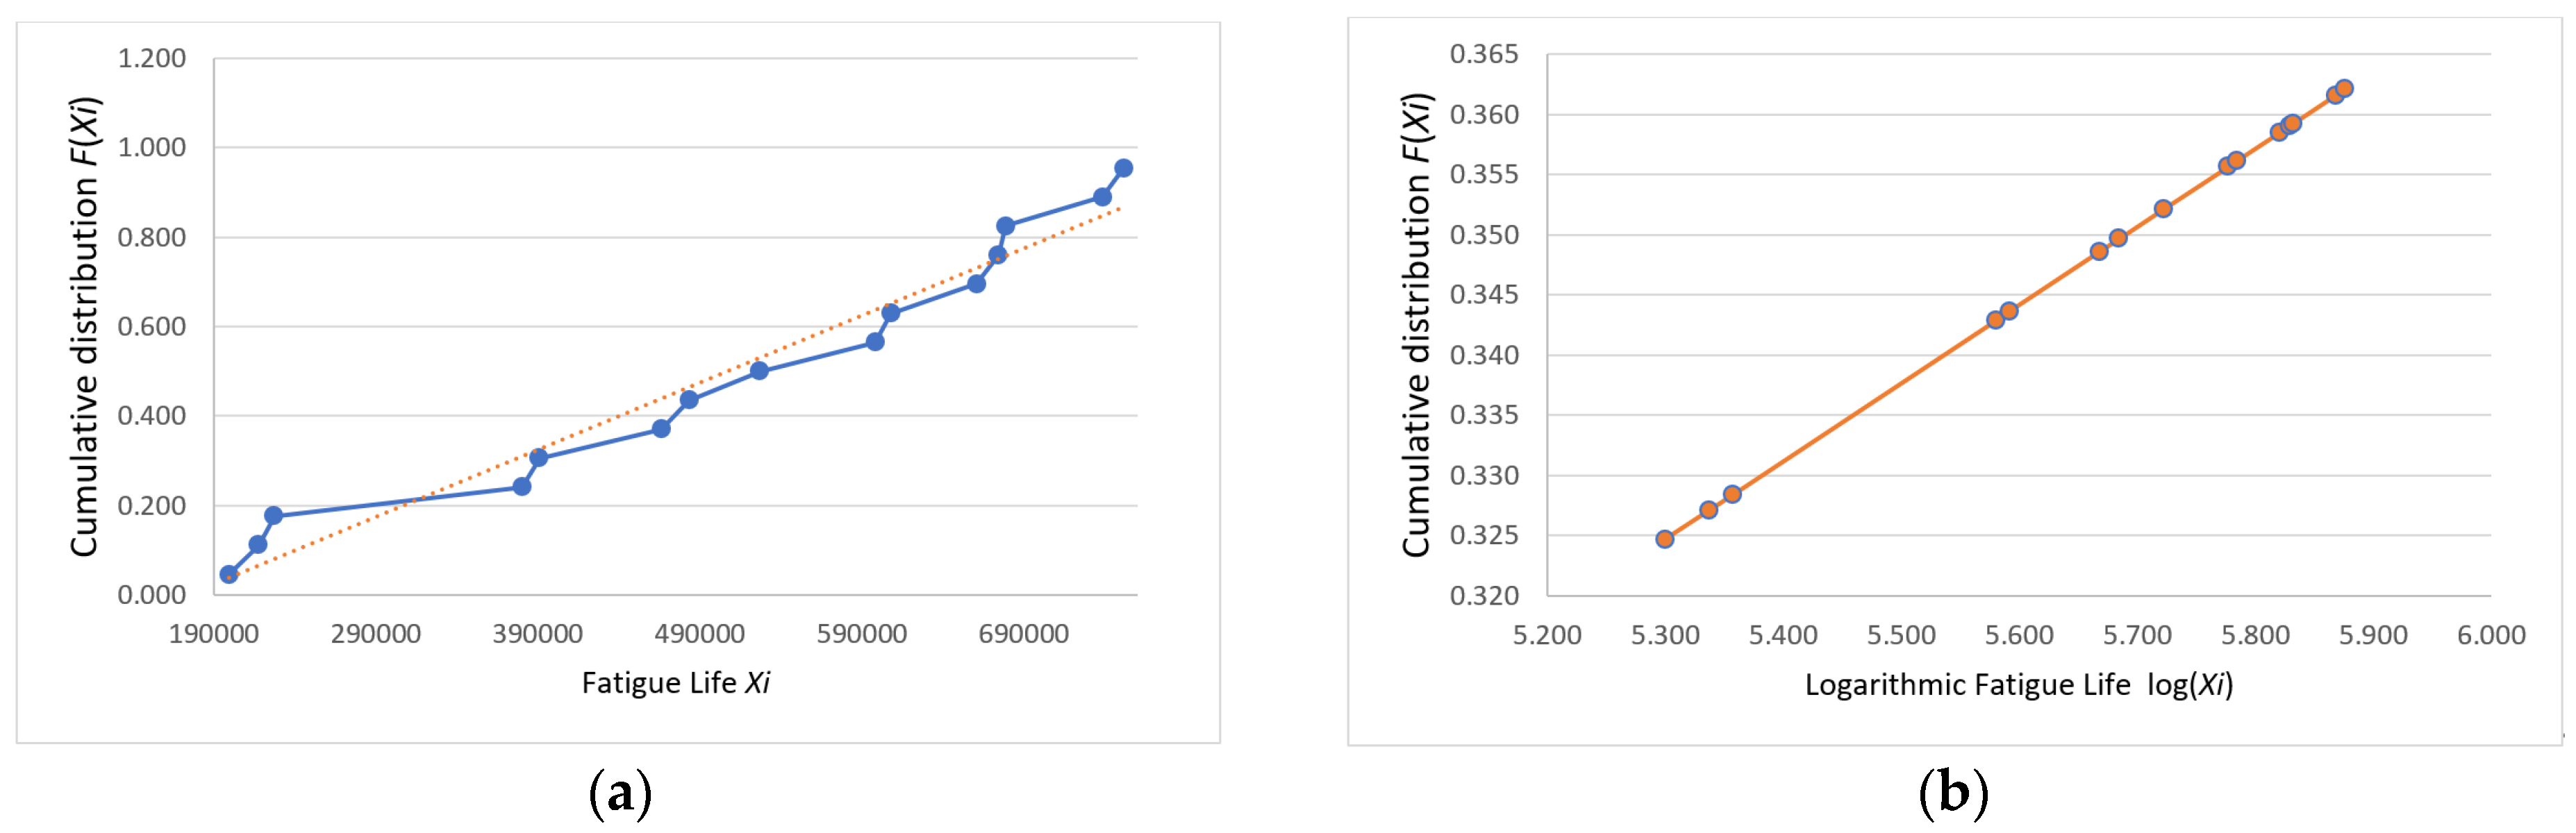
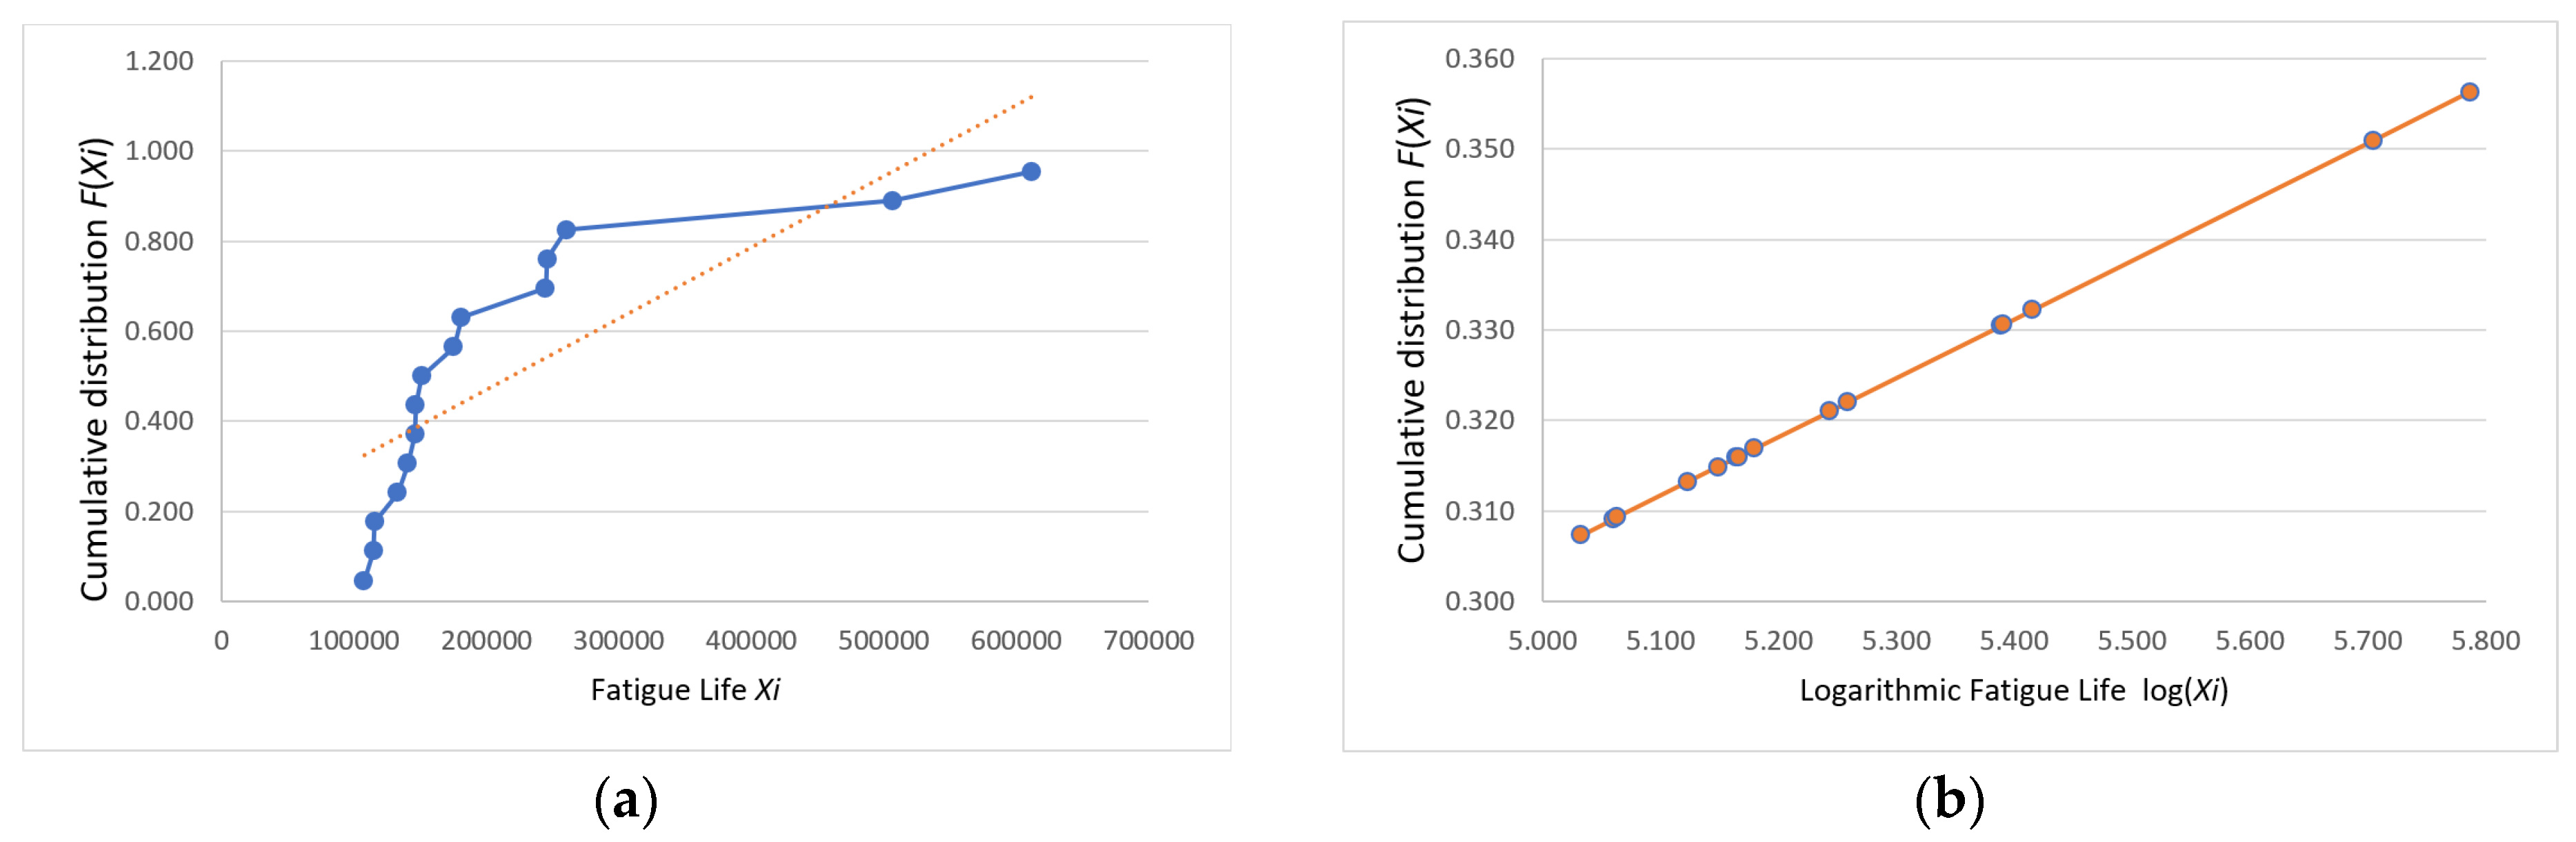
3.1. Distribution Testing
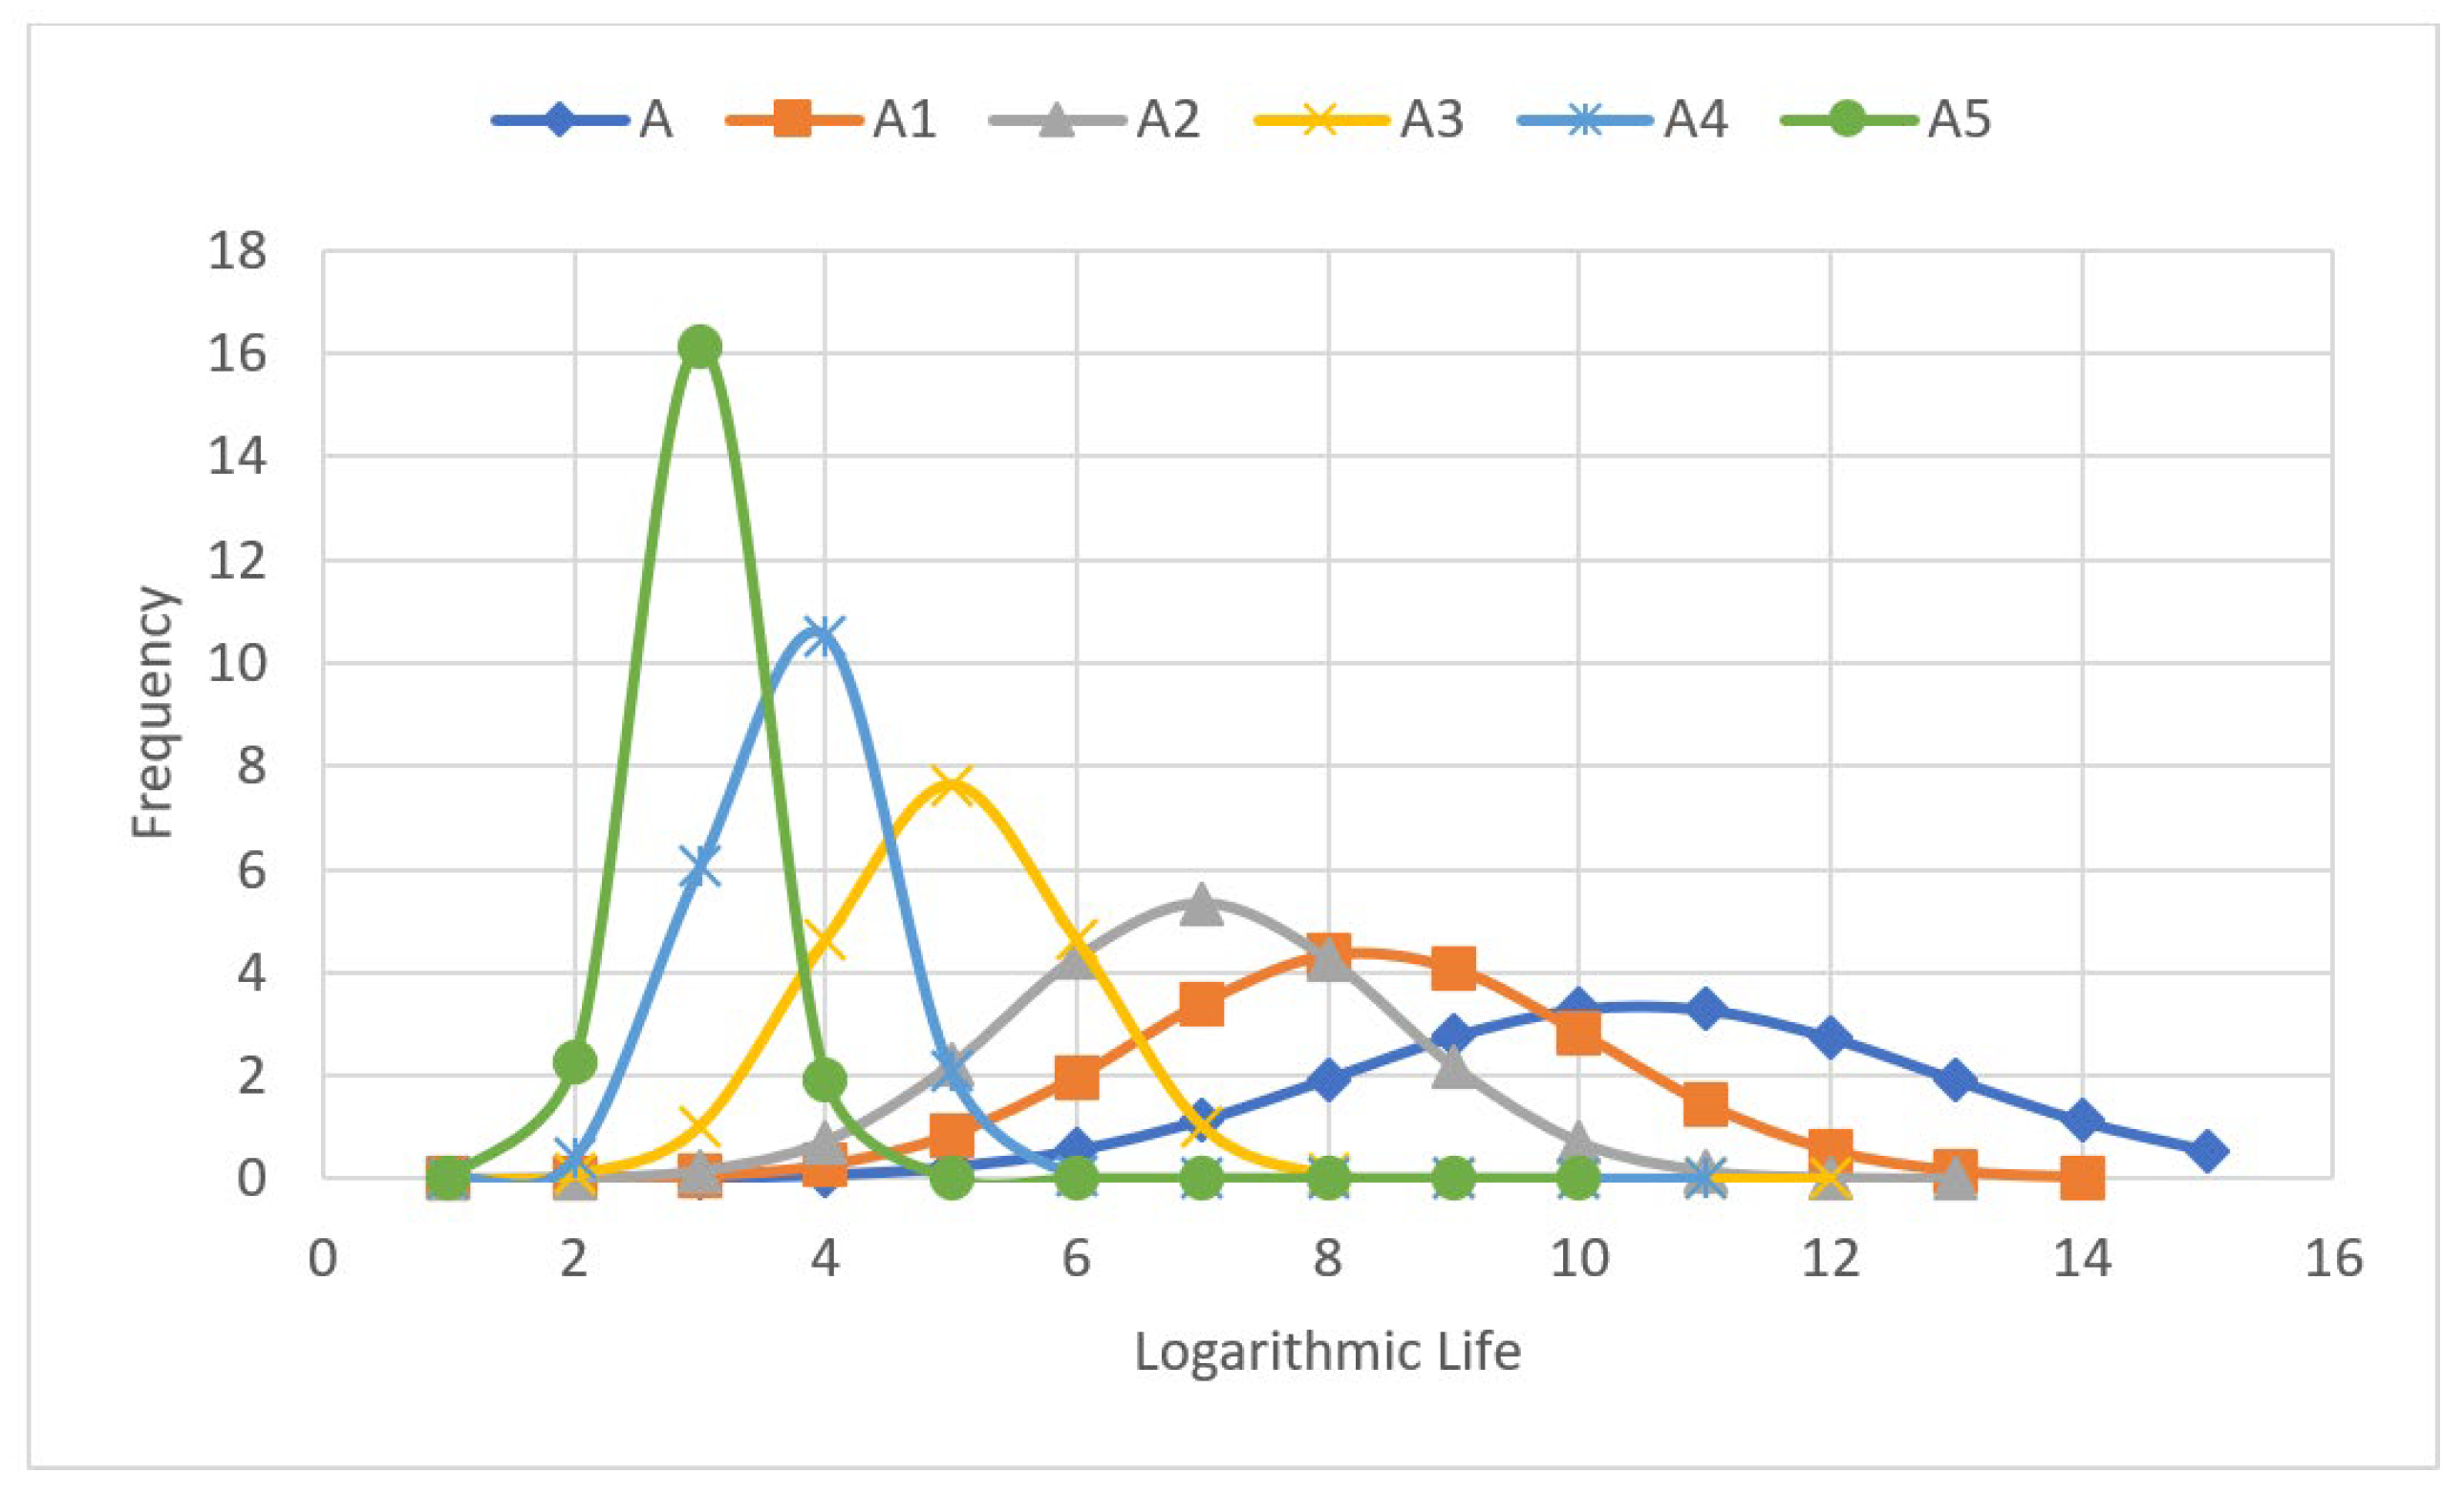
3.2. Processing Abnormal Fatigue Life Data
- (1)
- Calculate the mean and standard deviation of the sample. These statistical measures serve as the basis for subsequent outlier determination.
- (2)
- Calculate the deviation between each observed value and the mean, then divide this deviation by the standard deviation to obtain the “deviation ratio”, which reflects the degree of deviation between each data point and the overall sample.
- (3)
- Using the standardized table for a log-normal distribution, find Chauvenet’s criterion value for which the probability of an observed value is less than 1/n (where n is the sample size).
- (4)
- Compare the deviation ratio for each observed value with Chauvenet’s criterion value. If the former is greater than the latter, the observed value can be regarded as an outlier.
3.3. Hypothesis Testing
3.4. Comparison of Fatigue Reliability
4. Conclusions
- (1)
- The fatigue life data were analyzed using a normality test. If such data do not satisfy the normality requirements, relevant processing is required to ensure that they conform to the normality requirements. The collected data were confirmed to follow a log-normal distribution.
- (2)
- The outliers in the fatigue life data were removed using statistical methods to reduce the dispersion of the data, ensuring that it accurately reflected the fatigue lives of the specimen population.
- (3)
- Overall, the scatter in the fatigue life data for the shot-peened specimens was greater than that for the unpeened specimens, and there were no significant differences between those for the low- and high-intensity shot-peened specimens.
- (4)
- Statistical analyses indicated that shot peening significantly enhanced the fatigue life of the 2060-T8E30 alloy and that a longer fatigue life and higher fatigue reliability were achieved by low-intensity shot peening than by high-intensity shot peening.
- (5)
- The results of this study suggest that the reliability of fatigue test results can be enhanced by improving the consistency of fatigue specimen processing.
Author Contributions
Funding
Institutional Review Board Statement
Informed Consent Statement
Data Availability Statement
Conflicts of Interest
References
- Zhang, G.Q.; Teng, C.Y. Current status and development trend of advanced structural materials technology in aerospace field. J. Aeronaut. Mater. 2024, 44, 1–12. [Google Scholar]
- Yang, S.; Lu, Z.; Su, B.; Dai, S.; Liu, B.; Yan, M. Research progress of Al-Li alloy. Mater. Eng. 2001, 44–47. [Google Scholar]
- Niu, T.; Wang, X.Y.; Wu, X.C. Effect of shot peening process on surface properties and wear behavior of 4Cr5Mo2V steel. Heat Treat. Met. 2023, 48, 153–159. [Google Scholar]
- Huang, H.Y.; Zhang, F.L.; Wang, G.H.; Li, X.S.; Qian, Q.L.; Zou, W.; Cao, Y.F.; Liu, Q.; Chen, Y.Z.; Chen, Z. Influence of Conventional Shot Peening and Micro-Particle Peening Processes on the Surface Properties of 42CrMo Steel. Mater. Prot. 2024, 57, 101–109. [Google Scholar]
- Del Llano-Vizcaya, L.; Rubio-González, C.; Mesmacque, G.; Cervantes-Hernández, T. Multiaxial fatigue and failure analysis of helical compression springs. Eng. Fail. Anal. 2006, 13, 1303. [Google Scholar] [CrossRef]
- Ertas Ahmet, H.; Sonmez Fazil, O. Design of fiber reinforced laminates for maximum fatigue life. Procedia Eng. 2010, 2, 251. [Google Scholar] [CrossRef]
- Jawaid, S.; Ferguson, J. Design evaluation & product reliability assessment using accelerated reliability fatigue life tests. In Proceedings of the Annual Reliability and Maintainability Symposium, Los Angeles, CA, USA, 24–27 January 2000; pp. 239–244. [Google Scholar]
- Yao, W.X. Structural Fatigue Life Analysis; National Defense Industry Press: Beijing, China, 2003. [Google Scholar]
- Li, Y.; Han, X.; Liu, J. A prediction method on high-cycle fatigue parameters based on dissipated energy computation. Chin. Ournal Theor. Appl. Mech. 2013, 45, 367–374. [Google Scholar]
- Li, G.A. Microstructural Characteristics and Fatigue Damage Behavior of 2060 Aluminum-Lithium Alloy Sheet. J. Northwestern Polytech. Univ. 2020, 38, 384–391. [Google Scholar] [CrossRef]
- GB/T 3075–2008; Metallic Materials—Fatigue Testing—Axial-Force-Controlled Method. National Standard of the People’s Republic of China: Beijing, China, 2008.
- Xu, H. Fatigue Strength; Higher Education Press: Beijng, China, 1986; pp. 85–86. [Google Scholar]
- Yan, H. Fatigue and Fracture Properties of Materials and Statistical Analysis; Northwestern Polytechnical University: Xi’an, China, 1999. [Google Scholar]
- Ma, X.H.; Zhang, X. The Comparison among the Common Normality Tests for Numerical Variables. J. Evid.-Based Med. 2014, 14, 123. [Google Scholar]
- Yu, D.; Yang, Y.H.; Chen, R. Research on fatigue test and data reliability processing method. Phys. Test. 2022, 40, 13–17. [Google Scholar]
- Department of Science and Technology and Quality Supervision of the Ministry of Machinery Industry, Physical and Chemical Inspection Branch of Chinese Mechanical Engineering Society. Handbook of Materials Testing for Mechanical Engineering—Mechanics Volume; Liaoning Science and Technology Press: Shenyang, China, 2001. [Google Scholar]
- Meng, F.W.; Yang, T.; Zhi, X.; Zhang, X.; Deng, P.; Chen, Y.; Zhou, Z.; Xiao, Y. Experimental study on compressive strength and fatigue behavior of cement stabilized permeable recycled aggregate materials. J. Beijing Univ. Technol. 2024, 50, 94–104. [Google Scholar]
- Tian, R.; Dong, J.; Liu, Y.; Wang, Q.; Luo, Y. Effect of shot peening on very high cycle fatigue of 2024-T351 aluminium alloy. Mater. Express 2020, 10, 1032–1039. [Google Scholar] [CrossRef]
- Liu, R.W.; Huang Zh, G.; Liu, X.Y.; Sun, Y.F.; Wei, Y.D.; Cui, X.H.; Hou, H.L.; Xu, L.D. Fatigue crack propagation properties of industrial pure iron intensified by high energy shot peening. Heat Treat. Met. 2024, 49, 257–263. [Google Scholar]
- Gao, Z.T.; Xiong, J.J. Fatigue Reliability; Beijing University of Aeronautics and Astronautics Press: Beijng, China, 2000. [Google Scholar]
- Zhang, Z.Z.; Gao, Y.; Zhang, B.; Xin, Y.H.; Li, C. Application of F-Test and t-Test in Coal Industrial Value Analysis. Soda Ind. 2022, 6, 10–12. [Google Scholar]
- Wang, Y.; Li, T.; Dui, H.N. Study on Fatigue Scatter Factor under Severe Spectrum of Aircraft Structural Durability. Mech. Strength 2021, 43, 955–959. [Google Scholar]
- Zhang, F.; Wang, D.; Zhu, Y.F. Research on processing methods of fatigue testing data reliability. Ship Sci. Technol. 2024, 46, 8–12. [Google Scholar]
- Liu, W.T.; Huang, C. Fatigue Design Details for Military Aircraft Fatigue Rating Method Guide; Defense Industry Press: Beijng, China, 2012; pp. 30–40. [Google Scholar]


| Specimen Type | Shot Type | Shot Peening Parameters | Specimen Thickness | Number of Specimens | Specimen Number |
|---|---|---|---|---|---|
| Unpeened | None | None | 2.2 | 15 | A-1–A-15 |
| Low-intensity shot peening | Cast steel shot S230 | 0.20 ± 0.038 mmN 100% coverage rate | 2.2 | 15 | B-1–B-15 |
| High-intensity shot peening | Cast steel shot S230 | 0.36 ± 0.038 mmN 100% coverage rate | 2.2 | 15 | C-1–C-15 |
| Specimen | Fatigue Life (Cycles) | Specimen | Fatigue Life (Cycles) | Specimen | Fatigue Life (Cycles) |
|---|---|---|---|---|---|
| A-1 | 53,448 | B-1 | 527,107 | C-1 | 506,645 |
| A-2 | 122,414 | B-2 | 390,764 | C-2 | 115,496 |
| A-3 | 57,546 | B-3 | 751,497 | C-3 | 245,784 |
| A-4 | 75,144 | B-4 | 466,083 | C-4 | 140,810 |
| A-5 | 94,246 | B-5 | 483,501 | C-5 | 151,212 |
| A-6 | 57,969 | B-6 | 660,933 | C-6 | 107,832 |
| A-7 | 53,764 | B-7 | 674,324 | C-7 | 181,393 |
| A-8 | 54,907 | B-8 | 227,399 | C--8 | 146,518 |
| A-9 | 56,691 | B-9 | 738,583 | C-9 | 175,174 |
| A-10 | 54,553 | B-10 | 199,481 | C-10 | 114,756 |
| A-11 | 62,018 | B-11 | 607,939 | C-11 | 132,780 |
| A-12 | 45,427 | B-12 | 380,145 | C-12 | 146,109 |
| A-13 | 89,023 | B-13 | 217,562 | C-13 | 611,898 |
| A-14 | 50,154 | B-14 | 598,236 | C-14 | 260,341 |
| A-15 | 56,260 | B-15 | 678,816 | C-15 | 244,730 |
| Specimen Group | Logarithmic Mean | Logarithmic Standard Deviation | Maximum Deviation Ratio | Processing Result | Post-Processed Group | Proportion of Outlier Data | |
|---|---|---|---|---|---|---|---|
| A | 2 | 4.80 | 0.12 | 2.13 | Discard | A1 | 33% |
| A1 | 5 | 4.78 | 0.09 | 2.10 | Discard | A2 | |
| A2 | 13 | 4.76 | 0.07 | 2.07 | Discard | A3 | |
| A3 | 4 | 4.75 | 0.05 | 2.03 | Discard | A4 | |
| A4 | 12 | 4.74 | 0.04 | 2.00 | Discard | A5 | |
| B | 10 | 5.67 | 0.20 | 2.13 | Keep | B | 0 |
| C | 13 | 5.28 | 0.23 | 2.13 | Discard | C1 | 6.7% |
| C1 | 1 | 5.24 | 0.18 | 2.10 | Discard | C2 |
| Comparison | One-Tailed p-Value | One-Tailed Critical Value of t | Judgment | Conclusion |
|---|---|---|---|---|
| A5 and B | 1.2 × 10⁻⁶ | 0.17 | p < 0.01 | Falls into the rejection region, indicating a significant difference in variances |
| A5 and C2 | 1.32 × 10⁻⁵ | 0.19564 | p < 0.01 | Falls into the rejection region, indicating a significant difference in variances |
| B and C2 | 0.0655 | 4.341624 | p > 0.01 | Does not fall into the rejection region, indicating no significant difference in variances |
| Comparison | Test Method | Two-Tailed p-Value | Two-Tailed Critical Value of t | Judgment | Conclusion |
|---|---|---|---|---|---|
| A5 and B | Two-sample t-test with unequal variances | 1.51 × 10⁻¹¹ | 2.94 | p < 0.01 | There is a significant difference between the means. |
| A5 and C2 | Two-sample t-test with unequal variances | 1.37 × 10⁻⁸ | 3.01 | p < 0.01 | There is a significant difference between the means. |
| B and C2 | Two-sample t-test with equal variances | 1.02 × 10⁻⁷ | 2.77 | p < 0.01 | There is a significant difference between the means. |
| Statistic | Unpeened Group A5 | Low-Intensity Shot-Peened Group B | High-Intensity Shot-Peened Group C2 |
|---|---|---|---|
| 55,731 | 506,825 | 166,380 | |
| 1.31 | 3.50 | 1.80 | |
| 1.01 | 1.10 | 1.07 | |
| 1.00 | 1.00 | 1.00 | |
| 41,911 | 131,617 | 86,610 |
Disclaimer/Publisher’s Note: The statements, opinions and data contained in all publications are solely those of the individual author(s) and contributor(s) and not of MDPI and/or the editor(s). MDPI and/or the editor(s) disclaim responsibility for any injury to people or property resulting from any ideas, methods, instructions or products referred to in the content. |
© 2025 by the authors. Licensee MDPI, Basel, Switzerland. This article is an open access article distributed under the terms and conditions of the Creative Commons Attribution (CC BY) license (https://creativecommons.org/licenses/by/4.0/).
Share and Cite
Lv, Y.; Chen, X.; Fan, Y.; Tian, Y.; Zhang, F. Data Processing of 2060-T8 Alloy Fatigue Test Results Using Statistical Methods to Improve Reliability and Accuracy. Materials 2025, 18, 1711. https://doi.org/10.3390/ma18081711
Lv Y, Chen X, Fan Y, Tian Y, Zhang F. Data Processing of 2060-T8 Alloy Fatigue Test Results Using Statistical Methods to Improve Reliability and Accuracy. Materials. 2025; 18(8):1711. https://doi.org/10.3390/ma18081711
Chicago/Turabian StyleLv, Yuanbo, Xianmin Chen, Youyou Fan, Yuxiang Tian, and Feng Zhang. 2025. "Data Processing of 2060-T8 Alloy Fatigue Test Results Using Statistical Methods to Improve Reliability and Accuracy" Materials 18, no. 8: 1711. https://doi.org/10.3390/ma18081711
APA StyleLv, Y., Chen, X., Fan, Y., Tian, Y., & Zhang, F. (2025). Data Processing of 2060-T8 Alloy Fatigue Test Results Using Statistical Methods to Improve Reliability and Accuracy. Materials, 18(8), 1711. https://doi.org/10.3390/ma18081711