The Research on the Esterification Deacidification of Vacuum Gas Oil by FeZn Bimetal–Organic Frameworks Catalysts

Abstract
1. Introduction
2. Materials and Methods
2.1. Materials
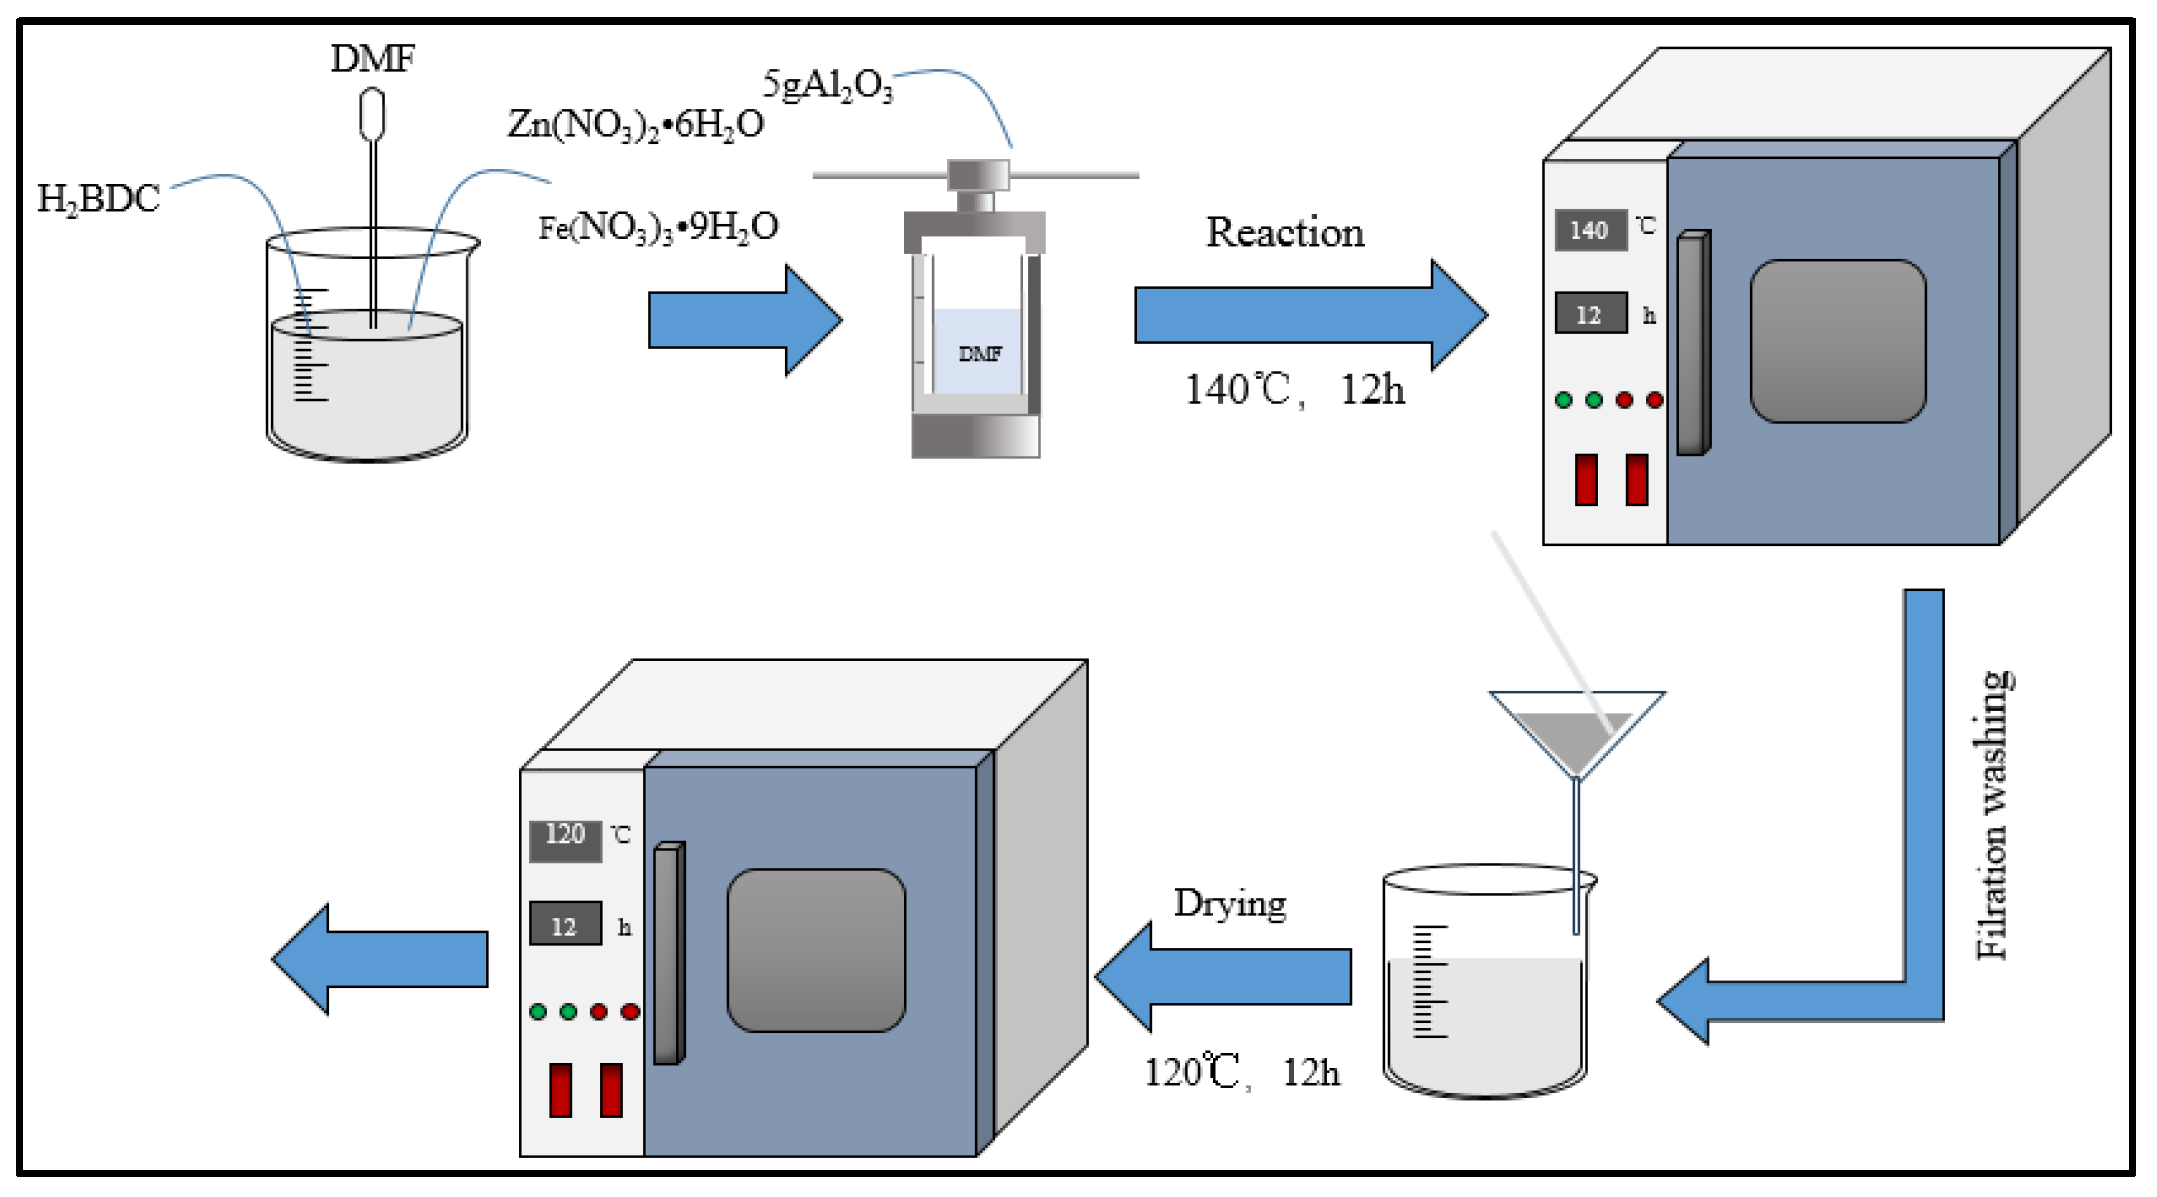
2.2. The Synthesis Methods
2.3. Charactorization
2.4. Deacidification Esterification
3. Results
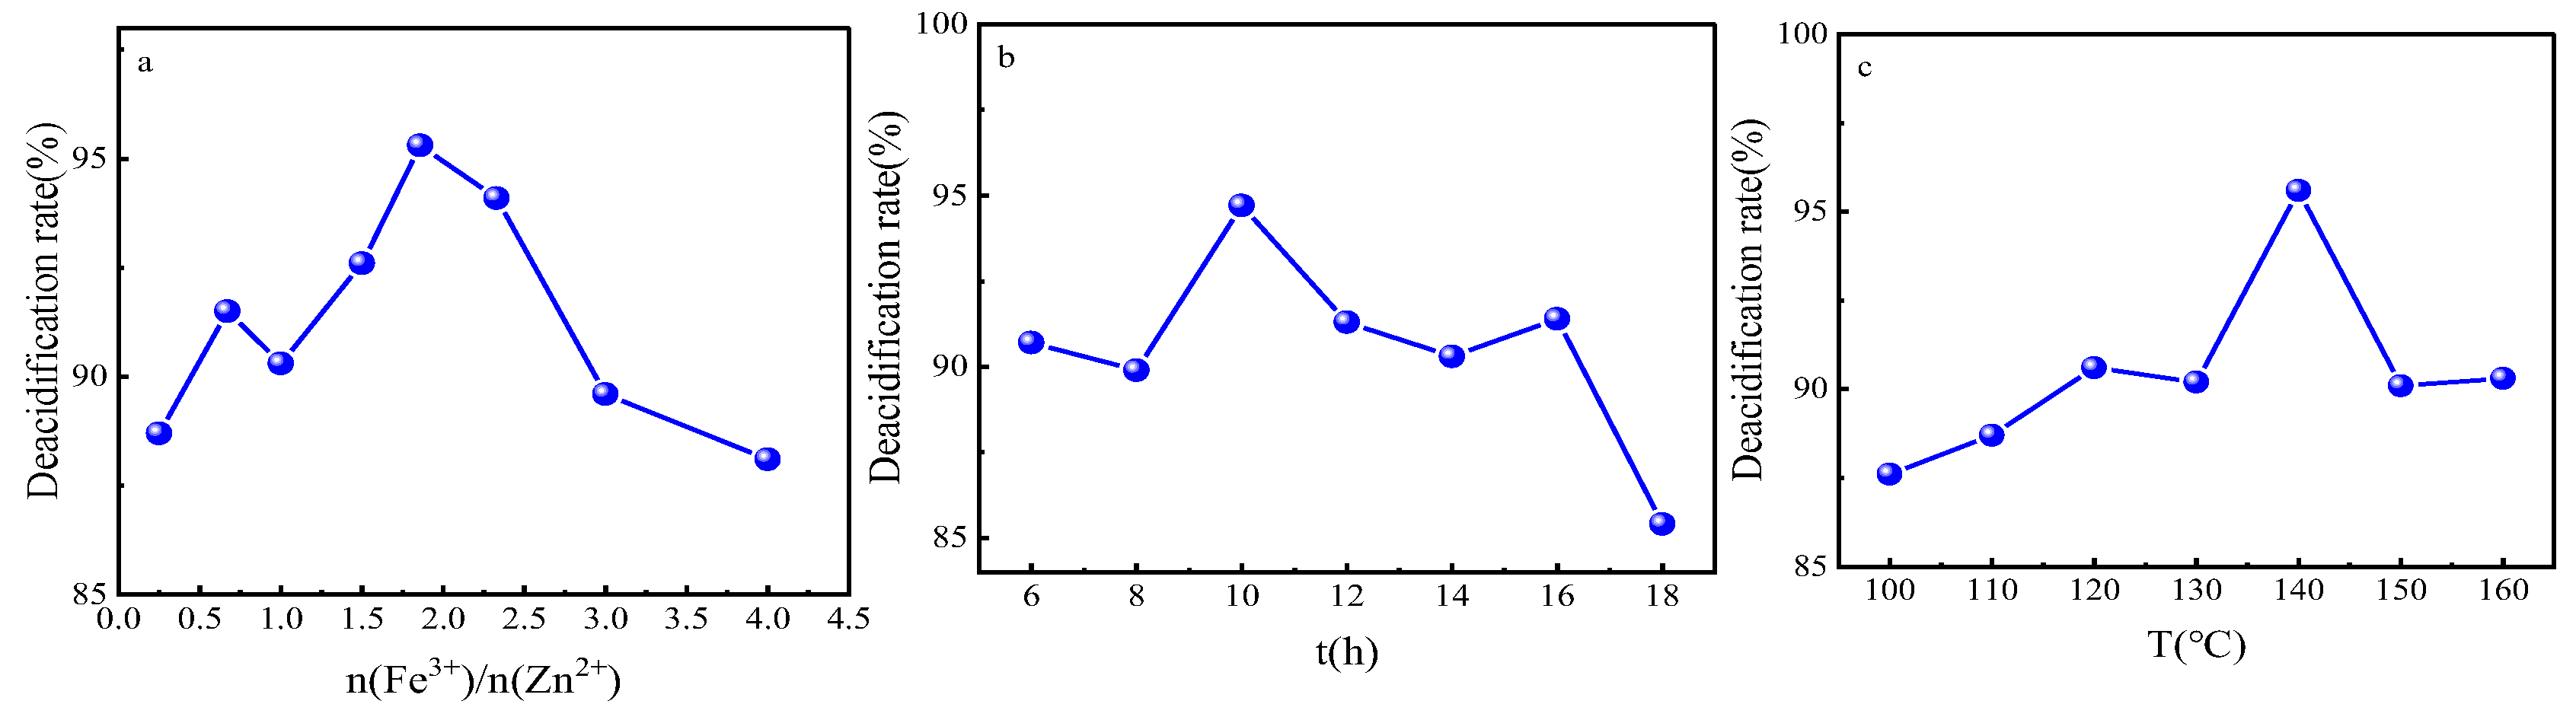
3.1. The Effect of Synthesis Parameters on the Deacidification Rate
3.2. The Features of the Catalysts
3.2.1. FT-IR Spectroscopy Analysis
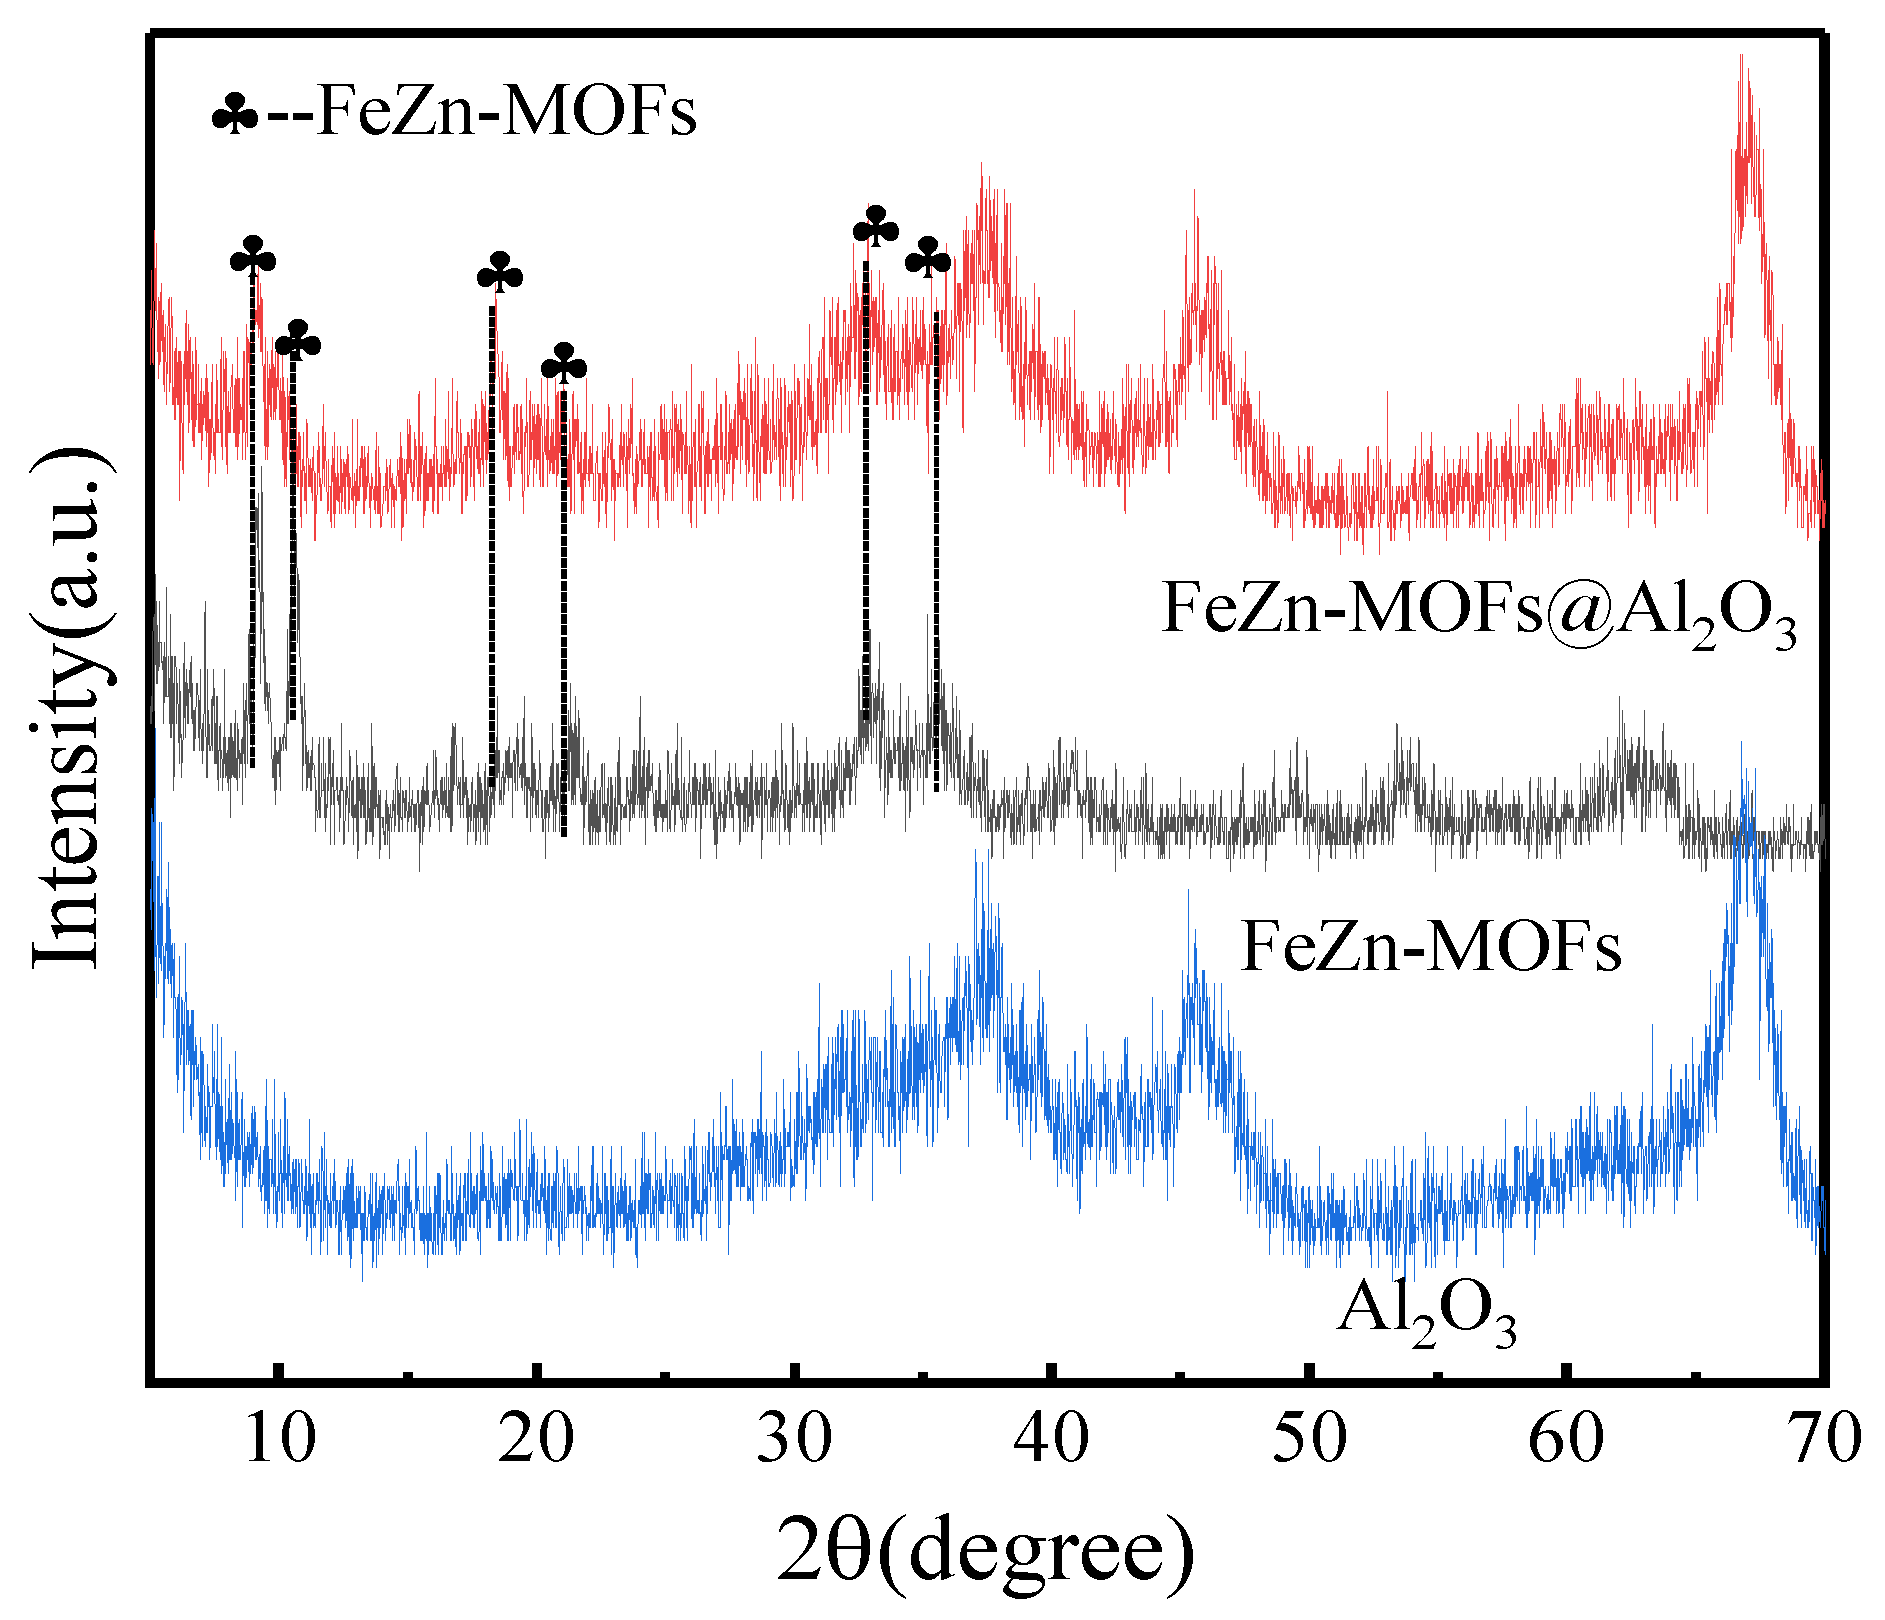
3.2.2. XRD Analysis
3.2.3. SEM Analysis
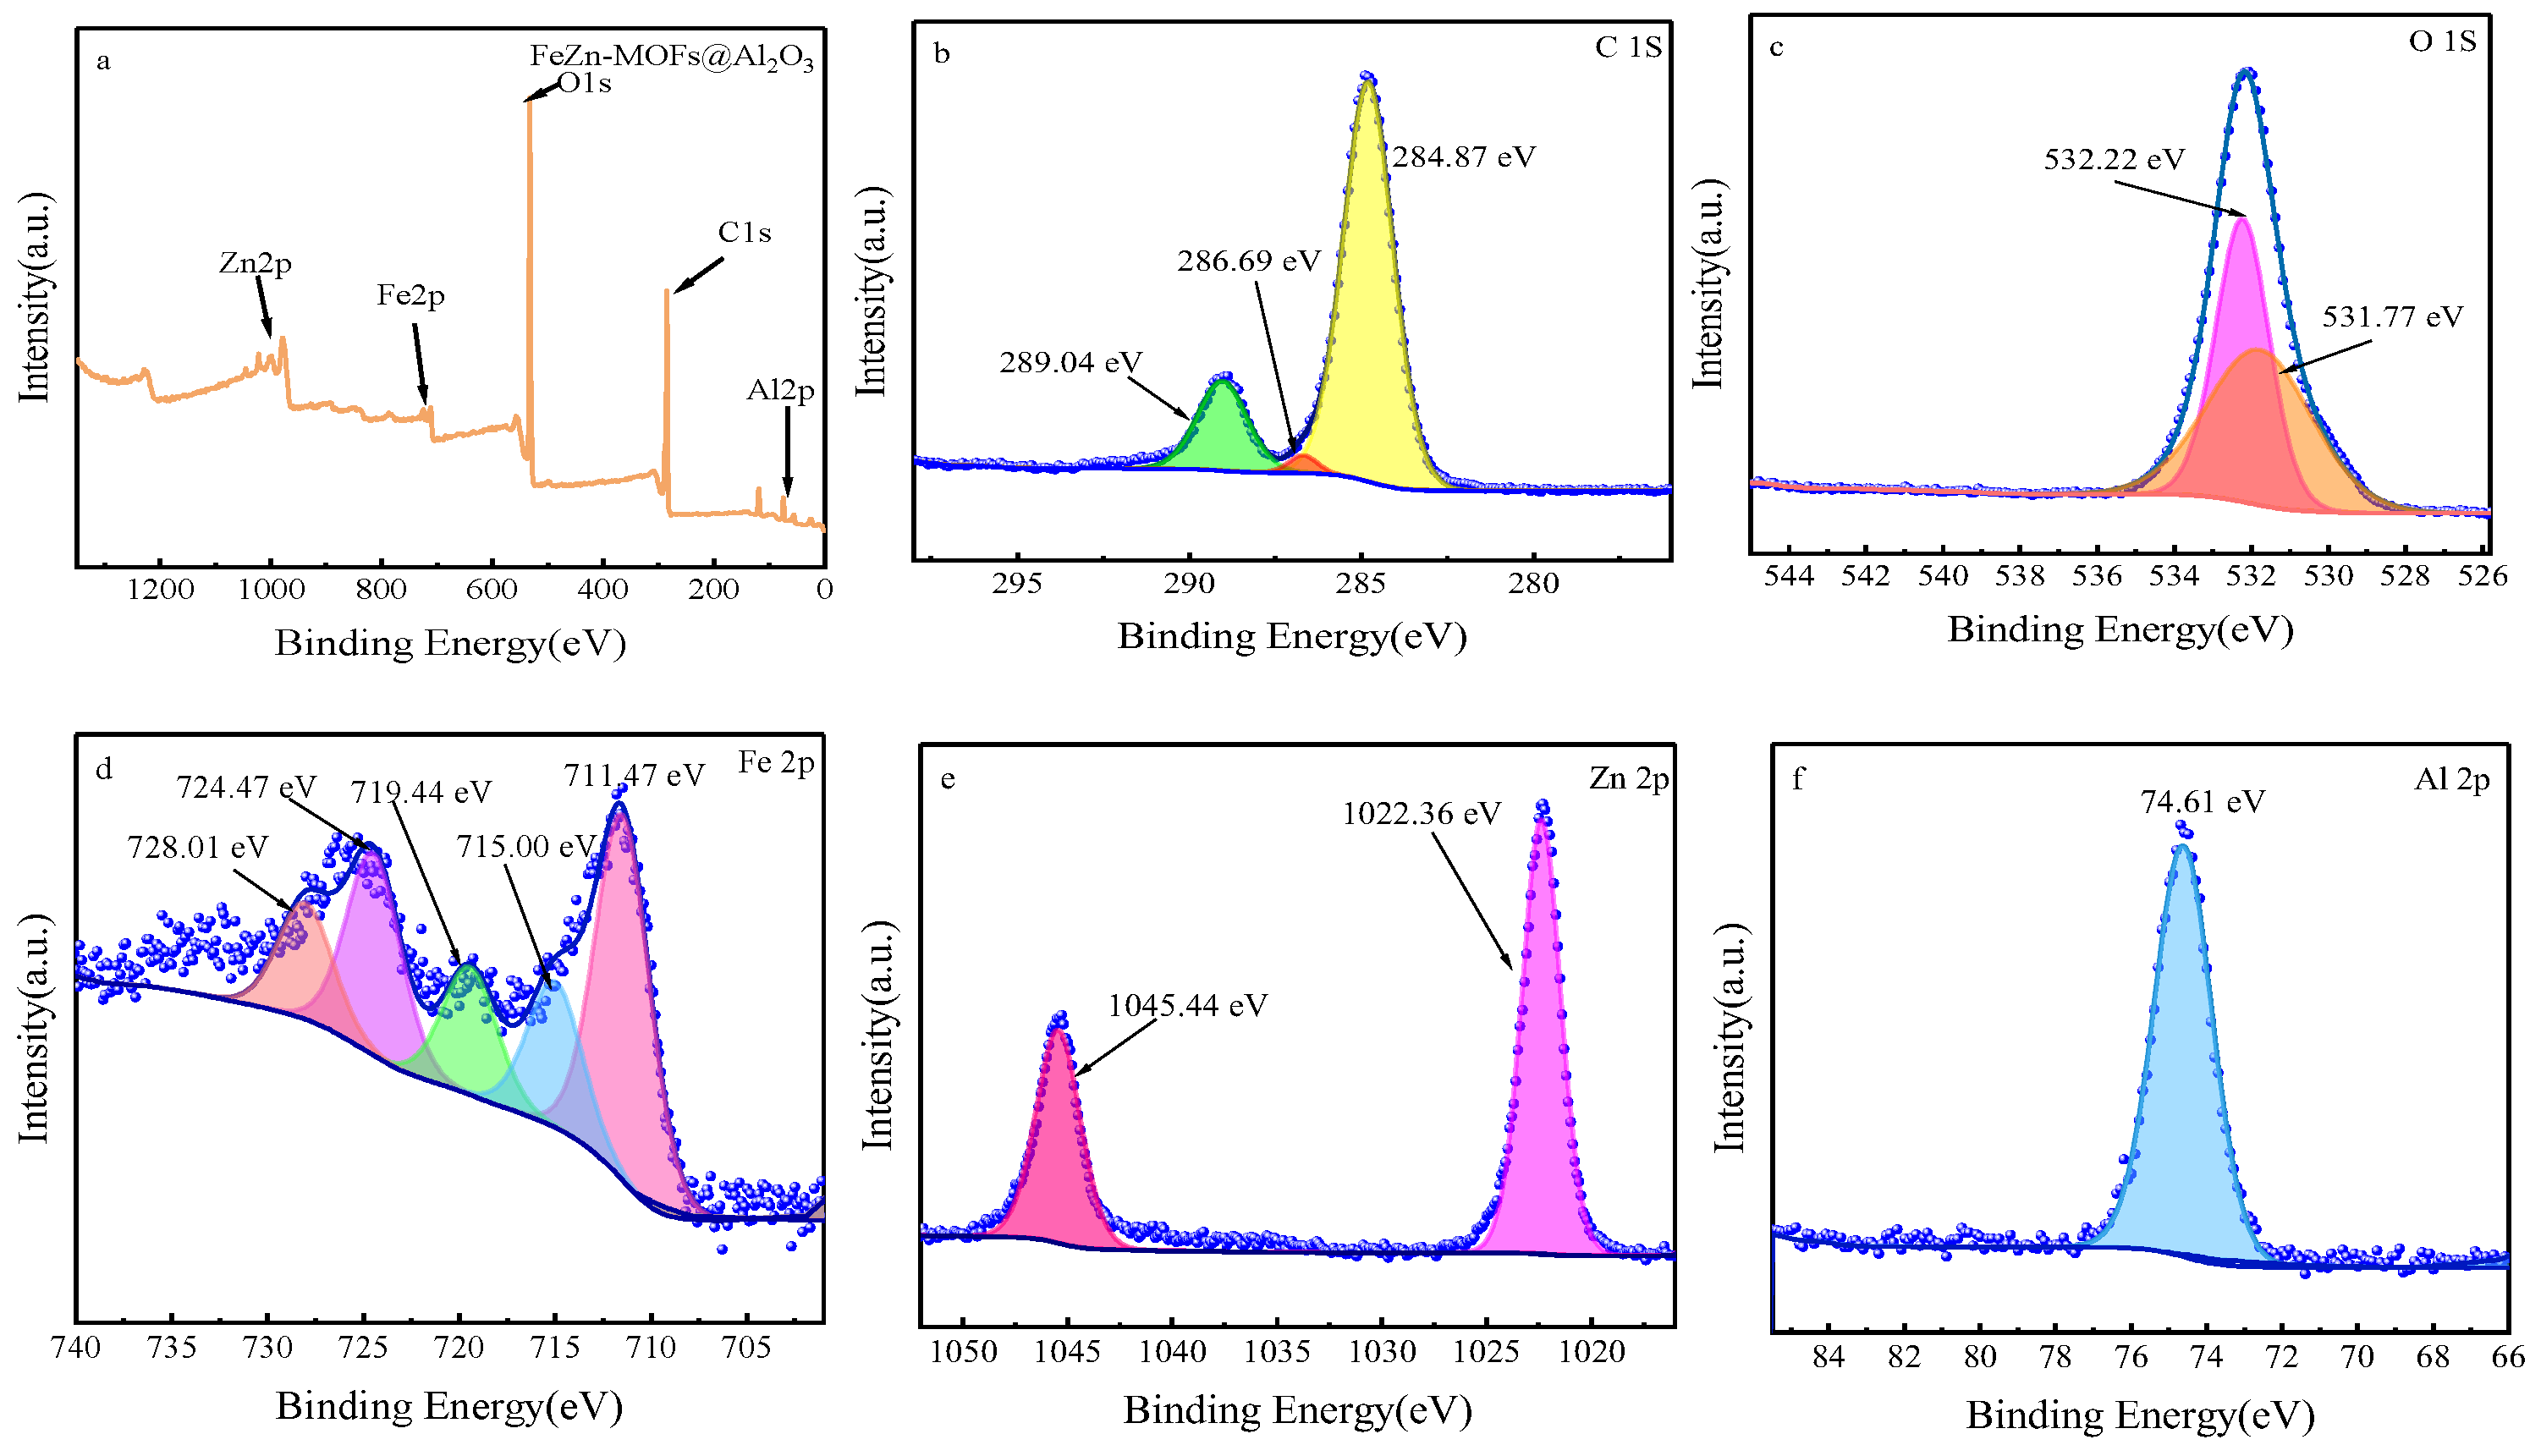
3.2.4. XPS Analysis
3.2.5. Thermal Stability Analysis
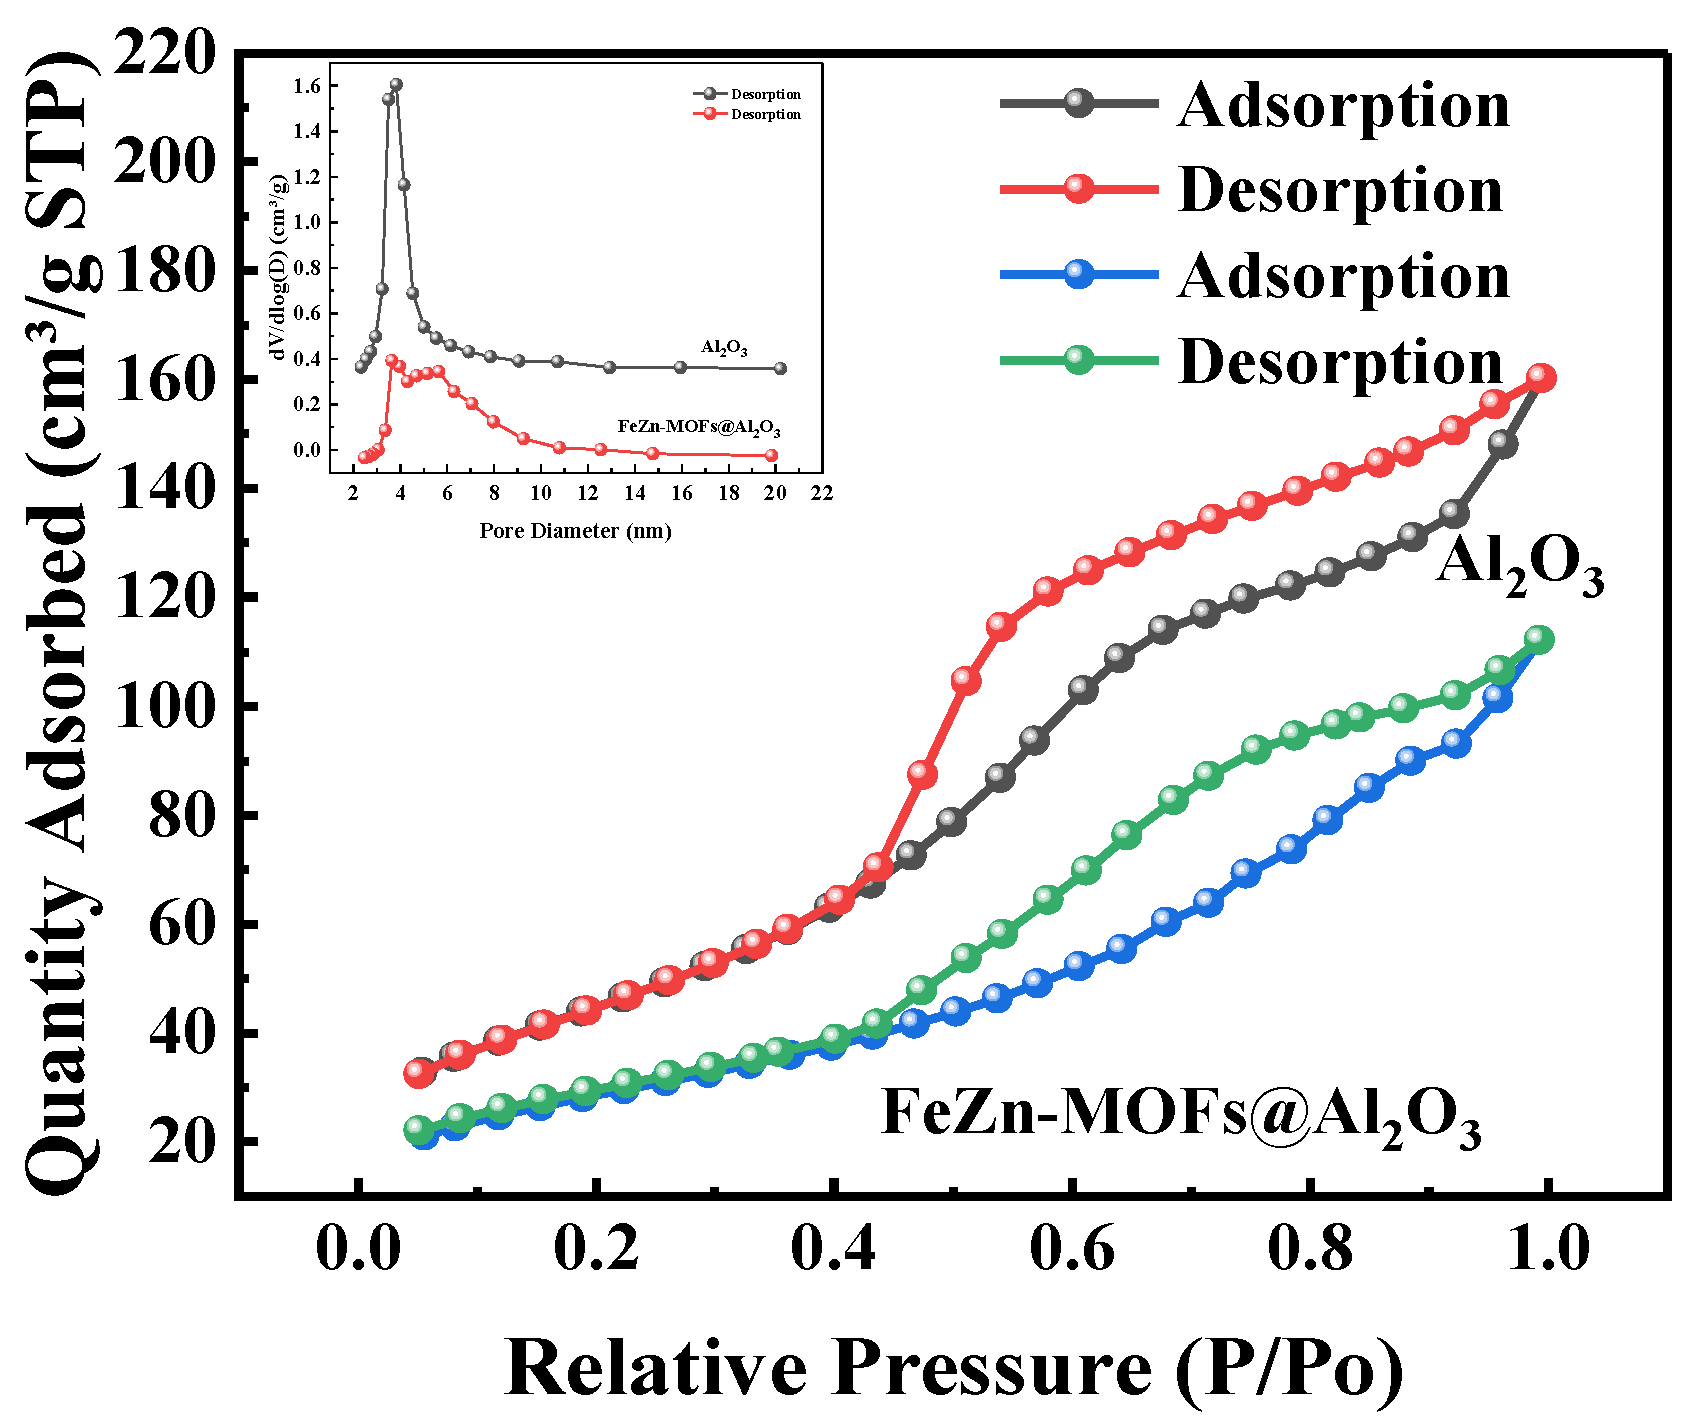
3.2.6. Brunauer–Emmett–Teller (BET) Surface Area and Pore Volume
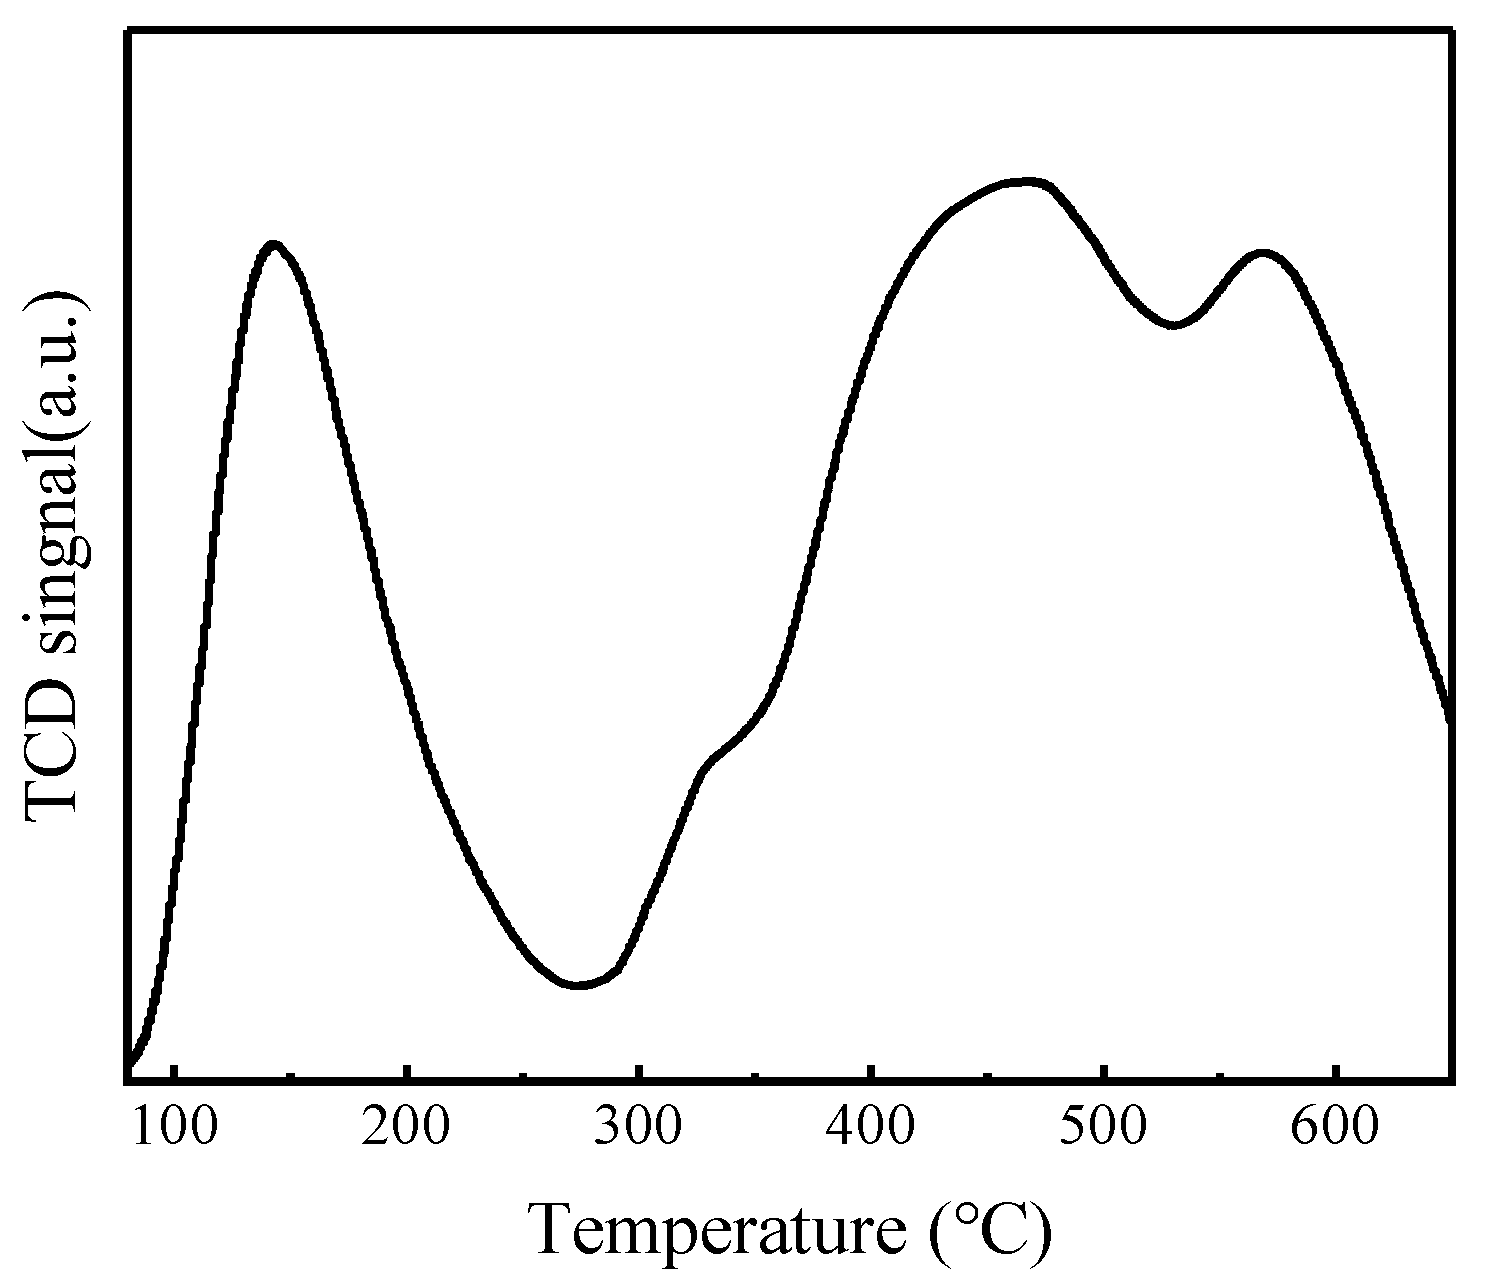
3.2.7. The Analysis of NH3-TPD Catalysts
3.3. Reaction Parameters of Esterification Deacidification
3.3.1. The Catalyst Dosage
3.3.2. The Amount of Glycol
3.3.3. The Time of Esterification
3.3.4. The Temperature of Esterification
3.4. Analysis of Refined Oil
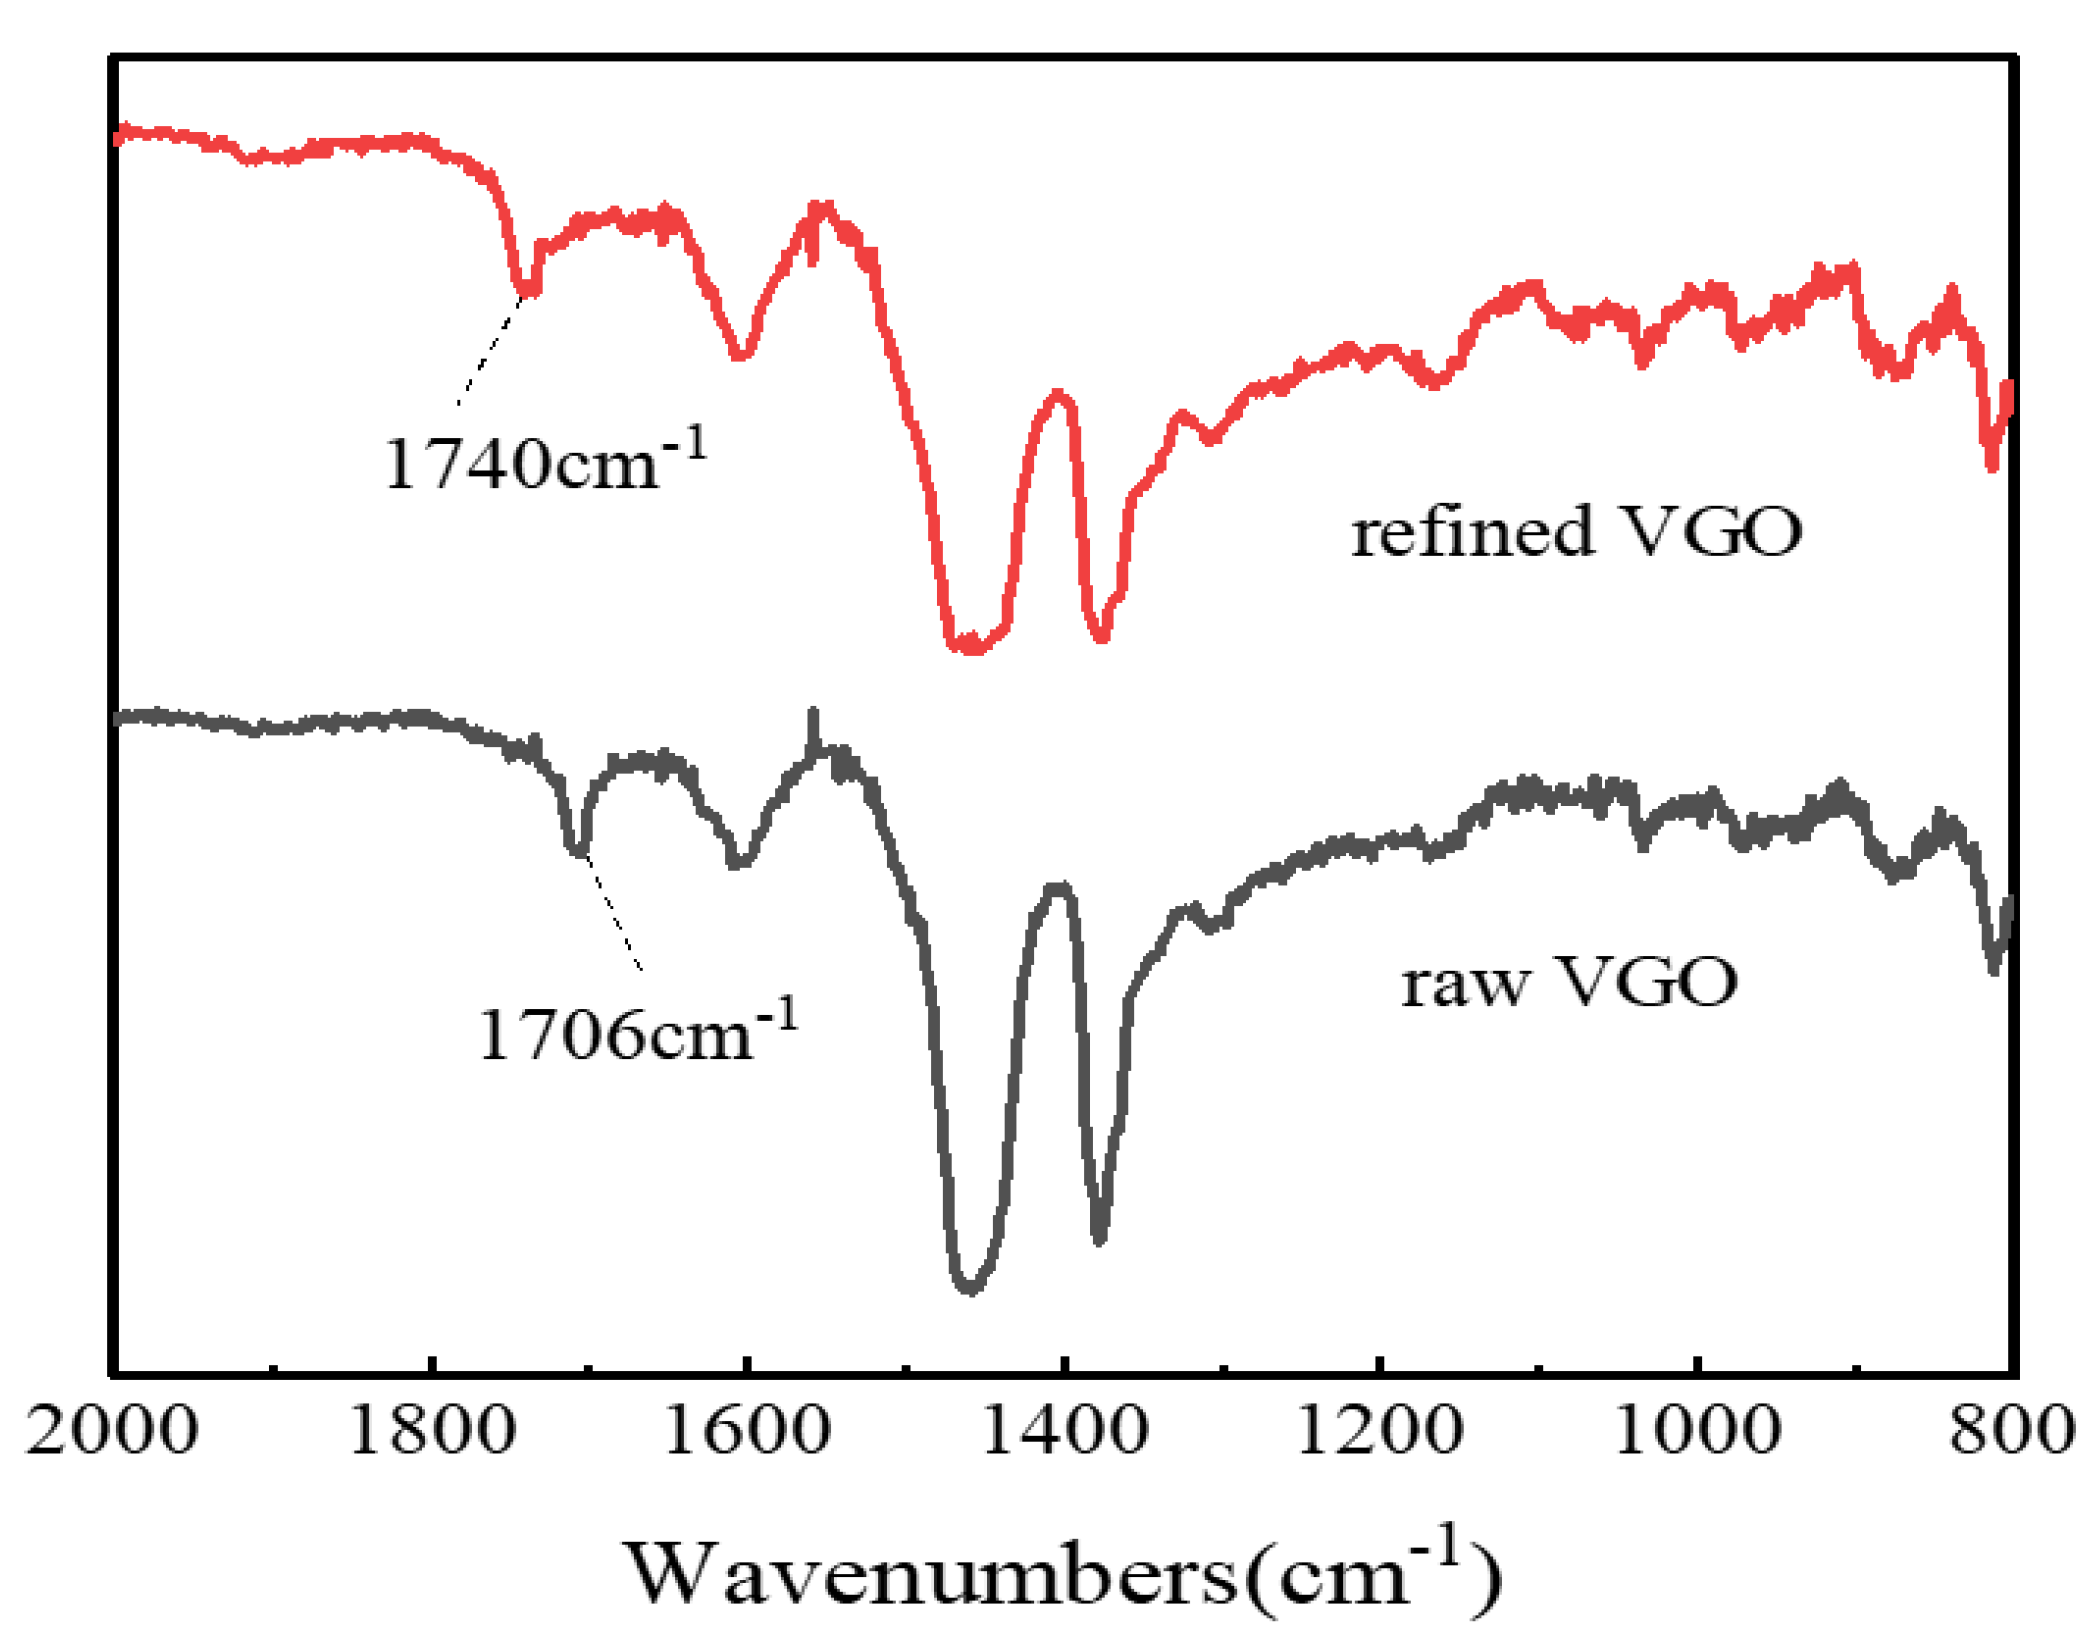
3.4.1. FT-IR Spectroscopy
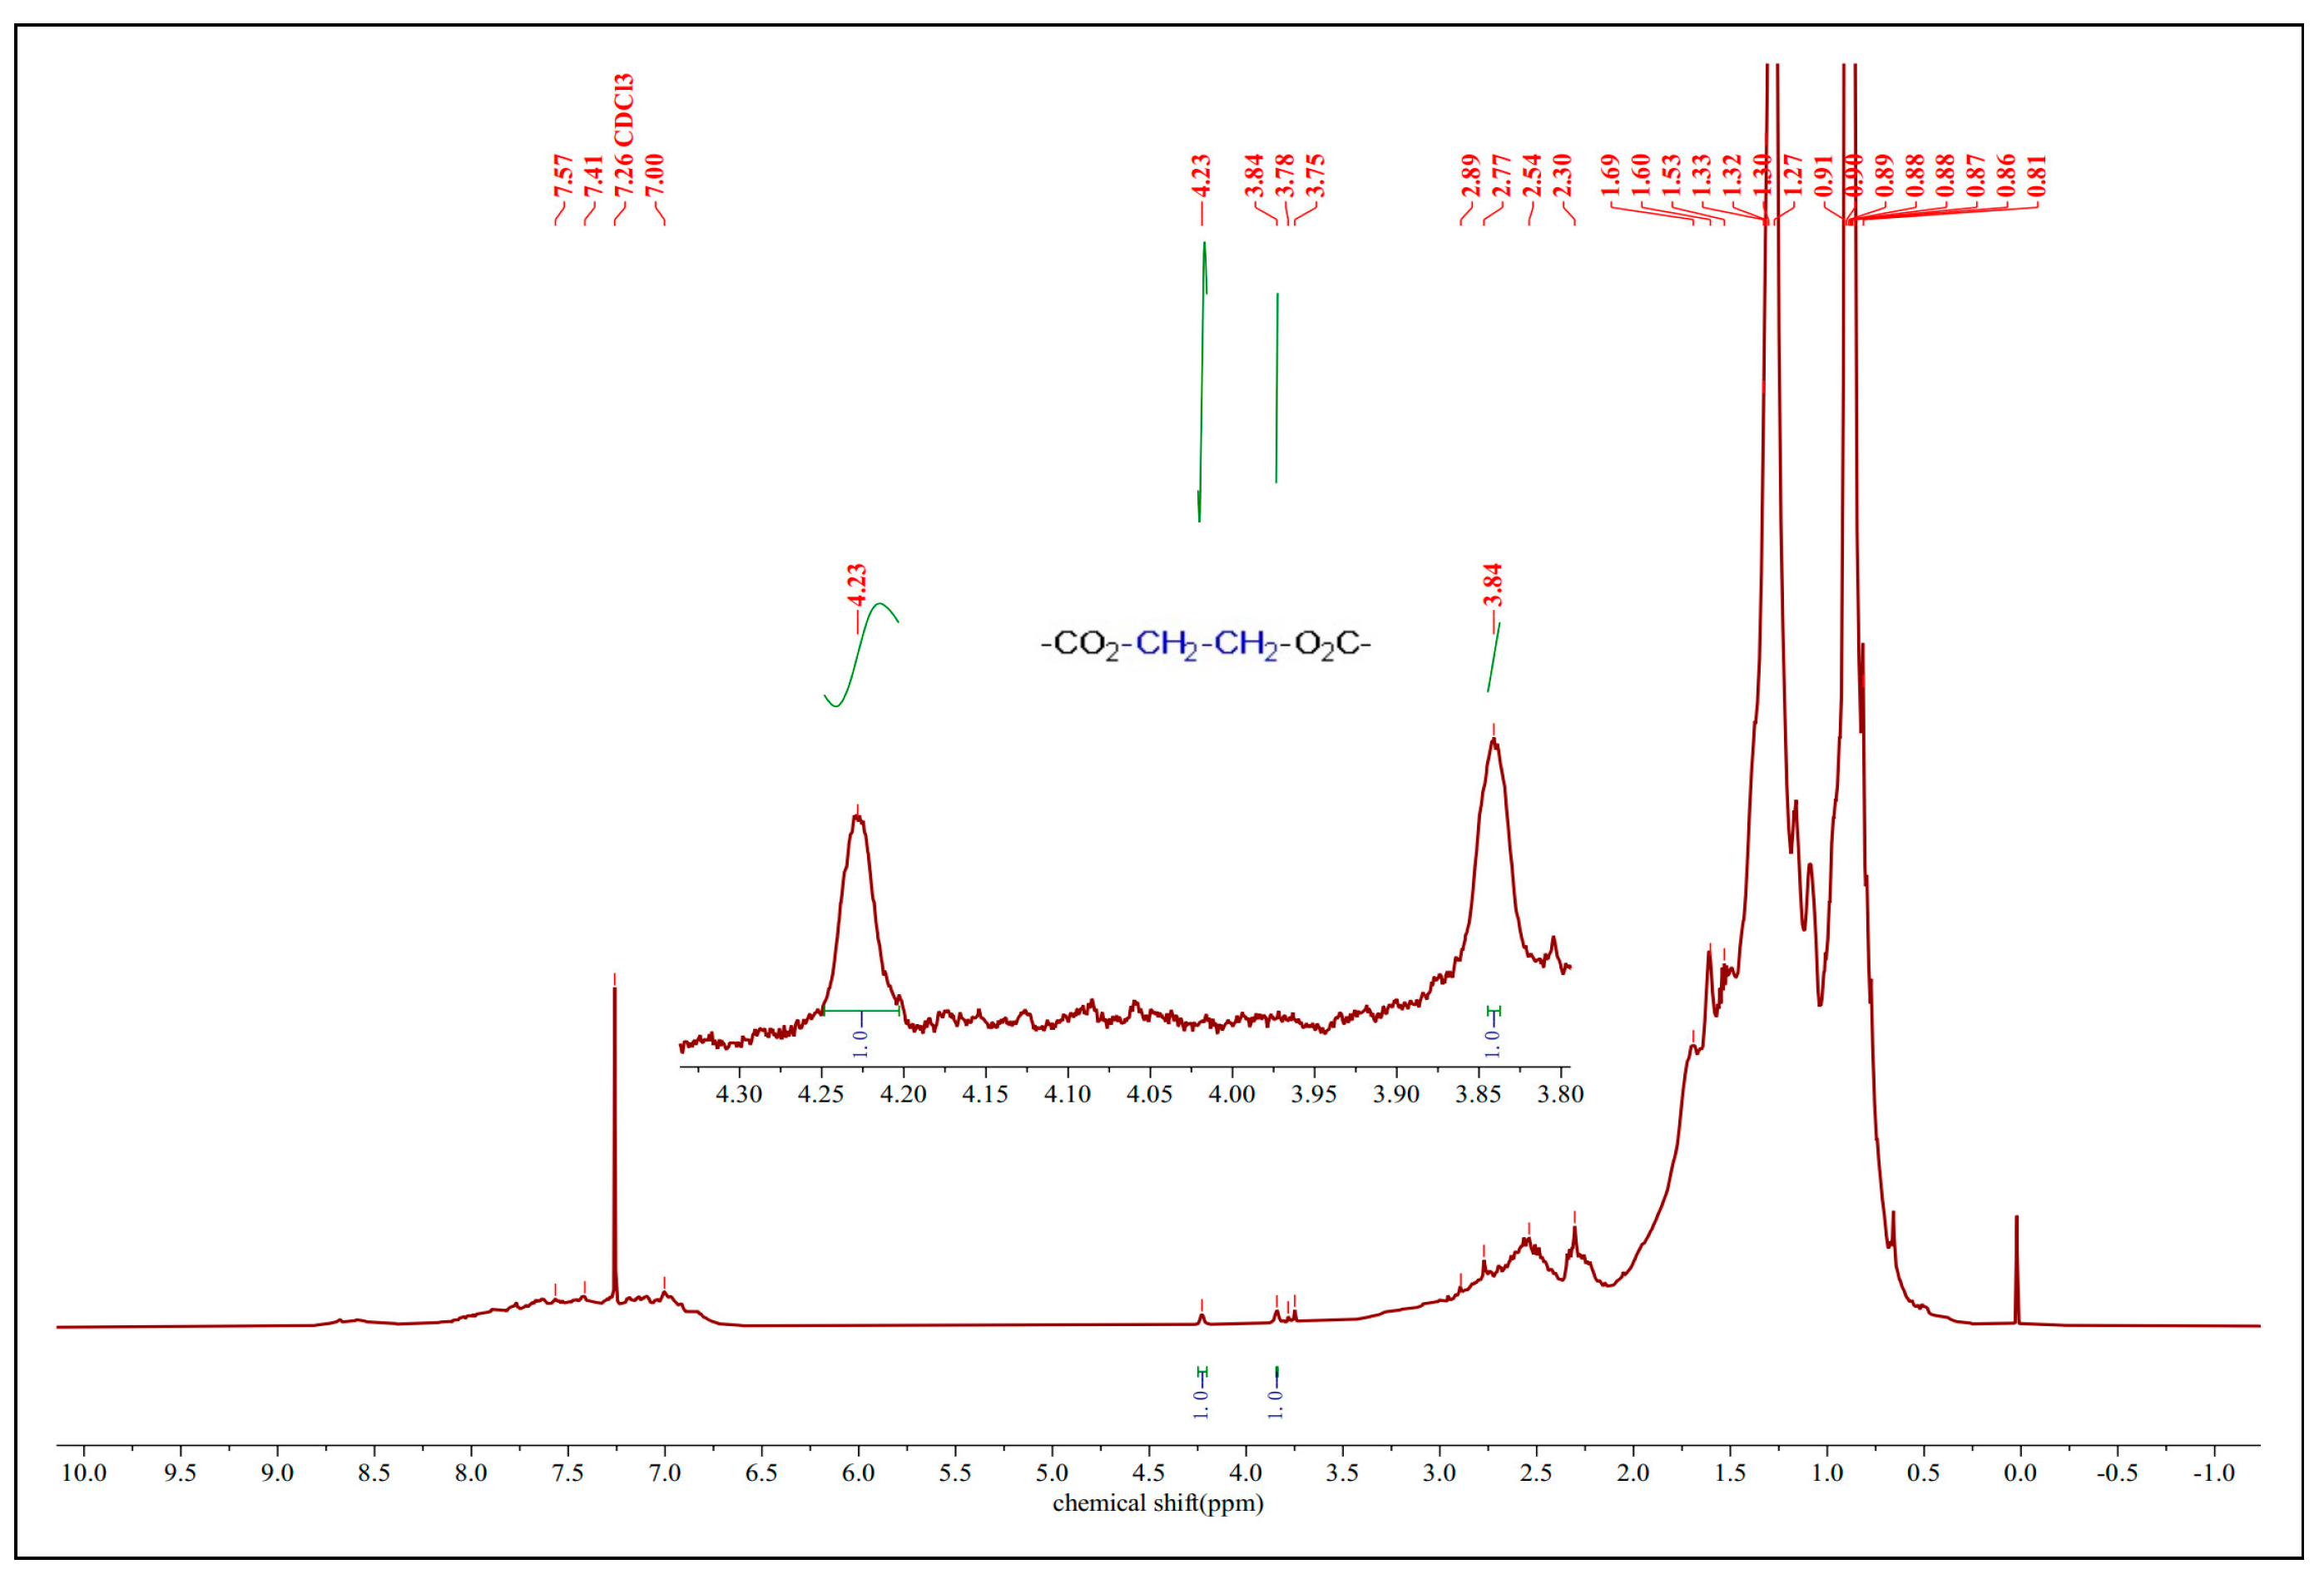
3.4.2. 1H-NMR
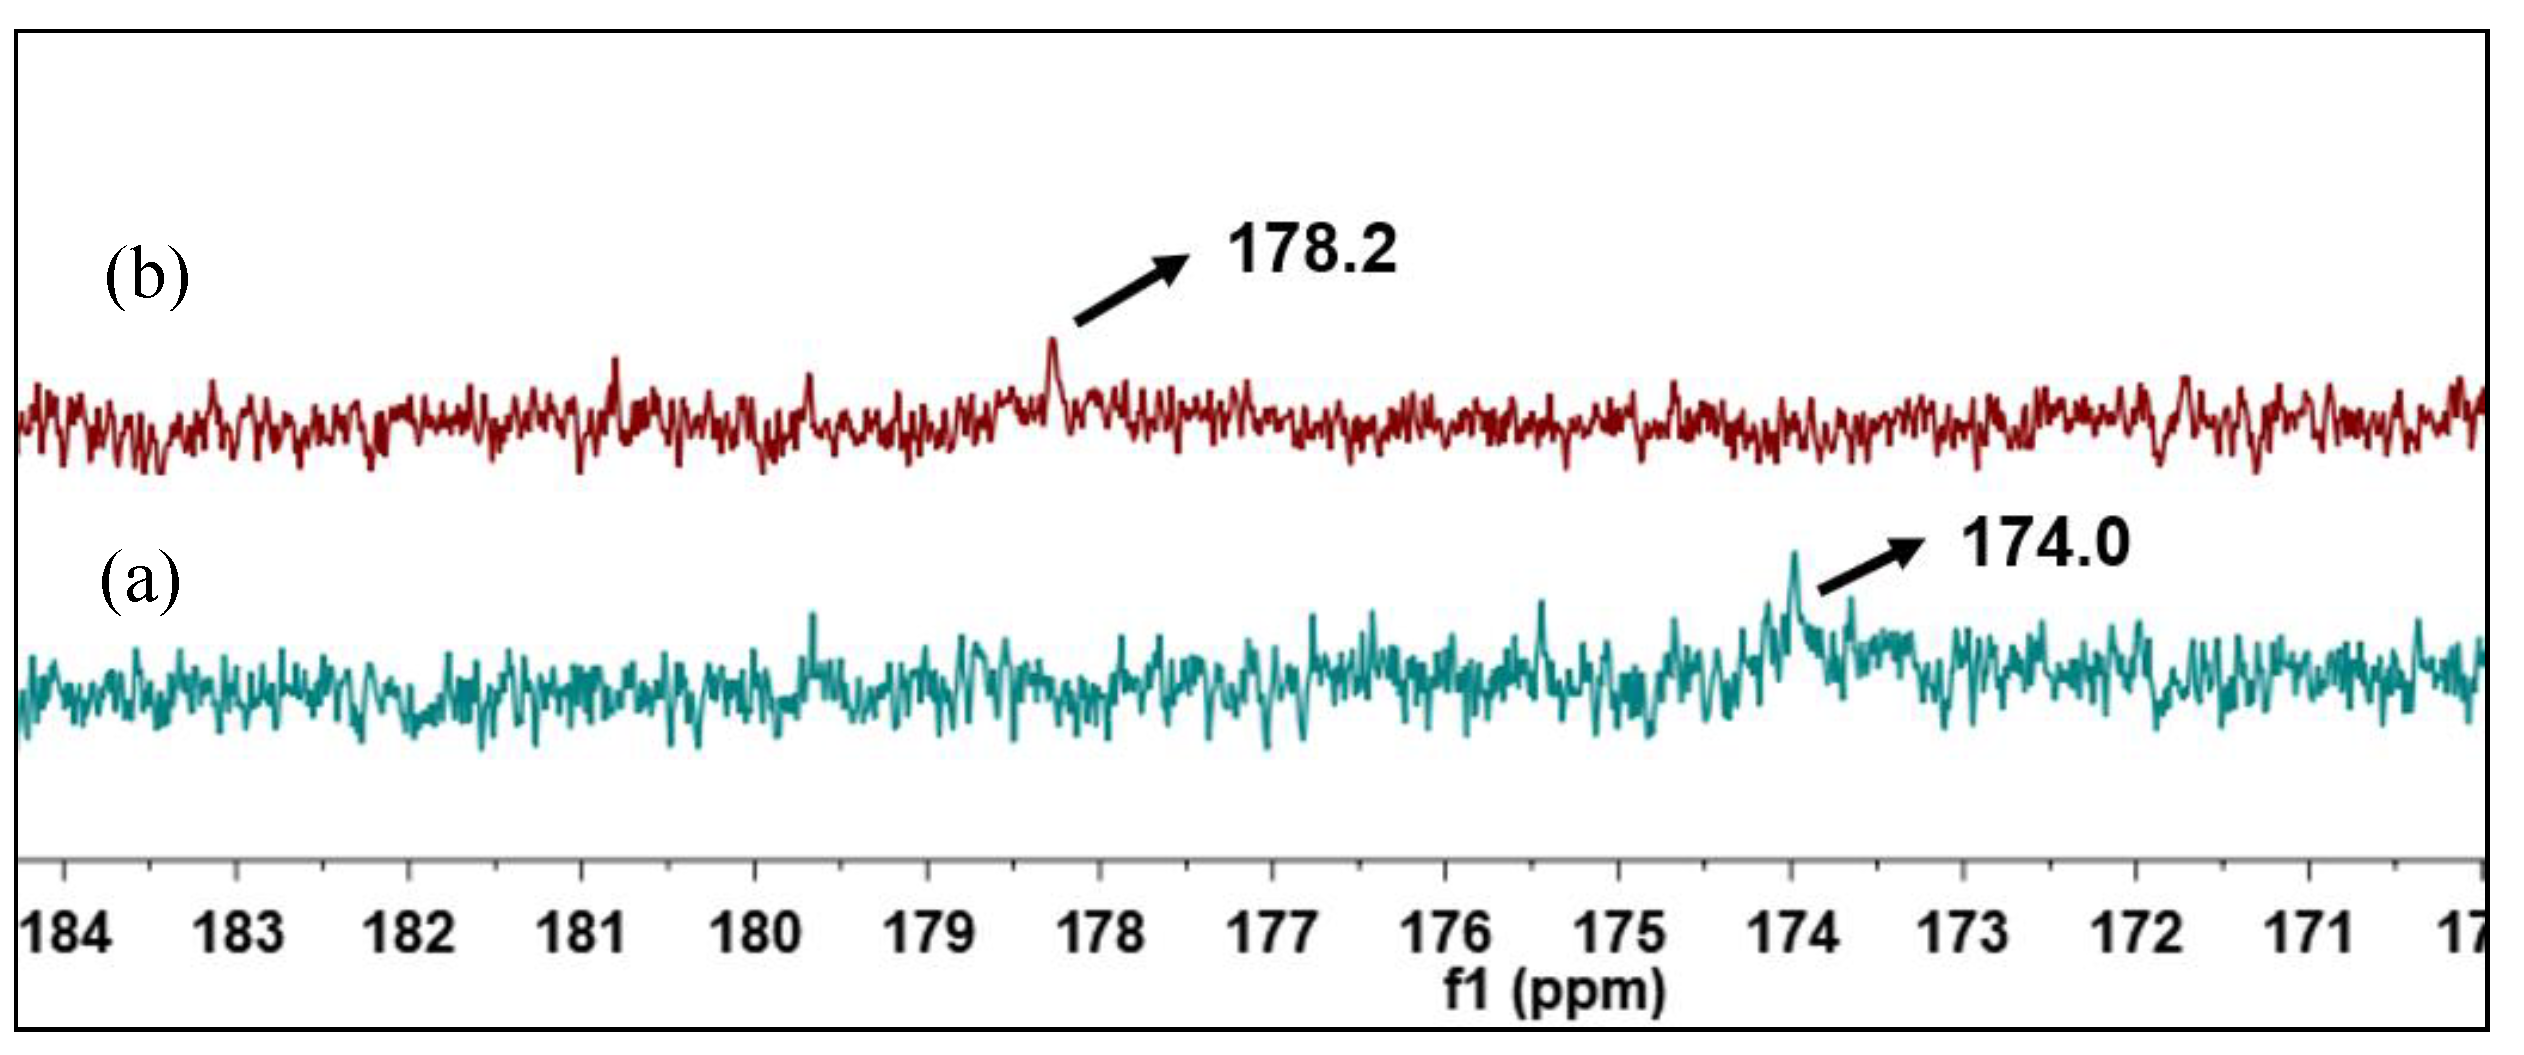
3.4.3. 13C-NMR
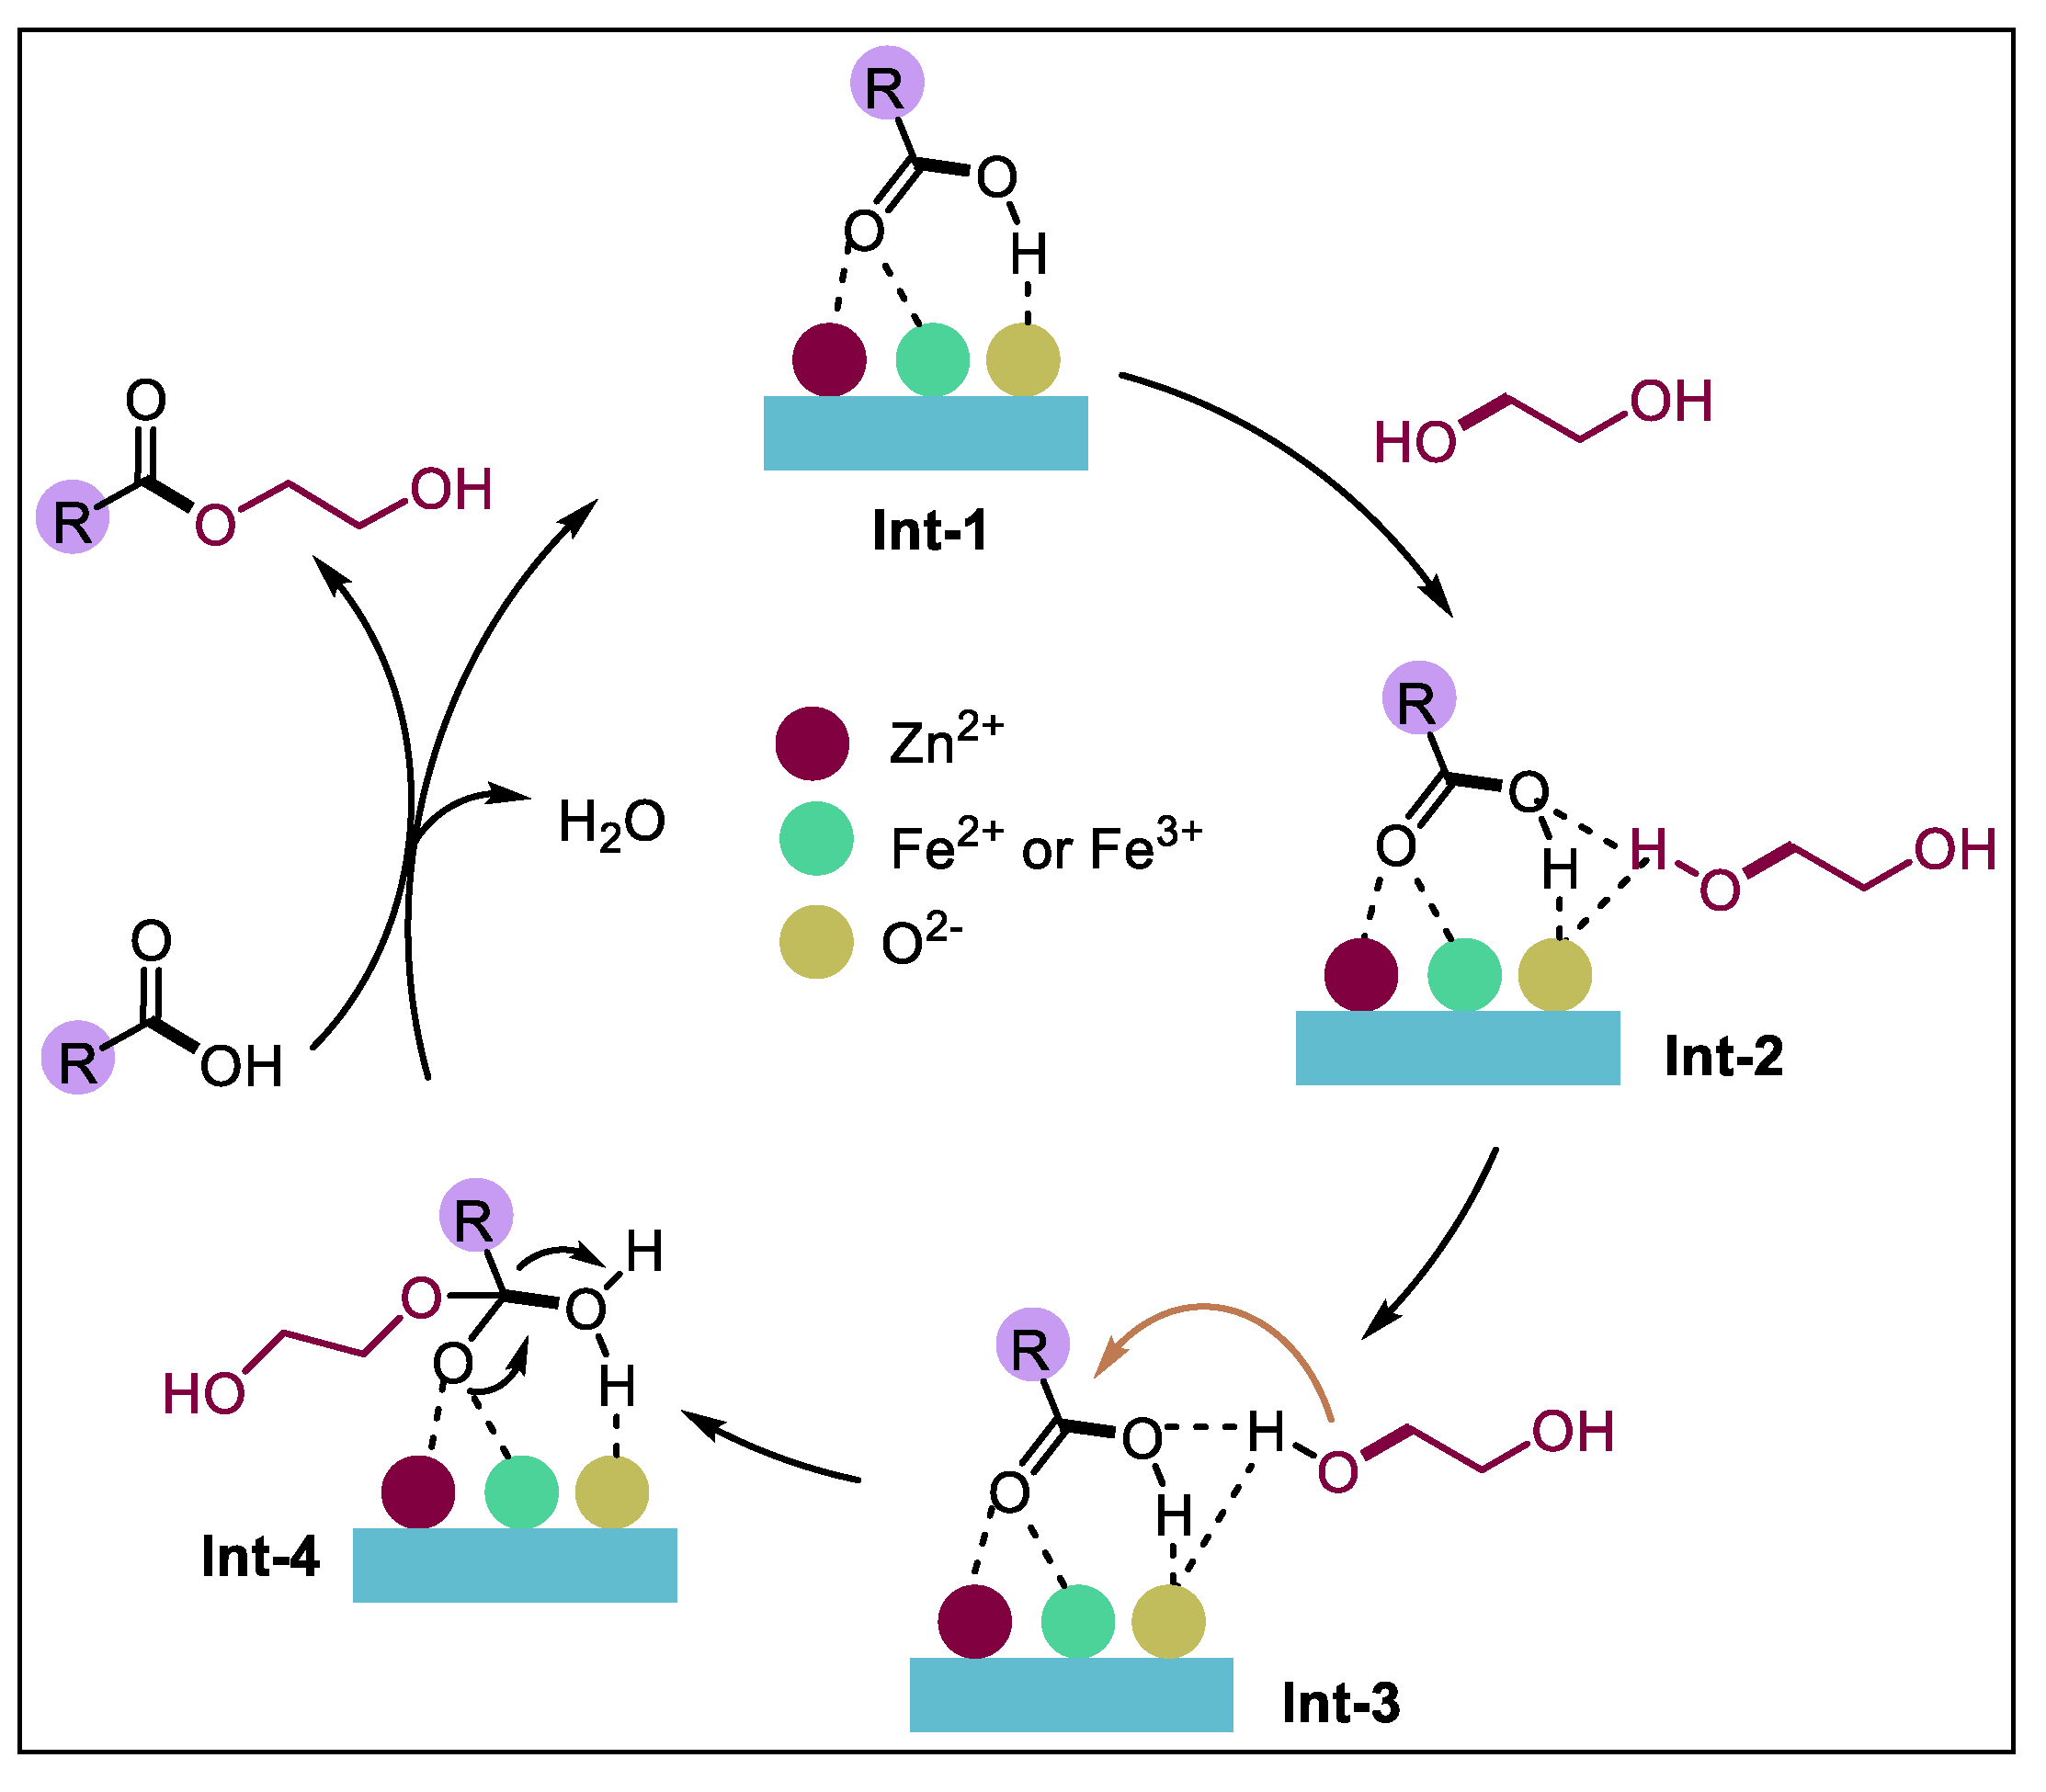
4. Reaction Mechanism
5. Conclusions
Author Contributions
Funding
Institutional Review Board Statement
Informed Consent Statement
Data Availability Statement
Conflicts of Interest
References
- Barrow, M.P.; McDonnell, L.A.; Feng, X.; Walker, J.; Derrick, P. Determination of the nature of naphthenic acids present in crude oils using nanospray Fourier transform ion cyclotron resonance mass spectrometry: The continued battle against corrosion. Anal. Chem. 2003, 75, 860–866. [Google Scholar]
- Wu, Y.; Lei, Y.; Liu, X.; Qiu, Y.; Wang, H. Synthesis, characterization, and catalytic performance of 12-phosphotungstic acid intercalated MgAl hydrotalcite for esterification of crude oil deacidification. J. Fuel Chem. Technol. 2017, 45, 1049–1055. [Google Scholar]
- Rana, B.S.; Cho, D.-W.; Cho, K.; Kim, J.-N. Total Acid Number (TAN) reduction of high acidic crude oil by catalytic esterification of naphthenic acids in fixed-bed continuous flow reactor. Fuel 2018, 231, 271–280. [Google Scholar]
- Wang, Y.-Z.; Li, J.-Y.; Sun, X.-Y.; Duan, H.-L.; Zhang, M.-M.; Liu, Y.-P. Removal of naphthenic acids from crude oils by fixed-bed catalytic esterification. Fuel 2014, 116, 723–728. [Google Scholar] [CrossRef]
- He, B.; Lian, X.; Jiang, S.; Yu, B.; Chen, C.-G.; Chen, L.; Lei, D.-L.; Gong, M.-Q. Research progress on the deacidification technologies of crude oil and various distillates. Chem. Ind. Eng. Prog. 2020, 39, 3014–3026. [Google Scholar]
- Wang, Y.Z.; Liu, Y.P.; Liu, C.G. Removal of Naphthenic Acids of a Second Vacuum Fraction by Catalytic Esterification. Pet. Sci. Technol. 2008, 26, 1424–1432. [Google Scholar]
- Li, X.; Zhu, J.; Liu, Q.; Wu, B. The removal of naphthenic acids from dewaxed VGO via esterification catalyzed by Mg–Al hydrotalcite. Fuel Process. Technol. 2013, 111, 68–77. [Google Scholar]
- Wan, X.; Ren, D.; Liu, Y.; Fu, J.; Song, Z.; Jin, F.; Huo, Z. Facile Synthesis of Dimethyl Succinate via Esterification of Succinic Anhydride over ZnO in Methanol. ACS Sustain. Chem. Eng. 2018, 6, 2969–2975. [Google Scholar]
- Zhai, D.; Nie, Y.; Yue, Y.; He, H.; Hua, W.; Gao, Z. Esterification and transesterification on FeO-doped sulfatedtin oxide catalysts. Catal. Commun. 2011, 12, 593–596. [Google Scholar]
- He, B.; Fu, X.; Lian, X.; Jiang, S.; Xu, P.; Deng, X.; He, C.; Chen, C. Catalytic deacidification of vacuum gas oil by ZnO/Al2O3 and its modification with Fe2O3. Catalysts 2019, 9, 499. [Google Scholar] [CrossRef]
- Taghizadeh, M.; Tahami, S. Recent developments in MIL-101 metal-organic framework for heterogenous catalysis. Rev. Chem. Eng. 2023, 39, 707–728. [Google Scholar]
- Moghadam, P.Z.; Li, A.; Wiggin, S.B.; Tao, A.; Maloney, A.G.P.; Wood, P.A.; Ward, S.C.; Jimenez, D.F. Development of a Cambridge structural database subset: A collection of metal-organic frameworks for past, present, and future. Chem. Mater. 2017, 29, 2618–2625. [Google Scholar]
- Li, Z.; Guo, Y.; Li, K.; Wang, S.; Bonis, E.D.; Cao, H.; Mertens, S.F.L.; Teng, C. Shape control of bimetallic MOF/Graphene composites for efficient oxygen evolution reaction. J. Electroanal. Chem. 2023, 930, 117144. [Google Scholar] [CrossRef]
- Marti, R.M.; Howe, J.D.; Morelock, C.R.; Conradi, M.S.; Walton, K.S.; Sholl, D.S.; Hayes, S.E. CO2 Dynamics in Pure and Mixed-Metal MOFs with Open Metal Sites. J. Phys. Chem. C 2017, 121, 25778–25787. [Google Scholar]
- Ding, M.; Cai, X.; Jiang, H.-L. Improving MOF stability: Approaches and applications. Chem. Sci. 2019, 10, 10209–10230. [Google Scholar] [CrossRef]
- Spieß, A.; Wiebe, J.; Iwaschko, E.; Woschko, D.; Janiak, C. Wood modification for the synthesis of MOF@wood composite materials with increased metal-organic framework (MOF) loading. Mol. Syst. Des. Eng. 2022, 7, 1682–1696. [Google Scholar] [CrossRef]
- Jin, M.; Qian, X.; Gao, J.; Chen, J.; Hensley, D.K.; Ho, H.C.; Percoco, R.J.; Ritzi, C.M.; Yue, Y. Solvent-Free Synthesis of CuO/HKUST-1 Composite and Its Photocatalytic Application. Inorg. Chem. 2019, 58, 8332–8338. [Google Scholar]
- Silva, C.T.P.D.; Veregue, F.R.; Moisés, M.P.; Guilherme, M.R.; Rinaldi, A.W. Synthesis of Al2O3-nanowhisker-based HKUST1 MOF composites. Mater. Chem. Phys. 2019, 232, 446–451. [Google Scholar]
- Samain, L.; Jaworski, A.; Edén, M.; Ladd, D.M.; Seo, D.K.; Garcia-Garicia, F.J.; Häussermann, U. Structural analysis of highly porous γ-Al2O3. J. Solid State Chem. 2014, 217, 1–8. [Google Scholar] [CrossRef]
- Grad, O.; Dan, M.; Barbu-Tudoran, L.; Tosa, N.; Lazar, M.D.; Blanita, G. MOF/Al2O3 composites obtained by immobilization of MIL-53(Cr) or MIL-101(Cr) on γ-alumina: Preparation and characterization. Microporous Mesoporous Mater. 2023, 353, 112518. [Google Scholar] [CrossRef]
- Wang, Y.; Zhang, L.; Li, R.; He, H.; Wang, H.; Huang, L. MOFs-based coating derived Me-ZIF-67@CuOx materials as low-temperature NO-CO catalysts. Chem. Eng. J. 2020, 381, 122757. [Google Scholar]
- Chang, S.; Xin, X.; Huang, Y.; Zhang, X.; Fu, Y.; Zhu, W.; Zhang, F.; Li, X. Pyroelectrically-induced Catalytic Performance of Zr-based MOF Under Cold-hot Alternation. Chem. J. Chin. Univ. 2021, 42, 2558–2563. [Google Scholar]
- Zhang, Q.-N.; Zhang, Y.; Cai, C.; Guo, Y.-C.; Reid, J.P.; Zhang, Y.-H. In situ observation on the dynamic process of evaporation and crystallization of sodium nitrate droplets on a ZnSe substrate by FTIR-ATR. J. Phys. Chem. A 2014, 118, 2728–2737. [Google Scholar] [PubMed]
- Jamal Sisi, A.; Khataee, A.; Fathinia, M.; Vahid, B.; Orooji, Y. Comparative study of sonocatalytic process using MOF-5 and peroxydisulfate by central composite design and artificial neural network. J. Mol. Liq. 2020, 316, 113801. [Google Scholar]
- Meng, Y.; Huang, Y.; Huang, G.; Song, Y. TPN-COF@Fe-MIL-100 composite used as an electrochemical aptasensor for detection of trace tetracycline residues. RSC Adv. 2023, 13, 28148–28157. [Google Scholar] [CrossRef]
- Rubio-Martinez, M.; Batten, M.P.; Polyzos, A.; Carey, K.-C.; Mardel, J.I.; Lim, K.-S.; Hill, M.R. Versatile, high quality and scalable continuous flow production of metal-organic frameworks. Sci. Rep. 2014, 4, 5443. [Google Scholar]
- Taddei, M.; Steitz, D.A.; Van Bokhoven, J.A.; Ranocchiari, M. Continuous-flow microwave synthesis of metal-organic frameworks: A highly efficient method for large-scale production. Chem. A Eur. J. 2016, 22, 3245–3249. [Google Scholar]
- Soto-Robles, C.A.; Luque, P.A.; Gómez-Gutiérrez, C.M.; Nava, O.; Vilchis-Nestor, A.R.; Lugo-Medina, E.; Ranjithkumar, R.; Castro-Beltrán, A. Study on the effect of the concentration of Hibiscus sabdariffa extract on the green synthesis of ZnO nanoparticles. Results Phys. 2019, 15, 102807. [Google Scholar]
- Mikhailova, S.S.; Mykhaylyk, O.M.; Dorfman, A.M.; Povstugar, V.I. XPS study of finely dispersed iron powders modified by radiation-grafted acrylamide. Surf. Interface Anal. 2000, 29, 519–523. [Google Scholar]
- Woodbridge, C.M.; Pugmire, D.L.; Johnson, R.C.; Boag, N.M.; Langell, M.A. HREELS and XPS Studies of Ferrocene on Ag(100). J. Phys. Chem. B 2000, 104, 3085–3093. [Google Scholar]
- Ali, K.; Ali, J.; Mehdi, S.M.; Choi, K.-H.; An, Y.J. Rapid fabrication of Al2O3 encapsulations for organic electronic devices. Appl. Surf. Sci. A J. Devoted Prop. Interfaces Relat. Synth. Behav. Mater. 2015, 353, 1186–1194. [Google Scholar] [CrossRef]
- Ababaikeri, R.; Sun, Y.; Wang, X.; Li, X.; Li, M.; Zhang, F.; Li, Y.; Wang, P.; Guo, J.; Cao, Y. Scalable fabrication of Bi@N-doped carbon as anodes for sodium/potassium-ion batteries with enhanced electrochemical performances. J. Alloys Compd. 2023, 935, 168207. [Google Scholar]
- Chen, Q.; Wang, H.; Perero, S.; Wang, Q.; Chen, Q. Structural, optical and magnetic properties of Fe3O4 sputtered TeO2–PbO–B2O3 and PbO–Bi2O3–B2O3 glasses for sensing applications. J. Non-Cryst. Solids 2015, 408, 43–50. [Google Scholar] [CrossRef]
- Al-Gaashani, R.; Radiman, S.; Daud, A.R.; Tabet, N.; Al-Douri, Y. XPS and optical studies of different morphologies of ZnO nanostructures prepared by microwave methods. Ceram. Int. 2013, 39, 2283–2292. [Google Scholar]
- He, B.; Liu, S.-C.; Chen, C.-G.; Cui, Y.-X.; Miu, J.; You, X.L. Deacidification of 4th Vacuum Gas Oil by Catalytic Esterification. Fine Chem. 2018, 35, 1408–1413. [Google Scholar]
- Barbosa Sandro, L.; Dabdoub Miguel, J.; Hurtado Gabriela, R.; Klein Stanlei, I.; Baroni Adriano, C.M.; Christielle, C. Solvent free esterification reactions using Lewis acids in solid phase catalysis. Appl. Catal. A Gen. 2006, 313, 146–150. [Google Scholar]
- Li, G.; Li, X.; Wumanjiang, E. Solvent-free esterification catalyzed by surfactant-combined catalysts at room temperature. New J. Chem. 2007, 31, 348–351. [Google Scholar]
- Védrine, J.C. Acid–base characterization of heterogeneous catalysts: An up-to-date overview. Res. Chem. Intermed. 2015, 41, 9387–9423. [Google Scholar]
- Wolzak, L.A.; Hermans, J.J.; Vries, F.; Berg, K.J.; Reek, J.N.H.; Tromp, M.; Korstanje, T.J. Mechanistic elucidation of monoalkyltin(iv)-catalyzed esterification. Catal. Sci. Technol. 2021, 11, 3326–3332. [Google Scholar]
- Villoria-del-Álamo, B.; Rojas-Buzo, S.; García-García, P.; Corma, A. Zr-MOF-808 as Catalyst for Amide Esterification. Chem. Eur. J. 2021, 27, 4588–4598. [Google Scholar]
- Hao, W.; Xinyue, L.; Yan, W.; Hou, C.; Qiu, Y.; Guo, K. Microwave-assisted synthesis of ethylene glycol-intercalated NiAl LDHs and their application for intracrystalline catalytic esterification with naphthenic acids in crude oil. Energy Fuels 2017, 31, 9898–9904. [Google Scholar]
- Wu, Y.; Liu, X.; Lei, Y.; Qiu, Y.; Wang, M.; Wang, H. Synthesis and characterization of 12-tungstophosphoric acid intercalated layered double hydroxides and their application as esterification catalysts for deacidification of crude oil. Appl. Clay Sci. 2017, 150, 34–41. [Google Scholar]


| Sample | BET Surface (m2/g) | Micropore Volume (cm3/g) |
|---|---|---|
| Al2O3 | 170.35 | 0.24 |
| FeZn-MOFs@Al2O3 | 99.46 | 0.16 |
| Acid Sites (mmol g−1) | Weak Acid | Medium-Strong Acid | Strong Acid | Total Acid Content |
|---|---|---|---|---|
| FeZn-MOFs@Al2O3 | 0.11 | 0.03 | 0.26 | 0.40 |
Disclaimer/Publisher’s Note: The statements, opinions and data contained in all publications are solely those of the individual author(s) and contributor(s) and not of MDPI and/or the editor(s). MDPI and/or the editor(s) disclaim responsibility for any injury to people or property resulting from any ideas, methods, instructions or products referred to in the content. |
© 2025 by the authors. Licensee MDPI, Basel, Switzerland. This article is an open access article distributed under the terms and conditions of the Creative Commons Attribution (CC BY) license (https://creativecommons.org/licenses/by/4.0/).
Share and Cite
He, B.; Zhang, Q.; Han, H.; Jiang, S.; Yu, B.; Chen, S. The Research on the Esterification Deacidification of Vacuum Gas Oil by FeZn Bimetal–Organic Frameworks Catalysts. Materials 2025, 18, 1647. https://doi.org/10.3390/ma18071647
He B, Zhang Q, Han H, Jiang S, Yu B, Chen S. The Research on the Esterification Deacidification of Vacuum Gas Oil by FeZn Bimetal–Organic Frameworks Catalysts. Materials. 2025; 18(7):1647. https://doi.org/10.3390/ma18071647
Chicago/Turabian StyleHe, Bai, Qing Zhang, Huimin Han, Songshan Jiang, Bo Yu, and Shuangkou Chen. 2025. "The Research on the Esterification Deacidification of Vacuum Gas Oil by FeZn Bimetal–Organic Frameworks Catalysts" Materials 18, no. 7: 1647. https://doi.org/10.3390/ma18071647
APA StyleHe, B., Zhang, Q., Han, H., Jiang, S., Yu, B., & Chen, S. (2025). The Research on the Esterification Deacidification of Vacuum Gas Oil by FeZn Bimetal–Organic Frameworks Catalysts. Materials, 18(7), 1647. https://doi.org/10.3390/ma18071647