
The Effect of Hollow Polymer Microspheres on the Pore Structure and Frost Resistance of Cement Mortar

 ,
,
Abstract
1. Introduction
2. Materials and Methods
2.1. Raw Materials
2.2. Test Ratios
2.3. Test Methods
3. Results and Discussion
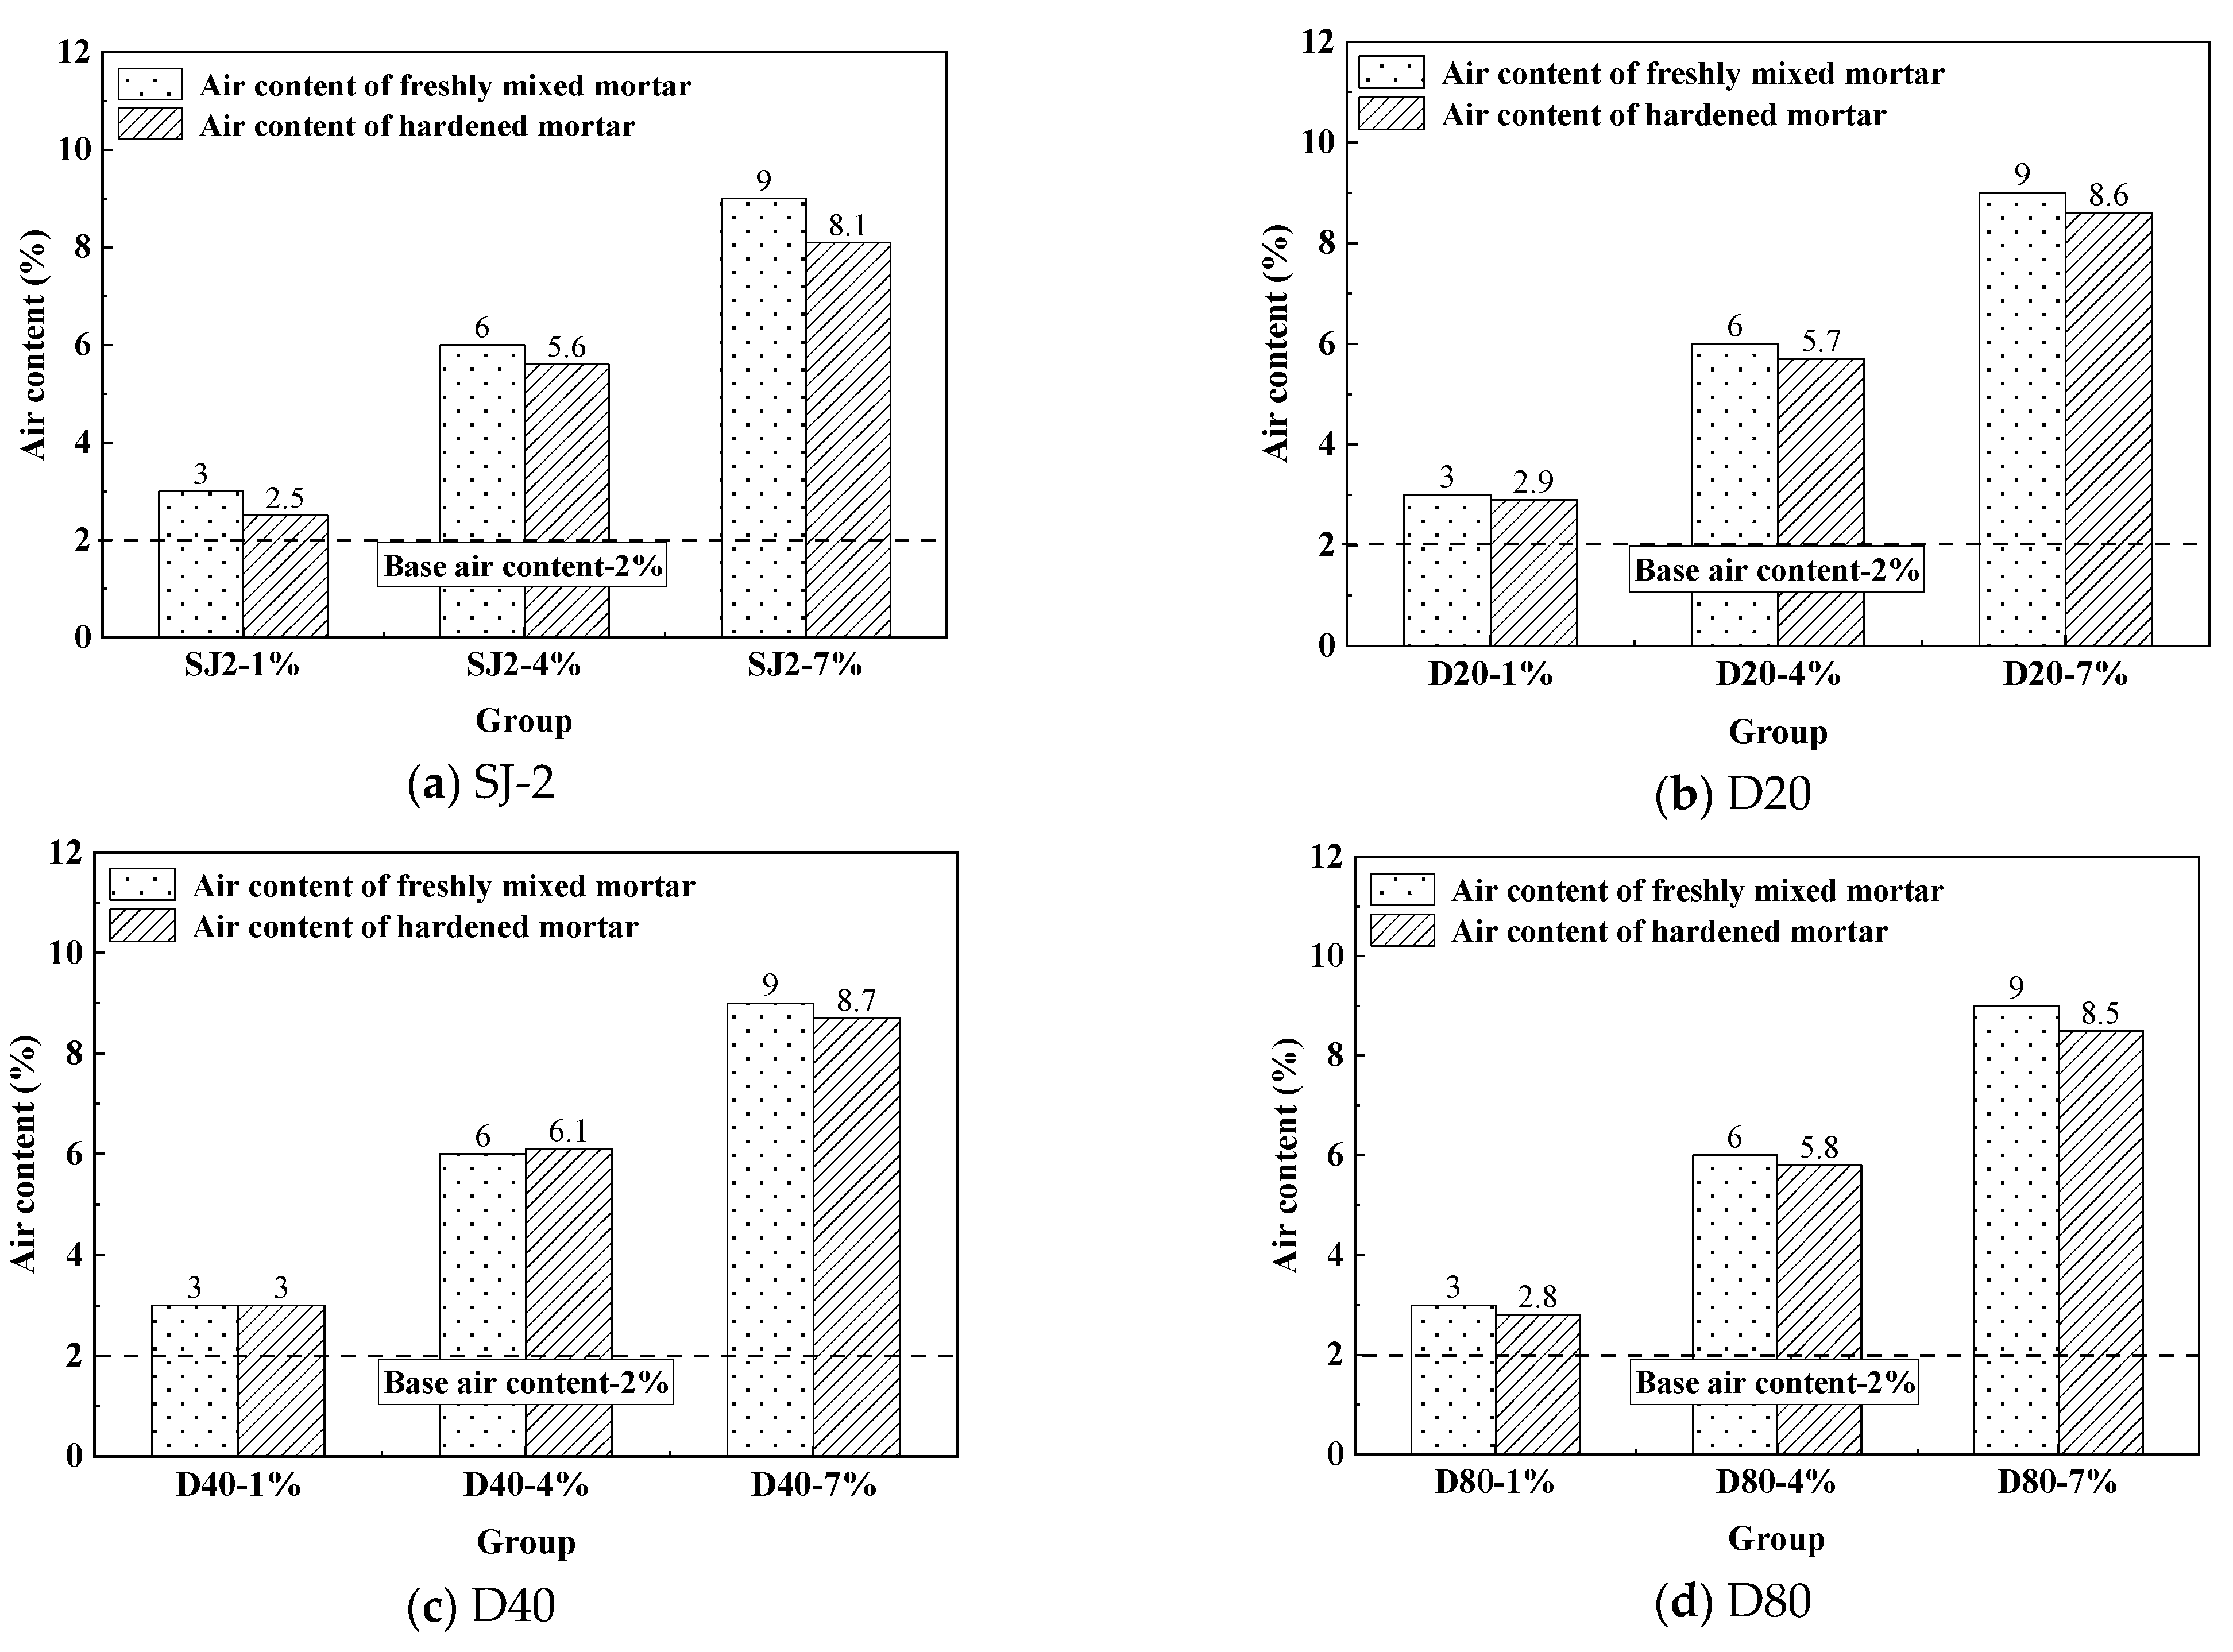
3.1. Gas Content
3.2. Compressive Strength
3.3. Solid Air-Entraining Mortar Pore Structure
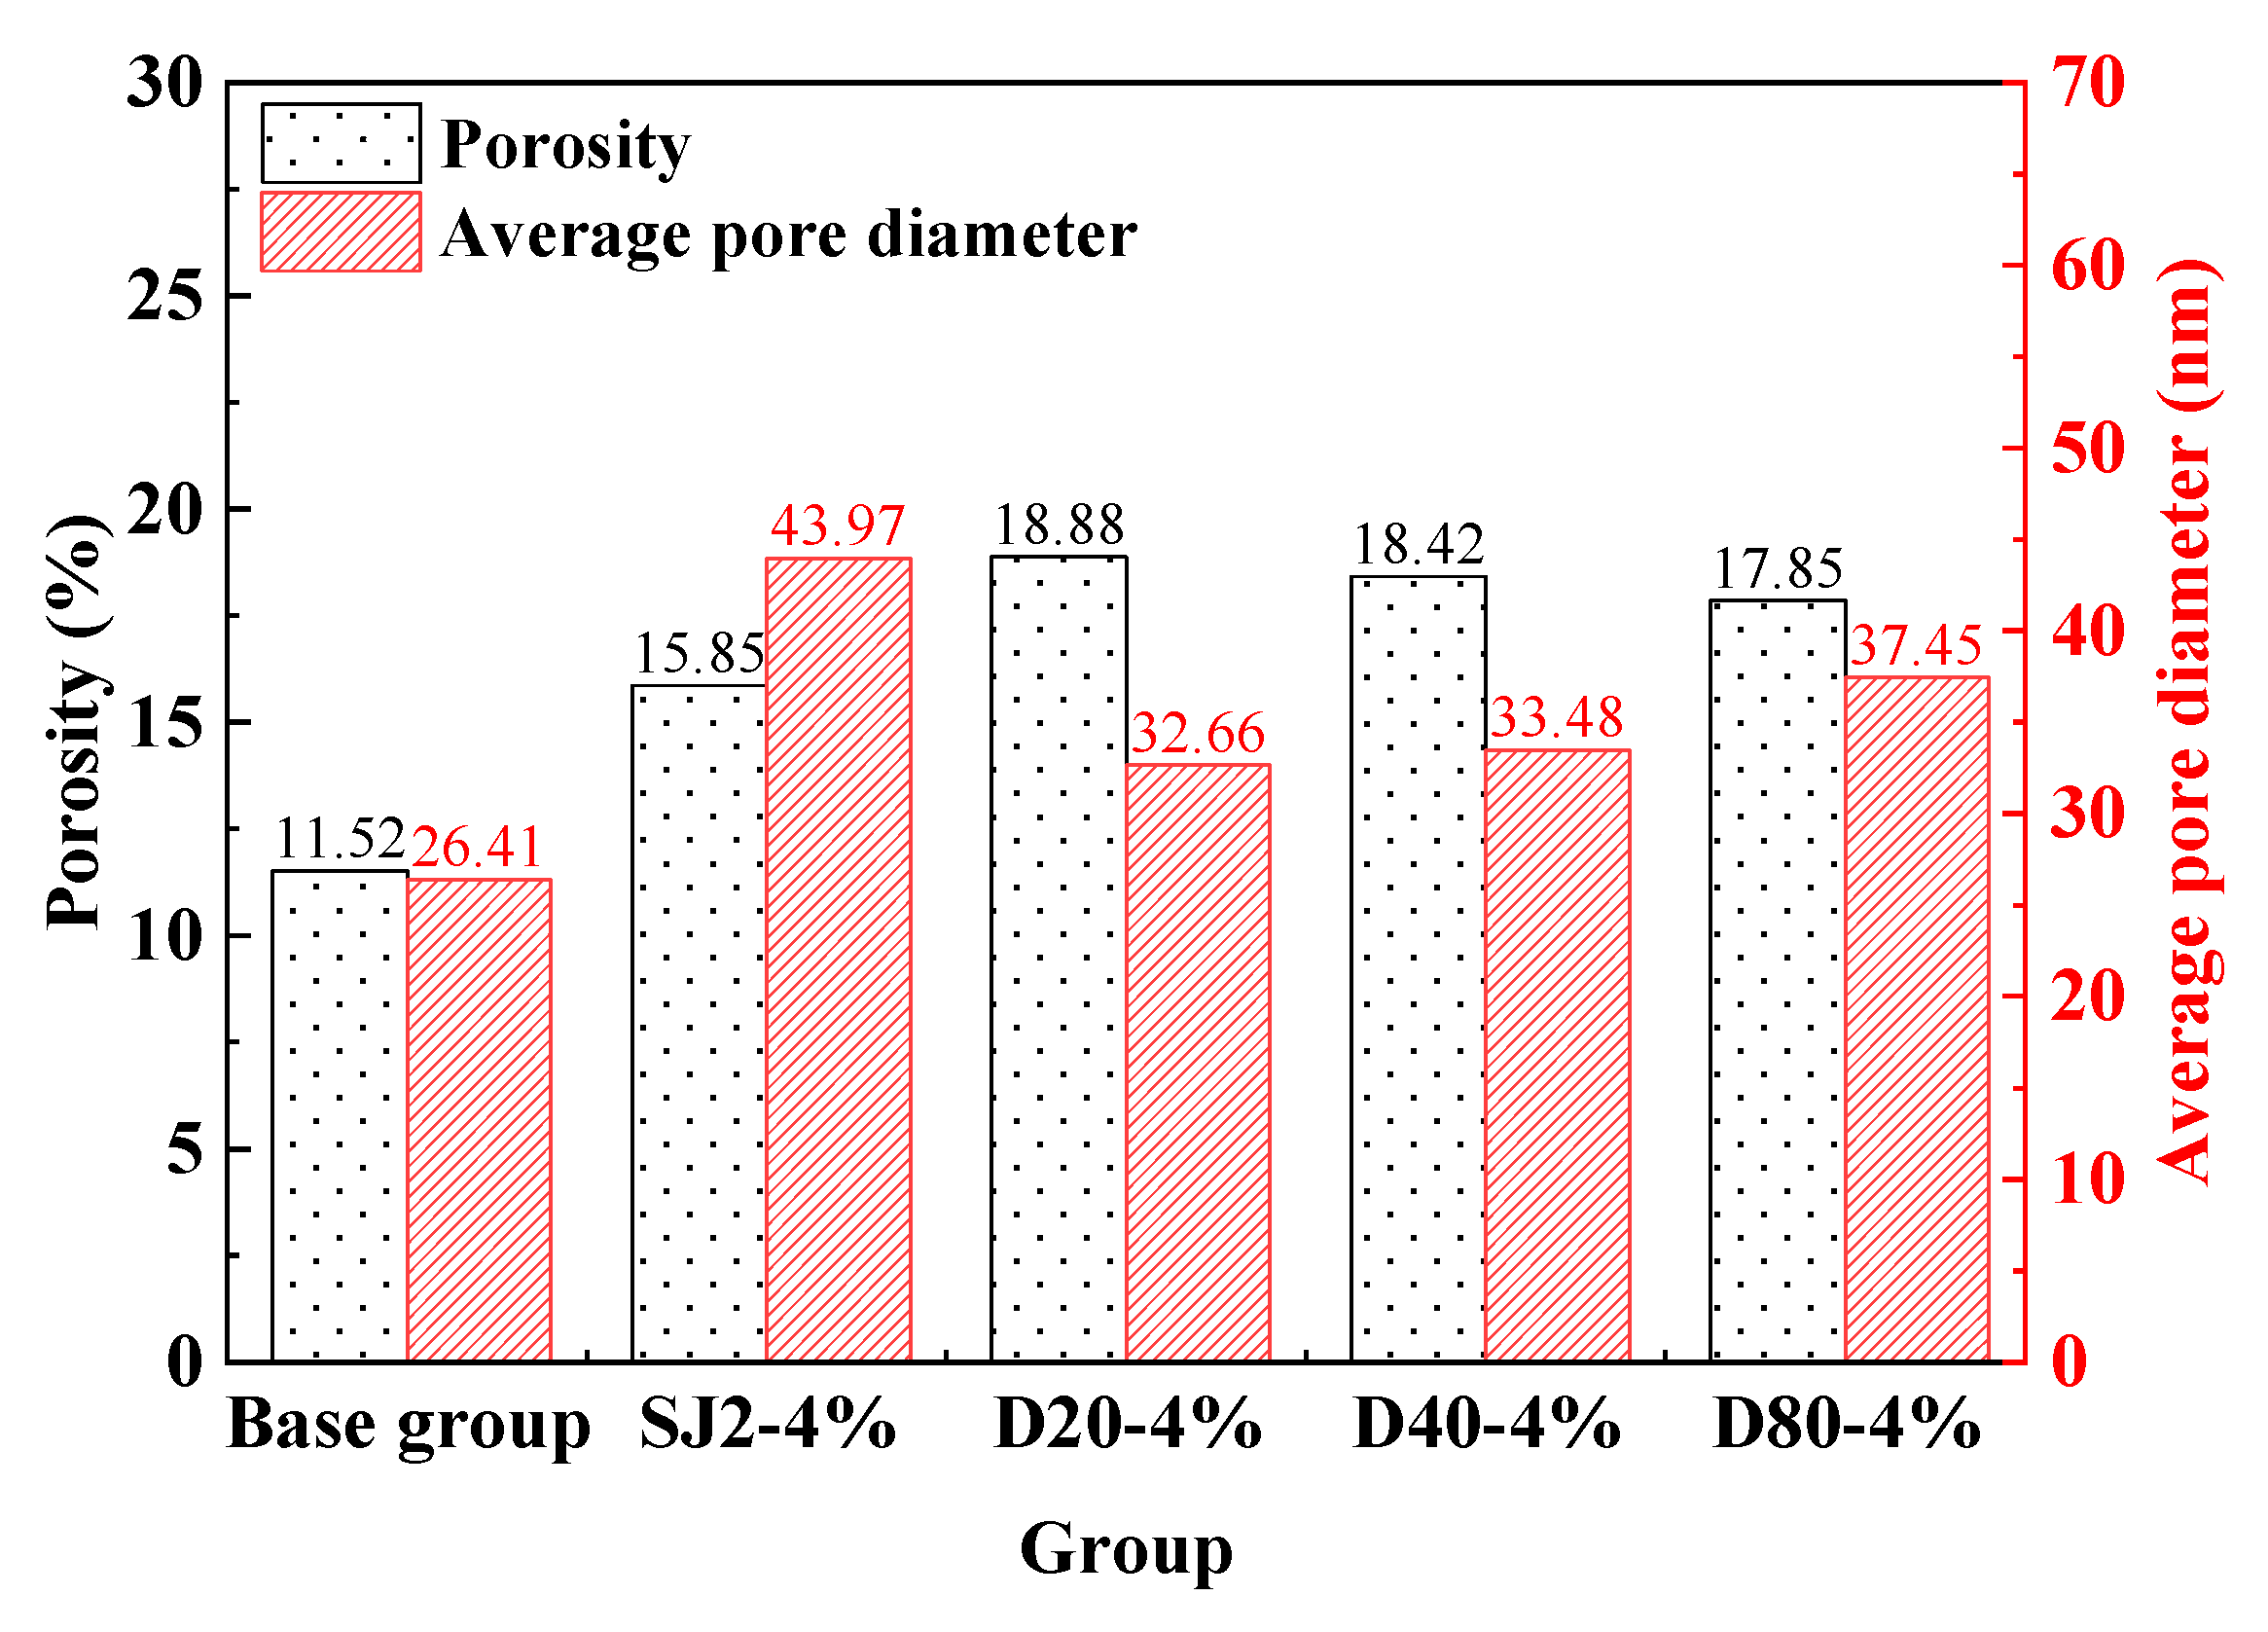
3.3.1. MIP
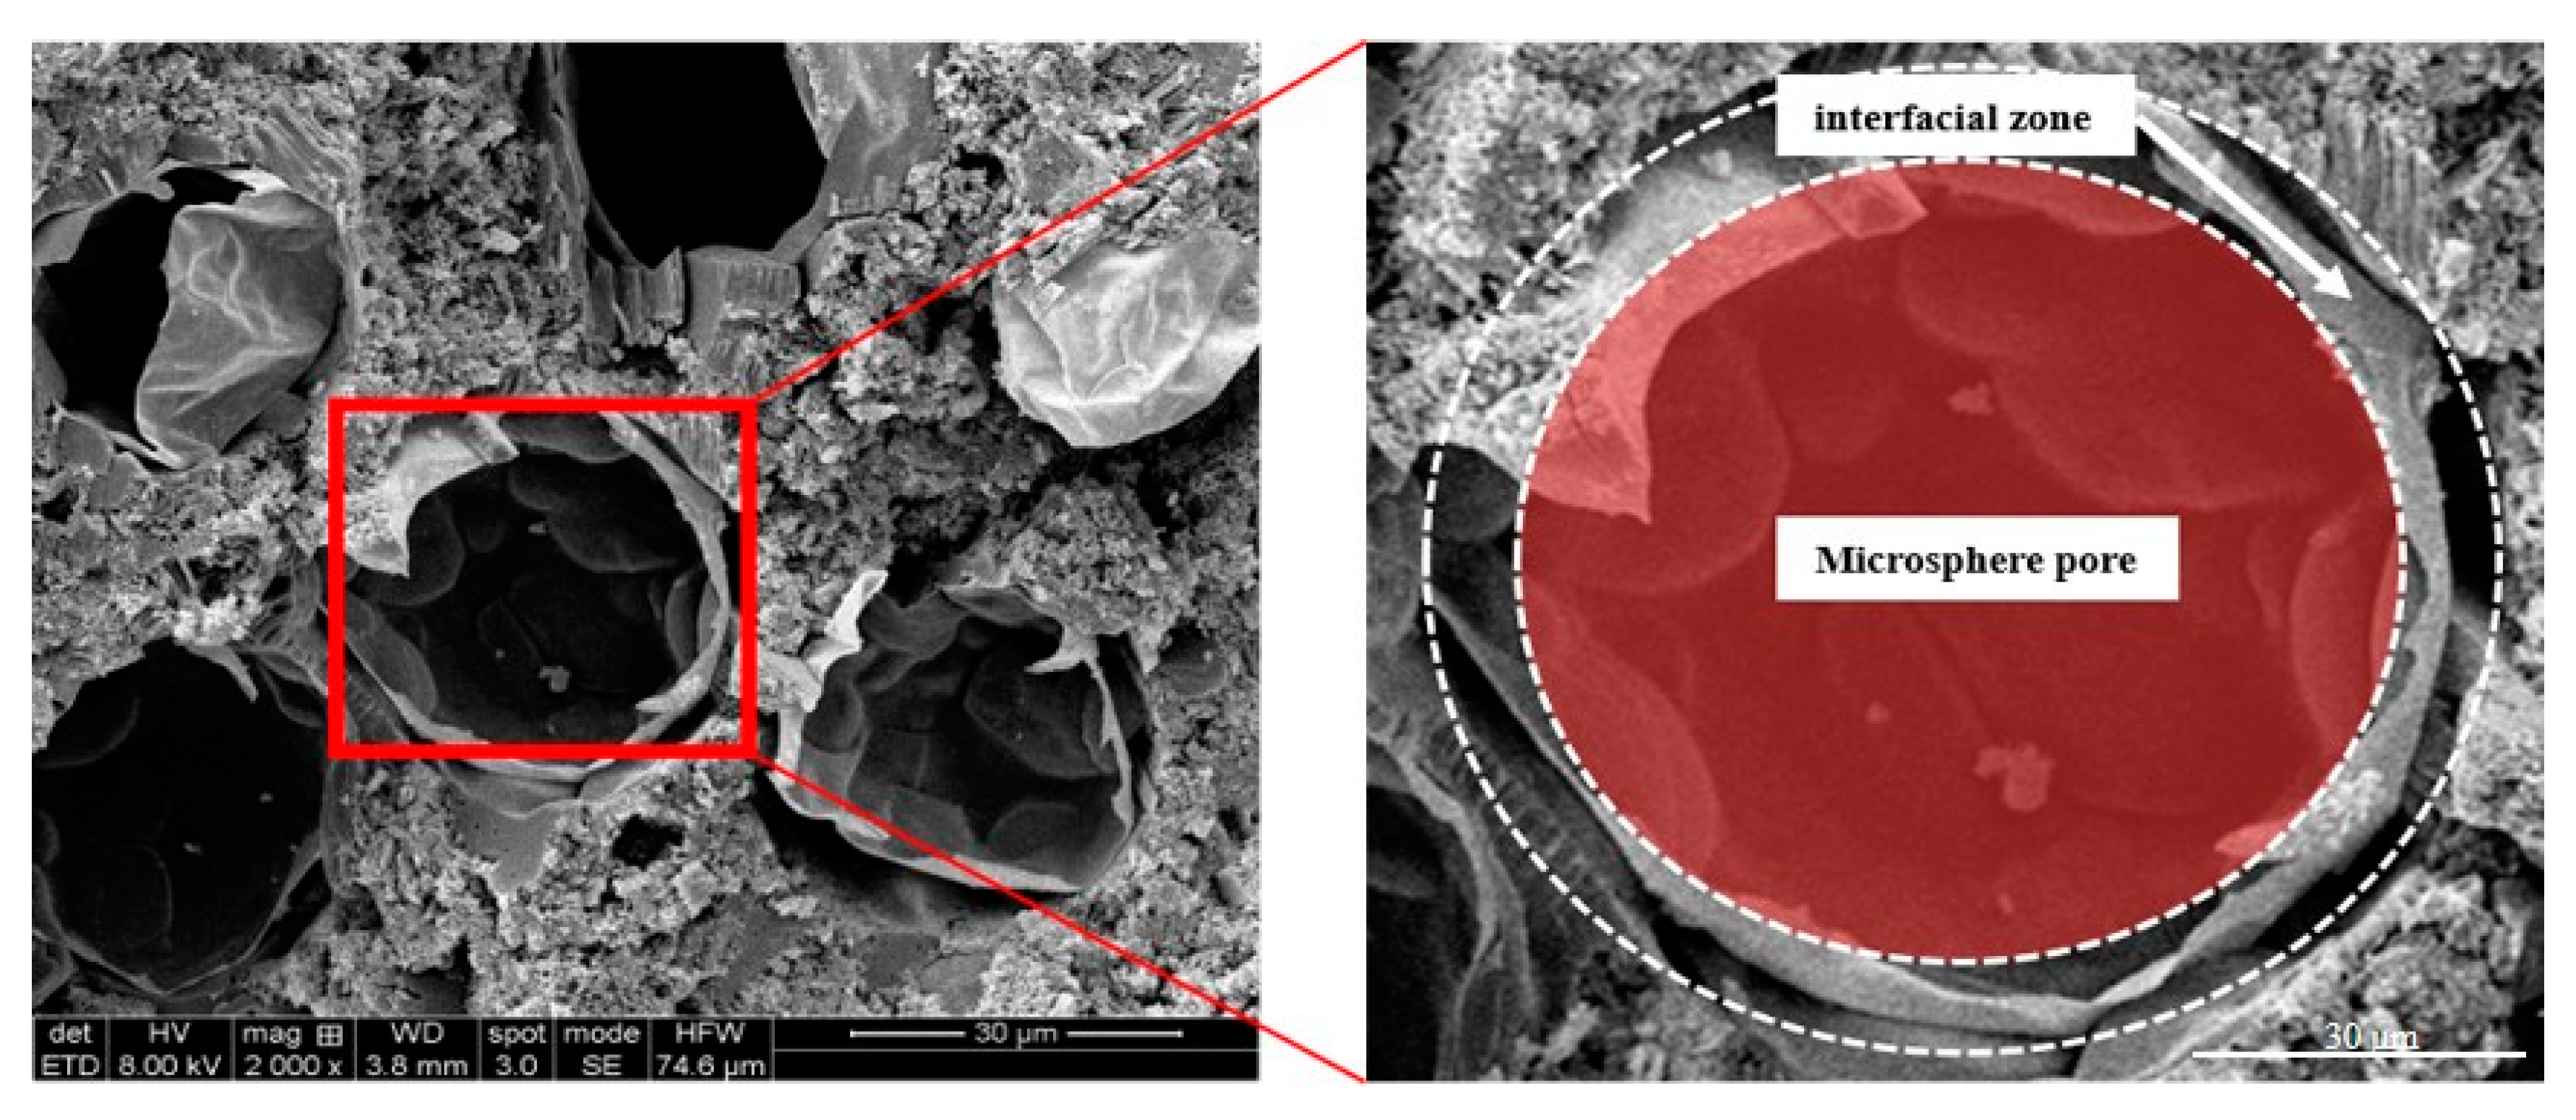
3.3.2. SEM
3.4. Frost Resistance
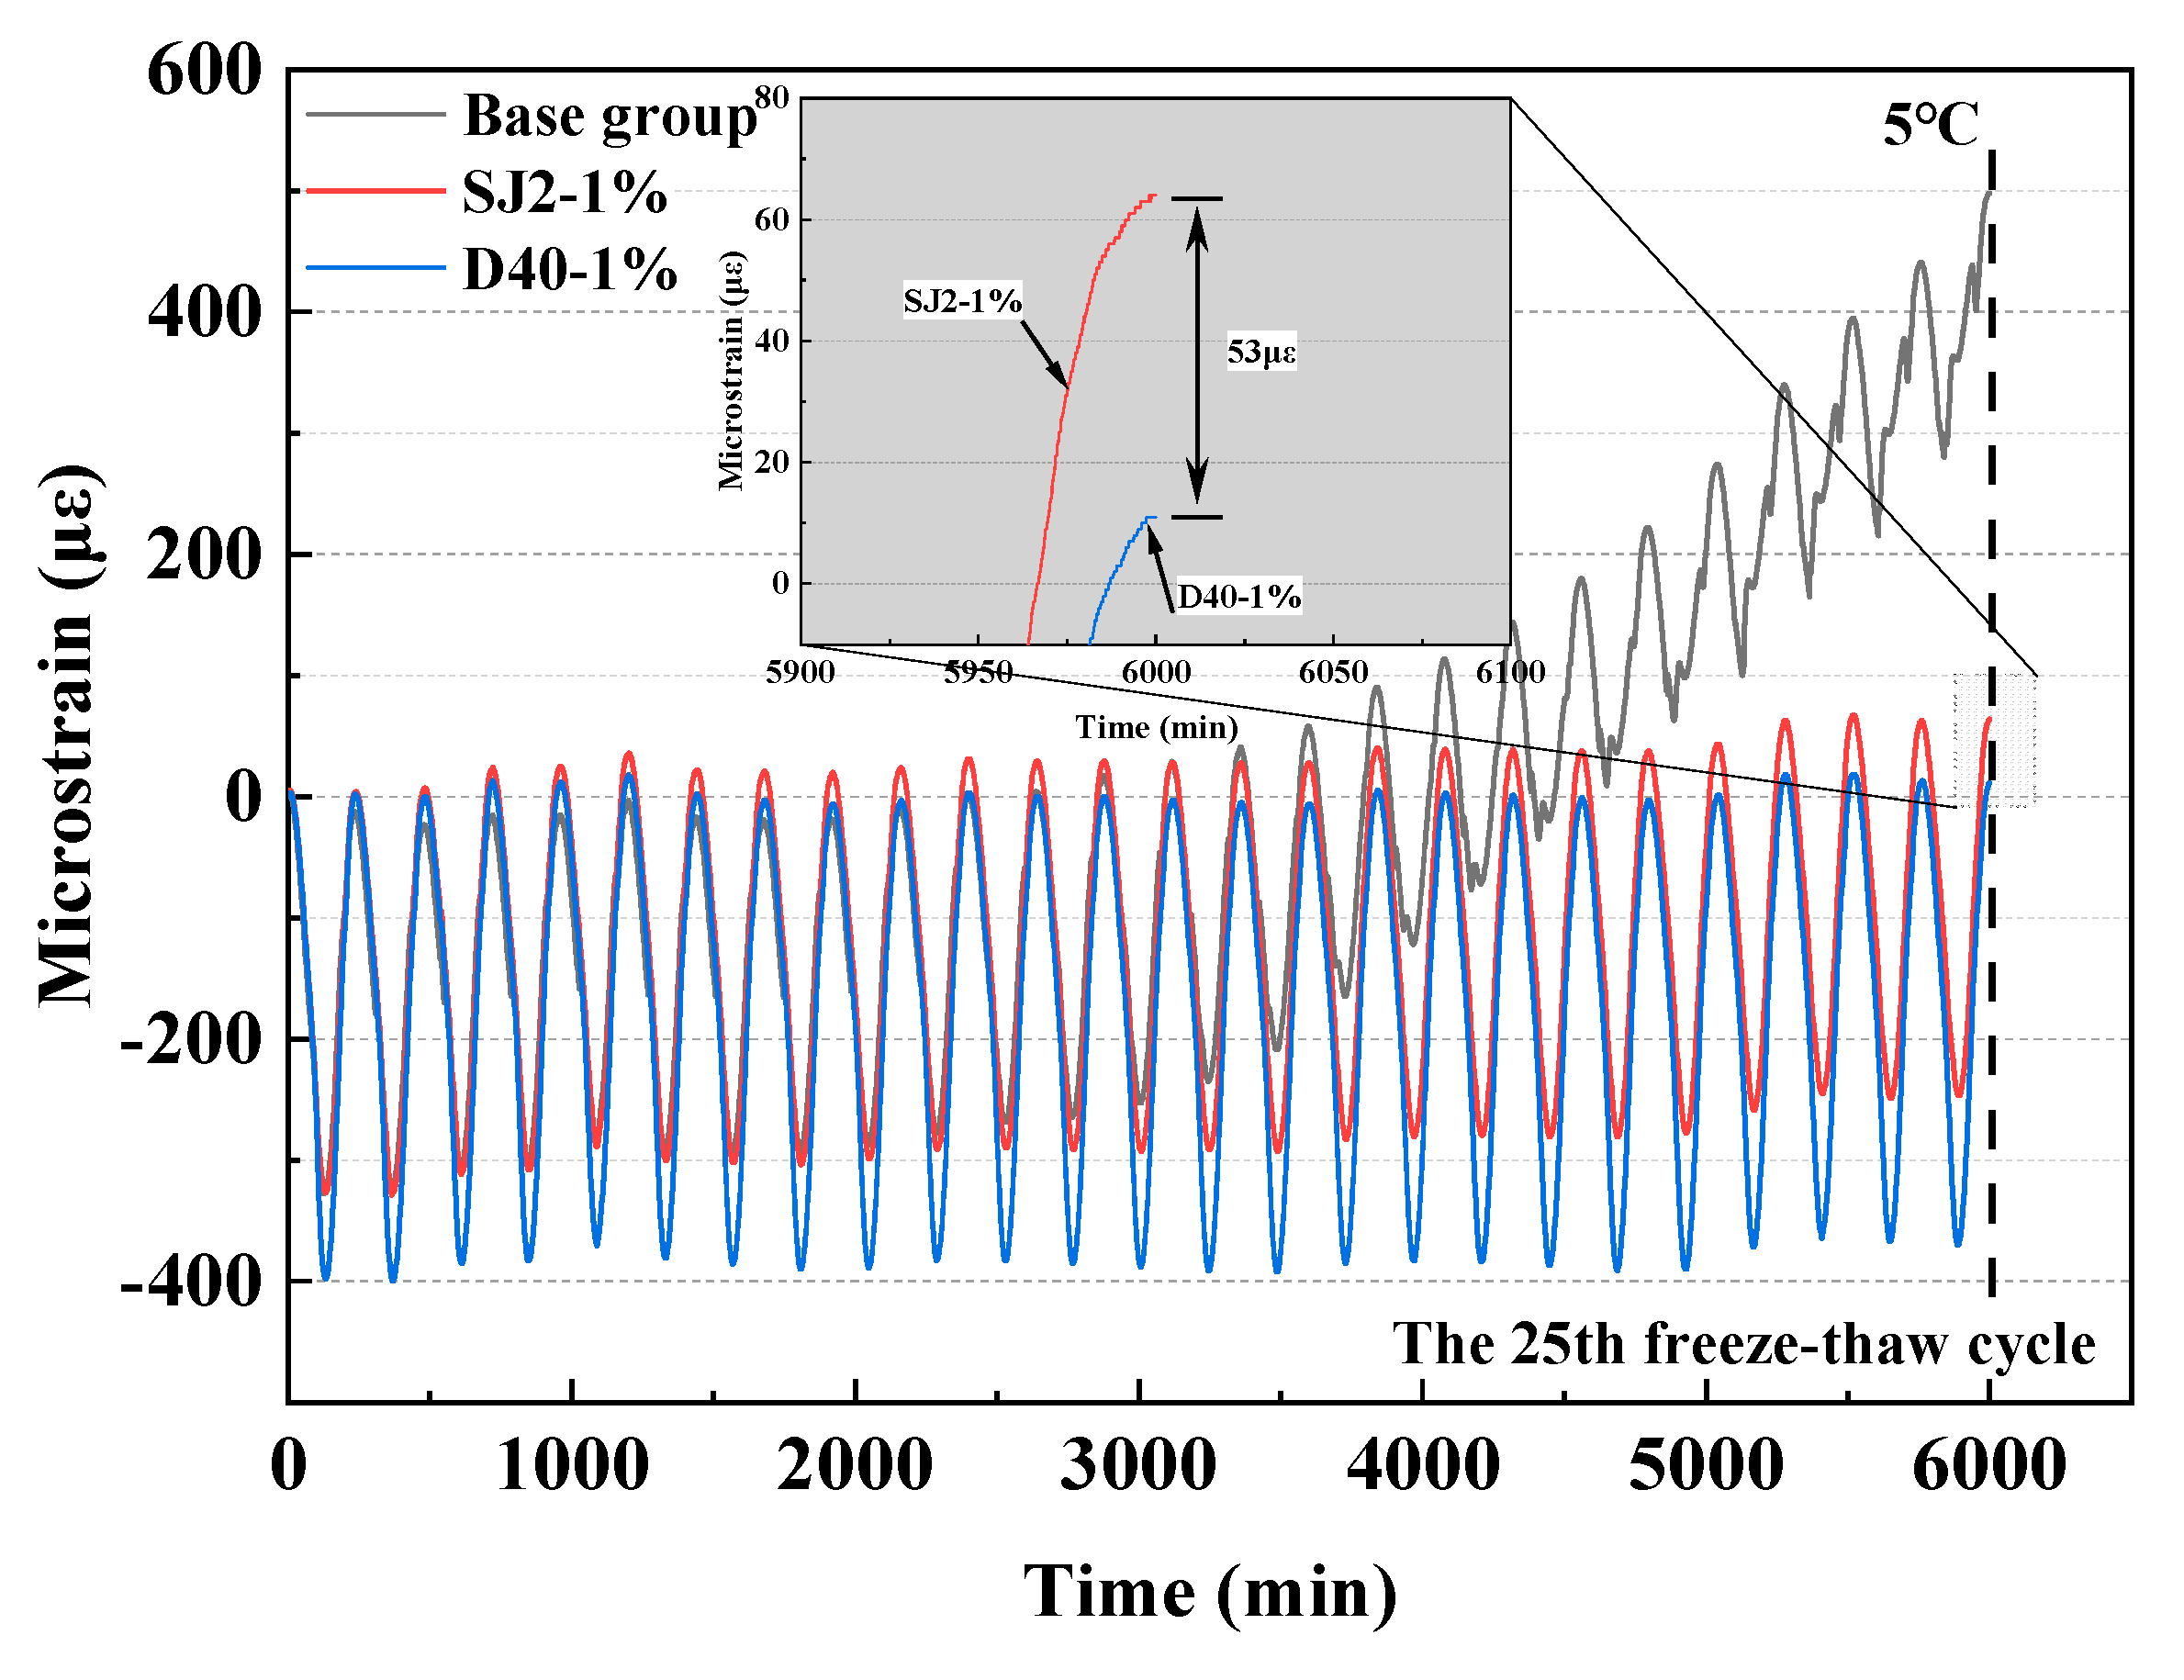
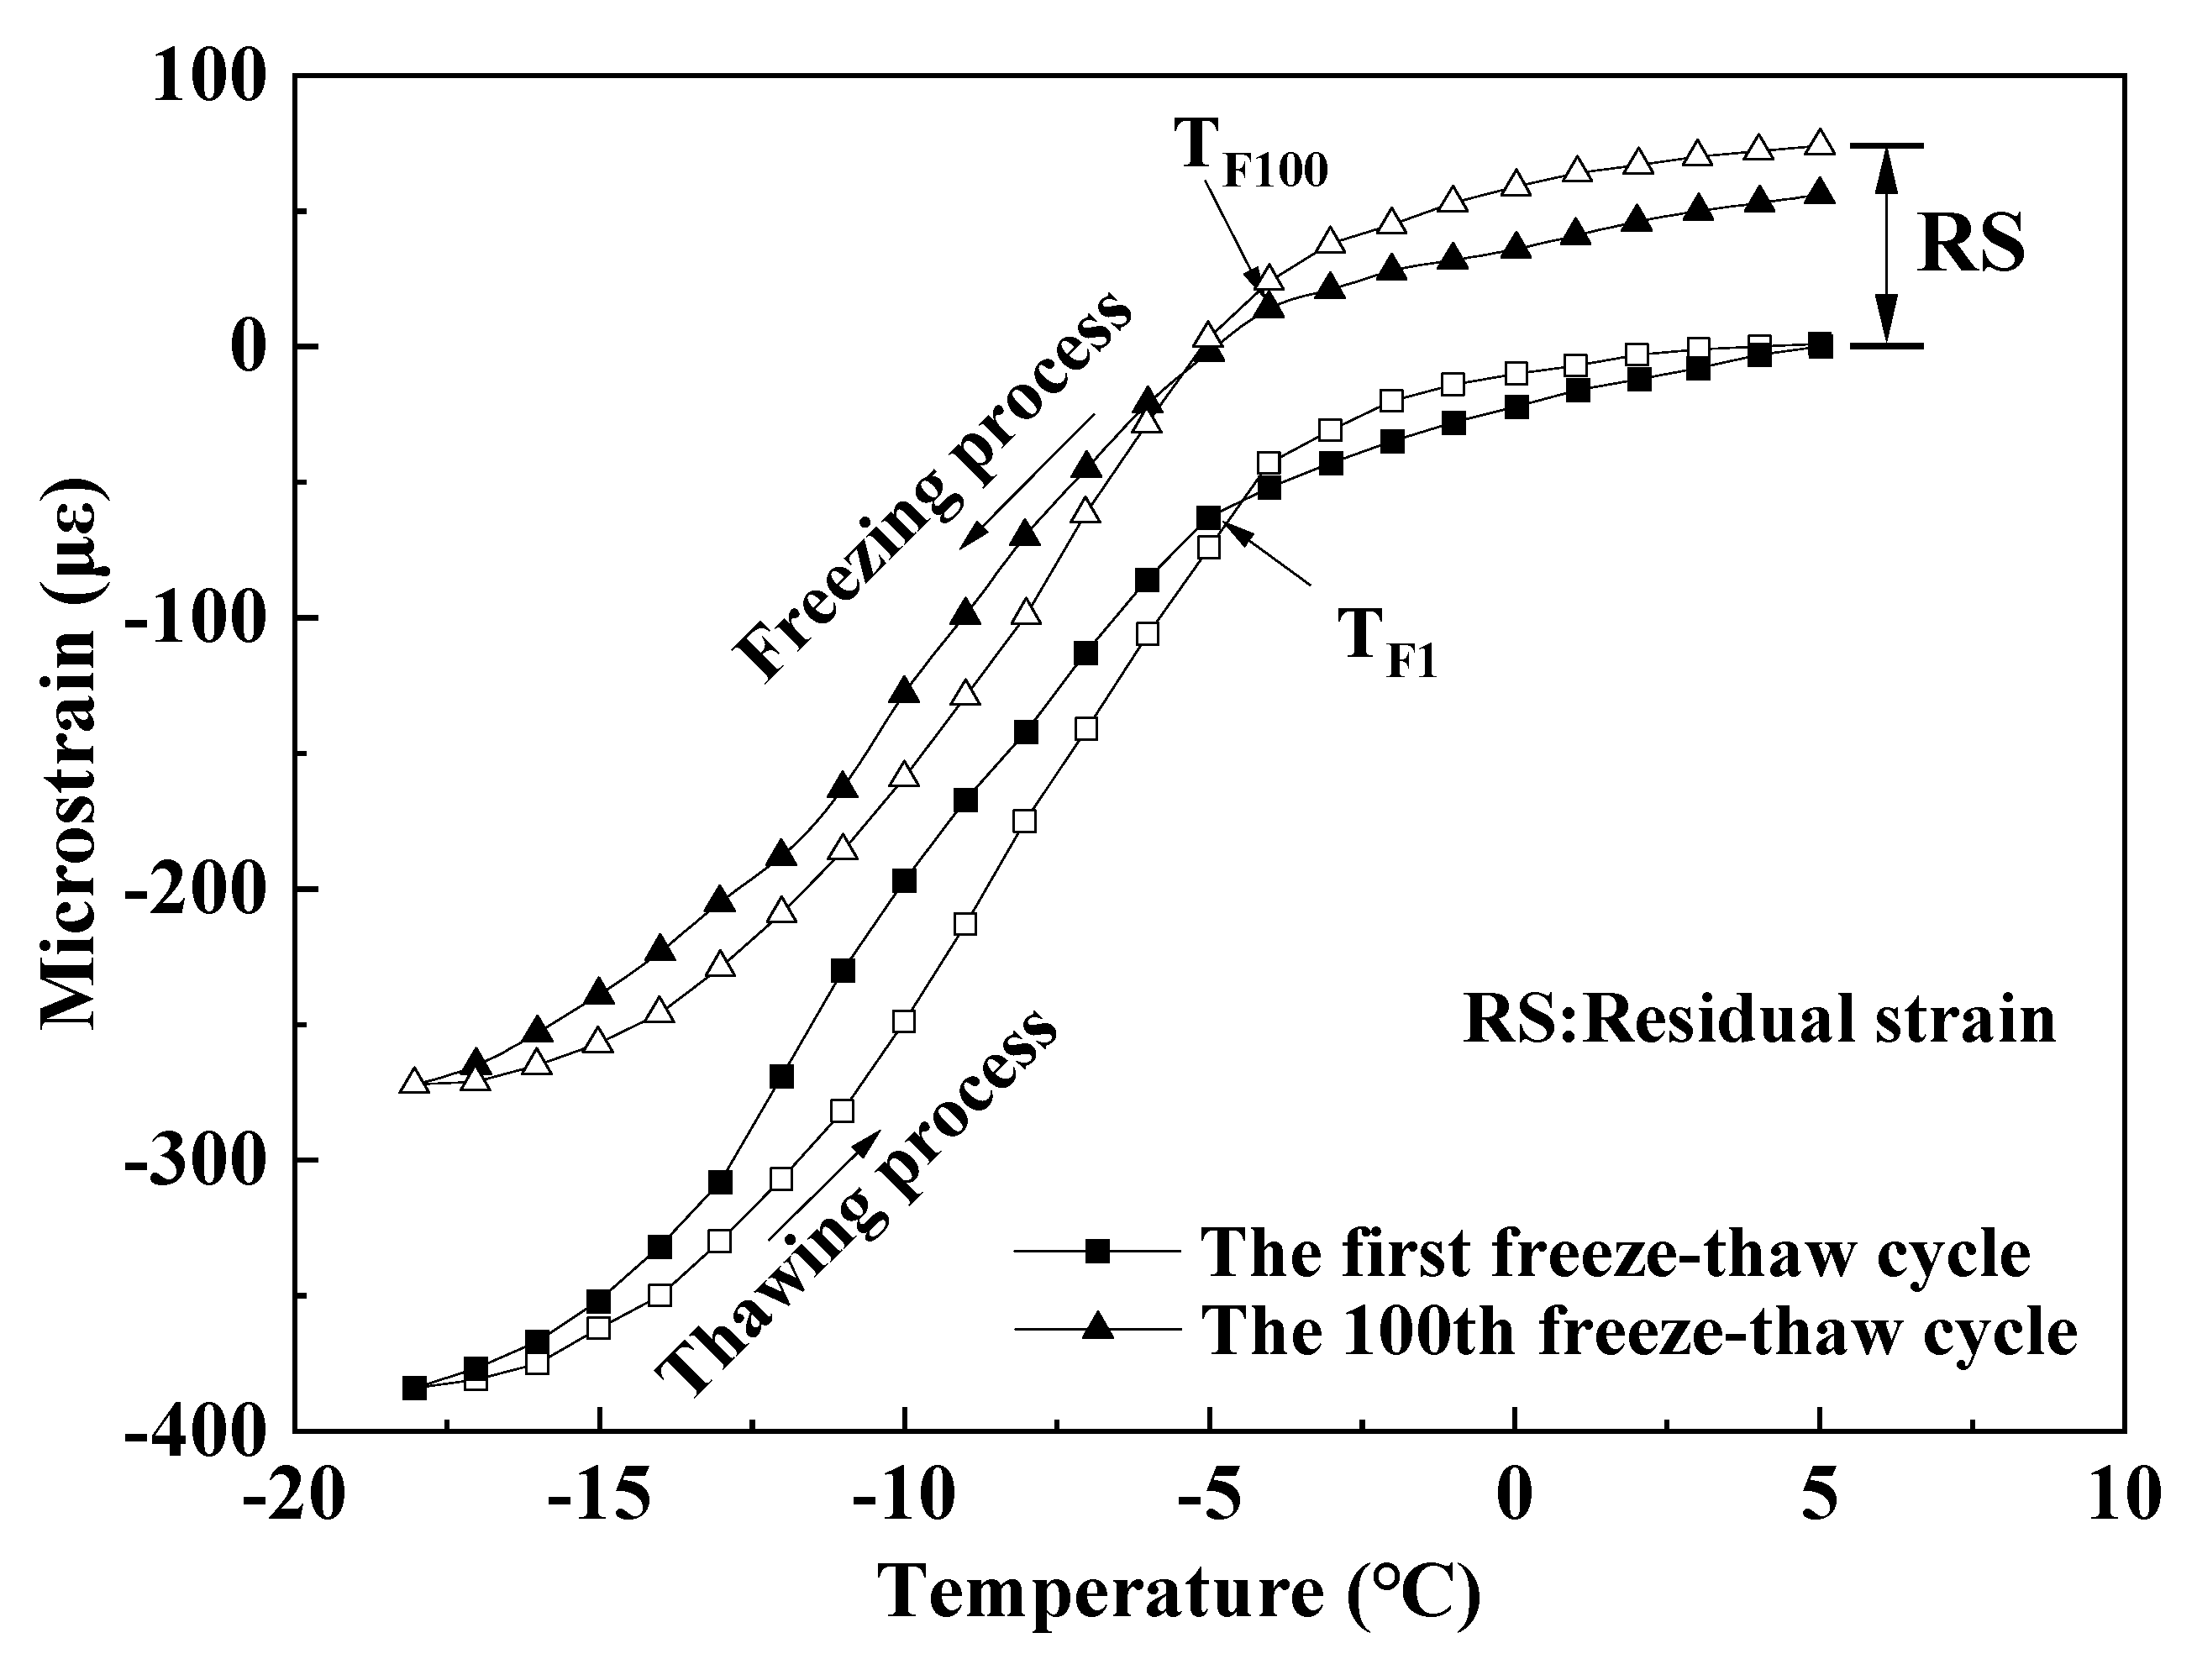
3.4.1. Residual Strain
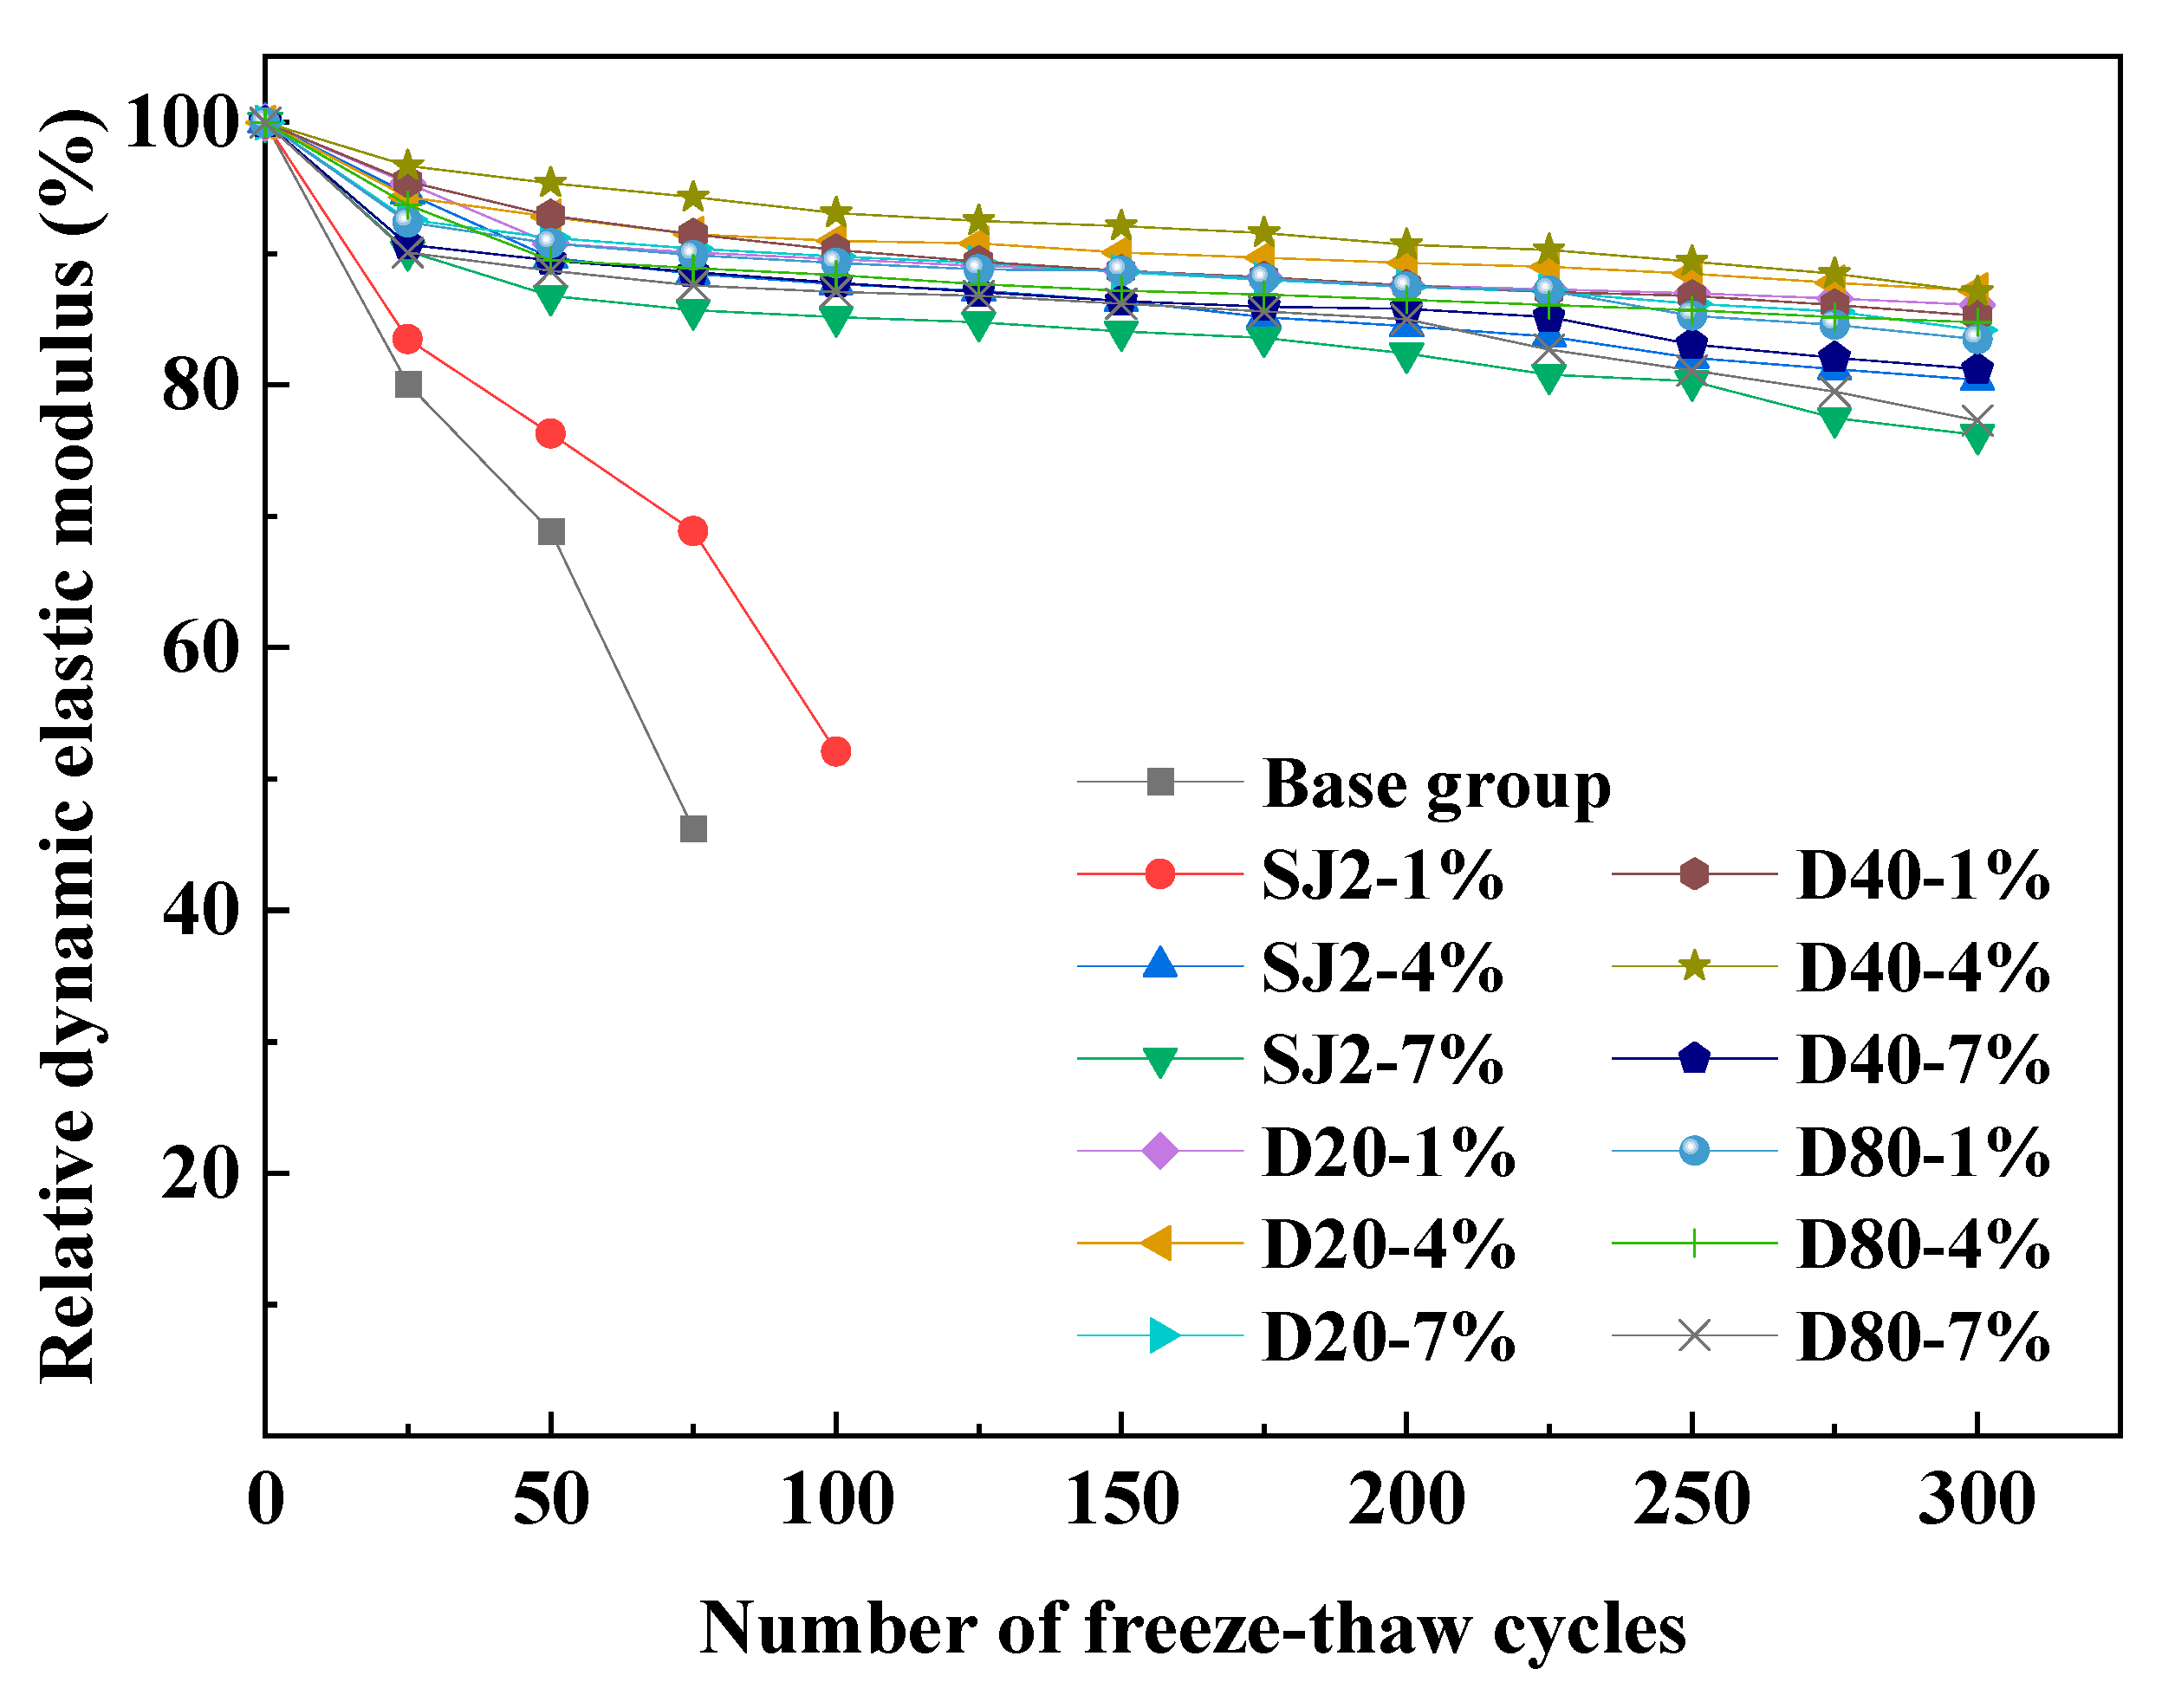
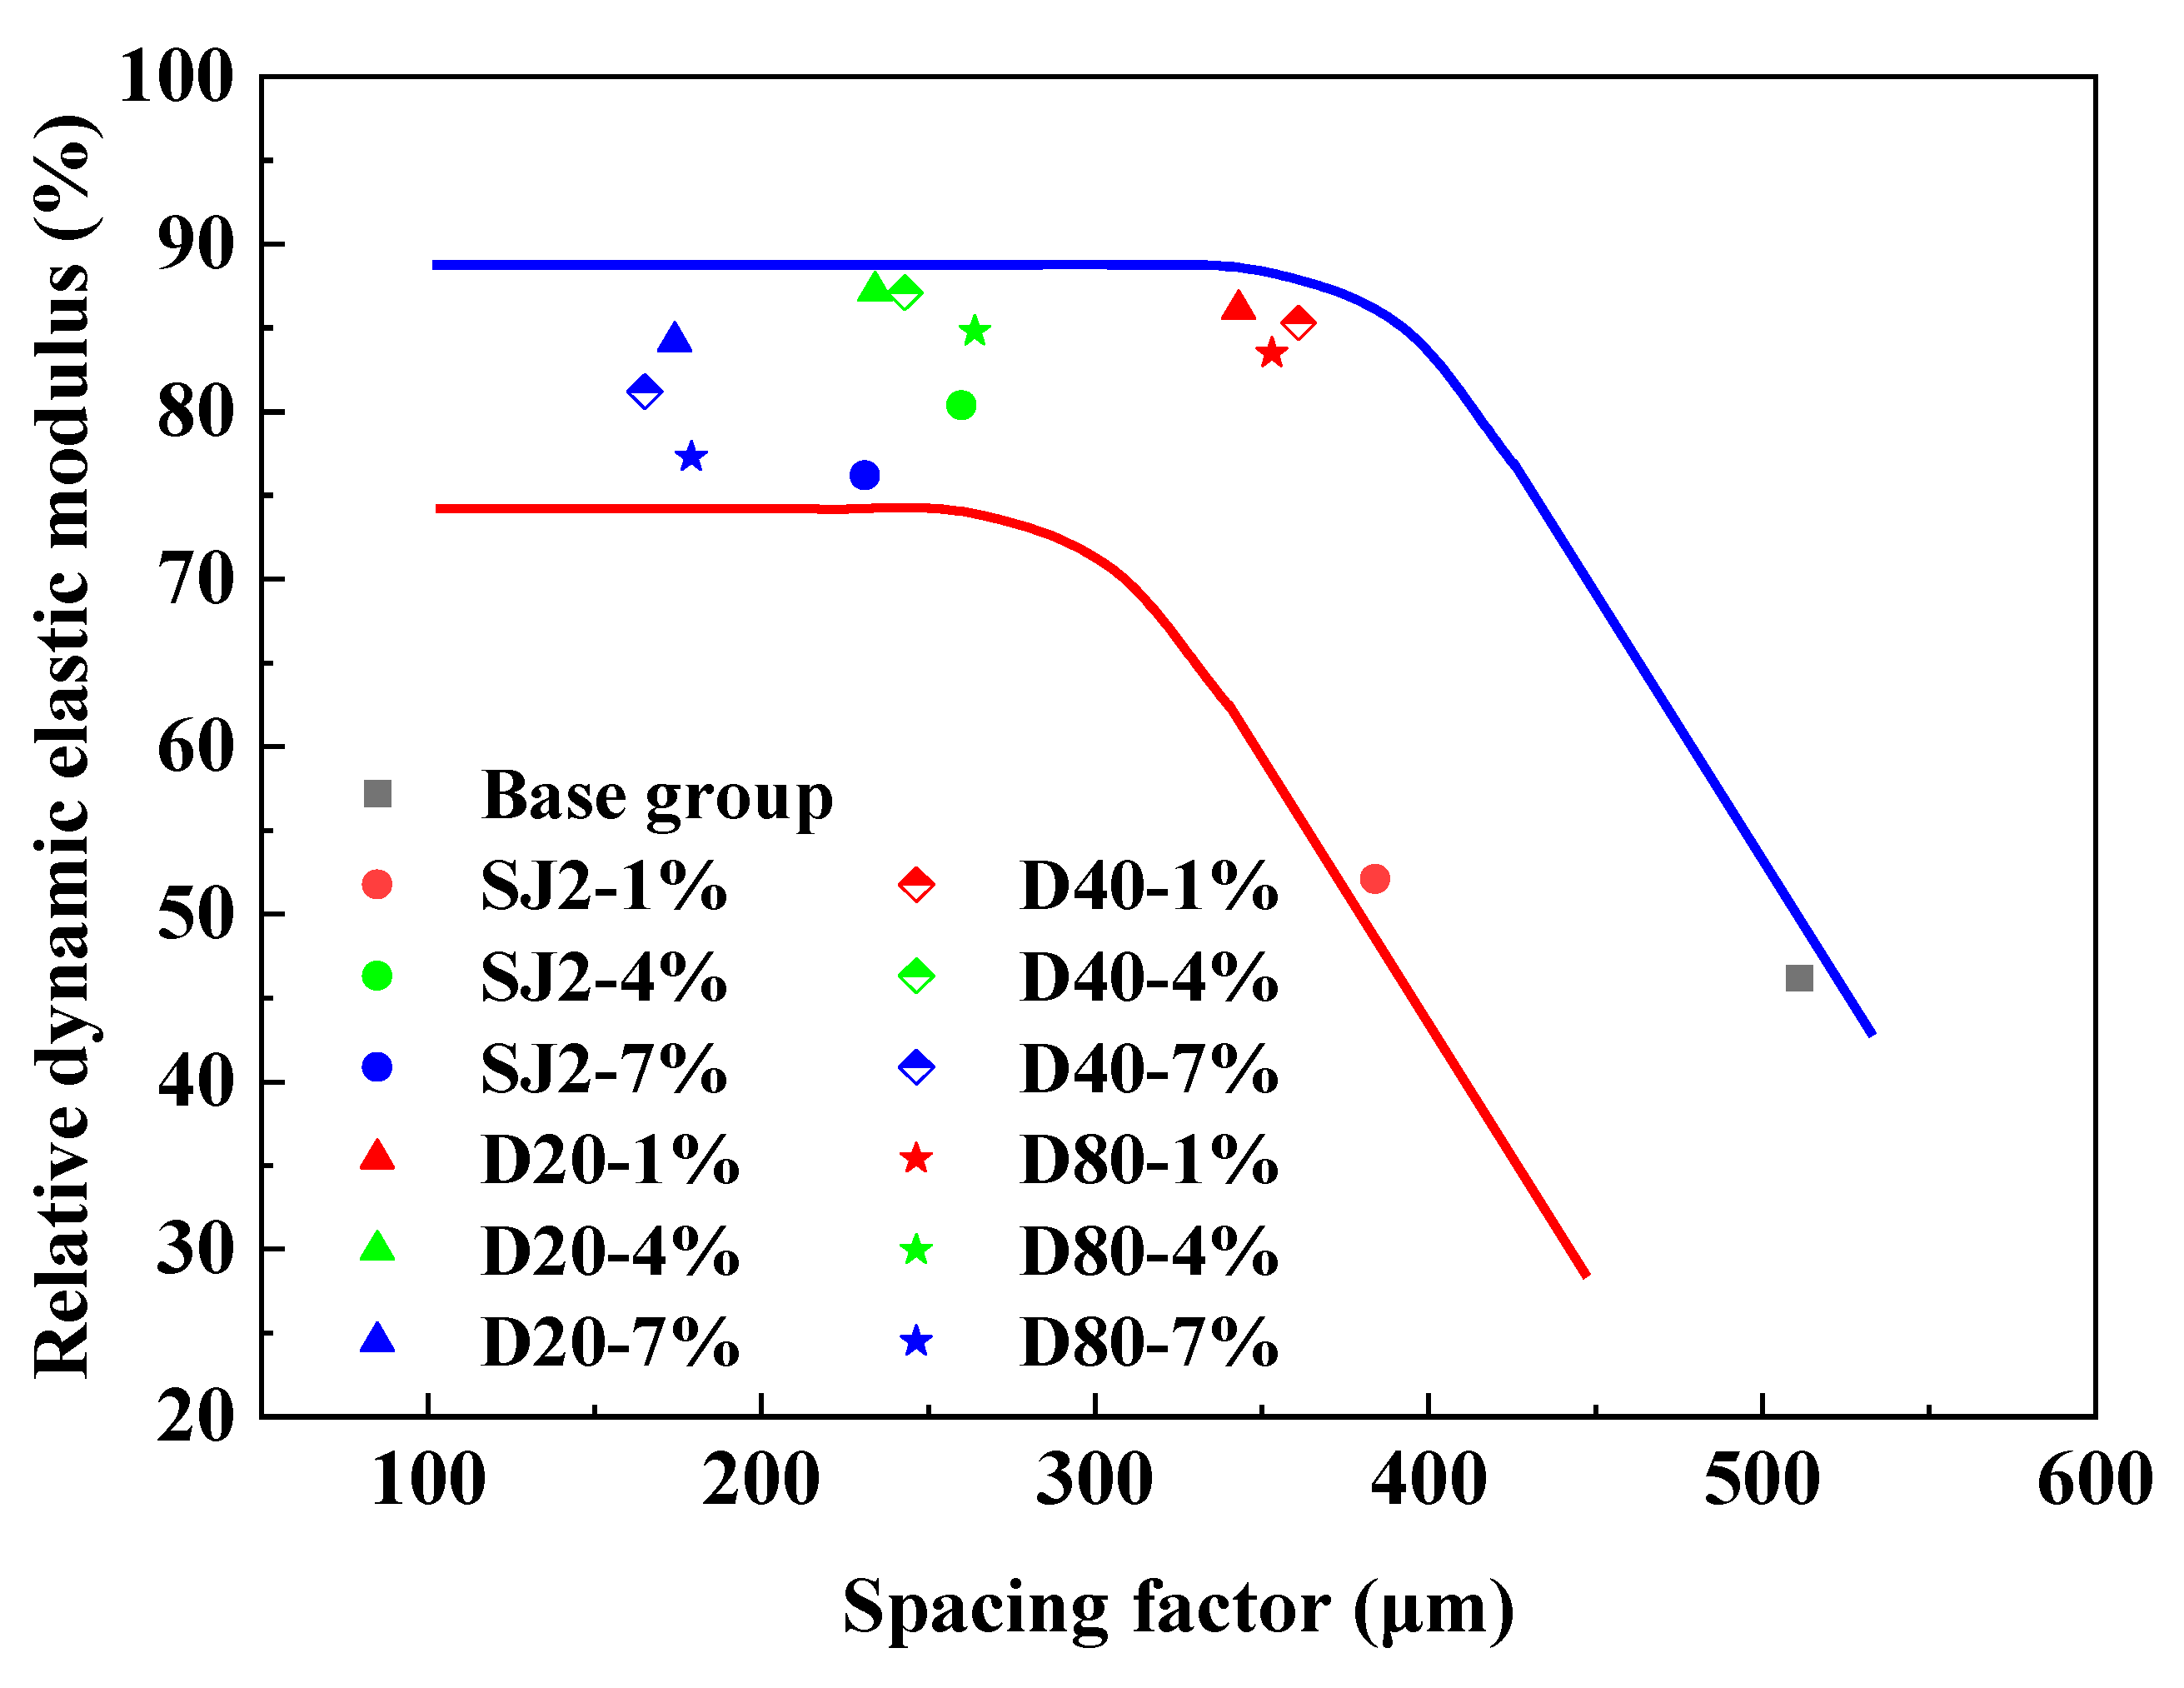
3.4.2. Relative Dynamic Modulus of Elasticity and Spacing Factor
4. Conclusions
- (1)
- Polymer hollow microspheres (WEA) consist of gas-filled cores encapsulated by a 100 nm thick thermoplastic shell, exhibiting superior mechanical properties and stability compared to the liquid film bubbles introduced by traditional SJ2 air-entraining agents (surfactants). The pore size introduced by WEA can be precisely controlled and stabilized, remaining unaffected by mortar molding or hydration processes, thereby forming uniformly sized, regularly shaped pores in the cement matrix.
- (2)
- At equivalent air content, WEA-modified mortar demonstrates higher compressive strength and lower residual strain after 100 freeze–thaw cycles compared to SJ2-modified mortar, indicating that WEA significantly enhances both mechanical performance and frost resistance relative to SJ2.
- (3)
- At a particle size of 40 µm, WEA-modified mortar with a 1% volume addition exhibits frost resistance comparable to that of SJ2-modified mortar with 4% air content. The performance of WEA-modified mortars is influenced by particle size, following the order of D20 > D40 > D80 in both mechanical strength and frost resistance.
- (4)
- SJ2 air-entrained mortar exhibits superior frost resistance when the spacing coefficient is below 250 μm. However, when the spacing coefficient exceeds 350 μm, its relative dynamic elastic modulus drops below 60% after 300 freeze–thaw cycles. In contrast, WEA-modified mortar, with pore sizes ranging from 20 to 80 µm, maintains excellent frost resistance even at spacing coefficients around 350 µm.
Author Contributions
Funding
Institutional Review Board Statement
Informed Consent Statement
Data Availability Statement
Conflicts of Interest
References
- Ge, X.; Ge, Y.; Li, Q.; Cai, X.; Yang, W.; Du, Y. Effect of low air pressure on the durability of concrete. Constr. Build. Mater. 2018, 187, 830–838. [Google Scholar] [CrossRef]
- Shan, G.; Lu, C.; Chen, J.; Gao, N.; Qiao, M.; Ran, Q.; Liu, J. Effects of air-entraining agents with different structures on solution and concrete properties. J. Silic. 2020, 8, 1256–1262. [Google Scholar]
- Liu, S.; Sang, R.; Hong, S.; Cai, Y.; Wang, H. A novel type of highly effective nonionic gemini alkyl O-glucoside surfactants: A versatile strategy of design. Langmuir 2013, 29, 8511–8516. [Google Scholar] [CrossRef] [PubMed]
- Wang, J.; Xue, S.; Zhang, P.; Li, C.; Gao, S. Effect of air entraining agent on capillary water absorption of mortar before and after freeze-thaw cycle. J. Build. Mater. 2022, 25, 1007–1014. [Google Scholar]
- Hammad Ahmed, S.; Yuan, Q.; Zuo, S. Air entrainment in fresh concrete and its effects on hardened concrete-a review. Constr. Build. Mater. 2021, 274, 121835. [Google Scholar] [CrossRef]
- Corr, D.J.; Juenger, M.C.; Monteiro, P.J.; Bastacky, J. Investigating entrained air voids and Portland cement hydration with low-temperature scanning electron microscopy. Cem. Concr. Compos. 2004, 26, 1007–1012. [Google Scholar] [CrossRef]
- Chen, X.; Yang, H.; Zhou, S.; Wang, Z. Study on freeze-thaw durability of concrete with characteristic parameters of air bubbles. J. Build. Mater. 2011, 14, 257–262. [Google Scholar]
- Li, Z.; Jiao, M.A.; Pu, Z. Frost resistance of hybrid fiber/twisted high-strength concrete. J. Build. Mater. 2023, 26, 1072–1081. [Google Scholar]
- Xing, J.; Zhou, M.; Zhang, Q. Effect of thermally activated gangue mineral admixture on impermeability and frost resistance of concrete. Silic. Bulletin. 2015, 34, 2696–2701. [Google Scholar]
- Shi, Y.; Yang, H.; Zhou, S.; Wang, A.; Lv, X. Effect of atmospheric pressure on the performance of AEA and air-entraining concrete. Adv. Mater. Sci. Eng. 2018, 2018, 6528412. [Google Scholar] [CrossRef]
- Li, L.; Ye, T.; Liu, Z. Effect of low air pressure curing on microporosity and impermeability of cement mortar. J. Build. Mater. 2023, 26, 823–830. [Google Scholar]
- Chen, H.X.; Wang, T.; He, R.; Zhang, J.S.; Fang, J.; Bai, Y. Influence of complex climatic environment on pore structure and mechanical properties of concrete in plateau. J. Chang. Univ. Nat. Sci. Ed. 2020, 40, 30–37. [Google Scholar]
- Liu, X. Research on the Effect of Low Air Pressure Environment on Air-Entraining Effect and Pore Structure of Concrete; Harbin Institute of Technology: Harbin, China, 2020. [Google Scholar]
- Li, L.; Chen, X.; Tian, B. Influence of atmospheric pressure on the air-entraining effect of the concrete air-entraining agent. J. Build. Mater. 2021, 24, 866–873. [Google Scholar]
- Yang, Q.; Zhu, B.; Yang, Q. Effect of high-frequency vibration on characteristic parameters of air-entraining concrete bubbles. J. Build. Mater. 2007, 10, 331–336. [Google Scholar]
- Zhang, J.; Guo, M.; Yang, R. Research on the effect of high-frequency vibration on frost resistance of concrete structures in road engineering. Highw. Transp. Sci. Technology. 2008, 25, 55–58. [Google Scholar]
- Zhang, H.; Gao, P.; Zhang, Z.; Pan, Y.; Zhang, W. Effects of parameters of air-avid structure on the salt-frost durability of hardened concrete. Appl. Sci. 2020, 10, 632. [Google Scholar] [CrossRef]
- Li, H. Research on the Effect of Calcium Acrylate Microspheres on the Properties of Silicate Cement; Jinan University: Jinan, China, 2014. [Google Scholar]
- Ong, F.S.; Attiogbe, E.K.; Nmai, C.K.; Smith, J.C. Freezing-and-Thawing Behavior of Cementitious Systems with New Polymeric Microsphere-Based Admixture. ACI Mater. J. 2015, 112, 735–743. [Google Scholar] [CrossRef]
- Frías, M.; de Reyes, A.M.M.L.; Villar-Cociña, E.; García, R.; de la Villa, R.V.; Vasić, M.V. New Eco-Cements Made with Marabou Weed Biomass Ash. Materials 2024, 17, 5012. [Google Scholar] [CrossRef]
- GB/T 17671-2021; Test Method for Strength of Cement Mortar (ISO Method). Chinses Standard Press: Beijing, China, 2021.
- ASTM C457/C 457M-12; Standard Test Method for Microscopical Determination of Parameters of the Air-Void System in Hardened Concrete. ASTM International: Conshohocken, PA, USA, 2012.
- Jakobsen, U.; Pade, C.; Thaulow, N.; Brown, D.; Sahu, S.; Magnusson, O.; De Buck, S.; De Schutter, G. Automated air void analysis of hardened concrete: A round robin study. Cem. Concr. Res. 2006, 36, 1444–1452. [Google Scholar] [CrossRef]
- Du, P.; Yao, Y.; Wang, L.; Xu, D.; Zhou, Z.; Sun, J.; Cheng, X. Using strain to evaluate the influence of air content on frost resistance of concrete. Cold Reg. Sci. Technol. 2018, 157, 21–29. [Google Scholar] [CrossRef]
- Kaufmann, J.P. Experimental identification of ice formation in small concrete pores. Cem. Concr. Res. 2004, 34, 1421–1427. [Google Scholar]
- Coussy, O.; Monteiro, P.J.M. Poroelastic model for concrete exposed to freezing temperatures. Cem. Concr. Res. 2008, 38, 40–48. [Google Scholar] [CrossRef]
- Piltner, R.; Monteiro, P.J.M. Stress analysis of expansive reactions in concrete. Cem. Concr. Res. 2000, 30, 843–848. [Google Scholar] [CrossRef]
- Ma, D. Monitoring and Simulation of Internal Deformation of Concrete Under Freeze-Thaw Cycle; Harbin Institute of Technology: Harbin, China, 2016. [Google Scholar]


| SiO2 | Al2O3 | Fe2O3 | CaO | MgO | SO3 | Na2O | f-CaO | LOI |
|---|---|---|---|---|---|---|---|---|
| 20.82 | 4.40 | 3.27 | 63.34 | 2.88 | 2.42 | 0.59 | 0.87 | 0.02 |
| Density (g·cm−3) | Specific Surface Area (m2 kg−1) | Condensation Time/Min | Flexural Strength/MPa | Compressive Strength/MPa | |||||
|---|---|---|---|---|---|---|---|---|---|
| Condensation | Congeal | 3 d | 7 d | 28 d | 3 d | 7 d | 28 d | ||
| 3.11 | 352 | 123 | 188 | 5.5 | 7.0 | 9.1 | 27.4 | 36.6 | 53.1 |
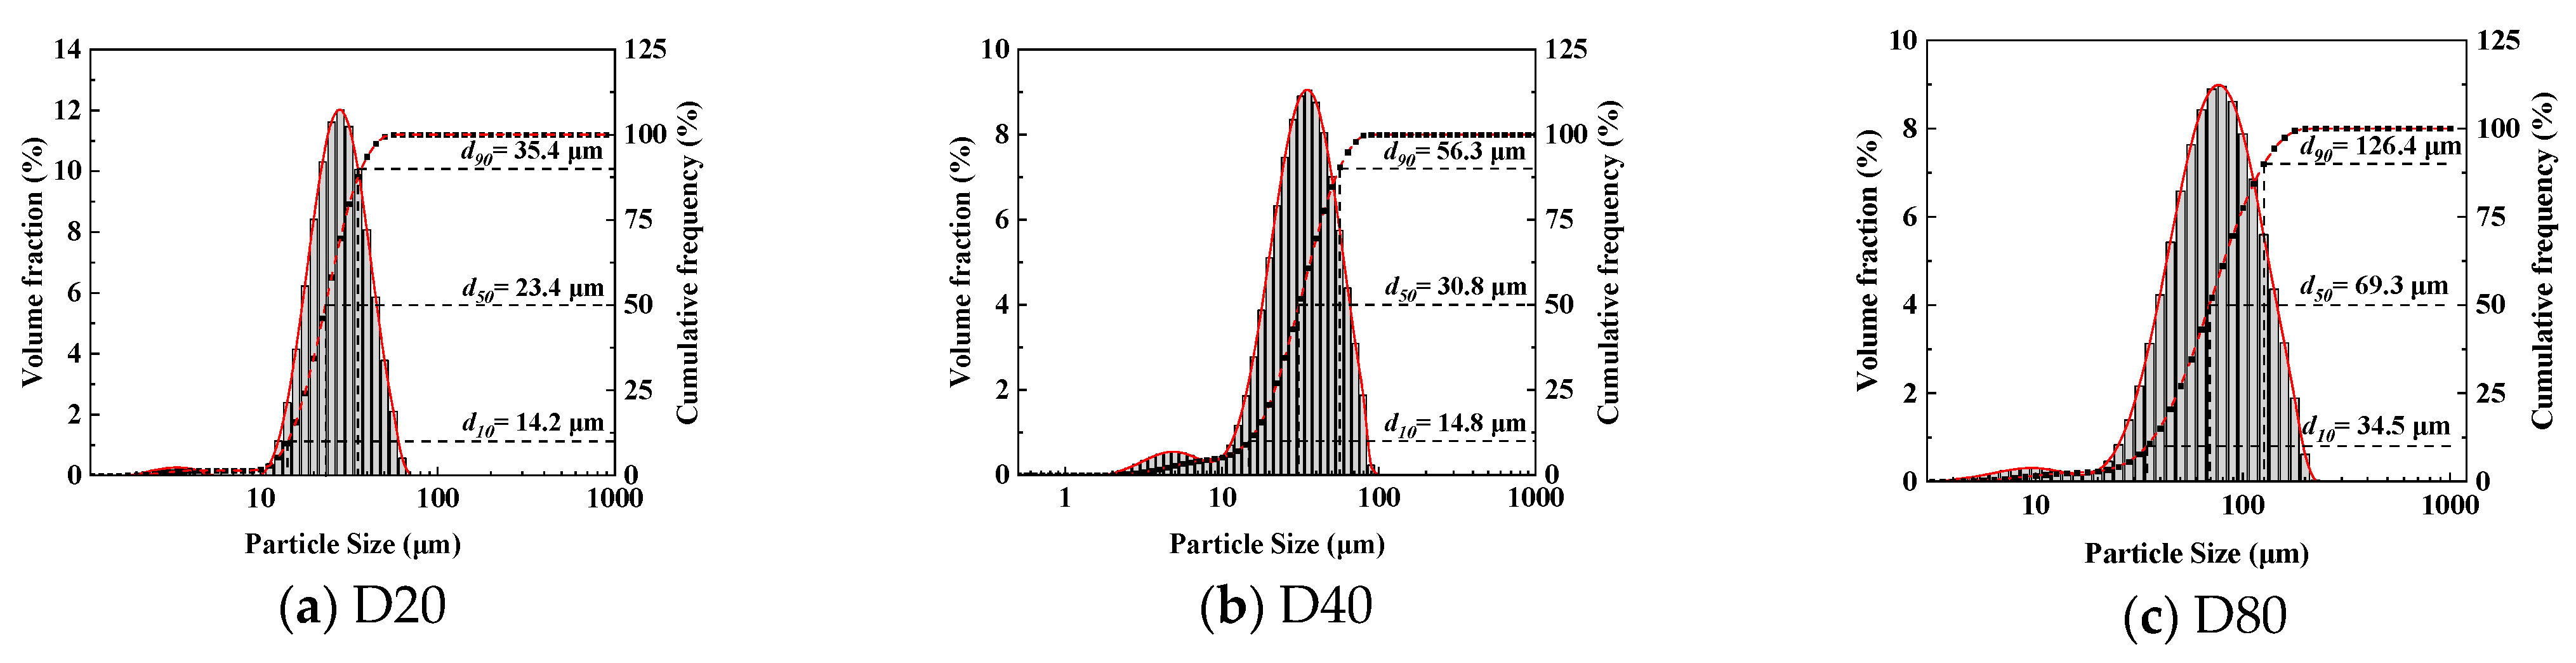
| Norm | Particle Size (μm) | True Density (kg/m3) | Solid Content (%) |
|---|---|---|---|
| D20 | 20 | 36 | 15 |
| D40 | 40 | 25 | 22 |
| D80 | 80 | 45 | 25 |
| WEA | Groups | Water/kg | Cement/kg | Sand/kg | Replacement Volume (%) | Dosage (g) | Target Gas Content (%) |
|---|---|---|---|---|---|---|---|
| D20 | D20-1% | 0.45 | 1.0 | 2.0 | 1 | 3.69 | 3 |
| D20-4% | 4 | 14.76 | 6 | ||||
| D20-7% | 7 | 25.83 | 9 | ||||
| D40 | D40-1% | 1 | 1.75 | 3 | |||
| D40-4% | 4 | 5.24 | 6 | ||||
| D40-7% | 7 | 12.23 | 9 | ||||
| D80 | D80-1% | 1 | 2.76 | 3 | |||
| D80-4% | 4 | 8.32 | 6 | ||||
| D80-7% | 7 | 19.36 | 9 |
Disclaimer/Publisher’s Note: The statements, opinions and data contained in all publications are solely those of the individual author(s) and contributor(s) and not of MDPI and/or the editor(s). MDPI and/or the editor(s) disclaim responsibility for any injury to people or property resulting from any ideas, methods, instructions or products referred to in the content. |
© 2025 by the authors. Licensee MDPI, Basel, Switzerland. This article is an open access article distributed under the terms and conditions of the Creative Commons Attribution (CC BY) license (https://creativecommons.org/licenses/by/4.0/).
Share and Cite
Li, L.; Ji, J.; Yu, L.; Luo, Z.; Zhang, P.; Niu, K. The Effect of Hollow Polymer Microspheres on the Pore Structure and Frost Resistance of Cement Mortar. Materials 2025, 18, 1644. https://doi.org/10.3390/ma18071644
Li L, Ji J, Yu L, Luo Z, Zhang P, Niu K. The Effect of Hollow Polymer Microspheres on the Pore Structure and Frost Resistance of Cement Mortar. Materials. 2025; 18(7):1644. https://doi.org/10.3390/ma18071644
Chicago/Turabian StyleLi, Lihui, Jianrui Ji, Lingfeng Yu, Zhihui Luo, Panpan Zhang, and Kaimin Niu. 2025. "The Effect of Hollow Polymer Microspheres on the Pore Structure and Frost Resistance of Cement Mortar" Materials 18, no. 7: 1644. https://doi.org/10.3390/ma18071644
APA StyleLi, L., Ji, J., Yu, L., Luo, Z., Zhang, P., & Niu, K. (2025). The Effect of Hollow Polymer Microspheres on the Pore Structure and Frost Resistance of Cement Mortar. Materials, 18(7), 1644. https://doi.org/10.3390/ma18071644