Article

Changes in Fluorescence of Aquatic Dissolved Organic Matter Induced by Plastic Debris

National Institute of R&D for Optoelectronics, INOE2000, Atomistilor 409, 077125 Magurele, Romania
*
Authors to whom correspondence should be addressed.
Materials 2025, 18(7), 1602; https://doi.org/10.3390/ma18071602
Submission received: 14 February 2025 / Revised: 21 March 2025 / Accepted: 31 March 2025 / Published: 1 April 2025
(This article belongs to the Special Issue Plastic Waste Management for Environmental Protection)

Abstract

:
Water contamination with plastic materials represents one of the most pressing environmental problems that the modern world is facing. In this context, the present paper aims to investigate the influence of fluorescent dissolved organic matter (FDOM) released by plastic materials on the aquatic bacterial fraction and evaluate the efficiency of fluorescence spectroscopy in identifying plastic FDOM in freshwater. To this purpose, river and tap water samples were contaminated in a controlled manner in the laboratory, and the water quality parameters and bacterial occurrence for these samples were determined using standard physico-chemical characterization methods: fluorescence spectroscopy, dynamic light scattering, and flow cytometry. The results revealed that plastic debris influenced the dissolved-particulate organic matter continuum, also affecting bacterial cell proliferation in both the river and tap samples. The study highlights that the impact of plastic FDOM on bacterial proliferation should not be taken lightly, while fluorescence spectroscopy proved to be an effective method for identifying the presence of plastic FDOM in water samples of various origins.

1. Introduction

Large amounts of plastic waste are continuously released into the environment, becoming a growing global threat [1]. Estimates show that in 2016, 11% of the global plastic waste reached aquatic ecosystems [2]. Large plastic waste enters freshwater systems through natural processes (such as wind or surface runoff) or through direct dumping [3]. Plastic waste is likely to accumulate in the system because most of the plastic polymers are non-biodegradable, and the main degradation mechanisms in water (solar radiation and thermal oxidation) are relatively slow in degrading plastic [1]. These mechanisms can break down plastic into small fragments and microplastics (particles < 5 mm), which may be ingested by aquatic animals, leading to starvation or changes in behaviour, reproduction, and growth [3]. Moreover, several additives can leach into the water with potential toxic effects on aquatic life [1,3,4]. Recent studies show that plastic can leach fluorescent dissolved organic matter (FDOM) [5,6,7,8,9,10,11,12,13]. FDOM is a heterogeneous mixture of compounds originating from natural and anthropogenic sources, and is ubiquitous to aquatic systems [14,15]. Few studies show that plastic-leached FDOM affects microbial communities [10,16,17,18]. However, studies that focus on commercially available plastic products have been scarce [7,16,19,20]. Commercial plastic products may turn into plastic litter and are likely to remain intact for decades [3] until they decompose into smaller and smaller fragments. Moreover, most of these studies focused only on the marine environment or engineered water systems. In order to expand knowledge on plastic FDOM, the aim of this study was to evaluate the release of FDOM from large plastic fragments—polystyrene and low-density polyethylene—into tap and river water samples with effluent intake. In particular, the study aimed to (1) assess the changes in FDOM leached from plastic in water samples, (2) determine the influence of plastic FDOM on the aquatic bacterial fraction, and (3) analyse the potential of using specific fluorescence peaks as indicators of plastic FDOM in freshwater.

2. Materials and Methods

2.1. Sample Preparation

Approximately 10 L of river samples were collected from the Ciorogarla River (Magurele, Romania, 44.33° N, 26.05° E) after a wastewater treatment plant release point. Ciorogarla Basin has a size of 149 km2 and collects wastewater effluents (with 12,500 PE) and untreated water that is illegally released into the river. It crosses mostly an agricultural area and flows into the Arges River. Ciorogarla samples were collected in February 2021, after a week free of precipitation. Also, 10 L of tap water were sampled after allowing the water to run for a few minutes. The samples were homogenized and divided into 7 identical samples in 1 L glass bottles. Sampling bottles were pre-cleaned with 2% RBS solution and thoroughly rinsed with distilled water. Bottles were also rinsed with the sampled river and tap water prior to collection. The samples were transported to the laboratory within 1 h of collection and allowed to reach room temperature before the addition of plastic debris. Samples were not filtered to preserve all DOM fractions.
Commercially available LDPE sandwich bags and PS coffee cup lids were used in the study. Ten PS coffee cup lids (11.90 g) and ten LDPE food bags (7.77 g) were added to each sample. Three replicates were prepared for each sample (3× River + PS, 3× Tap + PS, 3× River + LDPE, and 3× Tap + LDPE). One control sample (with no added plastic) was prepared for the tap and river sample sets. The samples were kept for 35 days at room temperature under normal light conditions (not under direct sunlight). The samples were gently shaken before each set of measurements. 10–15 mL of sample was extracted from each bottle for measurements in order to reduce the impact on the overall volume of the sample.

2.2. Standard Water Quality Parameters

Total organic carbon (TOC) was measured using the PF-12Plus photometer (Macherey-Nagel, Düren, Germany) and water quality testing kits from the same manufacturer. The measurements were performed according to the kit’s manufacturer instructions.

2.3. Dynamic Light Scattering

Dynamic light scattering (DLS) measurements were made using Zetasizer Nano ZS90 equipment (Malvern Instruments, Malvern, UK). The ZS90 is equipped with a 50 mW laser, having a wavelength of 532 nm, and the measurements were made at an angle of 90°. The narrow band filters that are part of the instrument improve the signal for fluorescent samples. Hydrodynamic size distribution measurements were performed at a temperature of 22 °C, with an equilibration time of 120 s. For each measurement, a disposable polypropylene cuvette was used. Each sample was measured in triplicate, without delays between measurements.

2.4. Flow Citometry

The flow cytometry (FCM) measurements were performed with a BD Accuri C6 Plus cytometer (BD Biosciences, San Jose, CA, USA), equipped with two lasers (blue—488 nm and red—640 nm), two scatter detectors, and four fluorescence detectors. In order to isolate the bacterial population, a staining protocol was applied for all of the samples. SYBR Green I (Sigma-Aldrich, St. Louis, MO, USA) and Propidium (PI) dyes (Sigma-Aldrich, St. Louis, MO, USA) were used according to the Eawag method [21] for assessing water quality. 1 mL of each sample was stained with 10 µL of SYBR Green I (10,000× dilution of DMSO stock solution) and 1 µL of PI (final concentration of 0.3 mM). After staining, each sample was kept in the dark at around 35 °C for 10 min. For each measurement, the following parameters were used: 50 µL of a volume of 500 µL, flow rate of 11 µL/min, core size of 5 µm, and threshold of 800 on FL1-H. For each sample, two-dimensional FL1-A (emission filter 533/30 nm) vs. FL3-A (emission filter > 670 nm) log-scale density plots were recorded. In order to separate low nucleic acid content (LNA) from high nucleic acid content (HNA), a BD Accuri C6 software (Version 1.0.23.1) template provided by BD Biosciences was used. Thus, the data acquisition was gated on the PFL1-A vs. FL3-A plots using a lower limit of 2000 on FL1. The bacterial cell gate included LNA and HNA bacteria. LNA bacteria are small and stain weakly with SYBR Green I, while HNA bacteria are large and stain brightly with SYBR Green I [21].

2.5. Fluorescence Spectroscopy

Fluorescence excitation–emission matrices (EEMs) (Figure S1) were recorded with a FP8200 spectrofluorometer (Jasco Corporation, Tokyo, Japan) using the following parameters: λexc/em = 200–500/240–550 nm, step 1 nm, slit 5 nm, integration time 20 msec. Raman spectra were recorded to check the stability of the instrument. Raman values varied between 36.92 a.u. and 38.53 a.u. (median value 37.34 a.u.). No inner filter correction was applied to the EEMs. The TOC value of the river sample was <20 mg/L and that of the tap water sample was <2 mg/L. According to past studies [22], the inner filter effect is unlikely to affect the fluorescence spectra of samples with TOC values below 25 mg/L. Fluorescence peaks were extracted from the blank corrected and Raman corrected EEMs [23] using the peak-picking method [24]. The following peaks were extracted: peak B (λexc/em = 230–240/300–310 nm), peak T230exc/em = 230–240/326–350 nm), peak T280exc/em = 270–282/328–350 nm), peak M (λexc/em = 290–310/370–420 nm), peak A (λexc/em = 230–238/400–424 nm), peak C (λexc/em = 310–350/400–450 nm). In addition, peaks described by Lee et al. [7] for plastic-derived FDOM were extracted as follows: H (λexc/em = 290/405 nm), L (λexc/em = 230/405 nm), P (λexc/em = 270/305 nm). Finally, peaks for optical brighteners were extracted according to Gandhimathi et al. [25]: 1,4-diphenylbutadiene (DPBD) (λexc/em = 330/375 nm), Uvitex-OB (UVX) (λexc/em = 375/425 nm), benzophenone (BPN) (λexc/em = 252/418 nm). The biological index (BIX), humification index (HIX), and the F450/500 index were calculated as recommended by Huguet et al. [26], Zsolnay et al. [27], and McKnight et al. [28], respectively.

2.6. Statistical Analysis

Statistical significance was determined using the Kruskal-Wallis H test, with a Nemenyi follow-up test (p < 0.01) [29]. The distribution of the data was considered non-normal (Shapiro-Wilk test, W = 0.995–0.656, p < 0.05).

3. Results and Discussions

3.1. Dynamic Light Scattering Data

DLS measurements revealed that for the control river sample, the average particle size doubled after the first 7 days of storage, increasing 4-fold by day 28 (Figure S2). The control tap water sample displayed an increase of only 31%, followed by a slow increase towards day 21 and a sudden decrease towards the end of the storage period. DOM polymers were shown to assemble into microgels up to an equilibrium size of 6 µm, which is the maximum size of the average DOM polymer chain length [30]. The tap water sample with added plastic displayed a different trend to the control sample, decreasing slightly towards day 35; however, a similar behaviour was observed between the LDPE and PS treatments. In the case of the river samples, only the PS sample showed increasing average particle size up to day 14, and decreased towards the end of the experiment. However, the River + LDPE sample displayed an almost constant average particle size during the entire period. Potentially due to the high surface size of LDPE bags compared to the fragments of the PS coffee cup lids, more particles adhered to LDPE surface. Thus, large plastic pieces may lead to a reduction in microgels as particles adhere to the plastic surface. These results potentially indicate that large plastic debris can disrupt the DOM to particulate organic matter (POM) continuum in a freshwater environment.

3.2. Impact of Plastic on Bacterial Cells Abundance and Behaviour

Cell abundance in the control tap sample increased slowly towards day 14 and showed a six-fold increase towards day 21 (Figure 1). For the Tap + LDPE sample, the cell abundance followed the same trend as the tap control sample but had lower values compared to control, while for the Tap + PS sample, cell abundance remained almost constant until day 28 and increased seven-fold towards day 35. The difference between datasets was not significant. However, these minor changes may indicate that plastic slightly delays or decreases cell proliferation. For example, Chen et al. [16] found that FDOM leached from plastic was toxic to a freshwater luminescent bacterium (Vibrio qinghaiensis Q67), while Mohamed et al. [31] showed that a plasticizer (di(2-ethylhexyl) terephthalate), found in polyvinyl chloride films can have a toxicity effect on gram positive bacteria (Rhodococcus ruber). Thus, substances leached from plastic can be toxic to certain bacteria. All of the river samples displayed the same decreasing trend throughout the experiment (Figure 1) and no significant impact from plastic on cell abundance was found.
The ratio between LNA and HNA may show the transition from a dormant to an actively growing bacterial community due to changes in the nutrient level in water systems [32,33]. While both LNA and HNA cells may be metabolically active, LNA cells may become dormant to withstand limited nutrient concentrations. HNA cells are more dynamic and sensitive to environmental changes compared to LNA cells [32,33]. Sharuddin et al. [32] suggested that an increase in HNA cells may come from LNA cells that are dormant in a limited nutrient environment, but which, in favourable conditions, may become fast growing cells with high DNA content. Consequently, these will be detected as HNA cells. The decrease in the LNA/HNA ratio for the control tap sample indicated an increase in HNA cells, potentially due to an increase in bacterial growth from storage at room temperature [34]. After 14 days of storage, the LNA/HNA ratio in the control sample showed a slight increase, potentially due to nutrient depletion. For the Tap + PS sample, the LNA/HNA ratio doubled within the first week of exposure, followed by an abrupt decrease towards day 21 to the level observed at the control sample. Potentially, in the first weeks of exposure to PS, bacterial growth was inhibited, while later the organic carbon that leached from plastic acted as a food source for microorganisms, leading to their activation. An abrupt decrease in the LNA/HNA ratio was observed in the case of the Tap + LDPE sample, suggesting that substances leaching from LDPE favoured bacterial growth immediately after exposure. Our results are supported by Romera-Castillo et al. [10], who showed that dissolved organic carbon (DOC) leaching from LDPE is consumed by microbes in water almost immediately after incubation. However, our results contradict the study of Harshvardan & Jha [35], who found that the metabolic activity of certain bacteria increased after 14 days of incubation with polyethylene. Although more studies on tap water are needed, the current results may have greater implications with regard to drinking water sources. As substances leaching from plastic act as food source and may increase bacterial growth, more intense water treatment may be needed for drinking water supply, increasing the cost of treatment processes. Left untreated, contaminated water may have a larger impact on the ecosystem and human health.
The river samples showed different trends compared to the tap samples with regard to the LNA/HNA ratio (Figure 1). The control sample showed that bacteria were relatively metabolically active until day 28, when a spike in the LNA/HNA ratio indicated a sudden drop in HNA cell content relative to LNA cells. The proportion of HNA cells dropped earlier in the River + PS sample compared to control sample. Previous studies showed that substances leaching from PS can be toxic and inhibit the growth of water microorganisms [36,37]. The River + LDPE sample showed a relatively constant LNA/HNA ratio throughout the experiment. These findings potentially indicate that microorganisms preferentially consume the existing food sources in nutrient rich waters and using leached DOC when nutrients become scarce in the environment. Also, active cells in the river sample may have adhered to plastic surfaces forming biofilm, which may have led to a constant LNA/HNA ratio in the LDPE samples. Urbanek et al. [38] and Oberbeckmann et al. [39] have investigated the formation of biofilm on PS and polyethylene, demonstrating that in cold marine water conditions, after a period of incubation of 2 weeks, the microplastics were covered in microbial assemblages. Our results show that plastics’ potential to disrupt microbial activity in water systems must not be underestimated considering the quantity of plastics that reach aquatic systems, and it warrants further analysis with a larger sample size compared to this study.

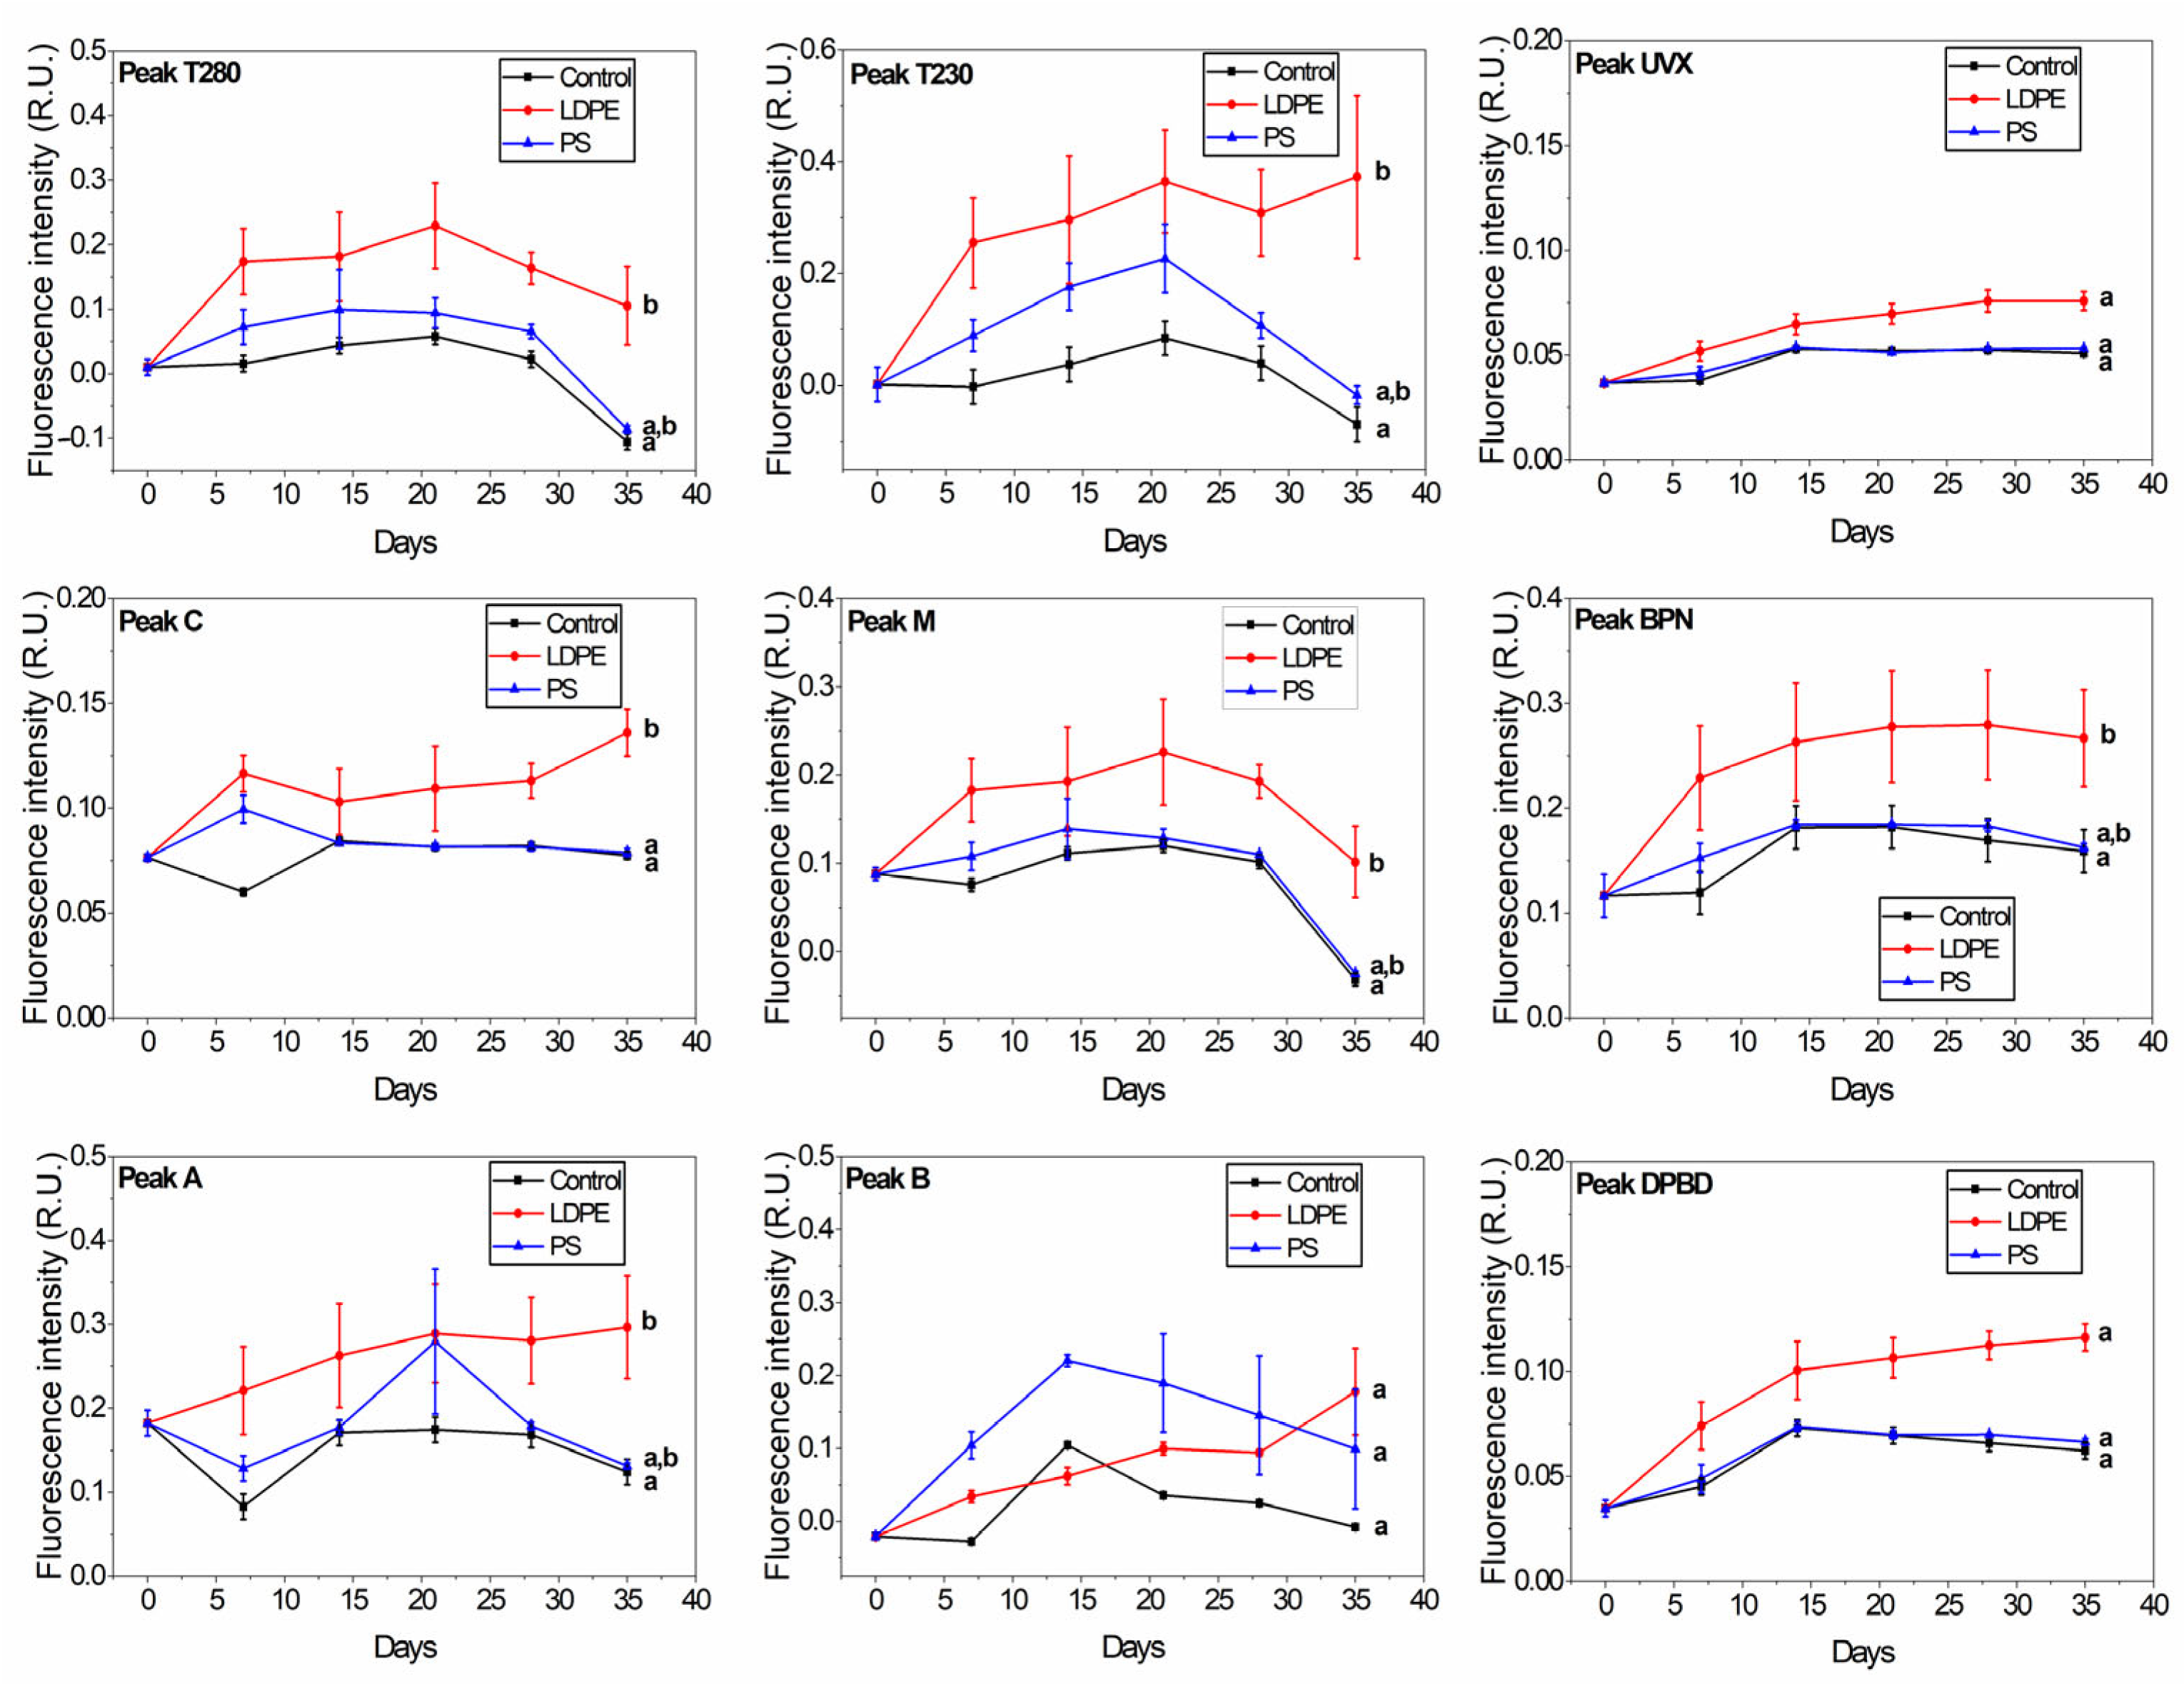
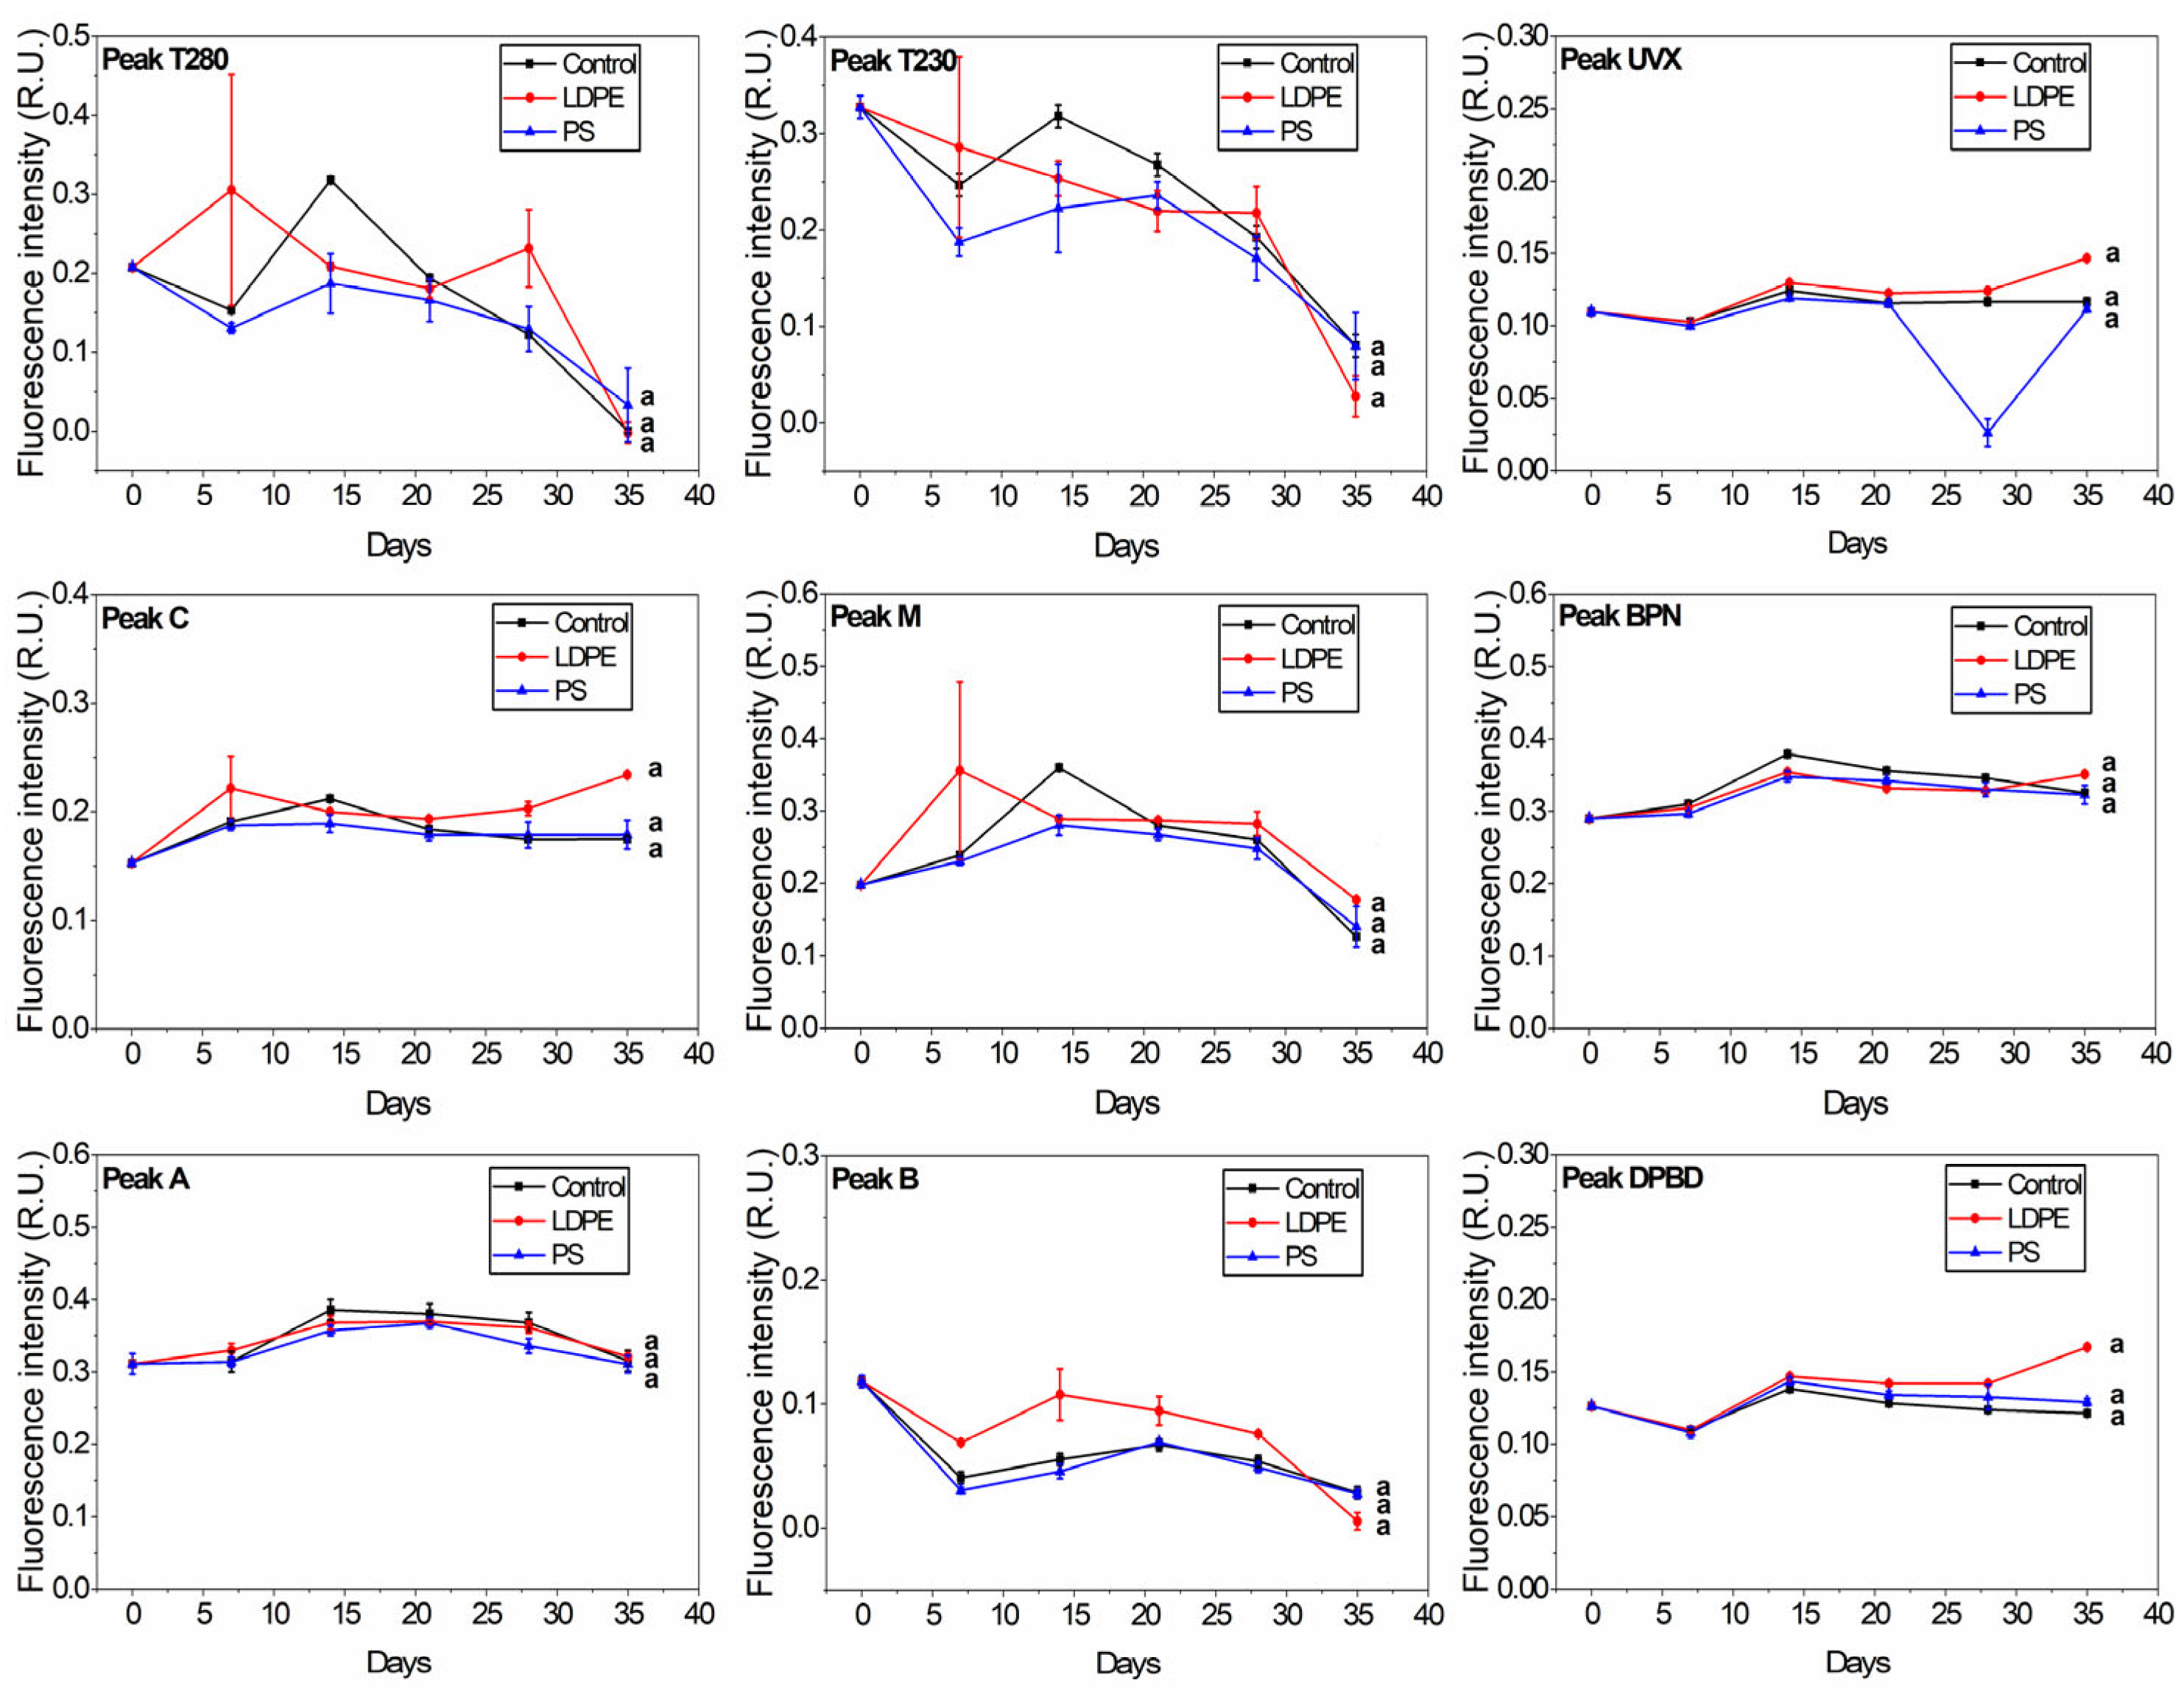
3.3. Plastic-Derived Fluorescent Dissolved Organic Matter

The EEMs showed the presence of nine peaks corresponding to the protein-like fraction (peaks B, T230 and T280), humic-like matter (peaks A, C and M), and optical brighteners-like matter (peaks BPN, DPBD and UVX). Tap water samples displayed significantly higher fluorescence intensity (p < 0.01) at all of the peaks when LDPE was added compared to control (Figure 2). Jacques and Poller [40] showed that the fluorescence of LDPE is due to α,β-unsaturated carbonyl compounds resulting from the oxidation of polymers. At the Tap + LDPE sample, peaks A and C showed a relatively continuous increase towards the end of the exposure period. Yan et al. [41] found that humic-like substances are preferentially released from MP-DOM with UV aging. Thus, the daily light conditions that the samples were exposed to in our study may have favoured the steady release of peaks A and C.
PS did not significantly increase the quantity of FDOM compared to the control sample, except for peak B. Peak B from the Tap + PS samples increased continuously for 14 days, followed by a drop towards day 21, arriving almost to the initial value by day 35. Peak B from the Tap +LDPE sample showed only a slight increase compared to the control, followed by a sudden increase from day 28 to day 35. Previous studies also proved that plastic releases FDOM in water in the peak B region [5,6,8,10,12,20,42,43,44] irrespective of plastic type. The fluorescence of this peak may originate from residual monomers and oligomers, and plastic additives that can leach from PS and LDPE. These substances were found to migrate from plastic packages [1]. Styrene oligomers were shown to leach from PS food packaging and coffee cups after contact with distilled water at room temperature [45,46,47]. Styrene displays fluorescence in the peak B range (λexc/em = 255/305 nm) [48]. Phenol was also found to migrate from PS in a solution of 20% ethanol [49]. Phenol displays fluorescence at ~290 nm when excited with 270 nm [50]. Zhao et al. [51] found that phenol has a peak at 304 nm; however, in a different solution. Peak B fluorescence may also indicate a contribution from the bisphenol A (BPA) additive. BPA migrates from PS and LDPE food containers into water [52,53] and displays fluorescence at around λexcn/em = 225/311 nm [8].
Tap + LDPE samples displayed a significantly different fluorescence signal compared to the control for the BPN peak (p < 0.01), and a slight, but non-significant difference for the DBPD and UVX peaks. DPBD, UVX, and BPN are optical brighteners that mask the yellow appearance of weathered plastic and provide a robust colour [25,54]. DPBD, in particular, was found to leach from LDPE plastic packages [25]. Optical brighteners absorb light in the range of 320–400 nm and emit between 400–480 nm [54]. The DPBD-like peak increased 3-fold from day 0 to day 35 in the case of the Tap + LDPE sample, and it was almost double in intensity compared to the Tap + PS and control samples. UVX-like and BPN-like peaks registered for the Tap + LDPE sample increased approximately 2-fold from day 0 to day 35. The lack of fluorescent DOM released from PS for these peaks may have been caused by the presence of TiO2. This component is added to plastic for a bright white appearance [54]. TiO2 exhibits an absorbance peak at 354 nm [55] and fluorescence emission at ~700 nm [56]. TiO2 competes with optical brighteners for UV light needed in order to function [54]. In addition, it may absorb the fluorescence emitted by peak C components.
River samples showed no significant difference between control, PS, and LDPE at any of the peaks (Figure 3). In general, the fluorescence of the protein-like peaks (B, T230, and T280) decreases with storage over long periods [57] due to bacterial degradation and humic-like matter formation. Peaks B and T230 degradation was slightly lower in the River + LDPE sample towards day 35. Oberbeckmann et al. [39] found differences between PE and PS microbial assemblages depending on the aquatic environment. They observed that differences were low with an increase in nutrient levels. This may explain the differences in FDOM between the river and tap samples in response to plastic addition. Moreover, DOC leached from plastics may have been used as a food source by the microbial fraction in the river samples, as shown by the flow cytometry data.
Most of the fluorescence indices did not show significant differences between the control and plastic treatments for the tap and river samples (Figure S3). A significant difference (p < 0.01) was observed at the T/C ratio between the Tap + LDPE sample and the other two samples. HIX values were significantly different (p < 0.01) for Tap + PS compared to the other samples. This highlights the influence of phenol-like components at peak T fluorescence, in particular those released by LDPE. Fluorescence index F450/500 showed significant differences between River + LDPE and the other samples (Figure S3). This difference was not observed by analysing the individual peaks—DPDB, UVX, and BNP (Figure 3)—which suggests that other compounds may be released by LDPE.

4. Conclusions

This study indicated that plastic debris changed the characteristics and composition of aquatic FDOM. The increase in fluorescence intensity suggested the migration of residual monomers, oligomers, and optical brighteners from plastic debris into water samples. Leaching plastic substances did not significantly affect cell abundance, but changed the content of LNA and HNA cells. In samples with low organic matter content, such as tap water, the substances from LDPE may have acted as food sources, activating dormant cells, while PS may have inhibited bacterial growth in the first weeks of exposure. In river water samples, the data suggested that microorganisms may have preferentially consumed existing food sources. They potentially switched to LDPE-leached substances or became inactive in the case of PS samples when the other food sources were depleted. The data also indicated that FDOM may have adhered to the surface of plastic, in particular to LDPE. The changes in FDOM were significantly different in the samples with low background FDOM, such as the tap water samples. In these samples, LDPE released significantly higher quantities of FDOM compared to PS. In the case of the river samples, no significant differences were observed between the control, PS, and LDPE samples; thus, a full analysis of fluorescence peaks and indices was needed to identify the changes in FDOM induced by plastic debris in water.

Supplementary Materials

The following supporting information can be downloaded at: https://www.mdpi.com/article/10.3390/ma18071602/s1, excel file “All data” containing all used data and “Supplementary material” containing Figure S1: Fluorescence excitation-emission matrices for control day 0, control day 14, Tap + LDPE day 14, River + LDPE day 14, Tap + PS day 14, River + PS day 14; Figure S2: The average hydrodynamic size distribution for the river and tap water samples. Parameters that present the same letter are not significantly different at p < 0.01; Figure S3: Changes in fluorescence index values for tap and river samples exposed to PS and LDPE. The groups indicated with the same letter indicate that they are not significantly different (p < 0.01).

Author Contributions

Conceptualization, E.M.C., C.L.P., S.I.D. and D.S.; methodology, C.L.P., S.I.D. and E.M.C.; validation, E.M.C.; investigation, E.M.C., C.L.P. and S.I.D.; resources, D.S.; data curation, E.M.C.; writing—original draft preparation, C.L.P. and E.M.C.; writing—review & editing, E.M.C., C.L.P., S.I.D. and D.S.; supervision, E.M.C. and D.S.; project administration, D.S.; funding acquisition, D.S. and E.M.C. All authors have read and agreed to the published version of the manuscript.

Funding

This research was funded by the Romanian National Research Authority, Ministry of Education and Research, and the Ministry of European Investment and Projects, grant number OPTRONICA VII PN23 05 (11N/2023) and 152/2016, SMIS 108109.

Institutional Review Board Statement

Not applicable.

Informed Consent Statement

Not applicable.

Data Availability Statement

The original contributions presented in this study are included in the Supplementary Materials. Further inquiries can be directed to the corresponding authors.

Conflicts of Interest

The authors declare no conflicts of interest.

References

  1. Hahladakis, J.N.; Velis, C.A.; Weber, R.; Iacovidou, E.; Purnell, P. An Overview of Chemical Additives Present in Plastics: Migration, Release, Fate and Environmental Impact during Their Use, Disposal and Recycling. J. Hazard. Mater. 2018, 344, 179–199. [Google Scholar] [CrossRef] [PubMed]
  2. Borrelle, S.B.; Ringma, J.; Law, K.L.; Monnahan, C.C.; Lebreton, L.; Mcgivern, A.; Murphy, E.; Jambeck, J.; Leonard, G.H.; Hilleary, M.A.; et al. Predicted Growth in Plastic Waste Exceeds Efforts to Mitigate Plastic Pollution. Science 2020, 369, 1515–1518. [Google Scholar] [CrossRef] [PubMed]
  3. van Emmerik, T.; Schwartz, A. Plastic Debris in Rivers. WIREs Water 2020, 7, e1398. [Google Scholar] [CrossRef]
  4. Schmidt, N.; Castro-Jiménez, J.; Fauvelle, V.; Ourgaud, M.; Sempéré, R. Occurrence of Organic Plastic Additives in Surface Waters of the Rhône River (France). Environ. Pollut. 2020, 257, 113637. [Google Scholar] [CrossRef]
  5. Agostino, A.; Rao, N.R.H.; Paul, S.; Zhang, Z.; Leslie, G.; Le-Clech, P.; Henderson, R. Polymer Leachates Emulate Naturally Derived Fluorescent Dissolved Organic Matter: Understanding and Managing Sample Container Interferences. Water Res. 2021, 204, 117614. [Google Scholar] [CrossRef]
  6. Chen, C.; Du, R.; Tang, J.; Wang, B.; Li, F.; Zhang, Z.; Yu, G. Characterization of Microplastic-Derived Dissolved Organic Matter in Freshwater: Effects of Light Irradiation and Polymer Types. Environ. Int. 2024, 185, 108536. [Google Scholar] [CrossRef]
  7. Lee, Y.K.; Hong, S.; Hur, J. A Fluorescence Indicator for Source Discrimination between Microplastic-Derived Dissolved Organic Matter and Aquatic Natural Organic Matter. Water Res. 2021, 207, 117833. [Google Scholar] [CrossRef]
  8. Lee, Y.K.; Romera-Castillo, C.; Hong, S.; Hur, J. Characteristics of Microplastic Polymer-Derived Dissolved Organic Matter and Its Potential as a Disinfection Byproduct Precursor. Water Res. 2020, 175, 115678. [Google Scholar] [CrossRef]
  9. Luo, H.; Xiang, Y.; He, D.; Li, Y.; Zhao, Y.; Wang, S.; Pan, X. Leaching Behavior of Fluorescent Additives from Microplastics and the Toxicity of Leachate to Chlorella Vulgaris. Sci. Total Environ. 2019, 678, 1–9. [Google Scholar] [CrossRef]
  10. Romera-Castillo, C.; Pinto, M.; Langer, T.M.; Álvarez-Salgado, X.A.; Herndl, G.J. Dissolved Organic Carbon Leaching from Plastics Stimulates Microbial Activity in the Ocean. Nat. Commun. 2018, 9, 1430. [Google Scholar] [CrossRef]
  11. Wang, Q.; Gu, W.; Chen, H.; Wang, S.; Hao, Z. Molecular Properties of Dissolved Organic Matter Leached from Microplastics during Photoaging Process. J. Hazard. Mater. 2024, 480, 136154. [Google Scholar] [CrossRef] [PubMed]
  12. Wasswa, J.; Mladenov, N.; Pearce, W. Assessing the Potential of Fluorescence Spectroscopy to Monitor Contaminants in Source Waters and Water Reuse Systems. Environ. Sci. Water Res. Technol. 2019, 5, 370–382. [Google Scholar] [CrossRef]
  13. Zhang, J.; Huo, X.; Zhang, K.; Deng, Y.; Xiao, Q.; Gao, Y.; Zhou, X.; Yan, B. Deciphering Fluorescent and Molecular Fingerprint of Dissolved Organic Matter Leached from Microplastics in Water. Water Res. 2024, 250, 121047. [Google Scholar] [CrossRef]
  14. Aiken, G.R. Fluorescence and Dissolved Organic Matter: A Chemist’s Perspective. In Aquatic Organic Matter Fluorescence; Coble, P.G., Lead, J.R., Baker, A., Reynolds, D.M., Spencer, R.G.M., Eds.; Cambridge University Press: New York, NY, USA, 2014; pp. 35–75. ISBN 978-0-521-76461-2. [Google Scholar]
  15. Hudson, N.; Baker, A.; Reynolds, D. Fluorescence Analysis of Dissolved Organic Matter in Natural, Waste and Polluted Waters—A Review. River Res. Appl. 2007, 23, 631–649. [Google Scholar] [CrossRef]
  16. Chen, J.; Wan, N.; Wang, D.; Zhang, W. Molecular Properties and Biotoxicity of Dissolved Organic Matter Leached from Microplastic (MP-DOM) during Typical Hydrothermal Treatment of Sewage Sludge. Sci. Total Environ. 2023, 892, 164548. [Google Scholar] [CrossRef]
  17. Romera-Castillo, C.; Mallenco-Fornies, R.; Saá-Yánez, M.; Álvarez-Salgado, X.A. Leaching and Bioavailability of Dissolved Organic Matter from Petrol-Based and Biodegradable Plastics. Mar. Environ. Res. 2022, 176, 105607. [Google Scholar] [CrossRef]
  18. Yang, X.; Zhou, Y.; Xia, R.; Liao, J.; Liu, J.; Yu, P. Microplastics and Chemical Leachates from Plastic Pipes Are Associated with Increased Virulence and Antimicrobial Resistance Potential of Drinking Water Microbial Communities. J. Hazard. Mater. 2024, 463, 132900. [Google Scholar] [CrossRef]
  19. Jin, Z.; Zhang, W.; Wang, X.; Liu, A.; Li, Z.; Bai, Y.; Wu, F. Leaching Behaviors of Dissolved Organic Matter from Face Masks Revealed by Fluorescence EEM Combined with FRI and PARAFAC. Water Res. 2024, 254, 121399. [Google Scholar] [CrossRef]
  20. Lee, Y.K.; He, W.; Guo, H.; Karanfil, T.; Hur, J. Effects of Organic Additives on Spectroscopic and Molecular-Level Features of Photo-Induced Dissolved Organic Matter from Microplastics. Water Res. 2023, 242, 120272. [Google Scholar] [CrossRef]
  21. Gatza, E.; Hammes, F.; Prest, E. Assessing Water Quality with the BD AccuriTM C6 Flow Cytometer. BD Biosciences White Paper 2013. Available online: https://www.bdbiosciences.com/content/dam/bdb/marketing-documents/Accuri-C6-DS-Eawag-Water-Quality-Template.pdf (accessed on 1 September 2022).
  22. Hudson, N.; Baker, A.; Ward, D.; Reynolds, D.M.; Brunsdon, C.; Carliell-Marquet, C.; Browning, S. Can Fluorescence Spectrometry Be Used as a Surrogate for the Biochemical Oxygen Demand (BOD) Test in Water Quality Assessment? An Example from South West England. Sci. Total Environ. 2008, 391, 149–158. [Google Scholar] [CrossRef]
  23. Lawaetz, A.J.; Stedmon, C.A. Fluorescence Intensity Calibration Using the Raman Scatter Peak of Water. Appl. Spectrosc. 2009, 63, 936–940. [Google Scholar] [CrossRef] [PubMed]
  24. Coble, P.G.; Spencer, R.G.M.; Baker, A.; Reynolds, D.M. Aquatic Organic Matter Fluorescence. In Aquatic Organic Matter Fluorescence; Coble, P.G., Lead, J., Baker, A., Reynolds, D.M., Spencer, R.G.M., Eds.; Cambridge University Press: New York, NY, USA, 2014; pp. 75–122. ISBN 978-0-521-76461. [Google Scholar]
  25. Gandhimathi, M.; Murugavel, K.; Ravi, T. Migration Study of Optical Brighteners from Polymer Packing Materials to Jam Squeeze and Fruit Drink by Spectrofluorimetry and RP-HPLC Methods. J. Food Sci. Technol. 2014, 51, 1133–1139. [Google Scholar] [CrossRef] [PubMed]
  26. Huguet, A.; Vacher, L.; Relexans, S.; Saubusse, S.; Froidefond, J.M.; Parlanti, E. Properties of Fluorescent Dissolved Organic Matter in the Gironde Estuary. Org. Geochem. 2009, 40, 706–719. [Google Scholar] [CrossRef]
  27. Zsolnay, A.; Baigar, E.; Jimenez, M.; Steinweg, B.; Saccomandi, F. Differentiating with Fluorescence Spectroscopy the Sources of Dissolved Organic Matter in Soils Subjected to Drying. Chemosphere 1999, 38, 45–50. [Google Scholar] [CrossRef]
  28. McKnight, D.M.; Boyer, E.W.; Westerhoff, P.K.; Doran, P.T.; Kulbe, T.; Andersen, D.T. Spectrofluorometric Characterization of Dissolved Organic Matter for Indication of Precursor Organic Material and Aromaticity. Limnol. Oceanogr. 2001, 46, 38–48. [Google Scholar] [CrossRef]
  29. Zaiontz, C. Real Statistics Resource Pack 2023. Available online: https://real-statistics.com/free-download/real-statistics-resource-pack/ (accessed on 21 March 2024).
  30. Shiu, R.F.; Vazquez, C.I.; Tsai, Y.Y.; Torres, G.V.; Chen, C.S.; Santschi, P.H.; Quigg, A.; Chin, W.C. Nano-Plastics Induce Aquatic Particulate Organic Matter (Microgels) Formation. Sci. Total Environ. 2020, 706, 135681. [Google Scholar] [CrossRef]
  31. Mohamed, D.F.M.S.; Tarafdar, A.; Lee, S.Y.; Oh, H.B.; Kwon, J.-H. Assessment of Biodegradation and Toxicity of Alternative Plasticizer Di(2-Ethylhexyl) Terephthalate: Impacts on Microbial Biofilms, Metabolism, and Reactive Oxygen Species-Mediated Stress Response. Environ. Pollut. 2024, 355, 124217. [Google Scholar] [CrossRef]
  32. Sharuddin, S.S.; Ramli, N.; Mohd-Nor, D.; Hassan, M.A.; Maeda, T.; Shirai, Y.; Sakai, K.; Tashiro, Y. Shift of Low to High Nucleic Acid Bacteria as a Potential Bioindicator for the Screening of Anthropogenic Effects in a Receiving River Due to Palm Oil Mill Effluent Final Discharge. Ecol. Indic. 2018, 85, 79–84. [Google Scholar] [CrossRef]
  33. Santos, M.; Oliveira, H.; Pereira, J.L.; Pereira, M.J.; Gonçalves, F.J.M.; Vidal, T. Flow Cytometry Analysis of Low/High DNA Content (LNA/HNA) Bacteria as Bioindicator of Water Quality Evaluation. Ecol. Indic. 2019, 103, 774–781. [Google Scholar] [CrossRef]
  34. Burkowska-But, A.; Kalwasińska, A.; Swiontek Brzezinska, M. Bacterial Growth and Biofilm Formation in Household-Stored Groundwater Collected from Public Wells. J. Water Health 2015, 13, 353–361. [Google Scholar] [CrossRef]
  35. Harshvardhan, K.; Jha, B. Biodegradation of Low-Density Polyethylene by Marine Bacteria from Pelagic Waters, Arabian Sea, India. Mar. Pollut. Bull. 2013, 77, 100–106. [Google Scholar] [CrossRef] [PubMed]
  36. Zimmermann, L.; Bartosova, Z.; Braun, K.; Oehlmann, J.; Völker, C.; Wagner, M. Plastic Products Leach Chemicals That Induce In Vitro Toxicity under Realistic Use Conditions. Environ. Sci. Technol. 2021, 55, 11814–11823. [Google Scholar] [CrossRef] [PubMed]
  37. Schiavo, S.; Oliviero, M.; Chiavarini, S.; Dumontet, S.; Manzo, S. Polyethylene, Polystyrene, and Polypropylene Leachate Impact upon Marine Microalgae Dunaliella Tertiolecta. J. Toxicol. Environ. Health Part A 2021, 84, 249–260. [Google Scholar] [CrossRef]
  38. Urbanek, A.K.; Rymowicz, W.; Mirończuk, A.M. Degradation of Plastics and Plastic-Degrading Bacteria in Cold Marine Habitats. Appl. Microbiol. Biotechnol. 2018, 102, 7669–7678. [Google Scholar] [CrossRef]
  39. Oberbeckmann, S.; Kreikemeyer, B.; Labrenz, M. Environmental Factors Support the Formation of Specific Bacterial Assemblages on Microplastics. Front. Microbiol. 2018, 8, 2709. [Google Scholar] [CrossRef]
  40. Jacques, P.P.L.; Poller, R.C. Fluorescence of Polyolefins-2. Use of Model Compounds to Identify Fluorescent Species in Thermally Degraded Polymers. Eur. Polym. J. 1993, 29, 83–89. [Google Scholar] [CrossRef]
  41. Yan, C.; Wang, X.; Nie, M.; Mo, X.; Ding, M.; Chen, J.; Yang, Y. Characteristics of Microplastic-Derived Dissolved Organic Matter and Its Binding with Pharmaceuticals Unveiled by Fluorescence Spectroscopy and Two-Dimensional Correlation Spectroscopy. Sci. Total Environ. 2024, 908, 168190. [Google Scholar] [CrossRef]
  42. Choi, N.E.; Lee, Y.K.; Oh, H.; Hur, J. Photo-Induced Leaching Behaviors and Biodegradability of Dissolved Organic Matter from Microplastics and Terrestrial-Sourced Particles. Chemosphere 2024, 355, 141826. [Google Scholar] [CrossRef]
  43. Luo, W.; Su, L.; Craig, N.J.; Du, F.; Wu, C.; Shi, H. Comparison of Microplastic Pollution in Different Water Bodies from Urban Creeks to Coastal Waters. Environ. Pollut. 2019, 246, 174–182. [Google Scholar] [CrossRef]
  44. Spagnuolo, M.L.; Marini, F.; Sarabia, L.A.; Ortiz, M.C. Migration Test of Bisphenol A from Polycarbonate Cups Using Excitation-Emission Fluorescence Data with Parallel Factor Analysis. Talanta 2017, 167, 367–378. [Google Scholar] [CrossRef]
  45. Ahmad, M.; Bajahlan, A.S. Leaching of Styrene and Other Aromatic Compounds in Drinking Water from PS Bottles. J. Environ. Sci. 2007, 19, 421–426. [Google Scholar] [CrossRef]
  46. Sanagi, M.; Ling, S.; Nasir, Z.; Wan Ibrahim, W.; Abu Naim, A. Determination of Residual Volatile Organic Compounds Migrated from Polystyrene Food Packaging into Food Simulant by Headspace Solid Phase Microextraction-Gas Chromatography. Malays. J. Anal. Sci. 2005, 9, 542–551. [Google Scholar]
  47. Tawfik, M.S.; Huyghebaert, A. Polystyrene Cups and Containers: Styrene Migration. Food Addit. Contam. 1998, 15, 592–599. [Google Scholar] [CrossRef]
  48. Zhou, Y.; Li, J.; Chen, F.; Ma, T.; Ni, Y. Study on the 3D Fluorescence Feature of Styrene and Emergent Treatment of Styrene Pollutant in Water. Guang Pu Xue Yu Guang Pu Fen Xi Guang Pu 2016, 36, 2169–2172. [Google Scholar]
  49. Pack, E.C.; Lee, K.Y.; Jung, J.S.; Jang, D.Y.; Kim, H.S.; Koo, Y.J.; Lee, H.G.; Kim, Y.S.; Lim, K.M.; Lee, S.H.; et al. Determination of the Migration of Plastic Additives and Non-Intentionally Added Substances into Food Simulants and the Assessment of Health Risks from Convenience Food Packaging. Food Packag. Shelf Life 2021, 30, 100736. [Google Scholar] [CrossRef]
  50. Tchaikovskaya, O.N.; Sokolova, I.V.; Kuznetsova, R.T.; Swetlichnyi, V.A.; Kopylova, T.N.; Mayer, G.V. Fluorescence Investigations of Phenol Phototransformation in Aqueous Solutions. J. Fluoresence 2000, 10, 403–408. [Google Scholar] [CrossRef]
  51. Zhao, X.; Li, Y.; Wang, J.; Ouyang, Z.; Li, J.; Wei, G.; Su, Z. Interactive Oxidation-Reduction Reaction for the in Situ Synthesis of Graphene-Phenol Formaldehyde Composites with Enhanced Properties. ACS Appl. Mater. Interfaces 2014, 6, 4254–4263. [Google Scholar] [CrossRef]
  52. Dopico-García, M.S.; López-Vilariño, J.M.; González-Rodríguez, M.V. Determination of Antioxidant Migration Levels from Low-Density Polyethylene Films into Food Simulants. J. Chromatogr. A 2003, 1018, 53–62. [Google Scholar] [CrossRef]
  53. Fasano, E.; Bono-Blay, F.; Cirillo, T.; Montuori, P.; Lacorte, S. Migration of Phthalates, Alkylphenols, Bisphenol A and Di(2-Ethylhexyl)Adipate from Food Packaging. Food Control 2012, 27, 132–138. [Google Scholar] [CrossRef]
  54. Jervis, D.A. Optical Brighteners: Improving the Colour of Plastics. Plast. Addit. Compd. 2003, 5, 42–46. [Google Scholar] [CrossRef]
  55. Ganapathi Rao, K.; Ashok, C.; Venkateswara Rao, K.; Shilpa Chakra, C.; Rajendar, V. Green Synthesis of TiO2 Nanoparticles Using Hibiscus Flower Extract. In International Conference on Emerging Technologies in Mechanical Sciences; Malla Reddy College of Engineering and Technology: Hyderabad, India, 2014; pp. 79–82. [Google Scholar]
  56. Huang, K.; Chen, L.; Deng, J.; Xiong, J. Enhanced Visible-Light Photocatalytic Performance of Nanosized Anatase TiO2 Doped with CdS Quantum Dots for Cancer-Cell Treatment. J. Nanomater. 2012, 2012, 720491. [Google Scholar] [CrossRef]
  57. Spencer, R.G.M.; Coble, P.G. Sampling Design for Organic Matter Fluorescence Analysis. In Aquatic Organic Matter Fluorescence; Coble, P.G., Lead, J.R., Baker, A., Reynolds, D.M., Spencer, R.G.M., Eds.; Cambridge University Press: New York, NY, USA, 2014; pp. 125–147. ISBN 978-0-521-76461-2. [Google Scholar]
Figure 1. Bacterial cell count and the LNA/HNA ratio for the river (control, River + LDPE, River + PS) and tap samples (control, Tap + LDPE, Tap + PS). The groups indicated with the same letter show that they are not significantly different (p < 0.01). HNA—high nucleic acid, LNA—low nucleic acid.
Materials 18 01602 g001
Figure 2. Changes in the release of plastic-derived FDOM in tap water samples (control, Tap + LDPE, Tap + PS). The peaks correspond to the protein-like fraction (peaks T230, T280 and B), humic-like matter (peaks A, C and M), and optical brighteners-like matter (peaks UVX, BPN and DPBD). The groups indicated with the same letter show that they are not significantly different (p < 0.01).
Materials 18 01602 g002
Figure 3. Changes in the release of plastic-derived FDOM in river water samples (control, River + LDPE, River + PS). The peaks correspond to the protein-like fraction (peaks T230, T280, and B), humic-like matter (peaks A, C, and M) and optical brighteners-like matter (peaks UVX, BPN, and DPBD). The groups indicated with the same letter show that they are not significantly different (p < 0.01).
Materials 18 01602 g003
Disclaimer/Publisher’s Note: The statements, opinions and data contained in all publications are solely those of the individual author(s) and contributor(s) and not of MDPI and/or the editor(s). MDPI and/or the editor(s) disclaim responsibility for any injury to people or property resulting from any ideas, methods, instructions or products referred to in the content.

