4.2. Influence of Machining Parameters on Surface Integrity
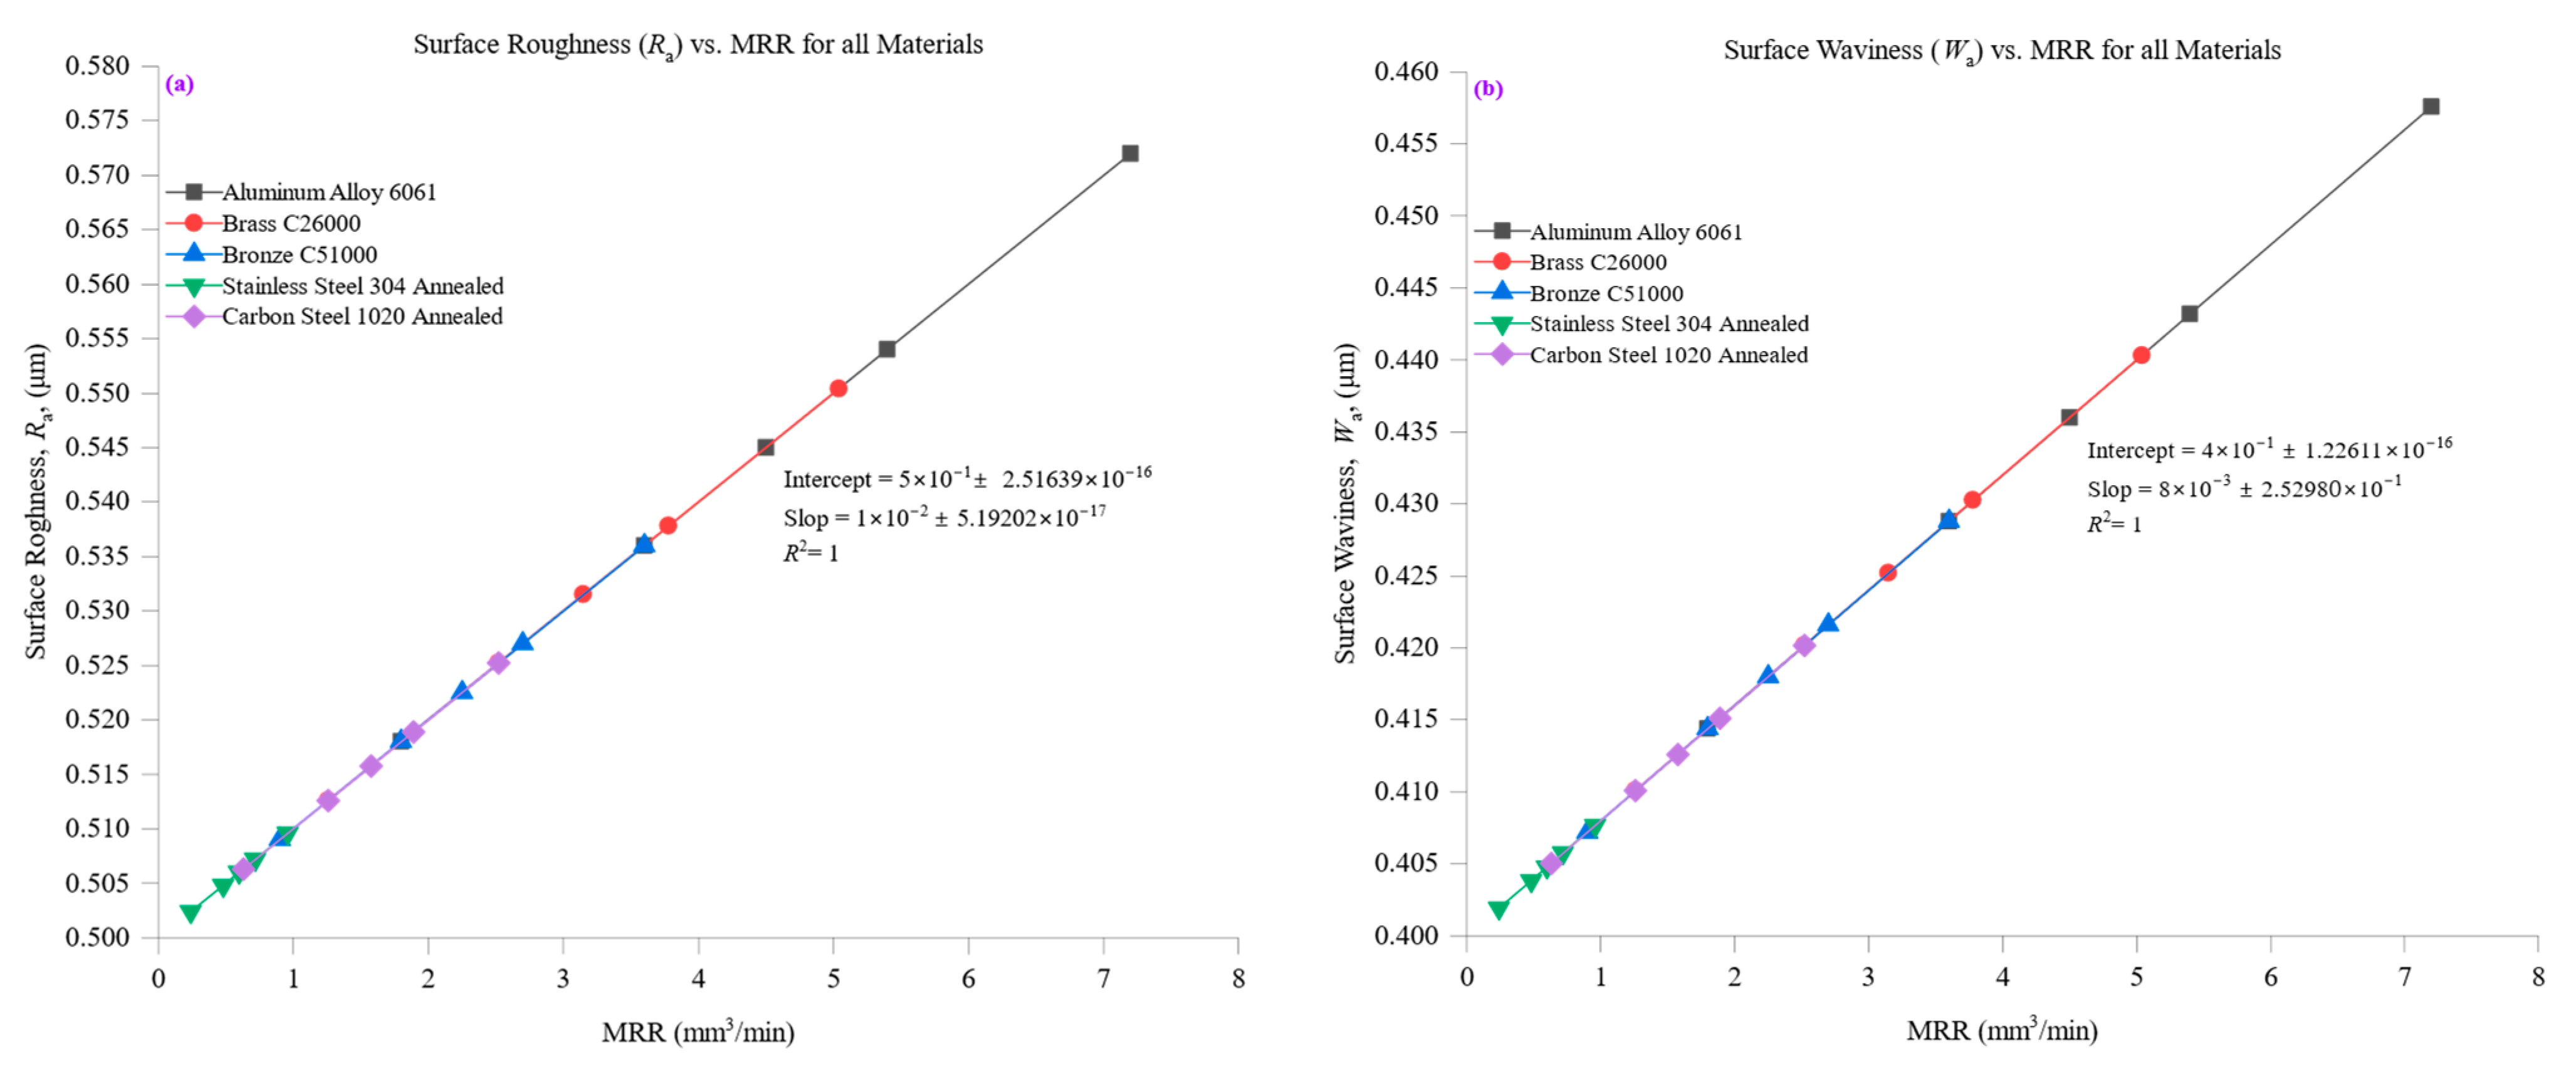
Figure 5a investigates the relationship between surface roughness (
Ra) and material removal rate (MRR) across the tested materials, revealing a trend where surface roughness tends to increase with MRR, although the rate of increase varies depending on material properties. Aluminum alloy 6061, known for its high thermal conductivity (205 W/m·K) and low hardness (95 HBW), demonstrated the lowest
Ra values across all MRR levels. At an MRR of 1.8 mm
3/min,
Ra measured approximately 0.518 µm, and even at the highest MRR of 7.2 mm
3/min,
Ra only increased slightly to 0.572 µm. The minimal variation in
Ra with increasing MRR indicates that aluminum maintains excellent surface integrity under varying cutting conditions. This behavior can be attributed to aluminum’s efficient heat dissipation, stabilizing cutting forces, and minimizing tool wear, which ensures consistent material removal with minimal surface degradation. Brass C26000 and bronze C51000, with intermediate thermal conductivities (109 W/m·K and 60 W/m·K, respectively) and moderate hardness values (115 HBW and 112 HBW), exhibited slightly higher
Ra values than aluminum but maintained stable surface conditions across different MRR levels. For brass,
Ra increased from 0.5126 µm at 1.26 mm
3/min to 0.5504 µm at 5.04 mm
3/min, while for bronze,
Ra rose from 0.509 µm at 0.9 mm
3/min to 0.536 µm at 3.6 mm
3/min. The controlled increase in roughness with higher MRR reflects their balanced machinability, as moderate thermal conductivity aids in heat dissipation while moderate hardness prevents excessive surface damage. Carbon steel 1020, with a thermal conductivity of 51 W/m·K and a hardness of 150 HBW, demonstrated an increase in
Ra from 0.5063 µm at an MRR of 0.63 mm
3/min to 0.5252 µm at 2.52 mm
3/min. The rise in roughness is more pronounced compared to aluminum, brass, and bronze, reflecting the influence of carbon steel’s higher cutting resistance and lower heat dissipation capacity. These factors lead to greater cutting forces and localized thermal buildup, promoting tool wear and surface irregularities and increasing
Ra at higher MRR values. Stainless steel 304, the hardest material tested (210 HBW) and the least thermally conductive (16 W/m·K), exhibited the highest
Ra values across all MRR levels. At an MRR of 0.24 mm
3/min,
Ra measured 0.5024 µm, increasing to 0.5096 µm at 0.96 mm
3/min. The relatively high increase in roughness with MRR highlights the challenges associated with machining stainless steel, where poor heat dissipation leads to excessive thermal stress and tool wear. These factors contribute to rougher surfaces as machining conditions become more aggressive.
Figure 5b extends this analysis to surface waviness (
Wa) and its relationship with MRR, revealing how large-scale surface undulations evolve with different machining conditions. Aluminum alloy 6061, with its high thermal conductivity and low hardness, exhibited the lowest
Wa values, maintaining excellent waviness control. At an MRR of 1.8 mm
3/min,
Wa was approximately 0.4144 µm, increasing only slightly to 0.4576 µm at the highest MRR of 7.2 mm
3/min. The small increase in
Wa demonstrates aluminum’s ability to maintain a smooth waviness profile even at high material removal rates, attributed to its efficient heat dissipation and low cutting resistance. Brass C26000 and bronze C51000 exhibited moderate increases in
Wa with rising MRR. Brass showed an increase from 0.41008 µm at 1.26 mm
3/min to 0.44032 µm at 5.04 mm
3/min, while bronze increased from 0.4072 µm at 0.9 mm
3/min to 0.4288 µm at 3.6 mm
3/min. These materials’ intermediate thermal conductivity helps mitigate excessive thermal buildup, resulting in relatively stable waviness profiles. However, their slightly higher hardness than aluminum leads to greater cutting resistance, contributing to a more noticeable increase in
Wa at higher MRR values. Carbon steel 1020, with its lower thermal conductivity and higher hardness, exhibited more significant increases in
Wa as MRR rose.
Wa values increased from 0.40504 µm at an MRR of 0.63 mm
3/min to 0.42016 µm at 2.52 mm
3/min. The increased waviness can be attributed to carbon steel’s higher cutting forces and reduced ability to dissipate heat, leading to greater surface deformation at higher material removal rates. Stainless steel 304, the hardest and least thermally conductive material, exhibited the highest
Wa values and the sharpest increase in waviness. At an MRR of 0.24 mm
3/min,
Wa measured 0.40192 µm, rising to 0.40768 µm at 0.96 mm
3/min. The rapid increase in
Wa with higher MRR is due to stainless steel’s poor thermal conductivity and high cutting resistance, which lead to pronounced cutting vibrations, tool wear, and uneven material removal. The resultant surface undulations are more significant, reflecting stainless steel’s tendency to develop higher waviness under aggressive machining conditions.
In summary,
Figure 5 emphasizes material properties’ fundamental influence on surface roughness and waviness during machining. Materials with high thermal conductivity and low hardness, such as aluminum alloy 6061, maintain stable surface quality with minimal increases in
Ra and
Wa across all MRR levels. In contrast, harder and less thermally conductive materials, such as stainless steel 304, experience substantial increases in both roughness and waviness due to greater thermal stress, cutting resistance, and tool wear. These findings underscore the necessity of optimizing machining parameters for different materials to achieve the best balance between productivity and surface quality.
Figure 6a provides a detailed evaluation of surface roughness (
Ra) at different cutting zones across the tested materials, shedding light on how material properties influence roughness progression. Aluminum alloy 6061, characterized by its high thermal conductivity (205 W/m·K) and low hardness (95 HBW), exhibited the lowest
Ra values across all cutting zones, maintaining a consistent roughness profile. The
Ra values ranged between 0.52 µm at the initial stage and 0.58 µm at later stages, with only a minimal increase over successive cutting zones. This stability is attributed to aluminum’s excellent heat dissipation, which prevents localized thermal stresses and ensures steady cutting performance. Its machinability allows for smoother material removal, producing a refined and consistent surface texture. Stainless steel 304, in contrast, demonstrated the highest surface roughness values across all cutting zones due to its low thermal conductivity (16 W/m·K) and high hardness (210 HBW). The initial
Ra values were around 0.92 µm but increased progressively, surpassing 1.0 µm at deeper cutting zones. High cutting resistance, rapid tool wear, and poor heat dissipation lead to more pronounced surface irregularities. The accumulation of thermal energy in the cutting region causes material hardening effects, further deteriorating surface quality and amplifying roughness variations between cutting zones. Intermediate materials, such as brass C26000 and bronze C51000, exhibited moderately roughness profiles. Brass, with a thermal conductivity of 109 W/m·K and hardness of 115 HBW, started with an
Ra of approximately 0.65 µm, which increased slightly as the cutting depth progressed. Bronze displayed a similar trend, beginning with an
Ra of about 0.71 µm and increasing modestly across cutting zones. These materials balance thermal dissipation and mechanical hardness, preventing excessive roughness while still demonstrating slight variations in texture. Carbon steel 1020, with a thermal conductivity of 51 W/m·K and a hardness of 150 HBW, displayed roughness characteristics between those of the softer alloys and harder stainless steel. The
Ra values were initially around 0.76 µm and increased slightly to approximately 0.8 µm at deeper cutting zones. While carbon steel exhibits higher cutting resistance than brass or bronze, its moderate machinability ensures relatively stable surface quality compared to stainless steel. Overall,
Figure 6a highlights that materials with high thermal conductivity and low hardness, such as aluminum, maintain smoother surfaces across all cutting zones due to efficient heat management and stable cutting conditions. Conversely, harder and less thermally conductive materials, like stainless steel, experience greater surface deterioration as cutting progresses, necessitating careful control of machining parameters to mitigate surface degradation.
Figure 6b investigates the evolution of surface waviness (
Wa) across different cutting zones, providing insights into the macroscopic surface undulations resulting from machining. The results reveal that materials with higher thermal conductivity and lower hardness exhibit significantly lower waviness levels, while harder and less thermally conductive materials develop more pronounced undulations as cutting progresses. Aluminum alloy 6061 exhibited the lowest
Wa values across all cutting zones, with an initial
Wa of approximately 0.4144 µm, which increased marginally to 0.4576 µm in later zones. The material’s high thermal conductivity facilitates efficient heat dissipation, reducing the likelihood of thermal distortions and ensuring stable cutting conditions. This results in minimal waviness variation, reflecting aluminum’s excellent machinability and ability to sustain consistent surface quality. Although stainless steel 304 did not exhibit the highest absolute
Wa values, it showed a relatively sharper response to cutting progression, with
Wa values increasing from approximately 0.4019 µm to 0.4077 µm. The material’s high hardness (210 HBW) and low thermal conductivity (16 W/m·K) lead to greater cutting forces and localized thermal stresses, promoting surface distortions and waviness amplification. The accumulation of heat near the cutting region results in increased tool wear and cutting instability, exacerbating the formation of macroscopic undulations. Intermediate materials, such as brass C26000 and bronze C51000, displayed moderate waviness characteristics. Brass exhibited an initial
Wa of around 1.06 µm, which increased slightly as the cutting process advanced. Bronze, with a slightly lower thermal conductivity than brass, followed a similar trend, with
Wa increasing from 1.12 µm to approximately 1.18 µm. Due to their mechanical properties and machining response, these materials maintain more stable waviness profiles than stainless steel but are not as smooth as aluminum. Carbon steel 1020 exhibited a moderate waviness progression, with
Wa values beginning at approximately 1.27 µm and increasing to around 1.36 µm. The material’s combination of intermediate hardness and thermal conductivity resulted in a more stable surface profile than stainless steel but one less uniform than aluminum. Heat accumulation during machining led to minor undulations, reflecting the material’s higher cutting resistance than softer alloys.
In summary,
Figure 6b emphasizes the significant influence of material properties on surface waviness at different cutting zones. Softer, highly conductive materials such as aluminum exhibit minimal waviness variations, while harder and less thermally conductive materials like stainless steel experience increasing waviness as machining progresses. These findings reinforce the importance of optimizing cutting conditions and tool selection to minimize surface waviness, particularly for harder materials with low thermal conductivity.
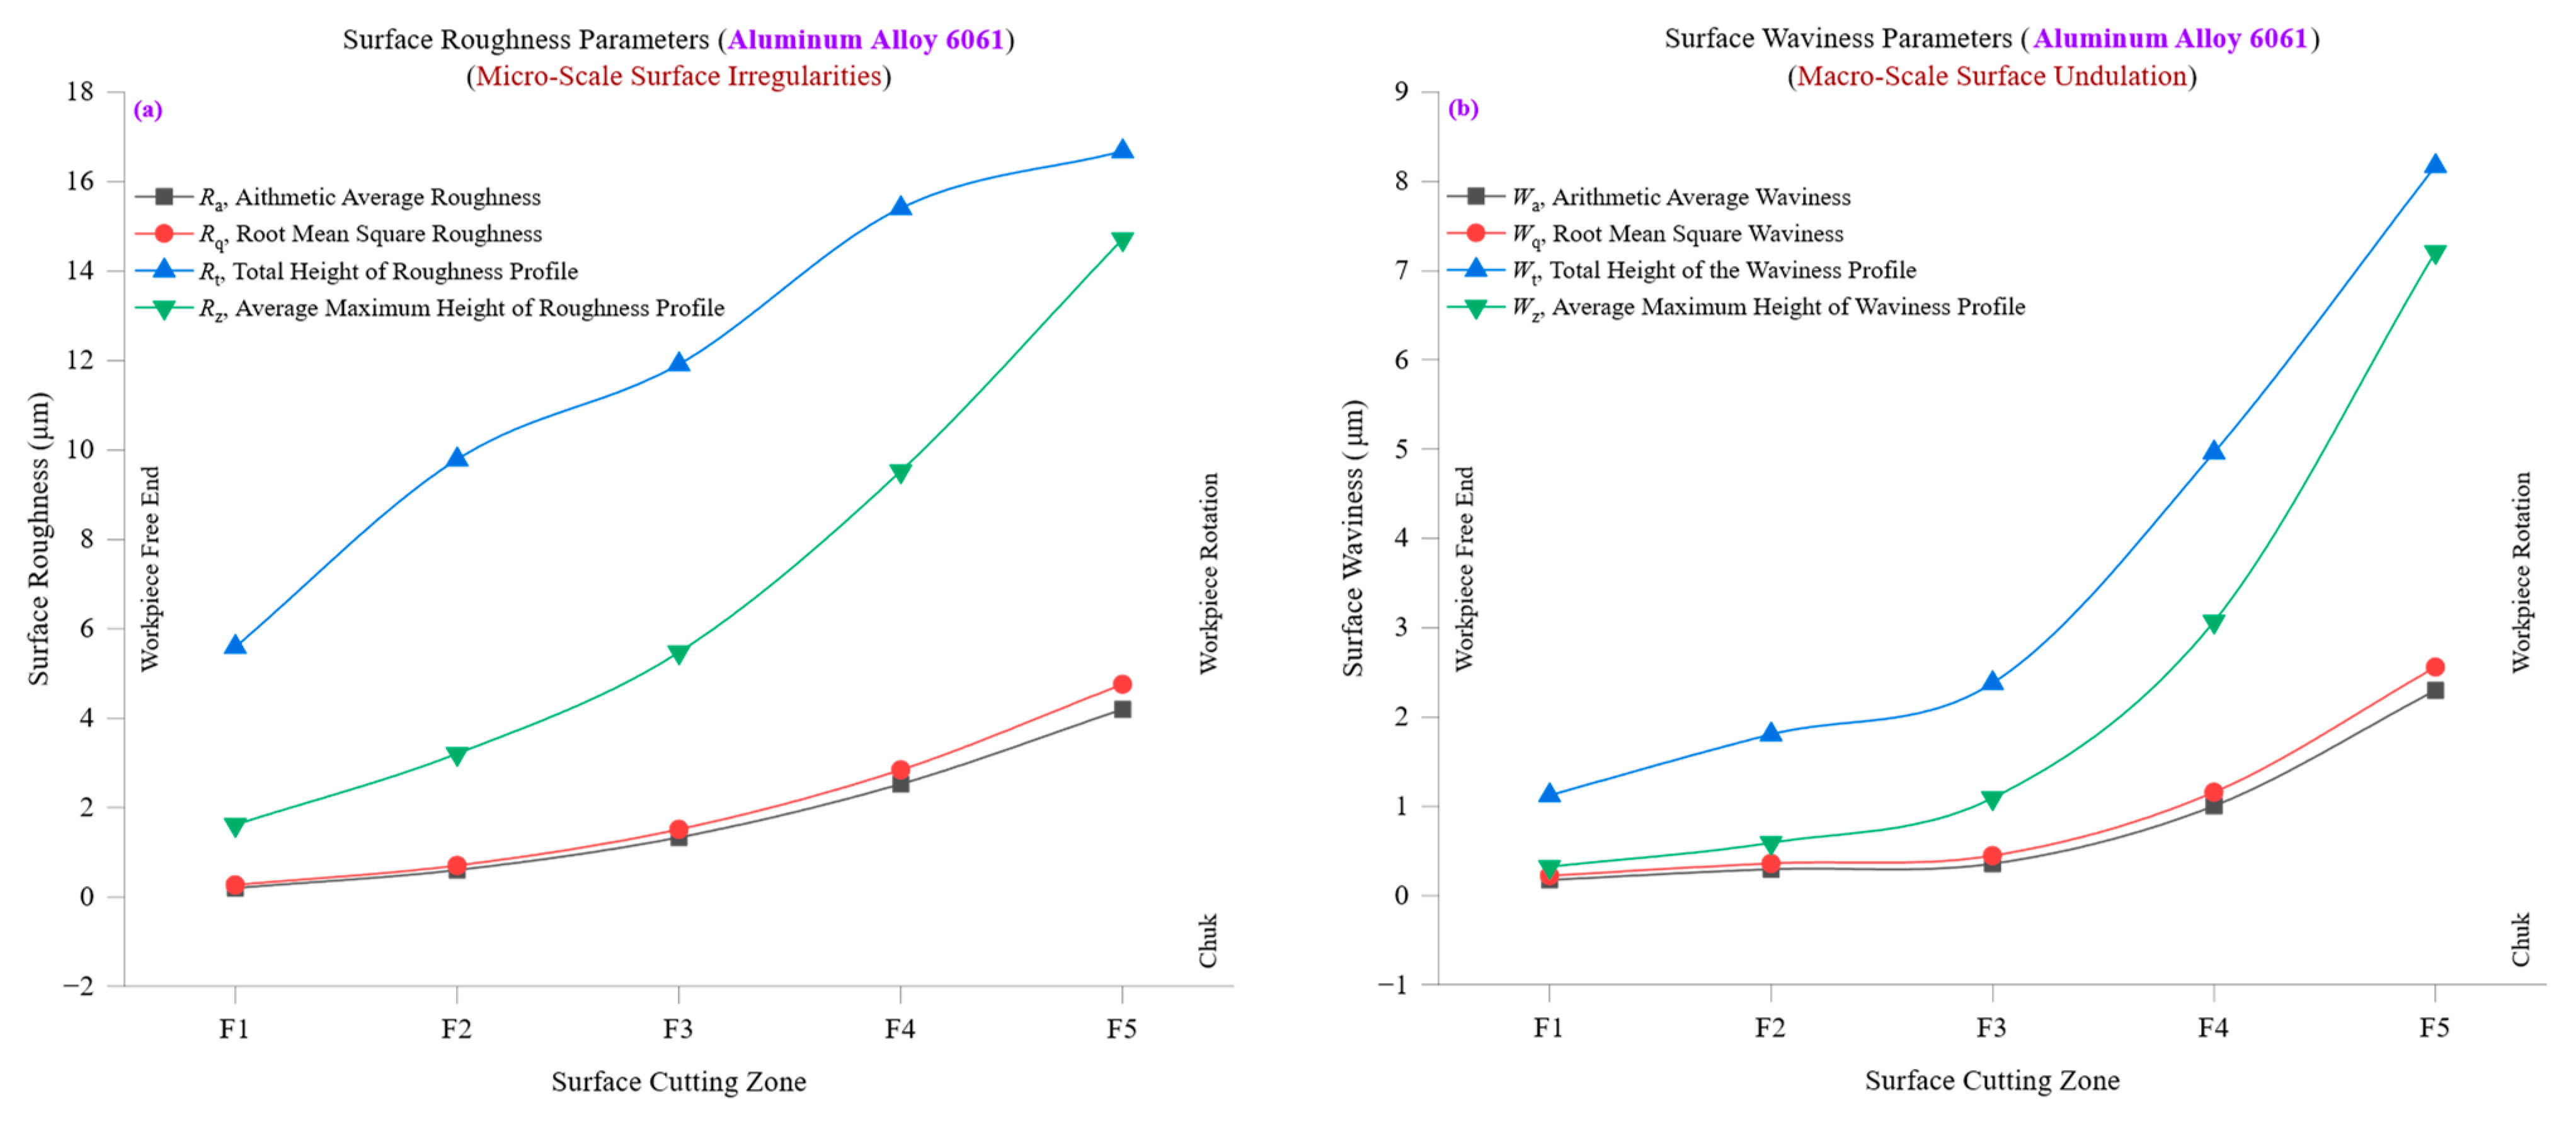
Figure 7a presents the evolution of surface roughness parameters—average roughness (
Ra), root mean square roughness (
Rq), total height of the roughness profile (
Rt), and ten-point mean roughness (
Rz)—across different cutting zones in aluminum alloy 6061. The progressive variation of these parameters provides insights into how surface texture develops during machining, reflecting the influence of tool wear, cutting stability, and thermal effects. At the initial cutting zone (F1),
Ra and
Rq values are relatively low, with
Ra at approximately 0.1971 µm and
Rq at 0.2633 µm, indicating a highly polished and uniform surface. These values suggest that the tool is in optimal condition at the early machining stages, allowing for minimal roughness formation. However,
Ra increases significantly as machining progresses, reaching 4.189 µm at F5, while
Rq peaks at 4.7497 µm. This rise in roughness is primarily due to progressive tool wear and increased cutting resistance, which generates microstructural deformations and surface irregularities. The total height of the roughness profile (
Rt) and ten-point mean roughness (
Rz) further illustrate the deterioration of surface texture over multiple cutting zones. At F1,
Rt is approximately 1.6079 µm, while
Rz is also 1.6079 µm, suggesting minimal peak-to-valley height variations in the machined surface. However, by the final cutting zone (F5),
Rt reaches 14.7138 µm, with
Rz following a similar trend, reflecting the development of deeper surface grooves and irregularities. The increase in
Rt and
Rz is attributed to the accumulation of machining-induced strain and tool degradation, leading to pronounced peaks and valleys on the surface. The trends in
Ra,
Rq,
Rt, and
Rz collectively indicate that while roughness increases over time due to progressive tool wear, the uniformity of the roughness profile remains relatively stable. The variations observed suggest that while aluminum alloy 6061 maintains good machinability, extended cutting operations require optimized machining parameters to minimize roughness buildup and maintain high surface integrity.
Figure 7b investigates the variation of surface waviness parameters, average waviness (
Wa), root mean square waviness (
Wq), total height of the waviness profile (
Wt), and ten-point mean waviness (
Wz) across different cutting zones, offering insights into large-scale surface undulations that develop during machining. At the initial cutting zone (F1), aluminum alloy 6061 exhibits low waviness values, with
Wa at approximately 0.1733 µm and
Wq at 0.222 µm. These values indicate a highly uniform and smooth waviness profile, with minimal deviations caused by cutting instabilities. As machining progresses,
Wa increases significantly to 2.2958 µm at F5, while
Wq follows a similar trend, reaching 2.5575 µm. This increase is primarily attributed to cumulative tool wear, slight variations in tool engagement, and material deformation effects, which introduce larger-scale undulations across the surface. The total height of the waviness profile (
Wt) and ten-point mean waviness (
Wz) provide further insight into the evolving waviness characteristics. At F1,
Wt is 1.1216 µm, while
Wz is 0.3227 µm, indicating a stable and consistent waviness pattern with minimal variations. However, by the final cutting zone (F5),
Wt increases to 8.1708 µm, while
Wz reaches 7.2095 µm, confirming the development of significant surface undulations. These pronounced variations result from thermal expansion, tool deflection, and increased vibrations, which contribute to irregular waviness patterns, particularly in extended machining cycles. The increasing trends in
Wa,
Wq,
Wt, and
Wz reinforce the role of thermal conductivity and cutting stability in controlling surface waviness. Aluminum’s high thermal conductivity (205 W/m·K) helps dissipate heat efficiently, reducing thermal-stress-induced waviness. However, at higher cutting zones, machining vibrations and accumulated tool wear begin to dominate, leading to noticeable waviness variations.
The combined trends observed in
Figure 7a,b suggest a strong interdependence between roughness and waviness evolution during machining. While surface roughness parameters (
Ra,
Rq,
Rt,
Rz) primarily reflect fine-scale irregularities influenced by direct tool–material interactions, surface waviness parameters (
Wa,
Wq,
Wt,
Wz) capture larger-scale deviations that emerge due to cutting vibrations, tool wear progression, and thermal expansion. At lower cutting zones, both roughness and waviness parameters remain low, indicating stable machining conditions with minimal deviations. However, as cutting progresses, roughness and waviness values increase significantly, with roughness showing a gradual increase, whereas waviness exhibits larger, more abrupt changes at higher cutting zones. This divergence suggests that roughness increases steadily as tool wear accumulates, whereas waviness is more sensitive to external machining instabilities, such as vibration and heat accumulation. The increasing trends in
Ra and
Wa suggest that as tool wear progresses, both micro-scale roughness and macro-scale waviness intensify, emphasizing the need for tool condition monitoring and adaptive cutting strategies. The steady rise in
Rt and
Wt highlights peak-to-valley deviations’ growing influence on fine and coarse surface features, reinforcing the importance of maintaining optimal cutting forces to limit excessive deformation.
Figure 7a,b demonstrate how surface roughness and waviness evolve across different cutting zones in aluminum alloy 6061. While
Ra,
Rq,
Rt, and
Rz reflect fine-scale roughness progression due to tool wear and cutting forces,
Wa,
Wq,
Wt, and
Wz capture large-scale waviness variations caused by thermal and mechanical instabilities. The findings underscore the necessity of optimizing machining parameters to balance roughness and waviness control, ensuring superior surface quality in CNC-turned aluminum components. The correlation between roughness and waviness trends suggests that while both parameters increase over time, waviness is more susceptible to external factors such as vibrations and thermal expansion, necessitating real-time machining adjustments to maintain high-quality surface finishes.
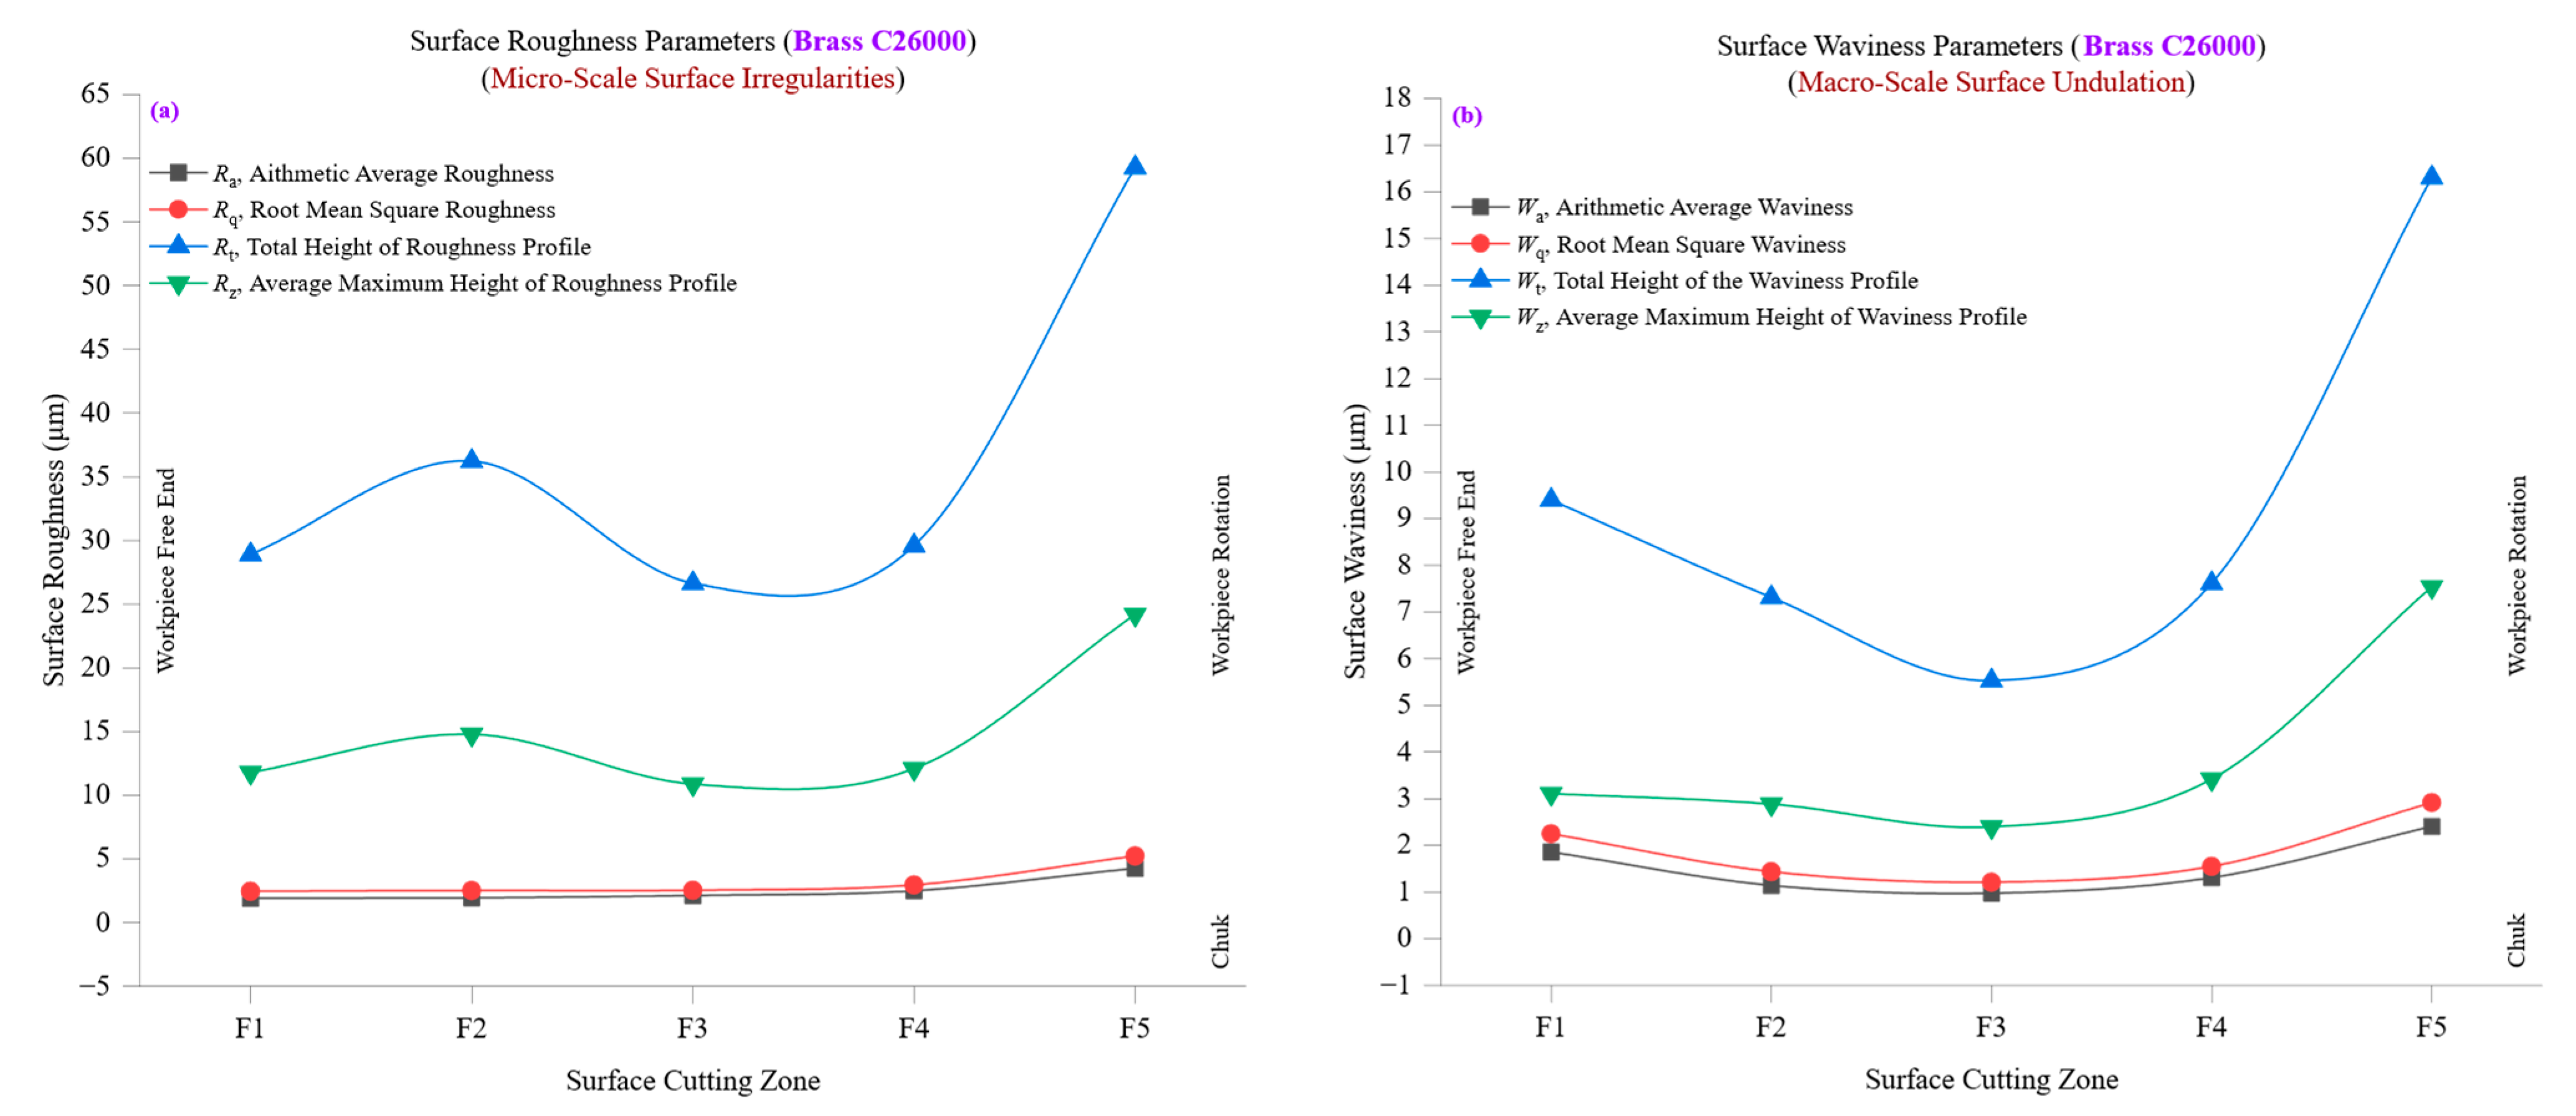
Figure 8a presents the variation in surface roughness parameters, average roughness (
Ra), root mean square roughness (
Rq), total height of the roughness profile (
Rt), and ten-point mean roughness (
Rz) across different cutting zones in brass C26000, revealing critical trends in surface texture development during machining. At the initial cutting zone (F1),
Ra starts at approximately 1.8958 µm, with
Rq at 2.4427 µm, indicating a relatively smooth surface with minimal roughness variations. At this stage, the Rq/Ra ratio of 1.288 suggests a consistent surface texture with a balanced distribution of peaks and valleys. However, as machining progresses,
Ra increases steadily, reaching 4.2544 µm at F5, while
Rq peaks at 5.2215 µm, indicating an accumulation of microstructural deformations and irregularities due to prolonged tool–material interactions. The total height of the roughness profile (
Rt) and ten-point mean roughness (
Rz) further demonstrate the impact of machining on surface integrity. At F1,
Rt is approximately 11.78 µm, while
Rz follows closely at 11.78 µm, indicating minimal peak-to-valley height deviations in the machined surface. However, by the final cutting zone (F5),
Rt reaches 24.18 µm, with
Rz mirroring this increase, reflecting deeper grooves and more prominent surface irregularities. This sharp rise in
Rt and
Rz suggests that increased tool wear, higher cutting forces, and localized material deformations contribute to surface degradation as the cutting process continues. The
Rq/
Ra ratio remains reasonably stable, with values fluctuating between 1.18 and 1.29 across cutting zones, reinforcing the notion that while roughness increases, the overall texture remains relatively uniform. However, the gradual rise in
Rsk (skewness) from −0.55 at F1 to 0.41 at F5 indicates that as machining progresses, the surface transitions from one dominated by valleys to one where sharp peaks become more prevalent. This change is a direct consequence of tool wear, increased strain hardening, and higher cutting resistance, which result in pronounced peaks and reduced material ductility.
Figure 8b explores the evolution of waviness parameters, average waviness (
Wa), root mean square waviness (
Wq), total waviness height (
Wt), and ten-point mean waviness (
Wz), across different cutting zones, providing a broader perspective on larger-scale surface deviations during machining. At the initial cutting zone (F1),
Wa is approximately 1.86 µm, with
Wq at 2.24 µm, reflecting a relatively stable and uniform waviness profile. The
Wq/
Wa ratio of 1.21 suggests a moderately consistent waviness pattern with minimal fluctuations in undulations across the surface. However, as machining progresses,
Wa increases gradually to 2.40 µm at F5. In comparison,
Wq peaks at 2.91 µm indicate that larger-scale surface undulations emerge due to accumulated tool deflections, thermal expansion, and cutting vibrations. The total waviness height (
Wt) and ten-point mean waviness (
Wz) provide additional insights into the macro-scale variations in surface texture. At the early stages (F1),
Wt is 9.39 µm, while
Wz is 3.10 µm, signifying controlled and stable waviness characteristics. However, by the final cutting zone (F5),
Wt rises significantly to 16.30 µm, while
Wz increases to 7.54 µm, highlighting the progressive formation of pronounced waviness features. These changes can be attributed to thermal expansion effects, variations in tool-chip interaction, and increasing cutting resistance, all of which contribute to greater fluctuations in the overall surface profile. An interesting trend is observed in waviness skewness (
Wsk) and waviness kurtosis (
Wku). Initially,
Wsk is −0.34 at F1, indicating a surface dominated by valleys, but as machining progresses,
Wsk moves toward −0.20 at F5, suggesting a shift toward a more balanced surface with a mix of peaks and valleys. The
Wku values, which start at 2.34 at F1 and increase to 2.93 at F5, indicate a gradual sharpening of the waviness distribution, reinforcing the idea that machining dynamics increasingly influence surface undulations as cutting progresses.
A direct correlation exists between surface roughness (Ra, Rq, Rt, Rz) and waviness (Wa, Wq, Wt, Wz), demonstrating how micro-scale roughness progression is linked to macro-scale waviness fluctuations during machining. At lower cutting zones (F1–F2), both roughness and waviness parameters remain relatively low, suggesting stable cutting conditions, minimal tool wear, and effective heat dissipation. However, roughness and waviness values increase significantly at higher cutting zones (F4–F5), reflecting the combined influence of tool wear, material deformation, and machining-induced vibrations. The trends observed in Rq/Ra and Wq/Wa ratios confirm that while roughness develops progressively, waviness is more susceptible to sudden variations caused by external machining factors. The increasing Rt and Wt values further emphasize that as machining progresses, peak-to-valley variations in both fine and coarse surface features become more pronounced, reinforcing the importance of maintaining optimal cutting conditions to prevent excessive surface defects.
Figure 8a,b highlight the evolution of surface roughness and waviness across different cutting zones for brass C26000, demonstrating how machining conditions affect both micro-scale and macro-scale surface characteristics. While
Ra,
Rq,
Rt, and
Rz provide insights into the fine-scale texture influenced by tool–material interactions and strain hardening,
Wa,
Wq,
Wt, and
Wz capture larger-scale surface undulations driven by thermal expansion, tool deflections, and machining dynamics. These findings underscore the importance of machining parameter optimization to balance roughness and waviness control, ensuring high surface integrity in CNC-turned brass components. The results further suggest that while brass exhibits stable cutting behavior, prolonged machining cycles necessitate close monitoring of tool wear and thermal effects to maintain superior surface quality.
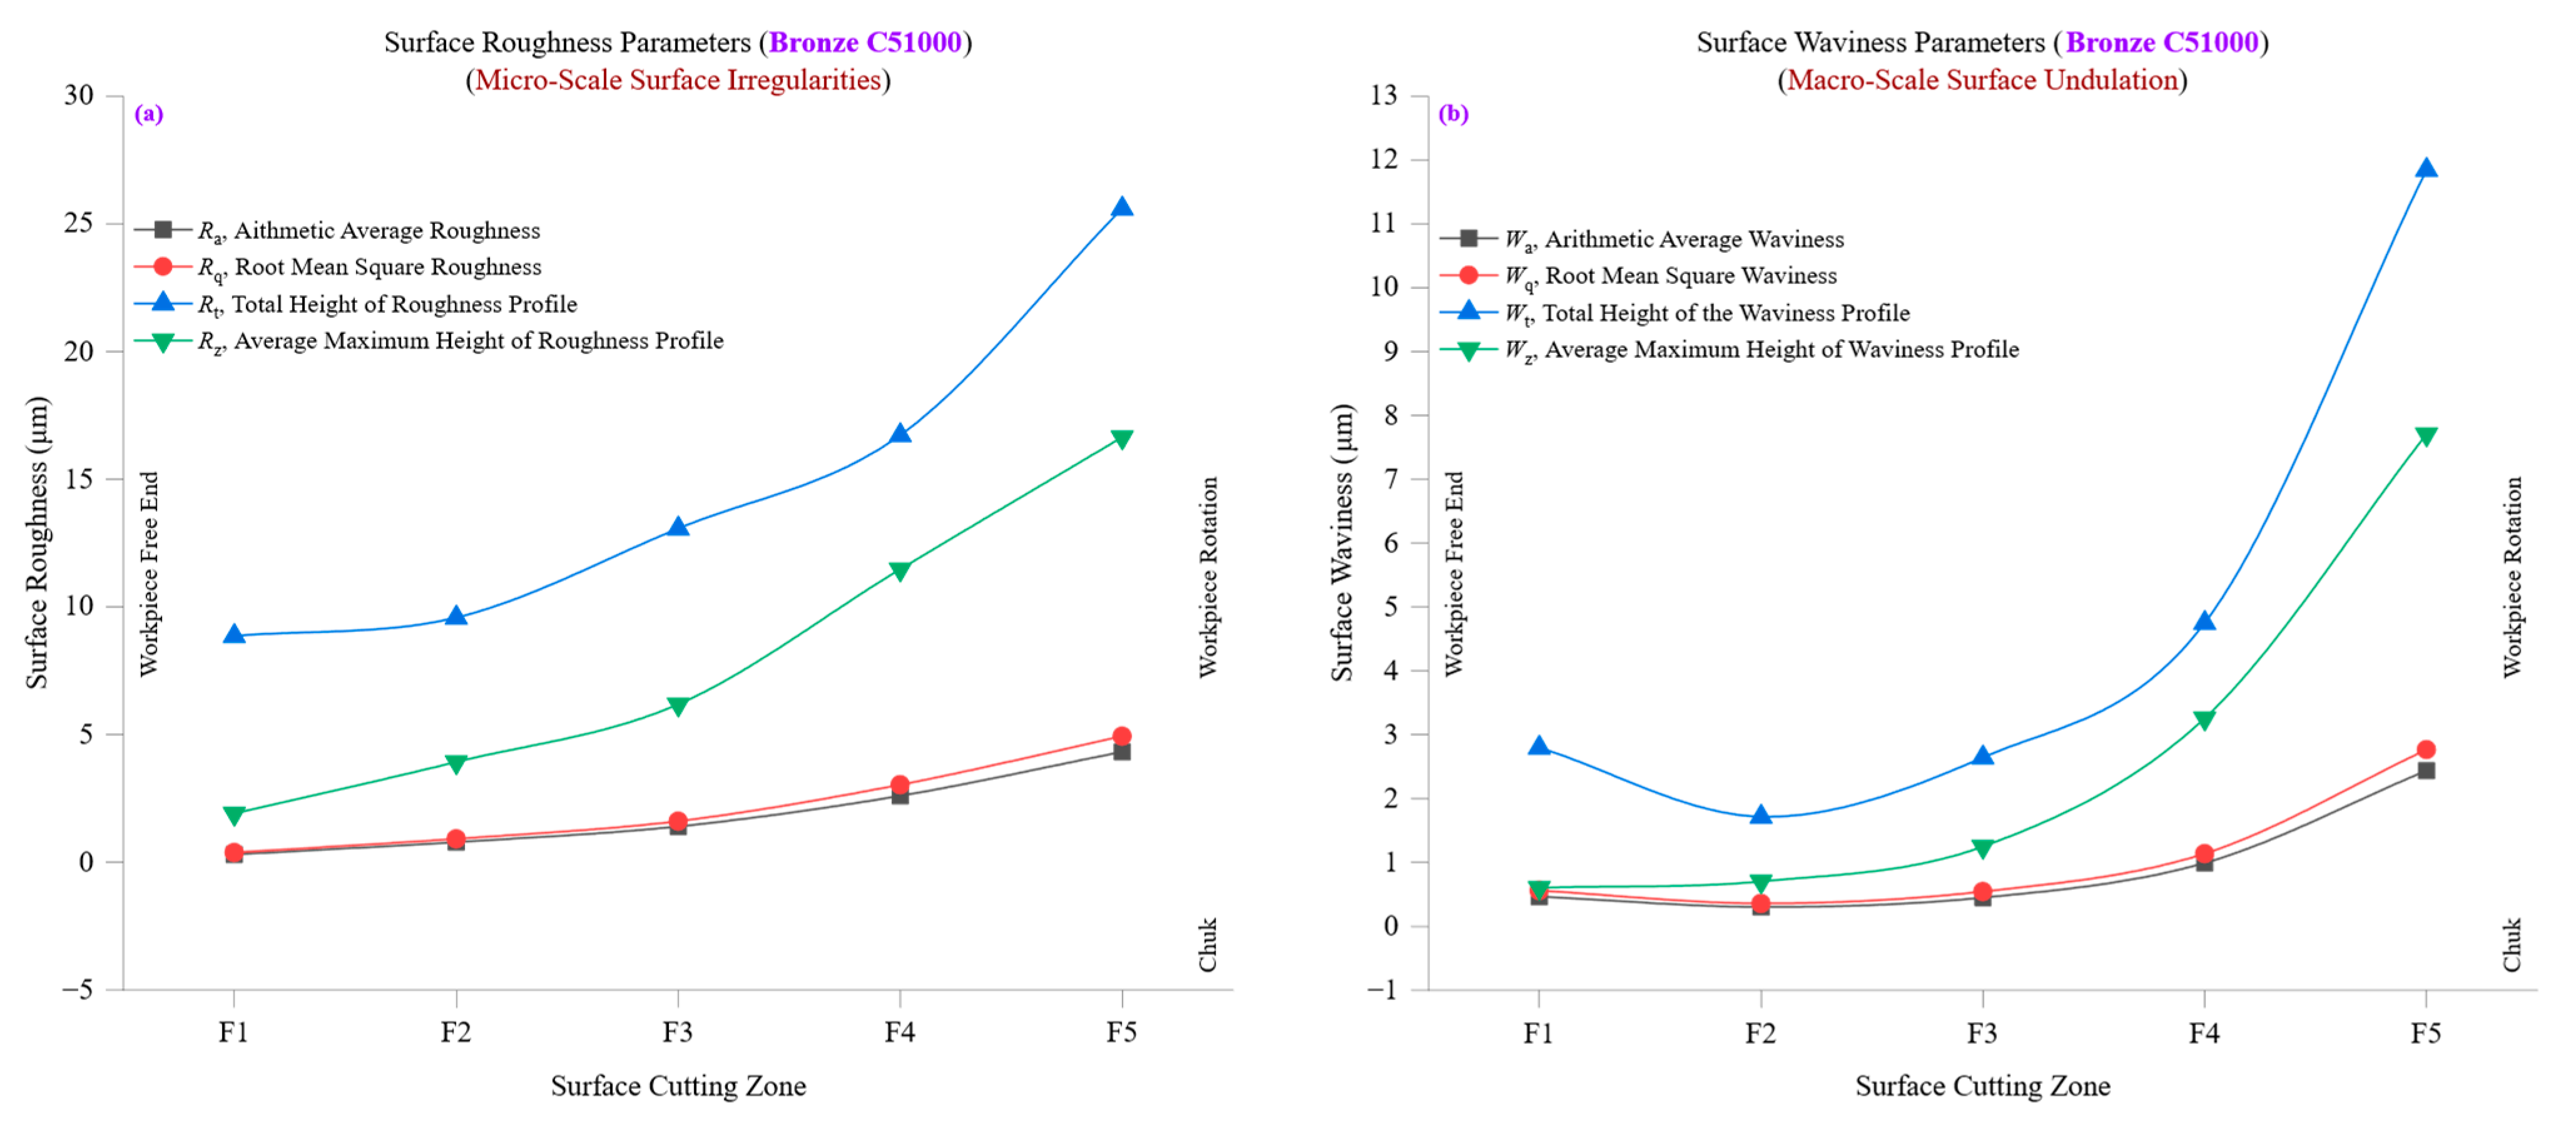
Figure 9a presents a detailed examination of surface roughness parameters, including average roughness (
Ra), root mean square roughness (
Rq), total height of the roughness profile (
Rt), and ten-point mean roughness (
Rz) across various cutting zones in bronze C51000. The findings reveal a progressive increase in roughness parameters as machining progresses, indicative of tool wear accumulation, strain hardening, and thermal effects that influence the material’s response to cutting. At the initial cutting zone (F1),
Ra is approximately 0.3066 µm, while
Rq is 0.3833 µm, signifying a relatively smooth surface with minimal variations. The
Rq/
Ra ratio at this stage is 1.25, indicating a well-balanced roughness distribution with minimal irregularities. However, as machining advances,
Ra increases steadily to 4.3256 µm at F5, while
Rq reaches 4.9391 µm, reflecting an increasingly coarse surface with a greater presence of microscopic deformations. The progressive rise in
Ra and
Rq directly results from increased tool wear, higher cutting forces, and gradual deterioration of the cutting edge, which contribute to greater surface irregularities. The total height of the roughness profile (
Rt) and ten-point mean roughness (
Rz) further illustrate the impact of machining on surface texture. At F1,
Rt is around 1.91 µm, and
Rz follows a similar pattern, indicating a highly uniform and consistent surface. However, by the final cutting zone (F5),
Rt increases significantly to 16.65 µm, while
Rz shows a similar peak, reflecting the formation of deeper peaks and valleys. This substantial increase in
Rt and
Rz suggests that as the cutting process continues, increased mechanical stress, material hardening, and localized deformation cause more pronounced roughness peaks, necessitating improved tool condition monitoring to maintain surface integrity. A closer look at
Rq/
Ra ratios reveals that while roughness increases, the relative balance between
Rq and
Ra remains stable, fluctuating between 1.14 and 1.25. This consistency suggests that while machining-induced roughness increases progressively, the overall texture remains relatively homogeneous, with no abrupt changes in peak-to-valley distribution. However, an important observation is the steady rise in skewness (
Rsk) values, from −0.59 at F1 to 0.47 at F5, indicating a transition from valley-dominated surfaces to peak-dominated ones. This shift indicates increasing material deformation, tool-wear-induced plowing, and changes in chip formation dynamics, all of which play a role in shaping surface roughness over time.
Figure 9b provides an in-depth analysis of waviness parameters, including average waviness (
Wa), root mean square waviness (
Wq), total waviness height (
Wt), and ten-point mean waviness (
Wz) across different cutting zones in bronze C51000. The results demonstrate how macro-scale surface undulations evolve as machining progresses, influenced by factors such as thermal expansion, tool deflections, and cutting vibrations. At the initial cutting zone (F1),
Wa is approximately 0.4653 µm, with
Wq at 0.5605 µm, indicating minimal waviness variations. The
Wq/
Wa ratio of 1.20 suggests a well-balanced waviness distribution with relatively smooth transitions between peaks and valleys. However, as machining continues,
Wa increases steadily to 2.4367 µm at F5, while
Wq reaches 2.7657 µm, reflecting a greater presence of larger-scale surface undulations. This increase in waviness is a direct result of thermal expansion effects, tool wear progression, and increasing dynamic instabilities during machining. The total waviness height (
Wt) and ten-point mean waviness (
Wz) provide additional insights into the progression of surface undulations. At F1,
Wt is around 2.80 µm, and
Wz is 0.60 µm, indicating a relatively uniform waviness profile. However, by the final cutting zone (F5),
Wt rises dramatically to 11.84 µm, while
Wz increases to 7.70 µm, signifying the development of more prominent waviness peaks and valleys. These changes reflect the combined influence of heat accumulation, cutting resistance, and increased material displacement due to prolonged machining exposure. A crucial observation is the behavior of waviness skewness (
Wsk) and waviness kurtosis (
Wku) over different cutting zones. Initially,
Wsk is −0.37 at F1, indicating a valleys-dominated surface. However, as machining progresses,
Wsk stabilizes near zero, suggesting a transition toward a more symmetric waviness distribution, where both peaks and valleys contribute equally to the overall surface profile. This transition can be attributed to machining-induced plastic deformation, which gradually modifies the surface profile and alters peak–valley distributions. The
Wku values, which start at 2.68 at F1 and increase slightly to 1.86 at F5, indicate that waviness distributions become less sharp over time as thermal and mechanical effects smooth out extreme undulations.
The correlation between surface roughness (Ra, Rq, Rt, Rz) and waviness (Wa, Wq, Wt, Wz) provides valuable insights into how micro-scale roughness development influences macro-scale waviness formation. At lower cutting zones (F1–F2), roughness and waviness values remain relatively low, indicating stable machining conditions with minimal tool wear or thermal distortion. However, at higher cutting zones (F4–F5), both roughness and waviness increase sharply, suggesting that the accumulation of cutting forces, tool wear, and heat generation leads to greater surface irregularities on both the micro and macro scales. The increasing Rq/Ra and Wq/Wa ratios confirm that while roughness progressively increases, waviness undergoes more dramatic shifts due to external machining factors. This reinforces the idea that while tool–material interactions and chip formation mechanics govern fine-scale surface roughness variations, larger-scale waviness is more susceptible to dynamic machining instabilities such as tool vibrations, heat-induced distortions, and machine rigidity effects.
The significant rise in Rt and Wt values at later cutting zones further emphasizes that as machining progresses, the combination of tool wear and thermal effects results in more pronounced peak-to-valley variations in both fine and coarse surface features. This highlights the importance of optimizing cutting conditions, selecting appropriate tool materials, and implementing real-time process monitoring to mitigate excessive roughness and waviness formation.
Figure 9a,b comprehensively analyze surface roughness and waviness evolution in bronze C51000, demonstrating how machining conditions influence both micro-scale and macro-scale surface characteristics. The findings reveal that while
Ra,
Rq,
Rt, and
Rz provide critical insights into fine-scale texture development,
Wa,
Wq,
Wt, and
Wz offer a broader perspective on large-scale undulations and waviness progression. These results emphasize the importance of balancing machining parameters to control both roughness and waviness, ensuring high surface integrity in CNC-turned bronze components. While bronze exhibits moderate machining stability, prolonged cutting cycles significantly increase roughness and waviness, requiring close monitoring of tool condition, cutting temperature, and material response.
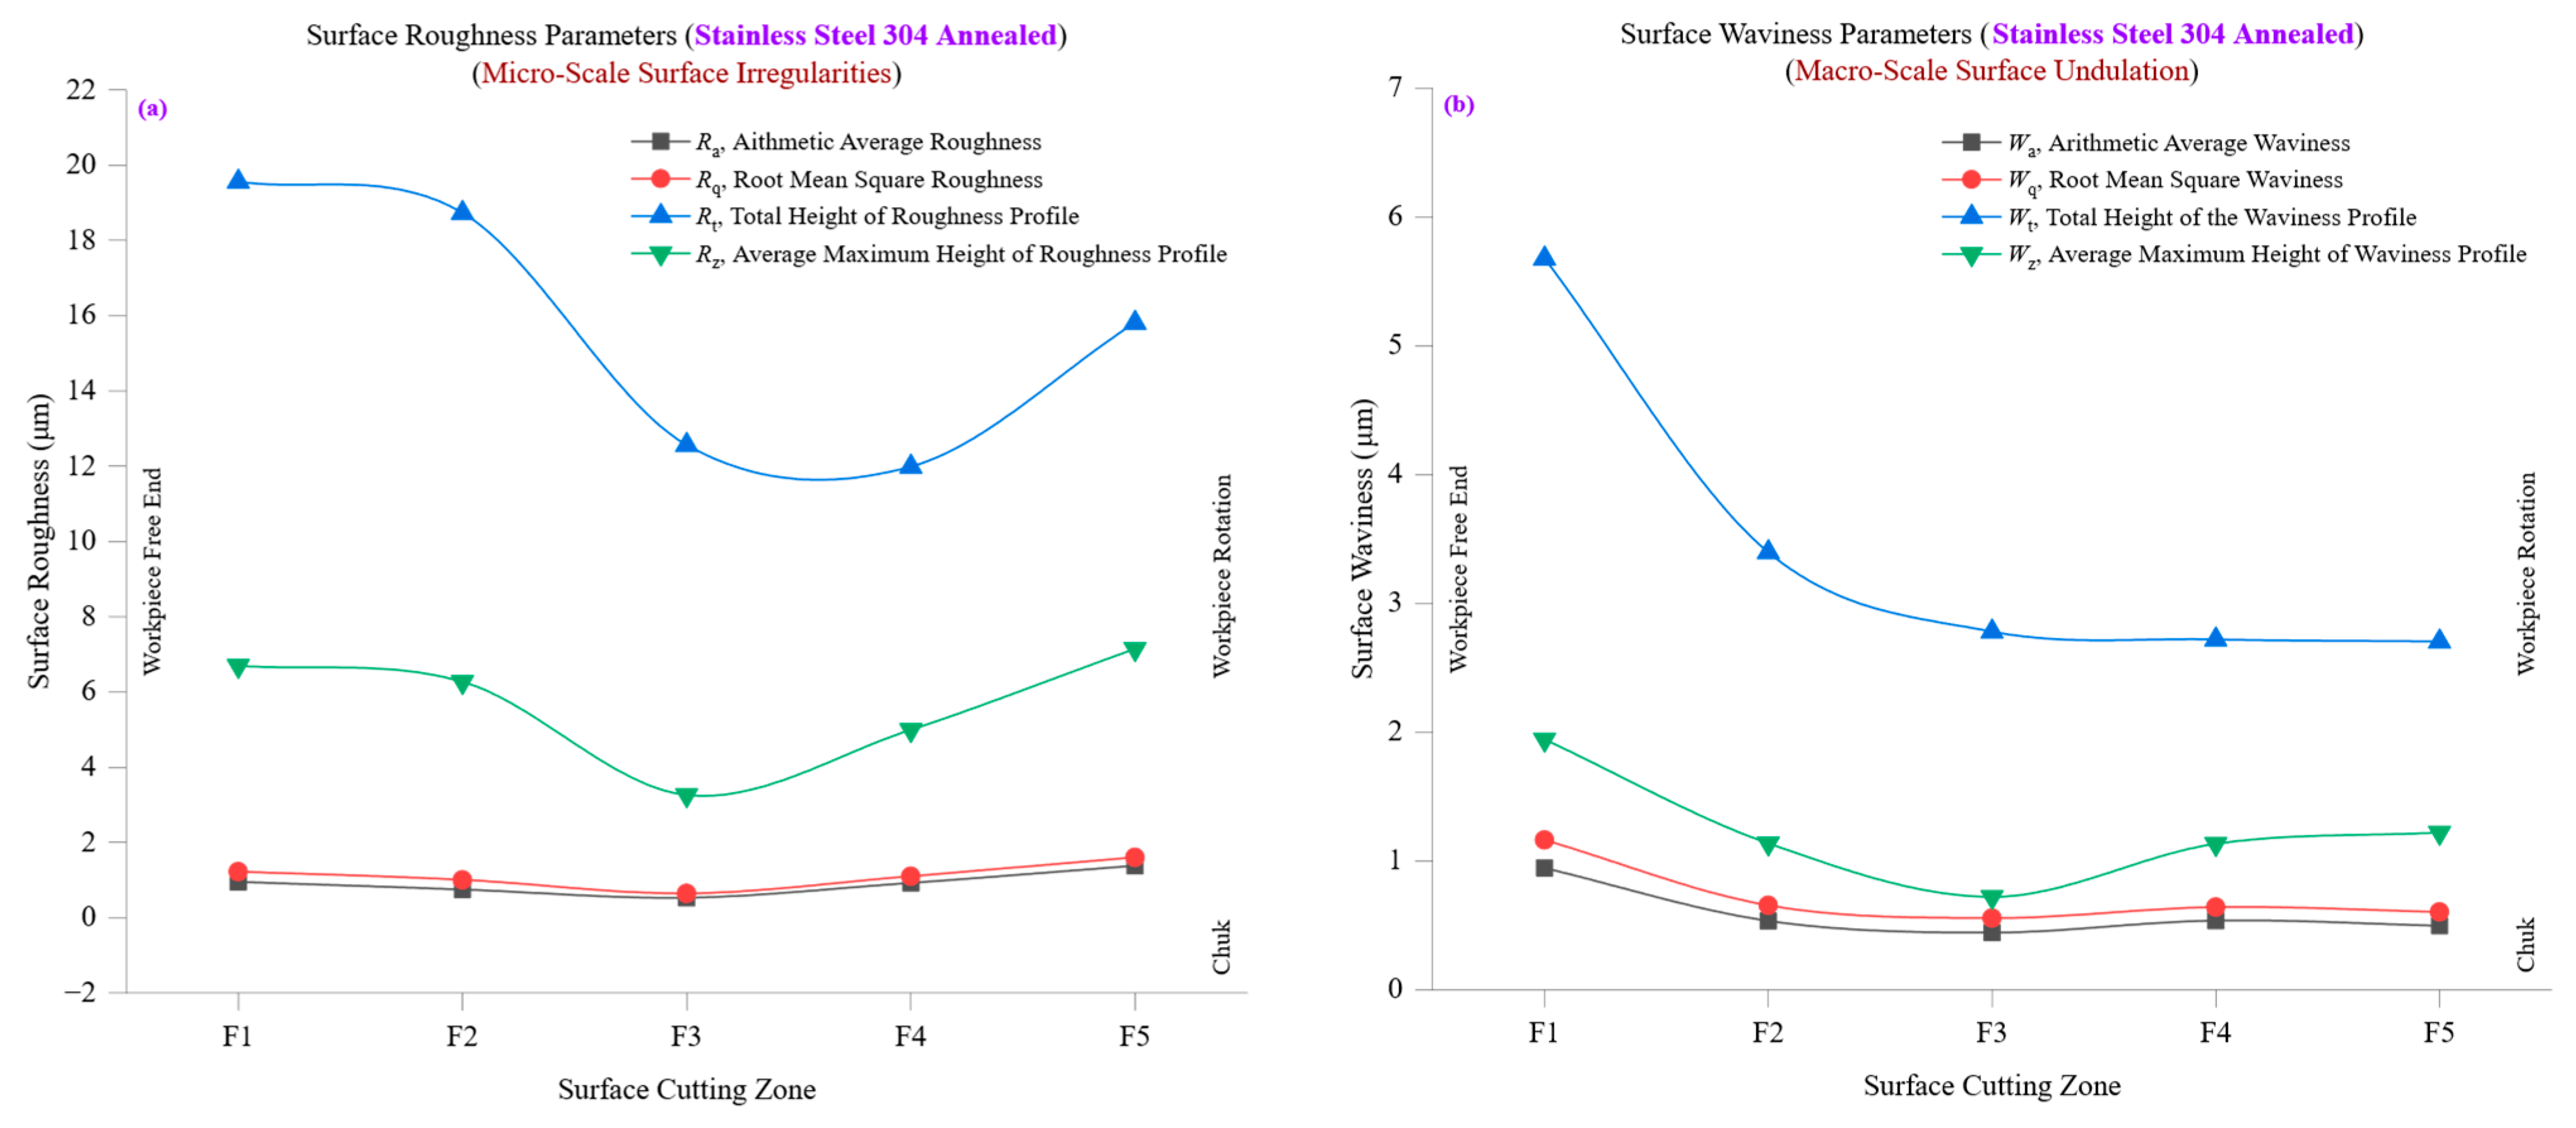
Figure 10a presents the progression of surface roughness parameters, including average roughness (
Ra), root mean square roughness (
Rq), total height of the roughness profile (
Rt), and ten-point mean roughness (
Rz) across multiple cutting zones in stainless steel 304 annealed. The data reveal a steady increase in roughness parameters with machining progression, demonstrating the material’s susceptibility to work hardening, tool wear effects, and thermal stress accumulation as cutting advances. At the initial cutting zone (F1),
Ra is approximately 0.9465 µm, while
Rq is 1.2199 µm, reflecting a moderately rough surface with minor irregularities. The
Rq/
Ra ratio at this stage is 1.29, indicating a well-distributed roughness pattern with a moderate mix of peaks and valleys. However, as machining progresses,
Ra increases to 1.3747 µm at F5. In comparison,
Rq reaches 1.5979 µm, highlighting the gradual degradation of surface quality due to increasing tool wear, rising cutting forces, and thermal stress buildup. The total height of the roughness profile (
Rt) and ten-point mean roughness (
Rz) further illustrate how machining conditions affect surface texture evolution. Initially,
Rt is around 6.69 µm, and
Rz follows a similar trend, indicating a reasonably stable cutting environment. However, at the final cutting zone (F5),
Rt increases to 7.14 µm, while
Rz also rises proportionally, signifying the development of deeper peaks and valleys. This increase is directly linked to stainless steel 304′s low thermal conductivity (16 W/m·K), which results in heat buildup during machining, leading to greater cutting resistance, higher tool wear rates, and rougher surfaces. Examining the
Rq/
Ra ratio, we observe that the relative balance between
Rq and
Ra remains within the 1.16–1.29 range despite the absolute increase in roughness values. This indicates that while machining-induced roughness grows, the overall texture maintains a predictable structure with no extreme deviations in peak-to-valley distributions. However, an important observation is the skewness (
Rsk) values, which transition from positive to negative as cutting progresses. Initially,
Rsk is 0.70 at F1, suggesting a peak-dominated surface, but by F5, it shifts to −0.06, indicating a more balanced distribution of peaks and valleys. This shift suggests that plastic deformation effects and tool-wear-induced plowing lead to a redistribution of surface features over time, reducing the dominance of sharp peaks.
Figure 10b examines the waviness parameters, including average waviness (
Wa), root mean square waviness (
Wq), total waviness height (
Wt), and ten-point mean waviness (
Wz) across different cutting zones for stainless steel 304 annealed. The findings reveal a notable increase in surface waviness as machining advances, reflecting cumulative effects of thermal distortion, cutting resistance, and tool deflections. At the initial cutting zone (F1),
Wa is approximately 0.9442 µm, while
Wq is 1.1627 µm, indicating a moderate waviness pattern with relatively minor undulations. The
Wq/
Wa ratio of 1.23 suggests a relatively uniform waviness distribution, with a consistent balance between peaks and valleys. However, as machining progresses,
Wa decreases slightly to 0.498 µm at F5, while
Wq reaches 0.6043 µm, indicating an overall reduction in waviness at later cutting stages. This decline in waviness, despite increasing roughness, suggests that initial machining stages introduce larger-scale undulations due to higher cutting forces and tool engagement effects. In contrast, later stages smooth out these features as surface deformation becomes more uniform. The total waviness height (
Wt) and ten-point mean waviness (
Wz) further illustrate the macro-scale evolution of surface undulations. Initially,
Wt is around 5.67 µm, and
Wz is 1.94 µm, indicating relatively moderate surface undulations. However, as machining continues,
Wt declines to 2.70 µm, and
Wz follows a similar trend, suggesting that as cutting progresses, the combined effects of tool wear and material hardening cause waviness features to become less pronounced, likely due to increased plastic deformation and surface-smoothing effects. A critical observation lies in the waviness skewness (
Wsk) and waviness kurtosis (
Wku) values, which evolve as machining progresses. Initially,
Wsk is positive at 0.74 in F1, indicating a peak-dominated waviness structure. However, as machining advances,
Wsk shifts to −0.51 at F5, indicating a transition toward a valley-dominated profile. This shift suggests that machining-induced stresses and plastic deformation effects lead to a redistribution of waviness features, reducing peak prominence while emphasizing valley formation. Similarly,
Wku values show an initial high value of 3.24, gradually stabilizing to 2.53, indicating that waviness distributions become less sharp over time as extreme peaks gradually wear down.
The correlation between surface roughness (Ra, Rq, Rt, Rz) and waviness (Wa, Wq, Wt, Wz) provides deeper insight into how micro-scale roughness changes influence macro-scale waviness formation. At lower cutting zones (F1–F2), roughness and waviness values remain relatively stable, suggesting an initial phase of machining stability with minimal tool wear or thermal distortion. However, roughness increases at higher cutting zones (F4–F5) while waviness decreases, highlighting an inverse relationship where machining progression leads to finer-scale roughness formation but a reduction in macro-scale waviness effects. Despite the rising roughness parameters, the decreasing Wt and Wz values at later cutting zones emphasize that while tool wear and thermal stresses degrade micro-scale surface quality, macro-scale undulations tend to stabilize due to increasing material conformity and plastic deformation. This trend reinforces the importance of balancing cutting parameters to control both roughness and waviness evolution, ensuring high surface integrity while mitigating excessive peak formation.
Figure 10a,b comprehensively analyze surface roughness and waviness evolution in stainless steel 304 annealed, demonstrating how machining conditions influence micro-scale and macro-scale surface characteristics. The findings emphasize that while stainless steel 304 exhibits significant resistance to machining-induced roughness, its low thermal conductivity and high hardness make it prone to tool wear and plastic deformation effects, necessitating careful optimization of cutting conditions to maintain surface integrity. The results highlight that while
Ra,
Rq,
Rt, and
Rz provide a fine-scale view of roughness development,
Wa,
Wq,
Wt, and
Wz offer a broader perspective on waviness behavior. The inverse relationship between increasing roughness and decreasing waviness underscores the role of machining-induced plasticity in modifying surface characteristics over time. These findings reinforce the need for precision machining strategies when working with stainless steel 304, ensuring that cutting speeds, tool geometry, and lubrication strategies are optimized to control roughness and waviness formation. The evolution of skewness and kurtosis values further emphasizes that the surface topography transitions from peak-dominated to valley-dominated structures, highlighting the need for adaptive cutting strategies to maintain optimal surface performance.
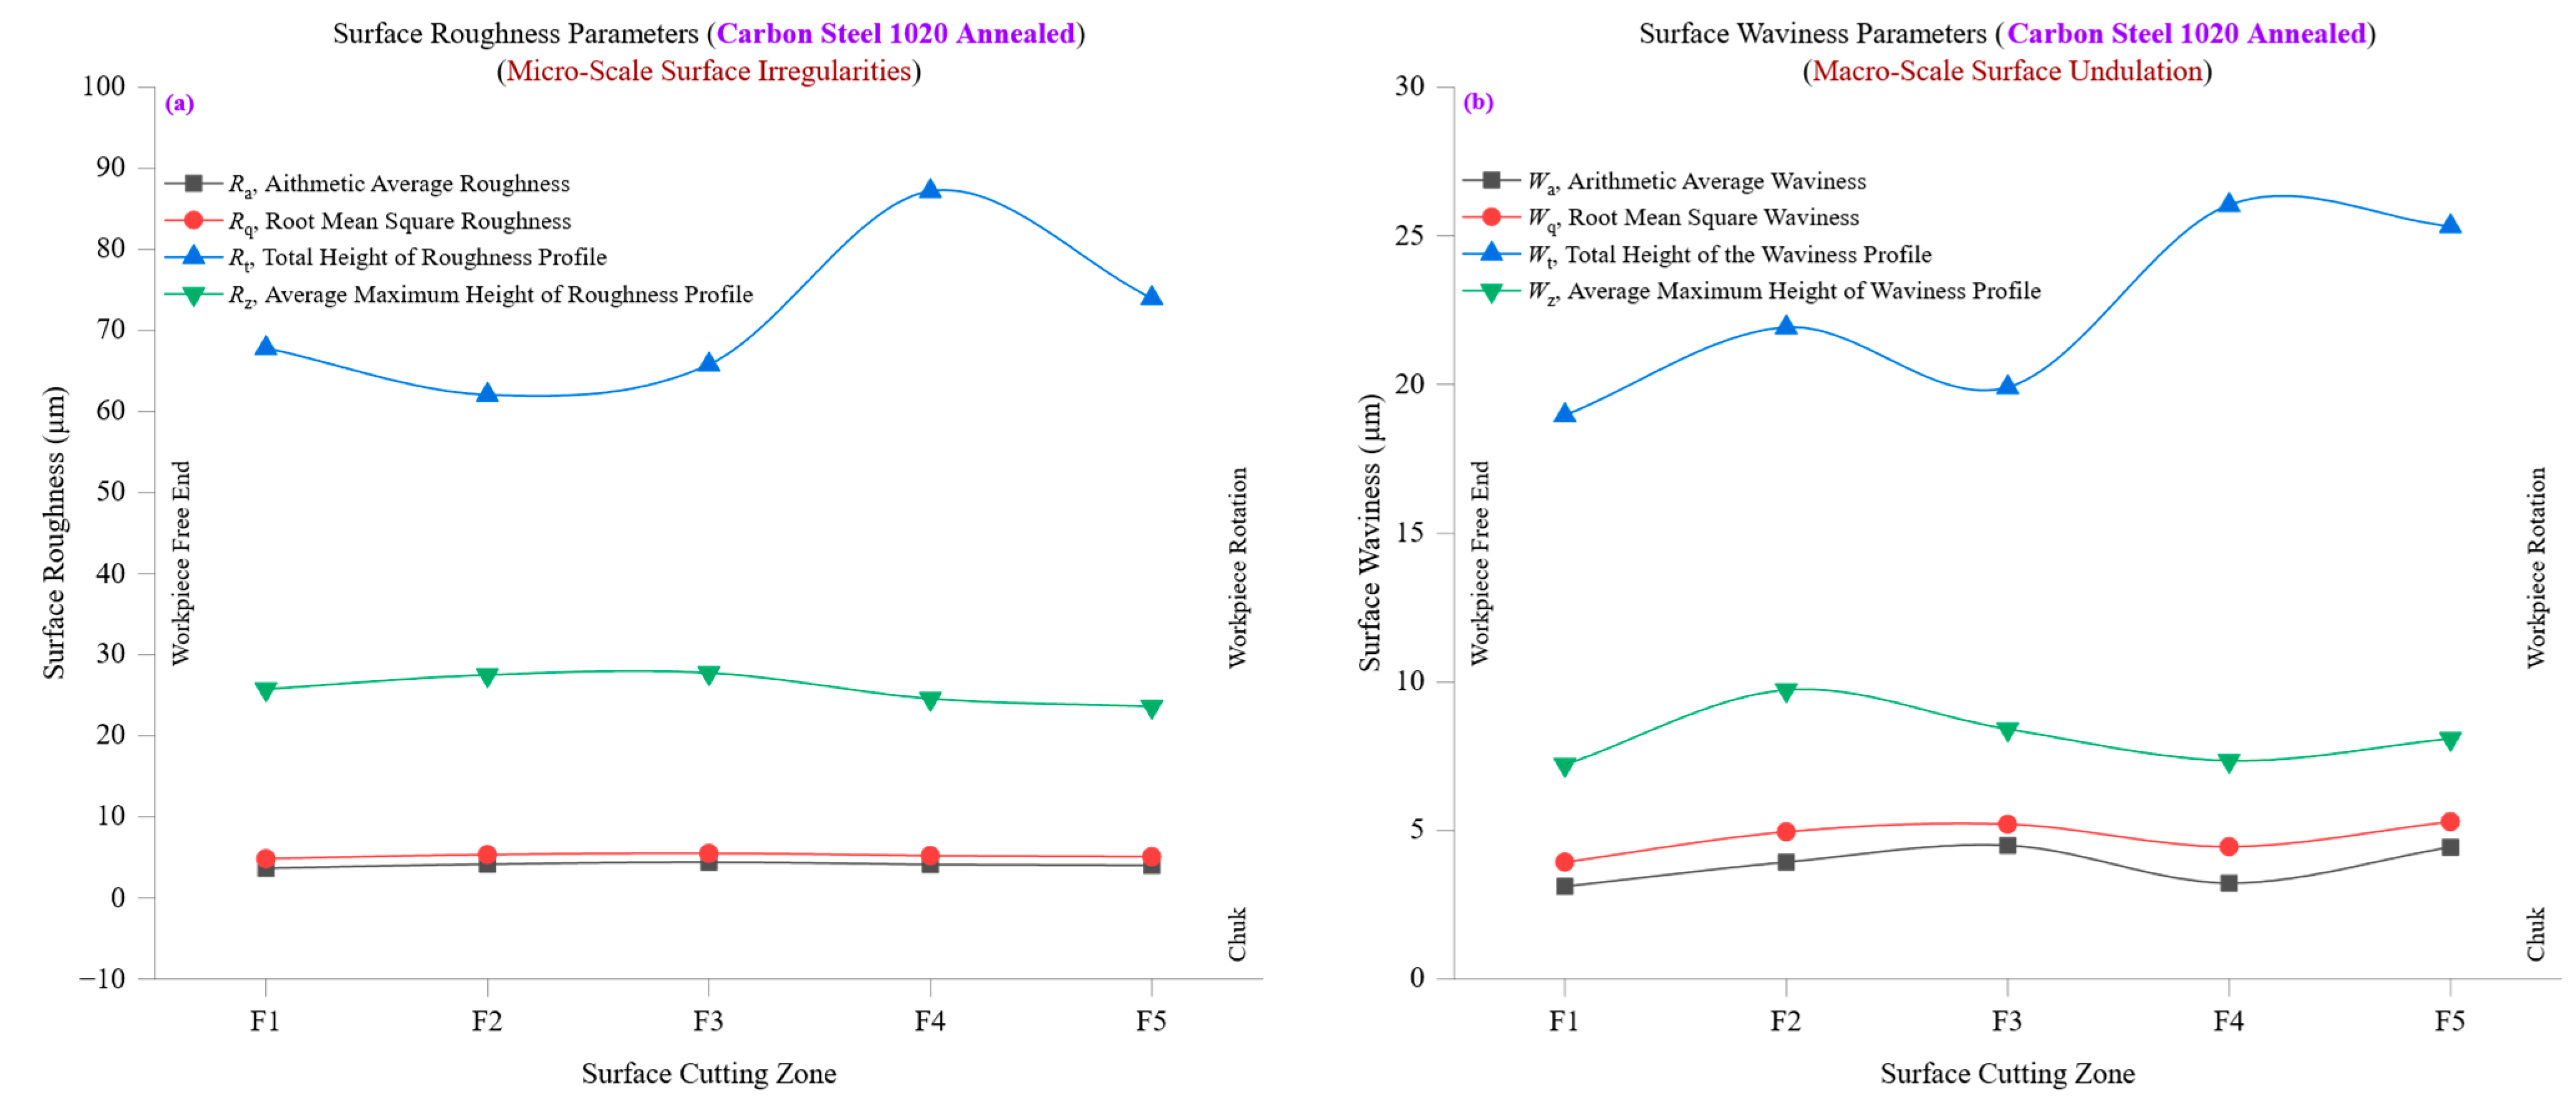
Figure 11a presents the evolution of surface roughness parameters, including average roughness (
Ra), root mean square roughness (
Rq), total height of the roughness profile (
Rt), and ten-point mean roughness (
Rz), across different cutting zones in carbon steel 1020 annealed. The data demonstrate how machining progression influences surface texture, revealing variations in peak formation, material deformation, and tool-wear effects. At the initial cutting zone (F1),
Ra is approximately 0.744 µm, while
Rq is 1.0006 µm, indicating a relatively smooth surface profile with well-distributed peaks and valleys. The
Rq/
Ra ratio of roughly 1.34 suggests a balanced roughness structure, where peak heights are consistent without extreme surface irregularities. However, as machining progresses,
Ra increases to 1.3747 µm at F5. In comparison,
Rq reaches 1.5979 µm, signifying an increase in overall roughness due to cumulative tool wear, higher cutting resistance, and increased surface plasticity. The total roughness height (
Rt) and ten-point mean roughness (
Rz) also exhibit a rising trend, showing how surface texture deteriorates as machining advances. Initially,
Rt is approximately 6.27 µm, and
Rz follows a similar trend, indicating a stable cutting environment. However, at F5,
Rt increases to 7.13 µm, highlighting the presence of deeper surface peaks and valleys caused by machining stress accumulation. This trend strongly correlates with carbon steel 1020′s moderate hardness (150 HBW) and thermal conductivity (51 W/m·K), leading to moderate heat dissipation and increasing cutting resistance. Examining the
Rq/
Ra ratio, we see that despite the absolute rise in roughness values, the relative structure of the surface remains largely consistent, with the ratio fluctuating between 1.19 and 1.34. This indicates that the fundamental texture remains predictable while roughness increases, suggesting steady material removal rather than erratic surface formation. However, the skewness (
Rsk) values transition from slightly positive to slightly negative, which indicates that the surface morphology evolves from a peak-dominated to a more balanced or valley-dominated profile due to material deformation and machining stresses.
Figure 11b investigates the waviness characteristics of carbon steel 1020, analyzing average waviness (
Wa), root mean square waviness (
Wq), total waviness height (
Wt), and ten-point mean waviness (
Wz). The data provide valuable insights into how macro-scale surface undulations evolve as machining progresses. At the initial cutting zone (F1),
Wa is approximately 0.591 µm, while
Wq is 0.7238 µm, indicating a relatively smooth waviness profile with moderate peak-to-valley variations. The
Wq/
Wa ratio of approximately 1.22 suggests that surface waviness is well-distributed without excessive sharp peaks or deep valleys. However, as cutting progresses,
Wa slightly decreases to 0.498 µm at F5, while
Wq stabilizes at 0.6043 µm, signifying that macro-scale waviness variations are gradually reduced, even as fine-scale roughness increases. The total waviness height (
Wt) and ten-point mean waviness (
Wz) further reinforce this trend. Initially,
Wt is around 3.45 µm, and
Wz is approximately 1.23 µm, reflecting moderate undulations in the cutting zone. However, by the final cutting zone (F5),
Wt declines to 2.70 µm.
Wz stabilizes at around 1.22 µm, suggesting that larger waviness features are gradually smoothed out as material deformation and tool-wear effects increase. Despite the increase in roughness, this reduction in waviness suggests an inverse relationship between surface roughness and waviness at later machining stages.
A key observation is in the waviness skewness (Wsk) and waviness kurtosis (Wku) values, which provide insight into how the waviness distribution changes as machining progresses. Initially, Wsk is slightly negative (−0.0689), indicating a mild valley-dominated waviness structure, while Wku is around 2.72, reflecting a moderate peak distribution. However, as machining progresses, Wsk shifts further into negative territory, emphasizing a growing trend toward valley formation rather than peak dominance. This transition suggests that machining forces gradually erode peak formations, smoothing out larger-scale waviness features while increasing micro-scale roughness.
The relationship between roughness (Ra, Rq, Rt, Rz) and waviness (Wa, Wq, Wt, Wz) provides key insights into how micro-scale surface roughness influences macro-scale surface waviness. At early cutting stages (F1–F2), both roughness and waviness remain stable, indicating a controlled machining environment with minimal tool wear effects. However, roughness increases at later cutting zones (F4–F5) while waviness decreases, highlighting an inverse relationship where macro-scale waviness stabilizes while micro-scale roughness worsens. This trend reinforces the material-dependent nature of carbon steel 1020, where its moderate hardness and thermal conductivity initially lead to steady machining conditions. However, increased cutting resistance and tool wear eventually deteriorate fine-scale surface characteristics while reducing large-scale waviness. Another notable trend is in the skewness (Rsk) and kurtosis (Rku) evolution, which indicates that surface morphology transitions from peak-dominated structures to more balanced or valley-dominated formations. This change suggests that the combined effects of machining stress, tool wear, and material plasticity lead to a redistribution of surface features, reducing sharp peaks and smoothing out waviness undulations.
Figure 11a,b provide a detailed analysis of how surface roughness and waviness evolve across different cutting zones for carbon steel 1020 annealed. The findings highlight that while carbon steel 1020 exhibits relatively moderate machining characteristics, its increasing cutting resistance over time leads to a trade-off between roughness and waviness development. The results emphasize that while
Ra,
Rq,
Rt, and
Rz offer insights into fine-scale roughness,
Wa,
Wq,
Wt, and
Wz provide a broader perspective on waviness behavior. The inverse relationship between roughness increase and waviness reduction suggests that as machining advances, plastic deformation and tool wear effects smooth out larger-scale waviness features while simultaneously increasing finer-scale roughness characteristics. These findings reinforce the need for precision machining strategies for carbon steel 1020, balancing cutting speeds, tool geometry, and lubrication strategies to optimize surface quality. The observed shift from peak-dominated to valley-dominated surfaces (negative
Wsk evolution) further highlights the importance of adaptive cutting techniques to control surface formation, ensuring uniform surface integrity while minimizing machining-induced defects.
