
Research on the Performance Laws of the Piezoelectric Beam and Magnetic Coupling Module of the Magnetic-Coupled Double-Wing Negative Stiffness Energy Harvester

Abstract
1. Introduction
2. Device Design and Static Analysis
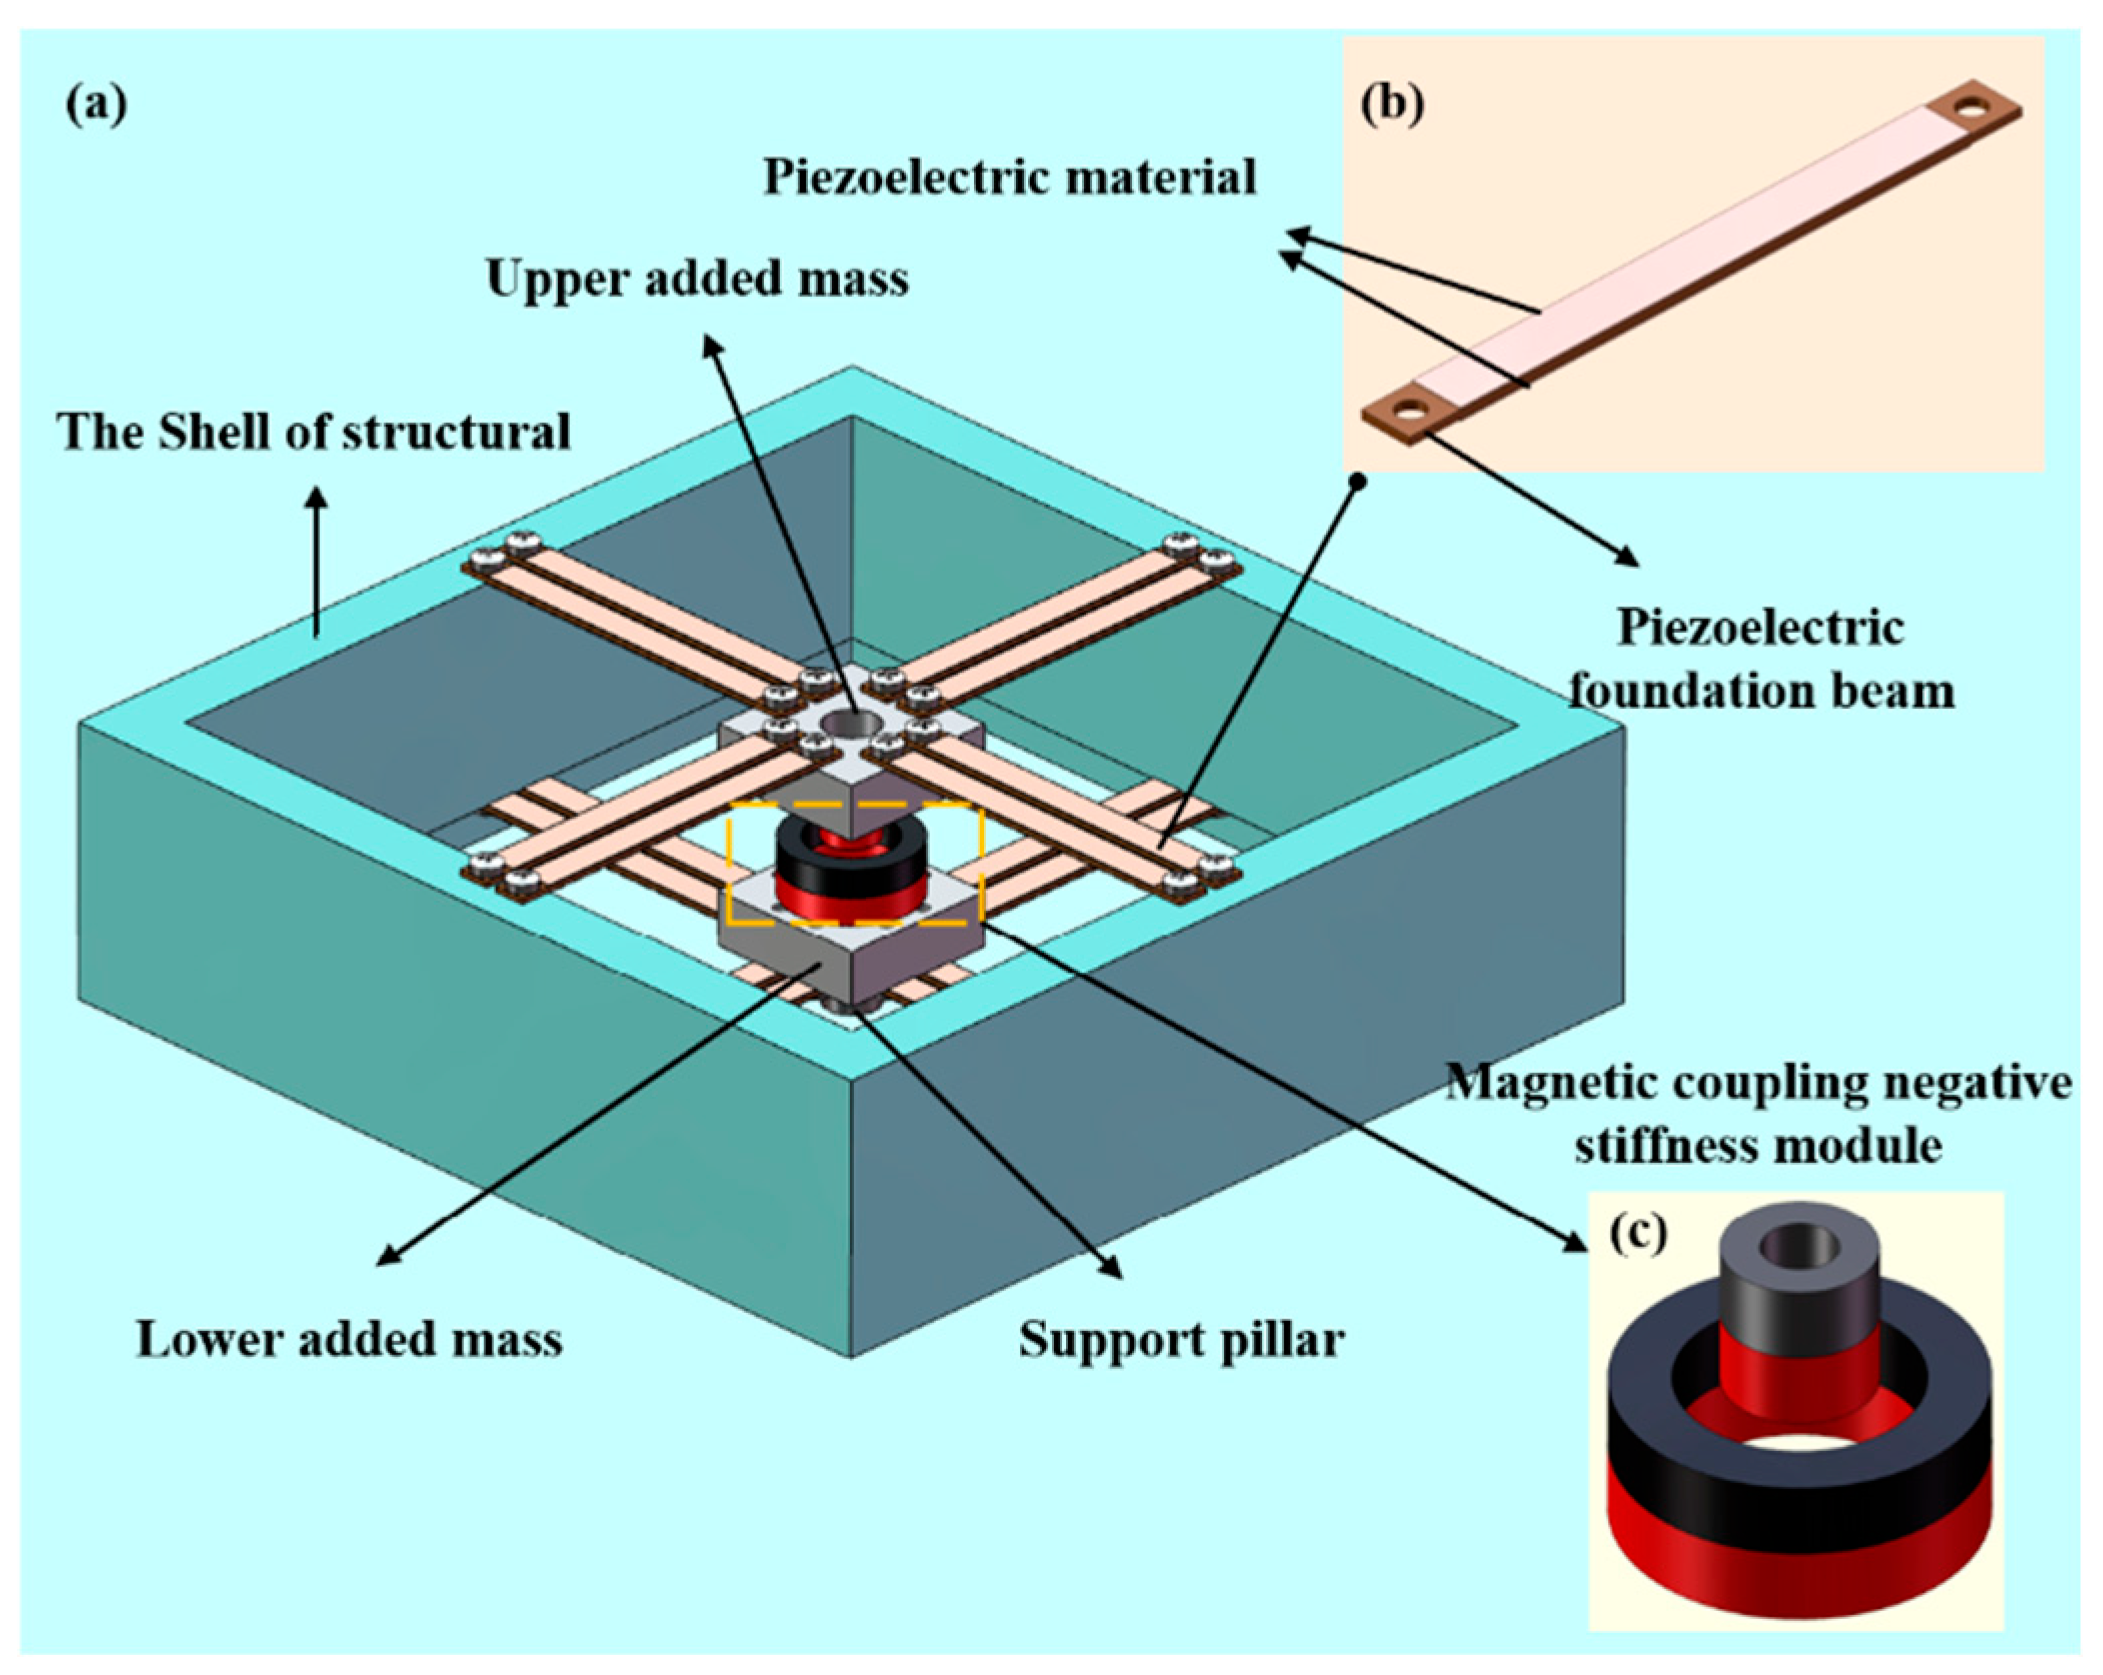
2.1. Structural Configuration
2.2. Simulation Parameter Setting
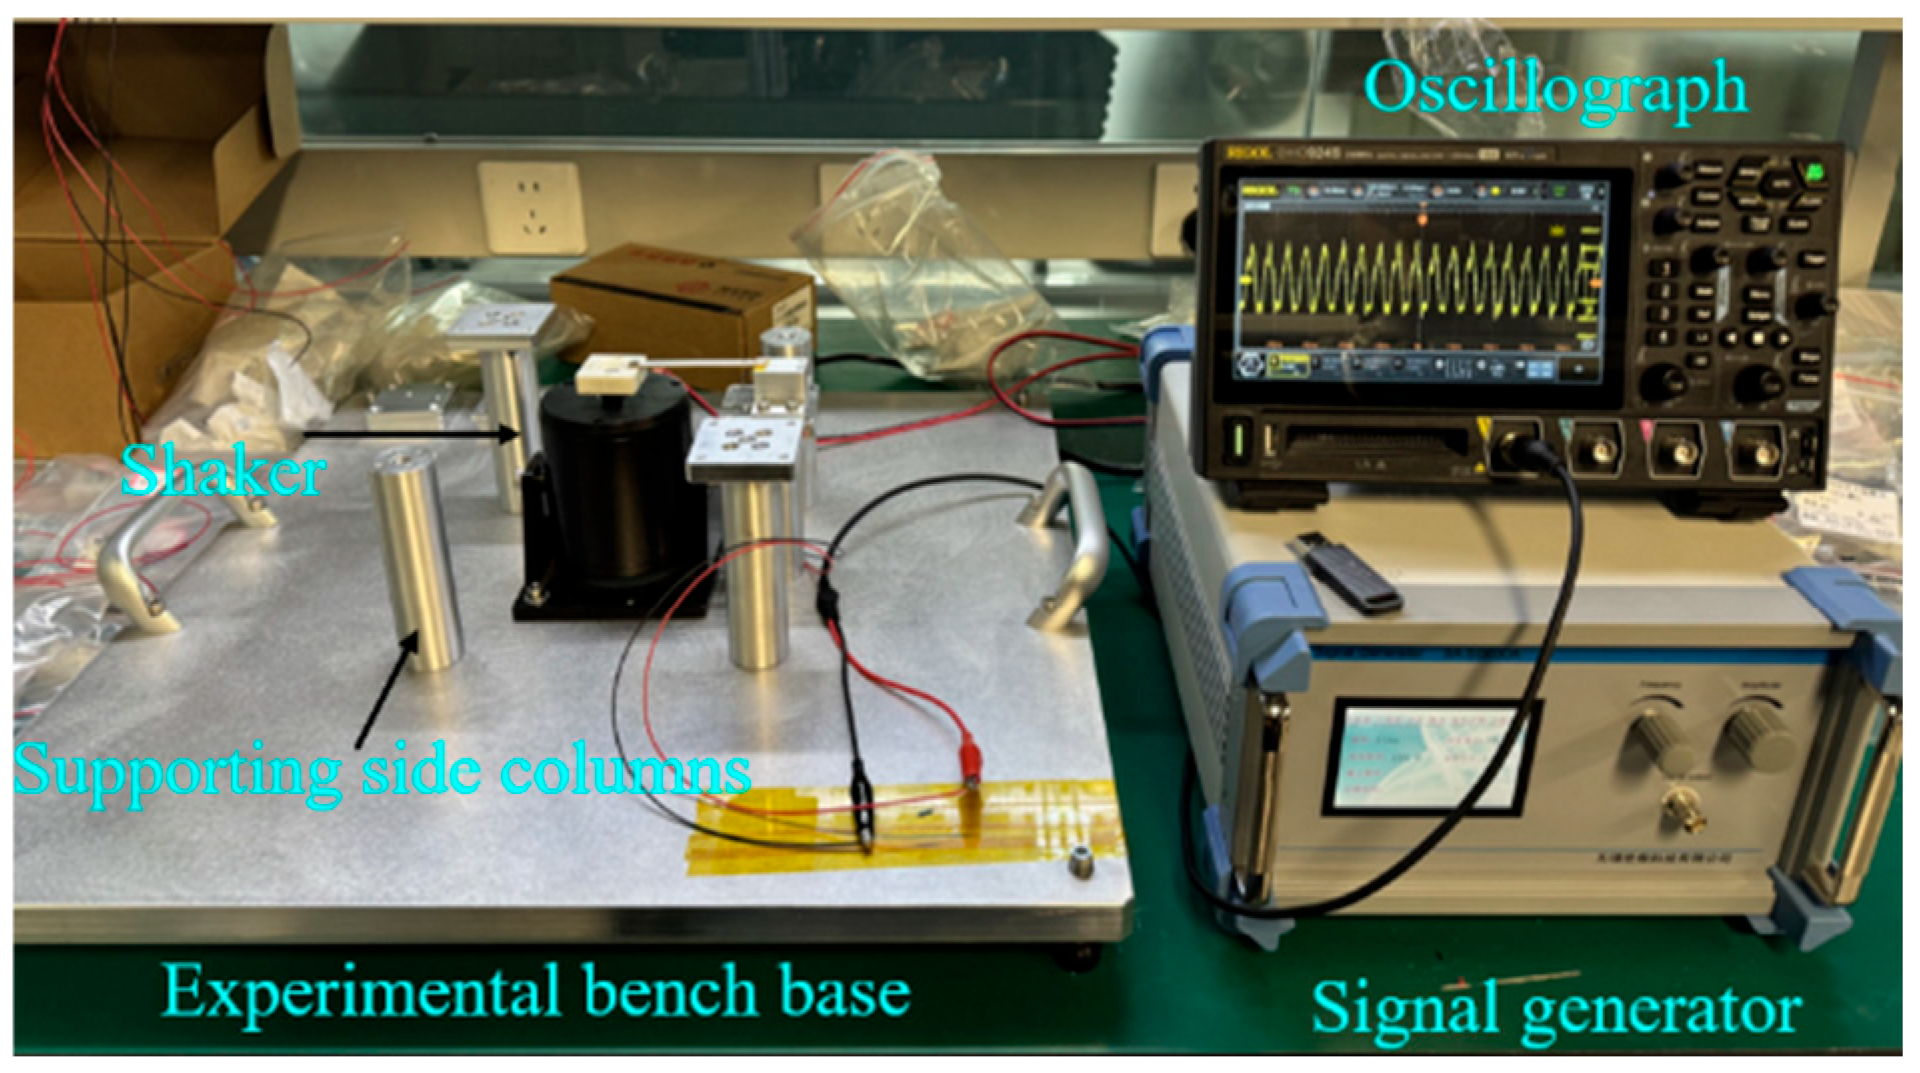
2.3. Experimental Setting
3. Results and Discussion
3.1. Single-Wing Piezoelectric Beam Performance
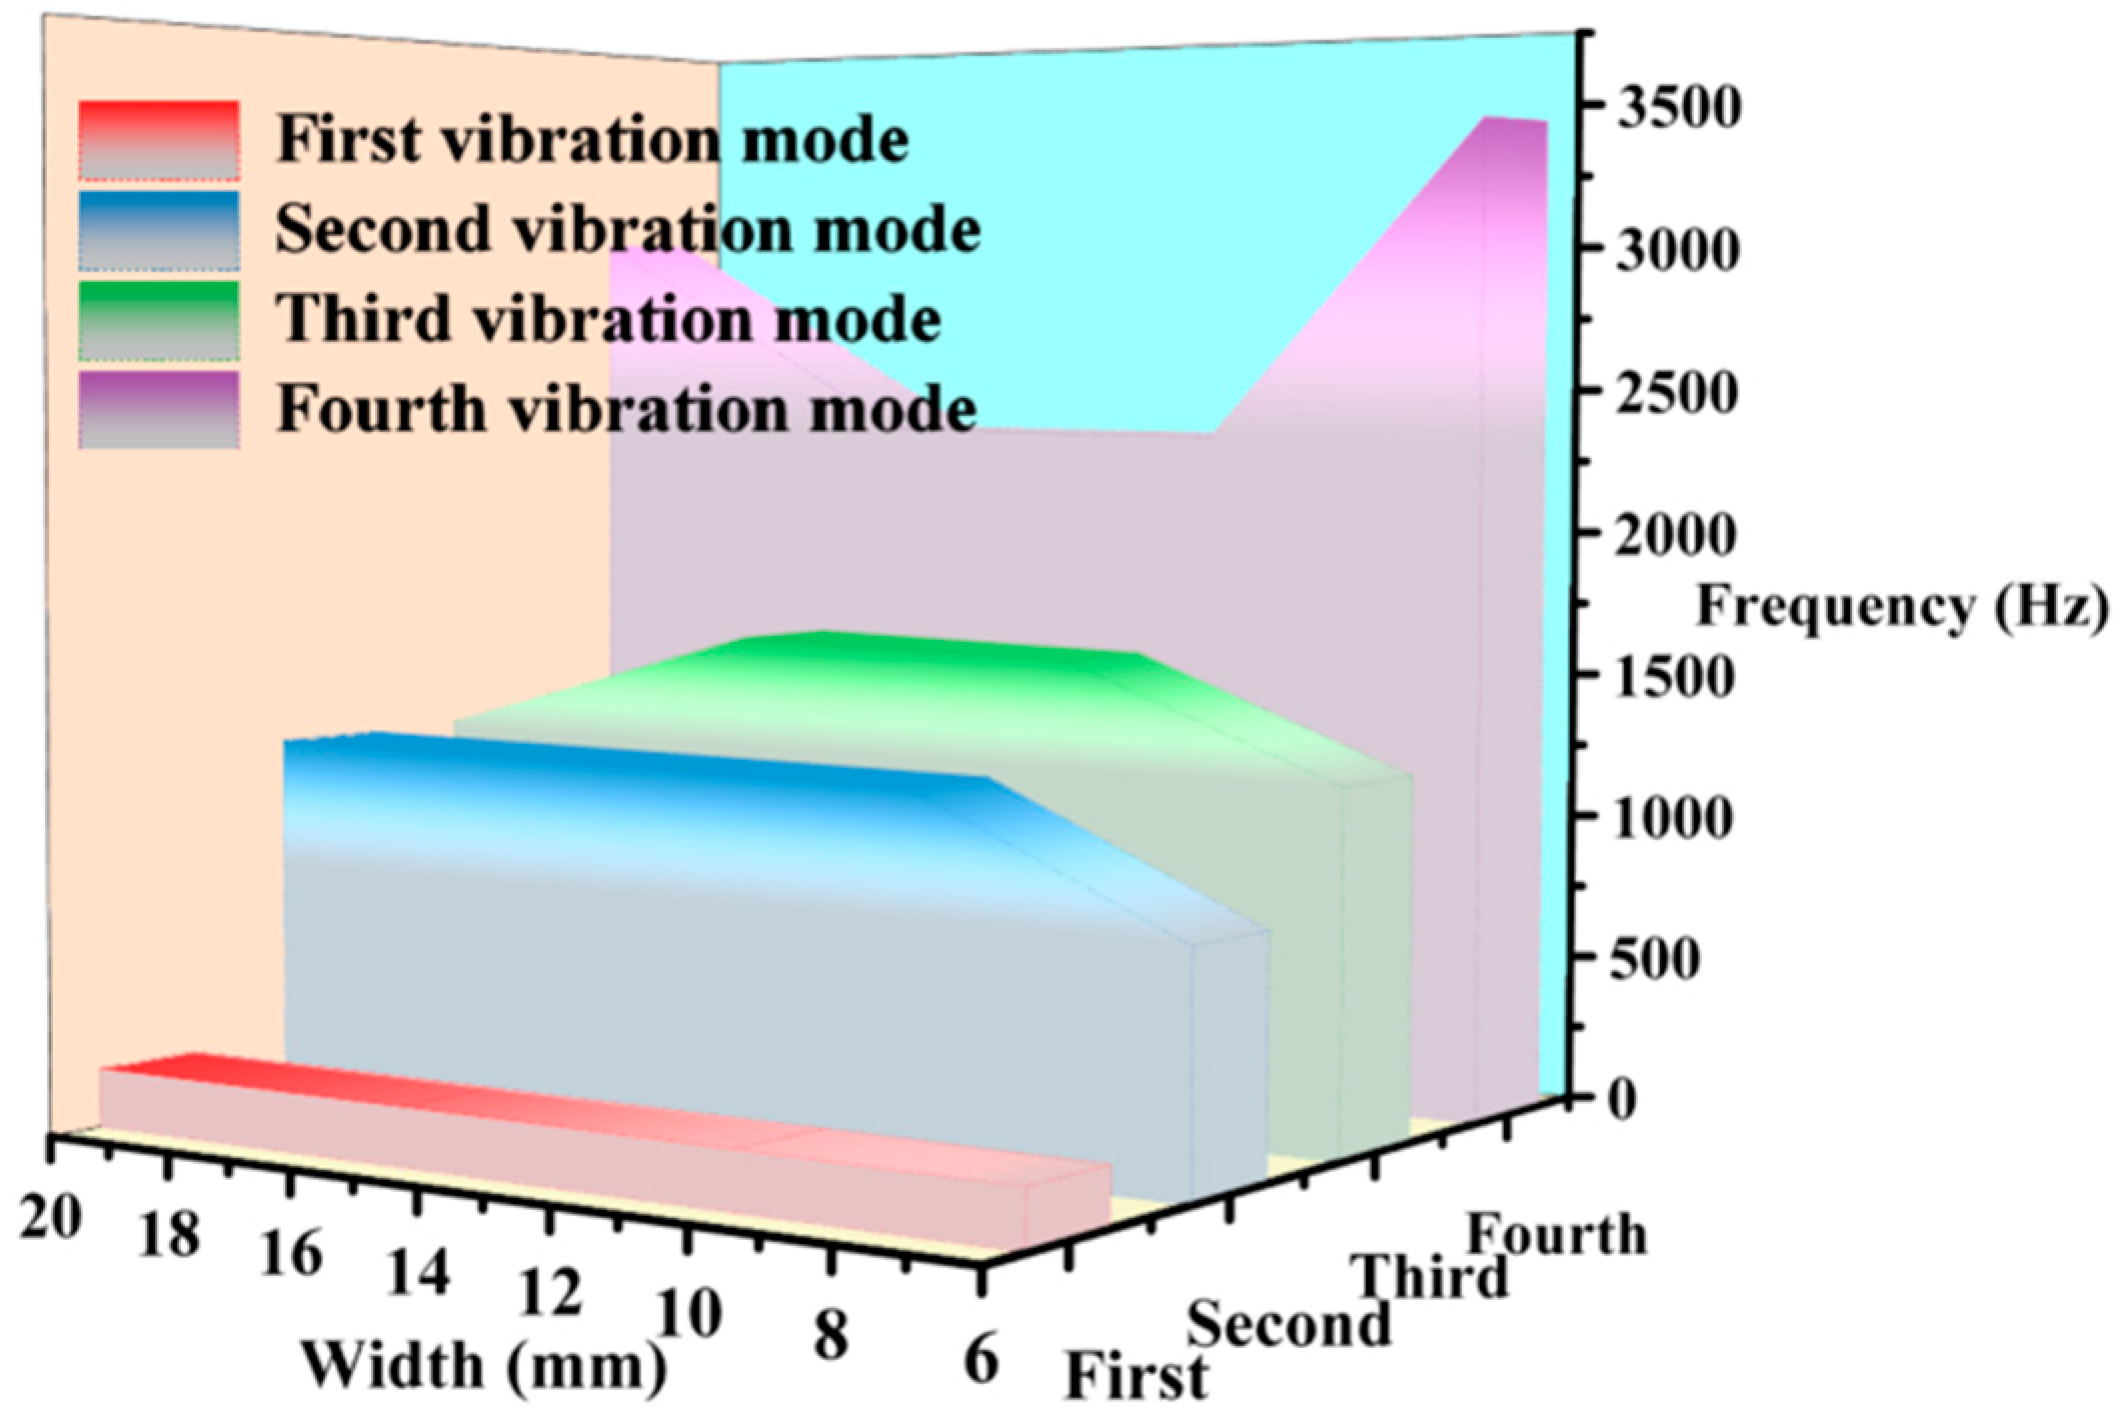
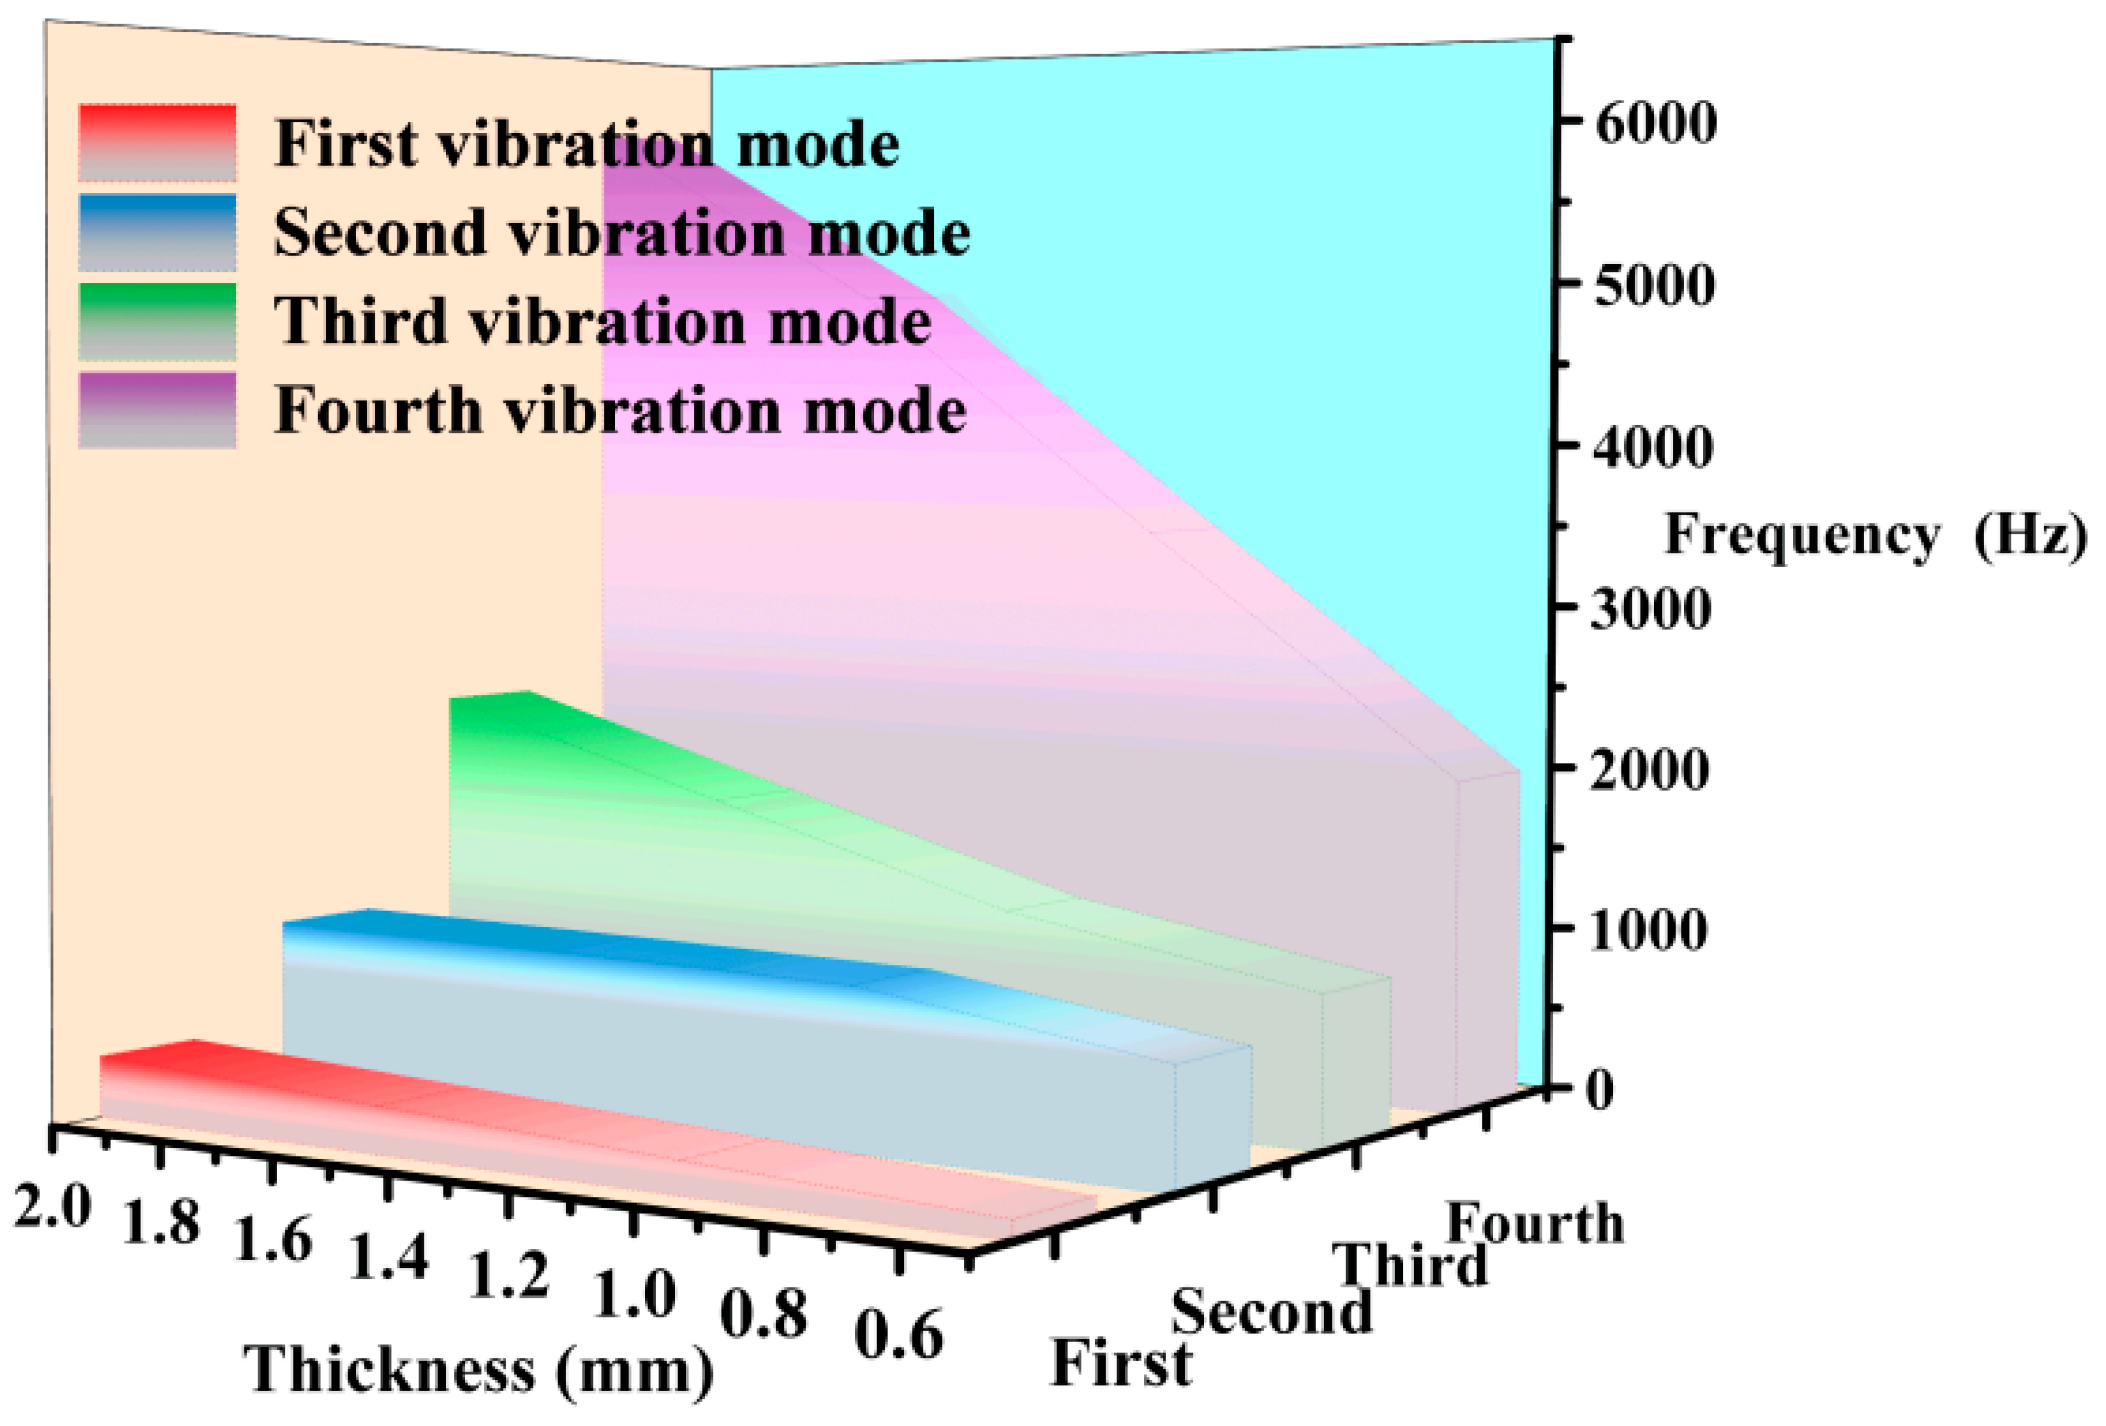
3.1.1. Modal Analysis
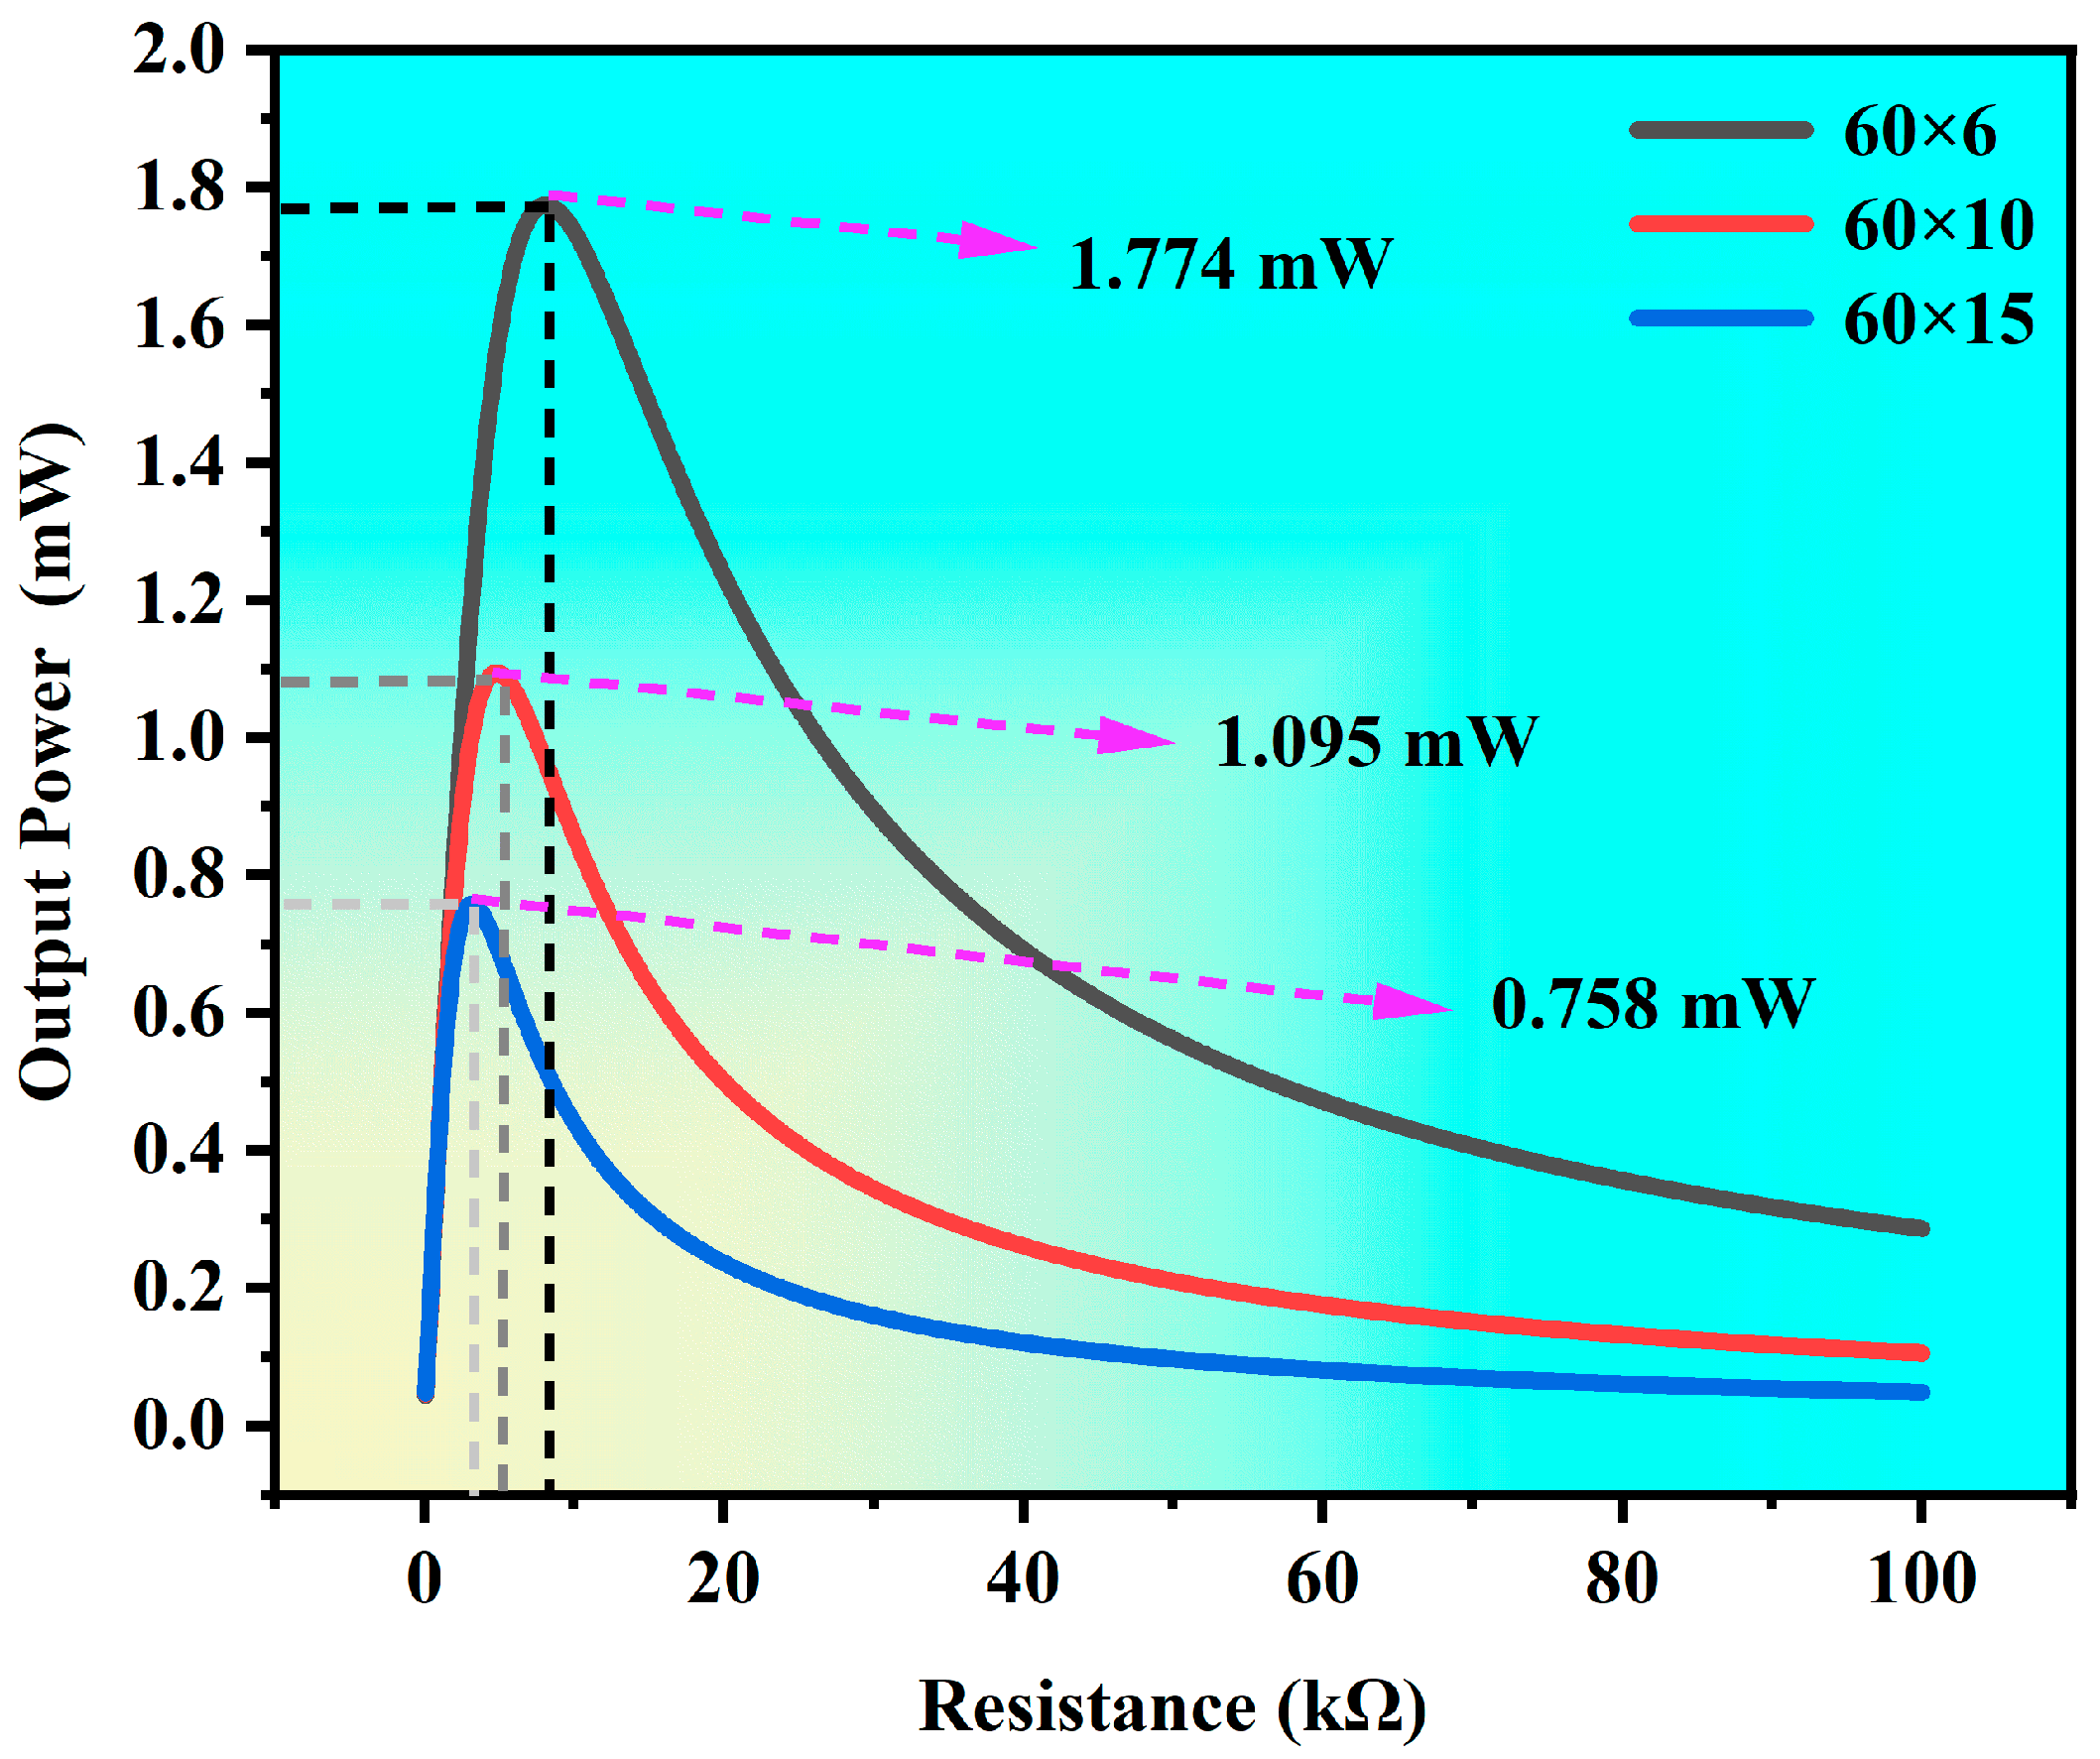
3.1.2. Resistance Correlation Analysis
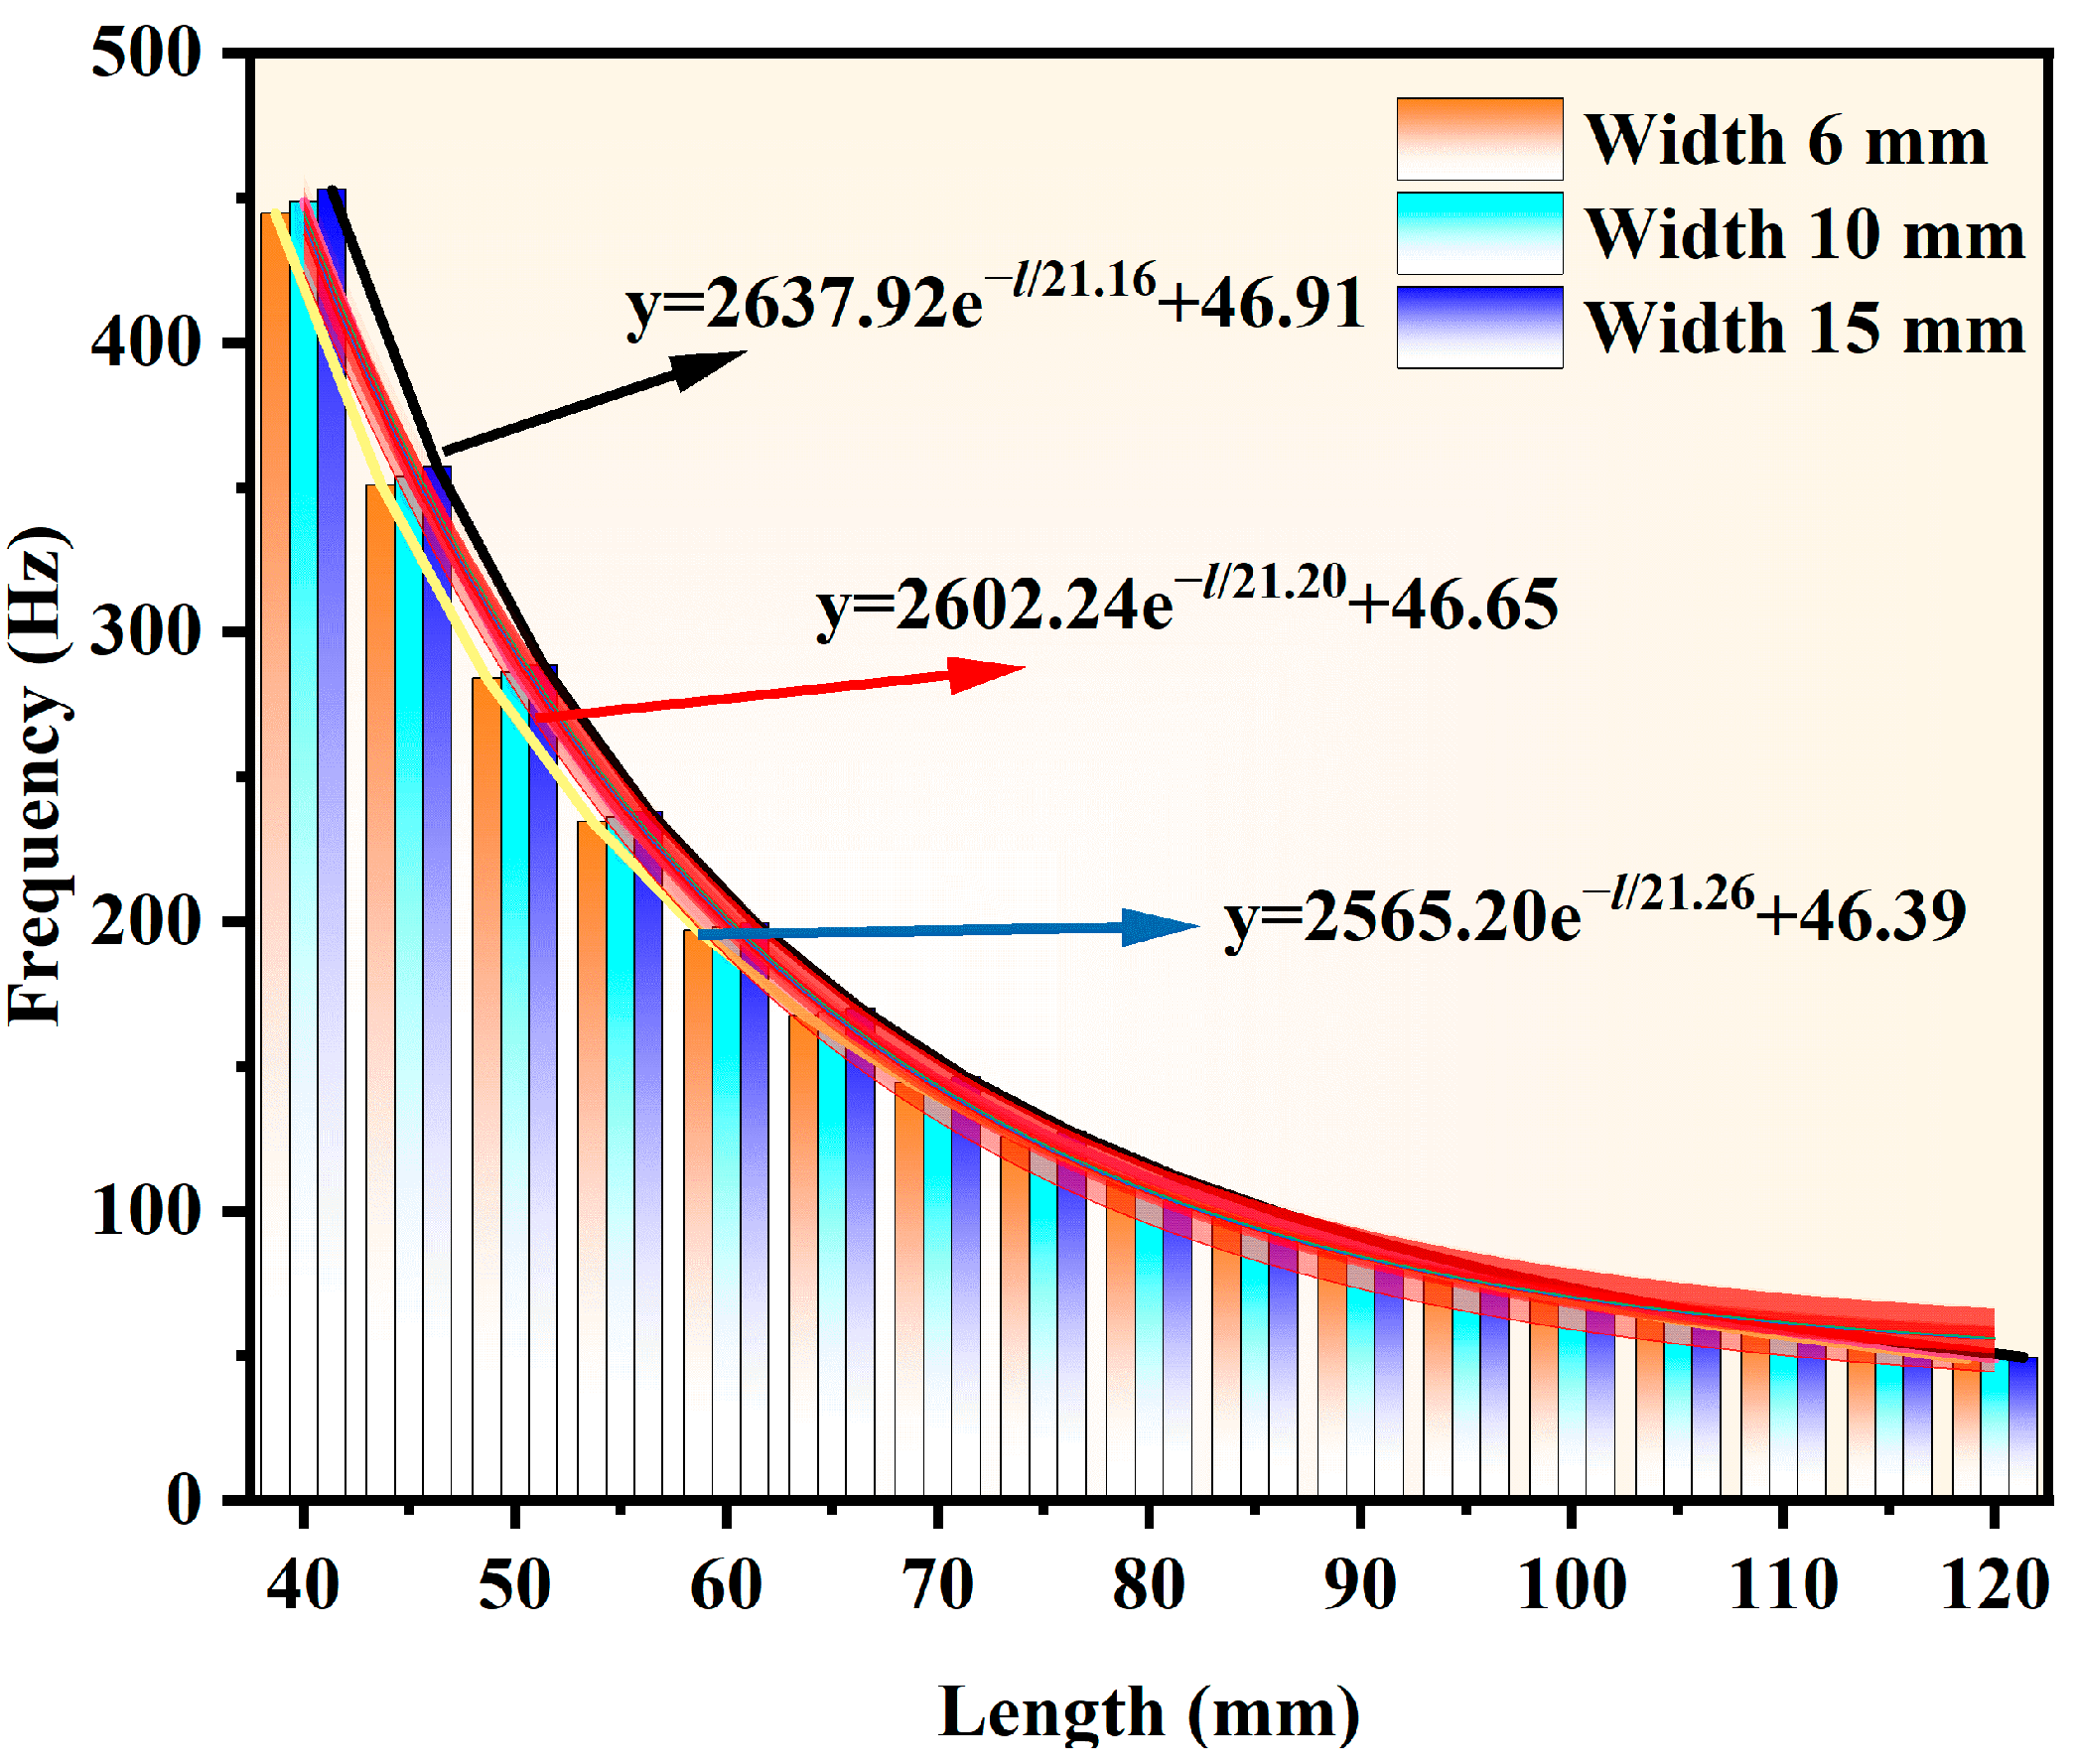
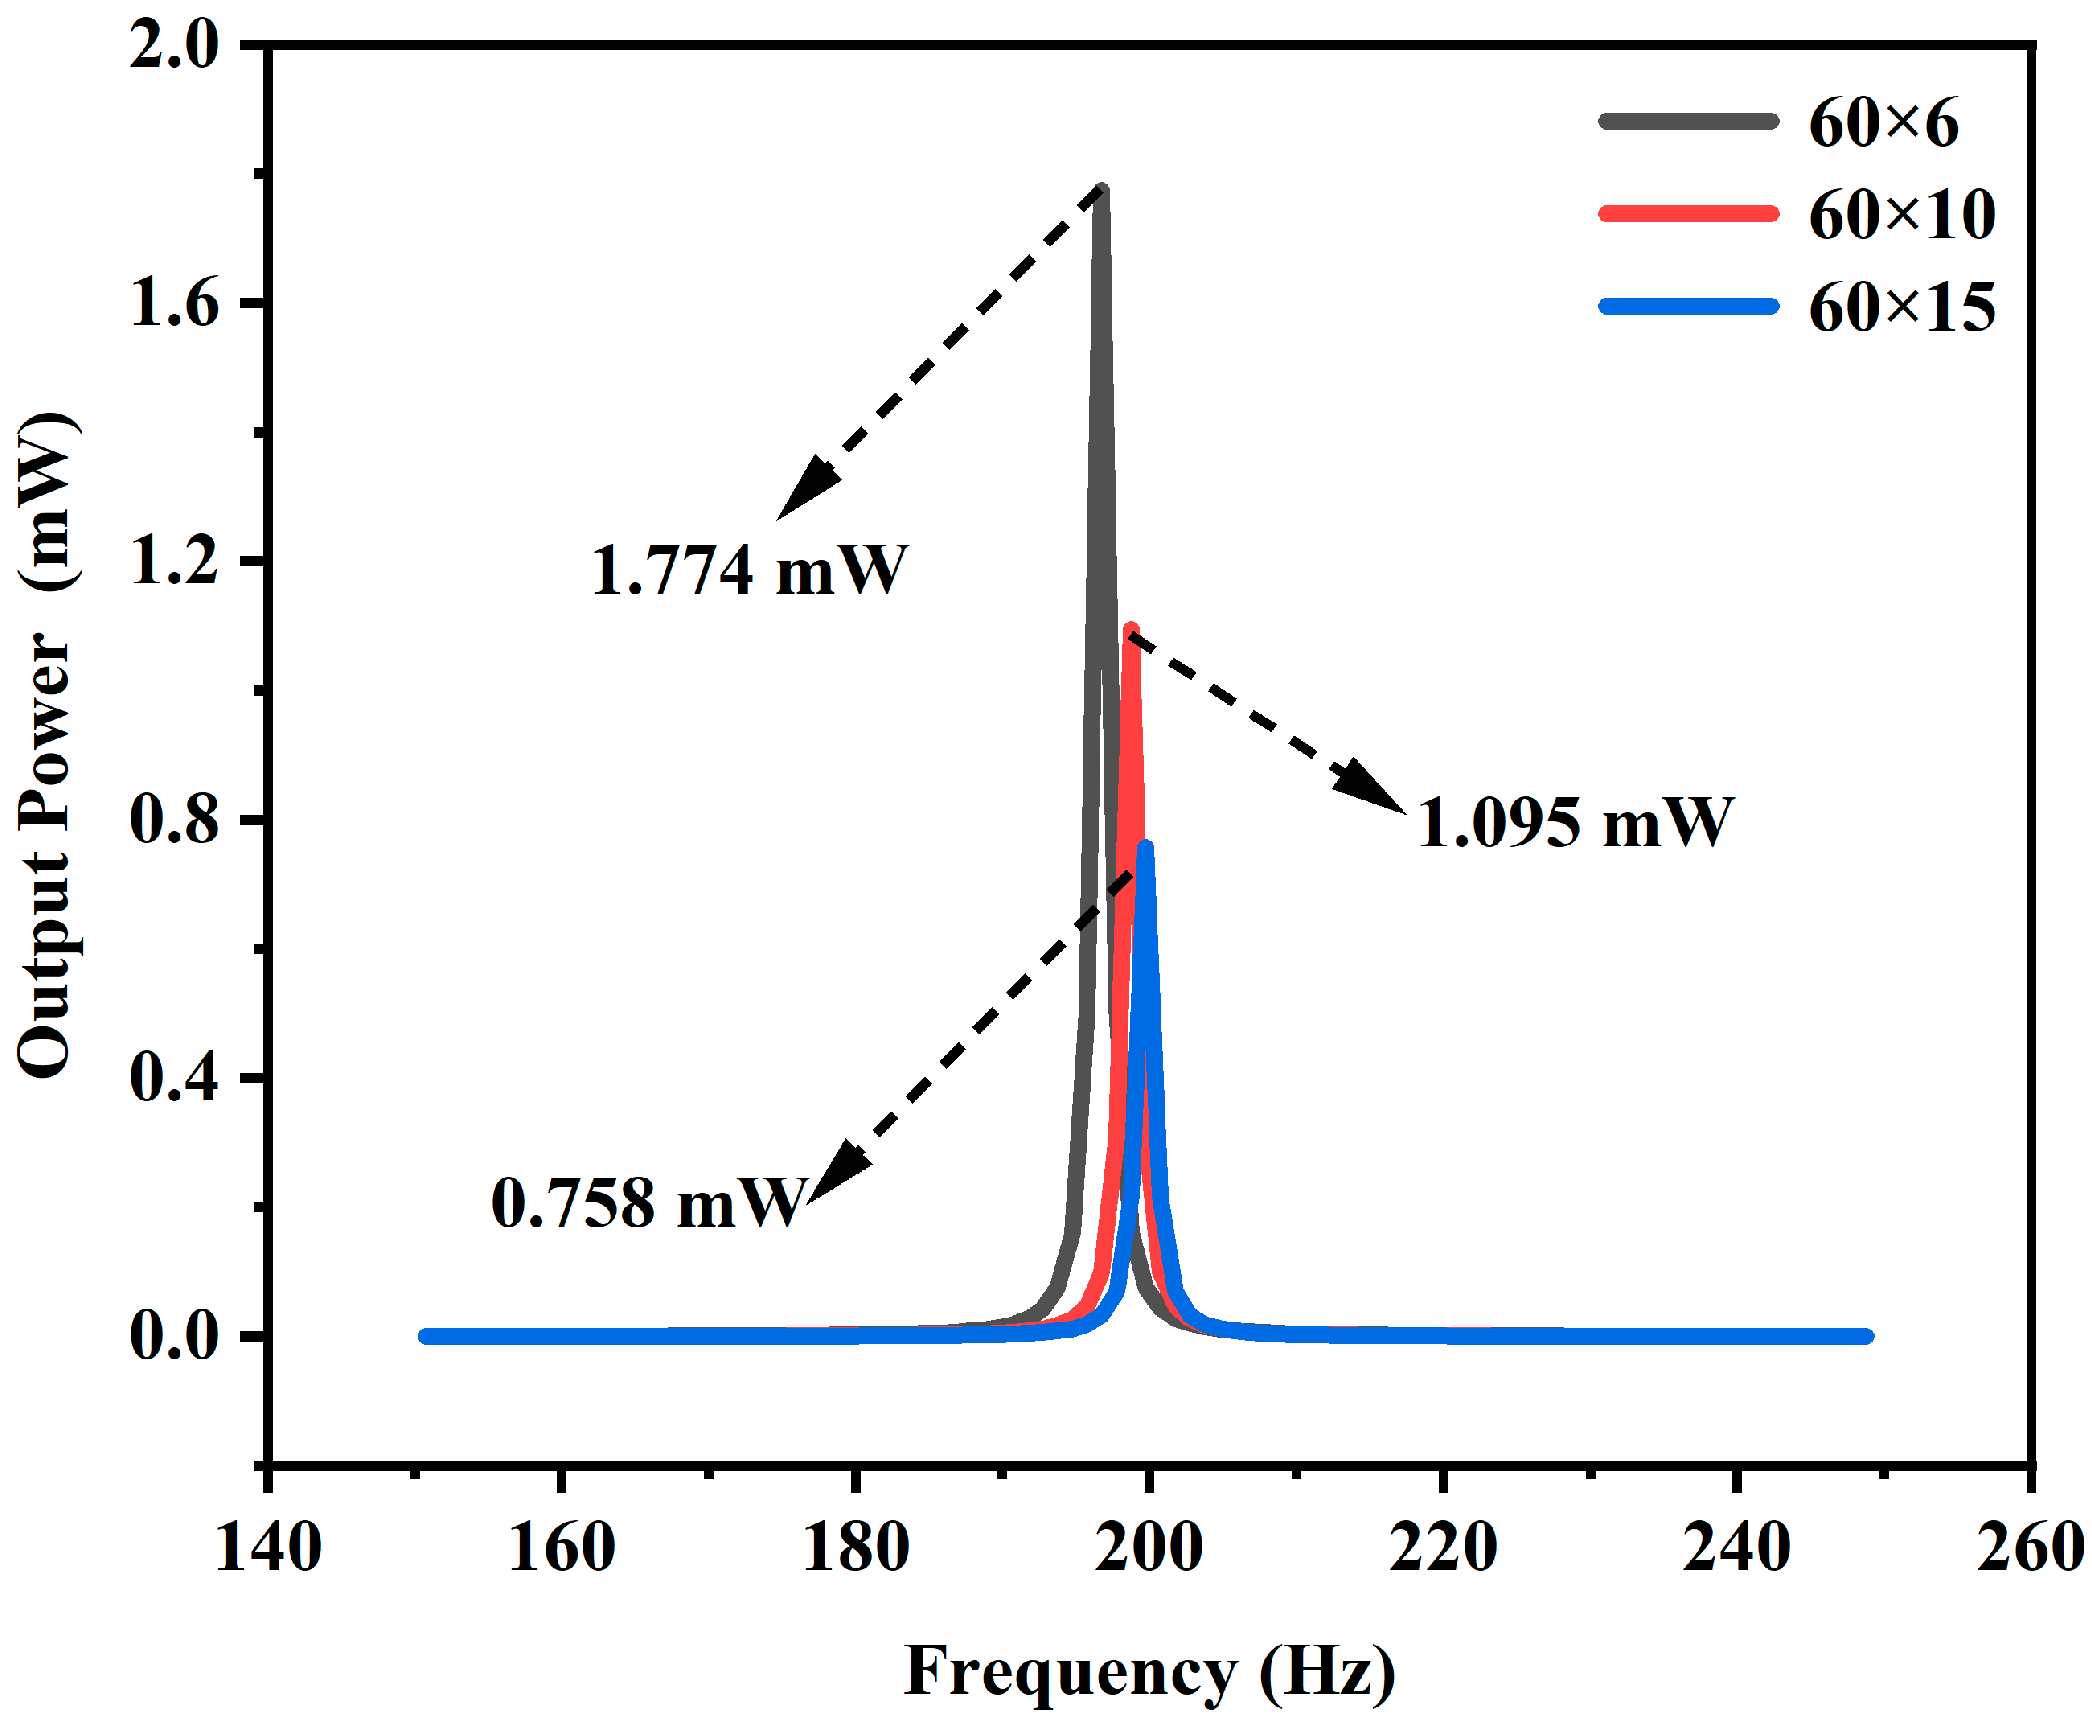
3.1.3. Frequency Correlation Analysis
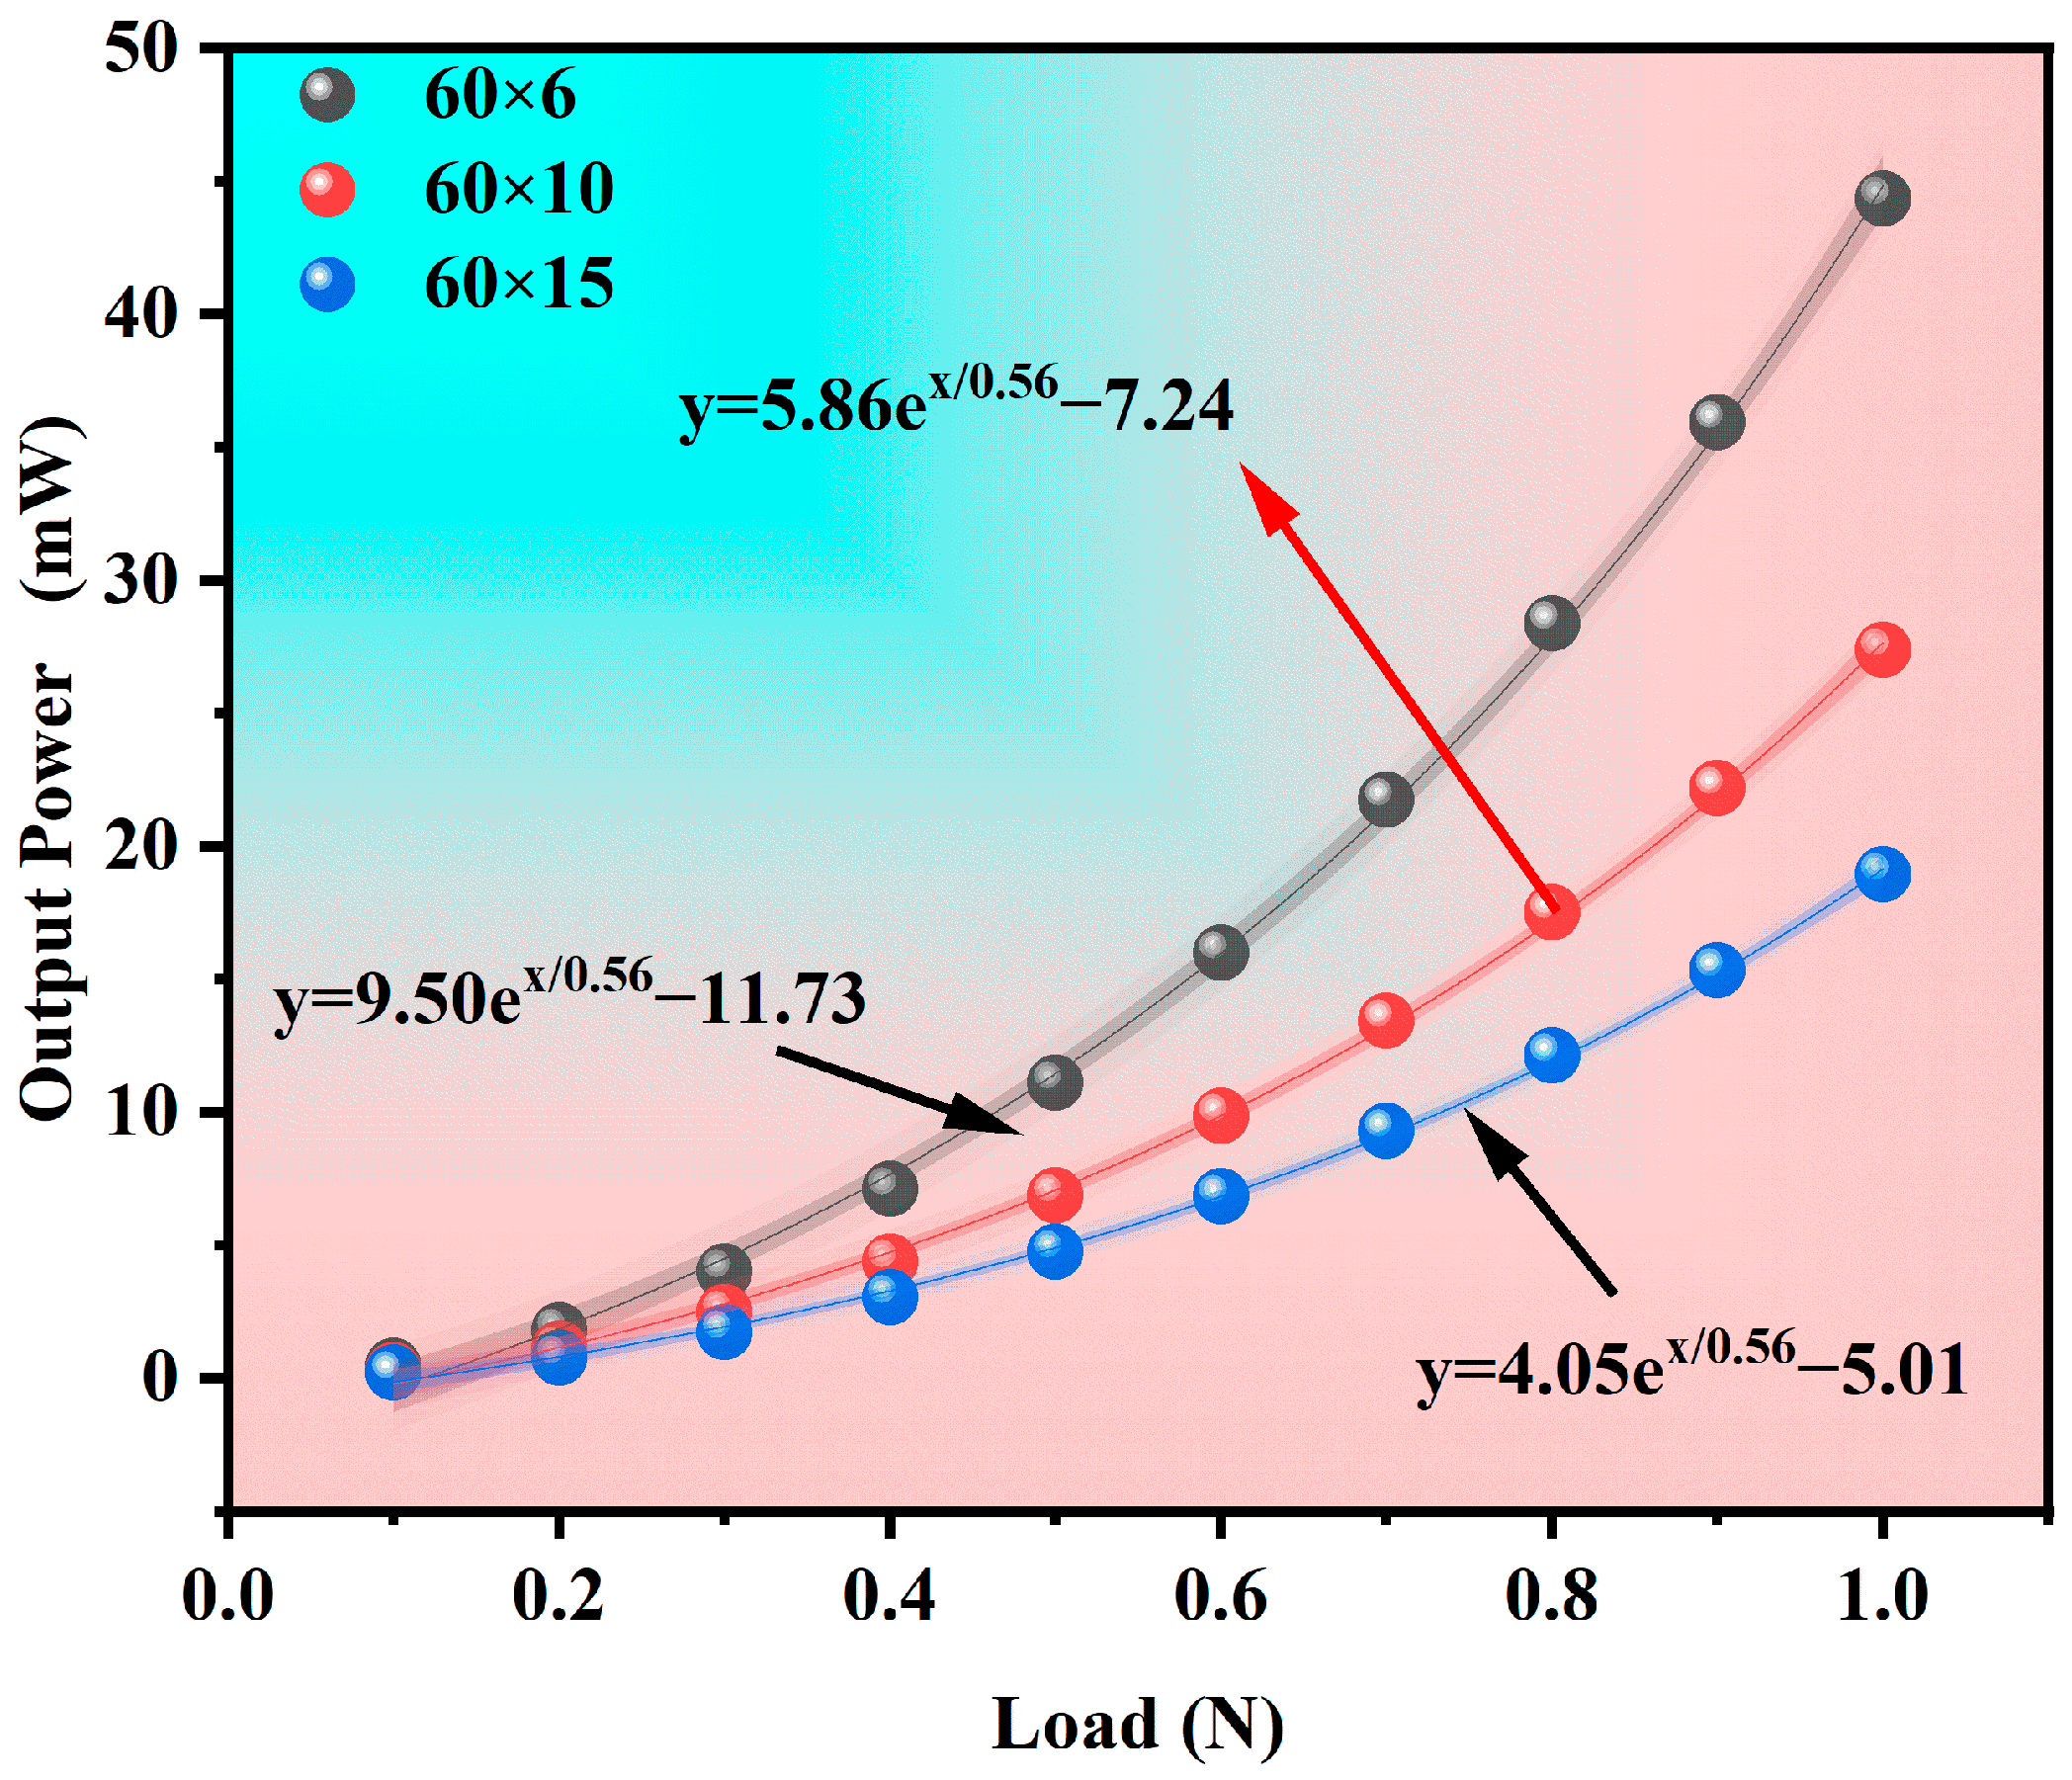
3.1.4. Load Correlation Analysis
3.1.5. Experimental-Simulation Correlation Analysis
3.2. Magnetic-Coupling Performance
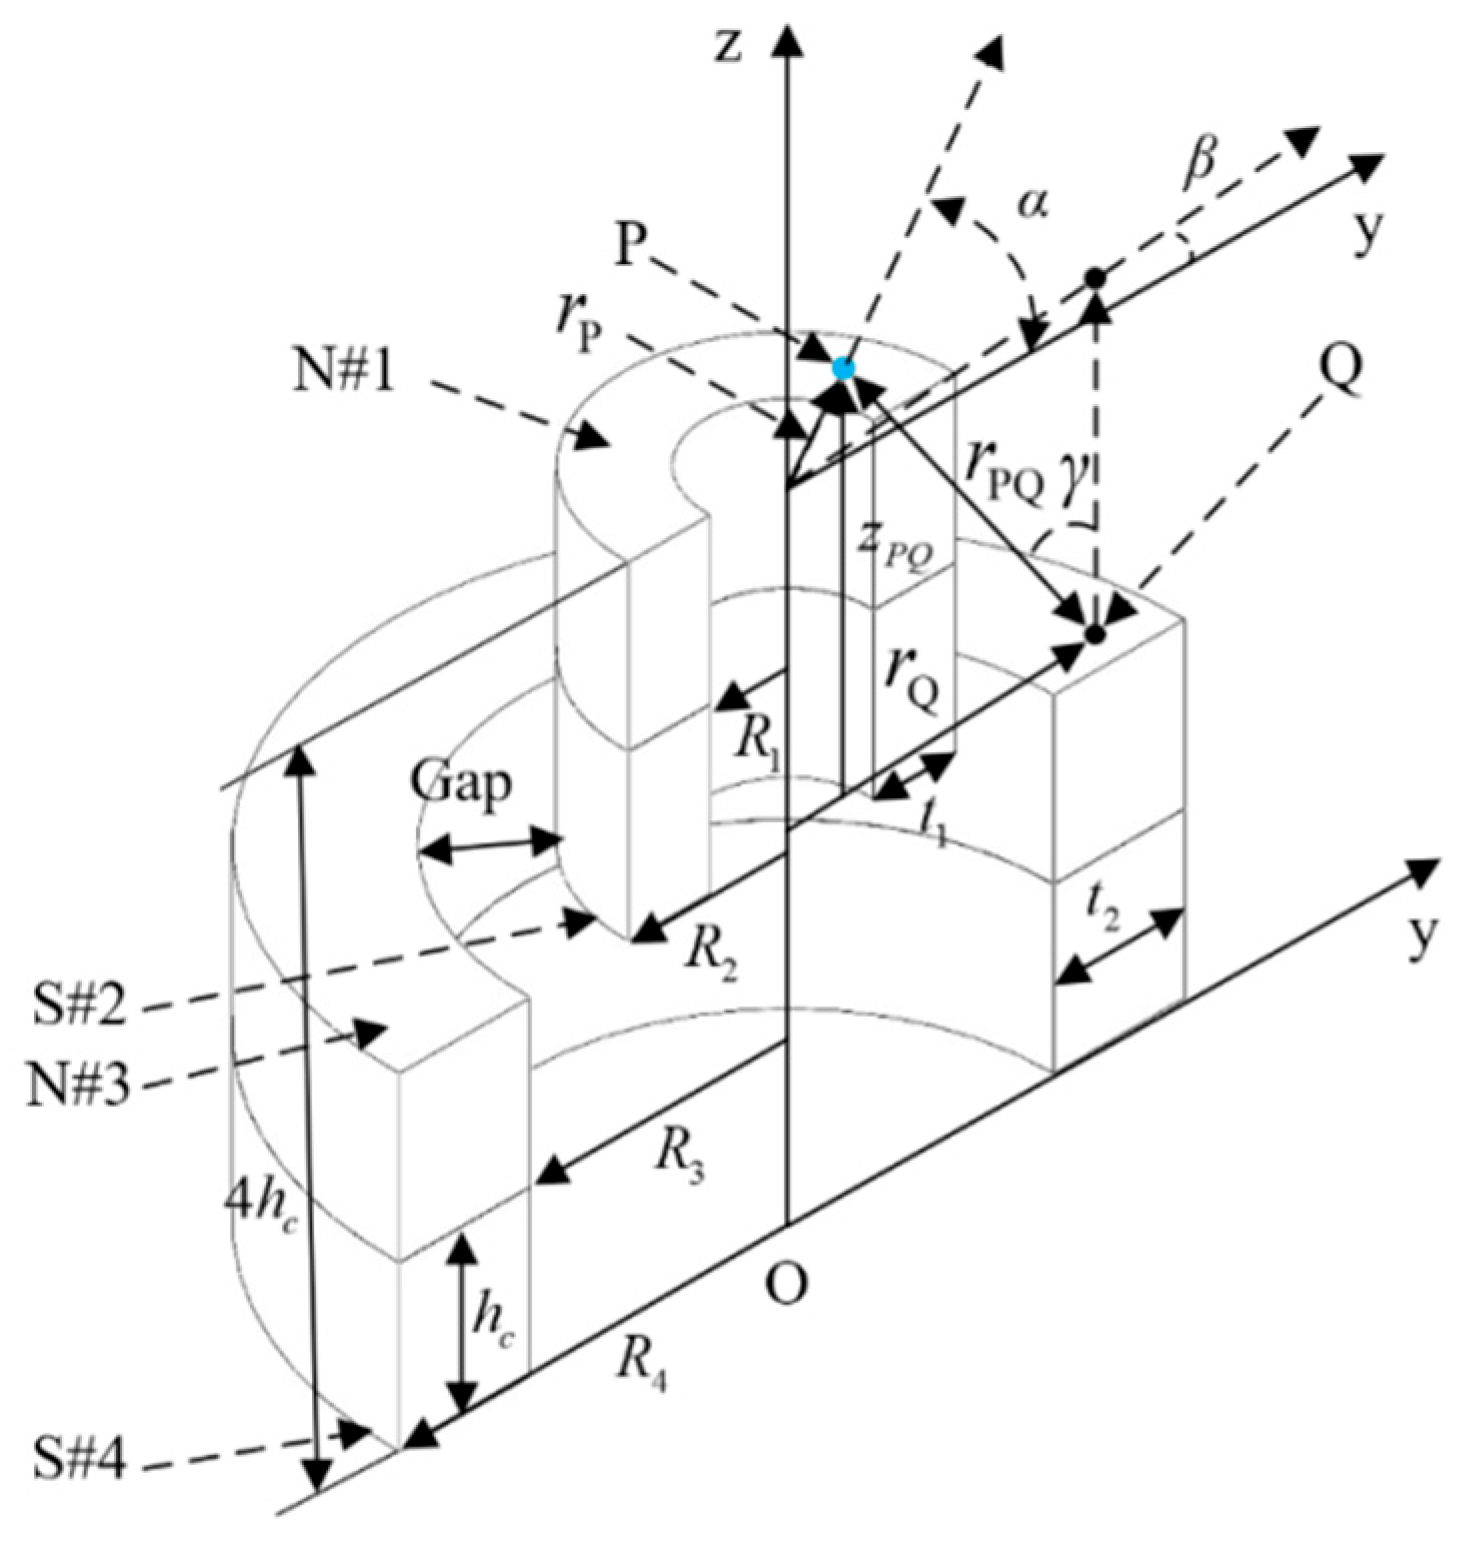
3.2.1. Theoretical Model
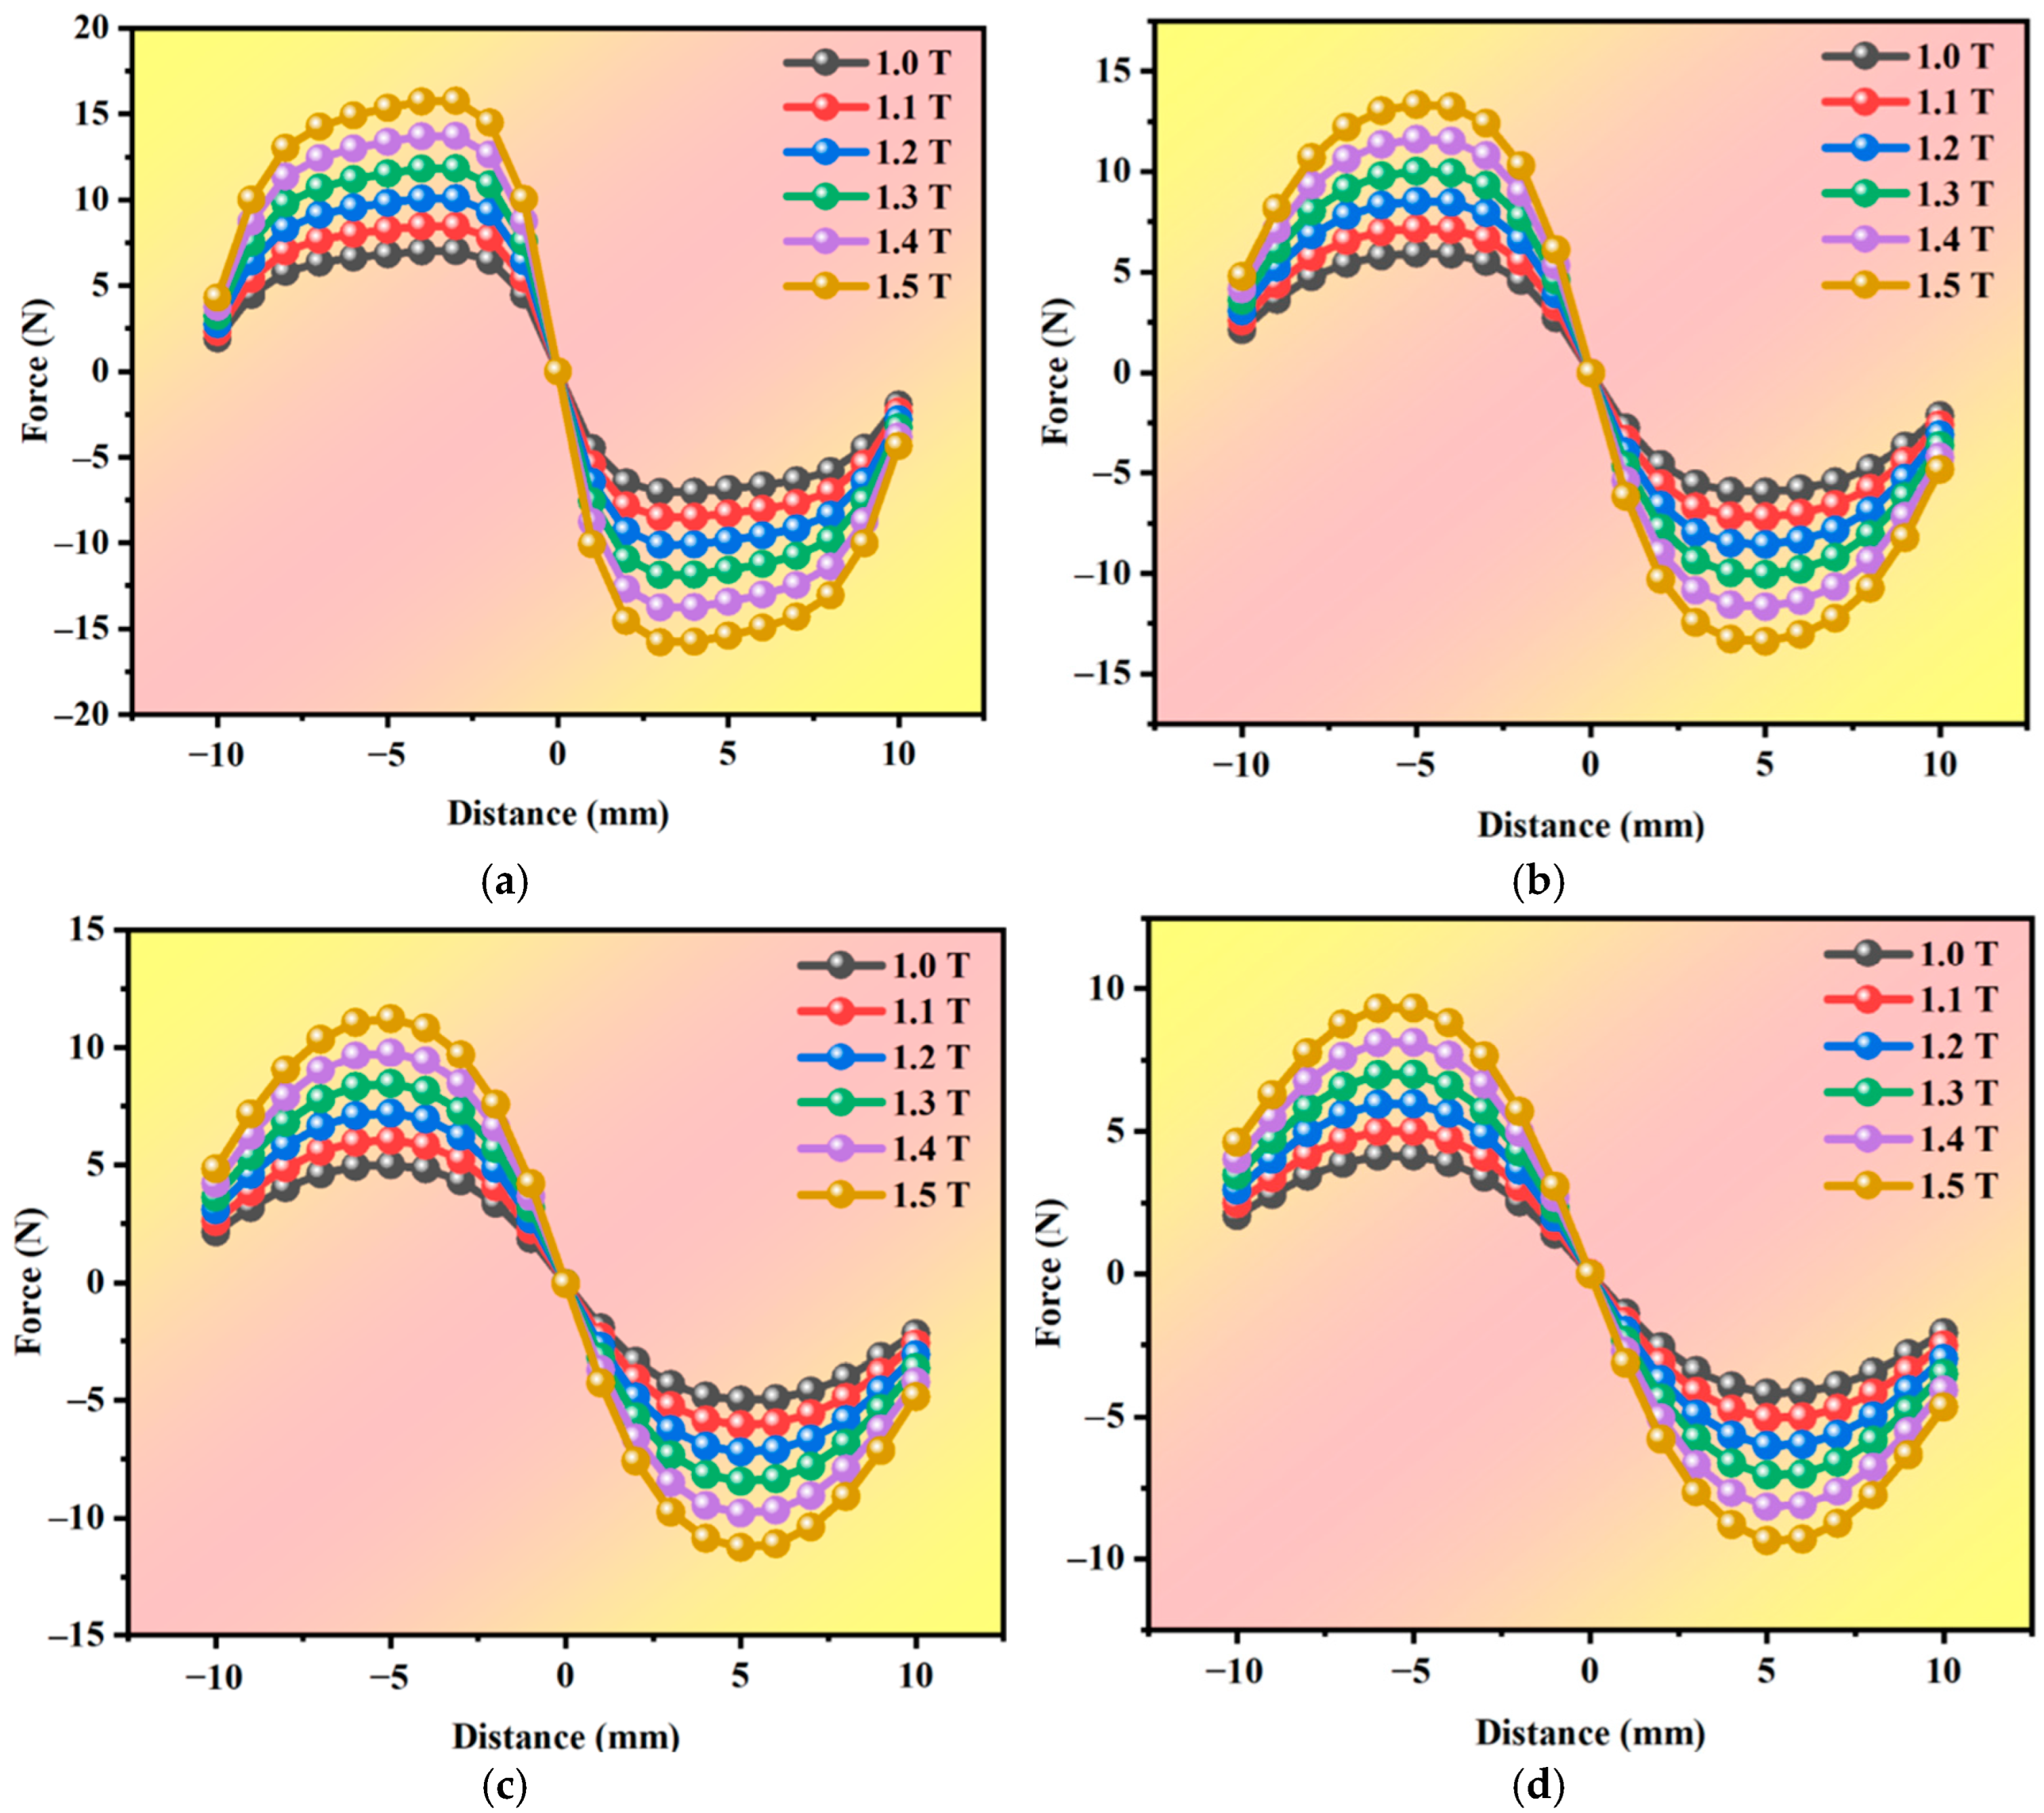
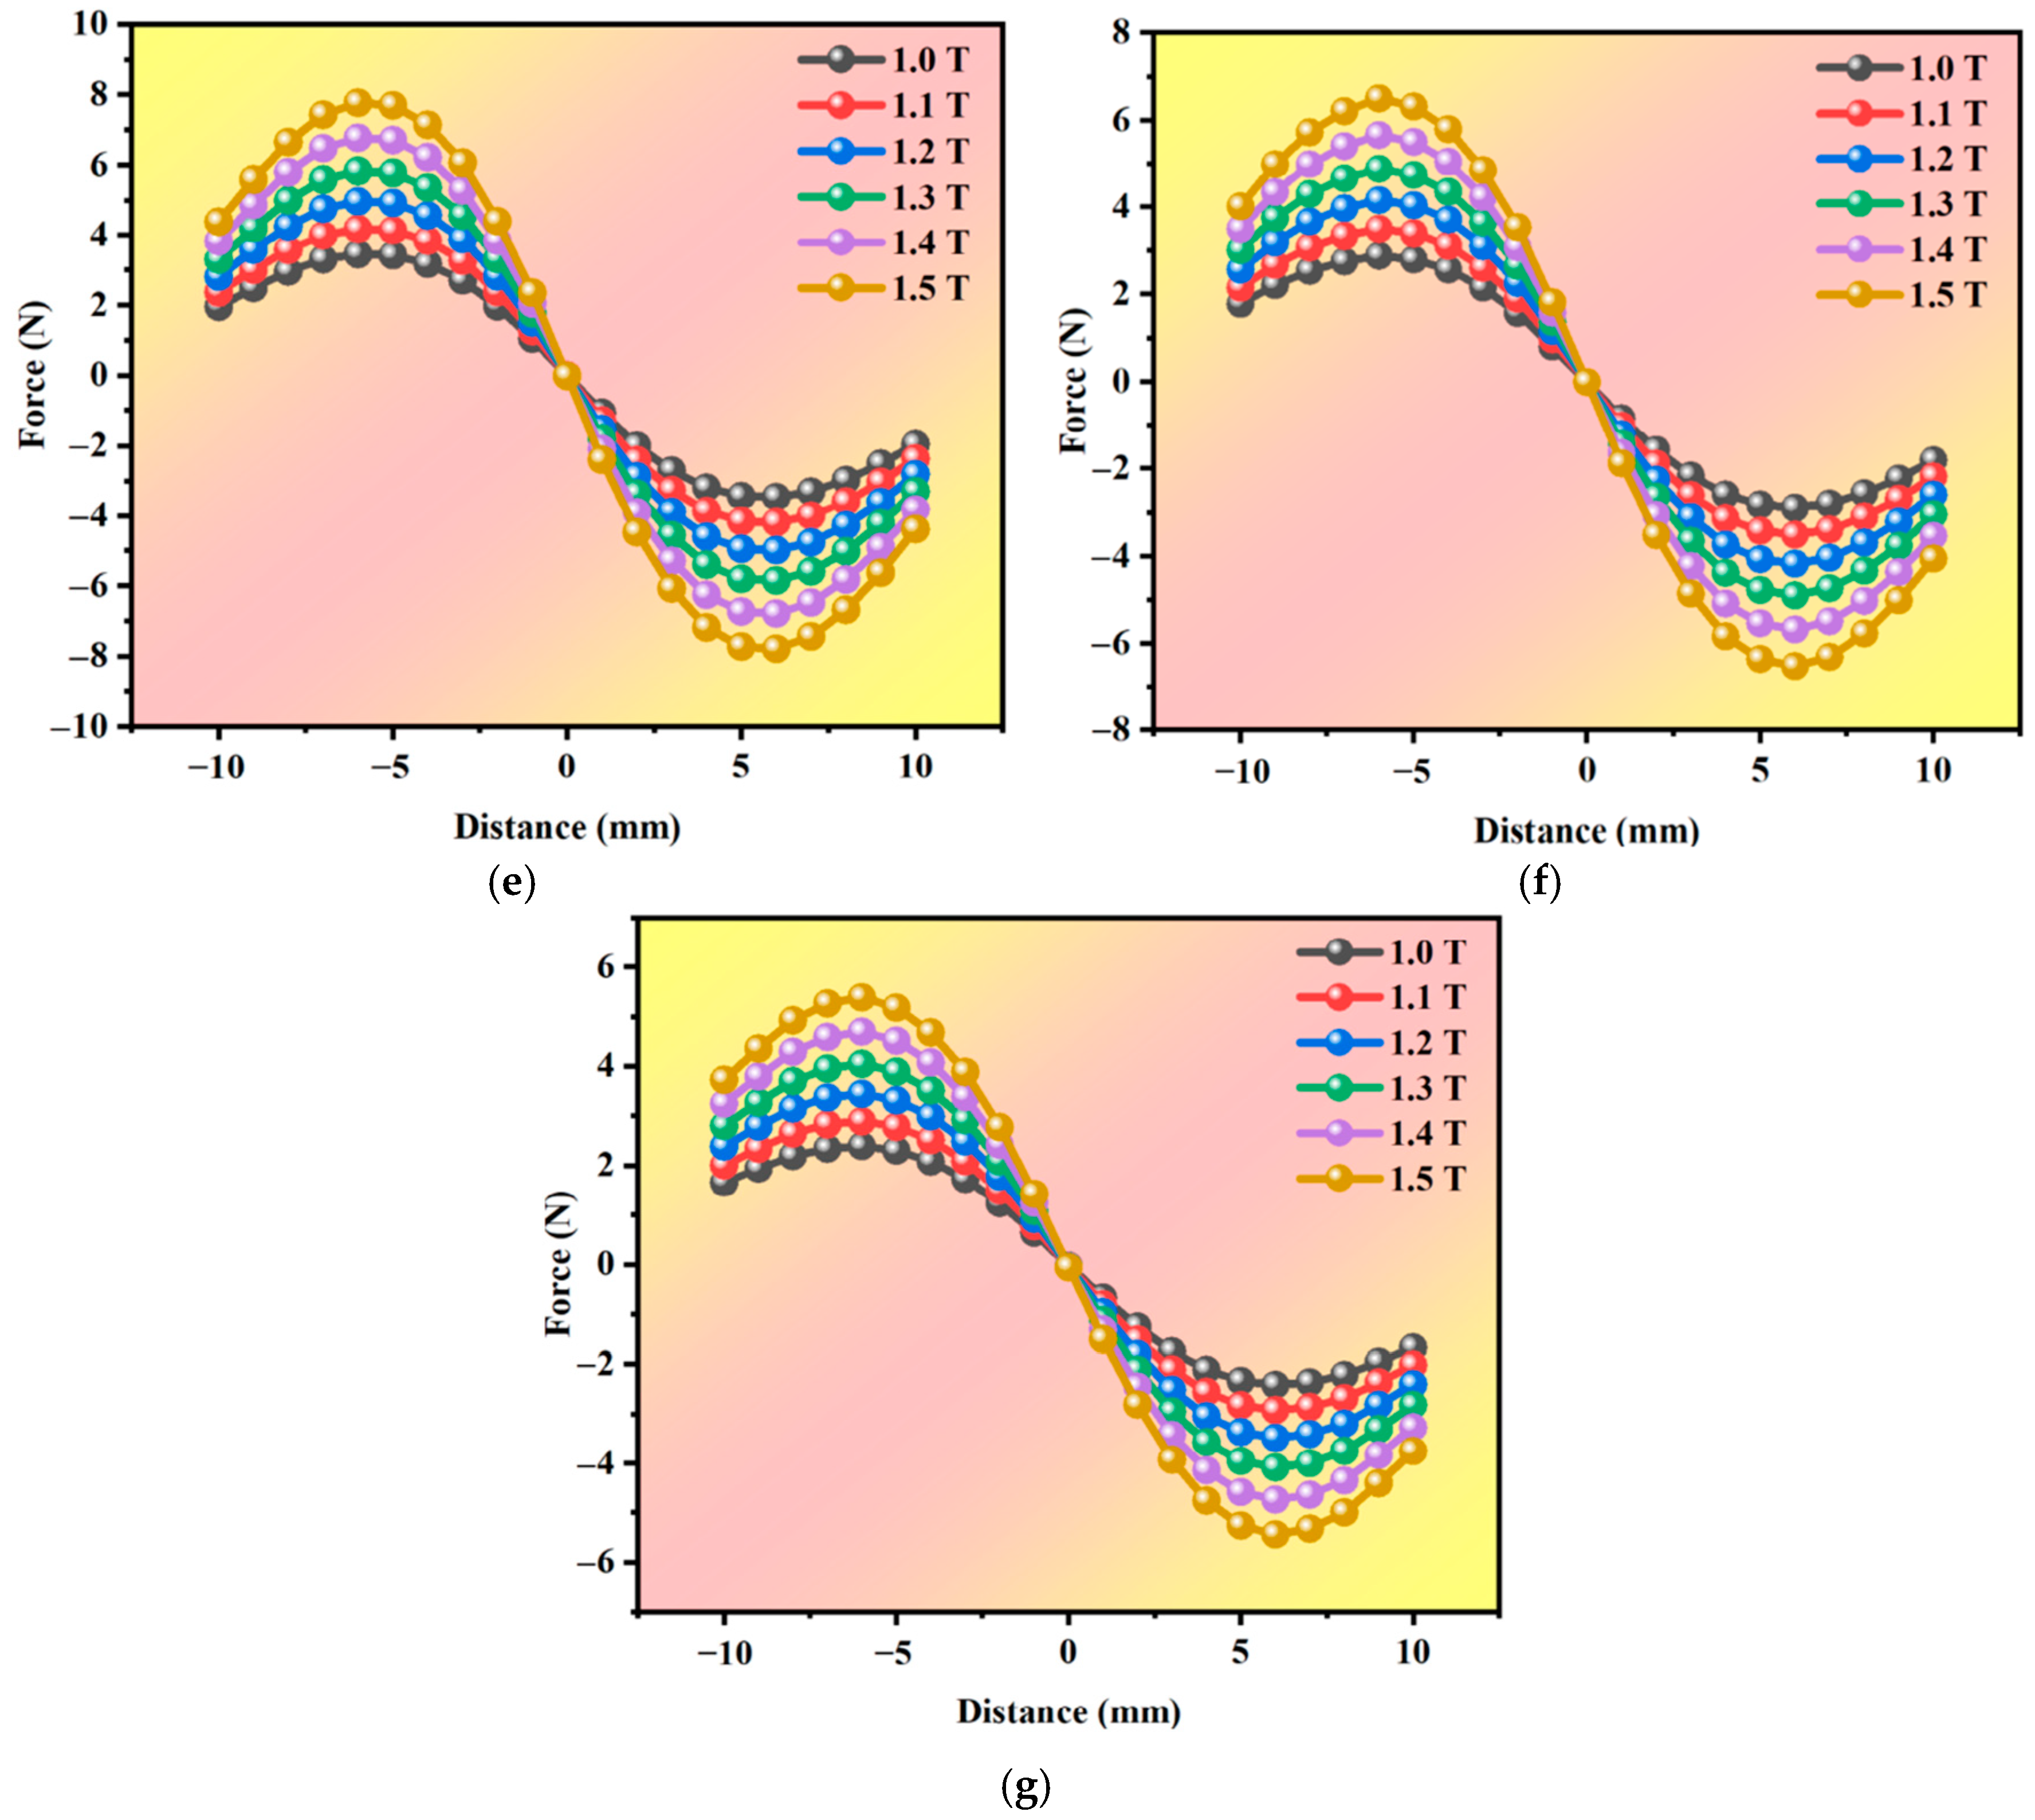
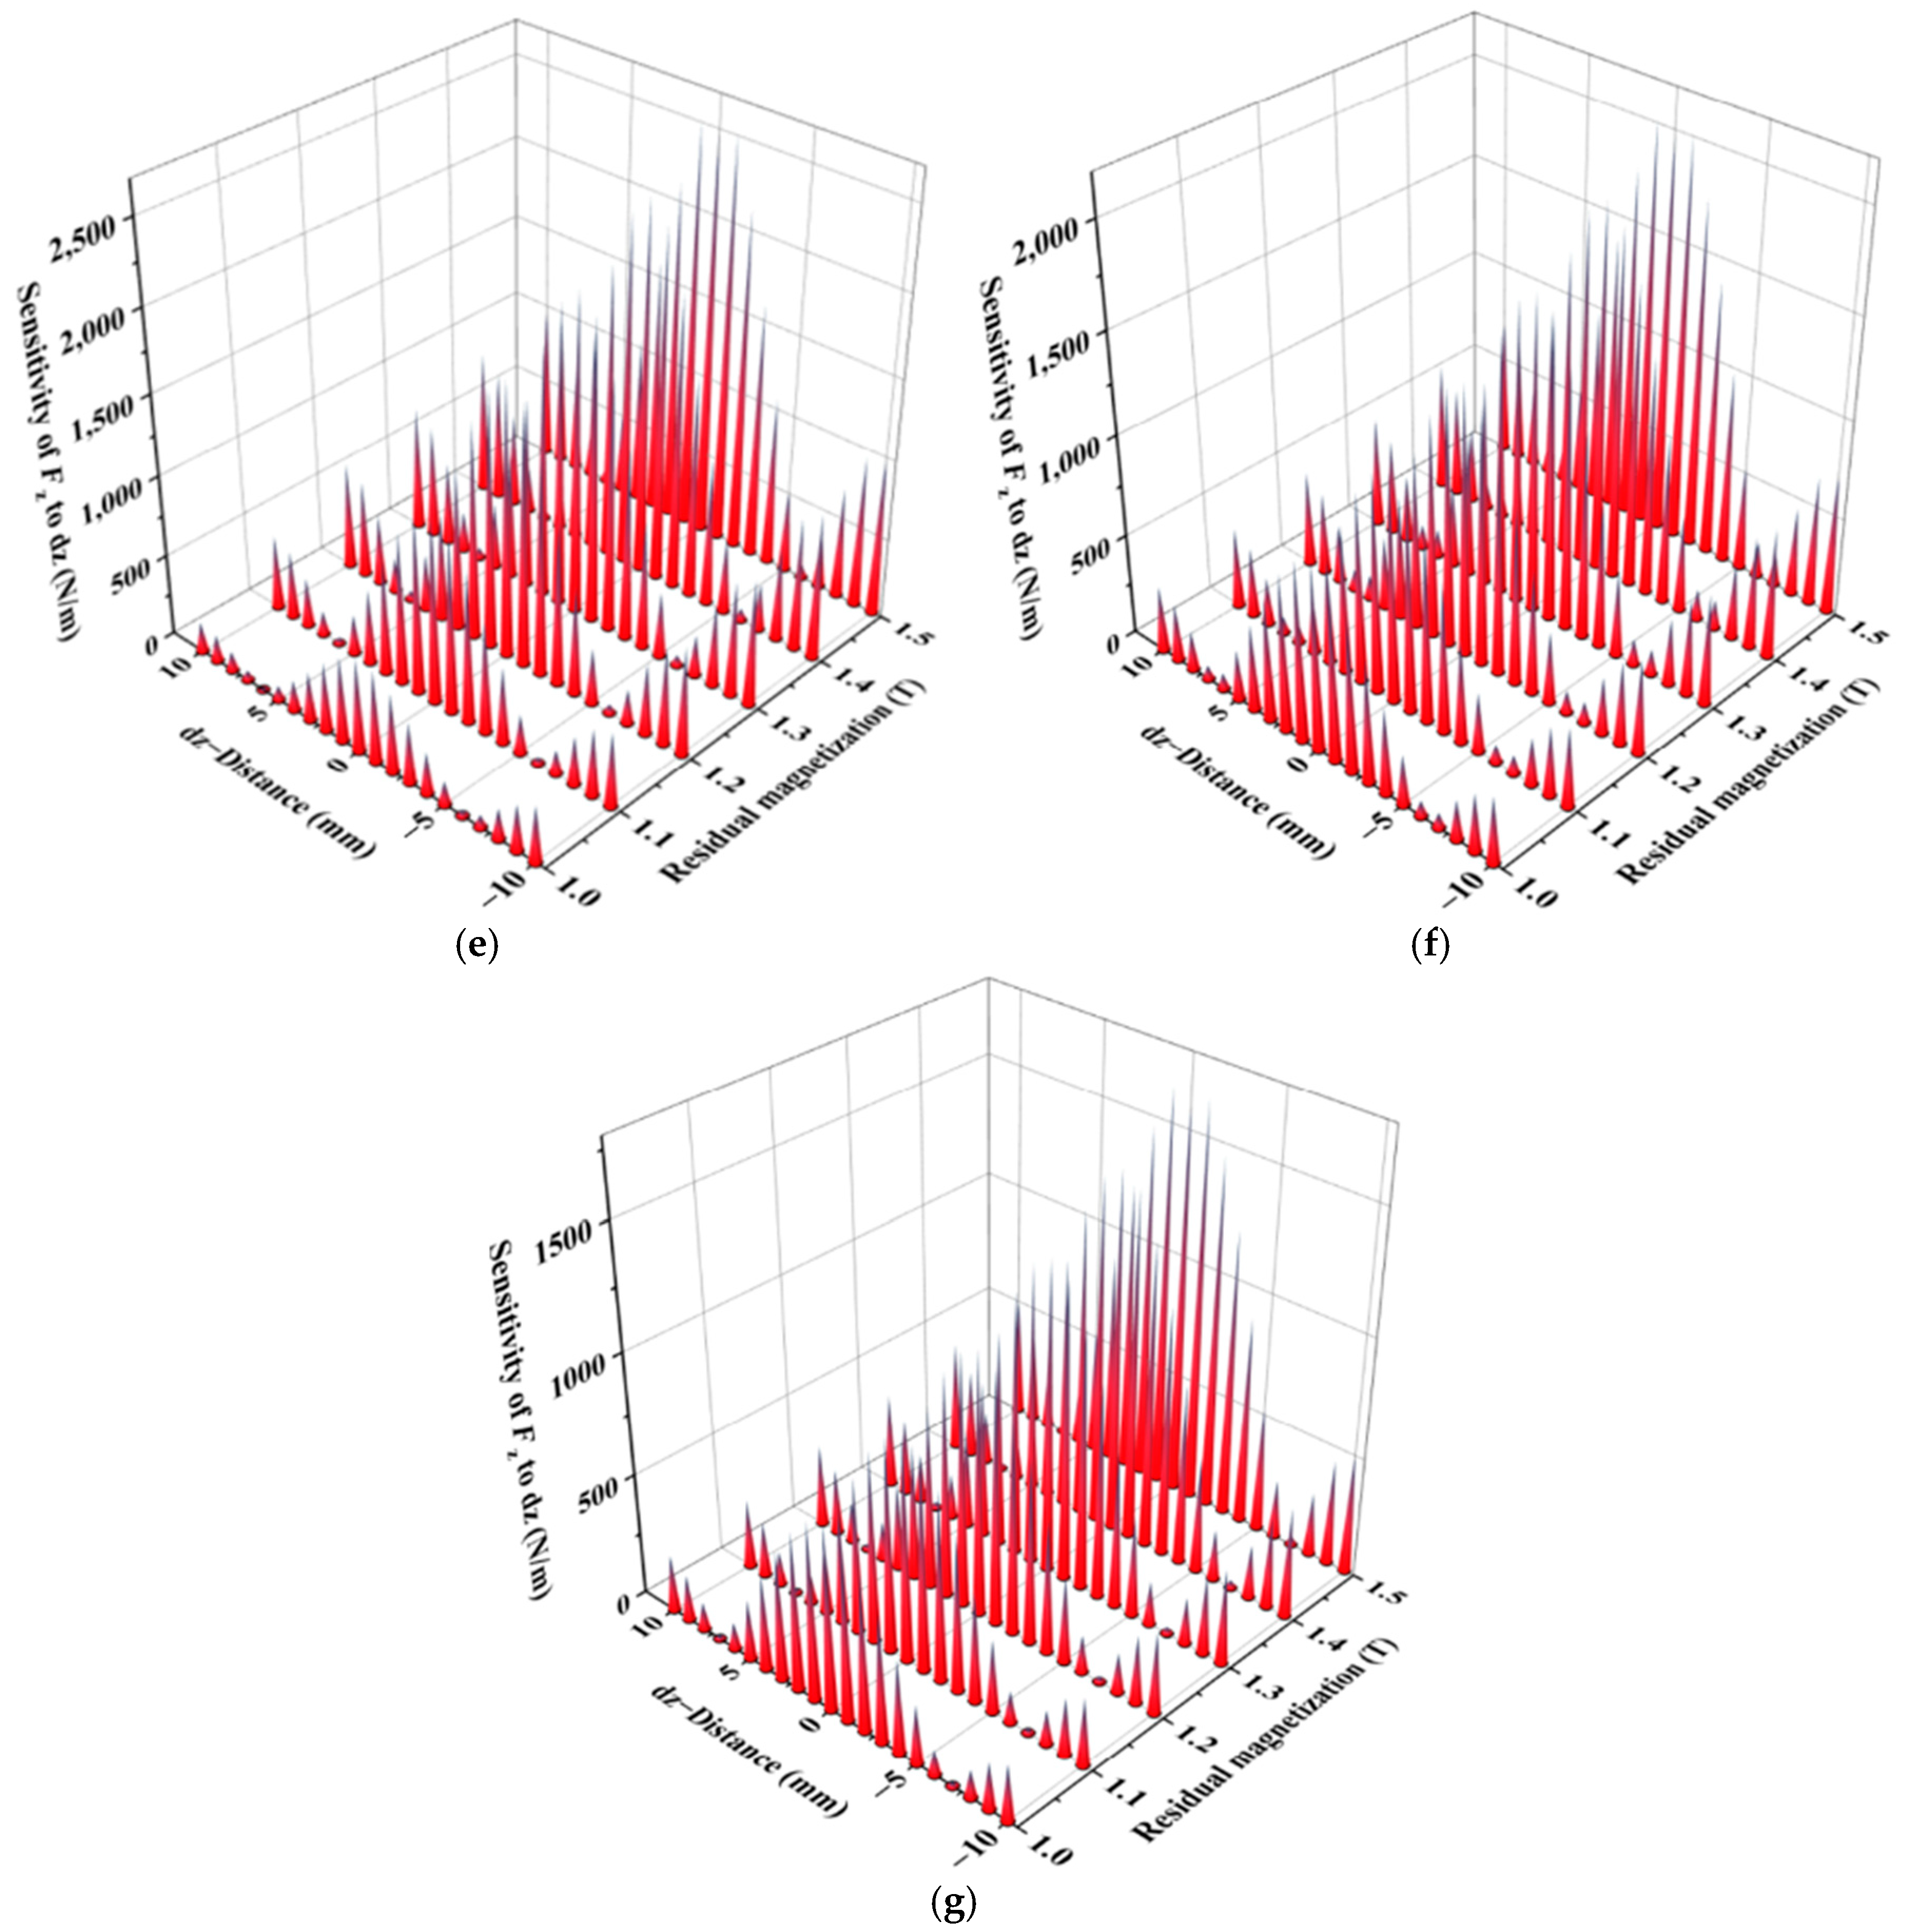
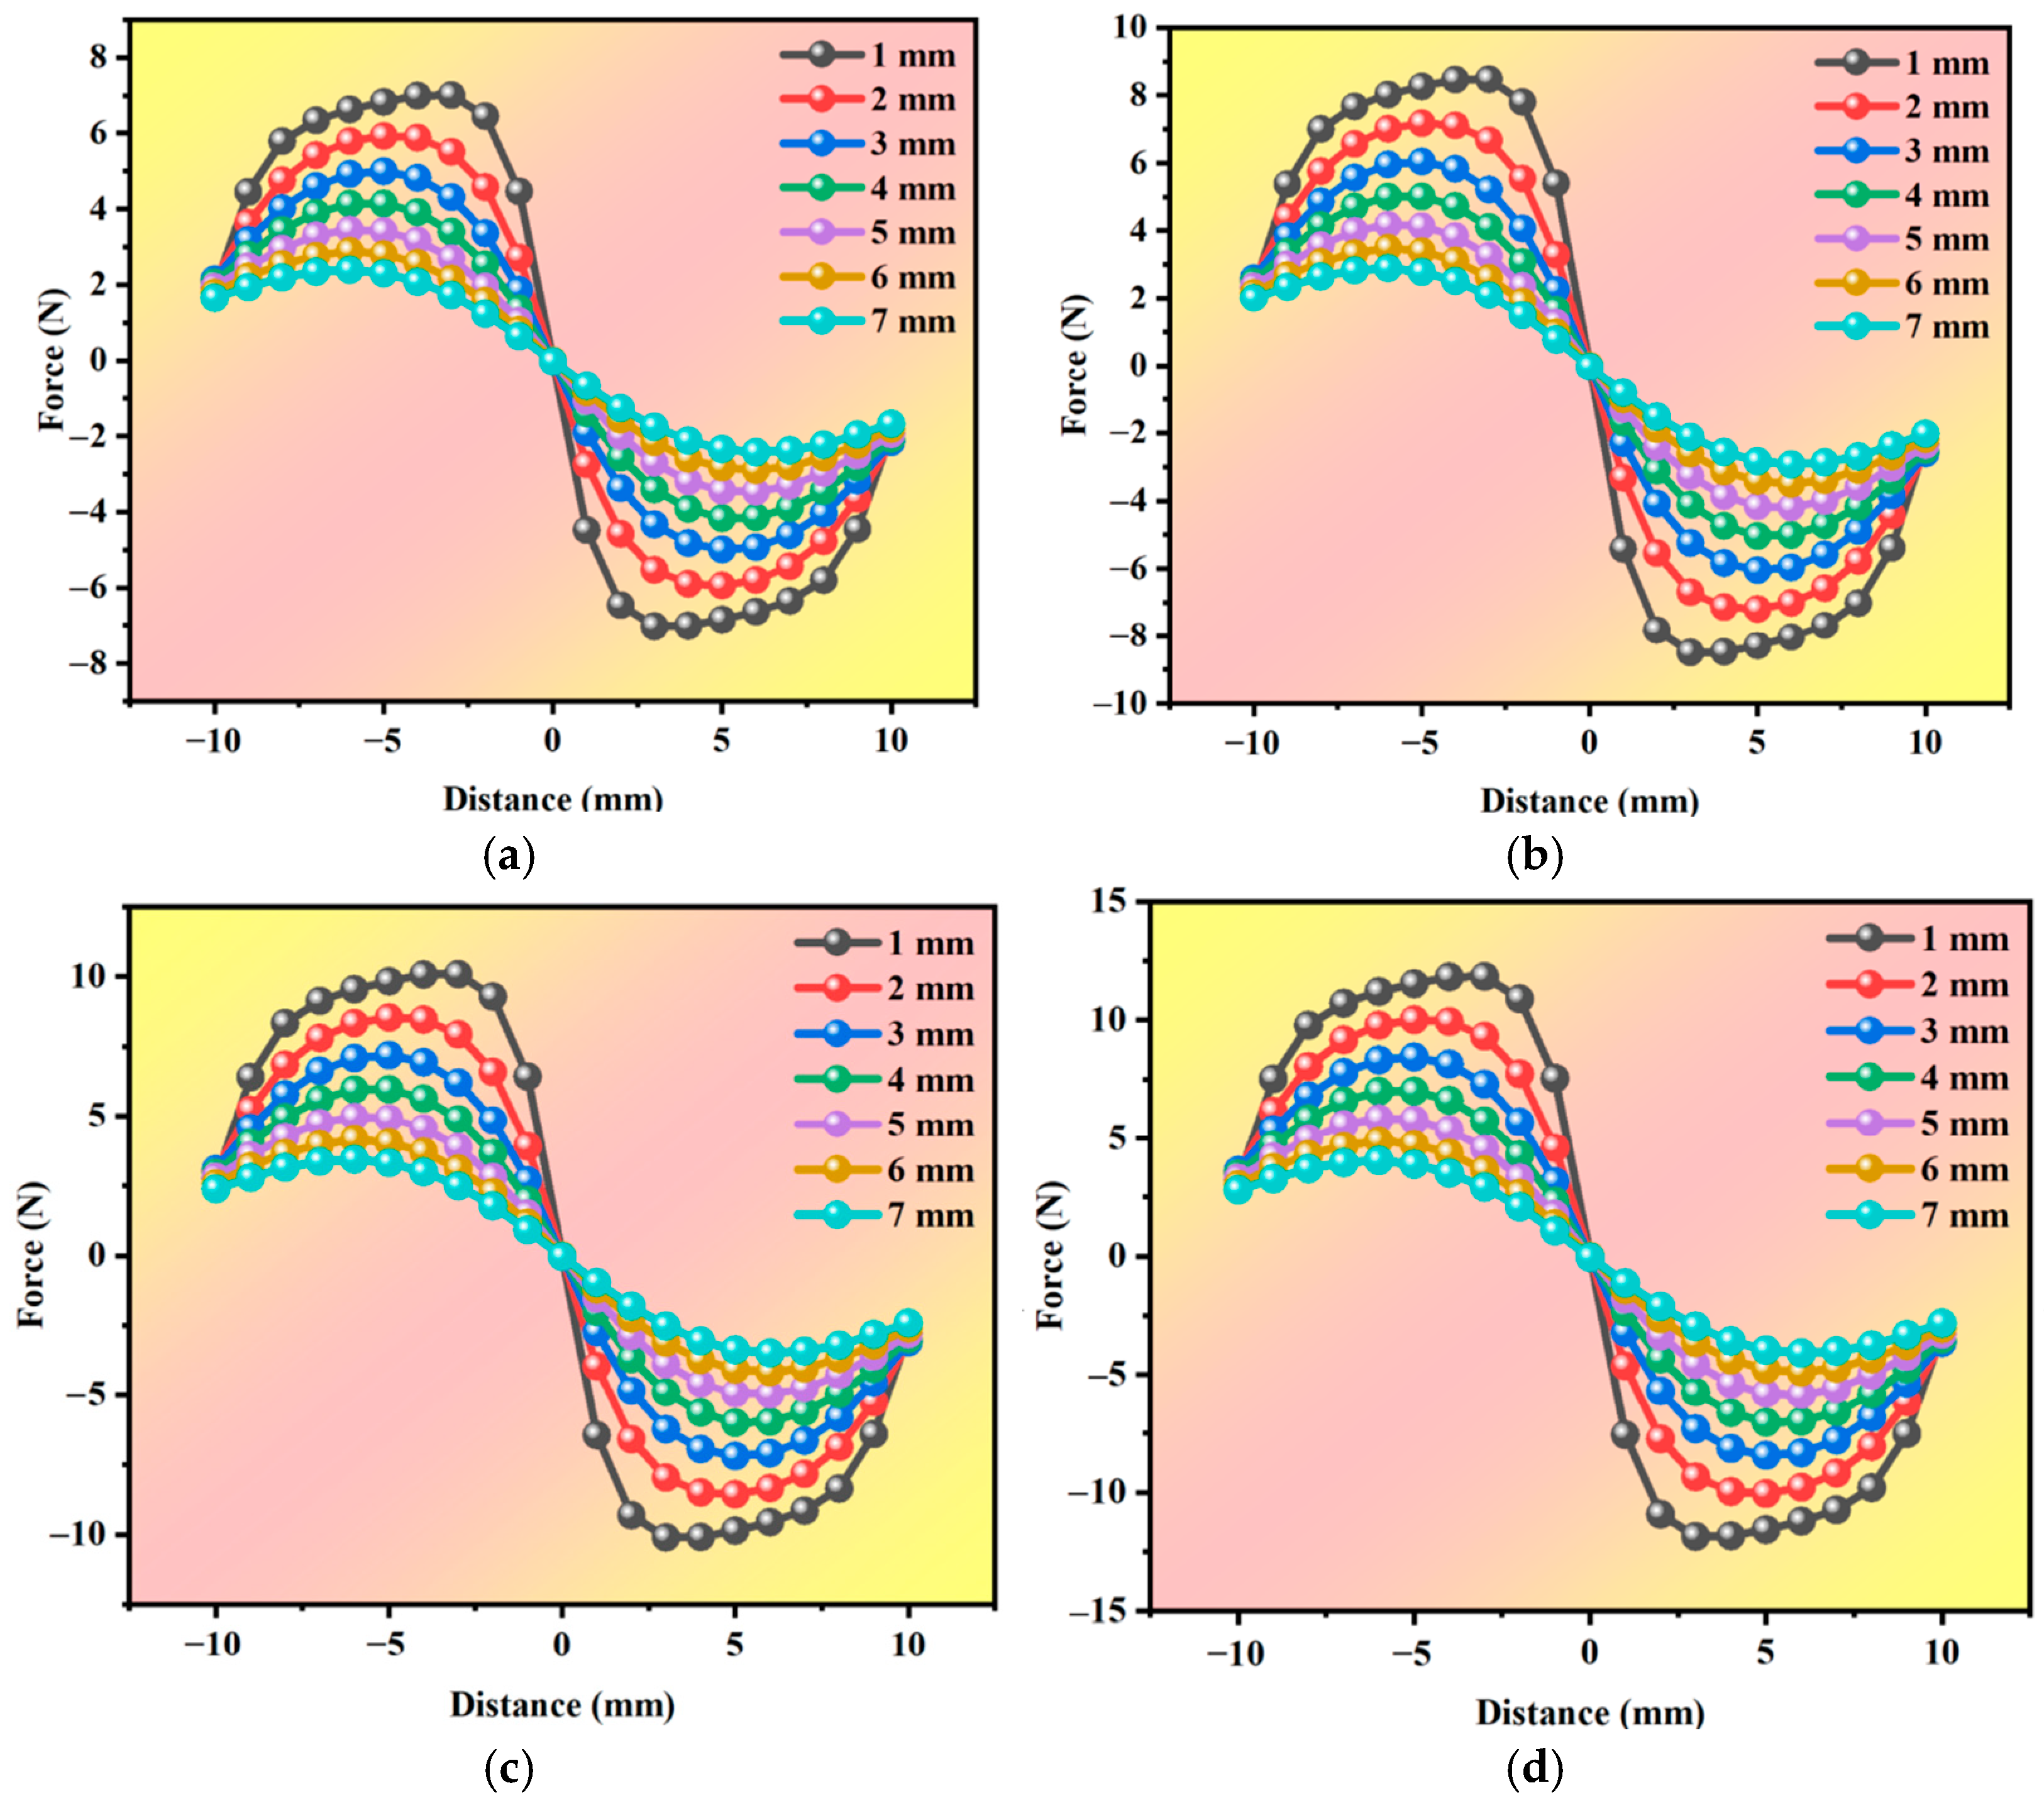
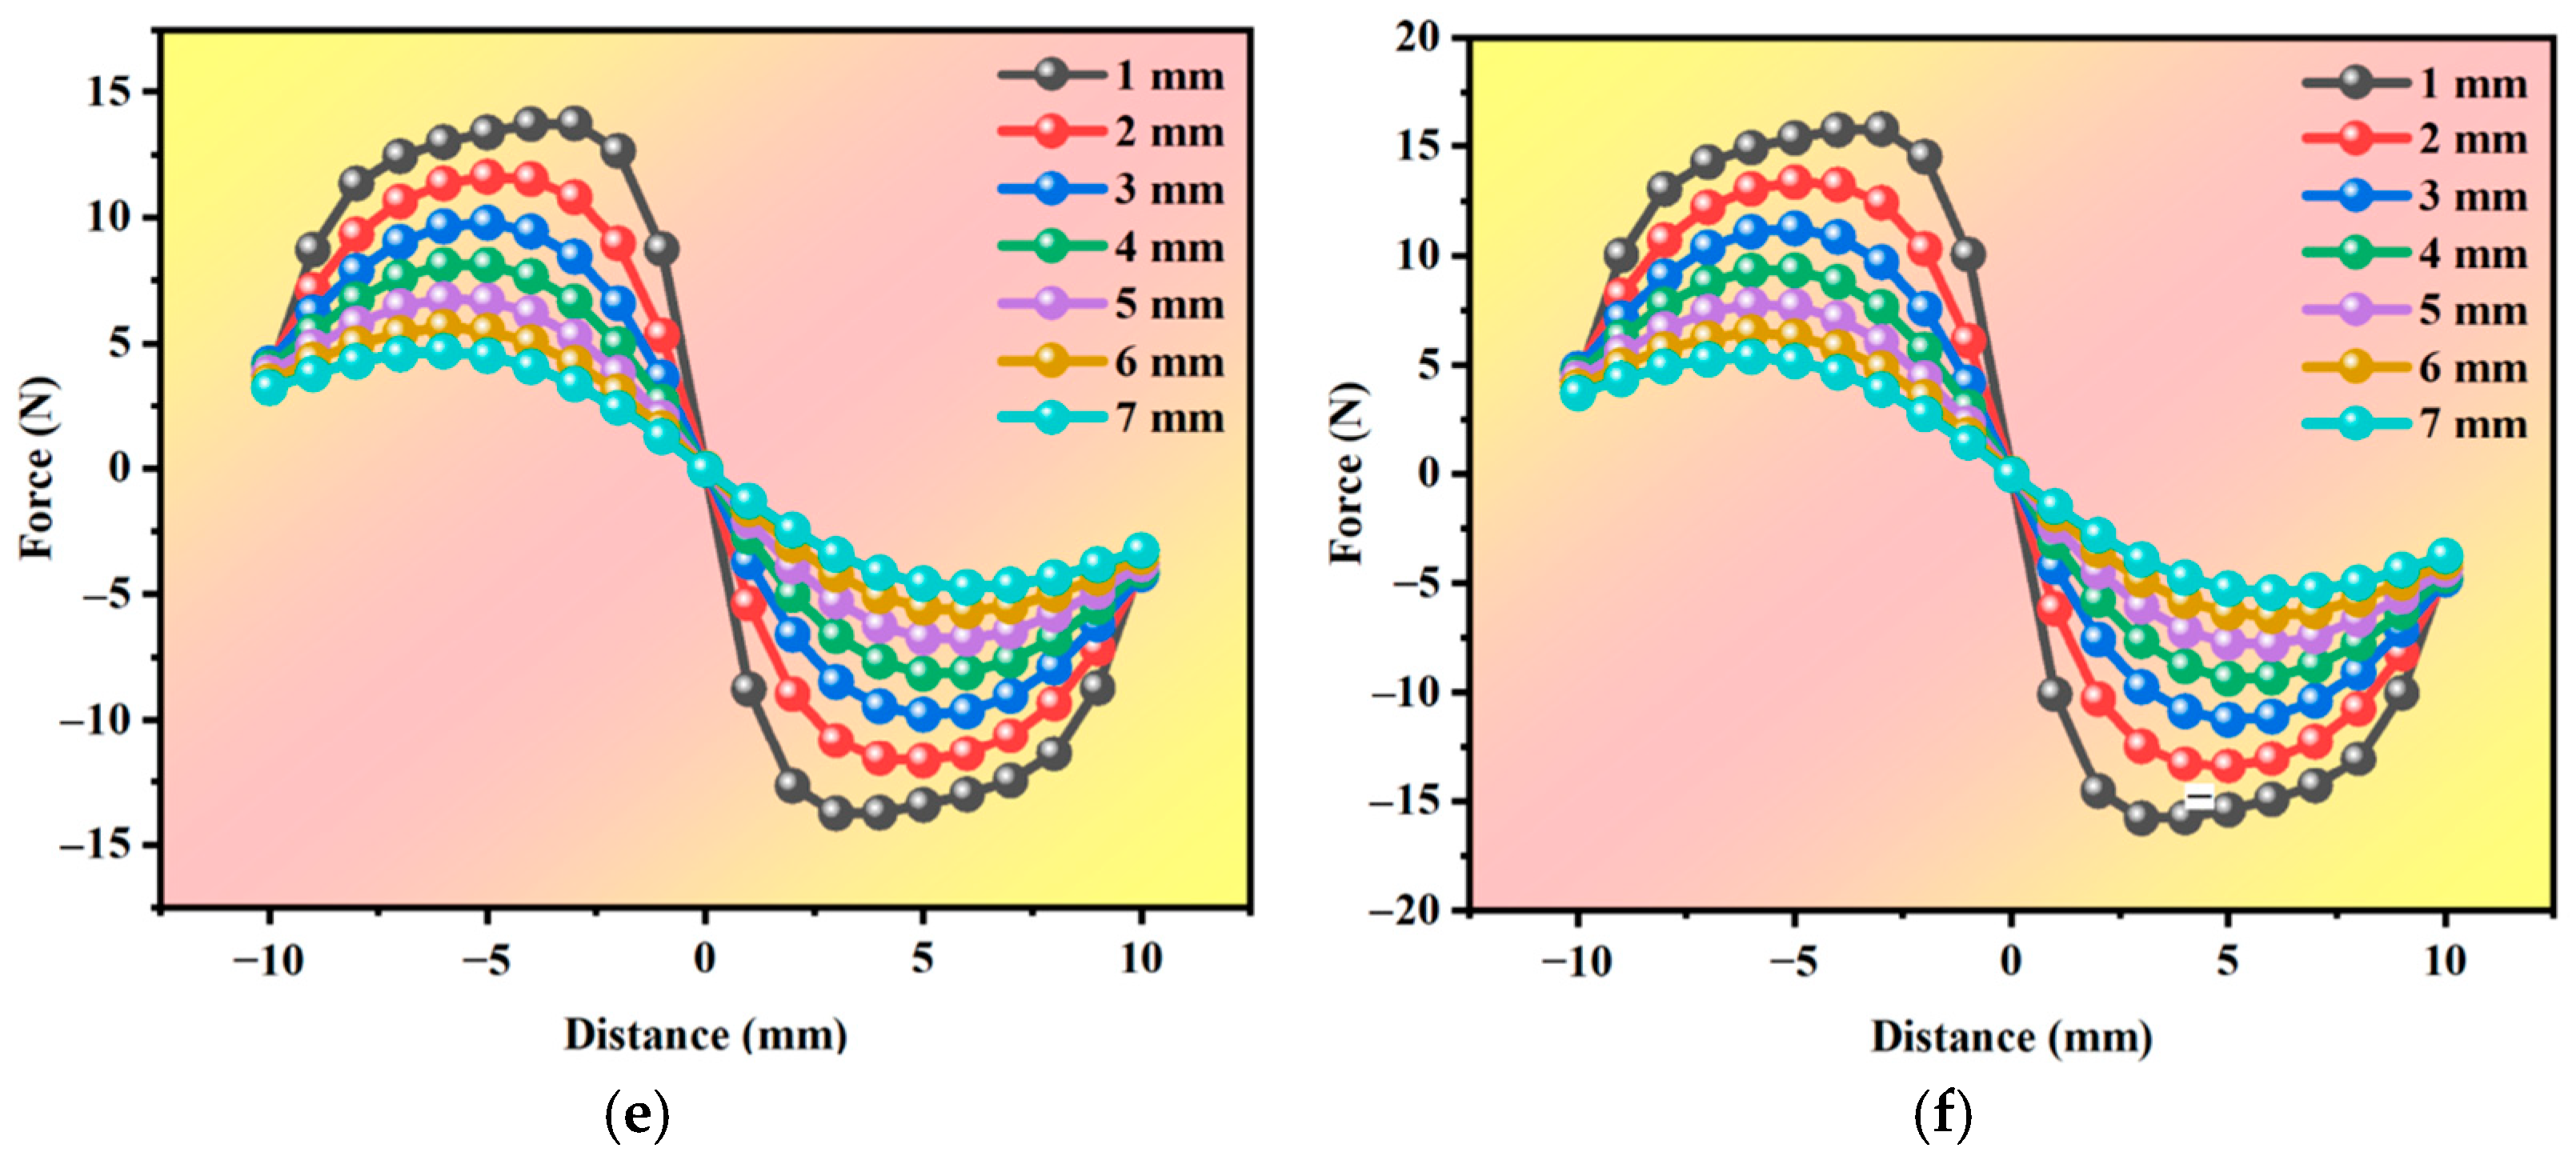
3.2.2. Effect of Remanence Intensity
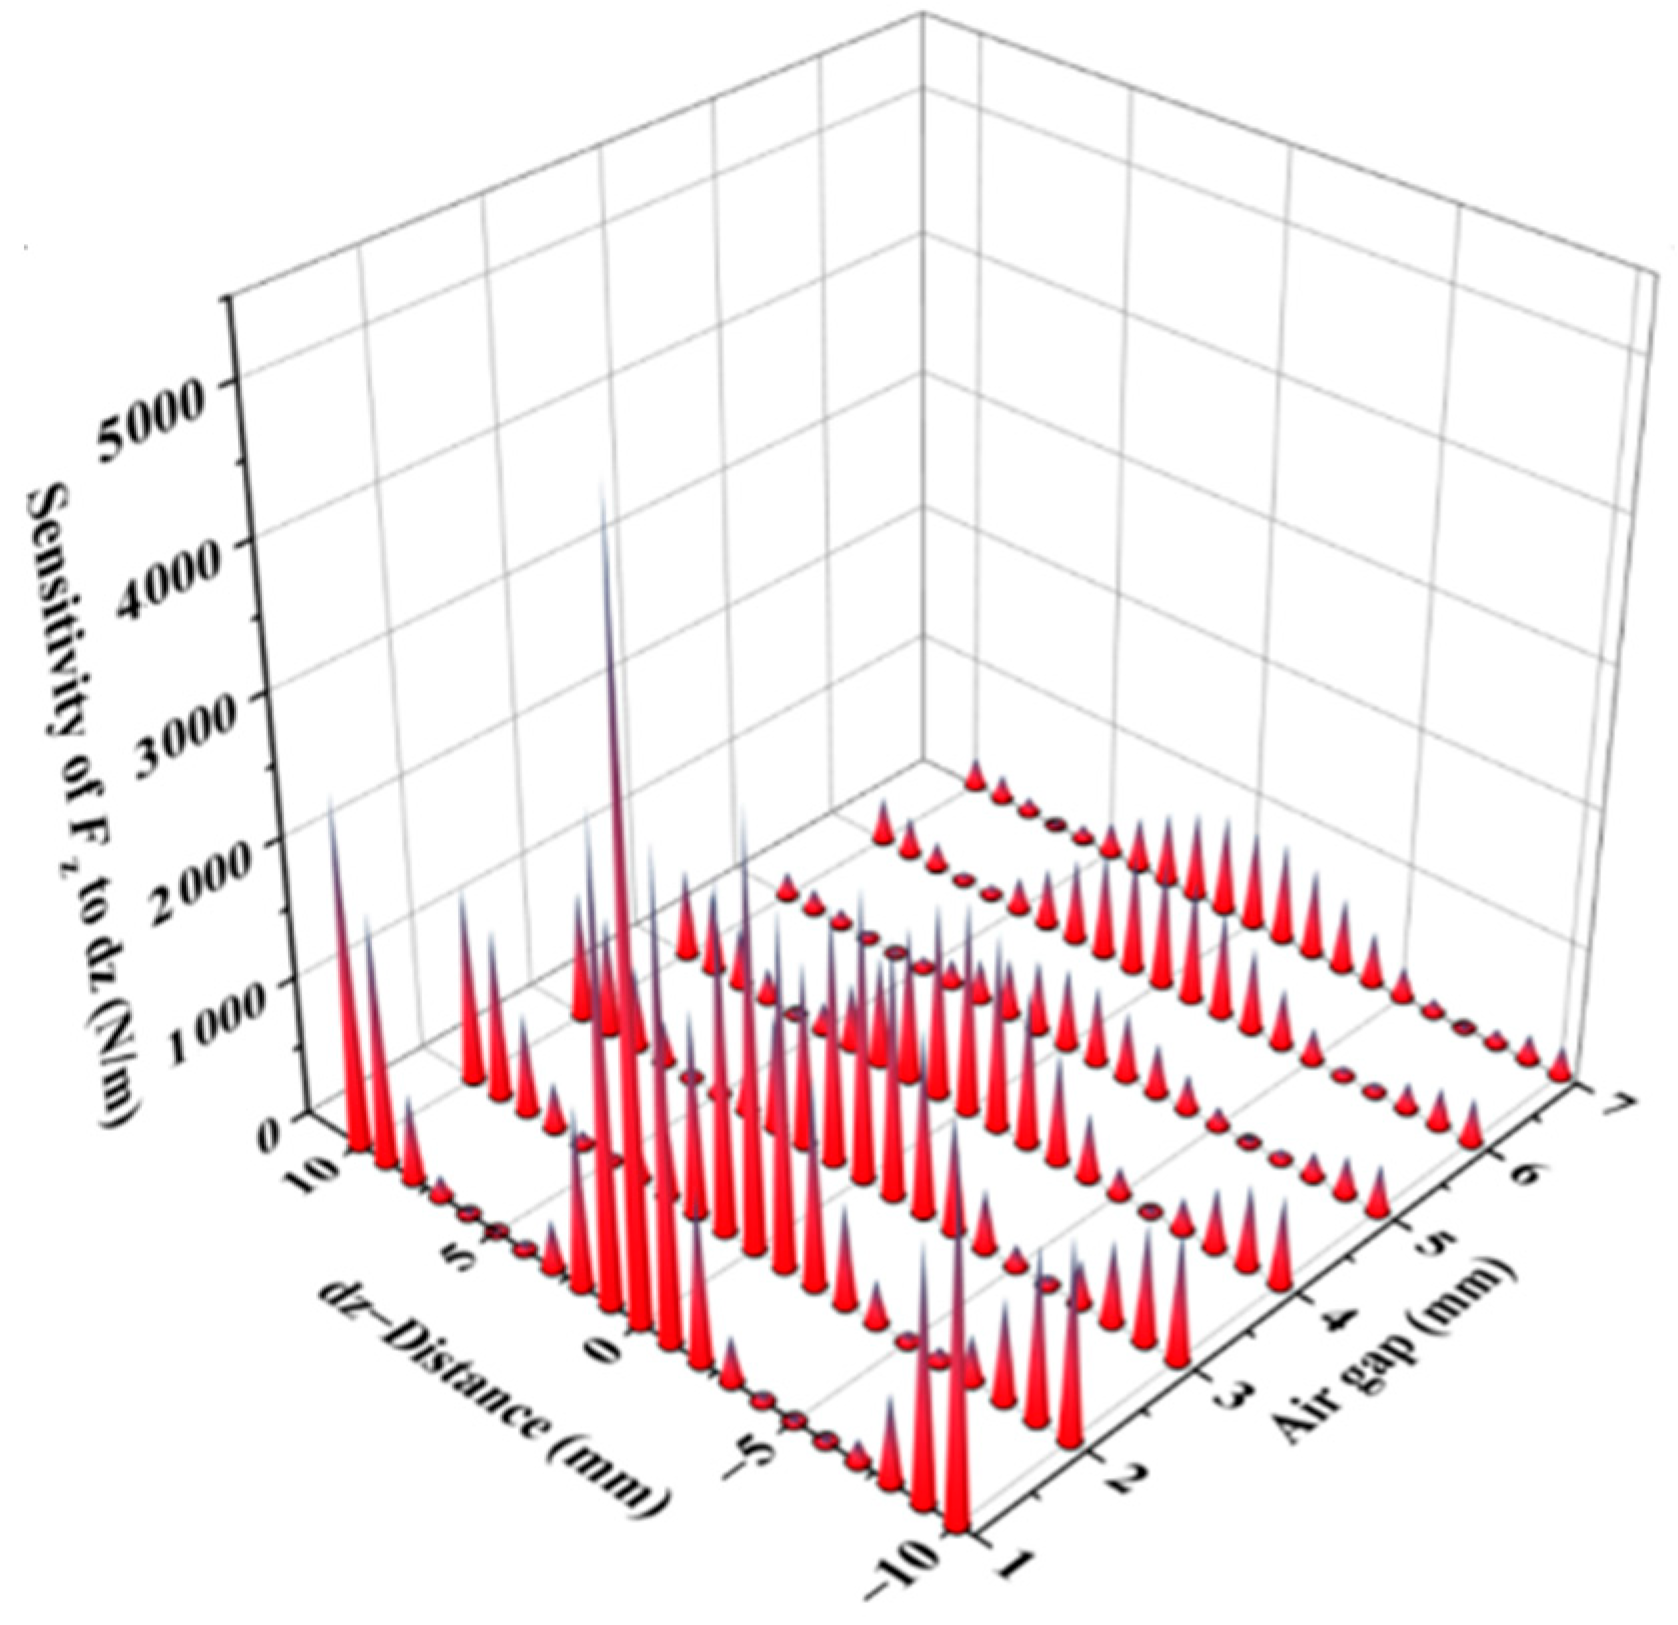
3.2.3. Effect of the Magnetic Gap
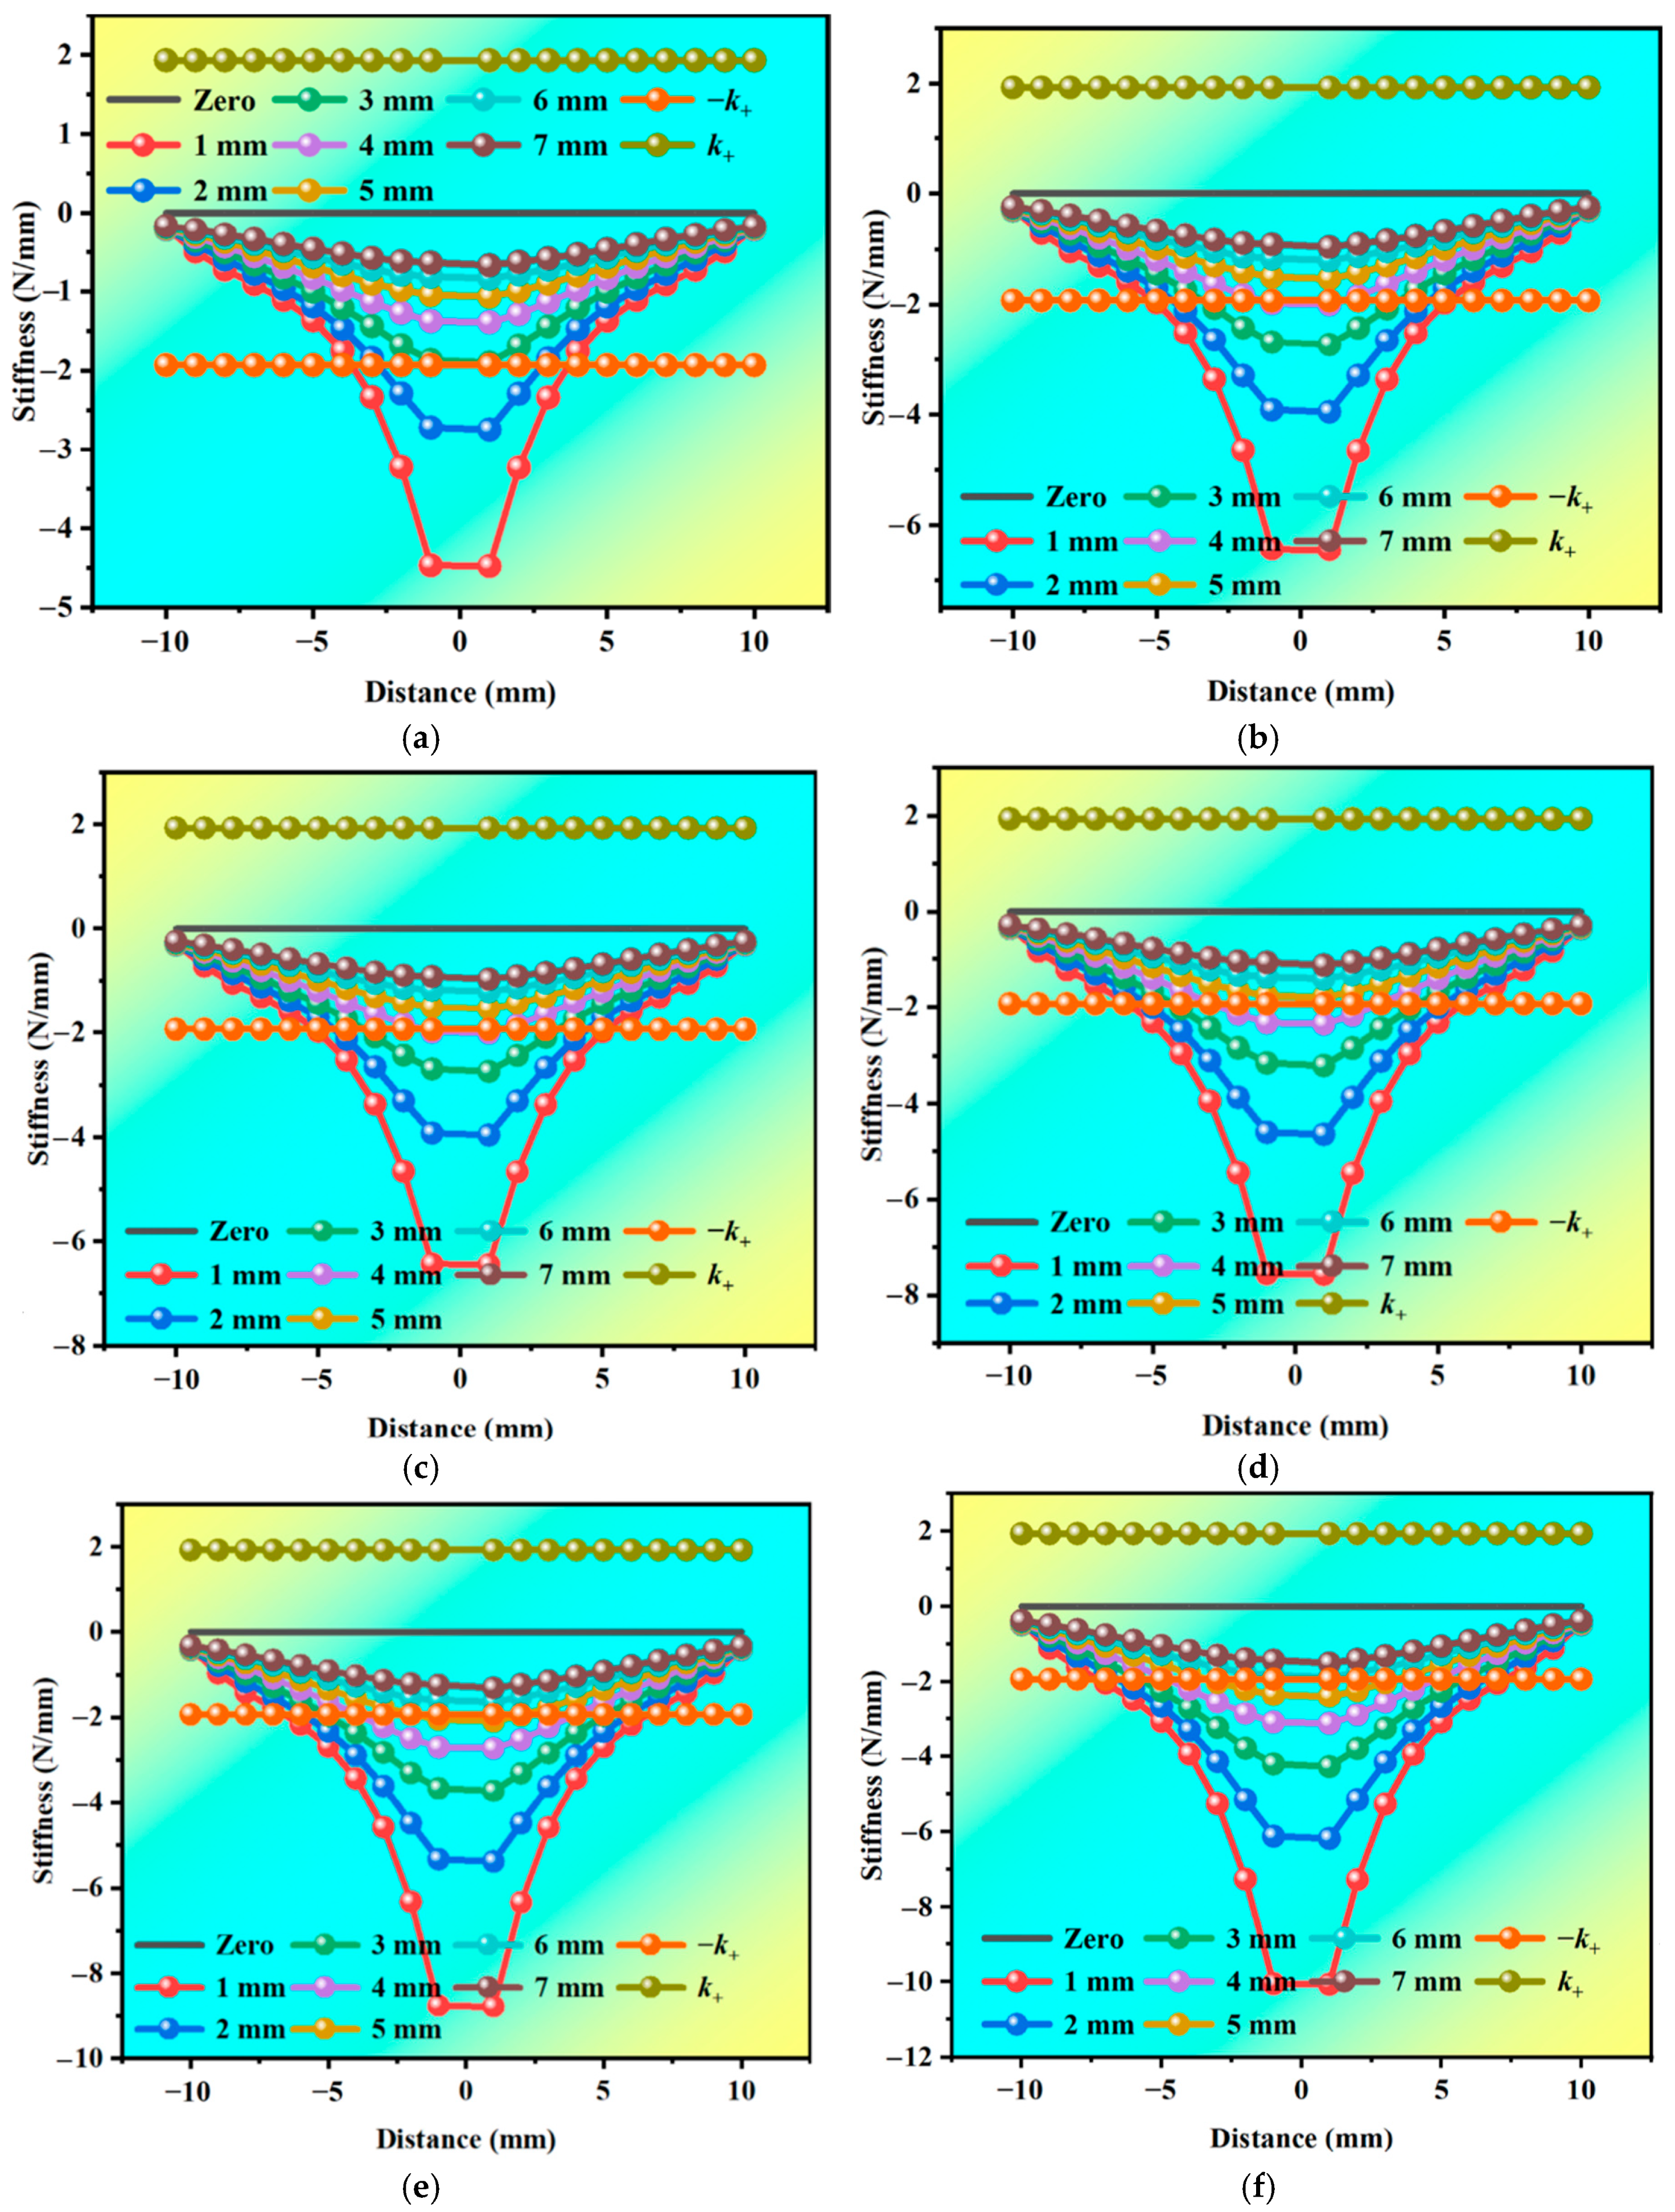
3.2.4. Effect of Stiffness
4. Conclusions
Author Contributions
Funding
Institutional Review Board Statement
Informed Consent Statement
Data Availability Statement
Conflicts of Interest
References
- Zou, C.; Wang, Y.; Wang, P.; Guo, J. Measurement of ground and nearby building vibration and noise induced by trains in a metro depot. Sci. Total. Environ. 2015, 536, 761–773. [Google Scholar] [CrossRef] [PubMed]
- Sheng, T.; Bian, X.-C.; Xiao, C.; Chen, Y.; Liu, G.-B.; Li, Y. Experimental study on a geosynthetics isolator for the base vibration isolation of buildings neighboring metro transportation. Geotext. Geomembr. 2021, 49, 1066–1078. [Google Scholar] [CrossRef]
- Ke, X.; Luo, W.; Zhou, Y.; Liang, Q.; Li, J.; Wang, S.; Jiang, K. Full-scale laboratory investigation on laminated rubber bearings for metro-induced vibration mitigation. Eng. Struct. 2024, 314, 118269. [Google Scholar] [CrossRef]
- Liu, X.; Wang, P. Investigation of the generation mechanism of rail corrugation based on friction induced torsional vibration. Wear 2021, 468–469, 203593. [Google Scholar] [CrossRef]
- Zhan, Q.; Chen, Y.; Zhao, Y.; Chen, M.; Guo, R. Vibration suppressing study of a simplified floating raft system by mixing using a non-linear connecting intercalary plate and connecting non-linear oscillators. Thin-Walled Struct. 2025, 206, 112686. [Google Scholar]
- Zhan, Q.; Chen, Y.; Zhao, Y.; Chen, M.; Guo, R. Experimental, theoretical and optimization studieson multimode vibration reduction of floating raft system based on NES cells. Ocean. Eng. 2024, 311, 118897. [Google Scholar]
- Erturk, A.; Inman, D. Broadband piezoelectric power generation on high-energy orbits of the bistable Duffing oscillator with electromechanical coupling. J. Sound Vib. 2010, 330, 2339–2353. [Google Scholar] [CrossRef]
- Stanton, S.C.; McGehee, C.C.; Mann, B.P. Non-linear dynamics for broadband energy harvesting: Investigation of a bistable piezoelectric inertial generator. Phys. D Non-Linear Phenom. 2010, 239, 640–653. [Google Scholar]
- Wu, Z.; Xu, Q. Design of a structure-based bistable piezoelectric energy harvester for scavenging vibration energy in gravity direction. Mech. Syst. Signal Process. 2022, 162, 108043. [Google Scholar] [CrossRef]
- Chen, Z.; Xia, Y.; He, J.; Xiong, Y.; Wang, G. Elastic-electro-mechanical modeling and analysis of piezoelectric metamaterial plate with a self-powered synchronized charge extraction circuit for vibration energy harvesting. Mech. Syst. Signal Process. 2020, 143, 106824. [Google Scholar] [CrossRef]
- Qiu, Z.-C.; Zhang, X.-M.; Wu, H.-X.; Zhang, H.-H. Optimal placement and active vibration control for piezoelectric smart flexible cantilever plate. J. Sound Vib. 2006, 301, 521–543. [Google Scholar] [CrossRef]
- Lin, J.; Huang, C.J.; Chang, J.; Wang, S.W. Active–passive vibration absorber of beam–cart–seesaw system with piezoelectric transducers. J. Sound Vib. 2010, 329, 4109–4123. [Google Scholar] [CrossRef]
- Chen, Z.; Yang, Y.; Lu, Z.; Luo, Y. Broadband characteristics of vibration energy harvesting using one-dimensional phononic piezoelectric cantilever beams. Phys. B Condens. Matter 2012, 410, 5–12. [Google Scholar] [CrossRef]
- Viet, N.V.; Al-Qutayri, M.; Liew, K.M.; Wang, Q. An octo-generator for energy harvesting based on the piezoelectric effect. Appl. Ocean. Res. 2017, 64, 128–134. [Google Scholar] [CrossRef]
- Ma, S.L.; Chen, J.W.; Li, H.Y.; Yang, J.T. Mechanism of enhancement of heat transfer for plate-fin heat sinks with dual piezoelectric fans. Int. J. Heat Mass Transf. 2015, 90, 454–465. [Google Scholar] [CrossRef]
- Li, M.; Yu, D.; Li, Y.; Liu, X.; Dai, F. A bi-stable device for simultaneous vibration absorption and energy harvesting using bi-stable piezoelectric composite laminate. Compos. Struct. 2023, 314, 116971. [Google Scholar] [CrossRef]
- Zhang, P.; Li, X.; Wang, J. Non-linear effect on stable state and snap-through bistability of square composite laminate. Eur. J. Mech. A/Solids 2025, 109, 105431. [Google Scholar] [CrossRef]
- Wang, J.; Chang, Z.; Liu, T.; Chen, L. A review of linear and nonlinear vibration analysis of composite laminated structures by computational approaches: 2015–2024. Nonlinear Dyn. 2025, 113, 10839–10859. [Google Scholar] [CrossRef]
- Alghisi, D.; Dalola, S.; Ferrari, M.; Ferrari, V. Ball-impact piezoelectric converter for multi-degree-of-freedom energy harvesting from broadband low-frequency vibrations in autonomous sensors. Procedia Eng. 2014, 87, 1529–1532. [Google Scholar] [CrossRef]
- Zhao, S.; Erturk, A. Deterministic and band-limited stochastic energy harvesting from uniaxial excitation of a multilayer piezoelectric stack. Sens. Actuators A Phys. 2014, 214, 58–65. [Google Scholar] [CrossRef]
- Li, S.; Crovetto, A.; Peng, Z.; Zhang, A.; Hansen, O.; Wang, M.; Li, X.; Wang, F. Bi-resonant structure with piezoelectric PVDF films for energy harvesting from random vibration sources at low frequency. Sens. Actuators A Phys. 2016, 247, 547–554. [Google Scholar] [CrossRef]
- Cao, Y.; Cao, D.; He, G.; Ge, X.; Hao, Y. Vibration analysis and distributed piezoelectric energy harvester design for the L-shaped beam. Eur. J. Mech.—A/Solids 2021, 87, 104214. [Google Scholar] [CrossRef]
- Liu, C.; Zhao, R.; Yu, K.; Lee, H.P.; Liao, B. A quasi-zero-stiffness device capable of vibration isolation and energy harvesting using piezoelectric buckled beams. Energy 2021, 233, 121146. [Google Scholar] [CrossRef]
- Yu, H.; Hou, C.; Shan, X.; Zhang, X.; Song, H.; Zhang, X.; Xie, T. A novel seesaw-like piezoelectric energy harvester for low frequency vibration. Energy 2022, 261, 125241. [Google Scholar] [CrossRef]
- Feng, D.; Shi, Y.; Zhao, R.; Chen, Y.; Zhang, P.; Guo, H.; Guo, T. Study on the mechanism of buffer absorbing energy of double-layer heterostructure based on viscoelastic materials for MEMS devices. Sens. Actuators A Phys. 2023, 364, 114790. [Google Scholar] [CrossRef]
- Song, J.; Xia, C.; Shan, G.; Wang, Z.; Ono, T.; Cheng, G.; Wang, D.F. Temperature sensing and energy harvesting with A MEMS parametric coupling device under low frequency vibrations. J. Sound Vib. 2024, 585, 118456. [Google Scholar] [CrossRef]
- Xu, Q.; Long, H.; Tian, S.; Cheng, Q.; Liu, J.; Li, M.; Xie, S.; Wang, P.; Gao, M.; Sun, Y. Dual-mode arrayed vibration-wind piezoelectric energy harvester. Energy Convers. Manag. 2025, 324, 119303. [Google Scholar] [CrossRef]
- Heidari, M.; Rahimi, G.H.; Bab, S. Ocean non-linear energy harvesting (NEH) with a buckled piezoelectric beam. Appl. Ocean Res. 2024, 150, 104115. [Google Scholar] [CrossRef]
- Kumar, G.Y.; Kumar, K.S. Modal analysis for optimized placement of piezoelectric patches on a composite beam structure. Mater. Today Proc. 2018, 5, 21135–21139. [Google Scholar]
- Nadertehrani, A.; Ziaei-Rad, S.; Eshtehardiha, R. Harvesting vibration energy by quad-stable piezoelectric cantilever beam: Modeling, fabrication and testing. Eur. J. Mech.—A/Solids 2024, 107, 105389. [Google Scholar] [CrossRef]
- Sinclair, A.N.; Chertov, A.M. Radiation endurance of piezoelectric ultrasonic transducers–A review. Ultrasonics 2015, 57, 1–10. [Google Scholar] [PubMed]
- Fang, X.; Duan, J.; Zhu, C.; Liu, J. Vibration analysis of piezoelectric semiconductor beams with size-dependent damping characteristic. Mater. Today Commun. 2023, 36, 106929. [Google Scholar] [CrossRef]
- Huang, X.; Zeng, Z.; Wang, D.; Luo, X.; Li, P.; Wang, W. Experimental study on the vibration reduction characteristics of the floating slab track for 160 km/h urban rail transit. In Structures; Elsevier: Amsterdam, The Netherlands, 2023; Volume 51, pp. 1230–1244. [Google Scholar]
- Xie, C.; Chen, Y.; Liu, X.; Tang, W.; Wang, R.; Peng, C.; Feng, Y. Effect of voltage and time on microstructure and corrosion resistance of anodic oxidation film on Al-5.5Zn-0.03In-1Mg-0.03Ti-0.08Sn alloy. J. Alloy. Compd. 2024, 1009, 176740. [Google Scholar] [CrossRef]
- Li, J.; Zhang, X.; Jiang, W.; Bi, Q.; Chen, L. A novel cut-out piezoelectric beam with limiters for broadband energy harvesting. Int. J. Non-Linear Mech. 2024, 167, 104919. [Google Scholar] [CrossRef]
- Daşdemir, A. Effect of interaction between polarization direction and inclined force on the dynamic stability of a pre-stressed piezoelectric plate. Mech. Res. Commun. 2023, 131, 104150. [Google Scholar] [CrossRef]
- Kim, S.B.; Park, J.H.; Ahn, H.; Liu, D.; Kim, D.J. Temperature effects on output power of piezoelectric vibration energy harvesters. Microelectron.J. 2011, 42, 988–991. [Google Scholar]
- Tan, Q.-C.; Zheng, F.-S.; Li, J.-G. Magnetic force transmission of a reciprocating motion. J. Bionic Eng. 2008, 5, 143–147. [Google Scholar] [CrossRef]
- Jones, D.S. The Theory of Electromagnetism; Elsevier: Amsterdam, The Netherlands, 2013. [Google Scholar]
- Gao, J.; Zhou, J.; Wang, Q.; Wang, K.; Lin, Q.; Tan, D. Design and optimization of quasi-zero-stiffness dual harvester-absorber system. Int. J. Mech. Sci. 2024, 273, 109227. [Google Scholar] [CrossRef]
- Wang, Q.; Zhou, J.; Wang, K.; Gao, J.; Lin, Q.; Chang, Y.; Xu, D.; Wen, G. Dual-function quasi-zero-stiffness dynamic vibration absorber: Low-frequency vibration mitigation and energy harvesting. Appl. Math. Model. 2022, 116, 636–654. [Google Scholar] [CrossRef]
- Attia, M.E.H.; Harby, K.; Bedairi, B.H.; Abdelgaied, M. Comparative analysis and optimization of different sets of axially magnetized cylindrical magnets to enhance freshwater productivity in hemispherical solar stills, emphasizing 4E performance. Sol. Energy Mater. Sol. Cells 2025, 282, 113364. [Google Scholar] [CrossRef]
- Fan, Q.S.; Yin, Y.J. Mechanics of Materials; Tsinghua University Press: Beijing, China, 2004. [Google Scholar]


| Variable | Scope | |
|---|---|---|
| Load (N) | 0.1–1/step 0.1 | |
| Size of piezoelectric sheet | Length (mm) | 40–120/step 10 |
| Width (mm) | 5–20/step 1 | |
| Thickness (mm) | 0.2 | |
| Single-wing piezoelectric beam | Thickness (mm) | 0.5–2/step 0.5 |
| Piezoelectric sheet material | Lead Zirconate Titanate Piezoelectric (PZT-5H) | |
| Magnetic ring material | N52 | |
| Magnetic ring gap (mm) | 1–7/step 1 | |
| Residual magnetism intensity (T) | 1.0–1.5/step 0.1 | |
| Magnetic ring thickness (mm) | 2 | |
| Magnetic ring height (mm) | 10 | |
| Single-wing piezoelectric beam | Beryllium bronze | |
| Single-Wing Piezoelectric Beam Model | Input Frequency (Hz) | Load (N) |
|---|---|---|
| 60 × 6 | 73 | 0.1–1/step 0.1 |
| Vibration Mode | Type 40 | Type 50 | Type 60 |
|---|---|---|---|
| First | 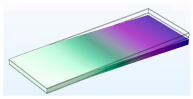 | 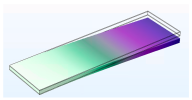 | 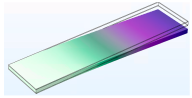 |
| Second | 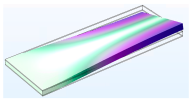 | 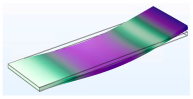 | 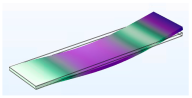 |
| Third |  | 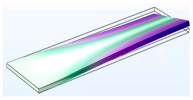 | 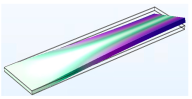 |
| Fourth | 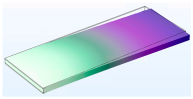 | 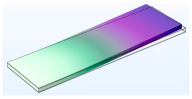 | 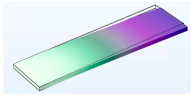 |
| Vibration Mode | Type 6 | Type 10 | Type 15 |
|---|---|---|---|
| First | 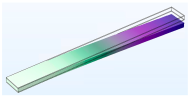 | 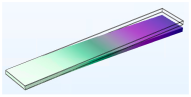 |  |
| Second |  | 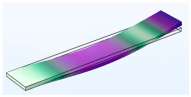 | 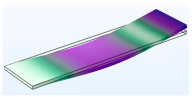 |
| Third | 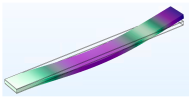 | 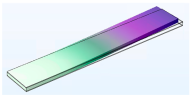 | 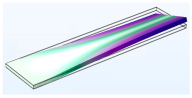 |
| Fourth |  |  | 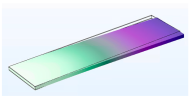 |
| Vibration Mode | Type 0.5 | Type 1 | Type 1.5 |
|---|---|---|---|
| First | 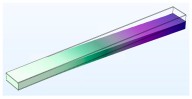 |  | 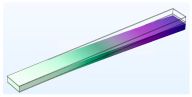 |
| Second | 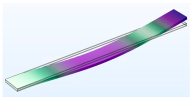 | 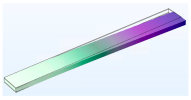 | 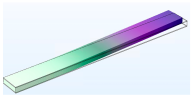 |
| Third | 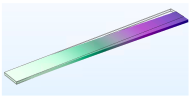 | 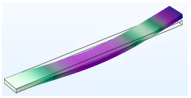 | 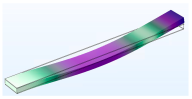 |
| Fourth | 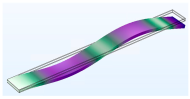 | 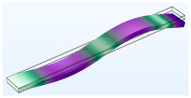 | 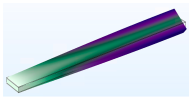 |
Disclaimer/Publisher’s Note: The statements, opinions and data contained in all publications are solely those of the individual author(s) and contributor(s) and not of MDPI and/or the editor(s). MDPI and/or the editor(s) disclaim responsibility for any injury to people or property resulting from any ideas, methods, instructions or products referred to in the content. |
© 2025 by the authors. Licensee MDPI, Basel, Switzerland. This article is an open access article distributed under the terms and conditions of the Creative Commons Attribution (CC BY) license (https://creativecommons.org/licenses/by/4.0/).
Share and Cite
Yang, J.; Chen, Y. Research on the Performance Laws of the Piezoelectric Beam and Magnetic Coupling Module of the Magnetic-Coupled Double-Wing Negative Stiffness Energy Harvester. Materials 2025, 18, 1503. https://doi.org/10.3390/ma18071503
Yang J, Chen Y. Research on the Performance Laws of the Piezoelectric Beam and Magnetic Coupling Module of the Magnetic-Coupled Double-Wing Negative Stiffness Energy Harvester. Materials. 2025; 18(7):1503. https://doi.org/10.3390/ma18071503
Chicago/Turabian StyleYang, Jie, and Yingchun Chen. 2025. "Research on the Performance Laws of the Piezoelectric Beam and Magnetic Coupling Module of the Magnetic-Coupled Double-Wing Negative Stiffness Energy Harvester" Materials 18, no. 7: 1503. https://doi.org/10.3390/ma18071503
APA StyleYang, J., & Chen, Y. (2025). Research on the Performance Laws of the Piezoelectric Beam and Magnetic Coupling Module of the Magnetic-Coupled Double-Wing Negative Stiffness Energy Harvester. Materials, 18(7), 1503. https://doi.org/10.3390/ma18071503