
Improving Shear Performance of Precast Concrete Segmental Beams Through Continuous Longitudinal Reinforcements Across Joints


Abstract
:1. Introduction
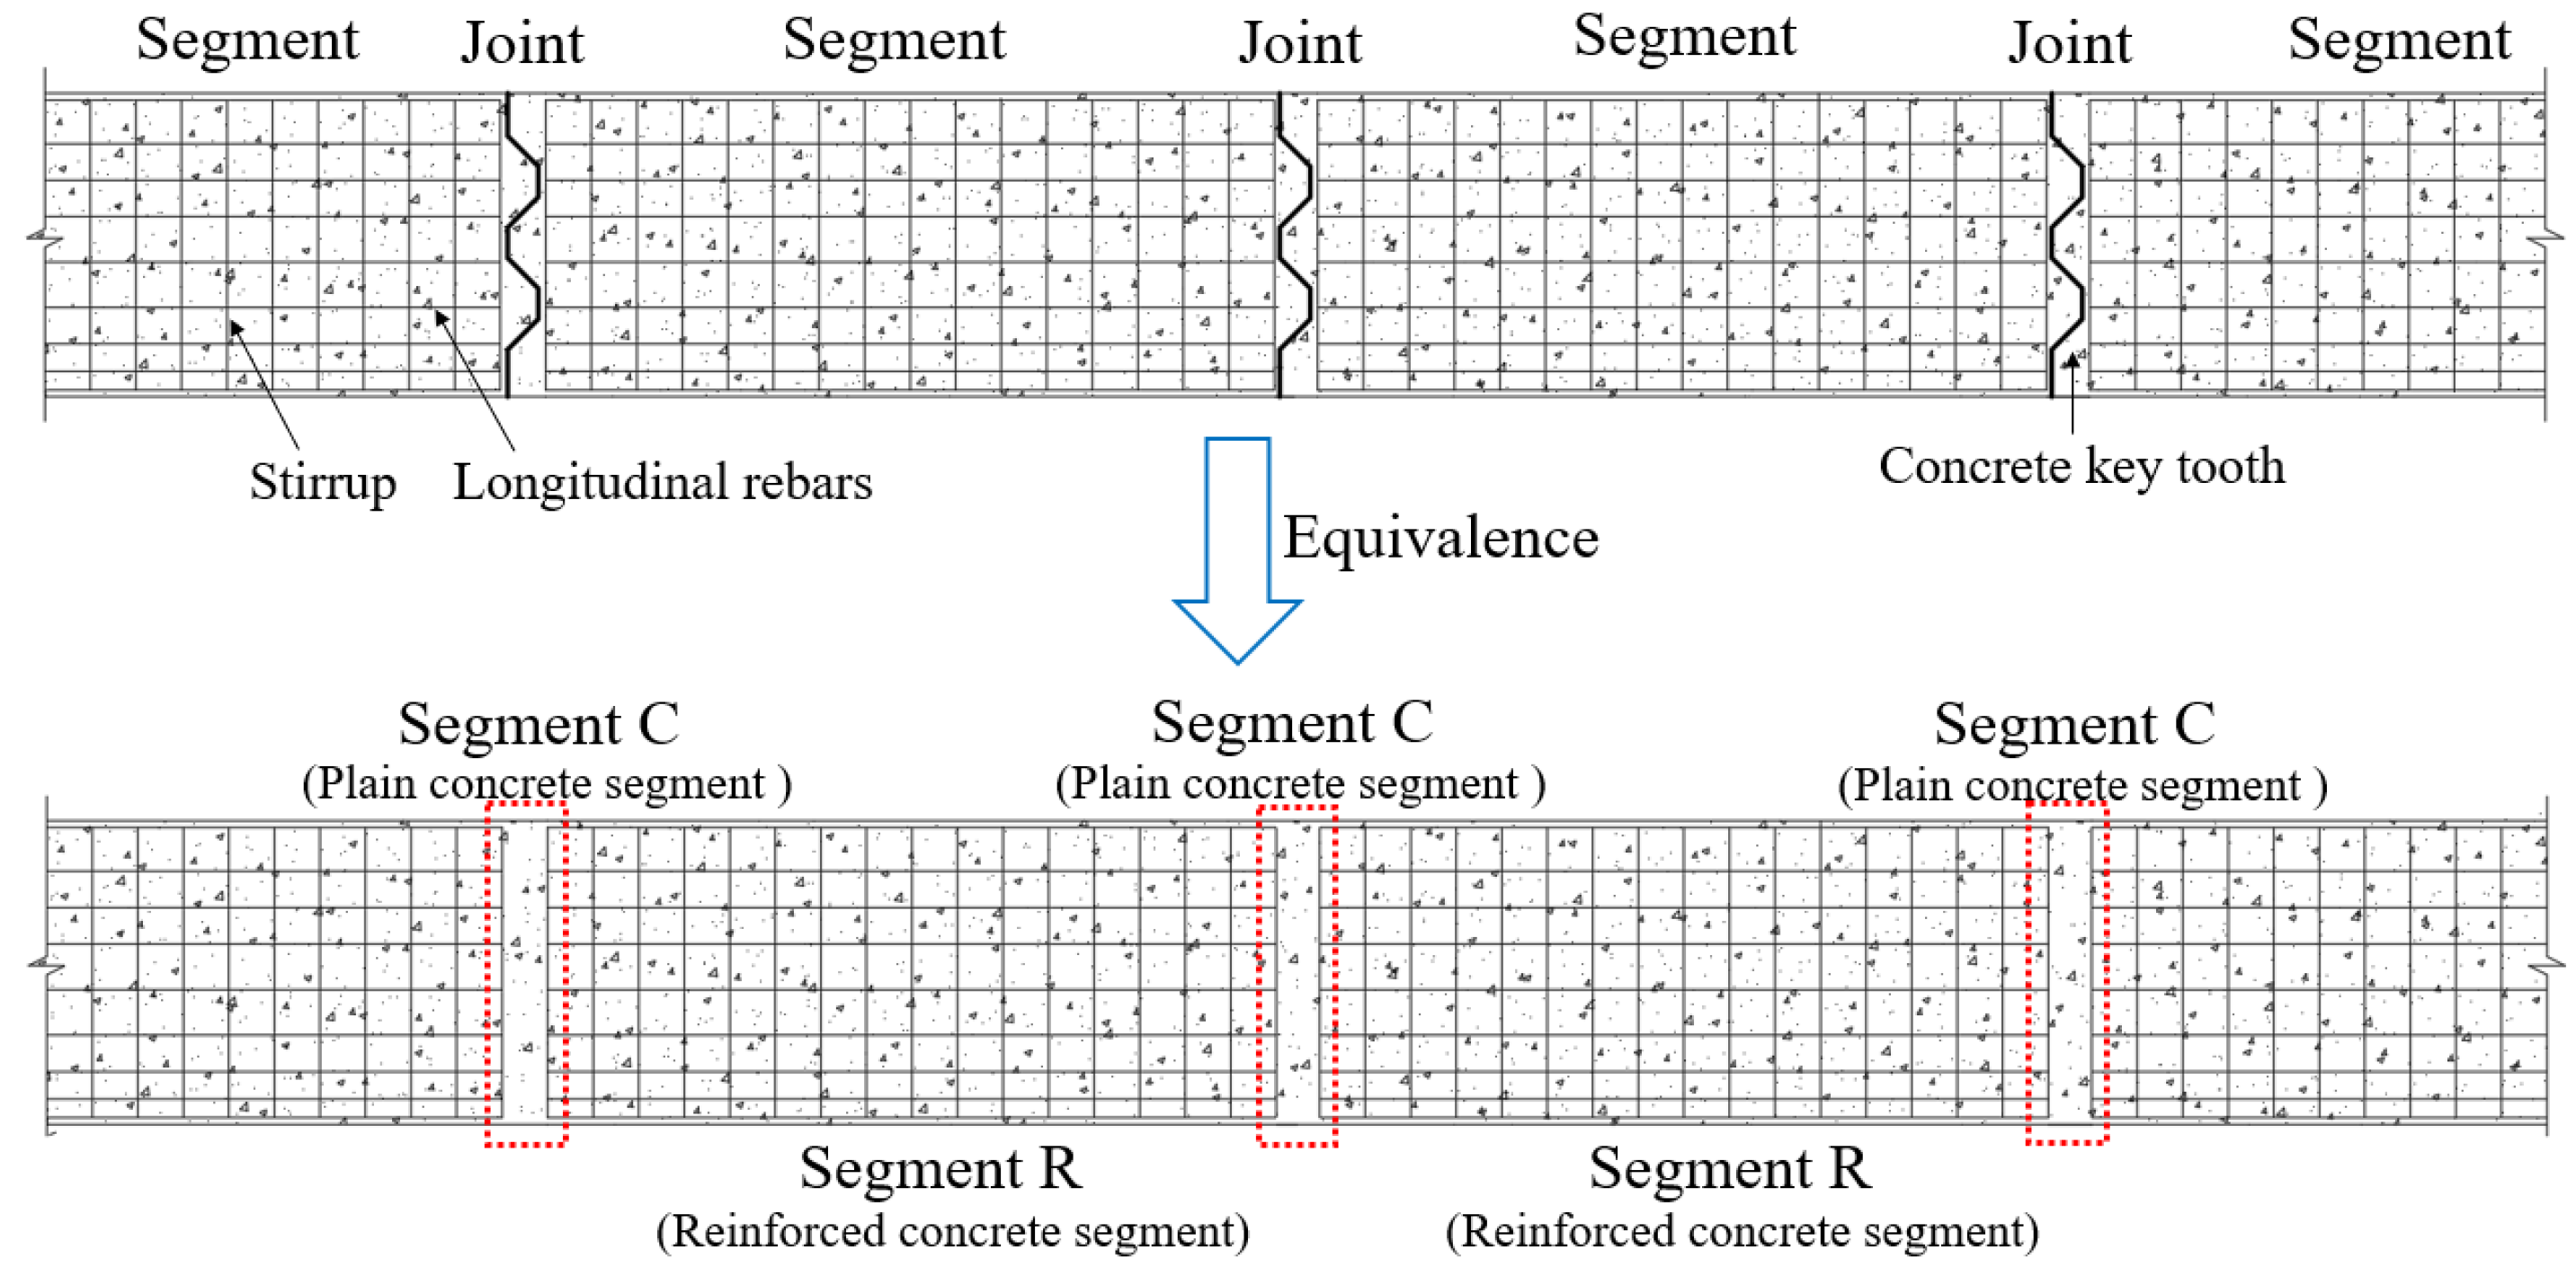
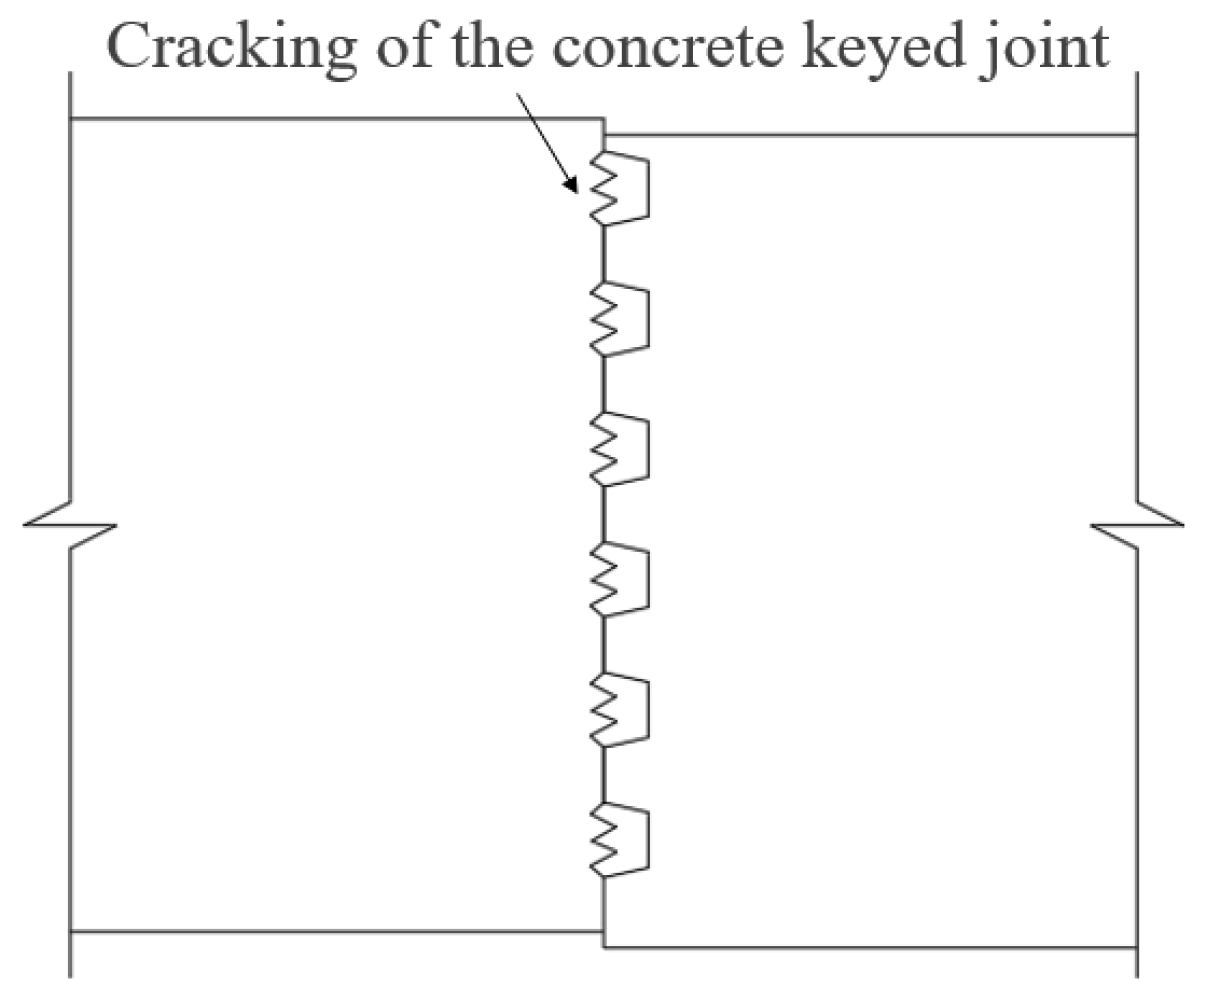
2. The Fundamental Nature and Failure Mode of Segmental Beams
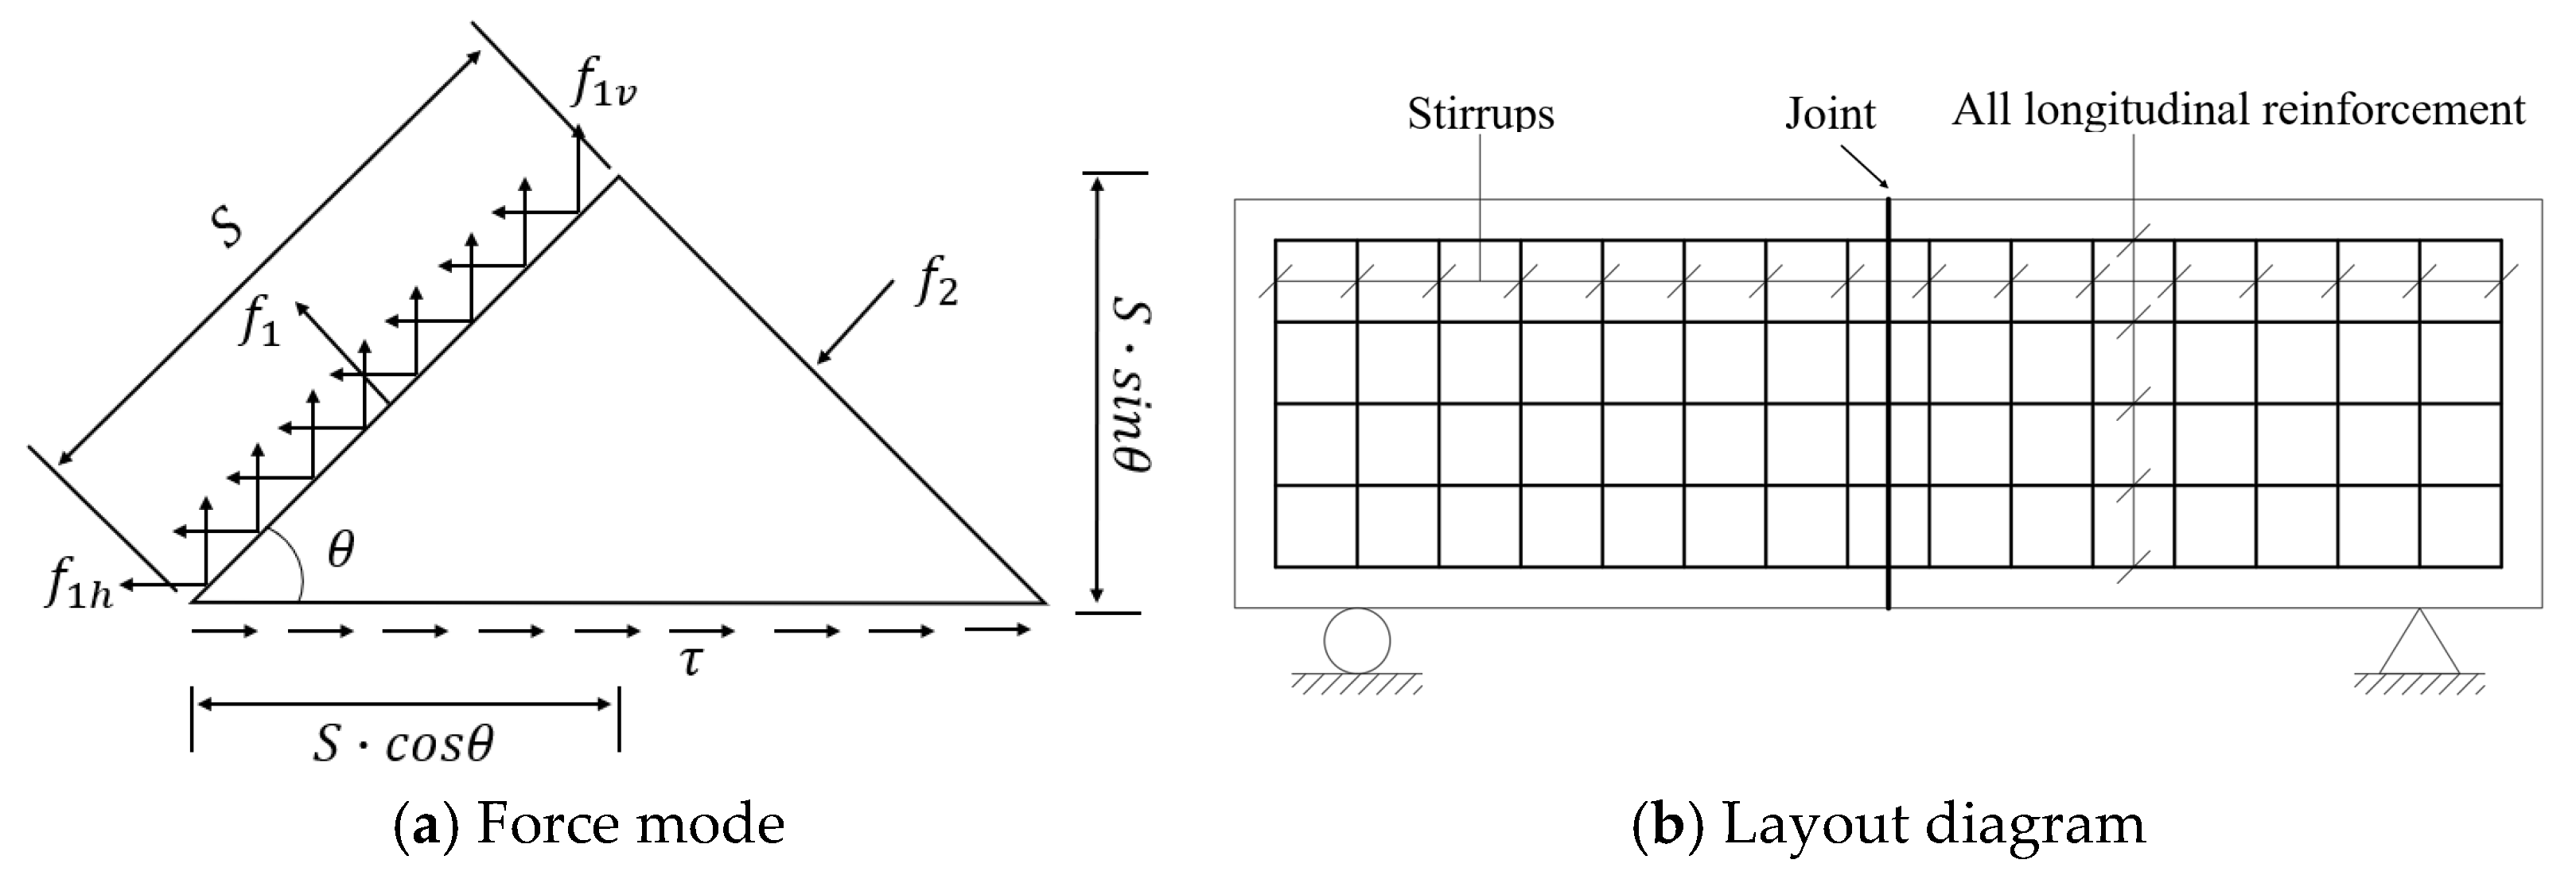
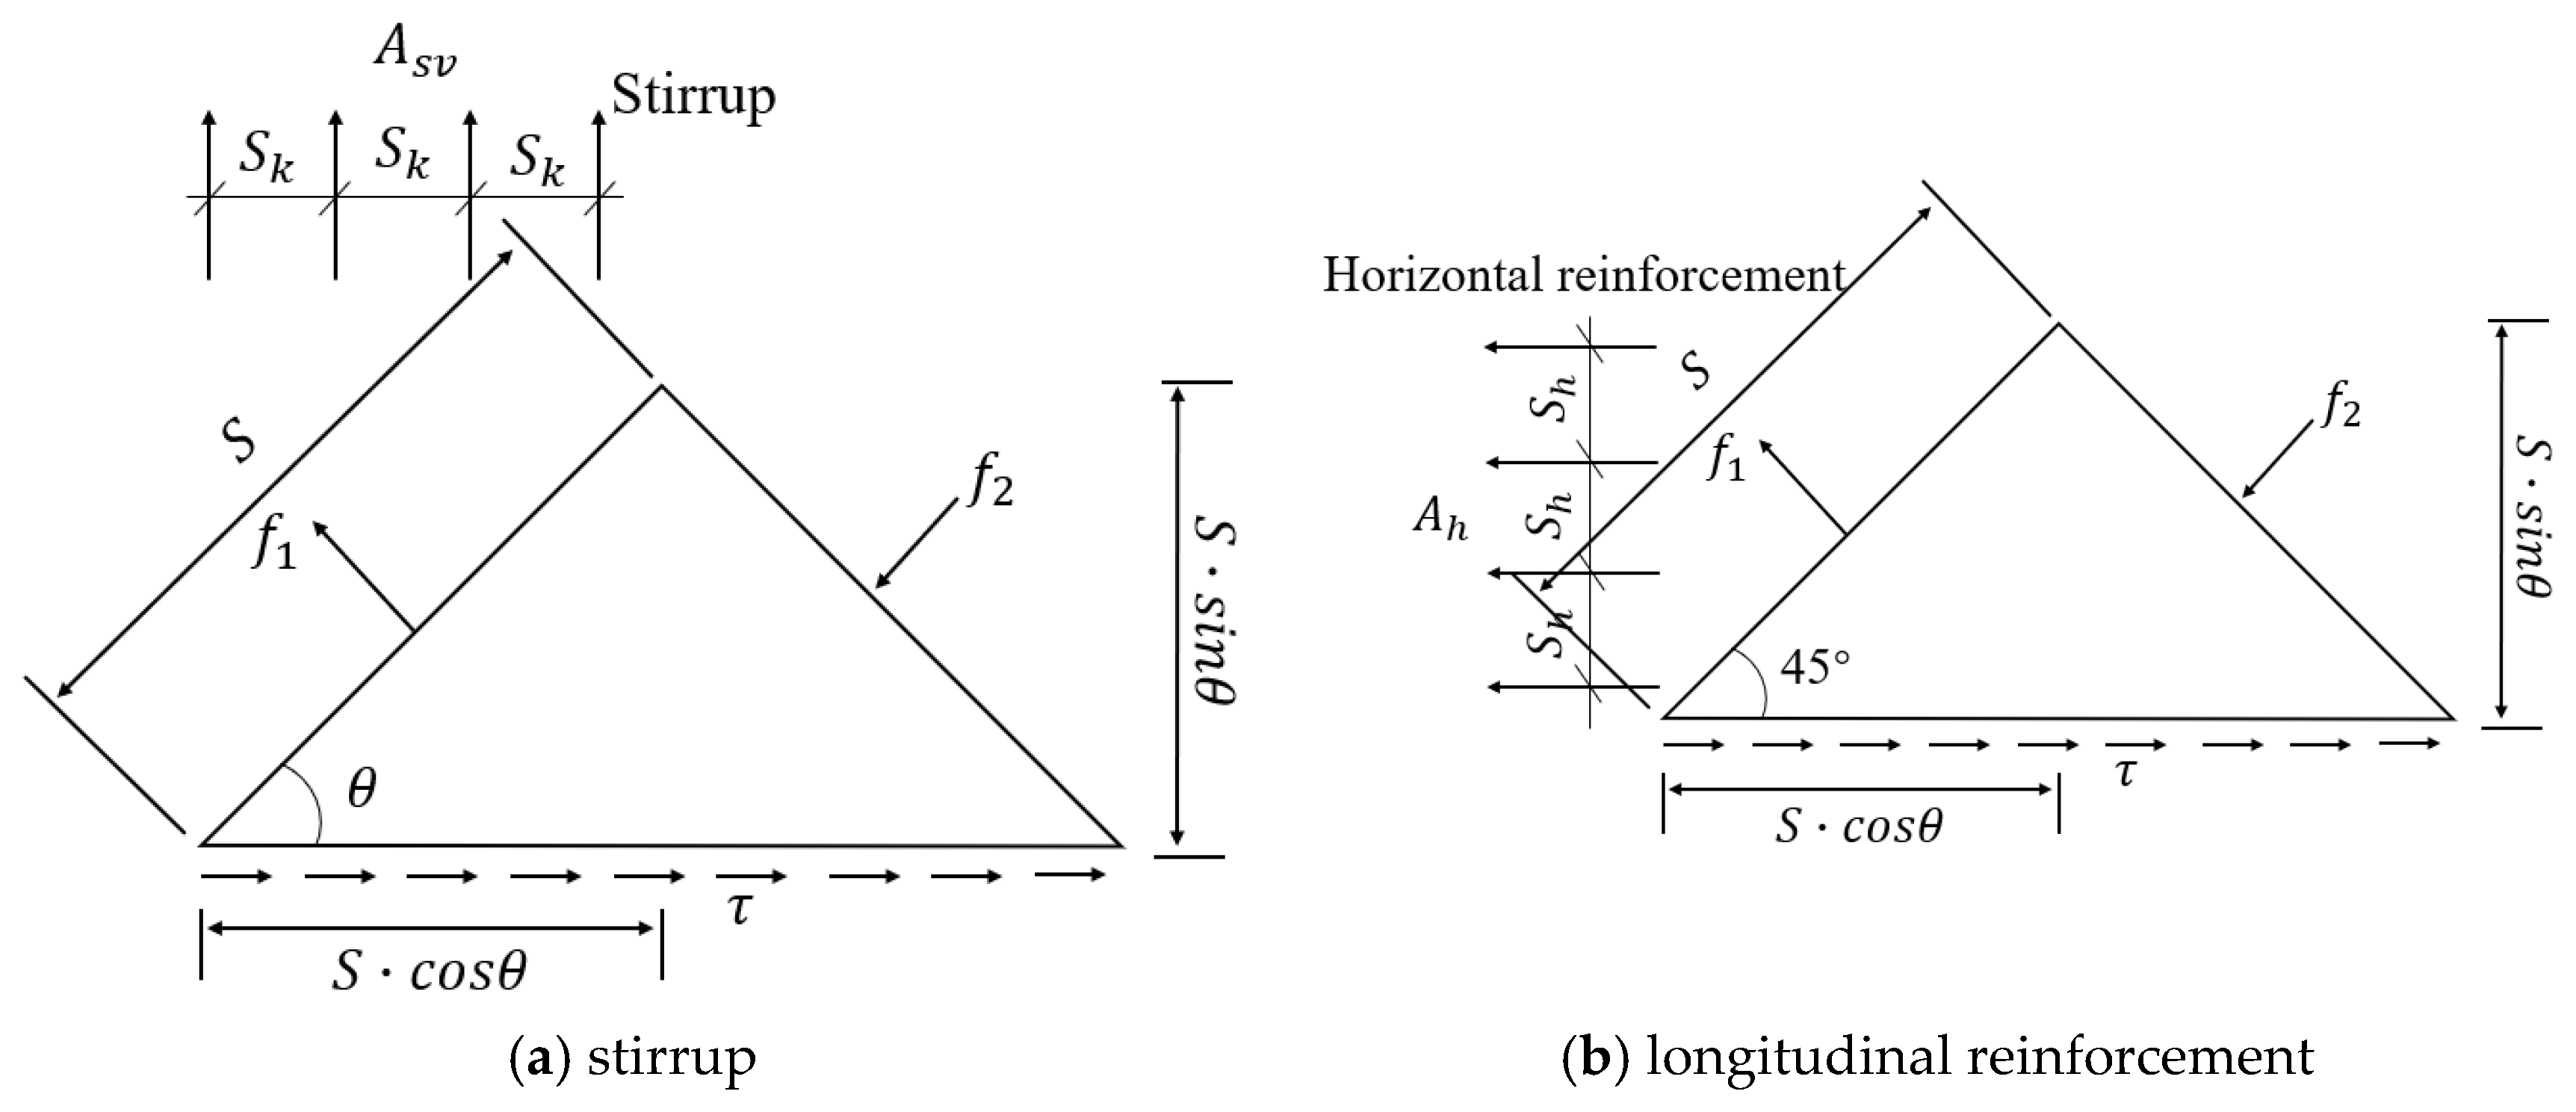
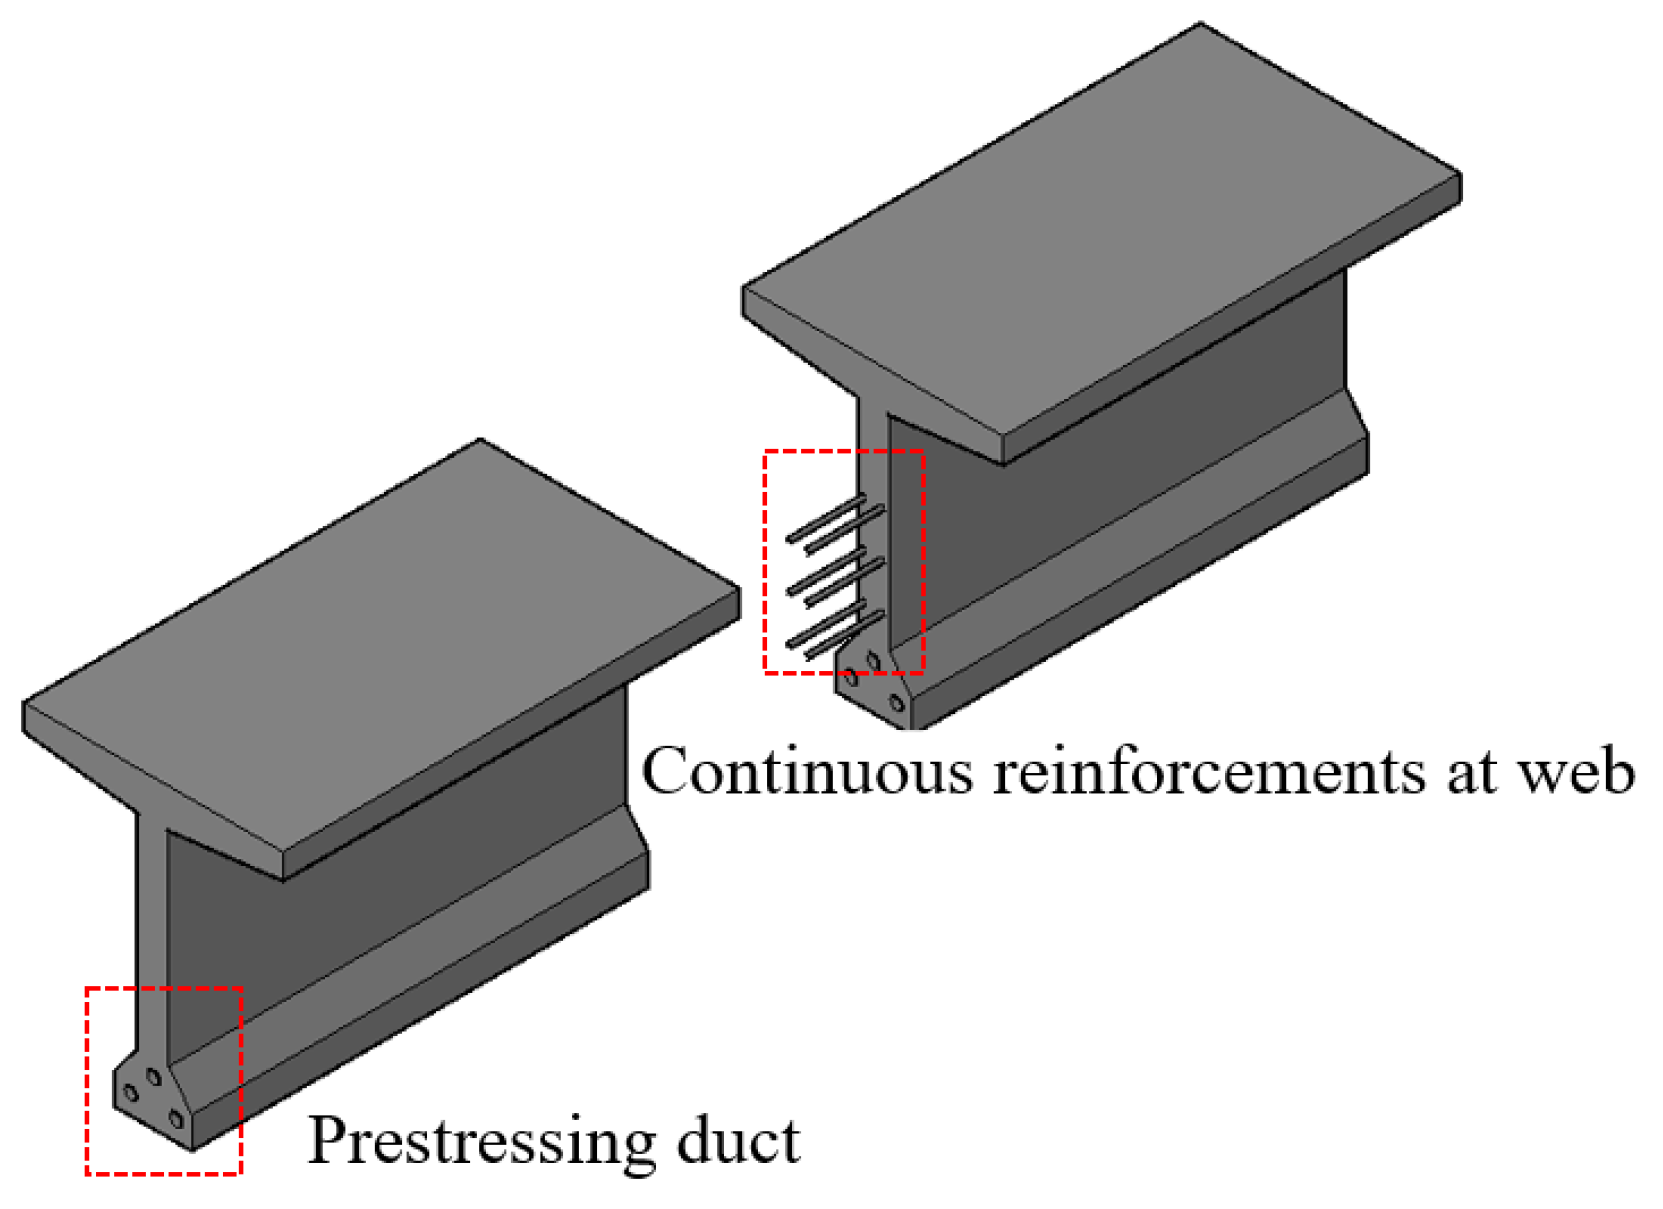
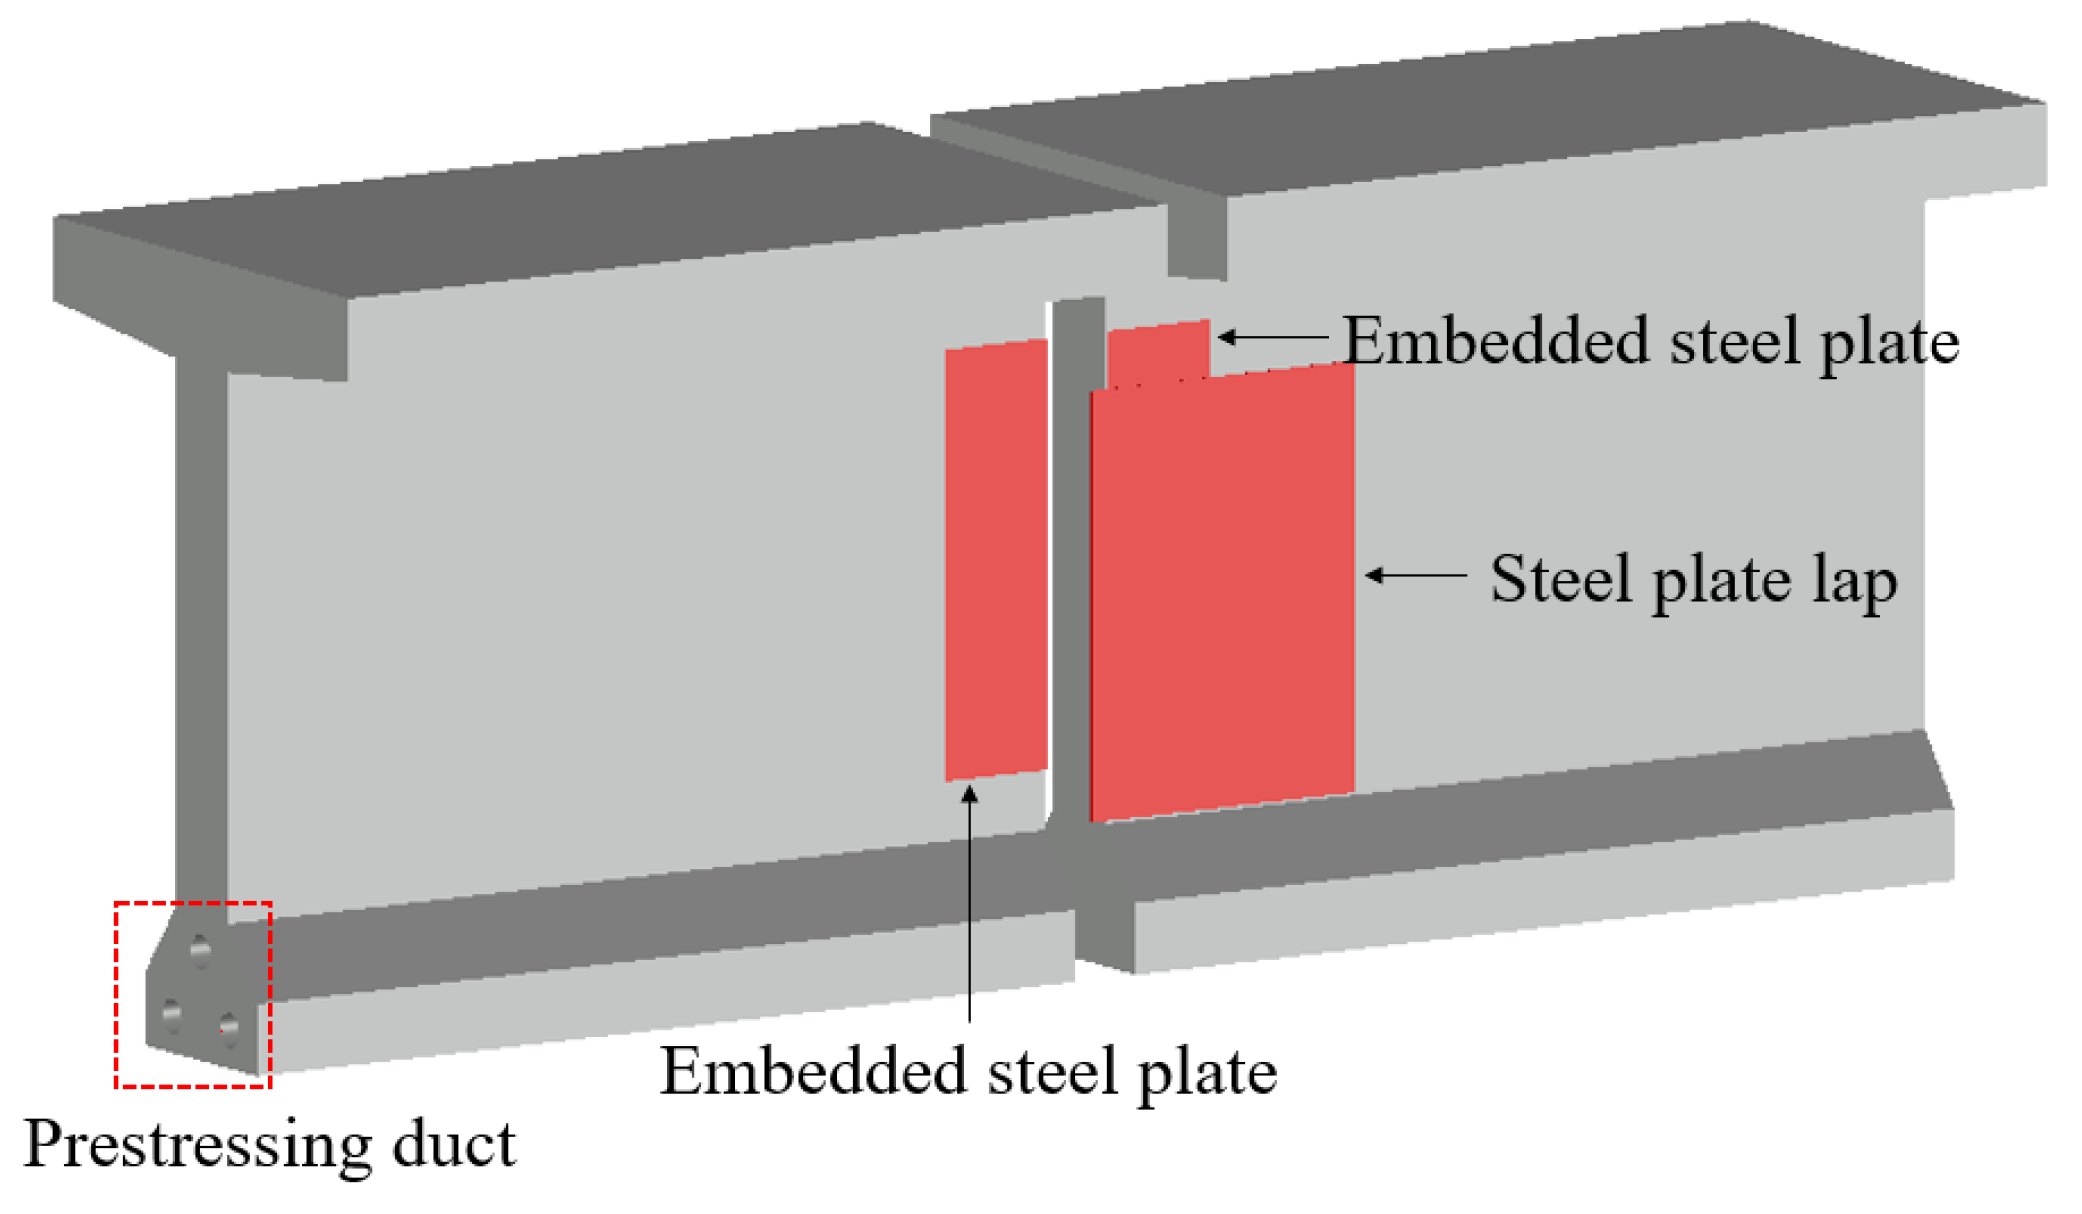
3. Design of Continuous Reinforcement Crossing the Joints
4. Experimental Program
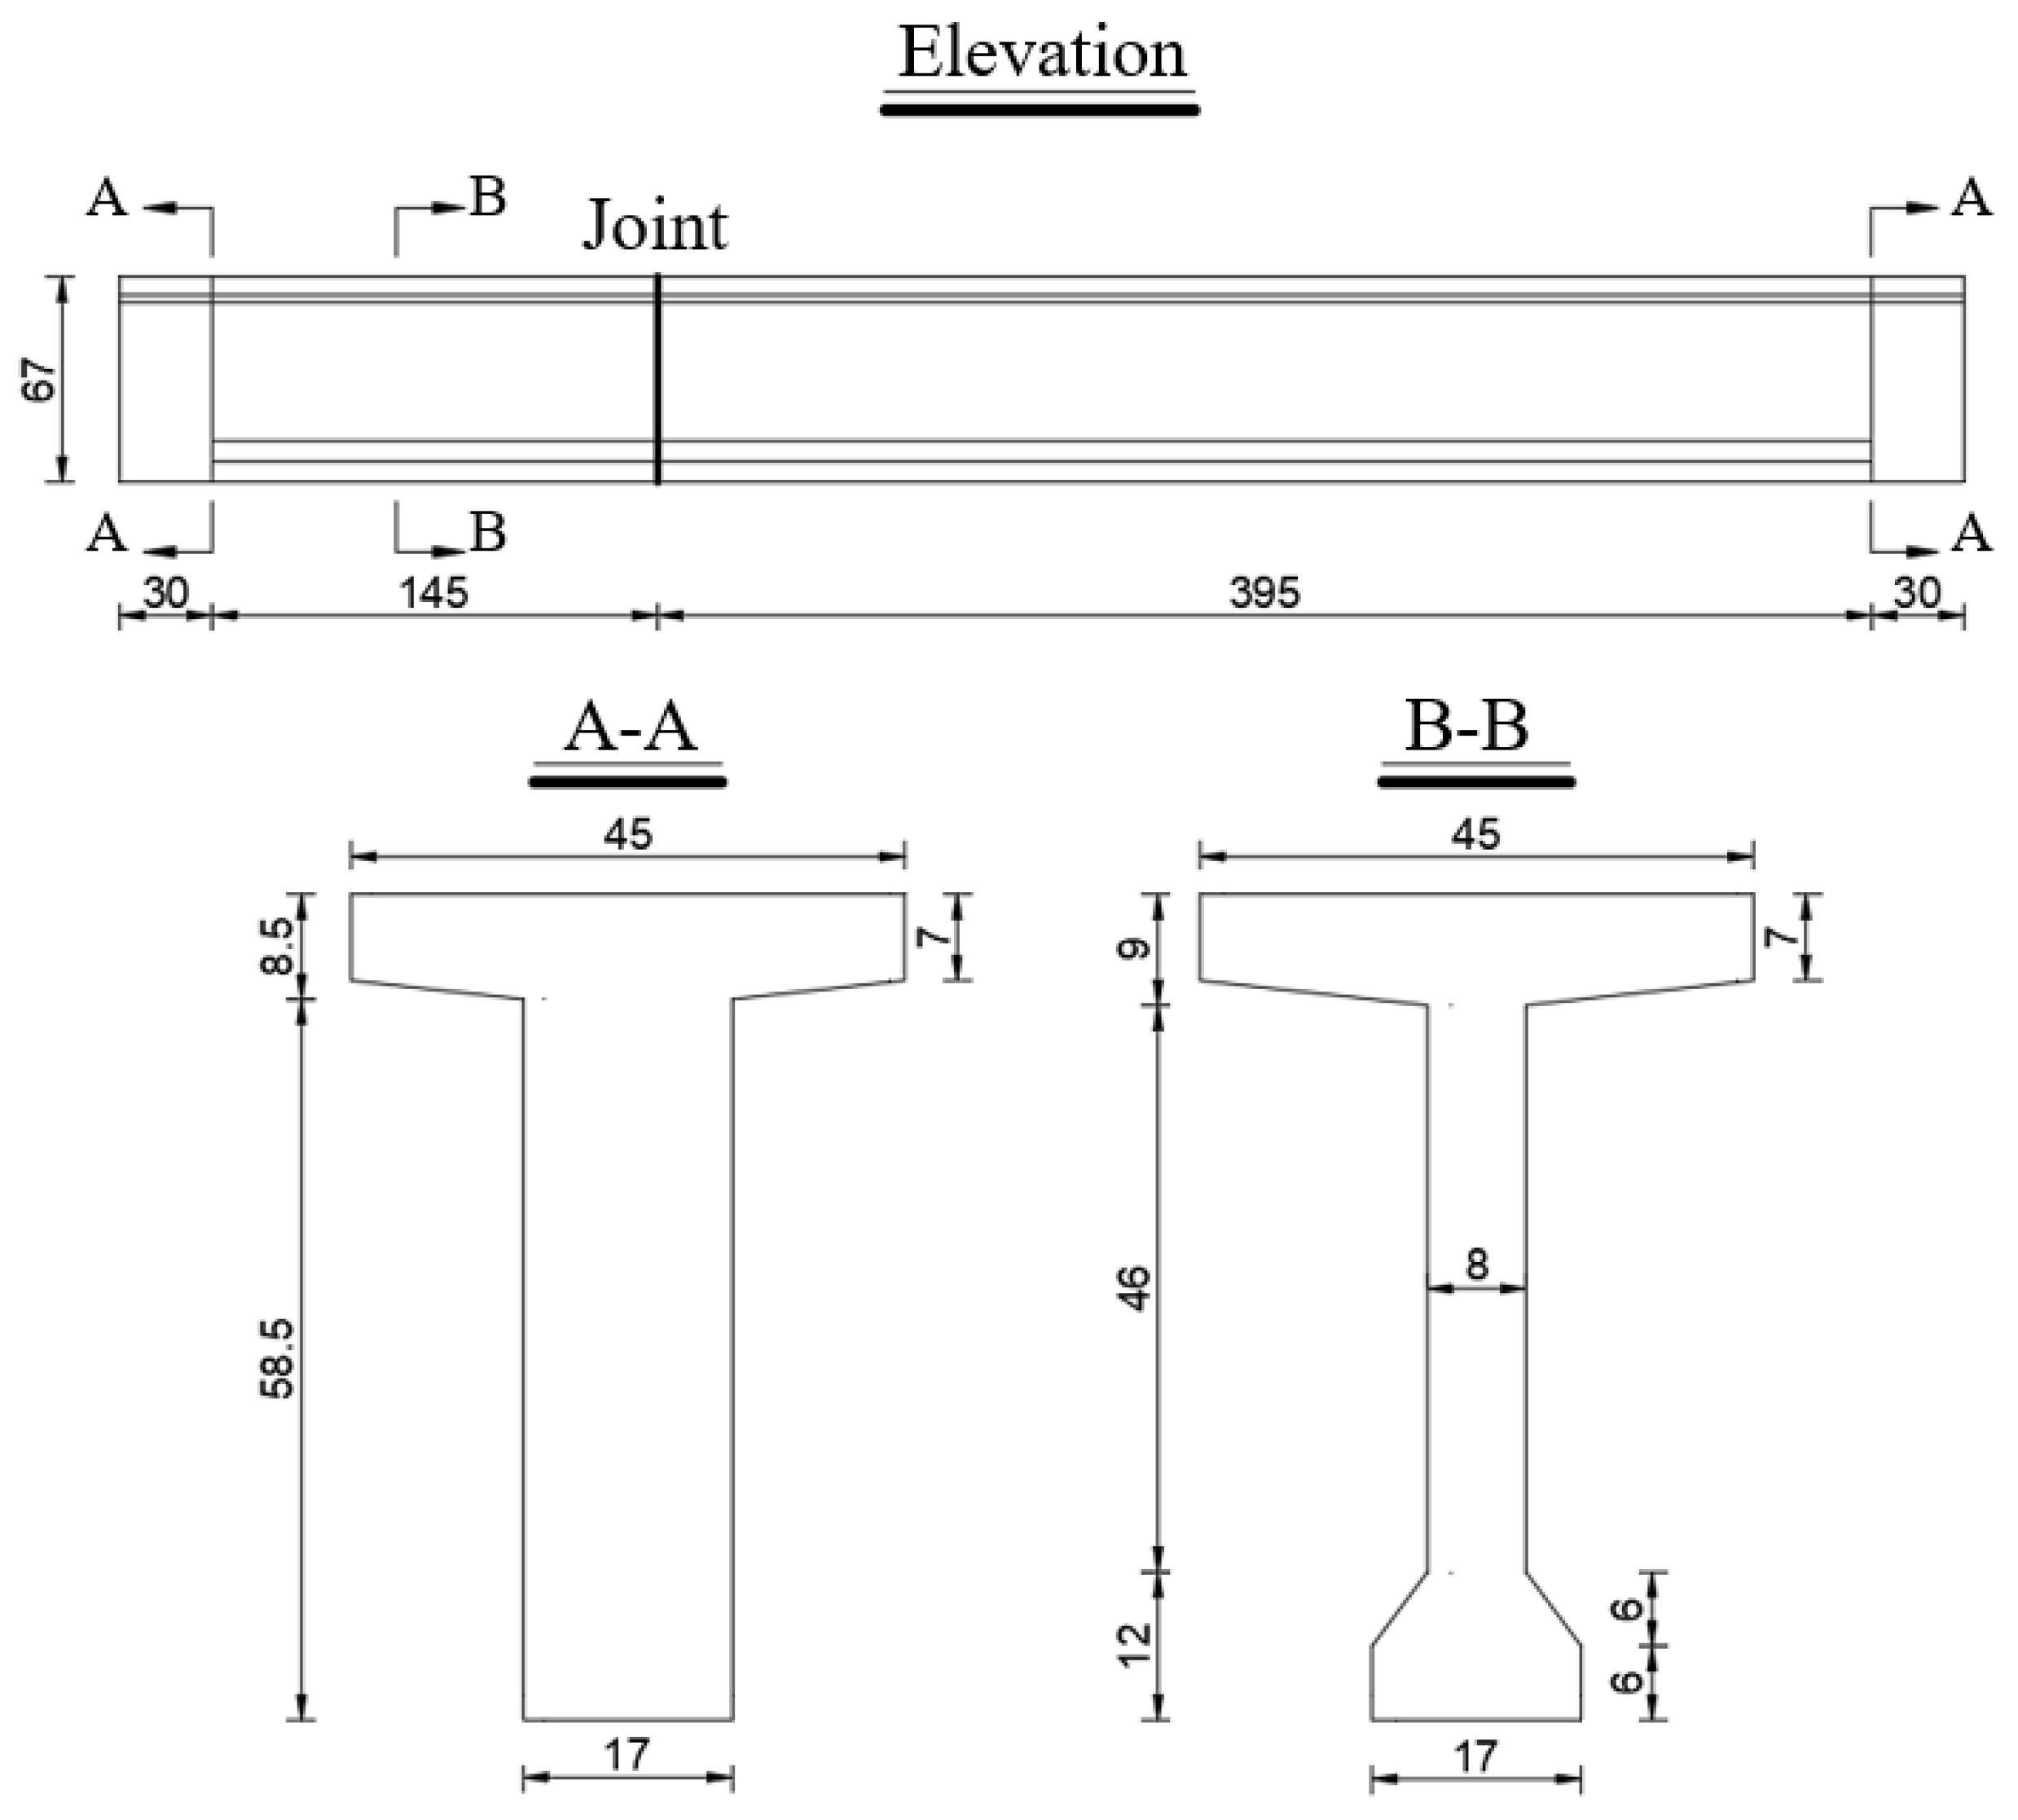
4.1. Test Specimens Design
4.1.1. Section Design
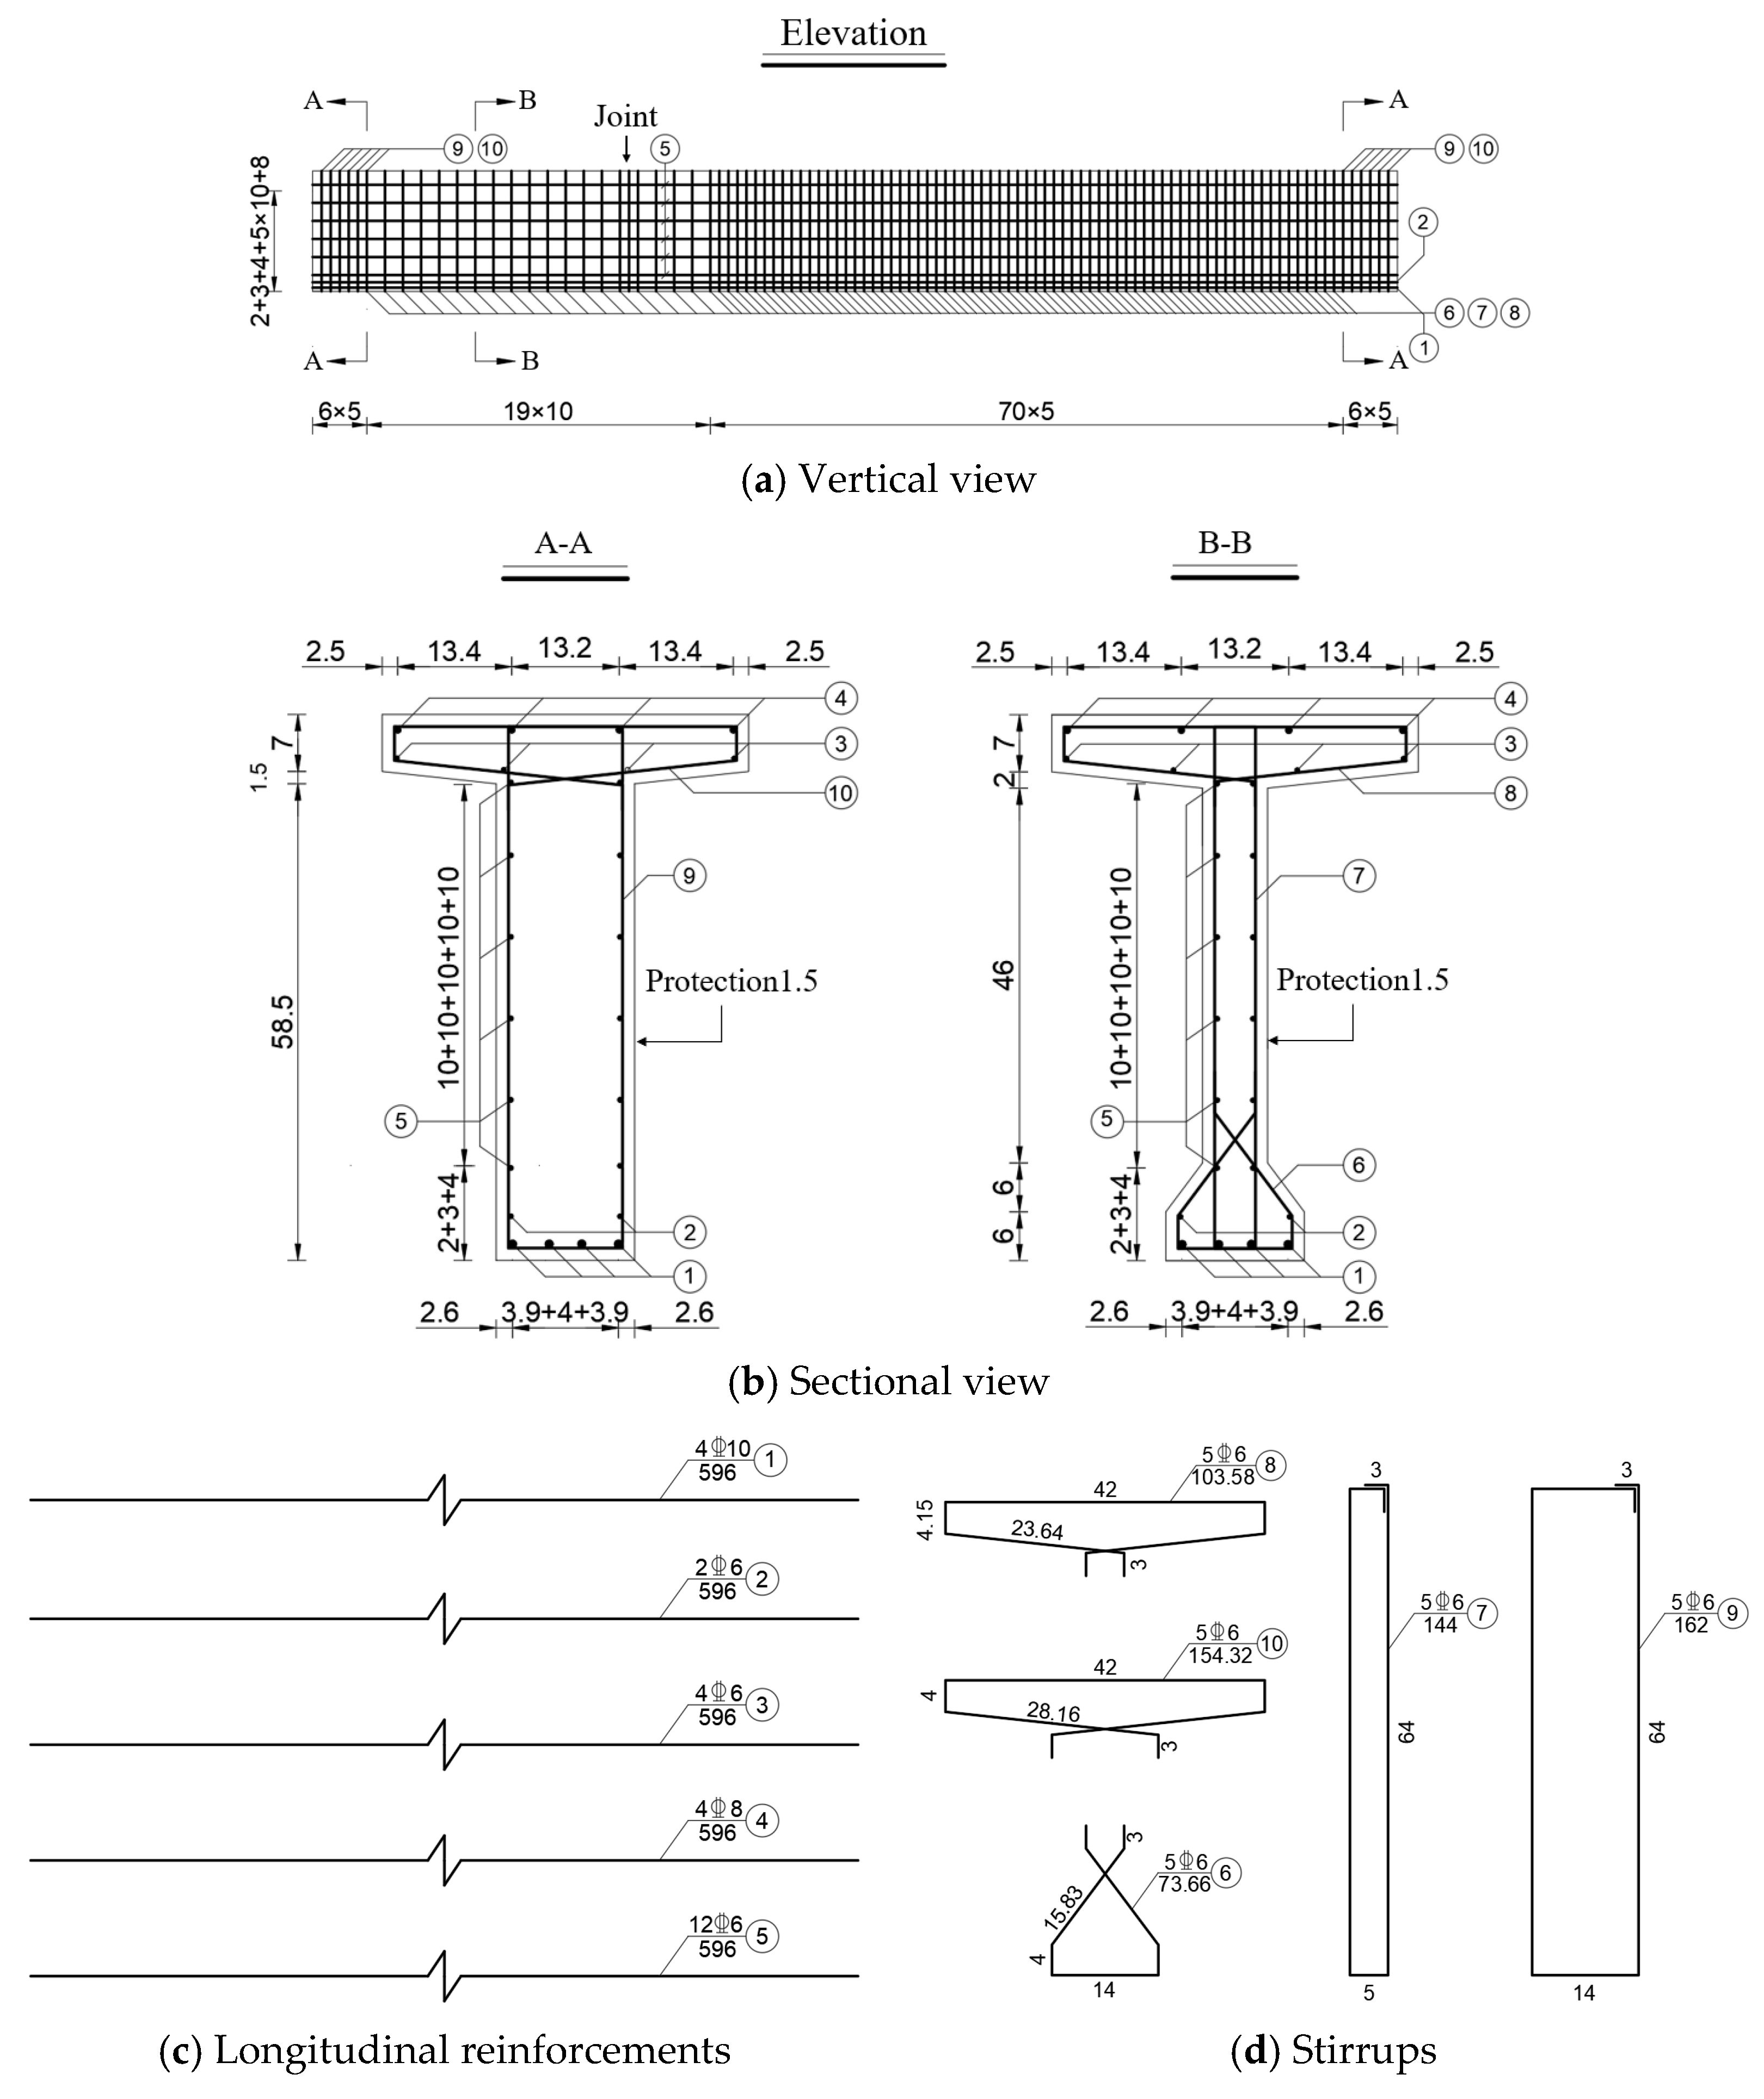
4.1.2. Reinforcement Design
4.1.3. Tendon Arrangement
4.1.4. Parameter Design
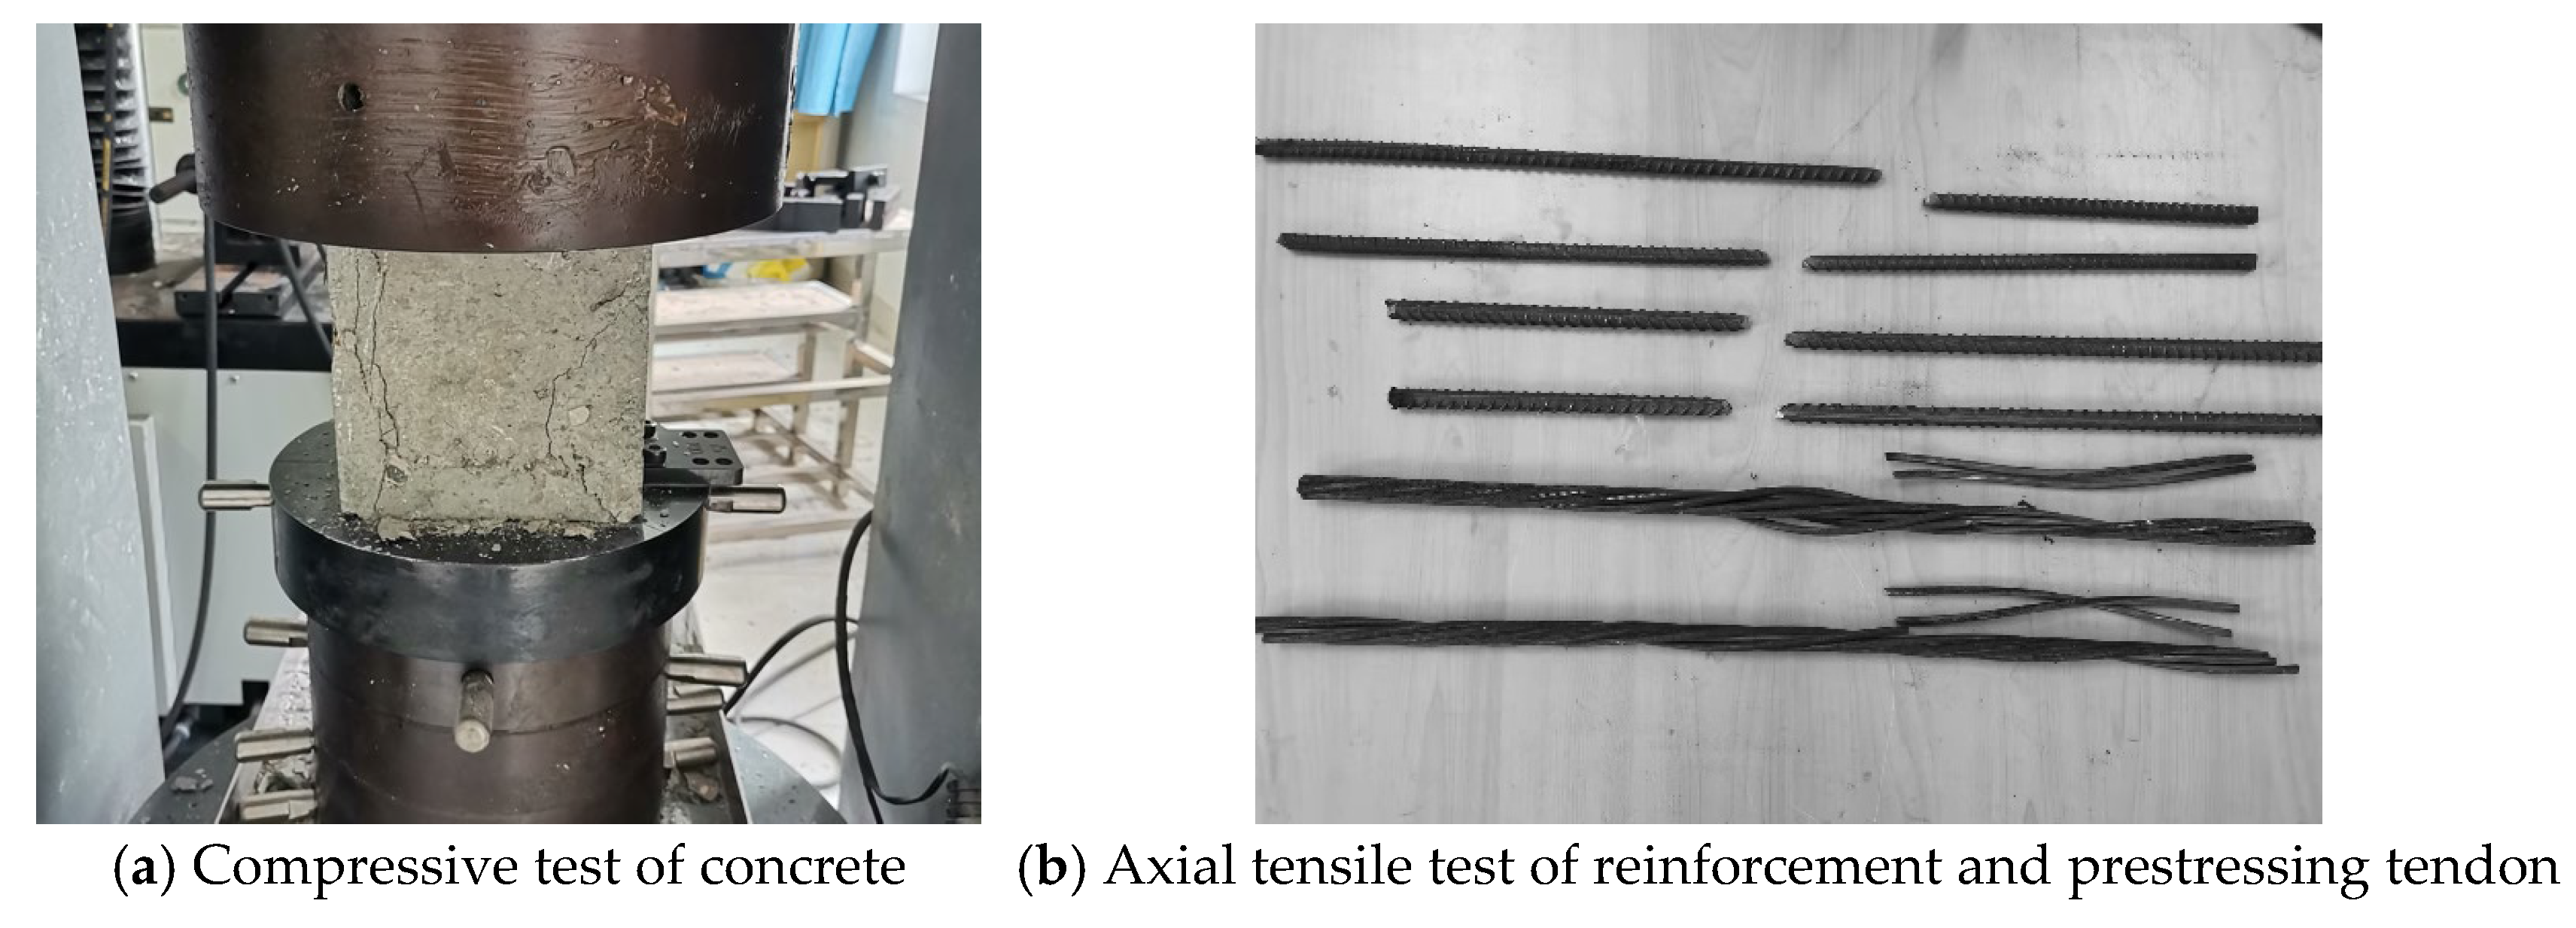
4.2. Materials
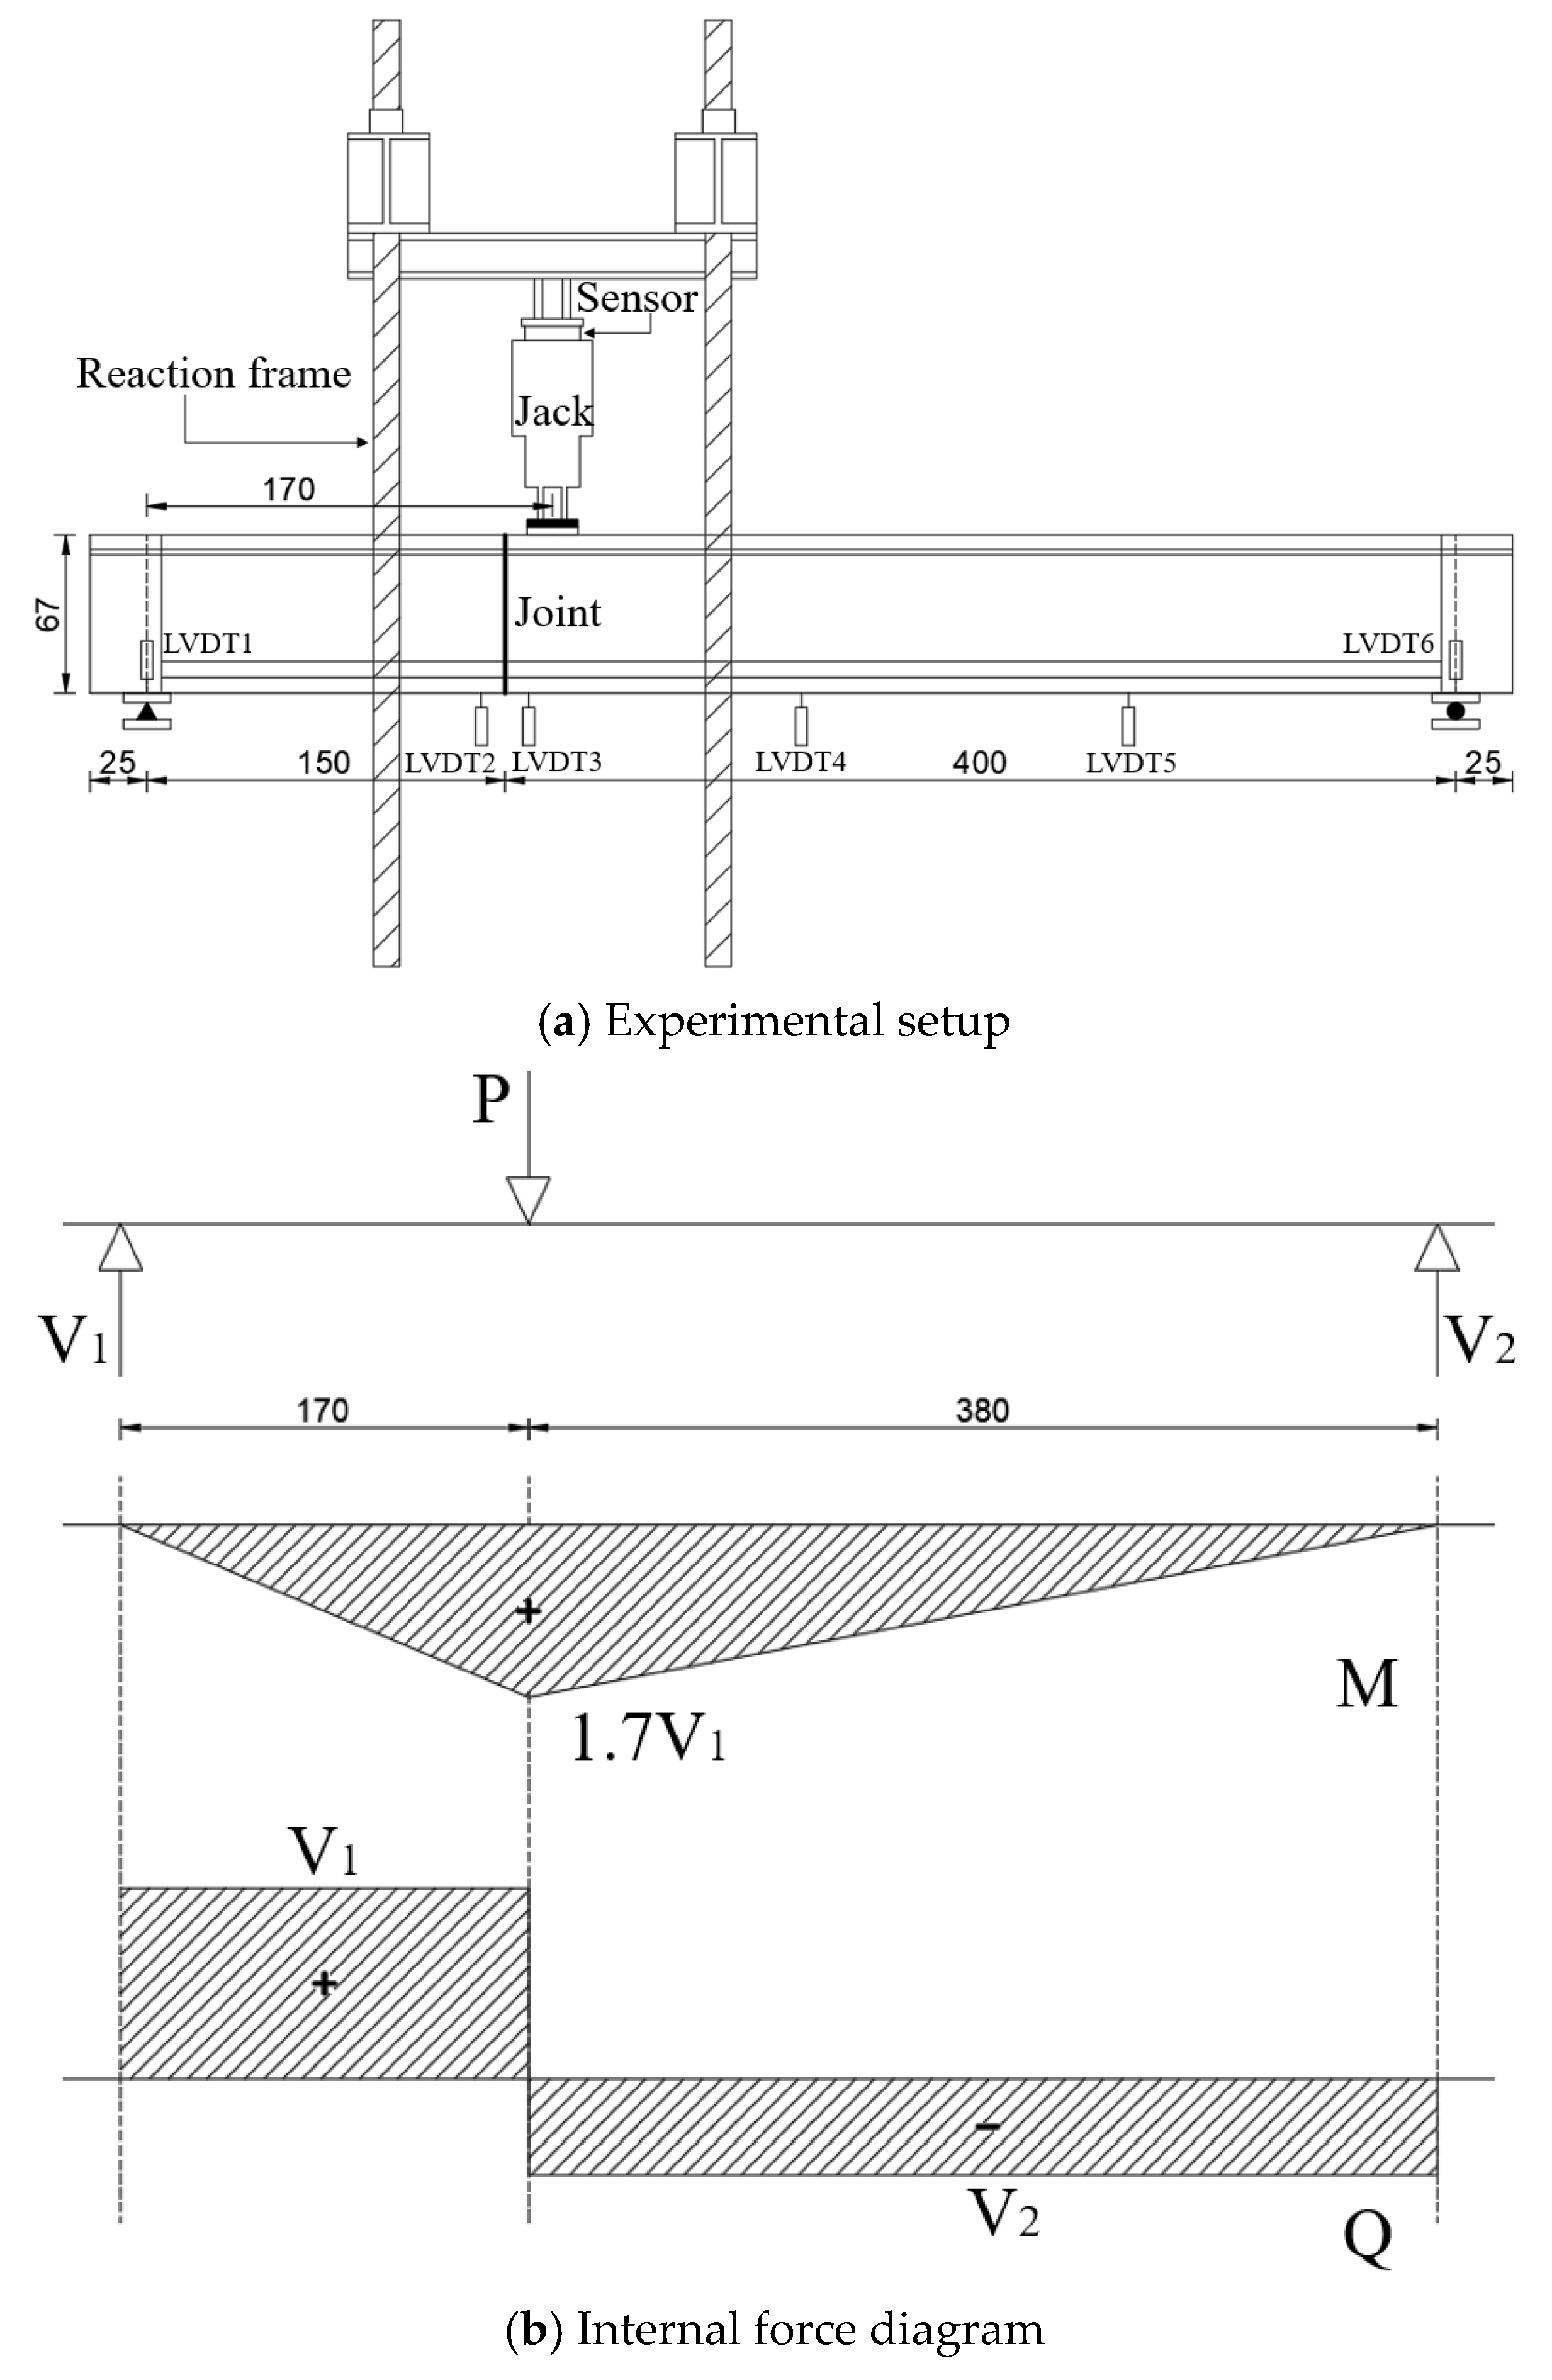
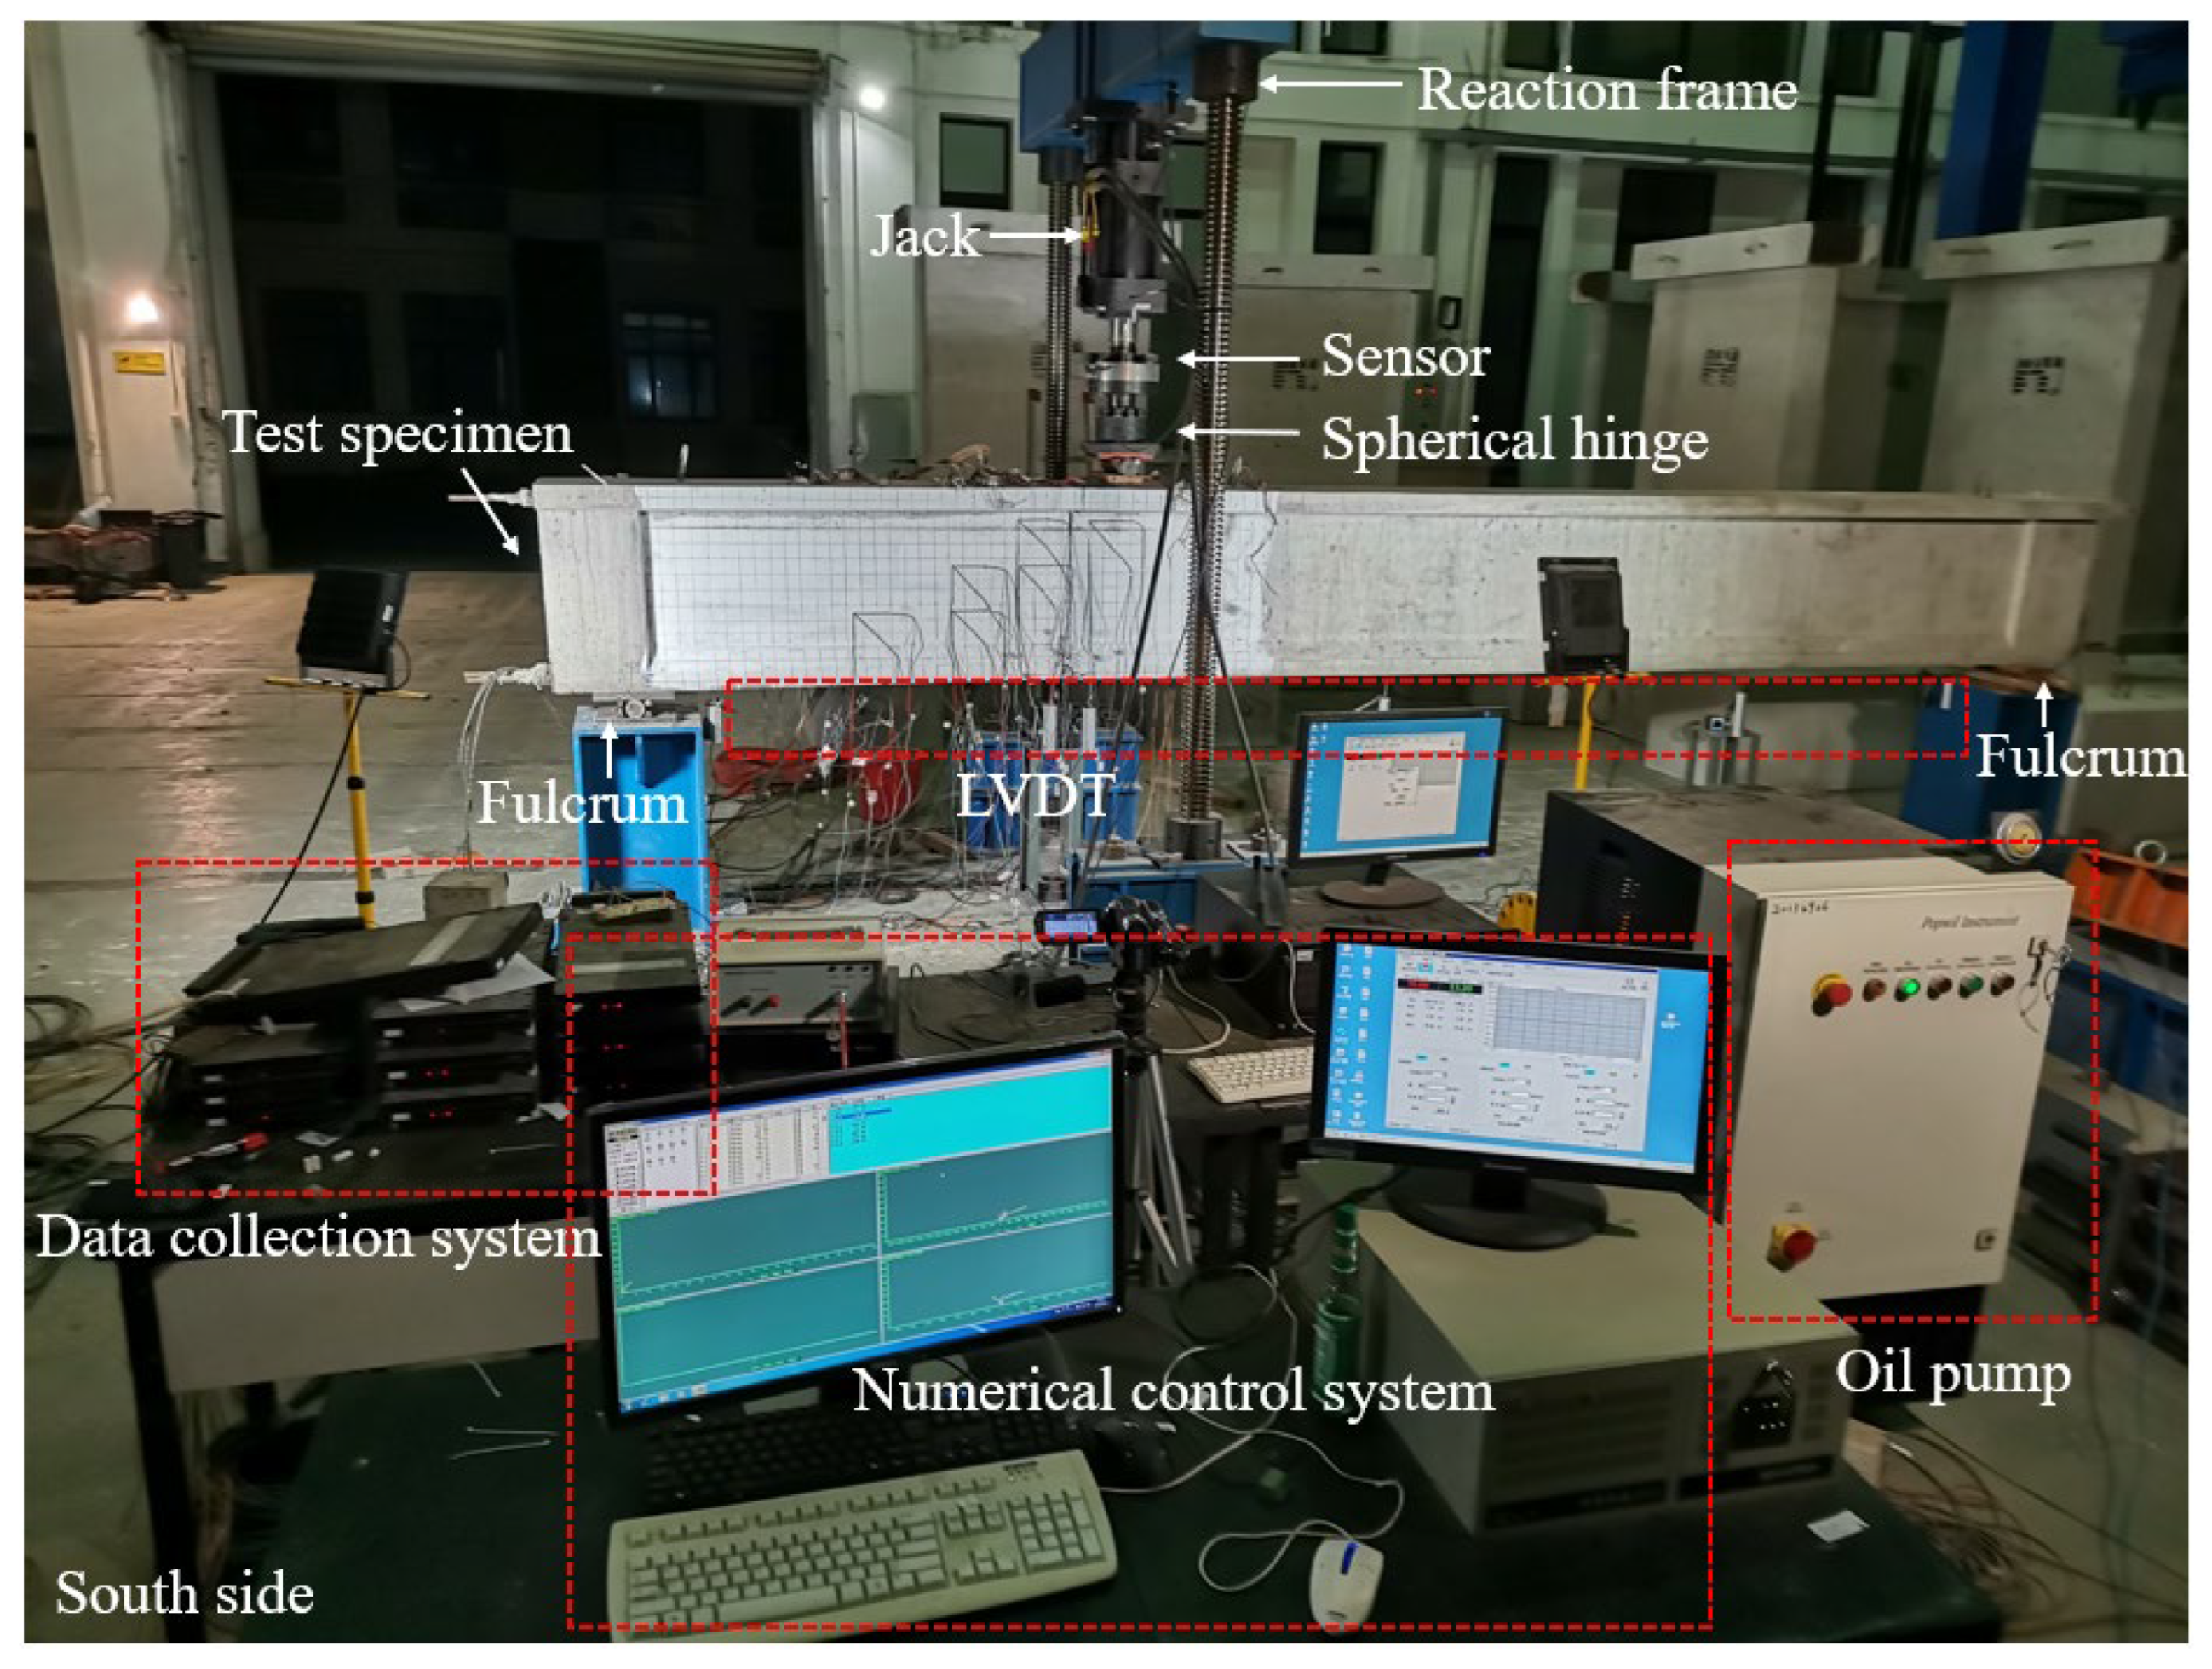
4.3. Test Setup
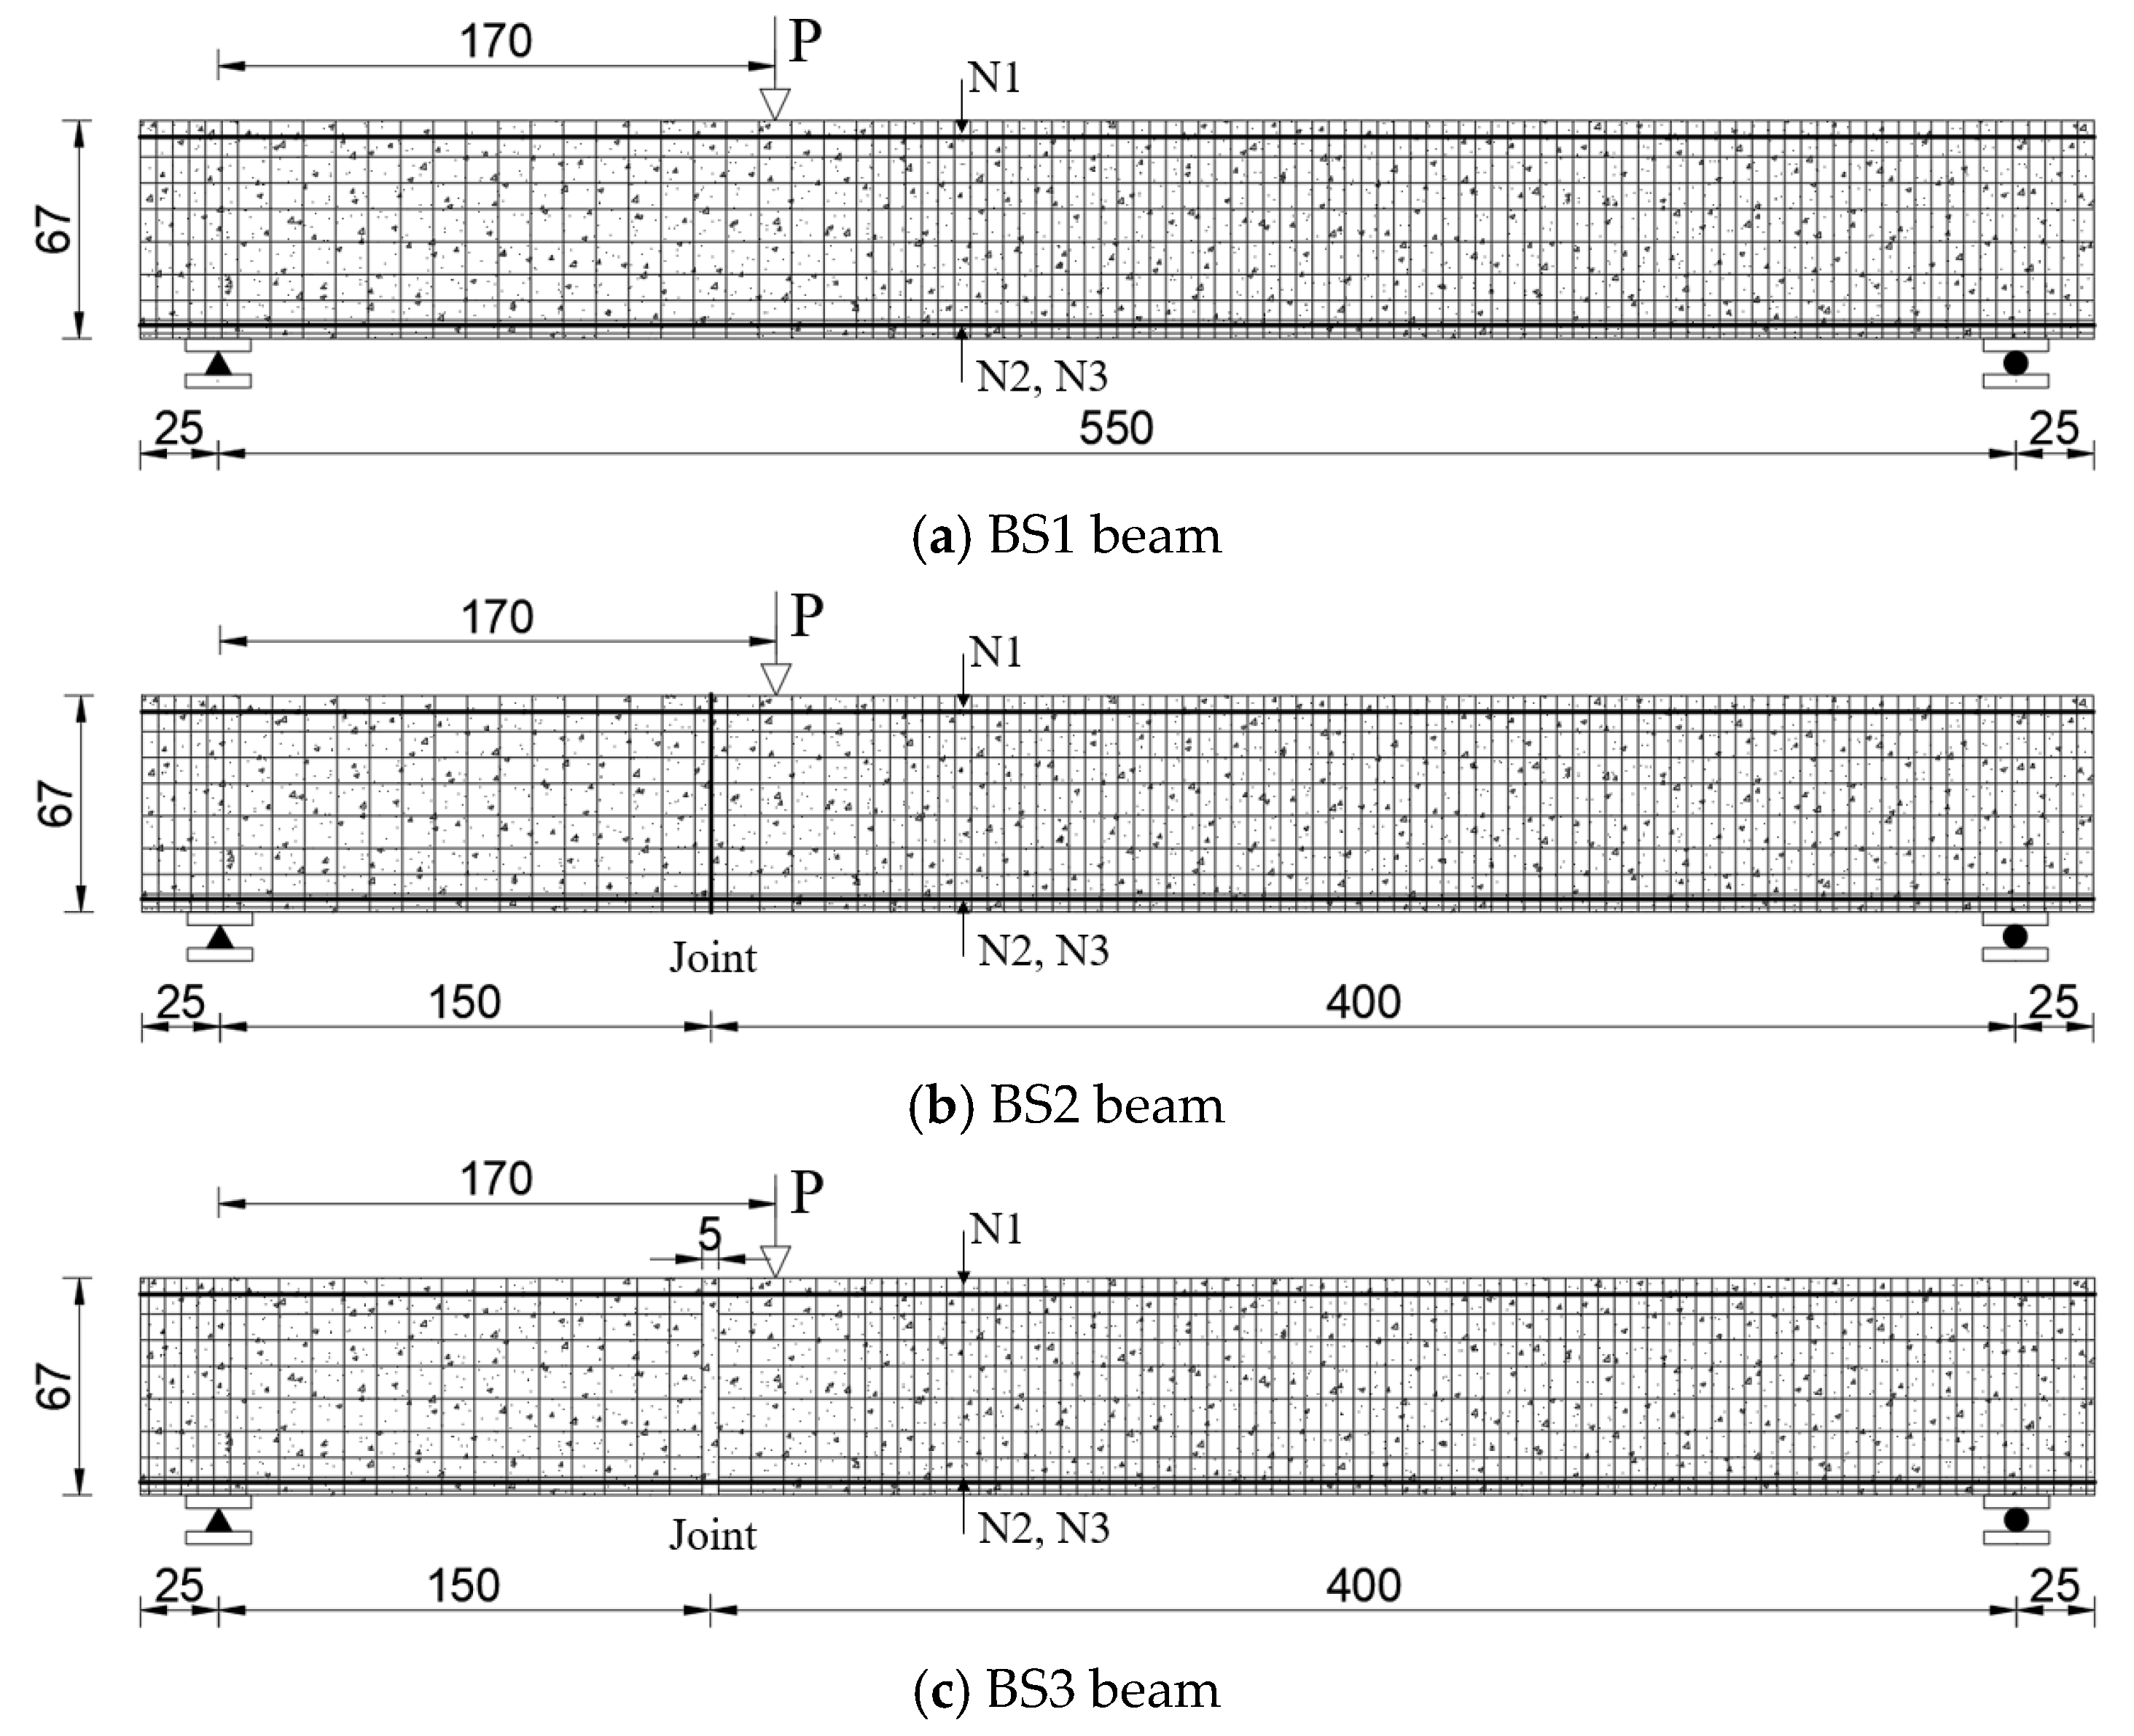
4.3.1. Support and Loading Points Layout
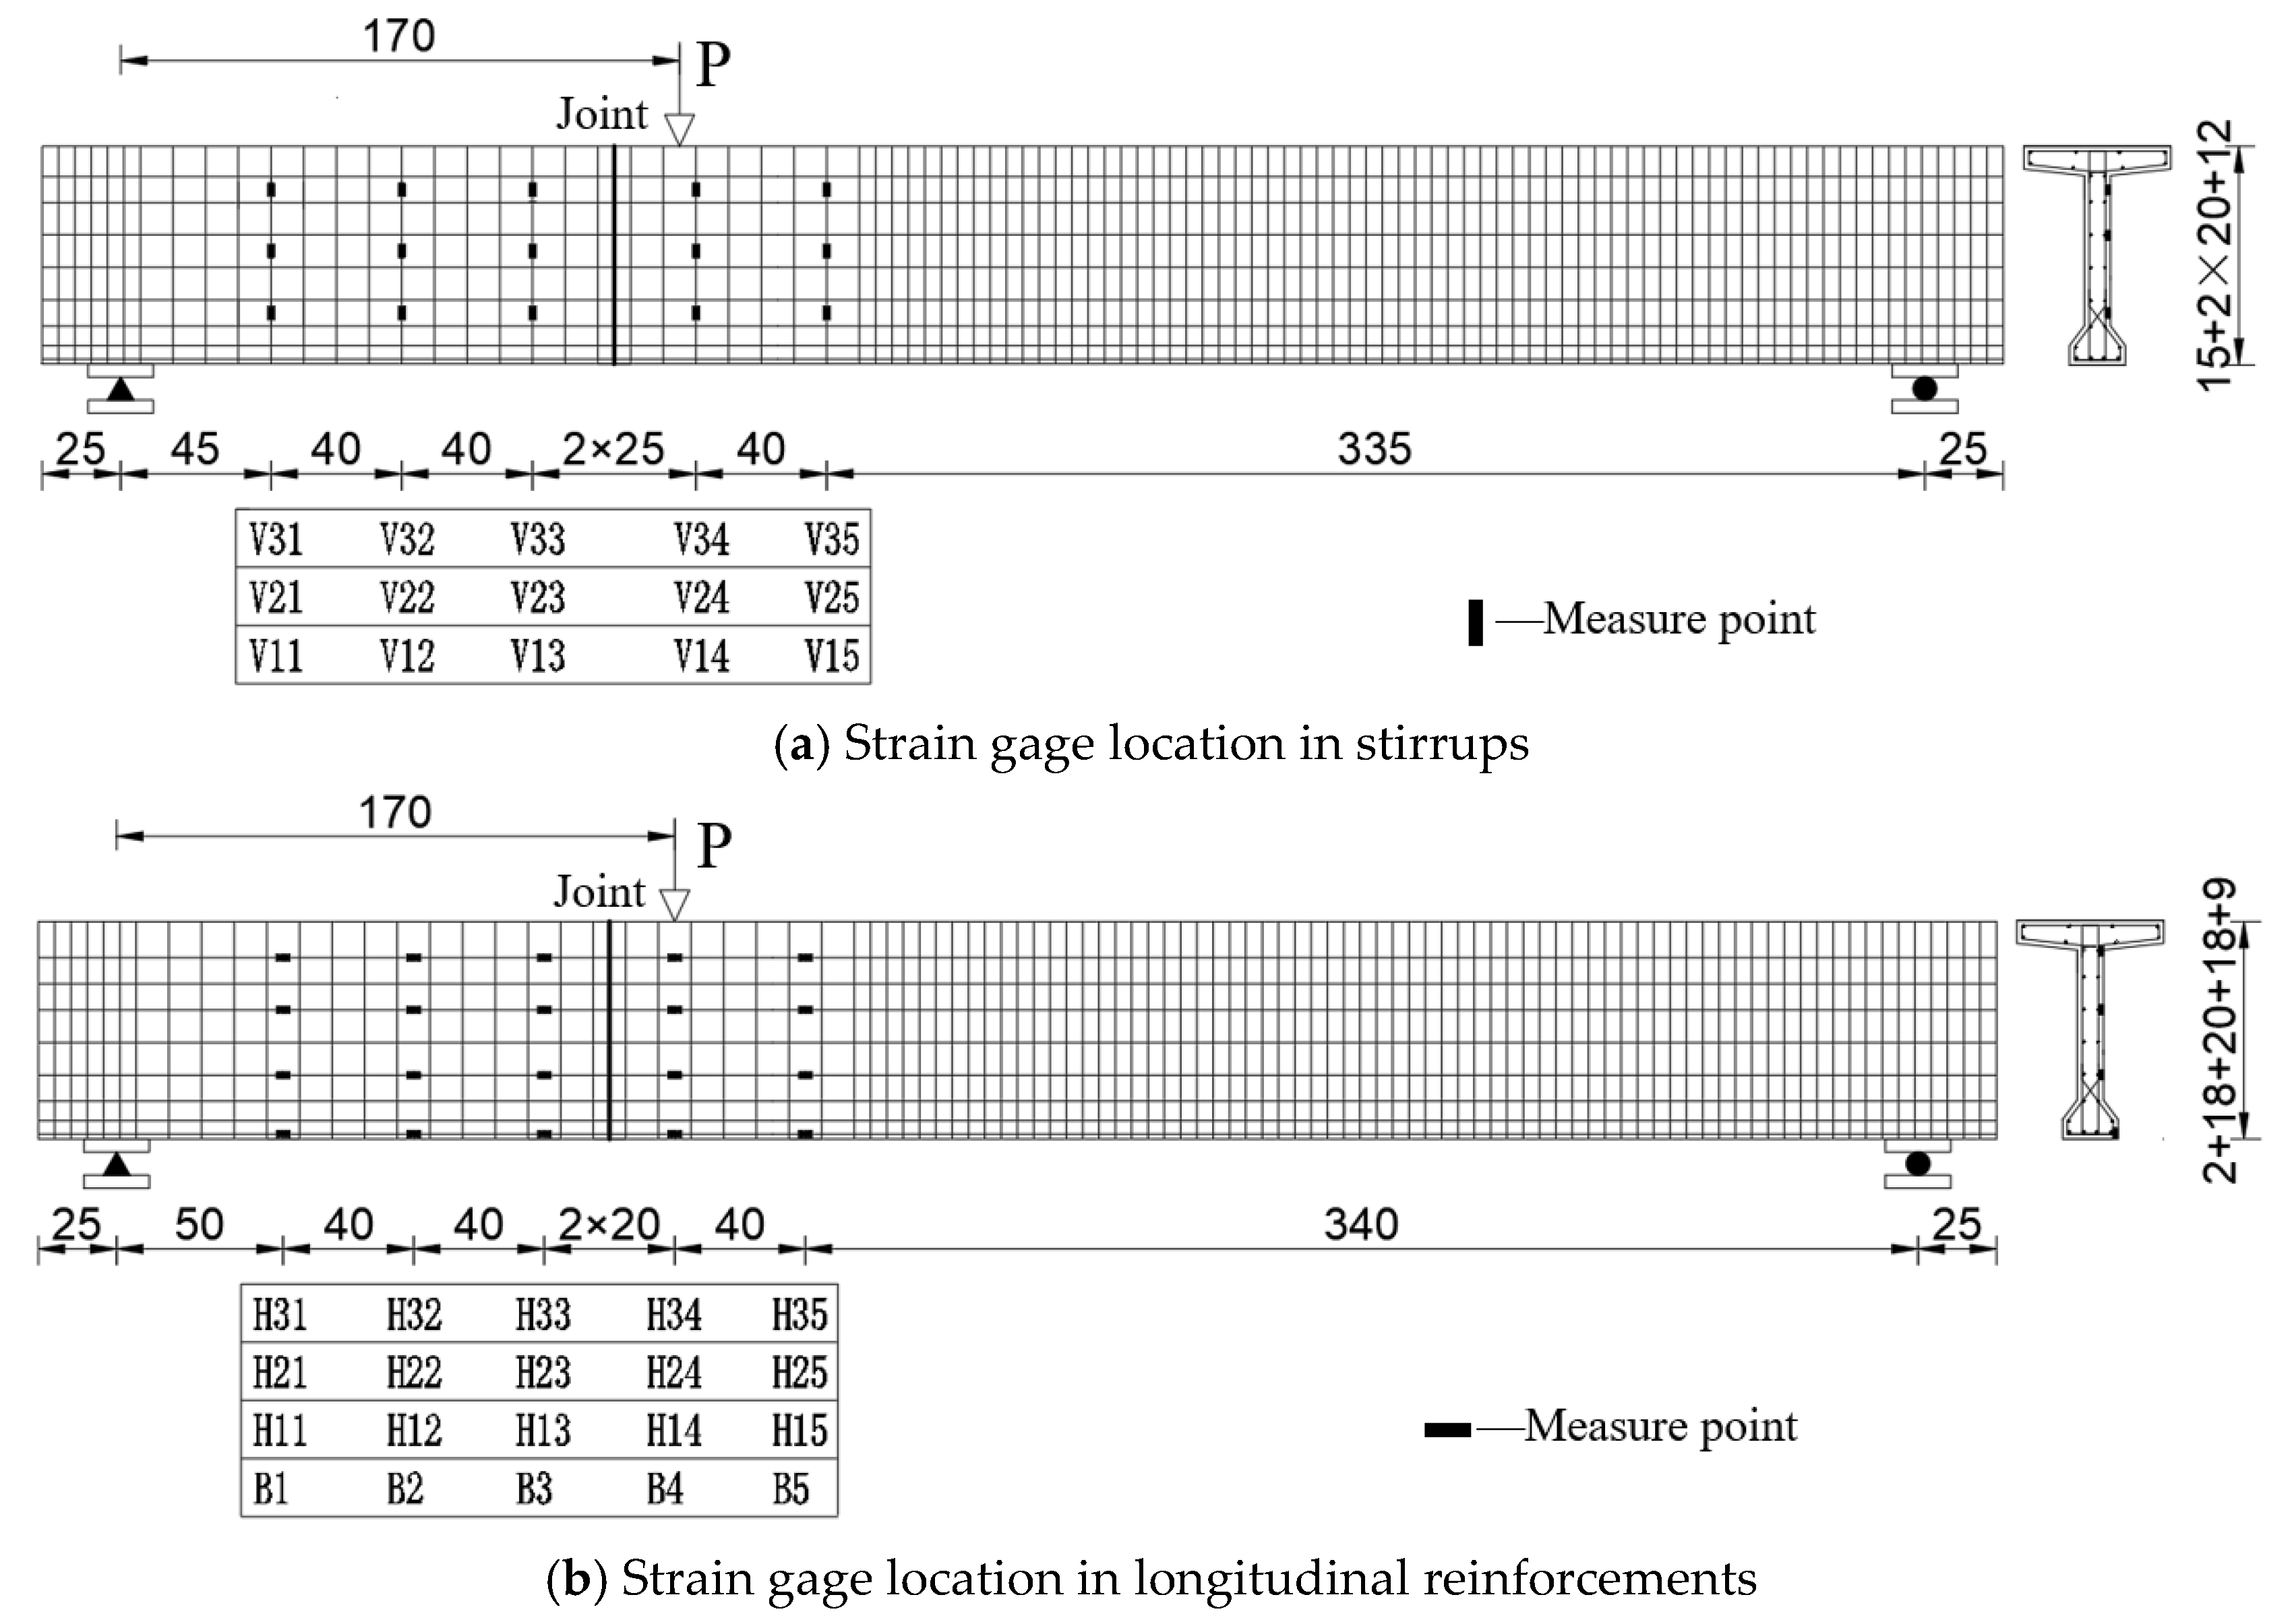
4.3.2. Measure Point Arrangement
4.3.3. Loading Scheme
5. Structural Response and Comparison
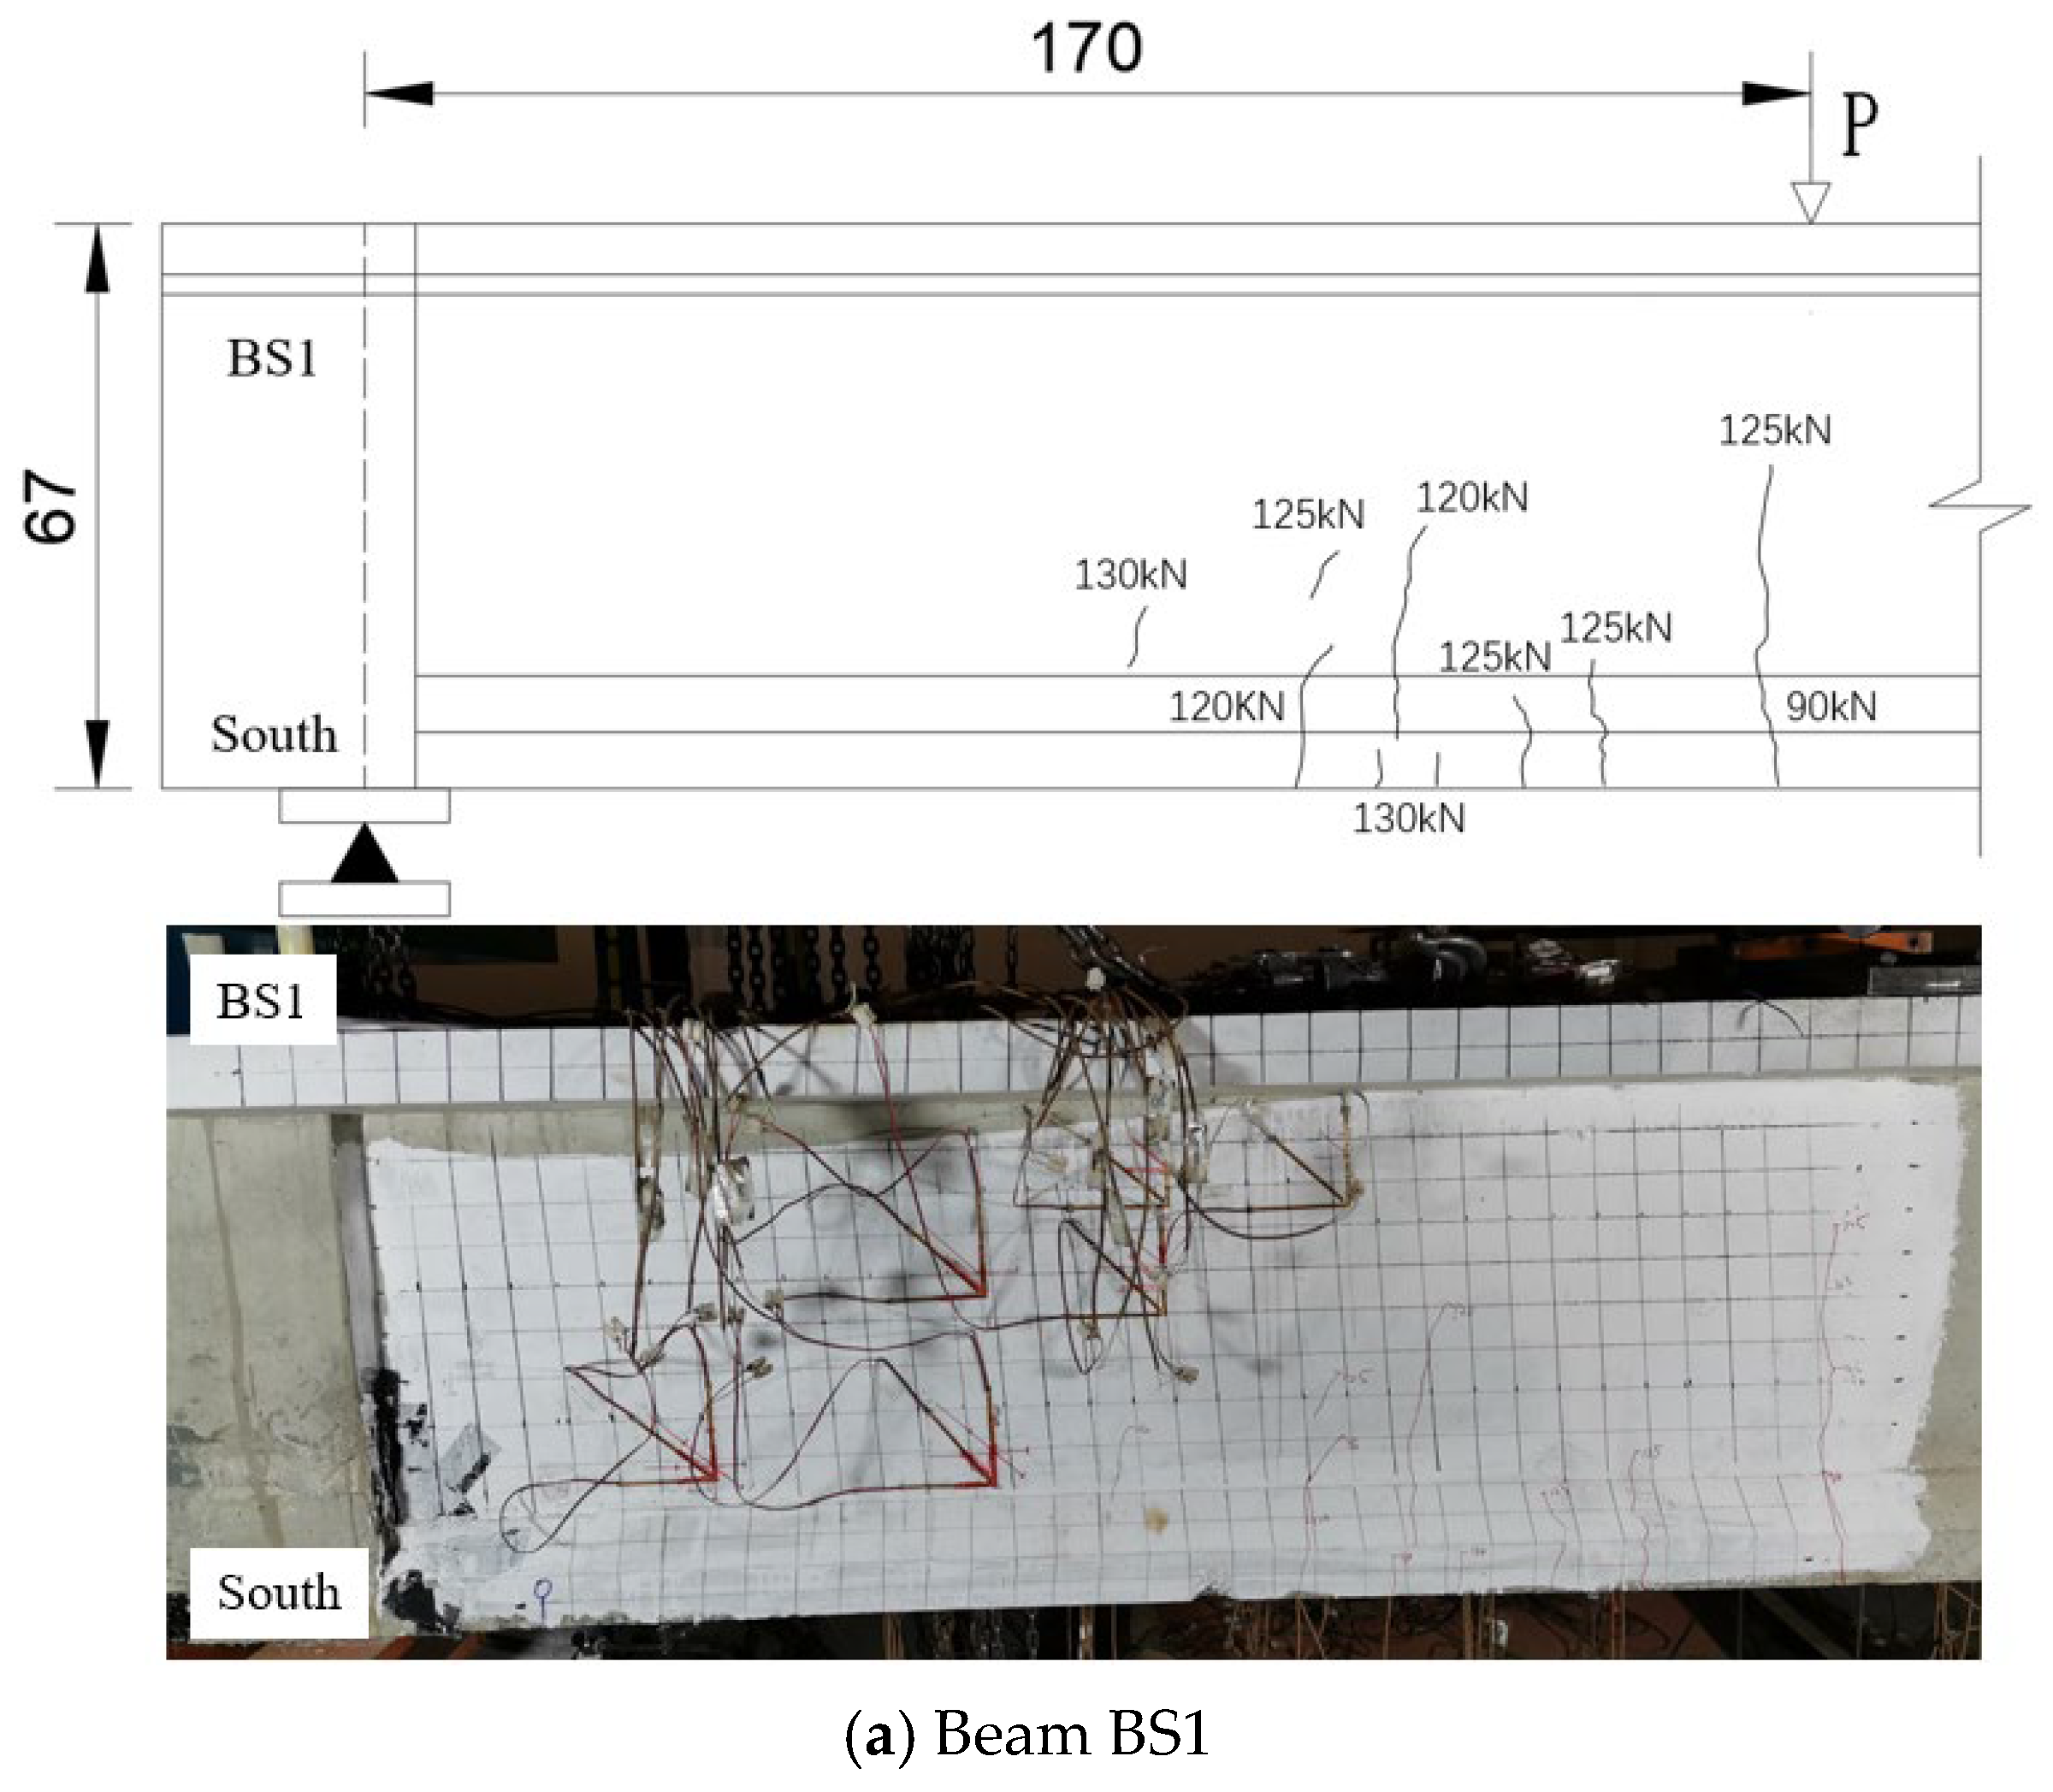
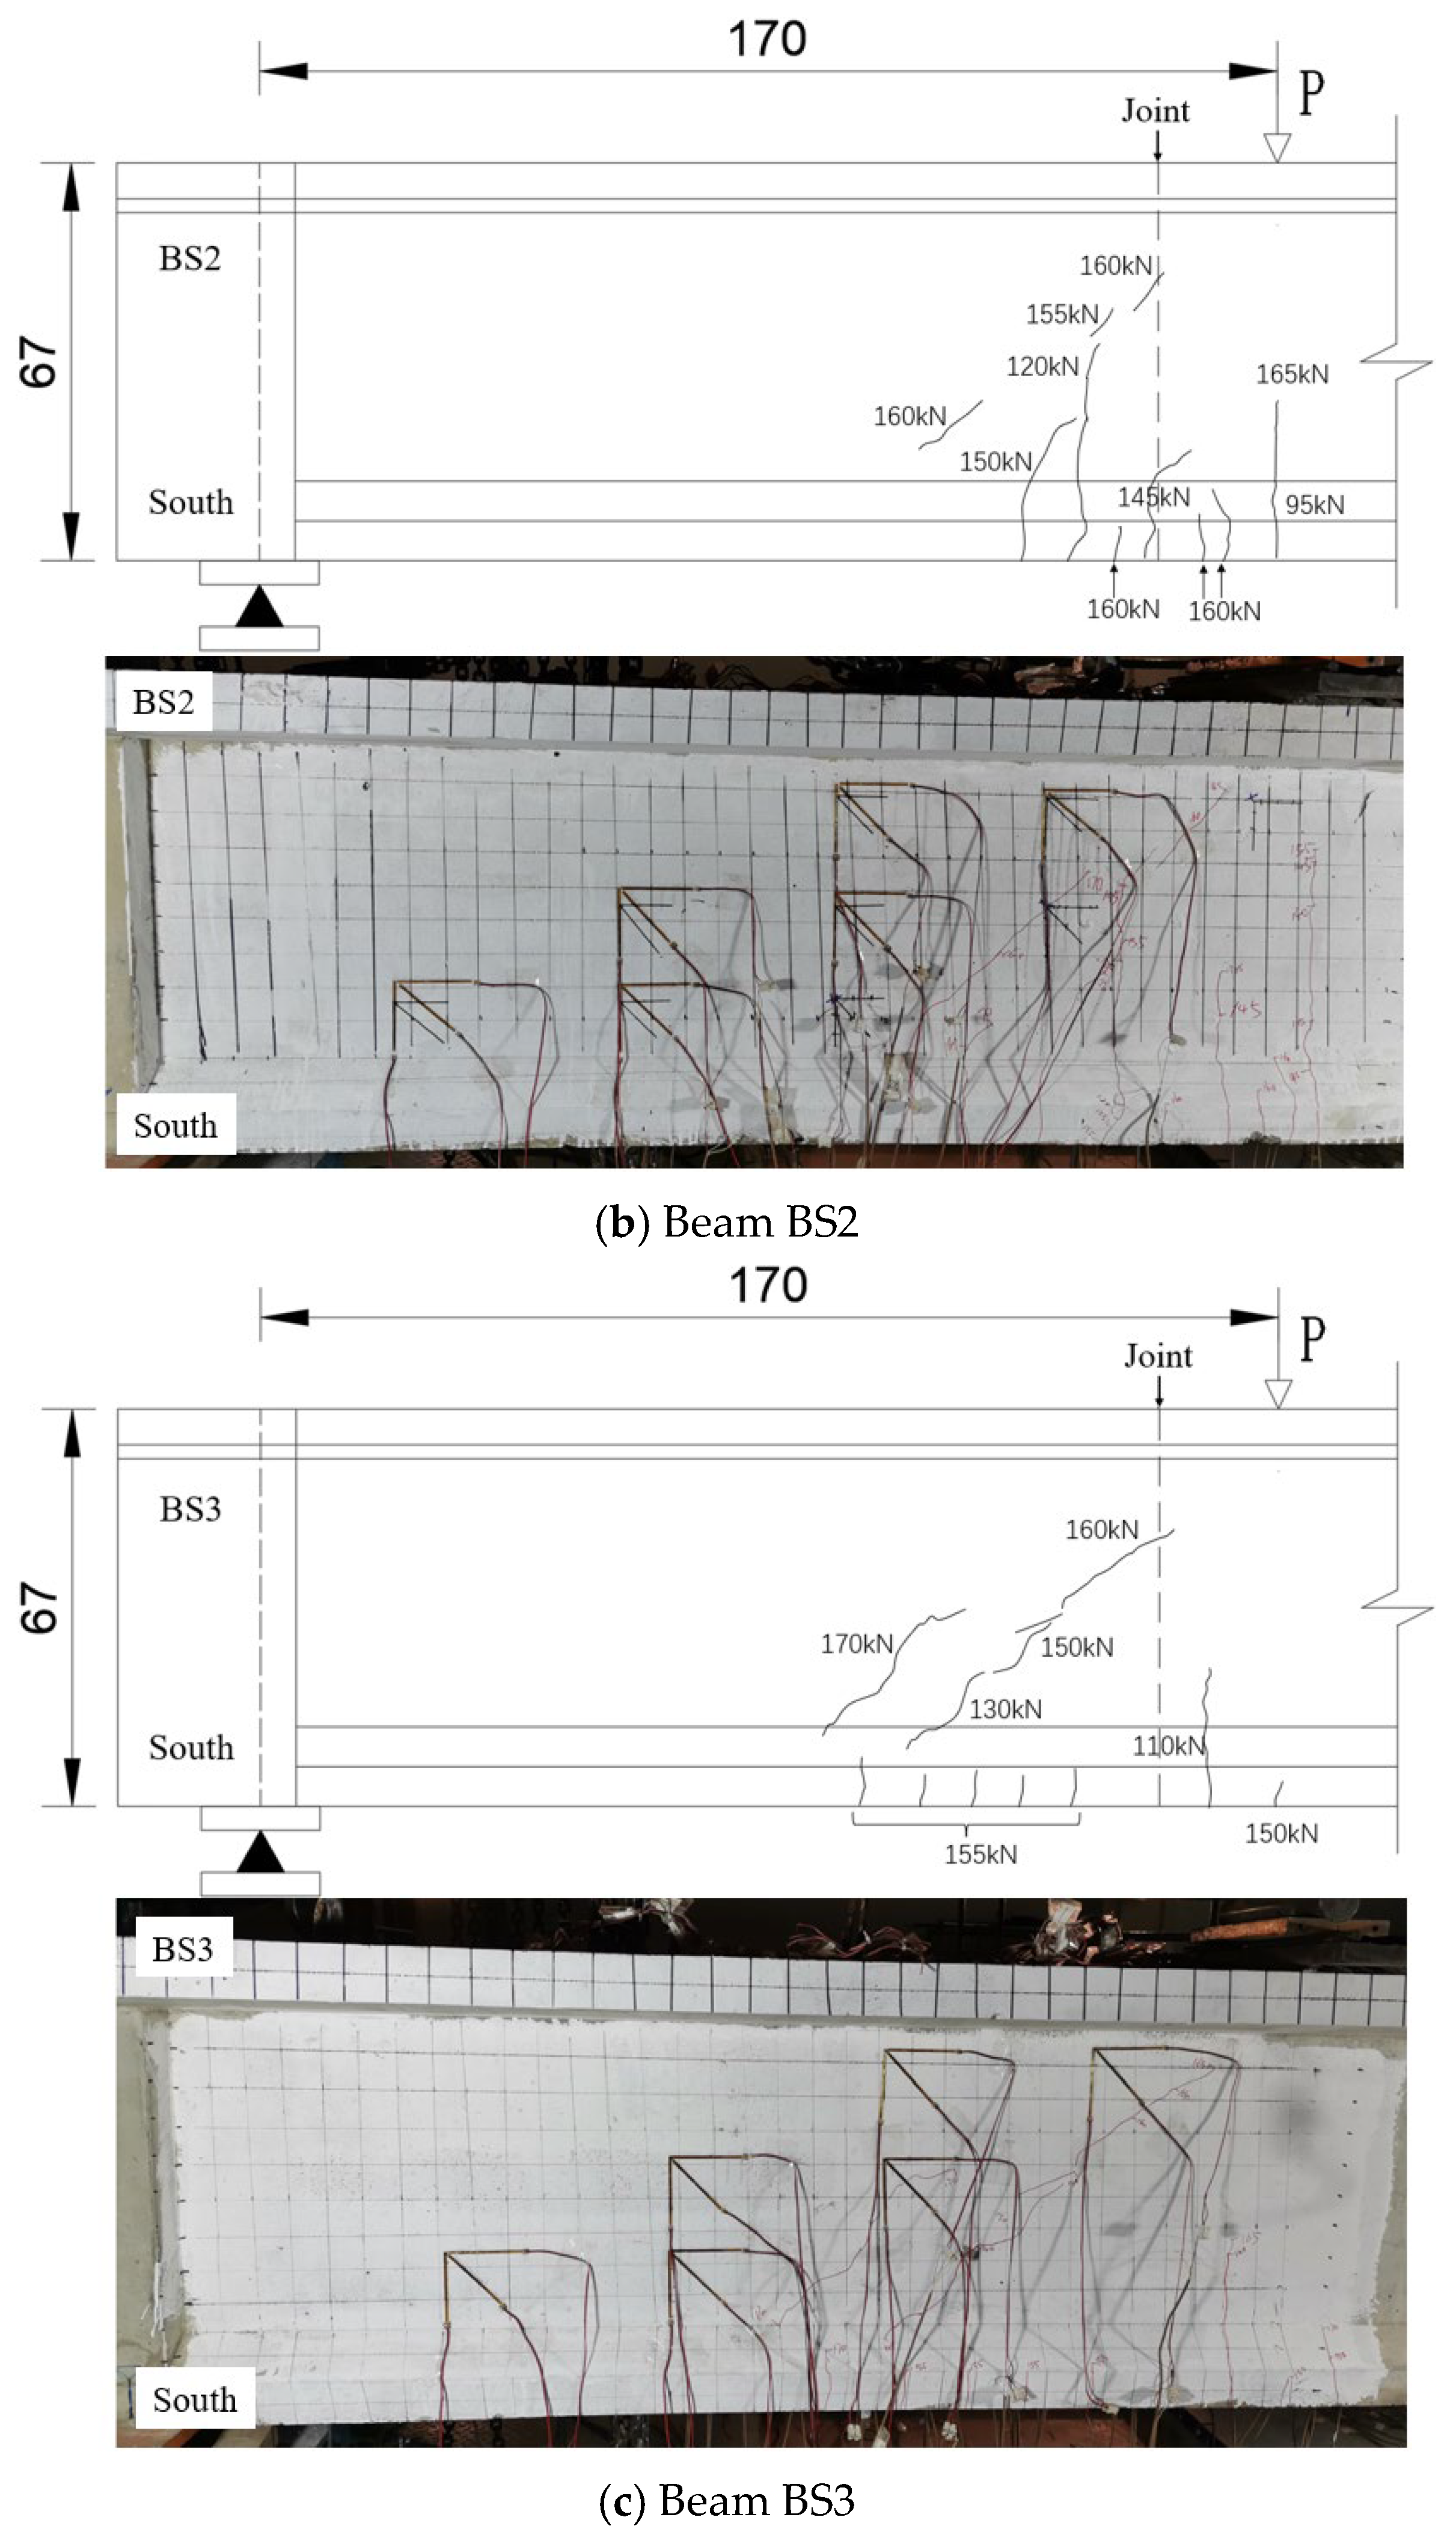
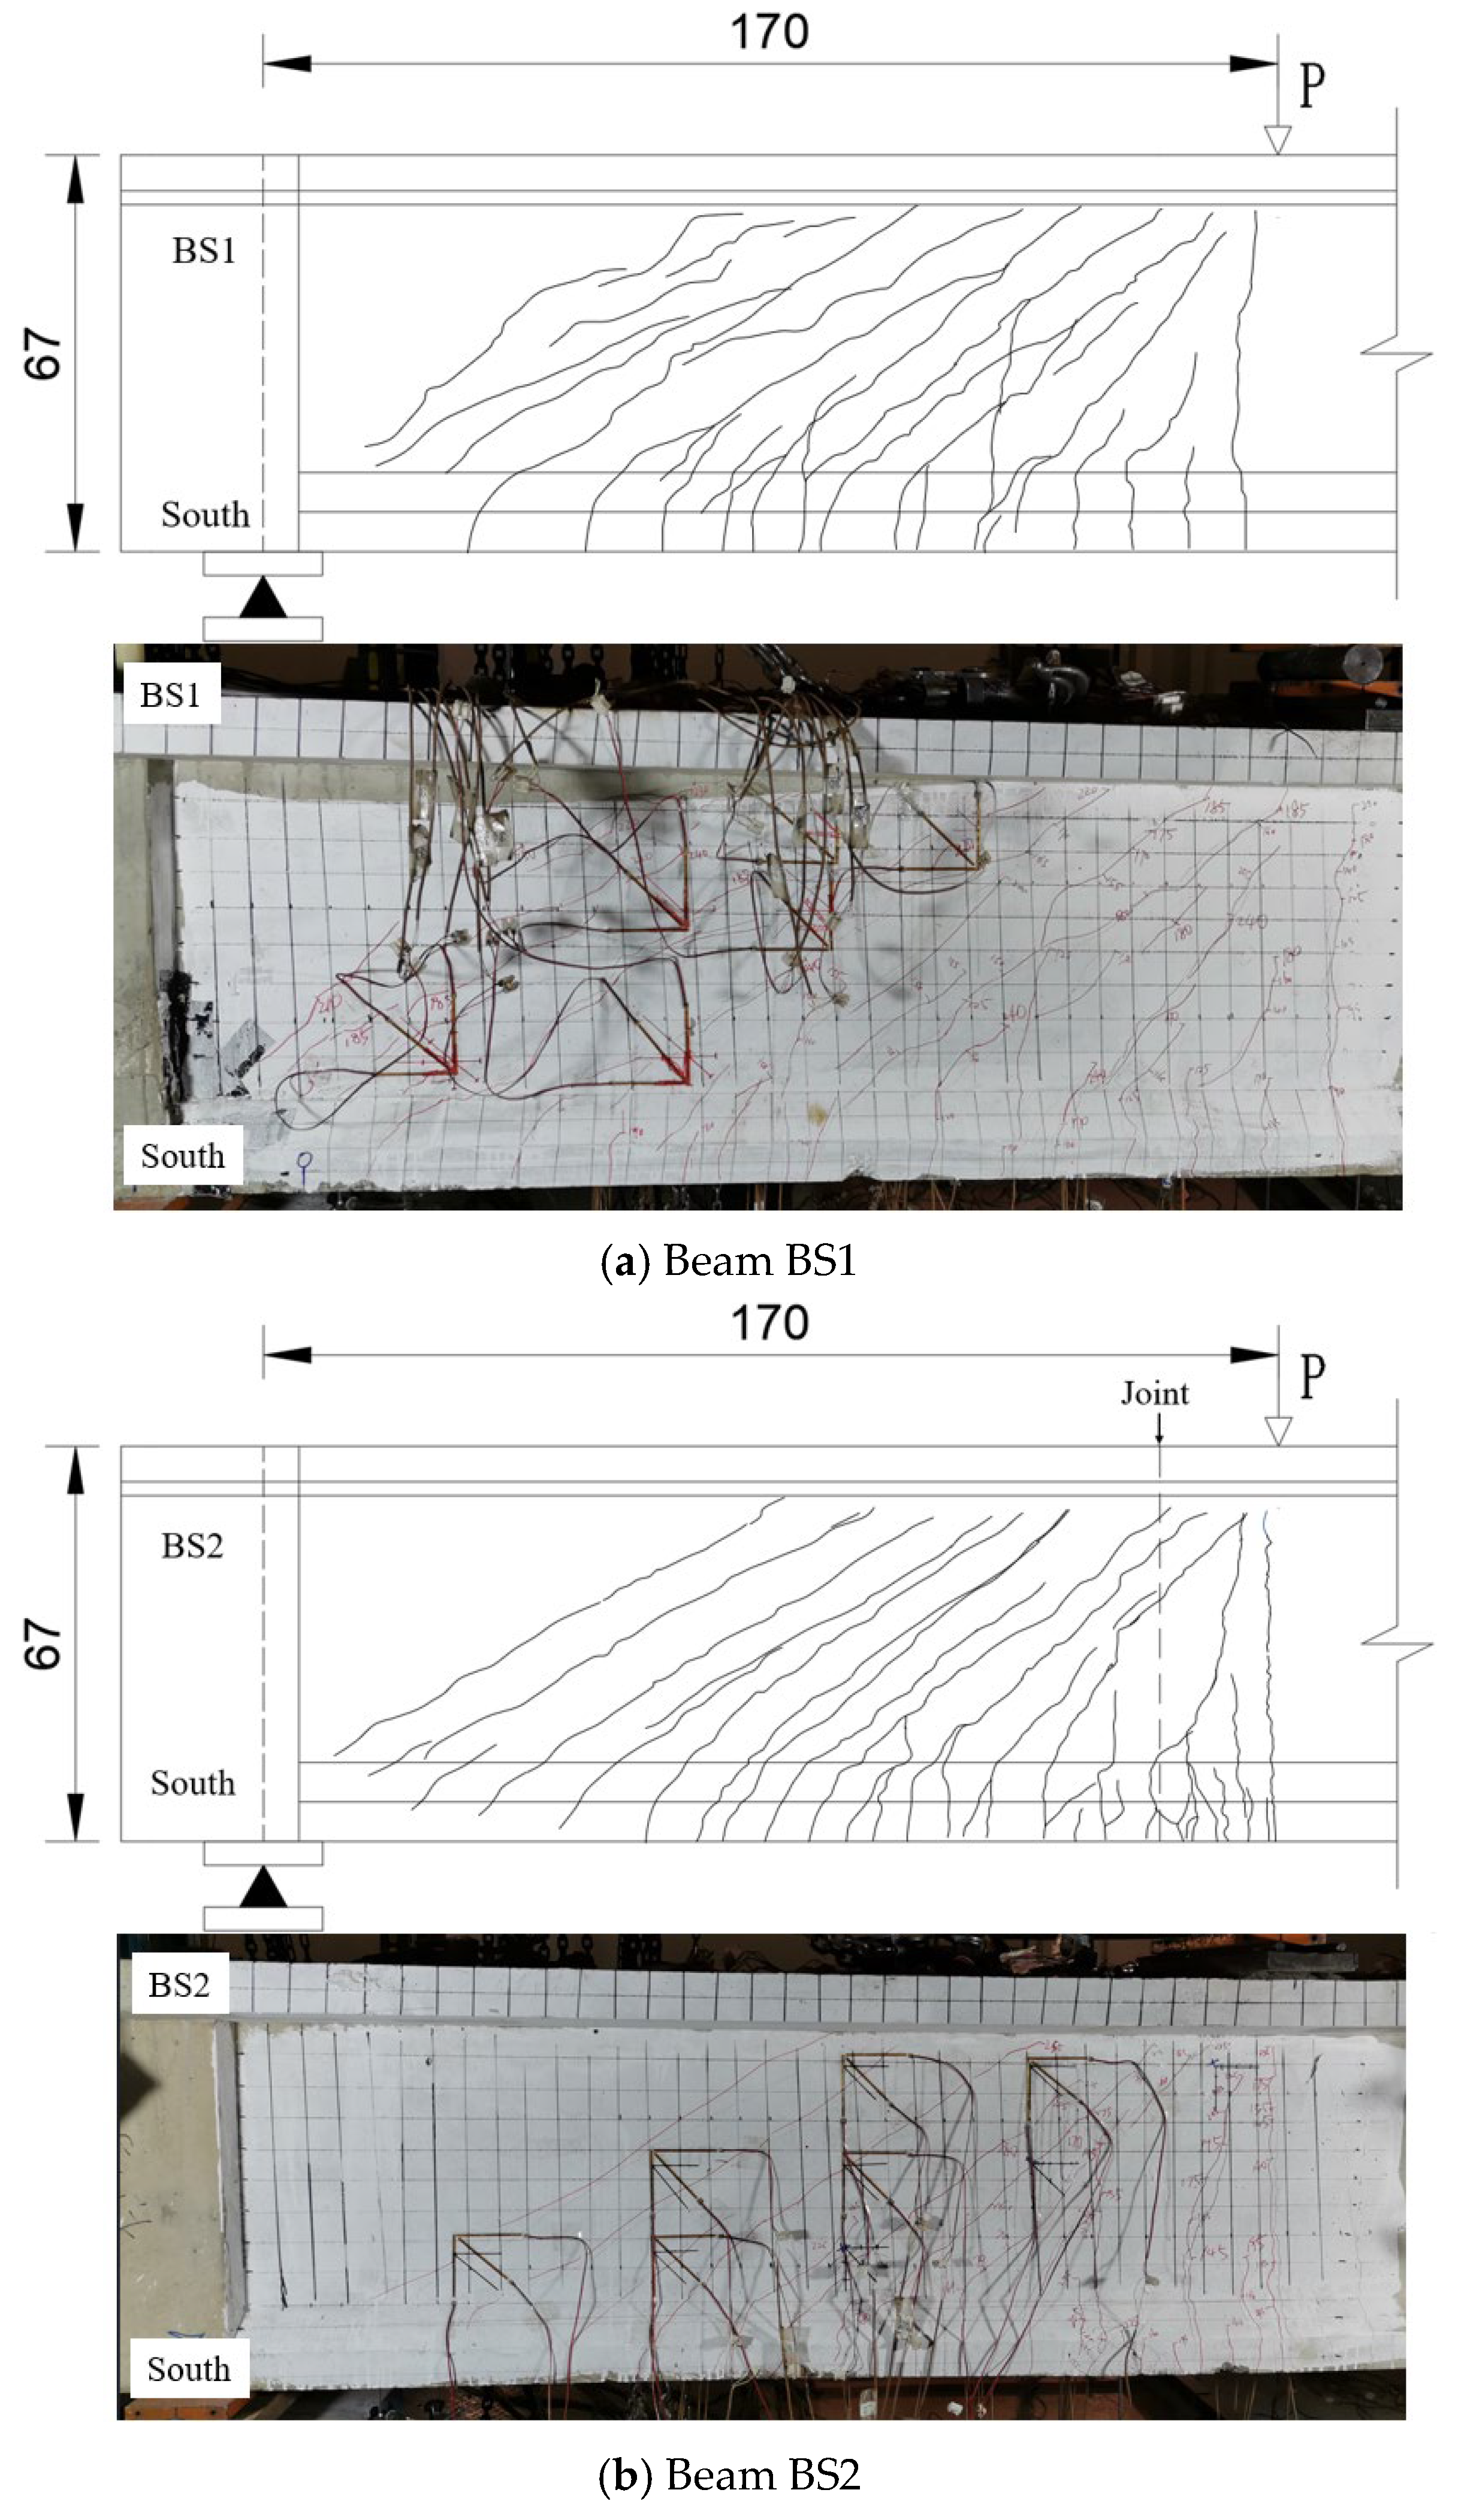
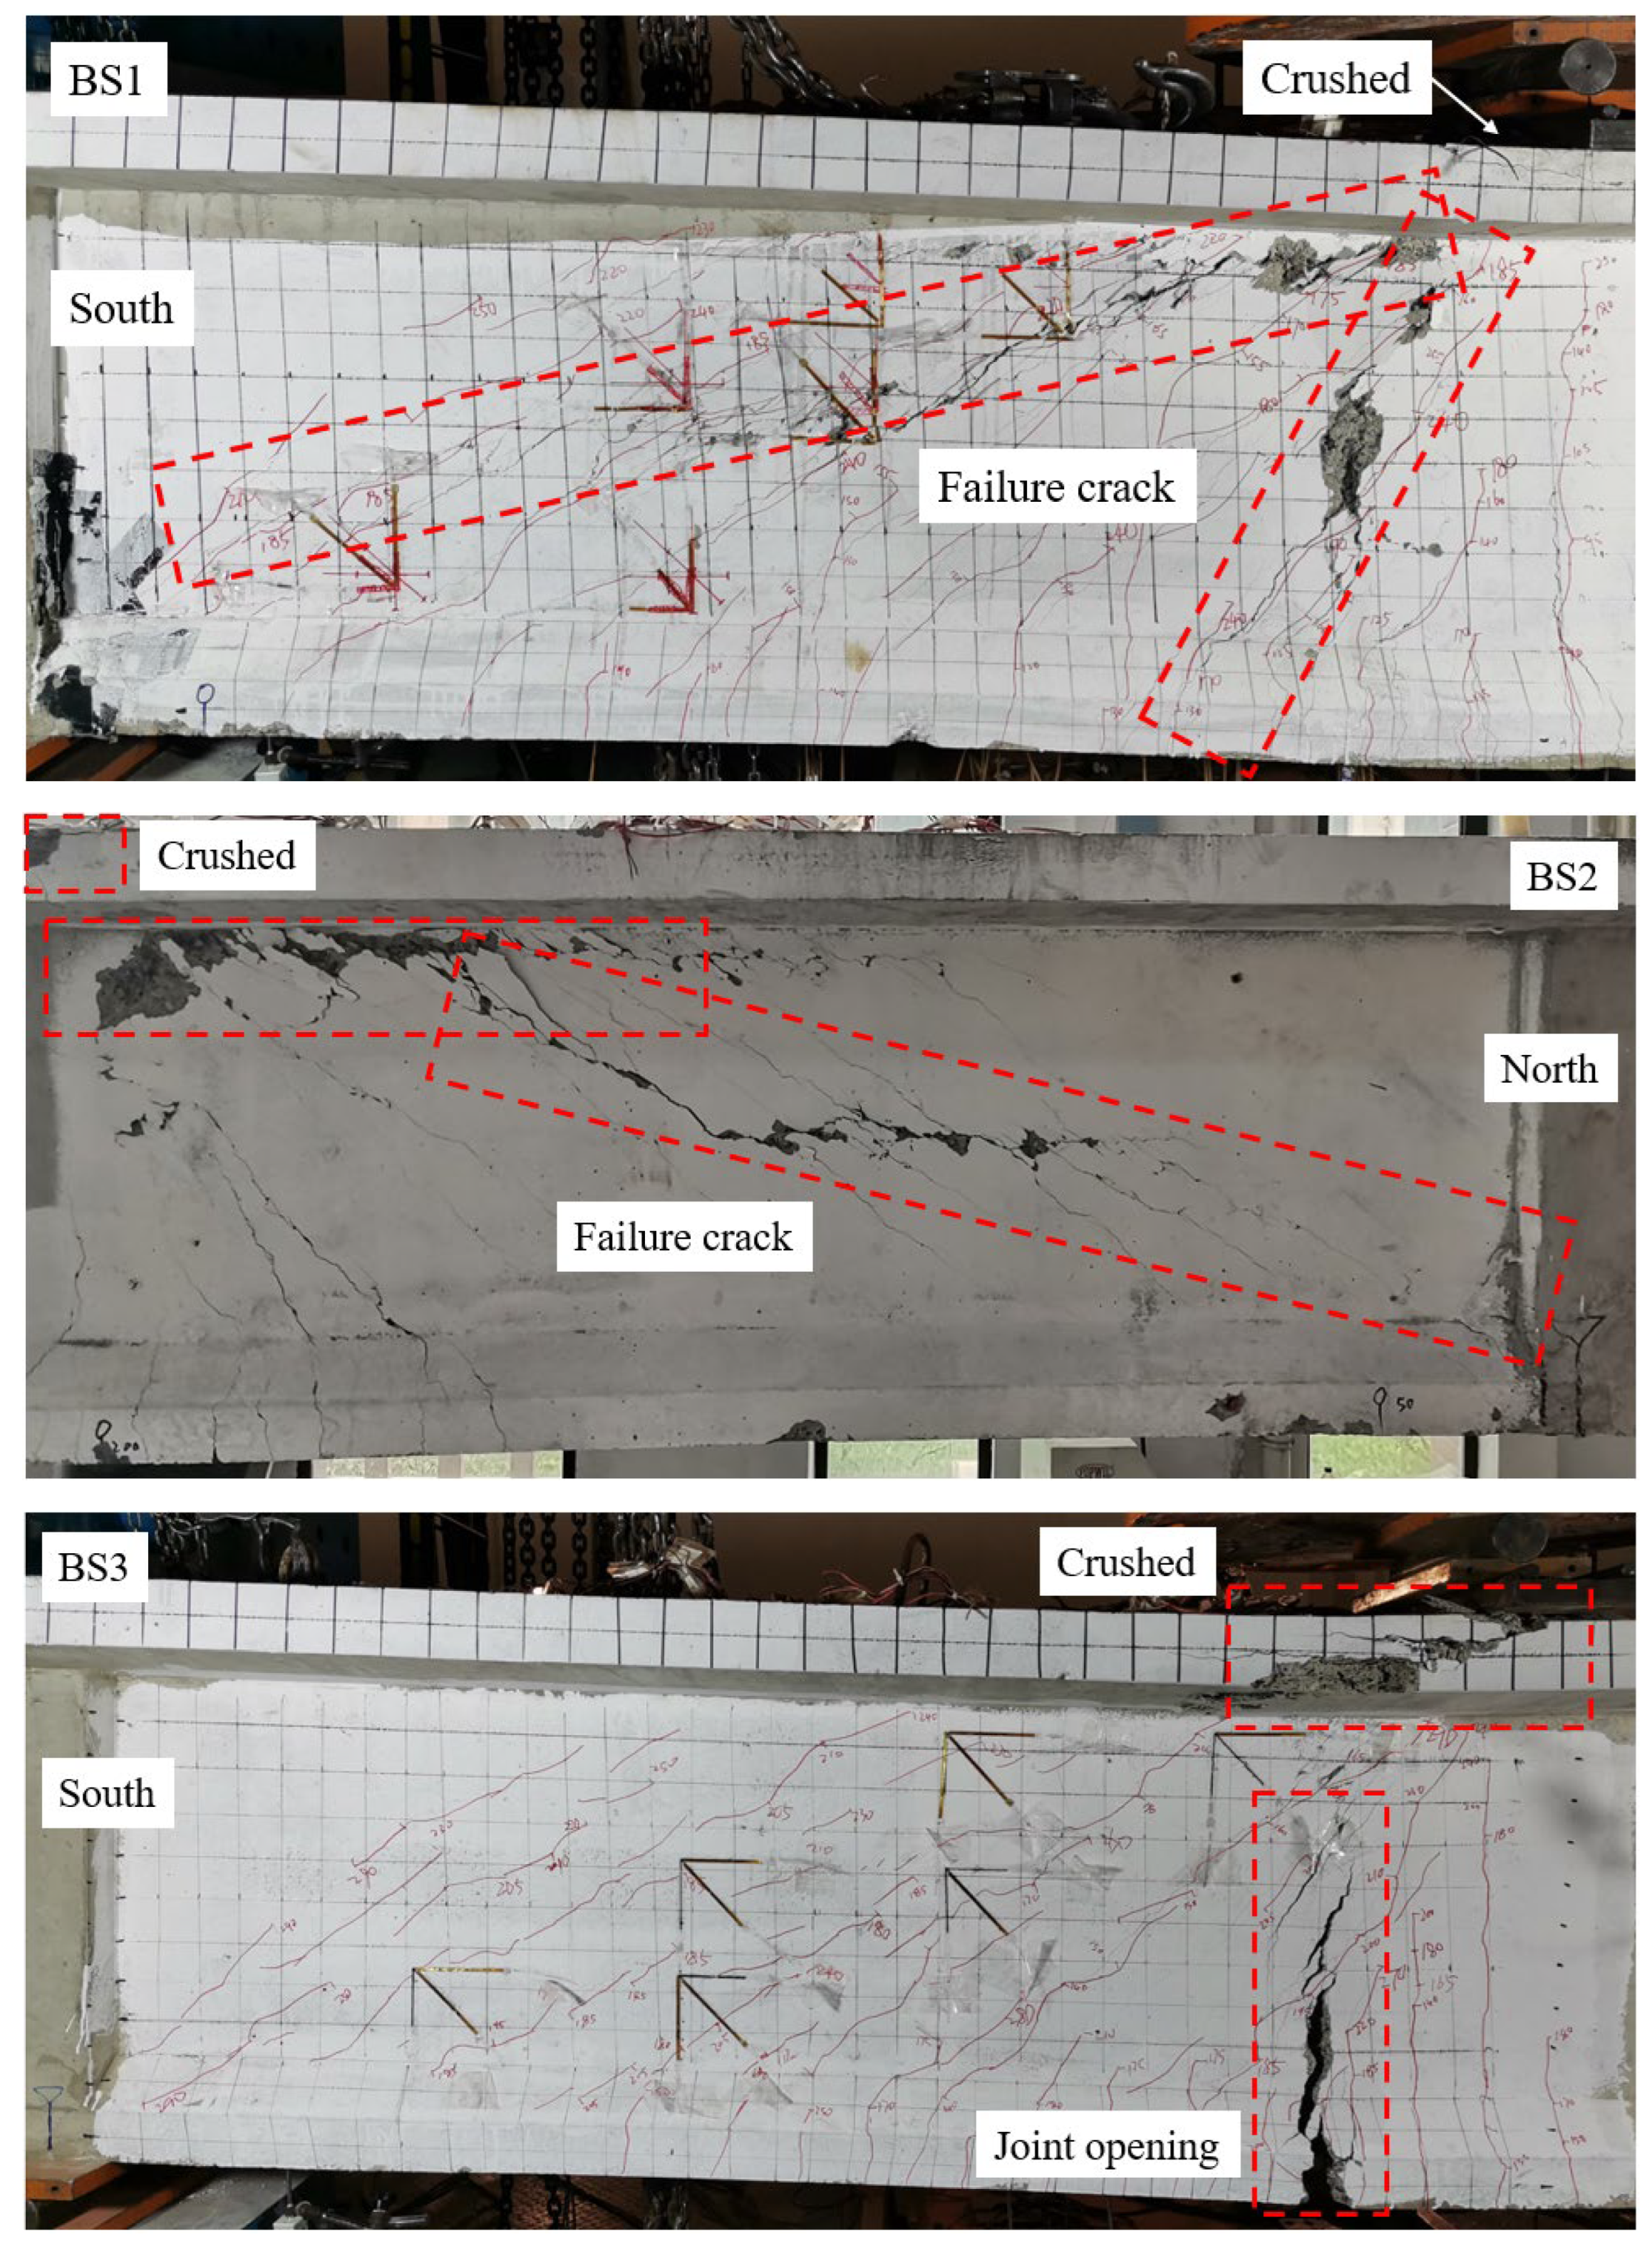
5.1. Crack Propagation
5.2. Reinforcement Strain Variation
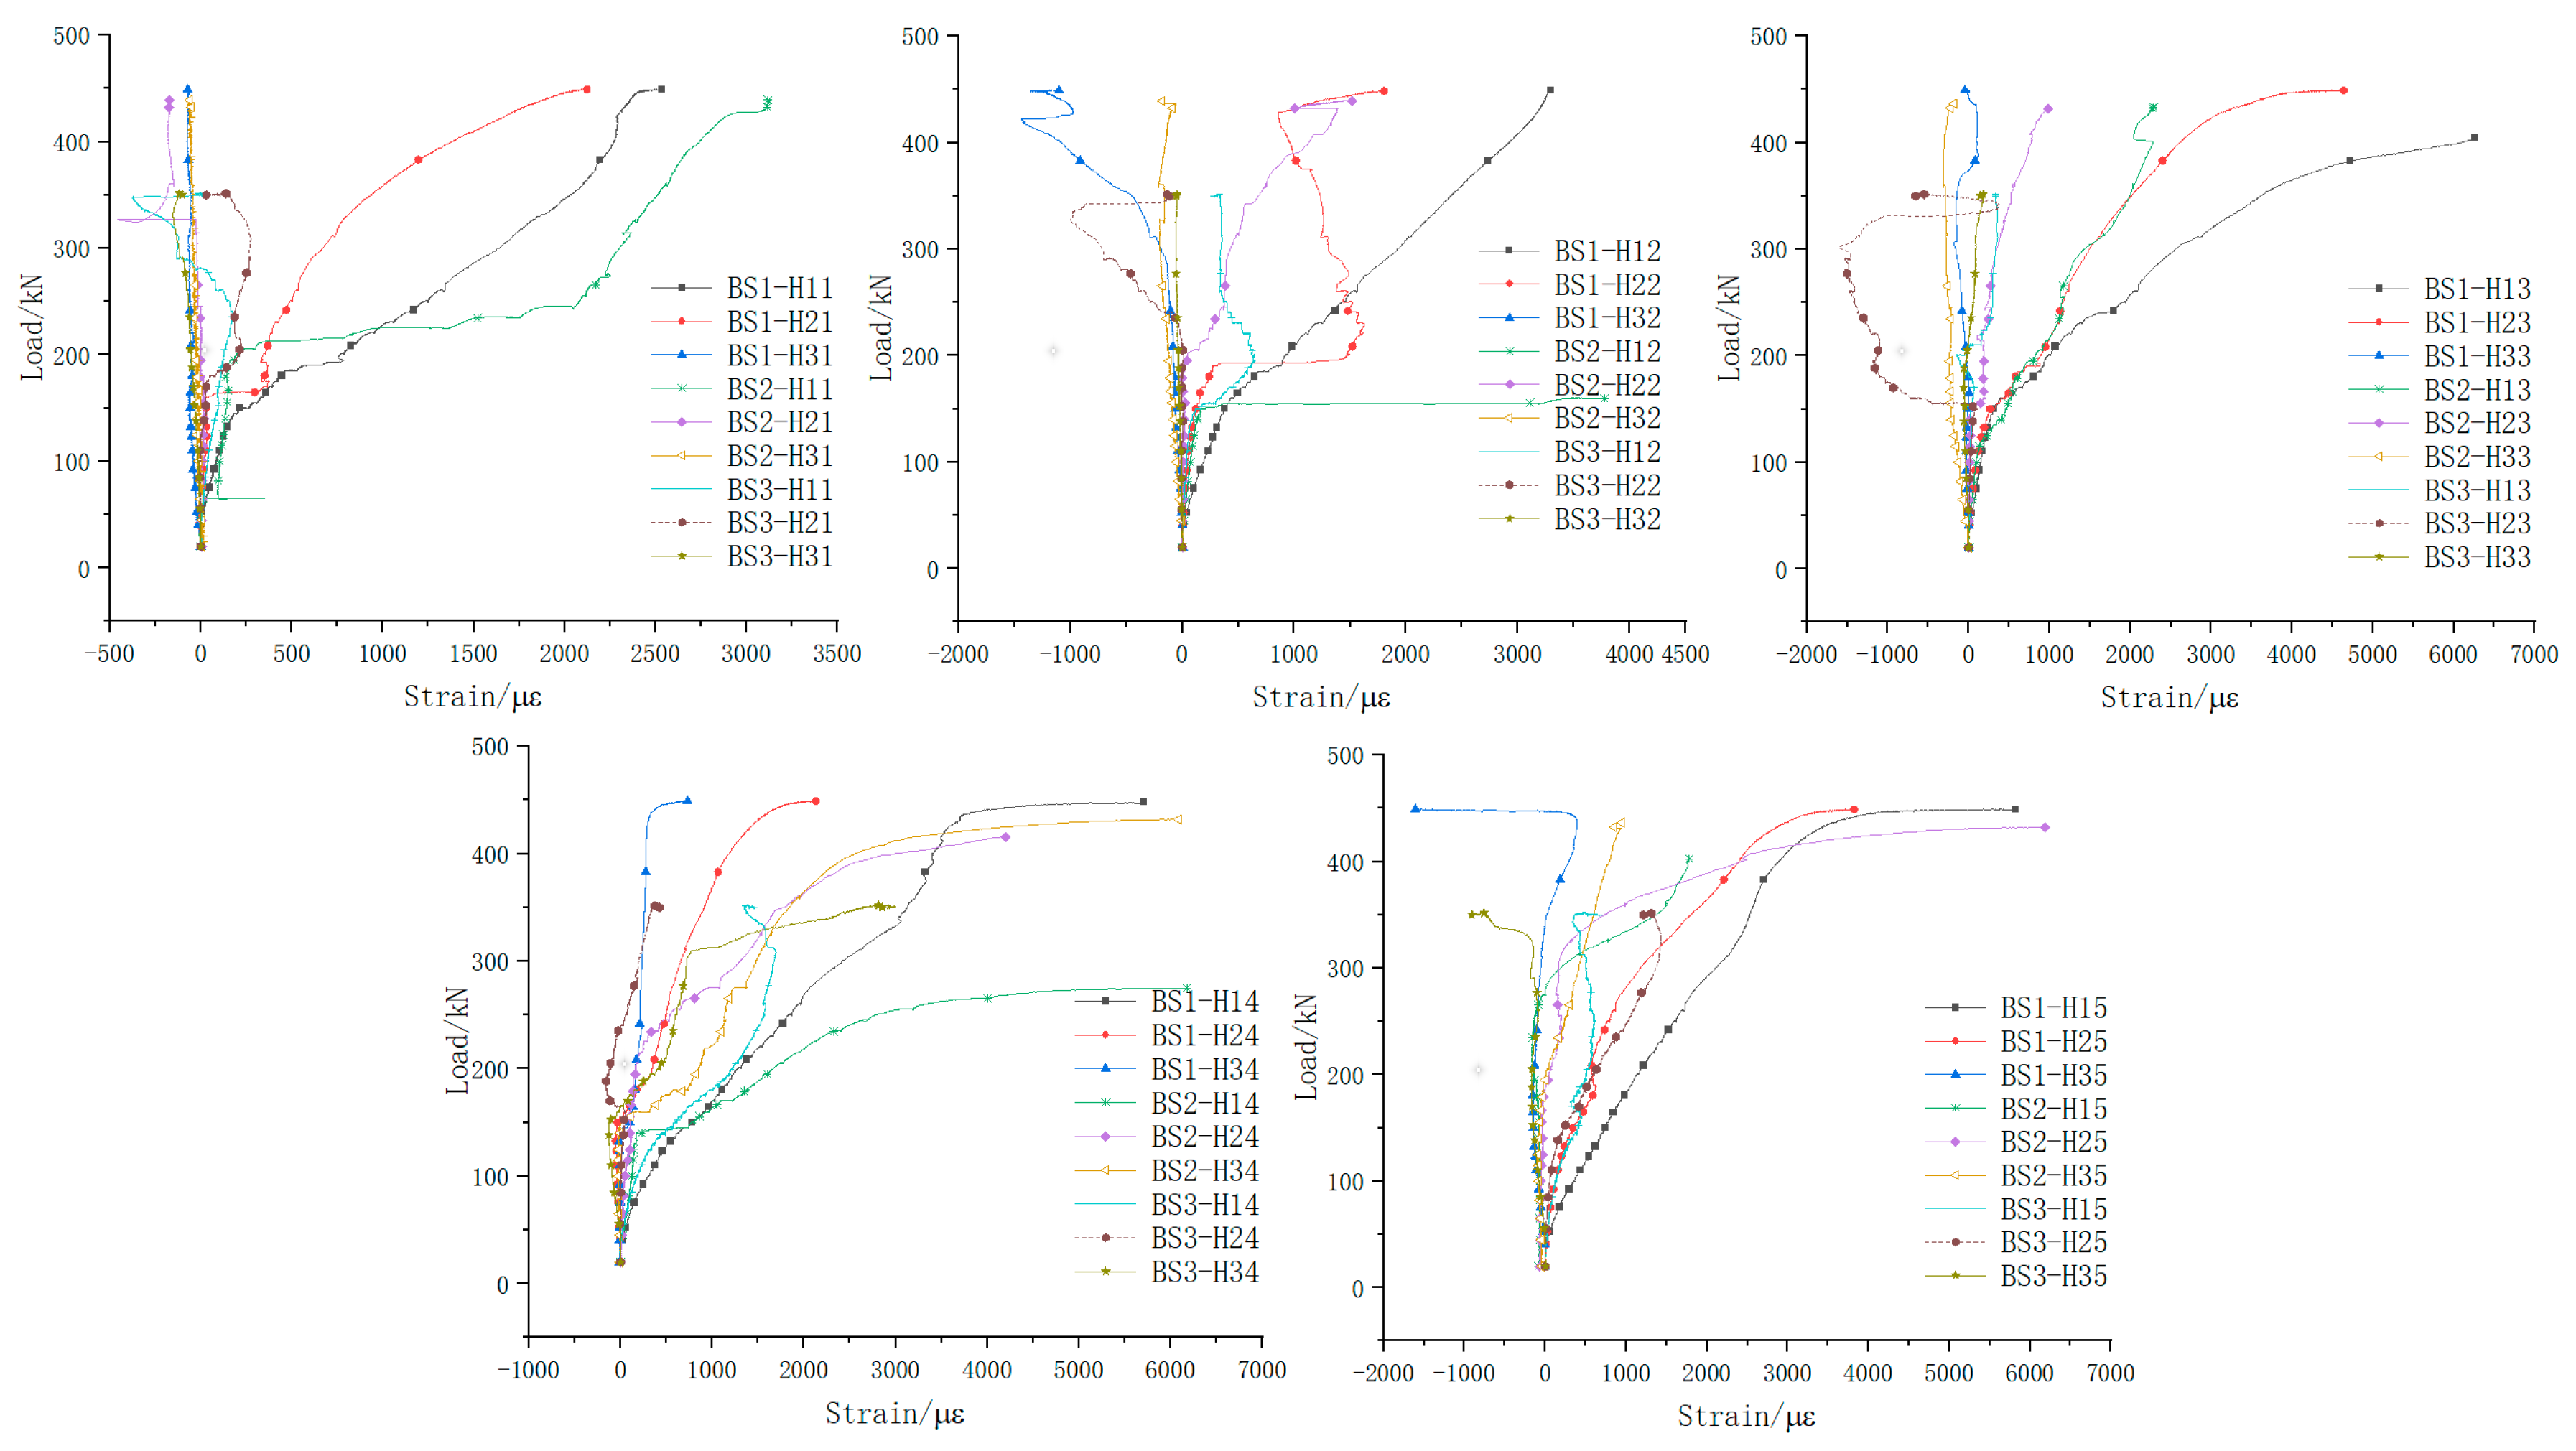
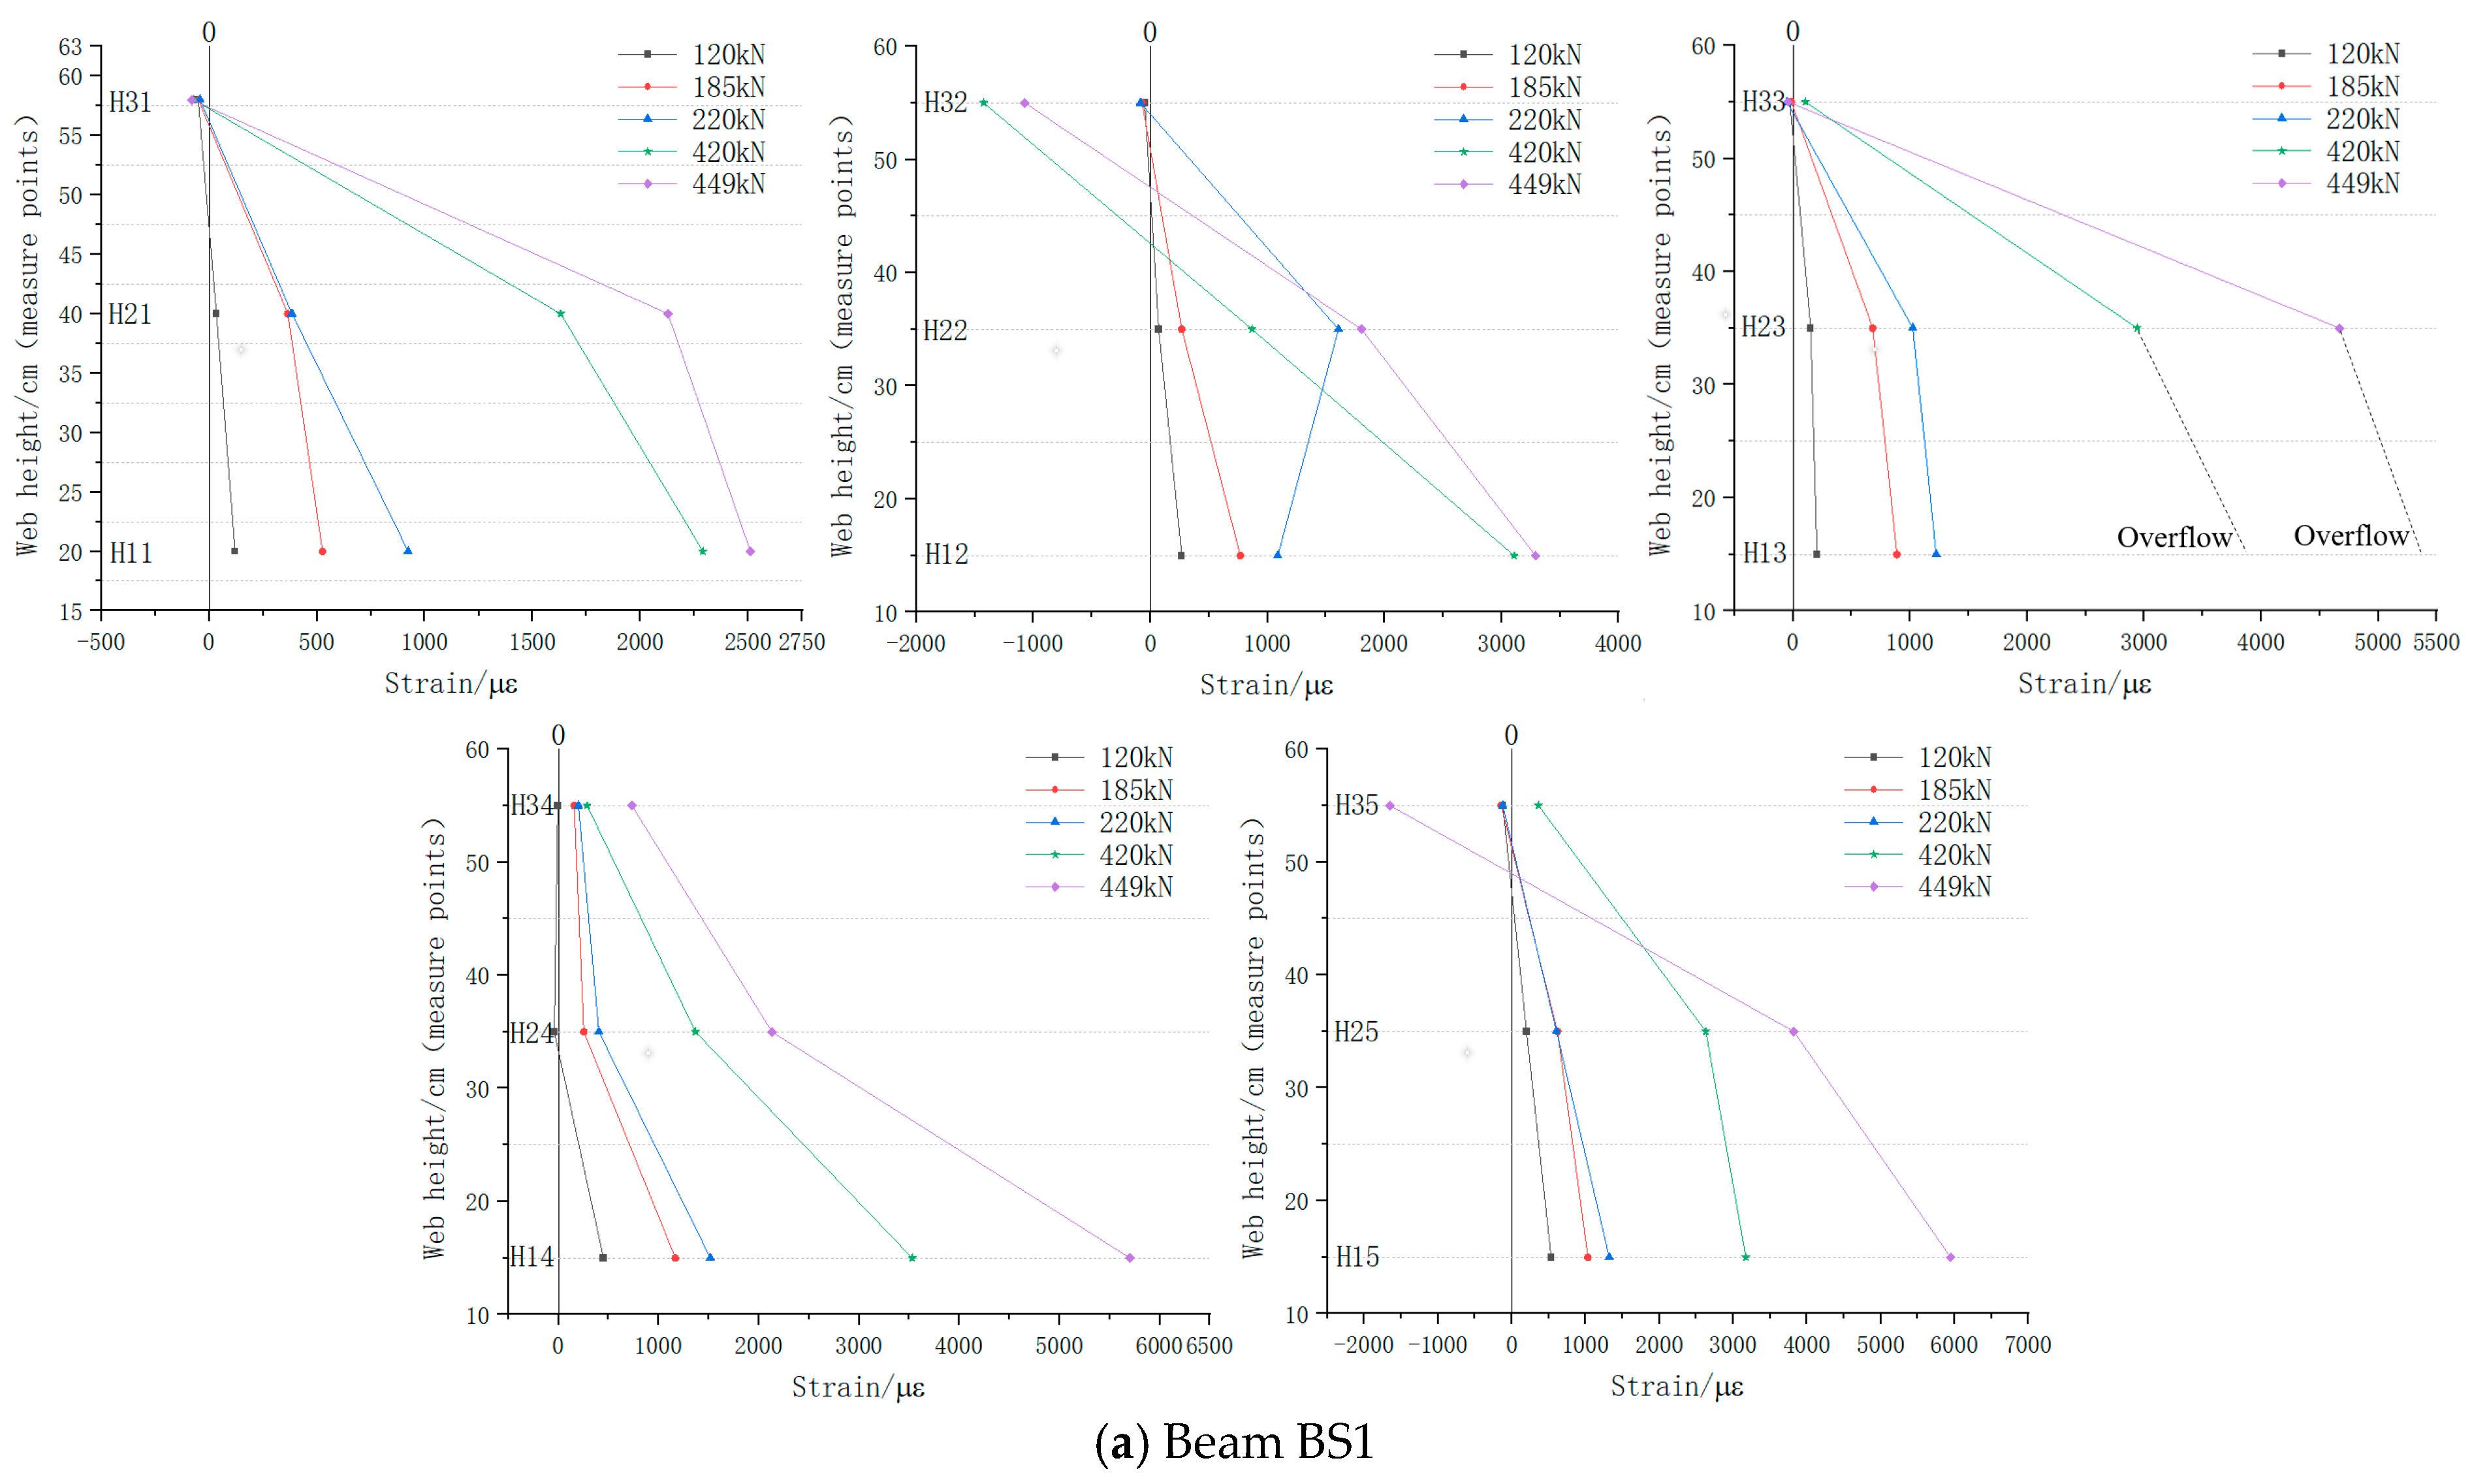
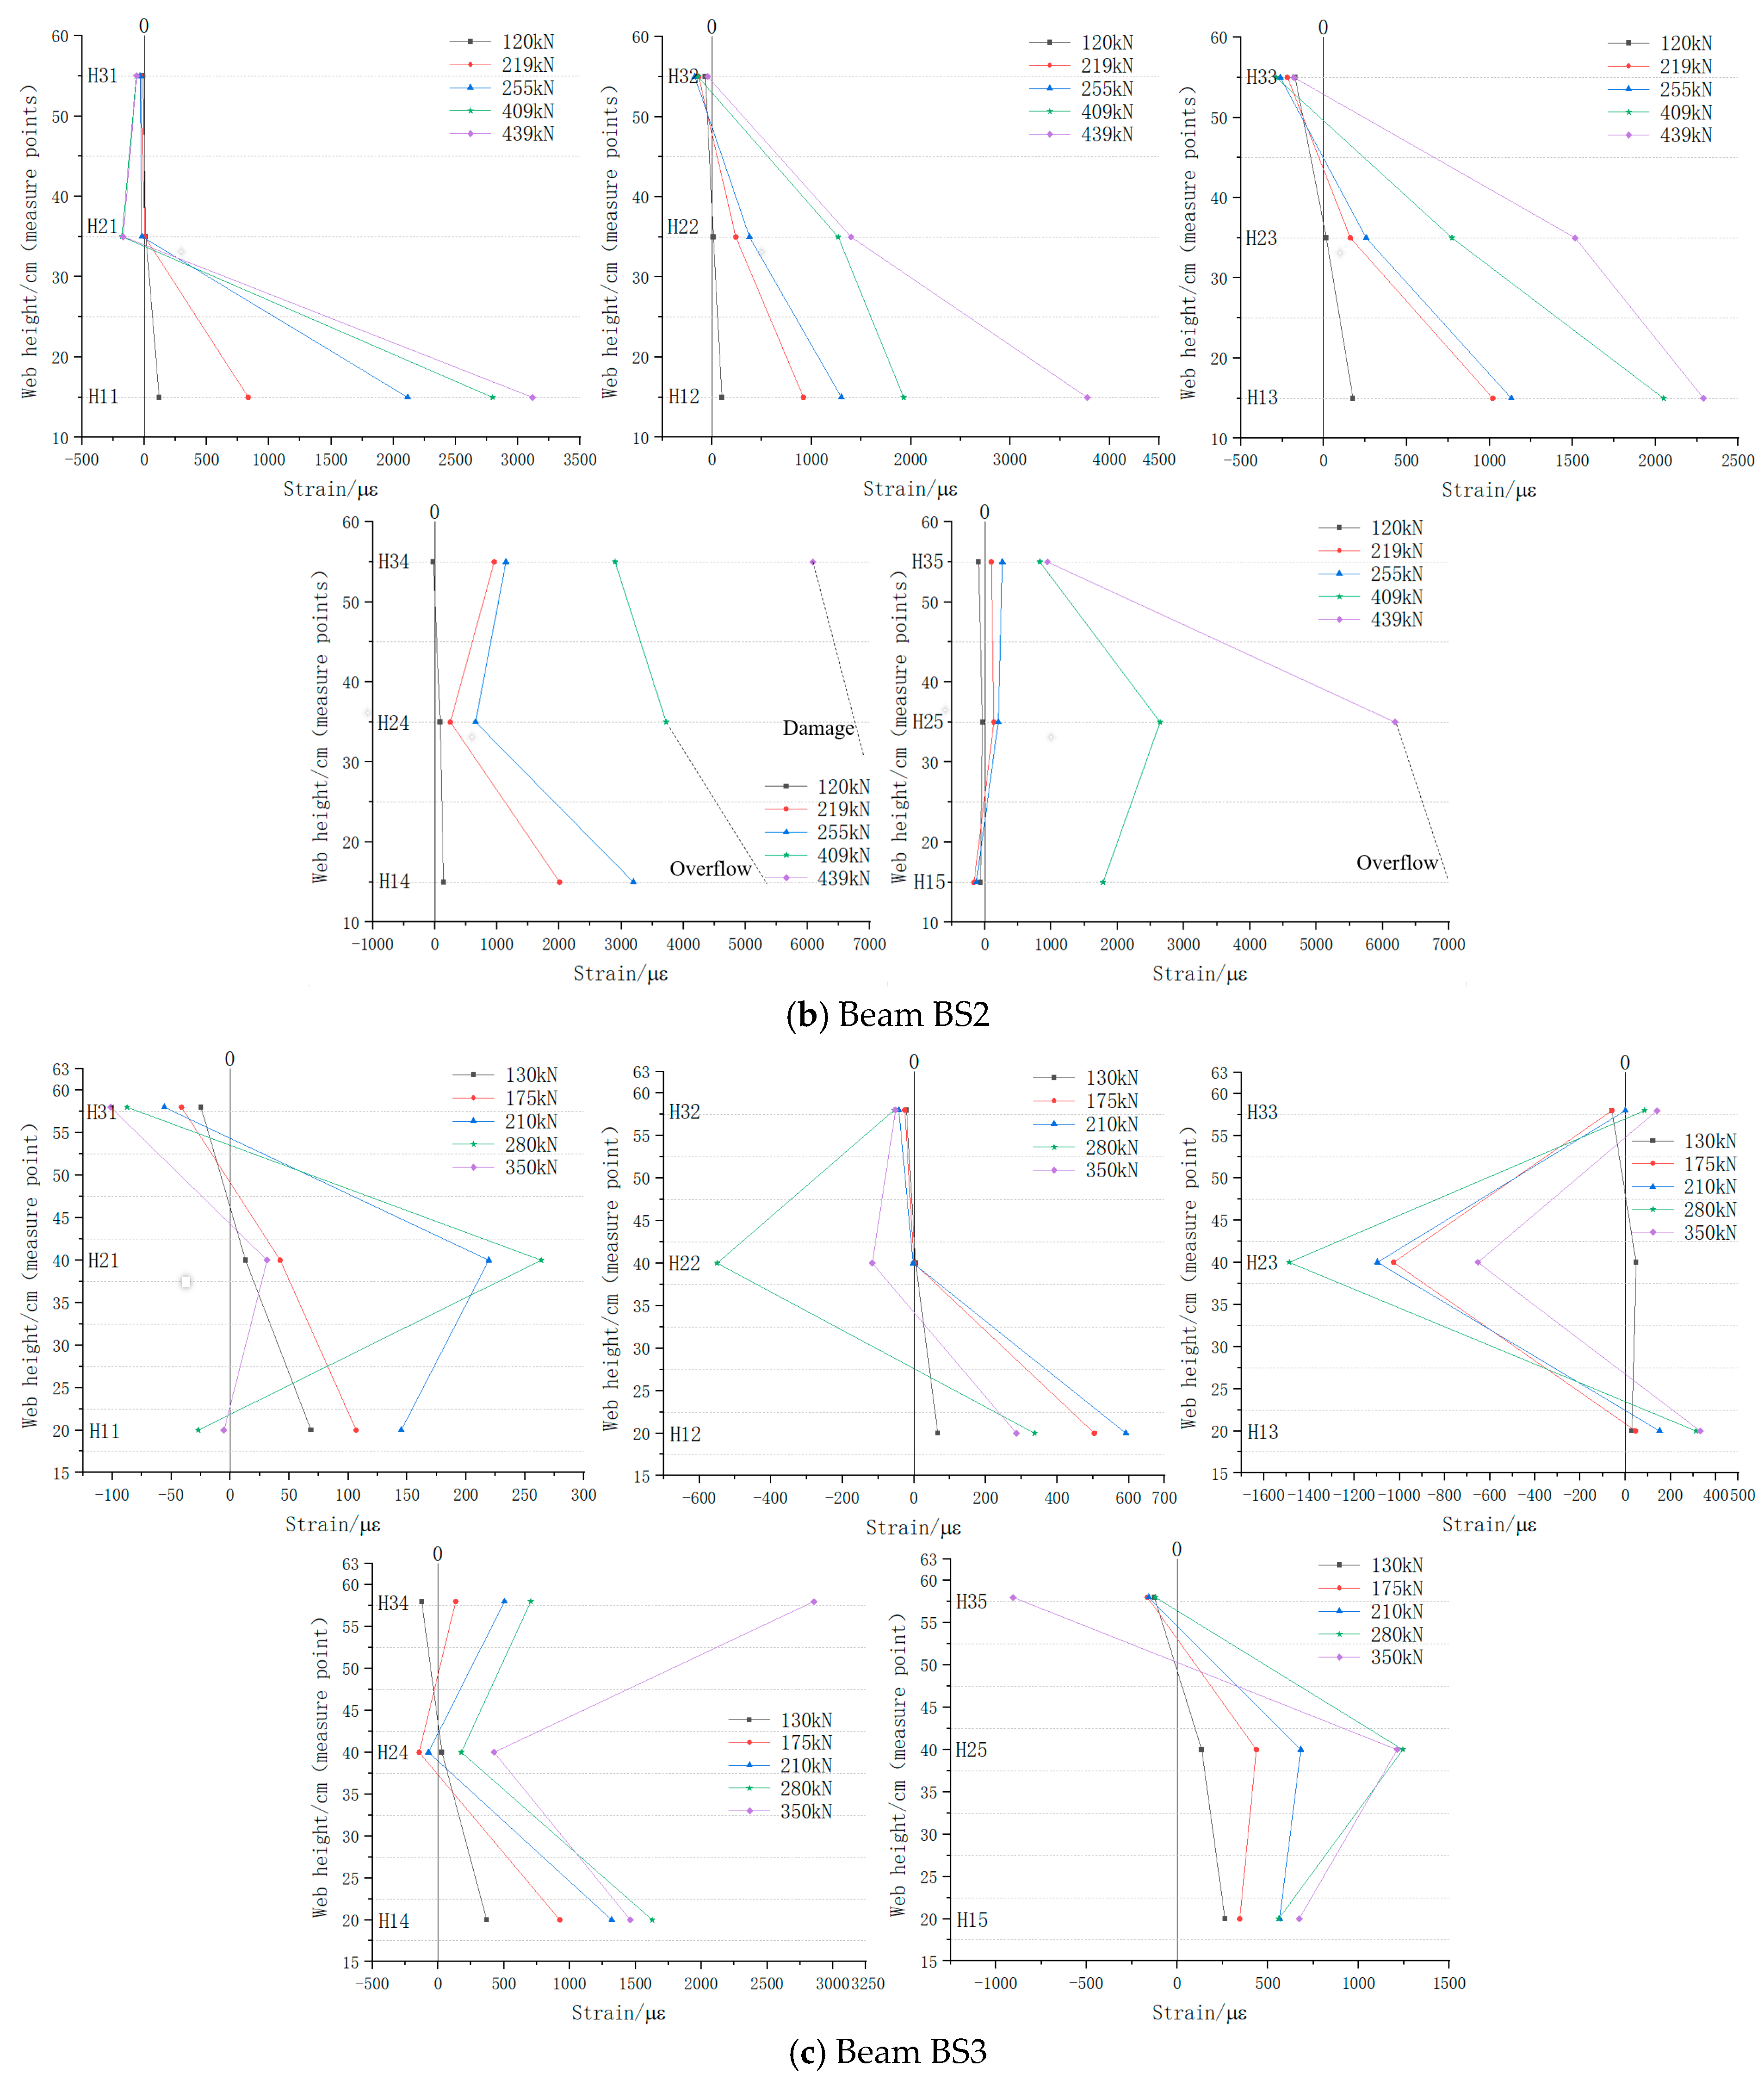
5.2.1. Web Longitudinal Reinforcement
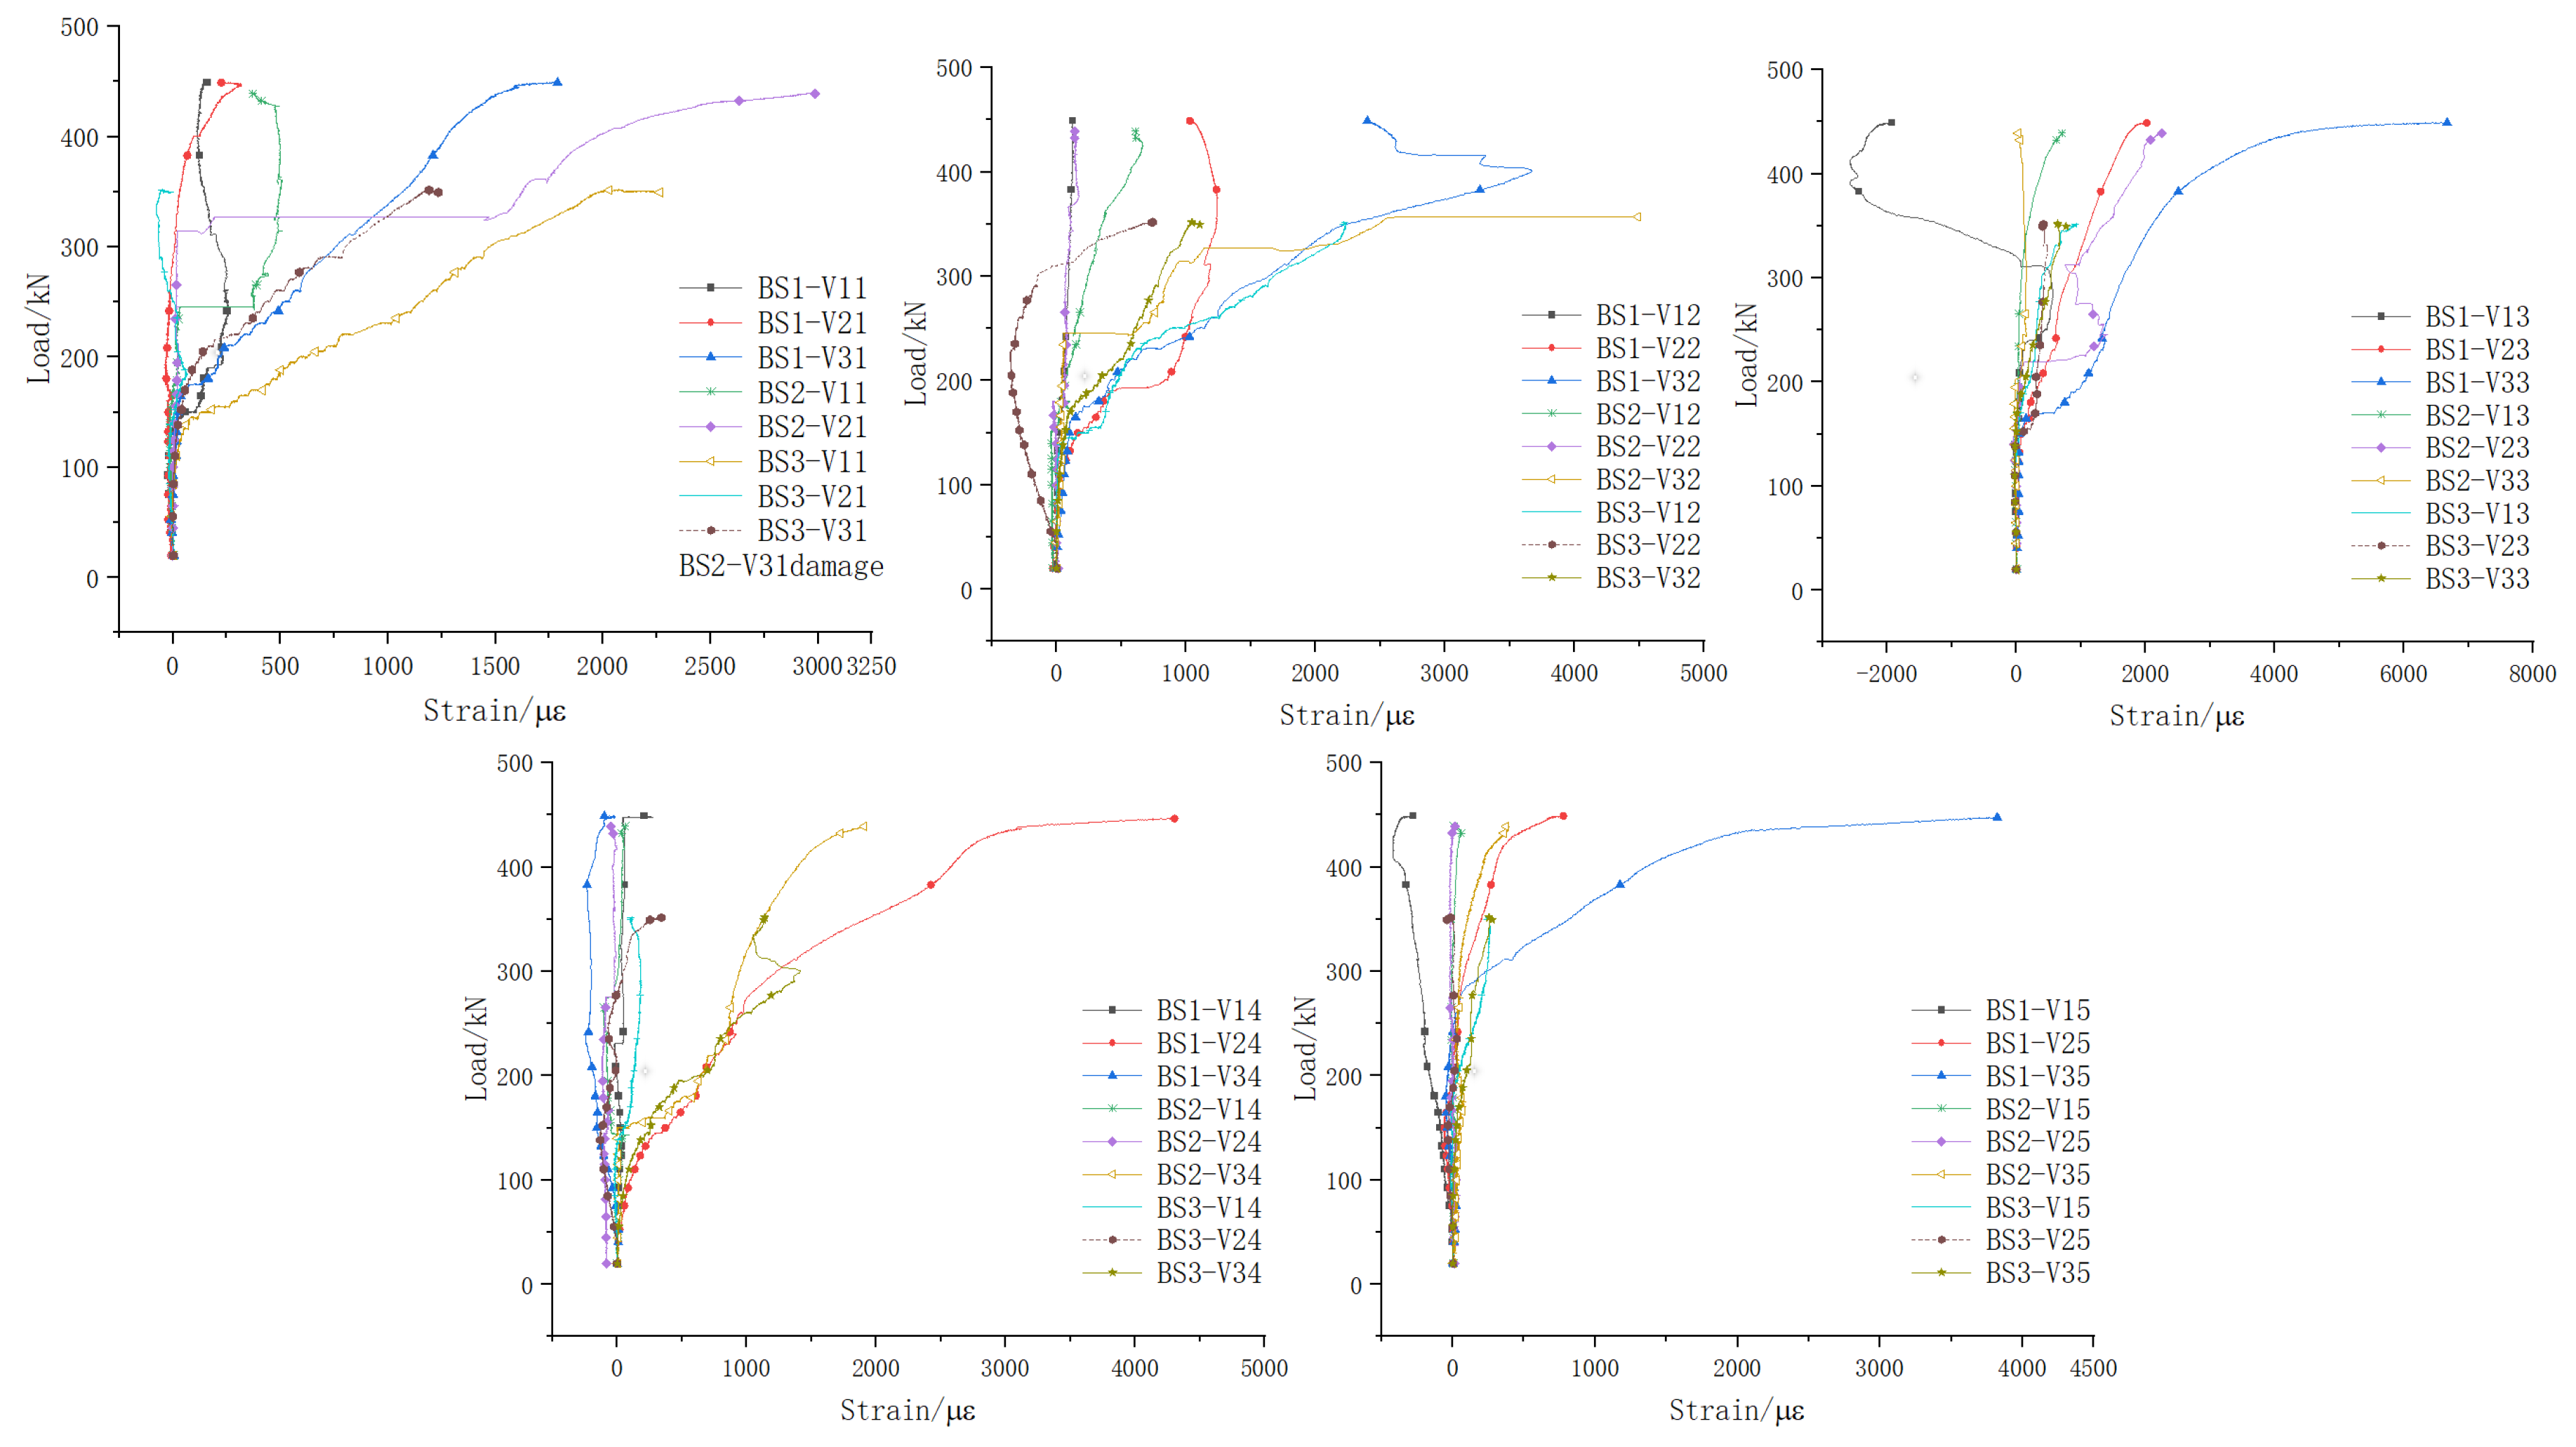
5.2.2. Stirrup
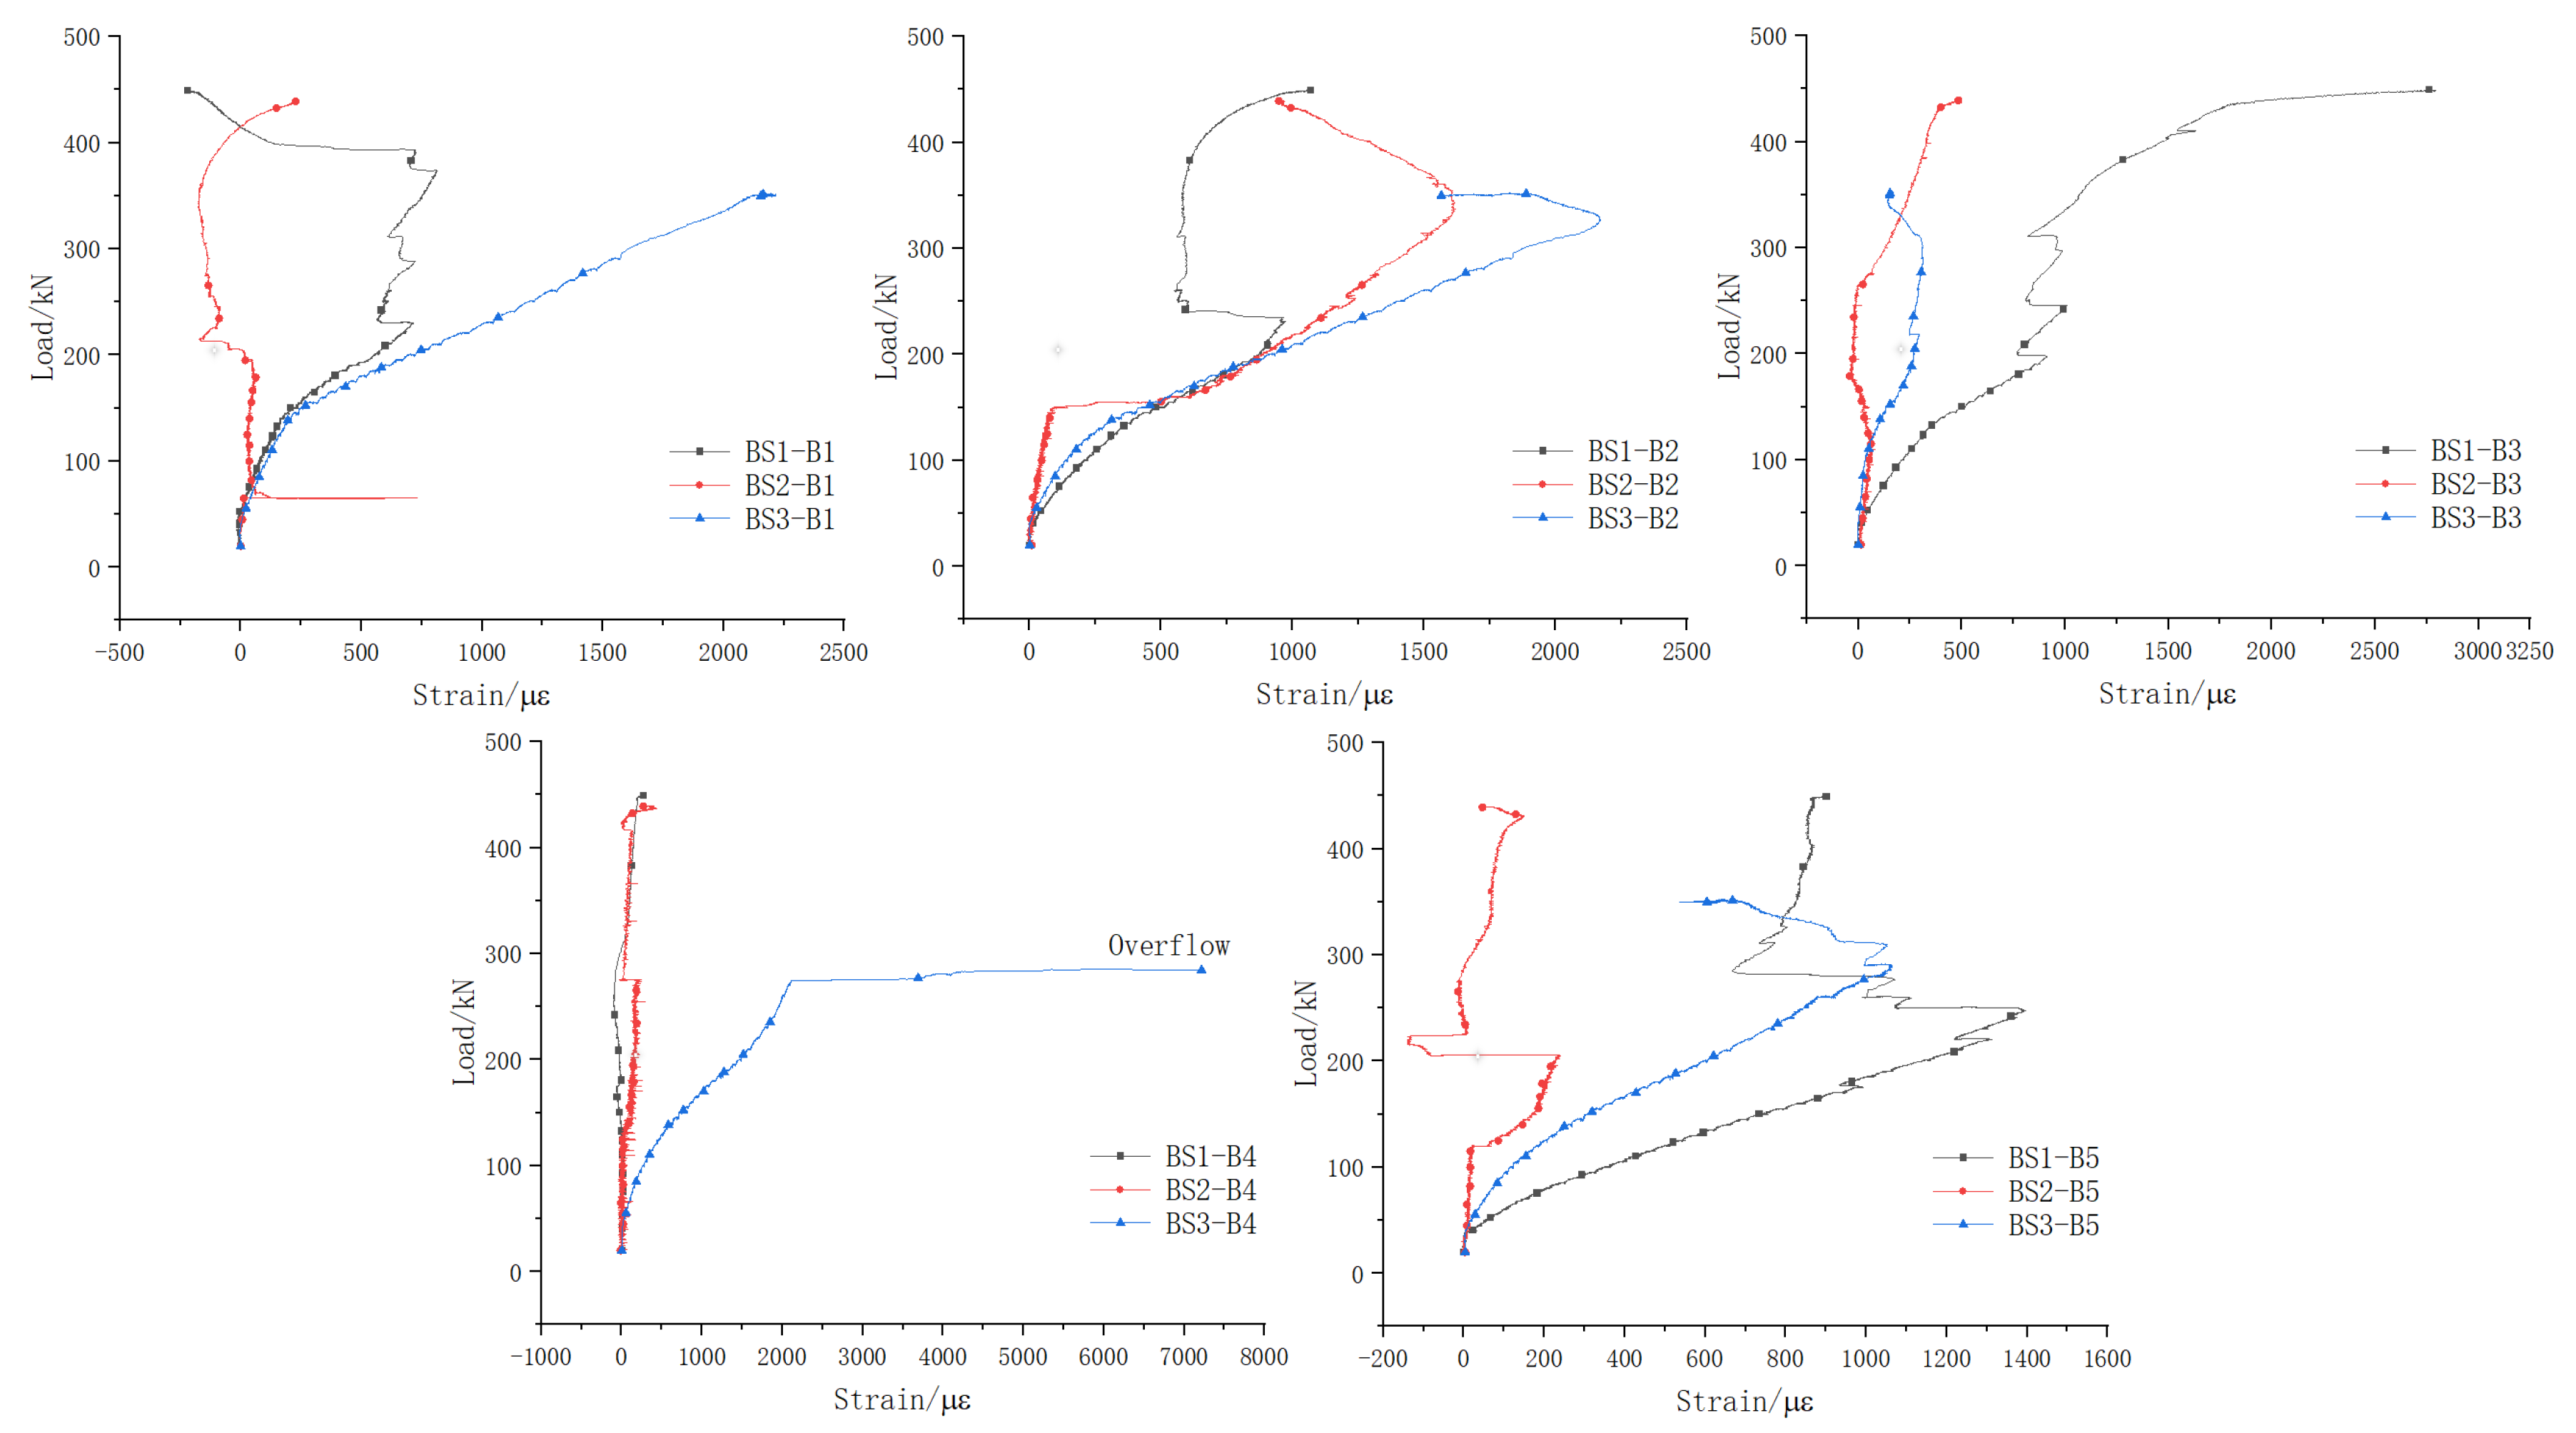
5.2.3. Bottom Longitudinal Reinforcement
5.3. Failure Mode
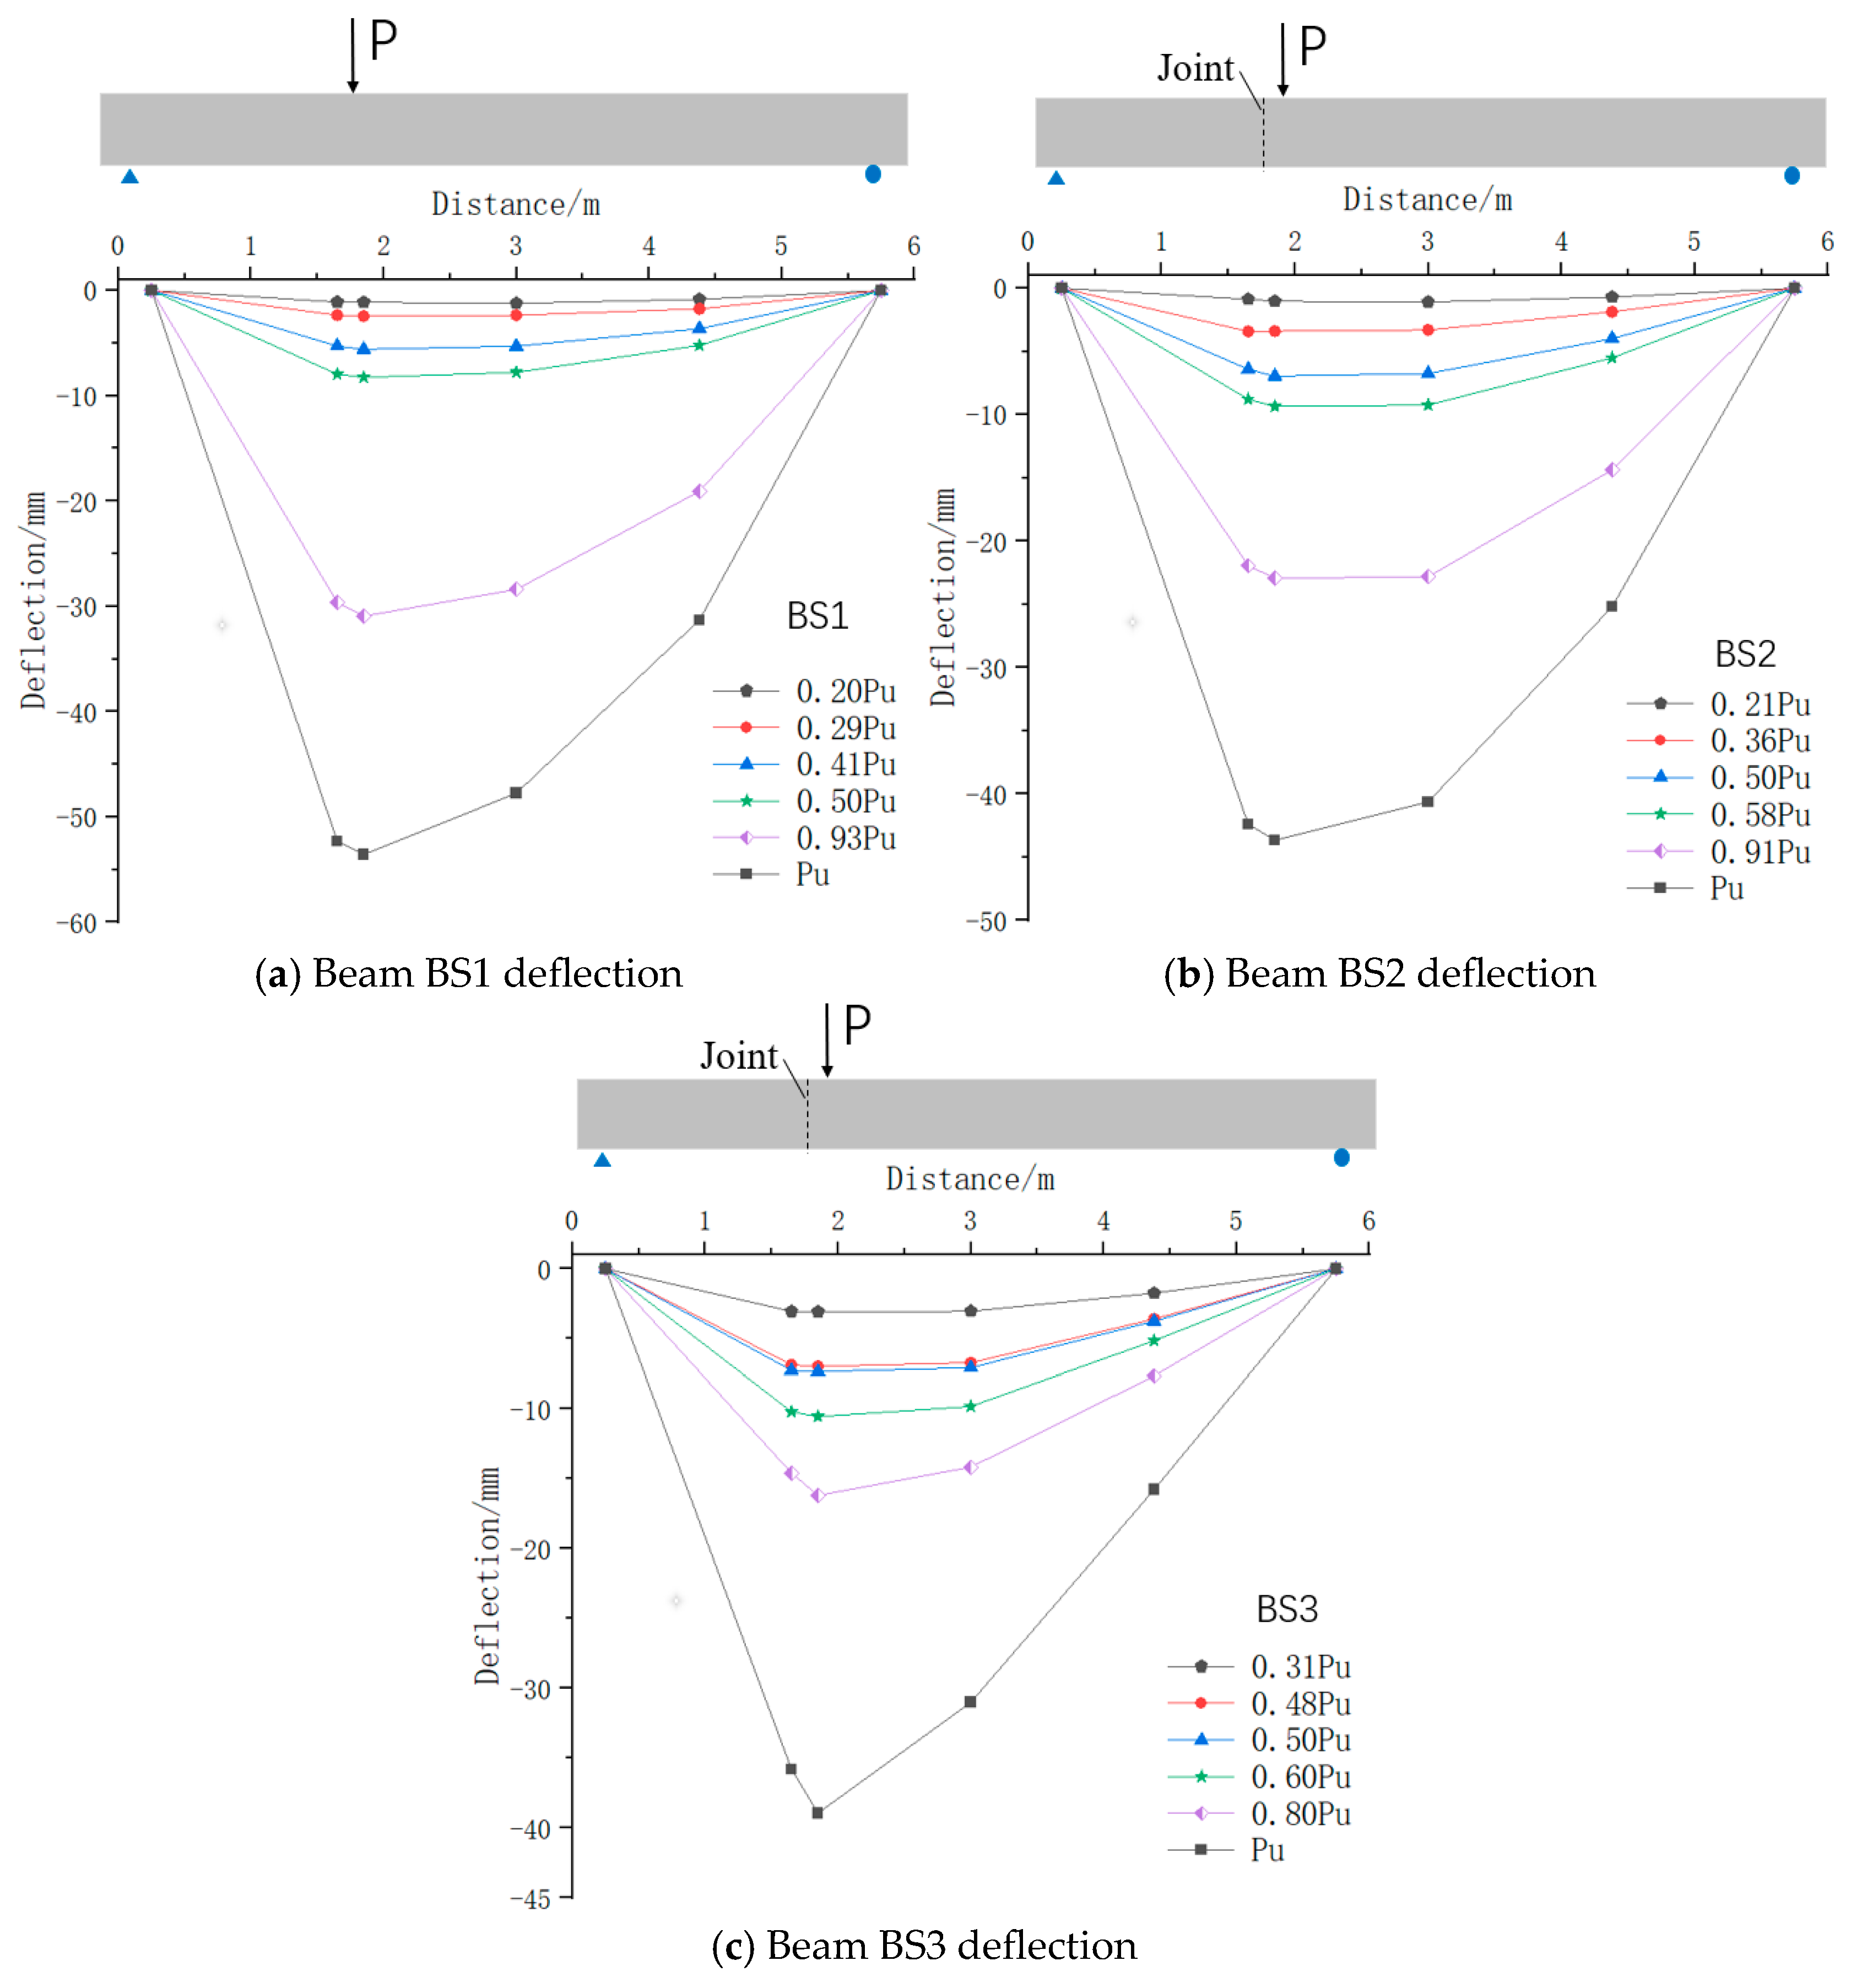
5.4. Deformation Characteristics
5.5. Stiffness Analysis
5.6. Shear Capacity
6. Discussion
- (1)
- Stirrups only
- (2)
- Stirrups and main longitudinal steel bars of upper and lower plates
- (3)
- Grid Shear Reinforcement Theory
7. Conclusions
- (1)
- The continuous longitudinal reinforcement at the joint effectively resisted the axial tension induced by shear forces, functioning similarly to stirrups in providing shear resistance. In contrast, the web longitudinal reinforcement near the joint in traditional segmental beams failed to reach the yield strain under tension, rendering it ineffective in fulfilling its intended shear role.
- (2)
- The mechanical behavior of stirrups in segmental beams with continuous longitudinal reinforcement closely resembles that of monolithic beams. Specifically, stirrups near the joint effectively resisted the vertical component of the principal tensile stress during specimen failure, fully utilizing their shear reinforcement capacity. However, in traditional segmental beams with open joints, the absence of longitudinal reinforcement constraints led to the complete release of structural stress on both sides of the joint. Consequently, shear stress was transferred primarily through the prestressing tendons and the concrete shear compression zone at the upper edge of the joint, significantly diminishing the shear resistance provided by stirrups.
- (3)
- In segmental beams with continuous longitudinal reinforcement, the web longitudinal reinforcement effectively bore the axial tension caused by shear, significantly reducing the tensile stress increase in the bottom longitudinal reinforcement. In contrast, traditional segmental beams, which feature discontinuous longitudinal reinforcement at the joint, exhibited a substantial increase in tensile stress in the bottom longitudinal reinforcement due to shear forces.
- (4)
- The continuous longitudinal reinforcement in segmental beams effectively restrained the development of diagonal web cracks and limited crack widths, thereby enhancing structural stiffness. Furthermore, the load–displacement curves of these beams closely mirrored those of monolithic beams, demonstrating significantly higher structural stiffness and load-bearing capacity compared to traditional segmental beams.
- (5)
- From the initiation of web cracking to specimen failure, the stress distribution near the joints of segmental beams with continuous longitudinal reinforcement largely adhered to the plane section assumption. This ensured that key mechanical behaviors—such as shear capacity, structural stiffness, crack propagation, and failure modes—were consistent with those observed in monolithic beams. The experimental results comprehensively validate the critical role of continuous longitudinal reinforcement at joint sections in segmental beams. This approach not only highlights its necessity but also establishes it as a vital method for mitigating the adverse effects of joints on mechanical performance.
- (6)
- The findings of this study highlight the necessity of incorporating continuous longitudinal reinforcement in future design codes for precast concrete segmental beams (PCSBs).
Author Contributions
Funding
Institutional Review Board Statement
Informed Consent Statement
Data Availability Statement
Conflicts of Interest
References
- Zhan, Y.; Li, Z.; Chen, Z.; Shao, J.; Yue, F.; Liu, F.; Ma, Z.J. Experimental and Numerical Investigations on Shear Performance of Key Tooth Joints of Precast Concrete Segmental Bridge Under Repeated Loading. Constr. Build. Mater. 2022, 351, 128794. [Google Scholar]
- Choi, J.S.; Lee, H.J.; Yuan, T.F.; Yoon, Y.S. Shear Strength of Steel Fiber Reinforced Lightweight Self-Consolidating Concrete Joints Under Monotonic and Cyclic Loading. Constr. Build. Mater. 2023, 363, 129829. [Google Scholar]
- Luo, Z.; Wang, Y.; Wang, T. Shear Behavior of Epoxy Joints in Precast Segmental Bridges Under Impact Loading. Eng. Struct. 2022, 269, 114641. [Google Scholar]
- Rabbat, B. Testing of Segmental Concrete Girders with External Tendons. PCI J. 1987, 32, 86–107. [Google Scholar]
- Macgregor, R.J.F.; Kreger, M.E.; Breen, J.E. Strength and Ductility of a Three-Span Externally Post-Tensioned Segmental Box Girder Bridge Model. Earth Planet. Sci. Lett. 1990, 305, 83–91. [Google Scholar]
- Ramos, G.; Aparicio, A.C. Ultimate Analysis of Monolithic and Segmental Externally Prestressed Concrete Bridges. J. Bridge Eng. 1996, 1, 10–17. [Google Scholar]
- Aparicio, A.C.; Ramos, G.; Casas, J.R. Testing of Externally Prestressed Concrete Beams. Eng. Struct. 2002, 24, 73–84. [Google Scholar]
- Huang, Z.; Liu, X. Modified Skew Bending Model for Segmental Bridge with Unbonded Tendons. J. Bridge Eng. 2006, 11, 59–63. [Google Scholar]
- Yuan, A.; Dai, H.; Sun, D.; Cai, J. Behaviors of Segmental Concrete Box Beams with Internal Tendons and External Tendons Under Bending. Eng. Struct. 2013, 48, 623–634. [Google Scholar]
- Jiang, H.; Cao, Q.; Liu, A.; Wang, T.; Qiu, Y. Flexural Behavior of Precast Concrete Segmental Beams with Hybrid Tendons and Dry Joints. Constr. Build. Mater. 2016, 110, 1–7. [Google Scholar]
- Jiang, H.; Li, Y.; Liu, A.; Ma, Z.J.; Chen, L.; Chen, Y. Shear Behavior of Precast Concrete Segmental Beams with External Tendons. J. Bridge Eng. 2018, 23, 04018049. [Google Scholar]
- Moustafa, S.E. Ultimate Load Test of a Segmentally Constructed Prestressed Concrete I-Beam. PCI J. 1974, 19, 54–75. [Google Scholar]
- Ramirez, G.; Macgregor, R.; Kreger, M.E. Shear Strength of Segmental Structures. In Proceedings of the Workshop AFPC External Prestressing in Structures, Saint-Rémy-lès-Chevreuse, France, 9 June 1993; pp. 287–296. [Google Scholar]
- Turmo, J.; Ramos, G.; Aparicio, A.C. FEM Study on the Structural Behaviour of Segmental Concrete Bridges with Unbonded Prestressing and Dry Joints: Simply Supported Bridges. Eng. Struct. 2005, 27, 1652–1661. [Google Scholar]
- Li, G.P.; Yang, D.H.; Lei, Y. Combined Shear and Bending Behavior of Joints in Precast Concrete Segmental Beams with External Tendons. J. Bridge Eng. 2013, 18, 1042–1052. [Google Scholar]
- Brenkus, N.R.; Wagner, D.J.; Hamilton, H.R. Experimental Evaluation of Shear Strength of an Innovative Splice for Prestressed Precast Concrete Girders. J. Bridge Eng. 2016, 21, 04016018. [Google Scholar]
- Takebayashi, T.; Deeprasertwong, K.; Leung, Y.W.J. A Full-Scale Destructive Test of a Precast Segmental Box Girder Bridge with Dry Joints and External Tendons. Struct. Build. 2015, 104, 297–315. [Google Scholar]
- Hindi, A.; Macgregor, R.; Kreger, M.E.; Breen, J.E. Enhancing Strength and Ductility of Post-Tensioned Segmental Box Girder Bridges. ACI Struct. J. 1995, 92, 73–94. [Google Scholar]
- Sivaleepunth, C.; Niwa, J.; Nguyen, D.H.; Hasegawa, T.; Hamada, Y. Shear Carrying Capacity of Segmental Prestressed Concrete. Doboku Gakkai Ronbunshuu E 2009, 65, 63–75. [Google Scholar]
- Halder, R.; Yuen, T.Y.P.; Chen, W.-W.; Zhou, X.; Deb, T.; Zhang, H.; Wen, T.H. Tendon Stress Evaluation of Unbonded Post-Tensioned Concrete Segmental Bridges with Two-Variable Response Surfaces. Eng. Struct. 2021, 245, 112984. [Google Scholar]
- Tran, D.T.; Pham, T.M.; Hao, H.; Chen, W. Numerical Investigation of Flexural Behaviours of Precast Segmental Concrete Beams Internally Post-Tensioned with Unbonded FRP Tendons Under Monotonic Loading. Eng. Struct. 2021, 249, 113341. [Google Scholar]
- Tran, D.T.; Pham, T.M.; Hao, H.; Chen, W. Numerical Study on Bending Response of Precast Segmental Concrete Beams Externally Prestressed with FRP Tendons. Eng. Struct. 2021, 241, 112423. [Google Scholar] [CrossRef]
- Le, T.D.; Pham, T.M.; Hao, H. Numerical Study on the Flexural Performance of Precast Segmental Concrete Beams with Unbonded Internal Steel Tendons. Constr. Build. Mater. 2020, 248, 118362. [Google Scholar] [CrossRef]
- Le, T.D.; Pham, T.M.; Hao, H.; Yuan, C. Performance of Precast Segmental Concrete Beams Posttensioned with Carbon Fiber-Reinforced Polymer (CFRP) Tendons. Compos. Struct. 2019, 208, 56–69. [Google Scholar] [CrossRef]
- American Association of State Highway and Transportation Officials. Guide Specifications for Design and Construction of Segmental Concrete Bridges; AASHTO: Washington, DC, USA, 1999. [Google Scholar]
- ACI 440.4r; Prestressing Concrete Structures with FRP Tendons. American Concrete Institute: Farmington Hills, MI, USA, 2004.
- EN 1992-1-1; Eurocode 2: Design of Concrete Structures—Part 1–1. General Rules and Rules for Buildings. British Standards Institution: London, UK, 2004.
- ACI 318–05; Building Code Requirements for Structural Concrete and Commentary. American Concrete Institute: Farmigton Hills, MI, USA, 2005.
- American Association of State Highway and Transportation Officials. Load and Resistance Factor Design. In Bridge Design Specifications, 3rd ed.; AASHTO: Washington, DC, USA, 2003. [Google Scholar]
- GB 50010-2010; Code for Design of Concrete Structures. Ministry of Housing and Urban-Rural Development of the People’s Republic of China, Architecture & Building Press: Beijing, China, 2010.
- Jtg3362–2018; Specifications for Design of Highway Reinforced Concrete and Prestressed Concrete Bridges and Culverts. Communications Press: Beijing, China, 2018.
- Xu, D.; Zhang, Y.; Liu, C.; Turmo, J. Shear Design of Concrete Beams Reinforced with Grid Reinforcement. Mag. Concr. Res. 2013, 65, 93–107. [Google Scholar] [CrossRef]
- Sun, Y.; Xu, D.; Chen, B.; Xu, F.Y.; Zhu, H.P. Three-Dimensional Reinforcement Design Method and Program Realization for Prestressed Concrete Box-Girder Bridges Based on a Specific Spatial Lattice Grid Model. Eng. Struct. 2018, 175, 822–846. [Google Scholar] [CrossRef]
- Zou, Y.; Xu, D.; Duanmu, X. Tests and Calculation Methods for the Shear Performance of Steel Shear Keyed Joint Segment Beams. Arch. Civ. Mech. Eng. 2024, 24, 128. [Google Scholar] [CrossRef]
- Jiang, H.; Hu, Z.; Cao, Z.; Gao, X.; Tian, Y.; Sun, X. Experimental and Numerical Study on Shear Performance of Externally Prestressed Precast UHPC Segmental Beams Without Stirrups. Structures 2022, 46, 1134–1153. [Google Scholar] [CrossRef]
- Zou, Y.; Xu, D. Experimental Study on the Bending Behavior of Precast Concrete Segmental Bridges with Continuous Rebars at Joints. Buildings 2024, 14, 2938. [Google Scholar] [CrossRef]
- Xu, D.; Zhang, Y.; Xu, F.; Gauvreau, P. Unified Flexural Design Method for Deep and Shallow Beams Using Non-Linear Grid Model. Struct. Eng. Int. 2017, 27, 482–491. [Google Scholar] [CrossRef]
- Bolina, F.L.; Lago, B.D.; Rodríguez, E.D. Effects of Thermal Properties on Temperature Field of UHPC Structures Under Fire Conditions. Constr. Build. Mater. 2024, 411, 134254. [Google Scholar] [CrossRef]


| Beams | BS1 | BS2 | BS3 | |
|---|---|---|---|---|
| Parameters | ||||
| Web width/mm | 80 | 80 | 80 | |
| Beam height/mm | 670 | 670 | 670 | |
| Effective height/mm | 639 | 639 | 639 | |
| Stirrup spacing/mm | 100 | 100 | 100 | |
| Shear span α/mm | 1700 | 1700 | 1700 | |
| Shear span ratio/λ | 2.66 | 2.66 | 2.66 | |
| Upper and lower longitudinal reinforcement ratio/% | 0.614 | 0.614 | 0.614 | |
| Stirrup ratio/% | 0.706 | 0.706 | 0.706 | |
| Longitudinal reinforcement type | Continuous at the joint | Continuous at the joint | Discontinuous at the joint | |
| Web longitudinal reinforcement ratio/% | 0.706 | 0.706 | 0.706 | |
| Erection | Monolithic | Segmental | Segmental | |
| Load type | Shear-bending | Shear-bending | Shear-bending | |
| Static scheme | Simply supported | Simply supported | Simply supported | |
| Test Names | BS1 | BS2 | BS3 |
|---|---|---|---|
| Strength/MPa | 49 | 46 | 48 |
| Specification and Dimension | C6 | C8 | C10 | |
|---|---|---|---|---|
| Yield strength/MPa | 455.30 | 450.06 | 465.35 | 1658.5 |
| Ultimate strength/MPa | 617.78 | 625.88 | 658.35 | 1844.39 |
| Elasticity modulus/MPa | 2.00 × 10⁵ | 2.00 × 10⁵ | 2.00 × 10⁵ | 1.95 × 10⁵ |
| Beam | BS1 | BS2 | BS3 |
|---|---|---|---|
| Effective prestressing/MPa | 840 | 827 | 829 |
| Version | Electrical Resistance/Ω | Sensitivity Coefficient/% | Precision | Length × Width/mm |
|---|---|---|---|---|
| BX120-100AA | 119.6 ± 0.1 | 2.08 ± 1 | A | 3 × 2 |
| Beams | Loading Force /kN | Crack Type | Length /mm | Width /mm | Location | Cracks Sequence | Remark |
|---|---|---|---|---|---|---|---|
| BS1 | 90 | Bending crack | 20 | 0.050 | Bottom edge of main beam at loading point | Initial crack | Incipient crack |
| 120 | Bending crack | 60 | 0.064 | Bottom edge of main beam 60 cm away from loading point | Second crack | ||
| 130 | Bending crack | 40 | 0.052 | Bottom edge of main beam 40 and 50 cm away from loading point | Third crack | ||
| BS2 | 95 | Bending crack | 30 | 0.060 | Bottom edge of main beam at loading point | Initial crack | Incipient crack |
| 145 | Bending crack | 80 | 0.085 | Bottom edge of joint | Second crack | ||
| 150 | Shear-Bending crack | 100 | 0.075 | Bottom edge of main beam 40 cm away from loading point | Third crack | ||
| BS3 | 110 | Bending crack | 30 | 0.053 | Bottom edge of main beam 10 cm away from loading point | Initial crack | Incipient crack |
| 150 | Bending crack | 30 | 0.060 | Bottom edge of main beam at loading point | Second crack | ||
| 155 | Bending crack | 50~70 | 0.073 | Bottom edge of main beam within 30~60 cm from loading point | Third crack |
| Beams | Loading Force /kN | Crack Type | Length /mm | Width /mm | Location | Cracks Sequence | Remark |
|---|---|---|---|---|---|---|---|
| BS1 | 120 | Diagonal shear crack in the web | 200 | 0.072 | At a distance of 50 cm from the loading point | Initial crack | Incipient crack |
| 125 | Diagonal shear crack in the web | 50 | 0.065 | At a distance of 60 cm from the loading point | Second crack | ||
| 130 | Diagonal shear crack in the web | 80 | 0.069 | At a distance of 85 cm from the loading point | Third crack | ||
| BS2 | 120 | Diagonal shear crack in the web | 80 | 0.073 | At a distance of 35 cm from the loading point | Initial crack | Incipient crack |
| 155 | Diagonal shear crack in the web | 50 | 0.071 | At a distance of 30 cm from the loading point | Second crack | ||
| 160 | Diagonal shear crack in the web | 50~80 | 0.089 | At distances of 20 cm and 60 cm from the loading point | Third crack | ||
| BS3 | 130 | Diagonal shear crack in the web | 100 | 0.099 | At a distance of 40 cm from the loading point | Initial crack | Incipient crack |
| 150 | Diagonal shear crack in the web | 100 | 0.179 | At a distance of 45 cm from the loading point | Second crack | ||
| 160 | Diagonal shear crack in the web | 200 | 0.079 | At a distance of 20 cm from the loading point | Third crack |
| Beam | BS1 | BS2 | BS3 |
|---|---|---|---|
| Shear capacity/kN | 449 | 435 | 350 |
| VS BS1/% | 1 | −3.11 | −22.05 |
| Main International Specifications | Shear Reinforcement | Shear Reinforcement |
|---|---|---|
| ACI [28], GB [30]/JTG [31] | Stirrups only | 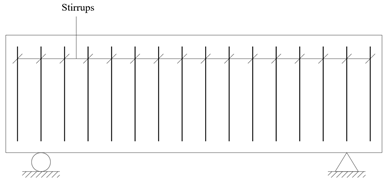 |
| Eurocode [27], AASHTO [25,29] | Stirrups and main longitudinal steel bars of upper and lower plates | 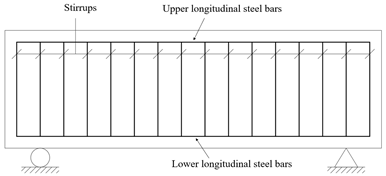 |
| Grid Shear Reinforcement Theory [33,37] | Stirrups and all longitudinal steel bars fall within shear reinforcement | 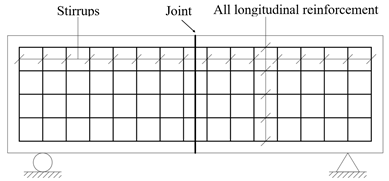 |
Disclaimer/Publisher’s Note: The statements, opinions and data contained in all publications are solely those of the individual author(s) and contributor(s) and not of MDPI and/or the editor(s). MDPI and/or the editor(s) disclaim responsibility for any injury to people or property resulting from any ideas, methods, instructions or products referred to in the content. |
© 2025 by the authors. Licensee MDPI, Basel, Switzerland. This article is an open access article distributed under the terms and conditions of the Creative Commons Attribution (CC BY) license (https://creativecommons.org/licenses/by/4.0/).
Share and Cite
Zou, Y.; Xu, D. Improving Shear Performance of Precast Concrete Segmental Beams Through Continuous Longitudinal Reinforcements Across Joints. Materials 2025, 18, 1410. https://doi.org/10.3390/ma18071410
Zou Y, Xu D. Improving Shear Performance of Precast Concrete Segmental Beams Through Continuous Longitudinal Reinforcements Across Joints. Materials. 2025; 18(7):1410. https://doi.org/10.3390/ma18071410
Chicago/Turabian StyleZou, Yu, and Dong Xu. 2025. "Improving Shear Performance of Precast Concrete Segmental Beams Through Continuous Longitudinal Reinforcements Across Joints" Materials 18, no. 7: 1410. https://doi.org/10.3390/ma18071410
APA StyleZou, Y., & Xu, D. (2025). Improving Shear Performance of Precast Concrete Segmental Beams Through Continuous Longitudinal Reinforcements Across Joints. Materials, 18(7), 1410. https://doi.org/10.3390/ma18071410