
Second-Order Effects in Lightweight Aggregate Concrete Slender Columns

 , , ,
, , ,  and
and
Abstract
1. Introduction
2. Materials and Methods
2.1. Experimental Program
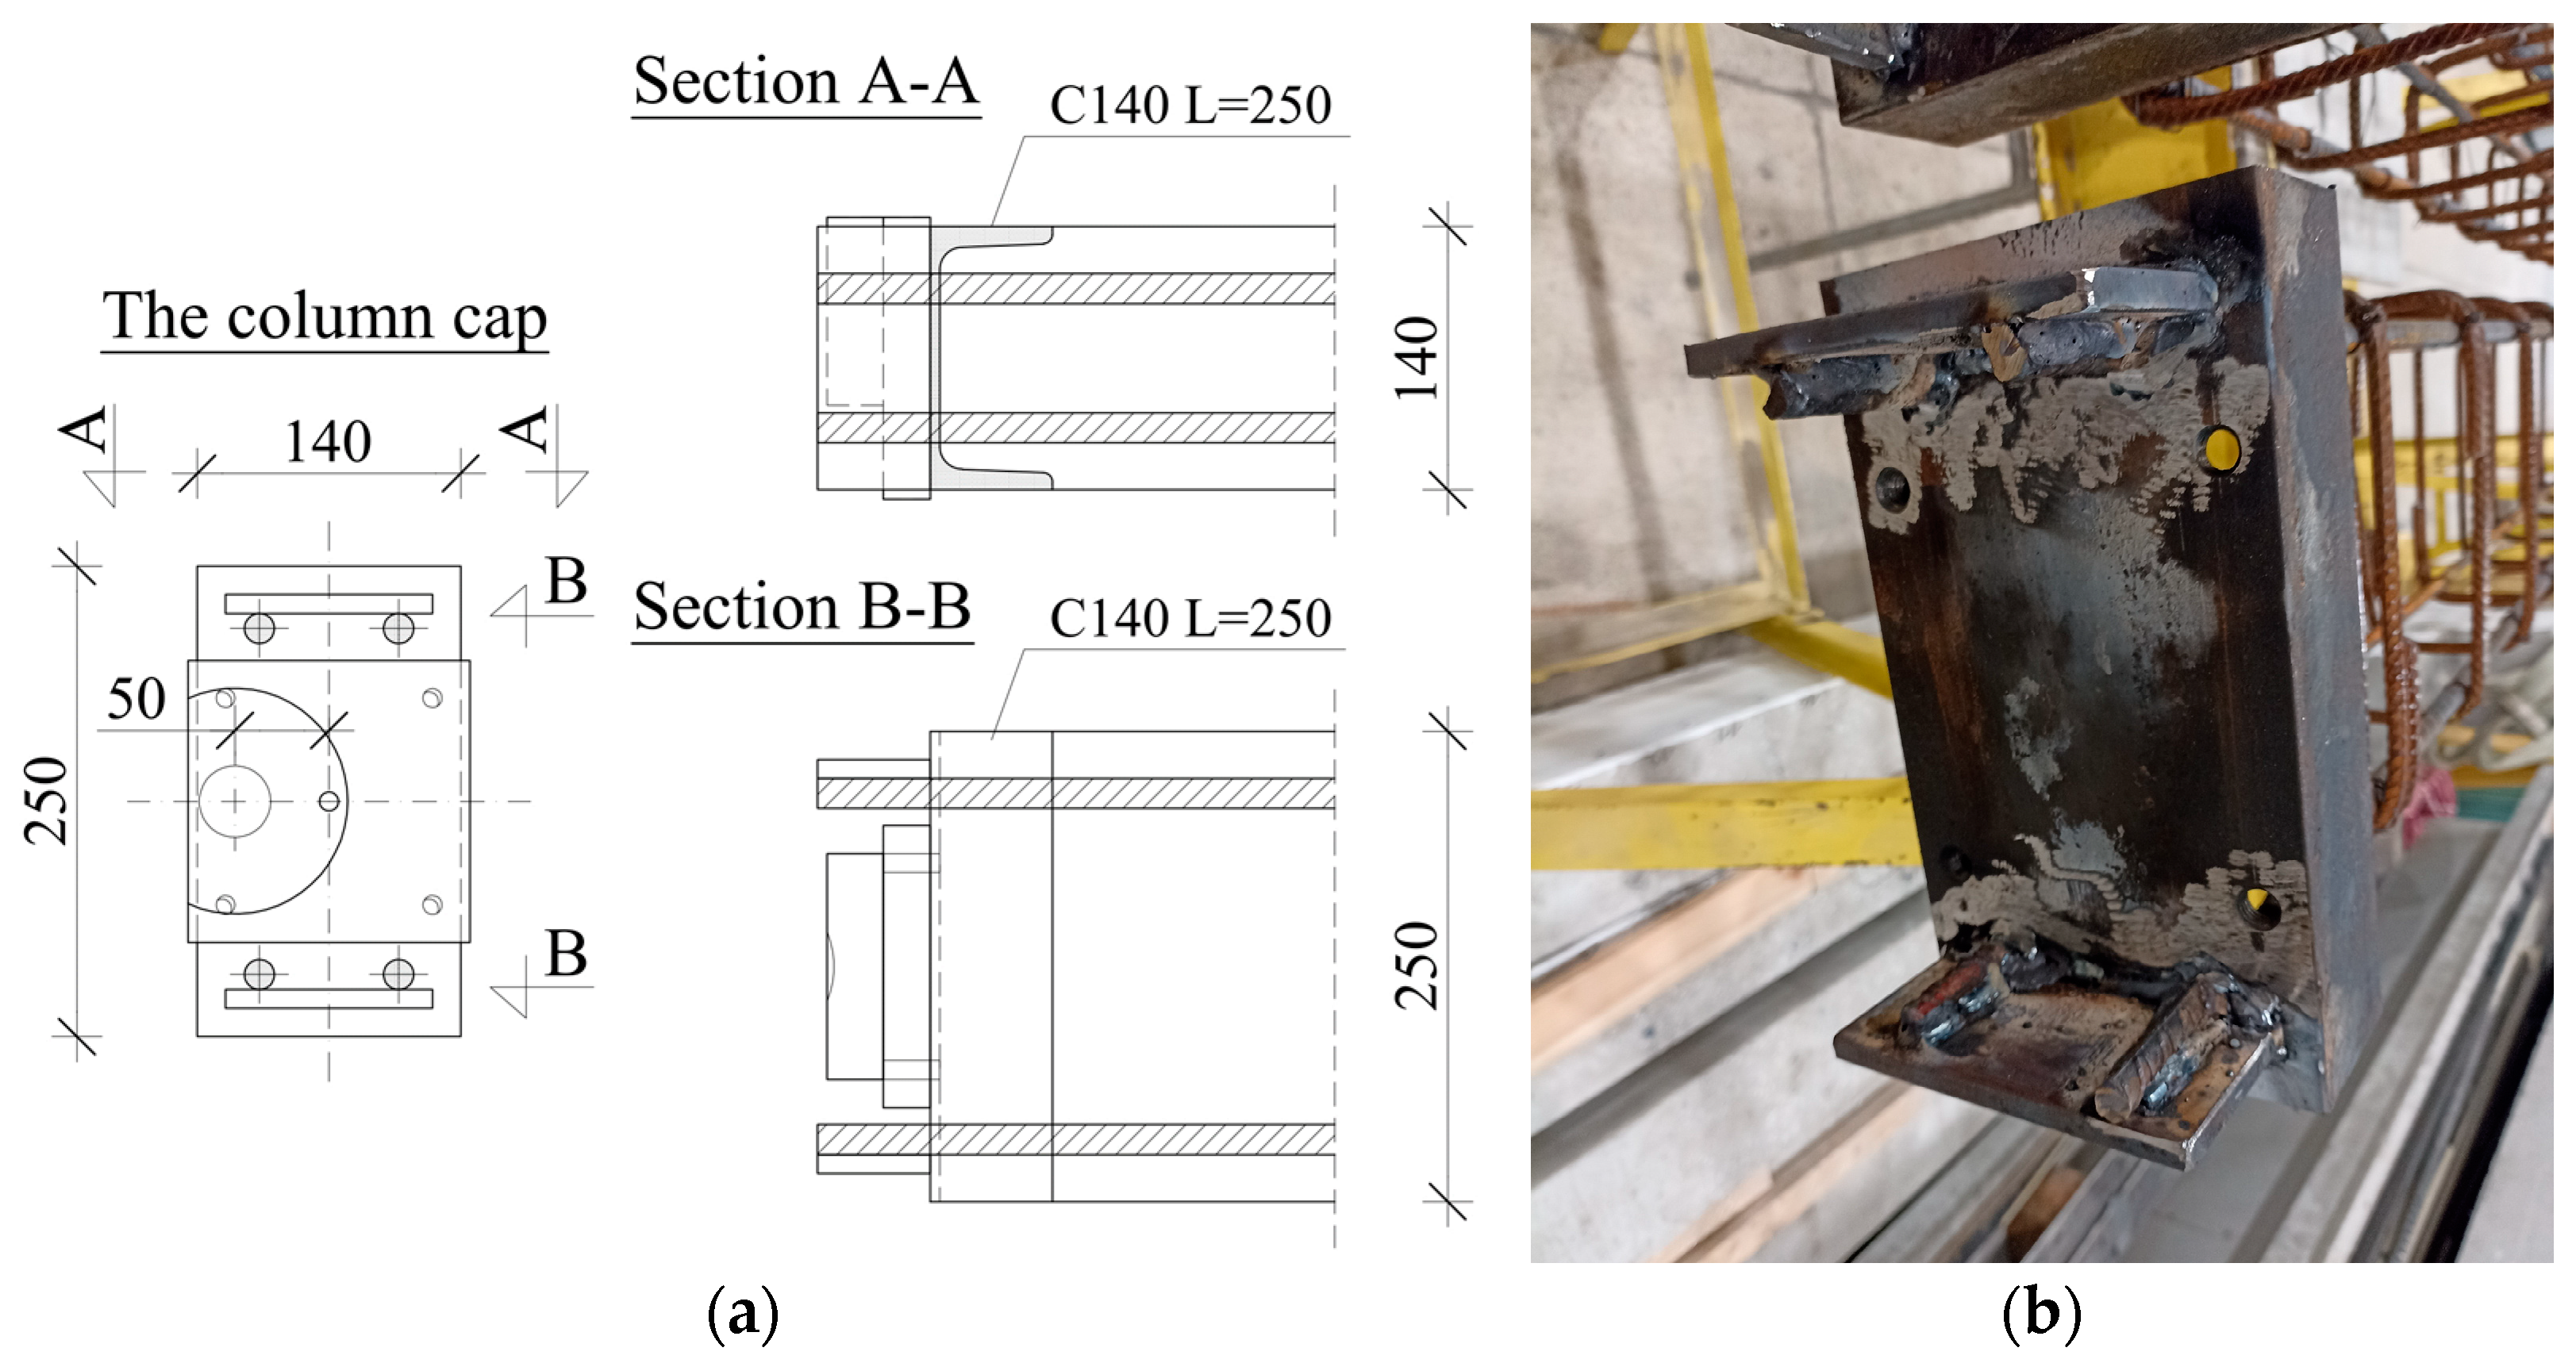
2.2. Elements
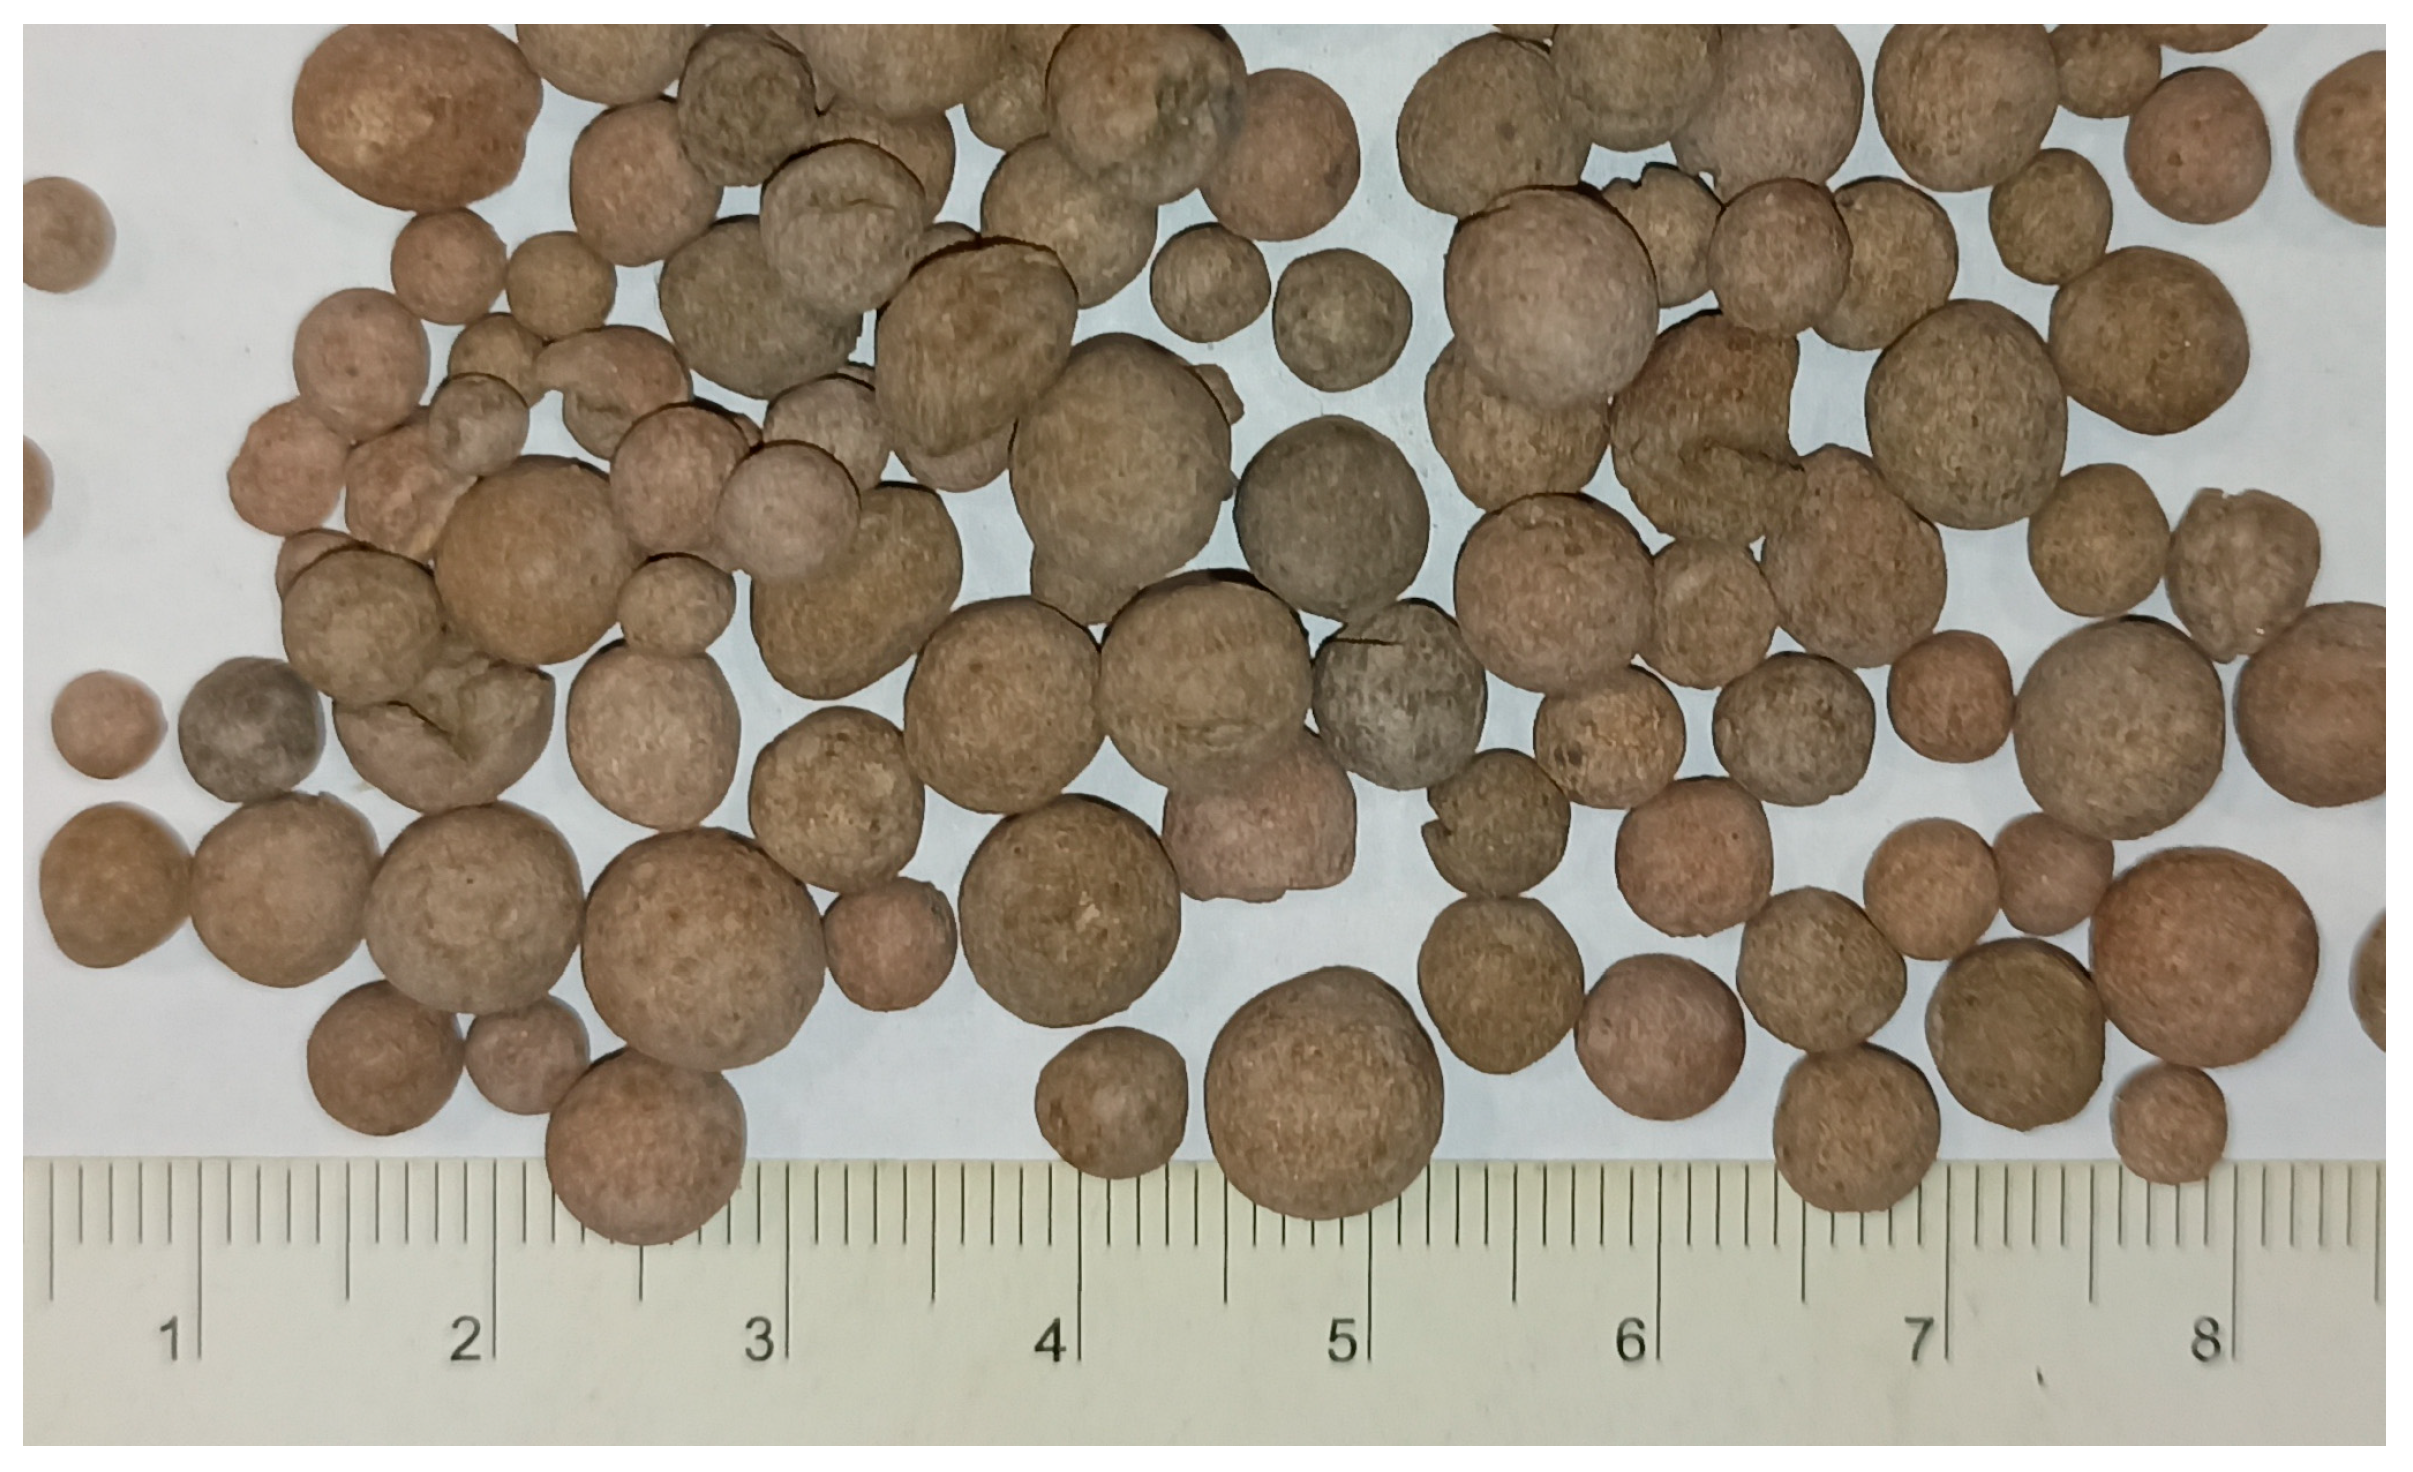
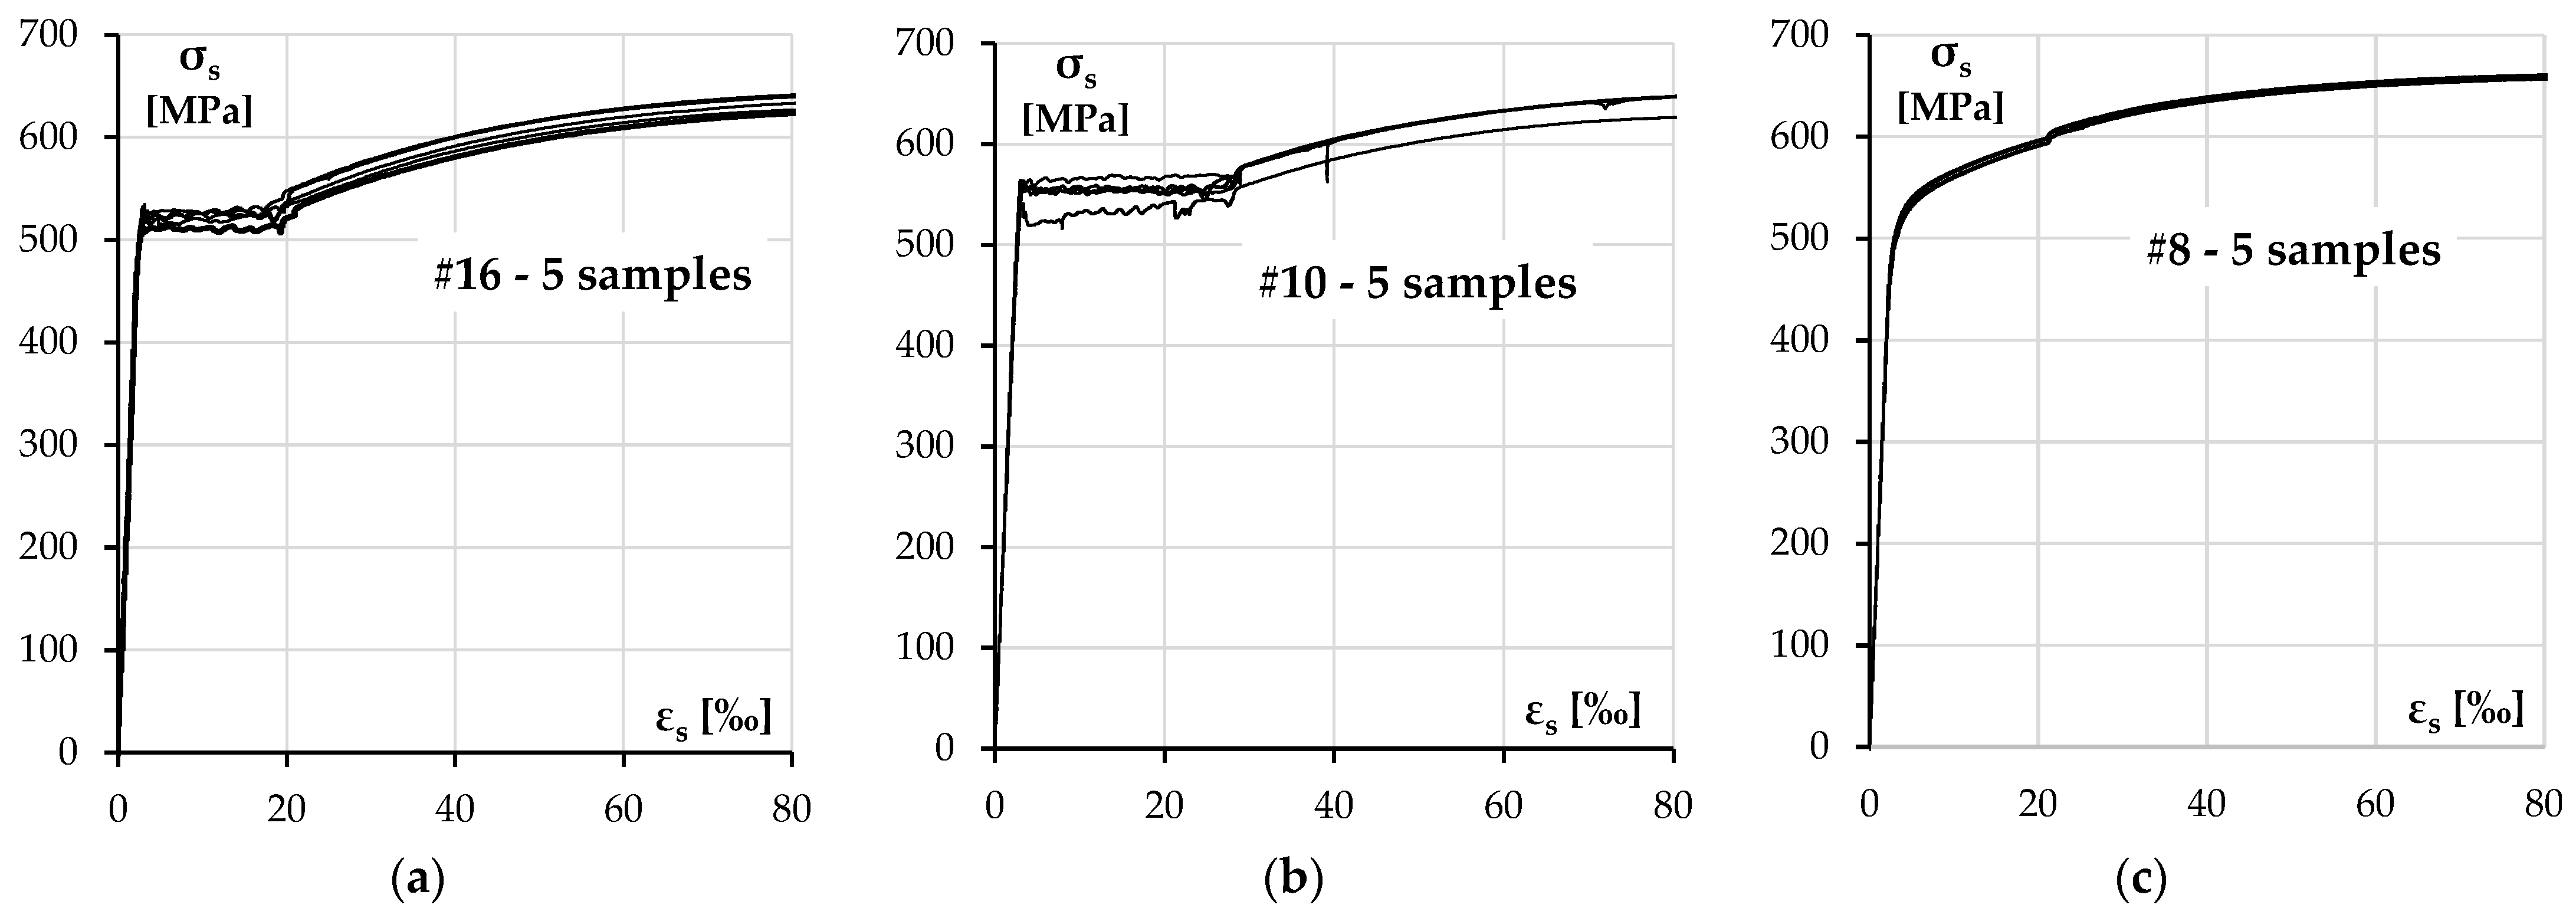
2.3. Materials
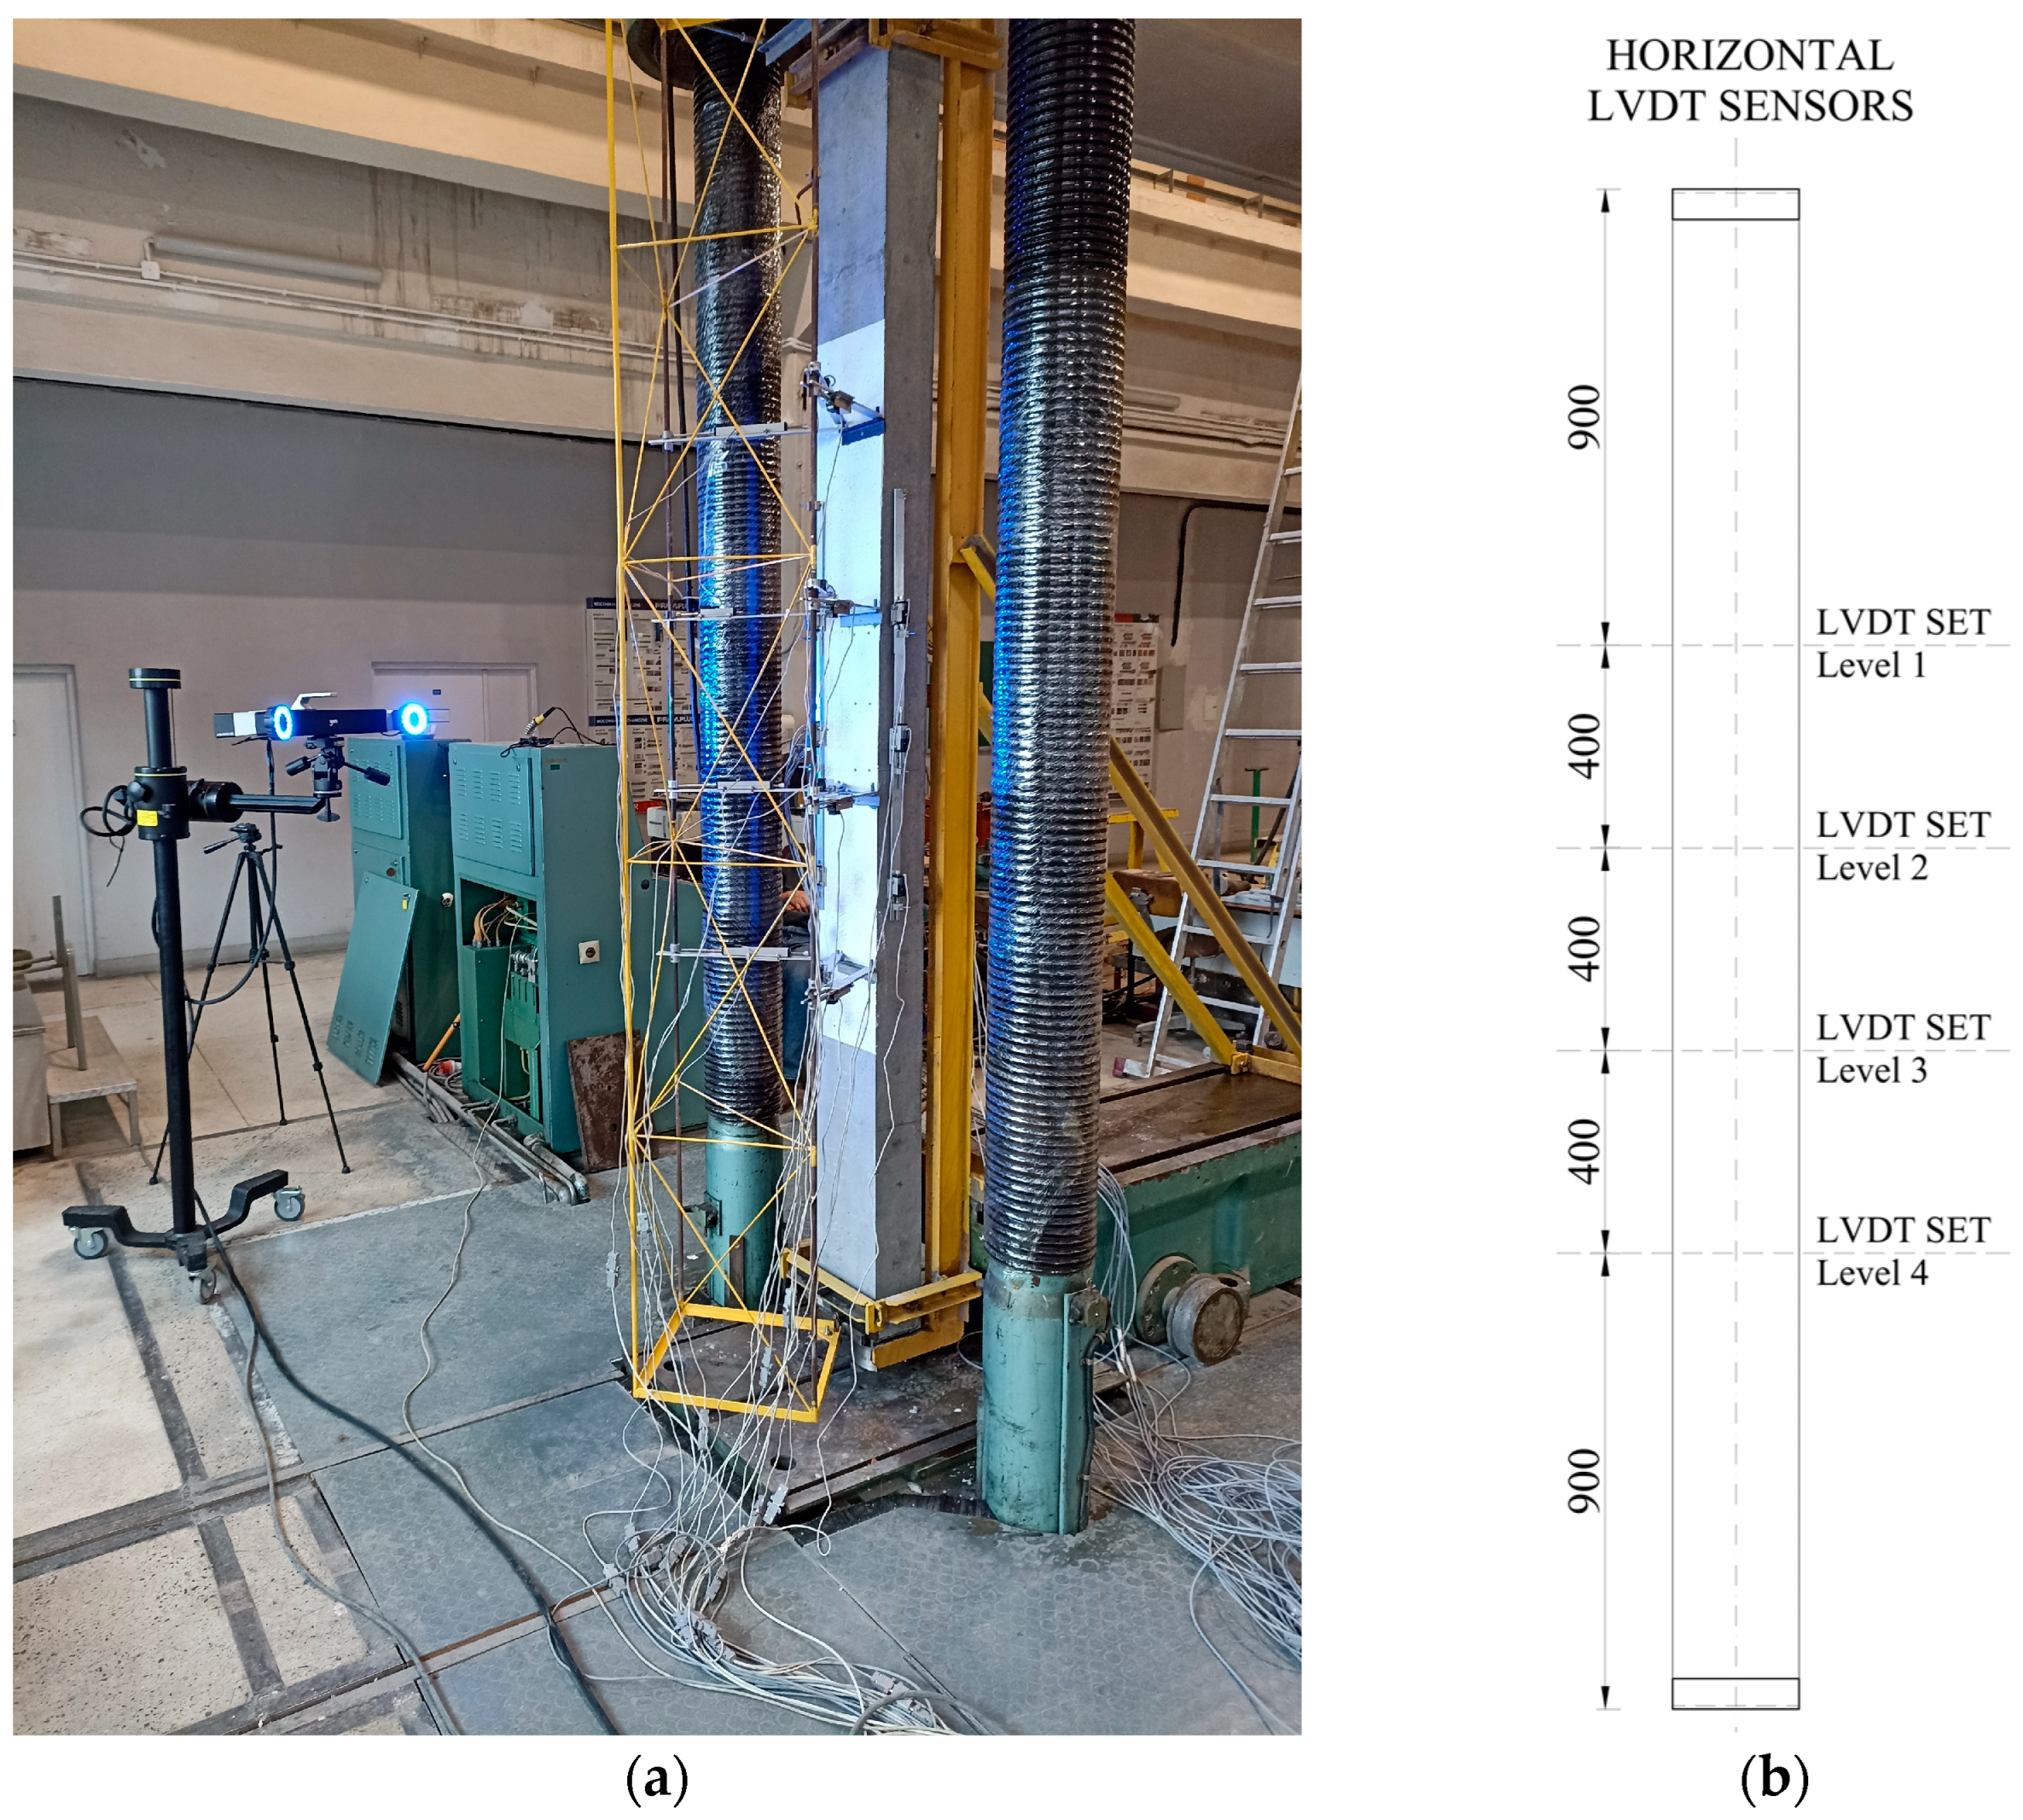
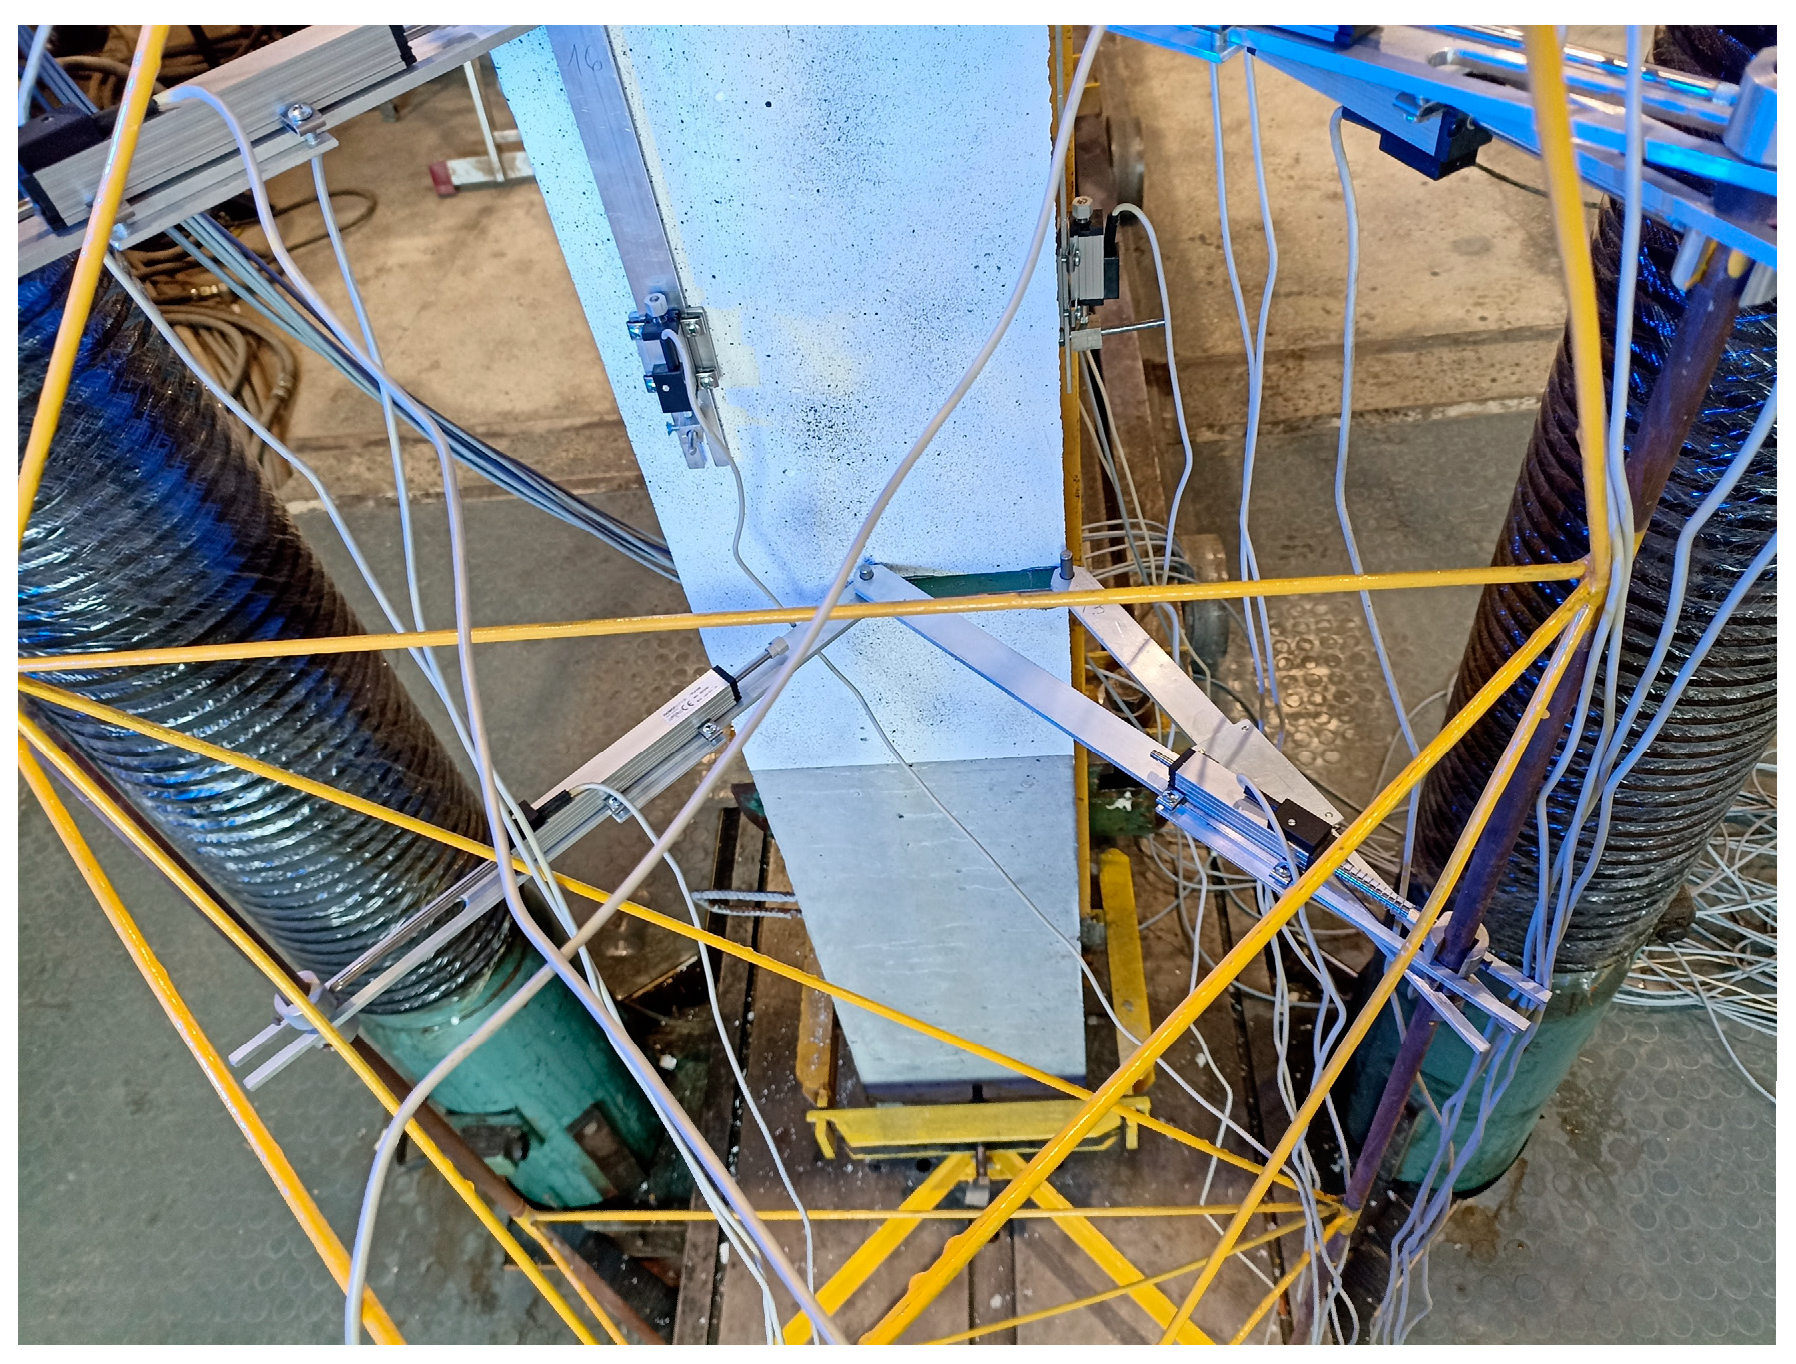
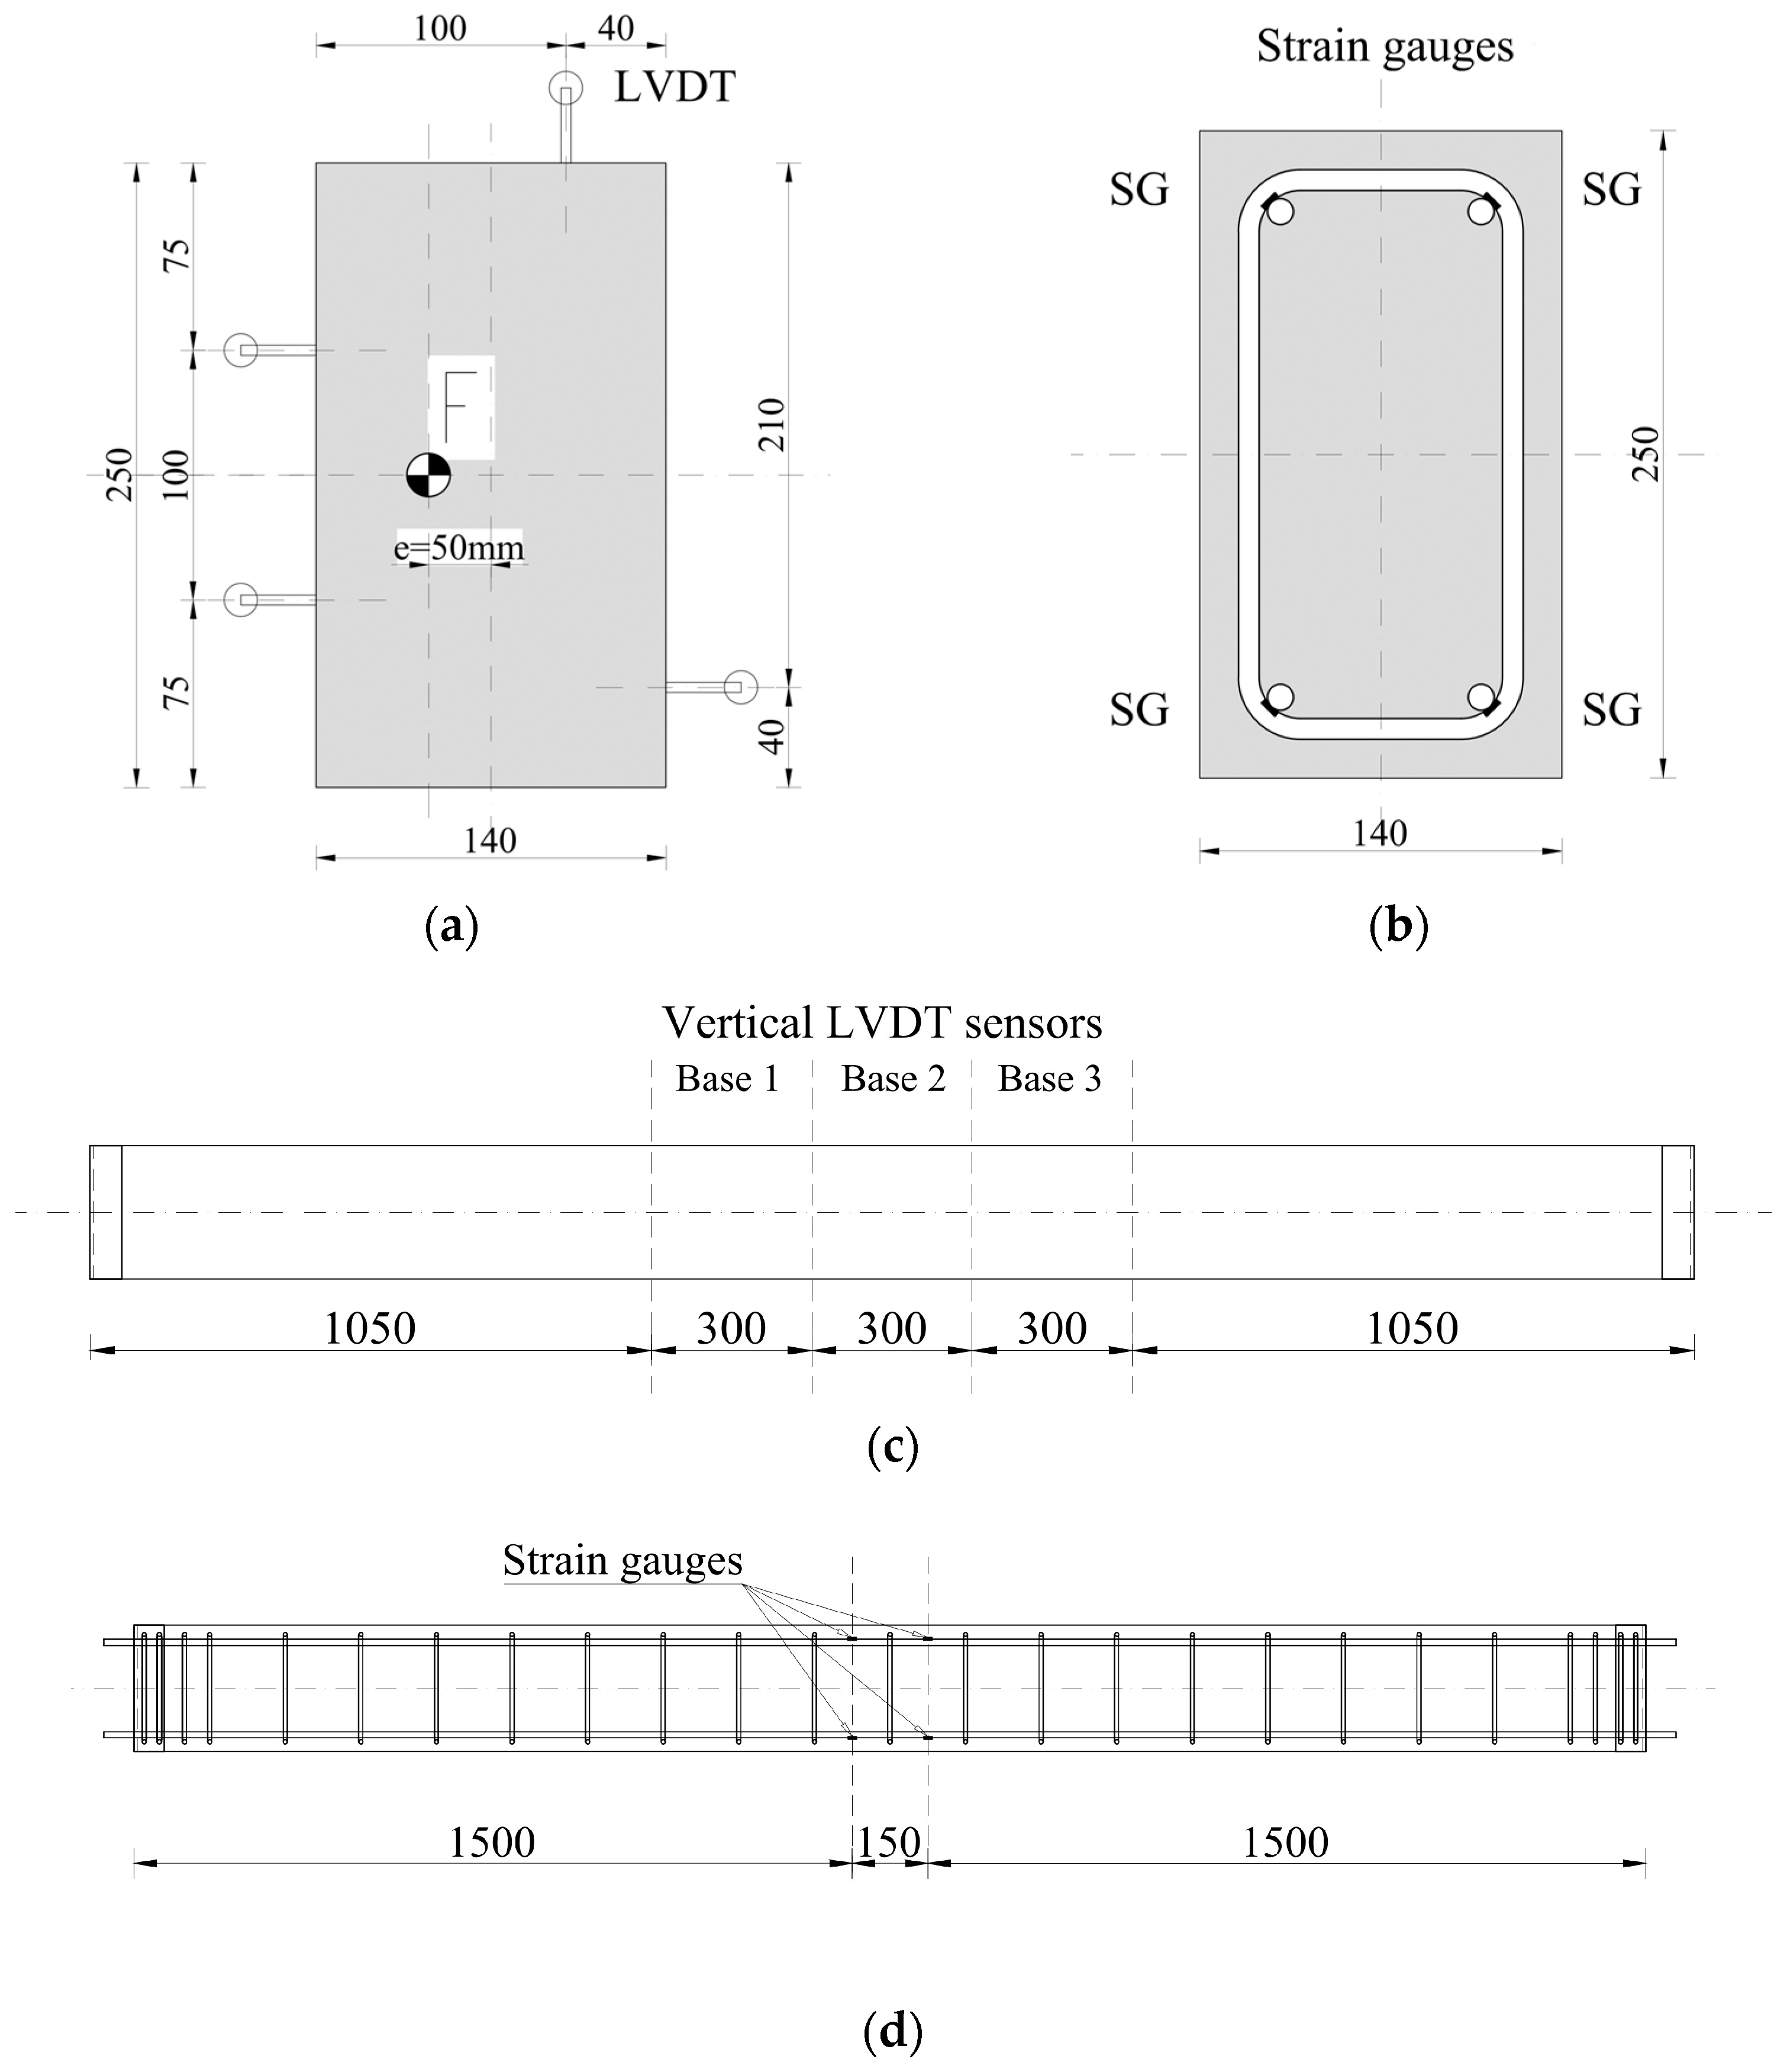
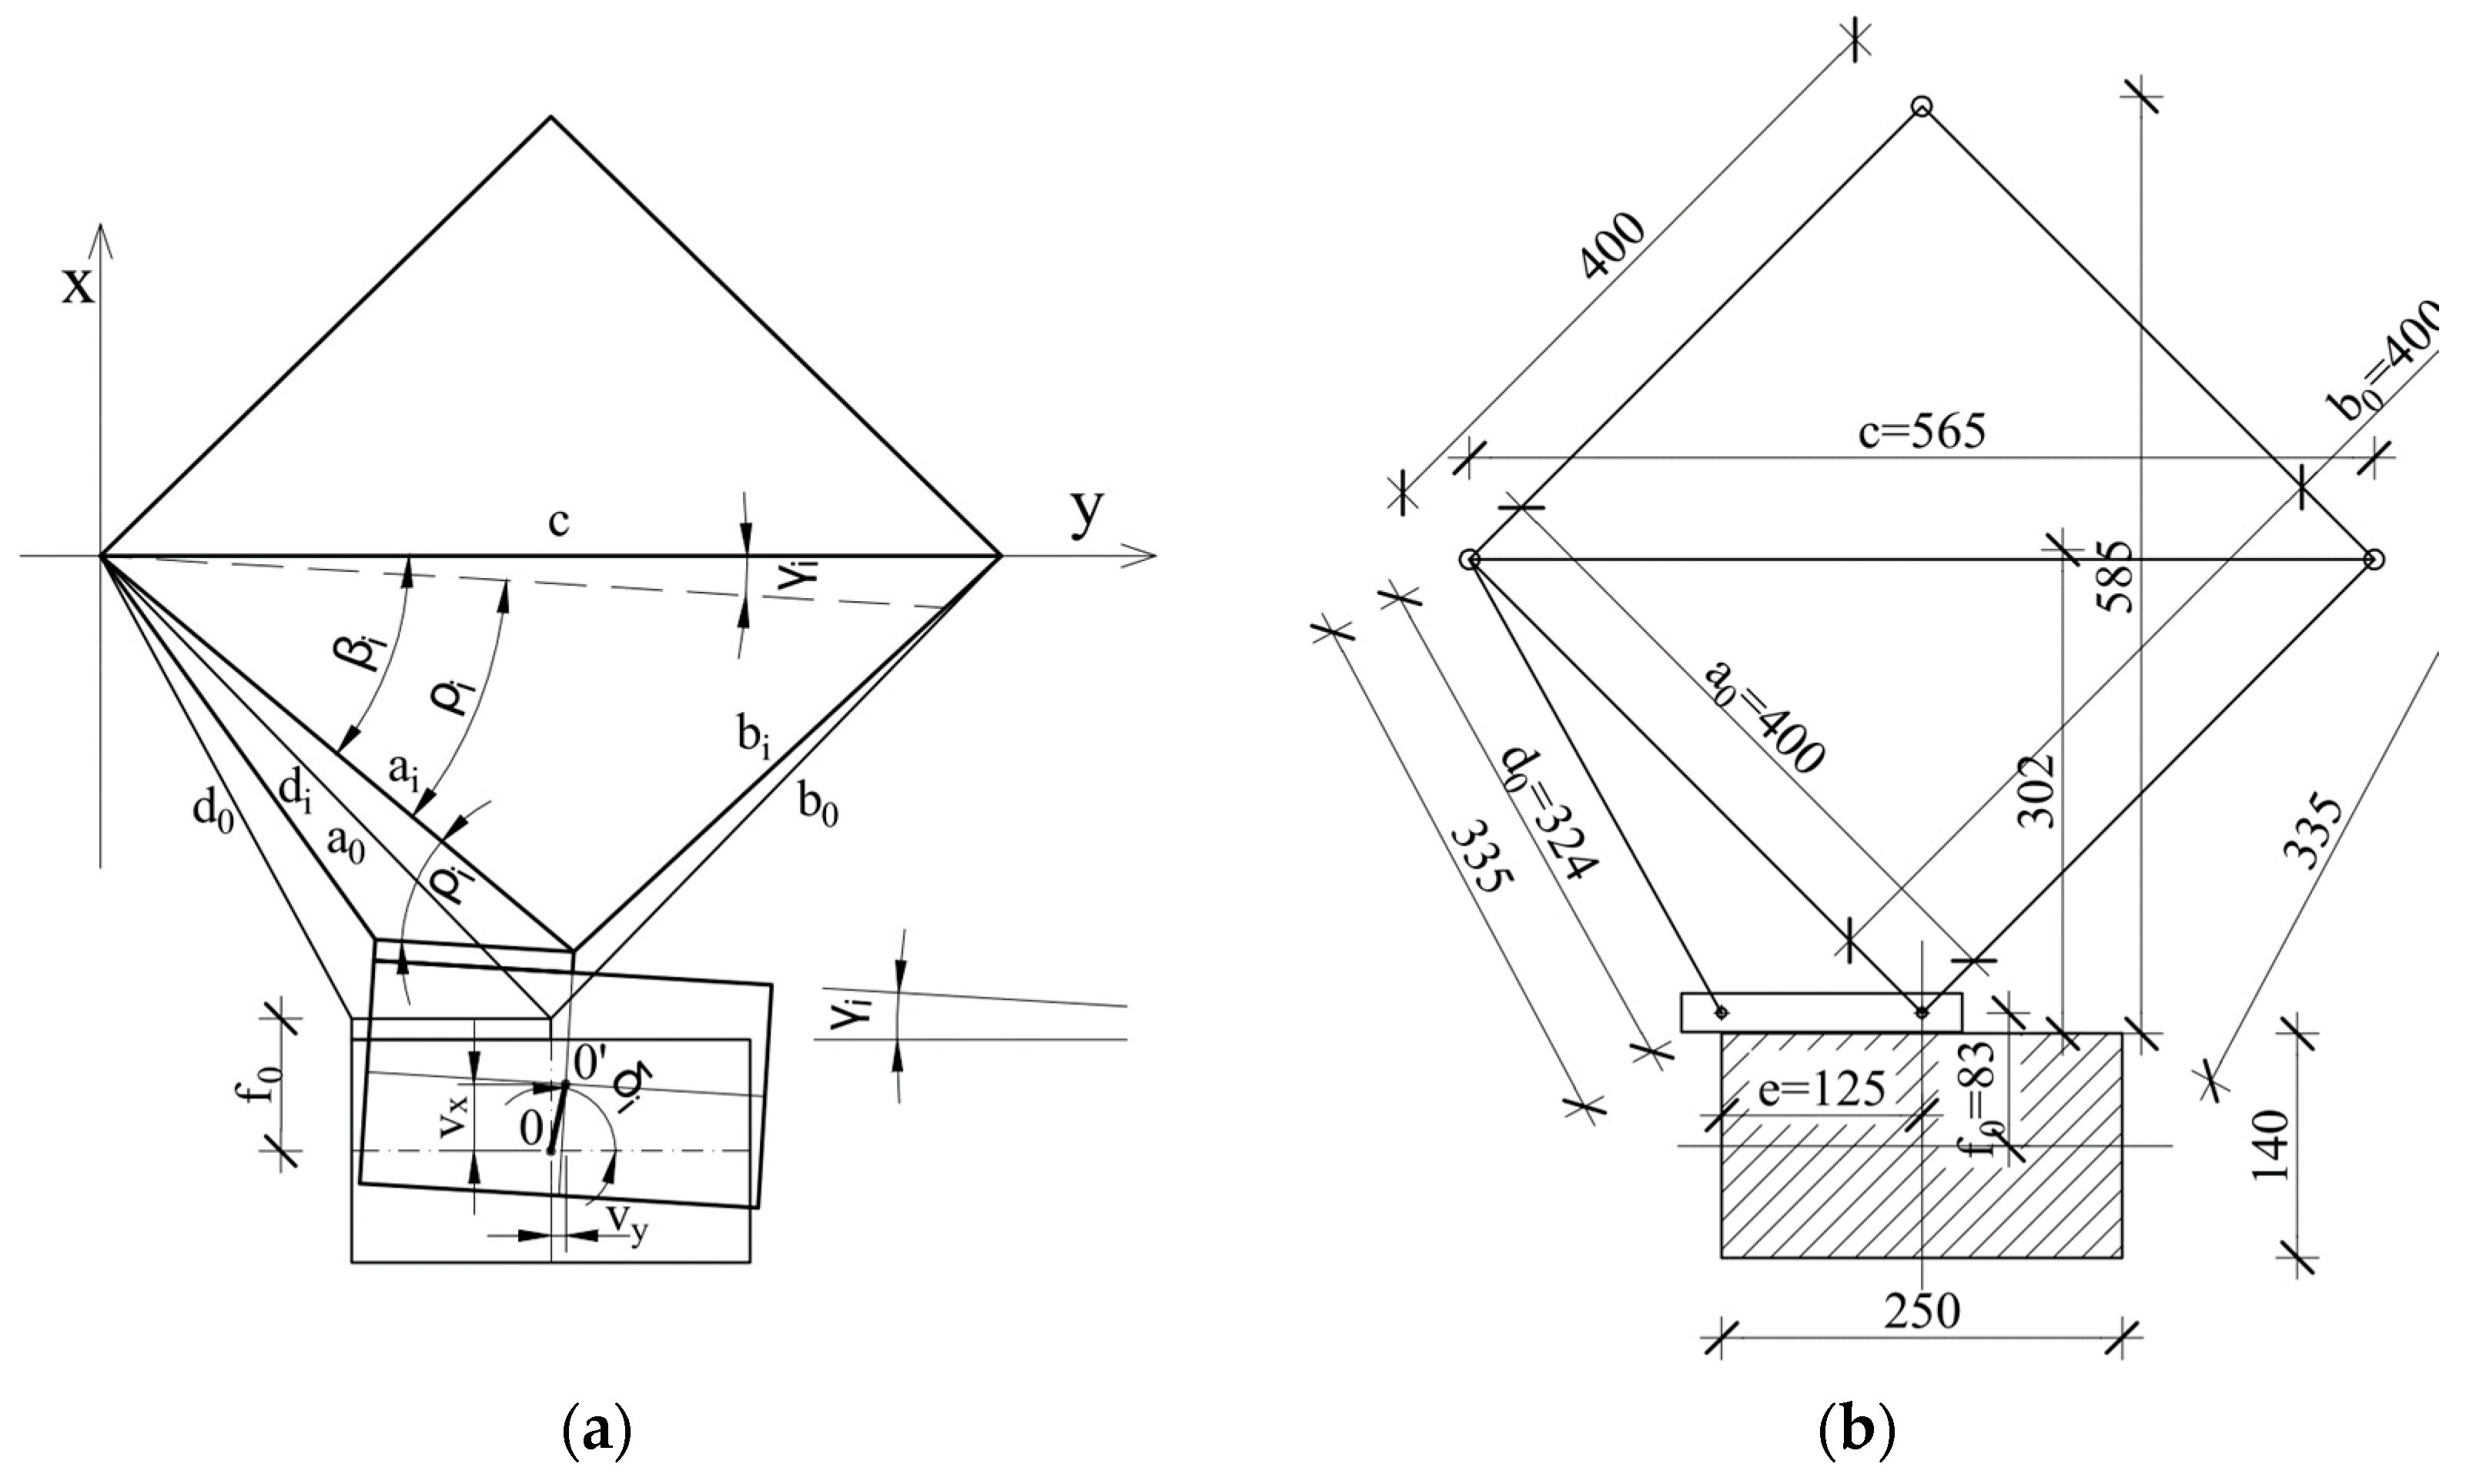
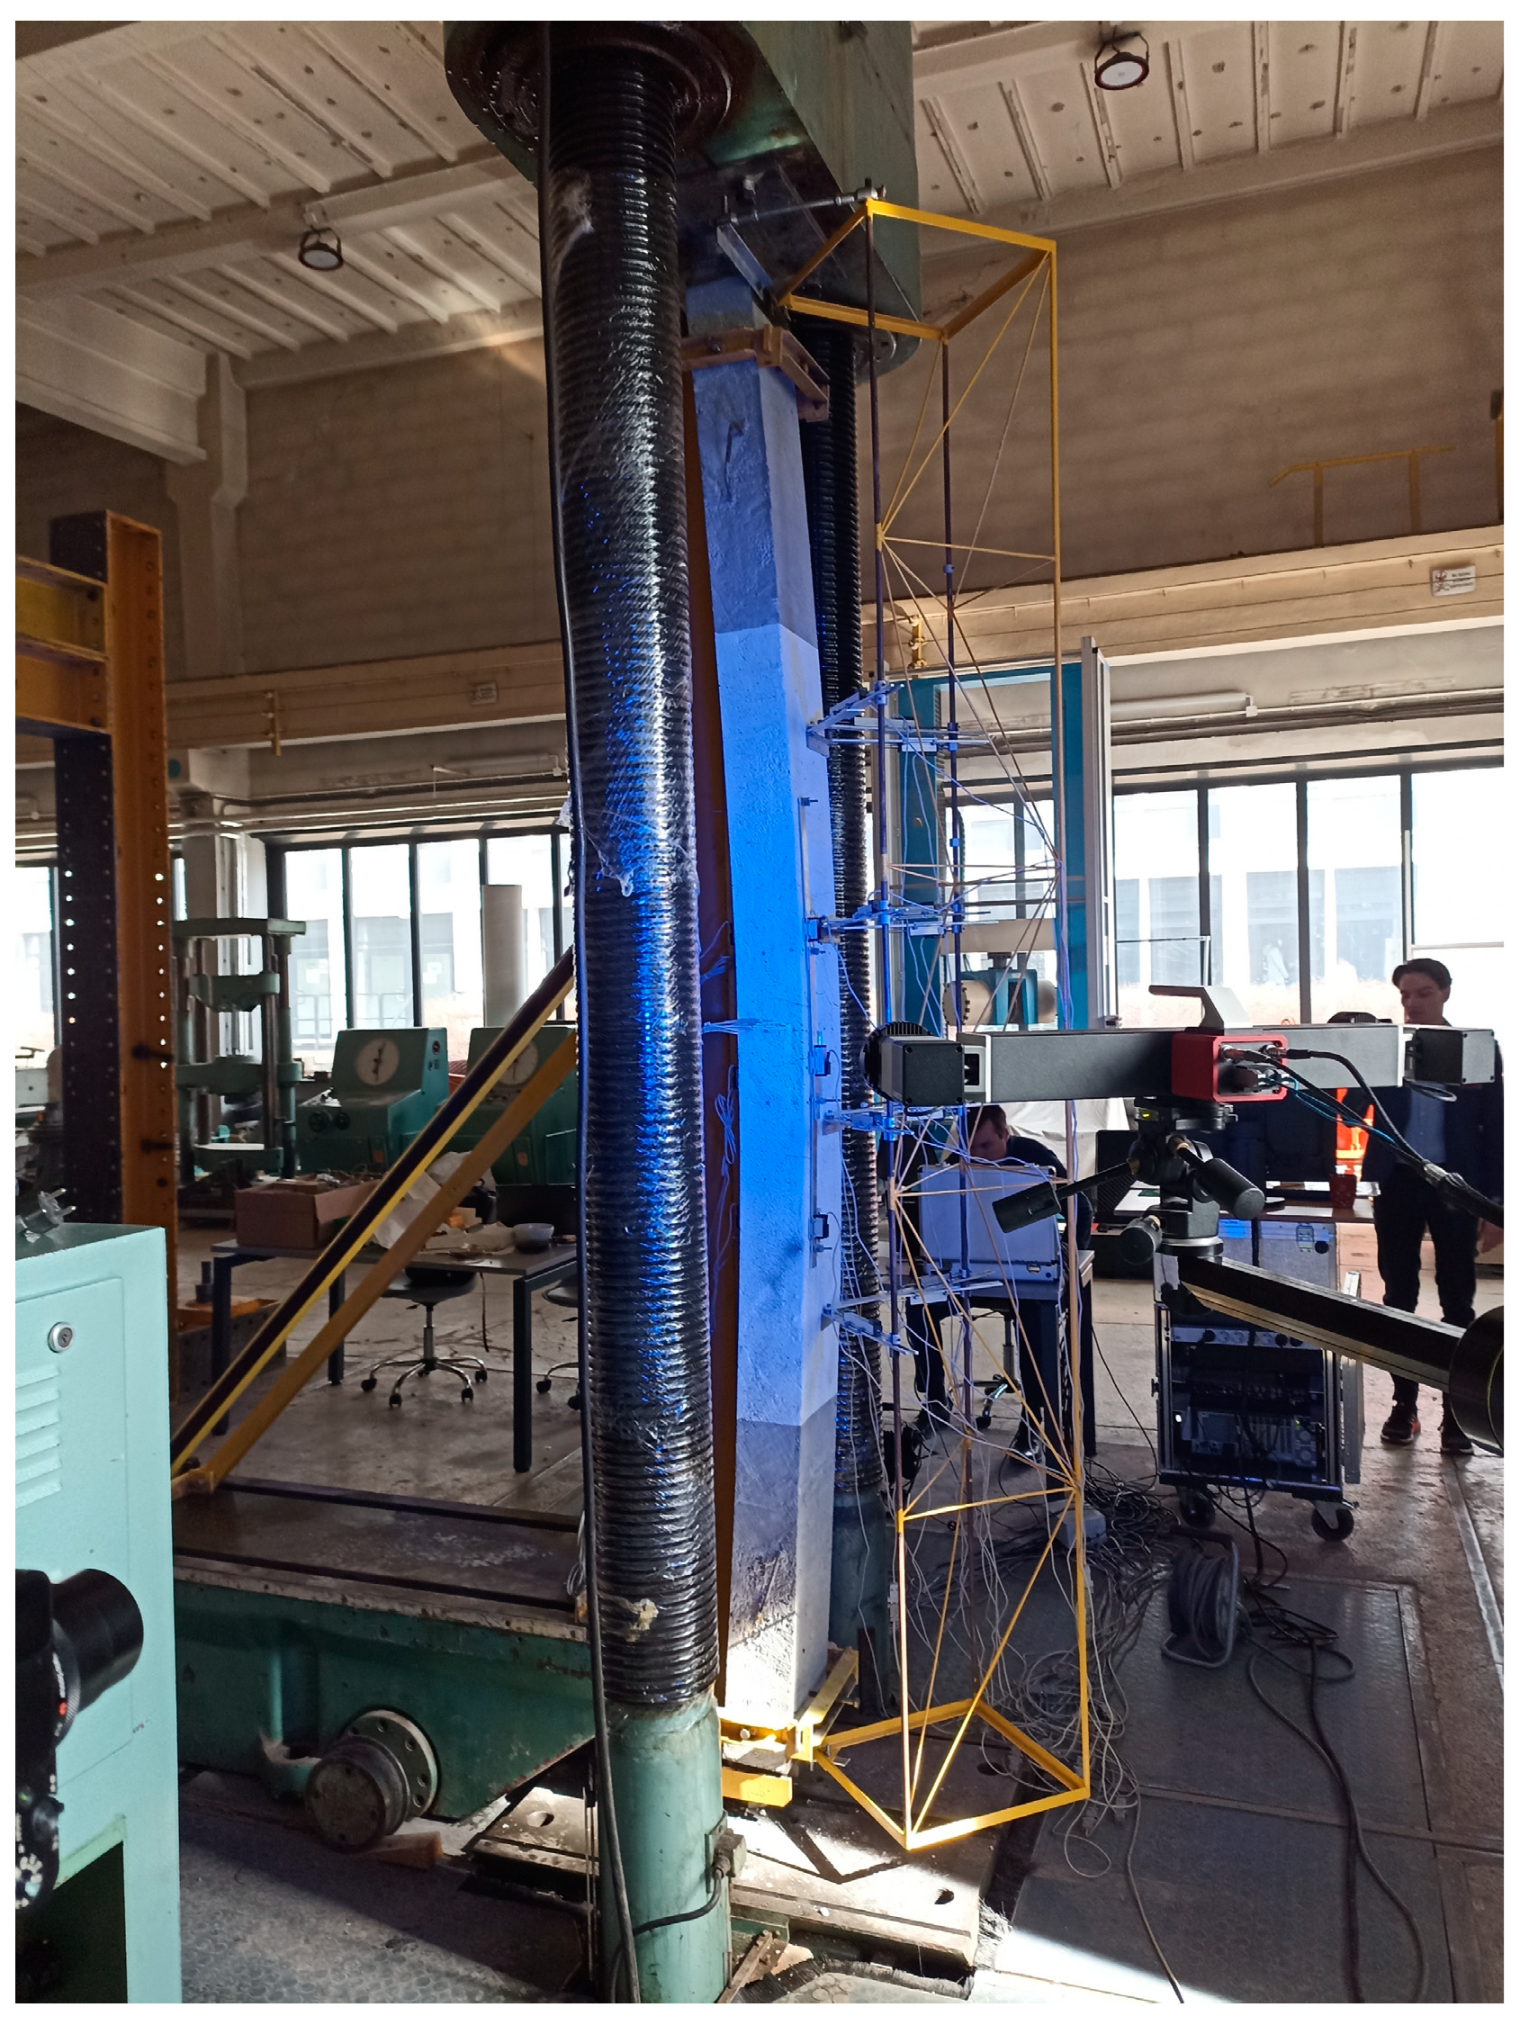
2.4. Test Stand and Measurement Instrumentation
2.5. Loading Procedure and Measurement Methods
3. Results
3.1. Experimental Results
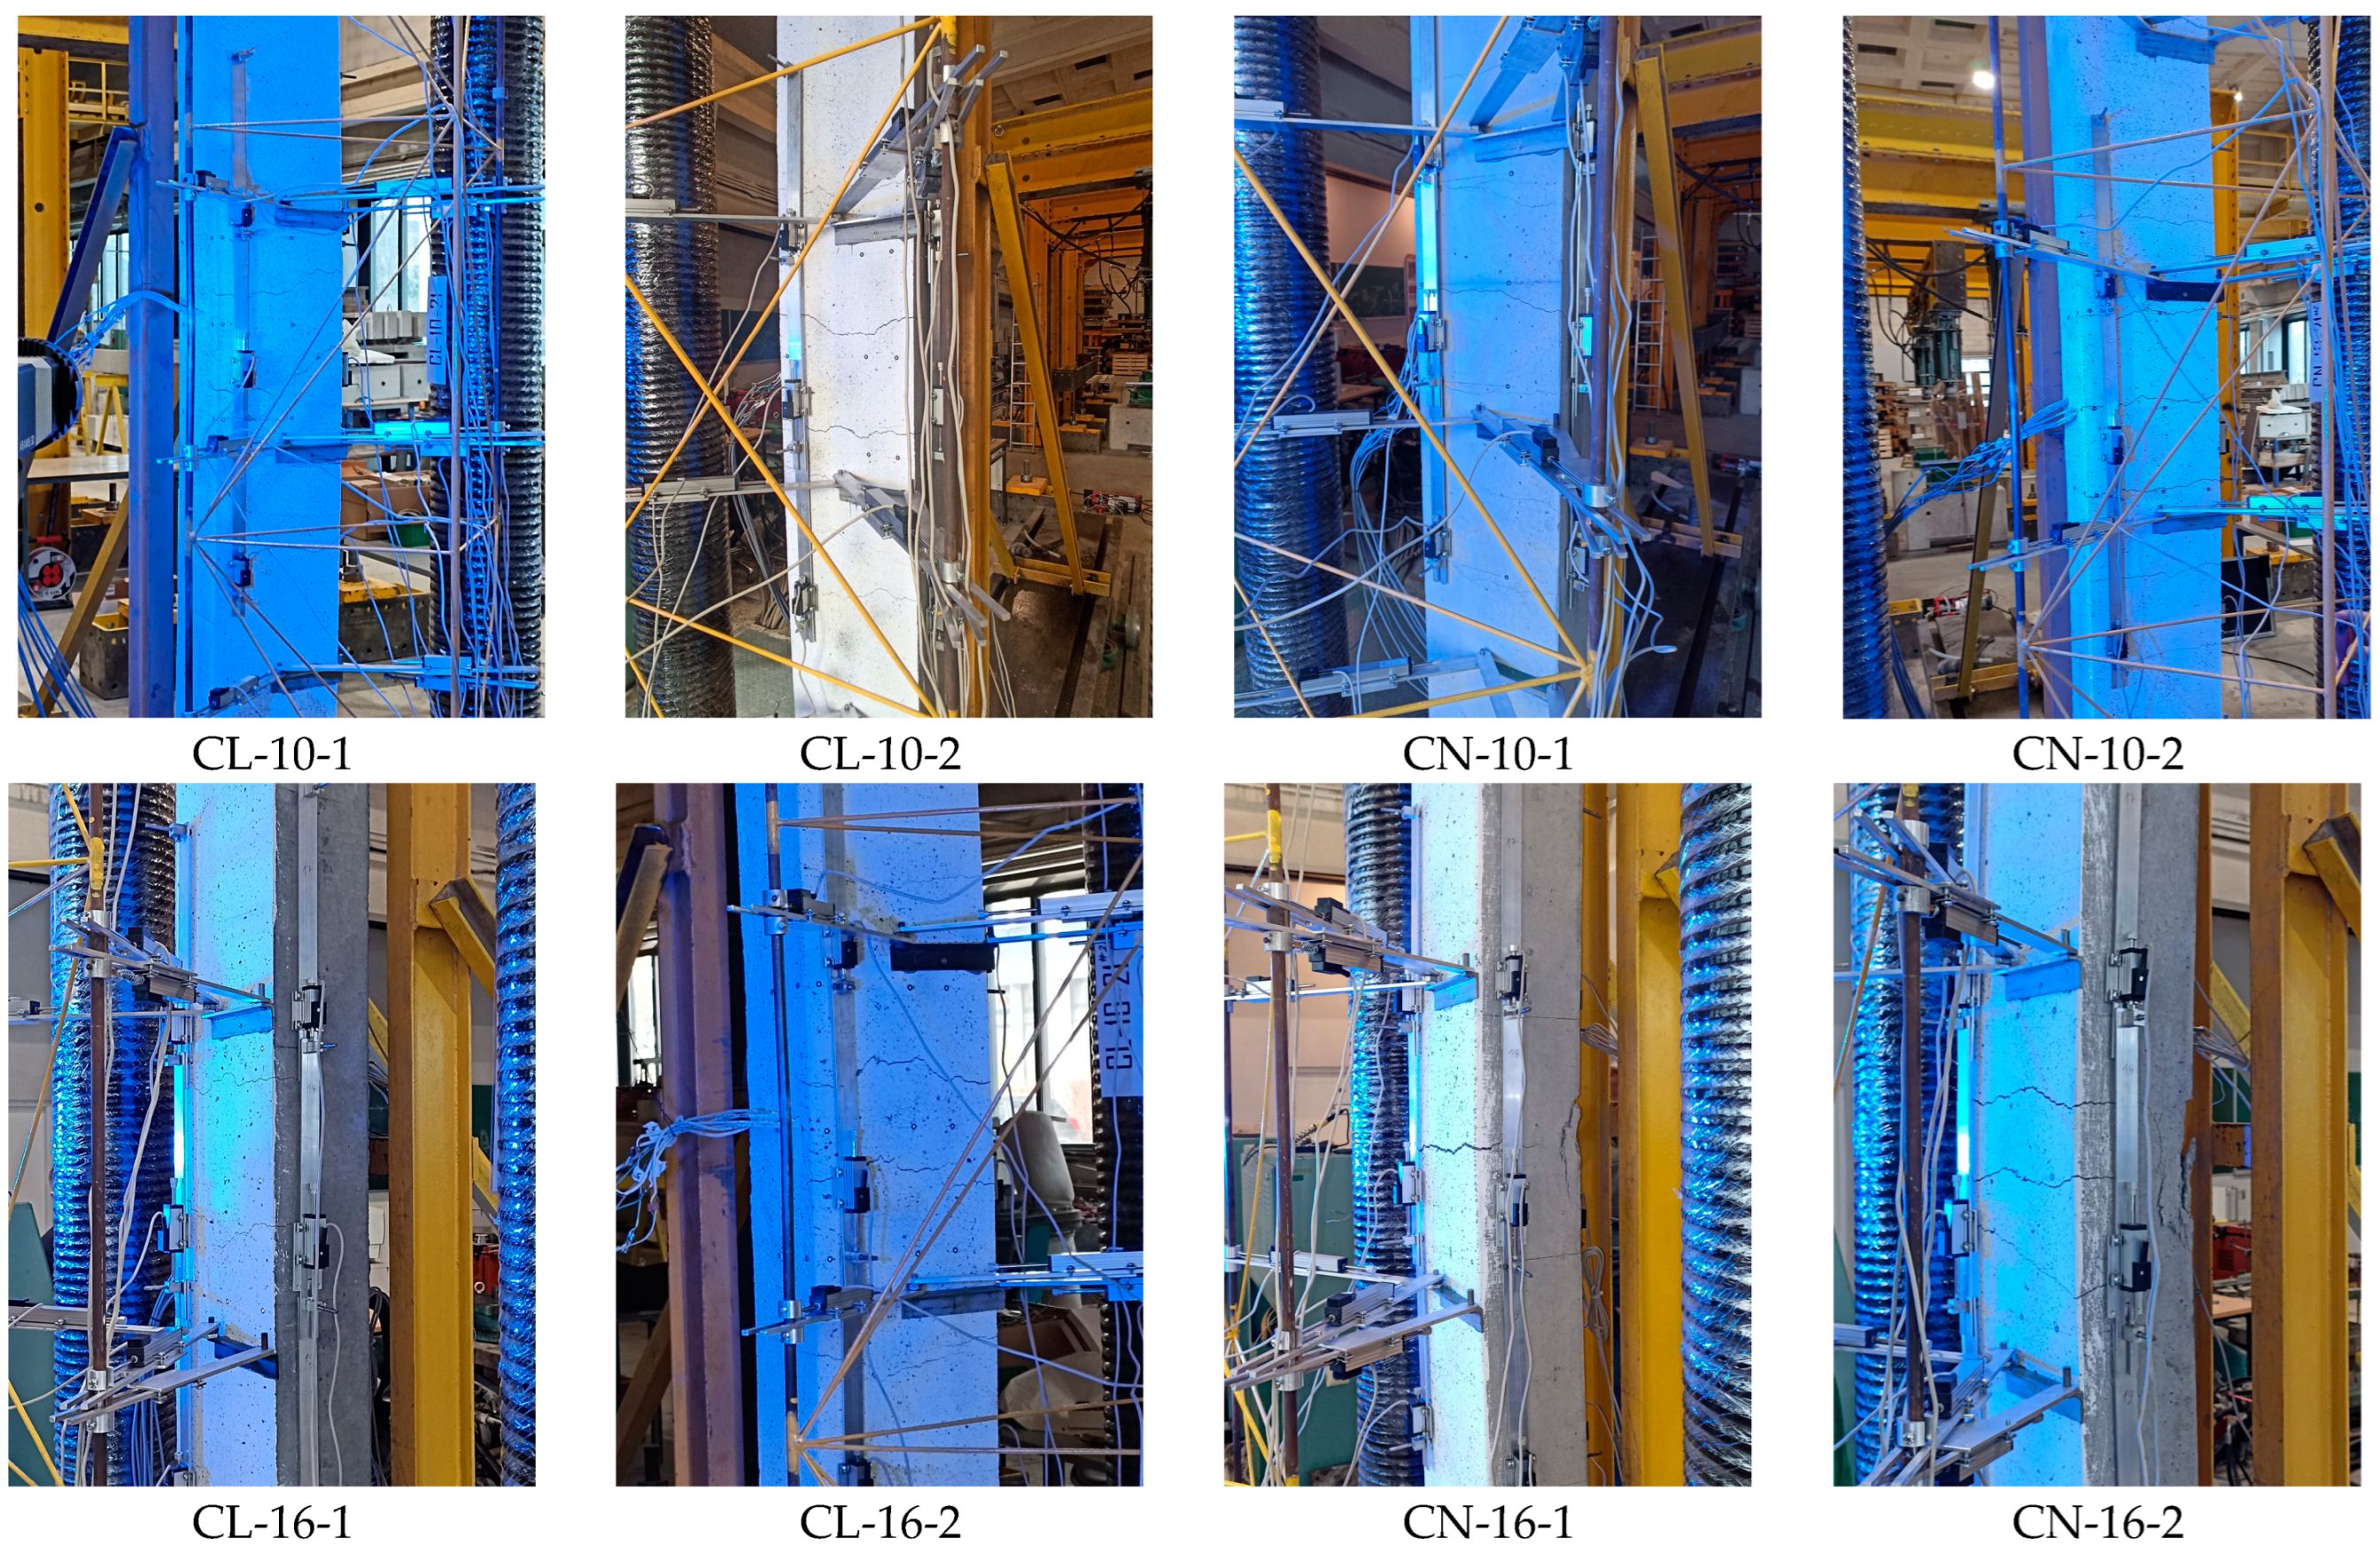
3.1.1. Failure Mode
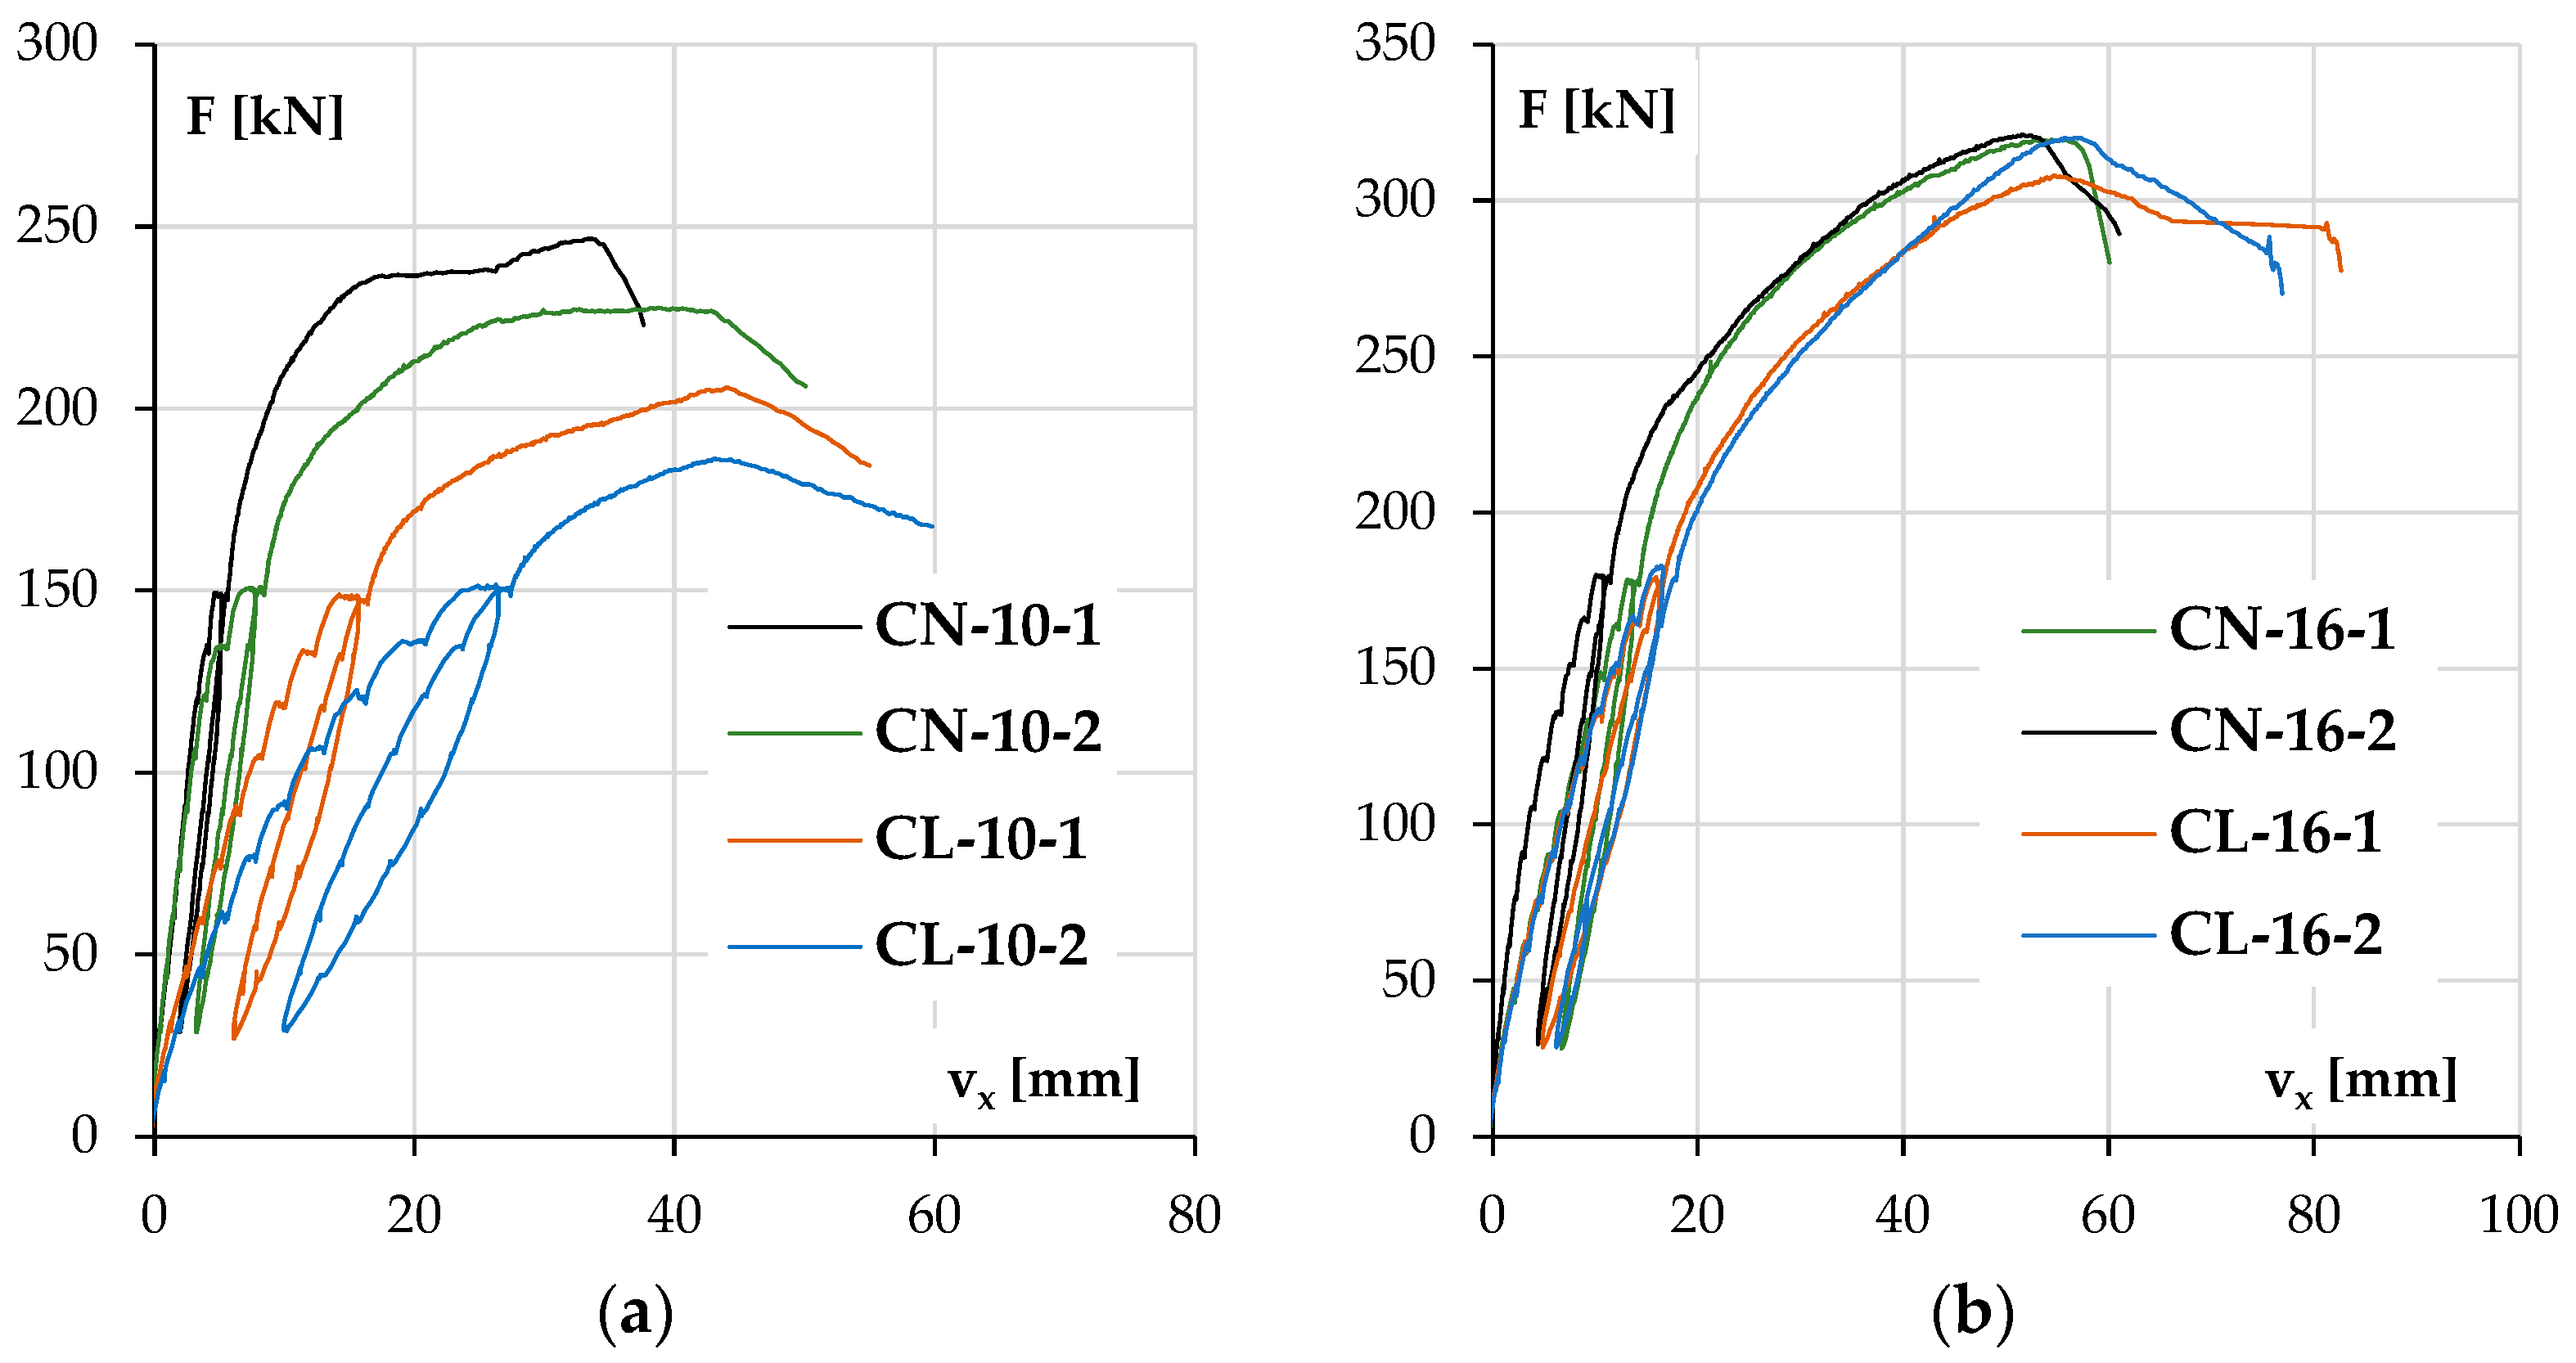
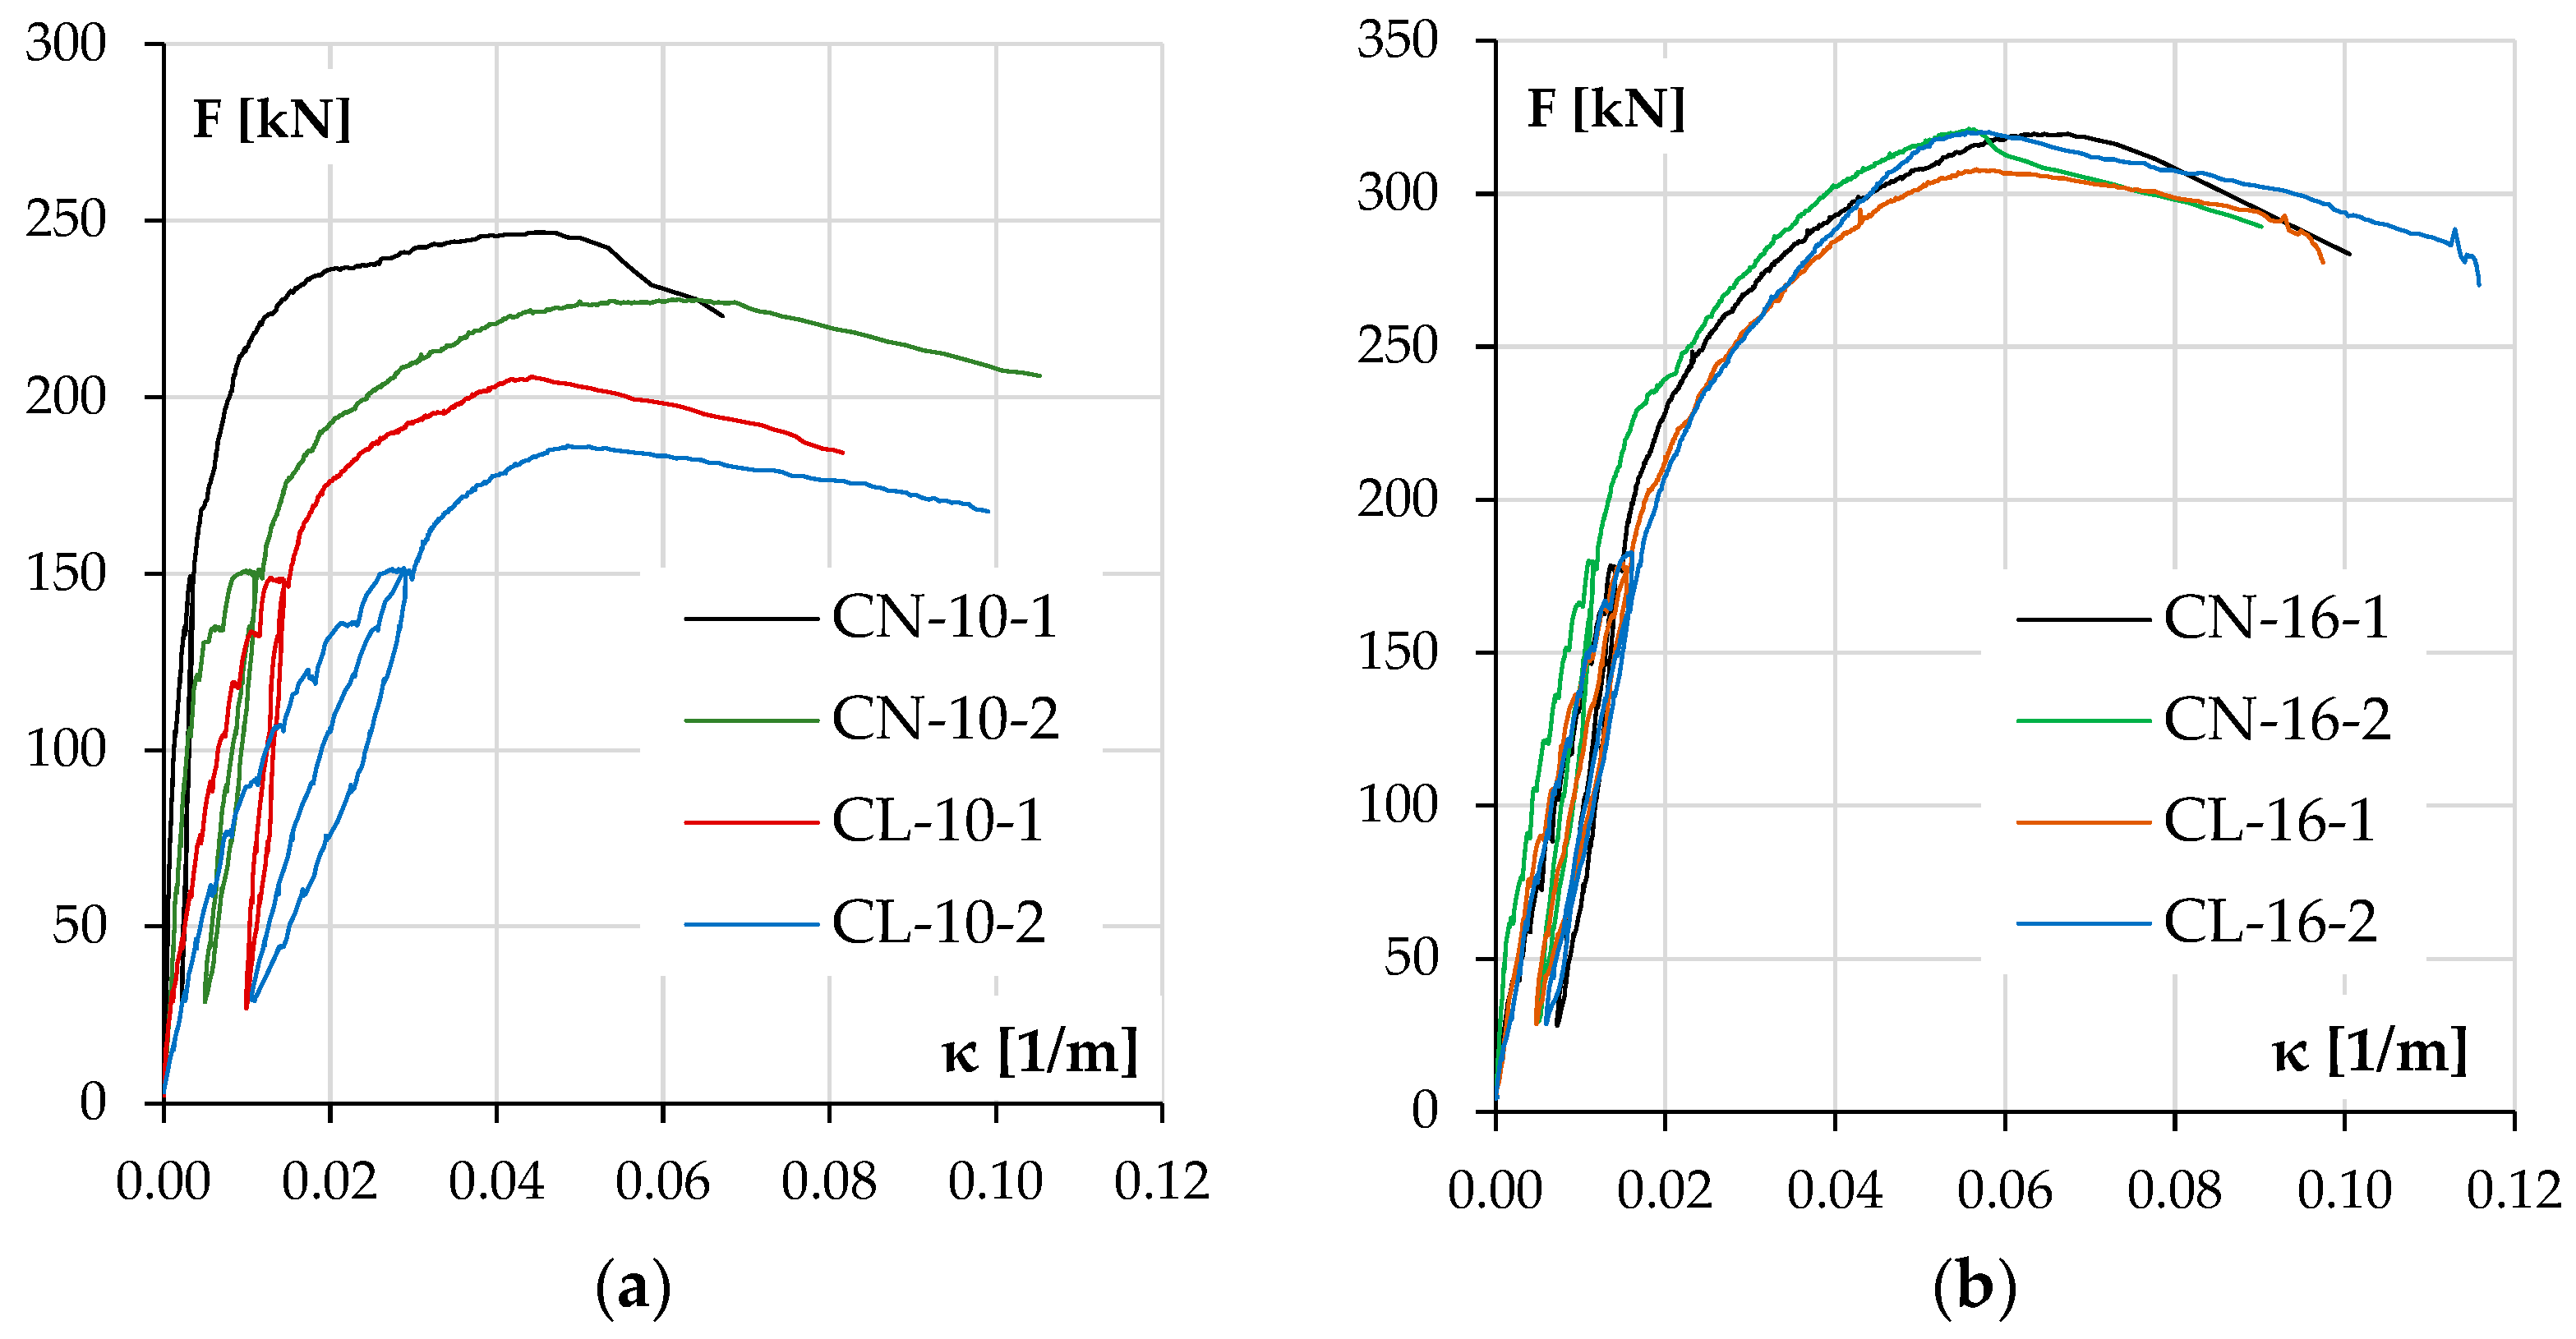
3.1.2. Ultimate Load and Deflection
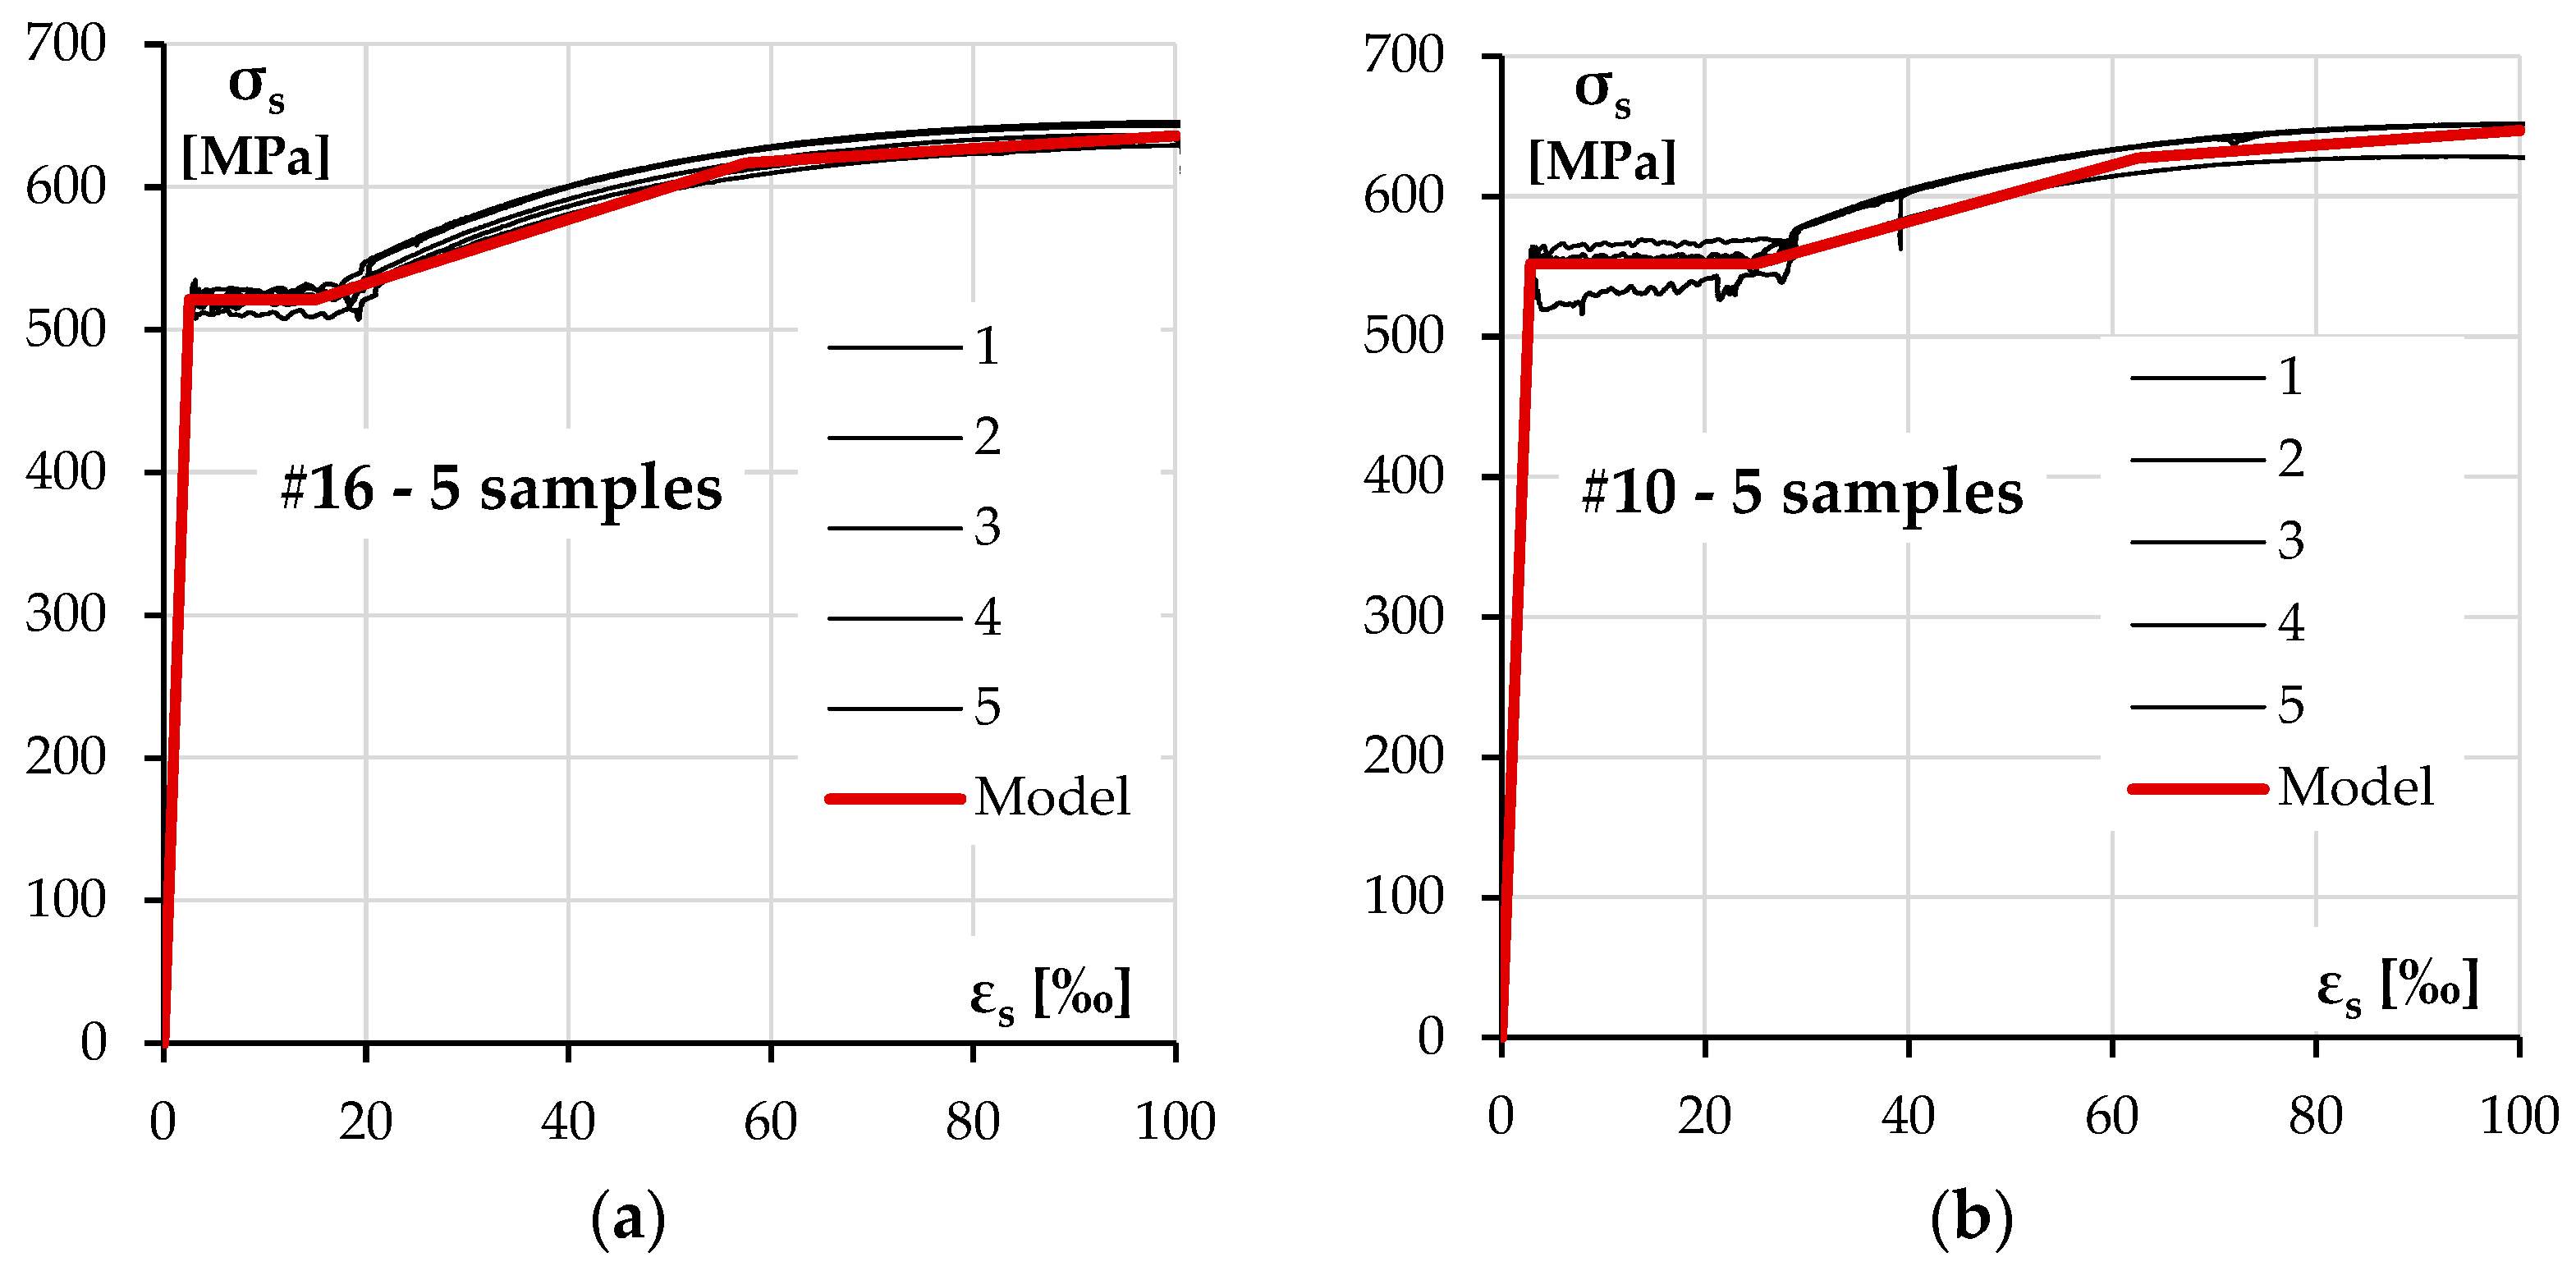
3.1.3. Concrete and Steel Strain

| Column | Strain Results at Maximum Force Fu | |||
|---|---|---|---|---|
| vxu | εc | εs | κ | |
| m | ‰ | ‰ | 1/m | |
| CL-10-1 | 0.044 | 2.33 | −2.49 | 0.044 |
| CL-10-2 | 0.044 | 2.52 | −3.05 | 0.051 |
| CN-10-1 | 0.034 | 1.74 | −3.21 | 0.045 |
| CN-10-2 | 0.039 | 1.56 | −5.17 | 0.062 |
| CL-16-1 | 0.054 | 3.02 | −3.02 | 0.056 |
| CL-16-2 | 0.057 | 3.30 | −2.92 | 0.058 |
| CN-16-1 | 0.056 | 3.07 | −4.14 | 0.067 |
| CN-16-2 | 0.052 | 2.89 | −3.07 | 0.056 |
3.2. Column Modeling
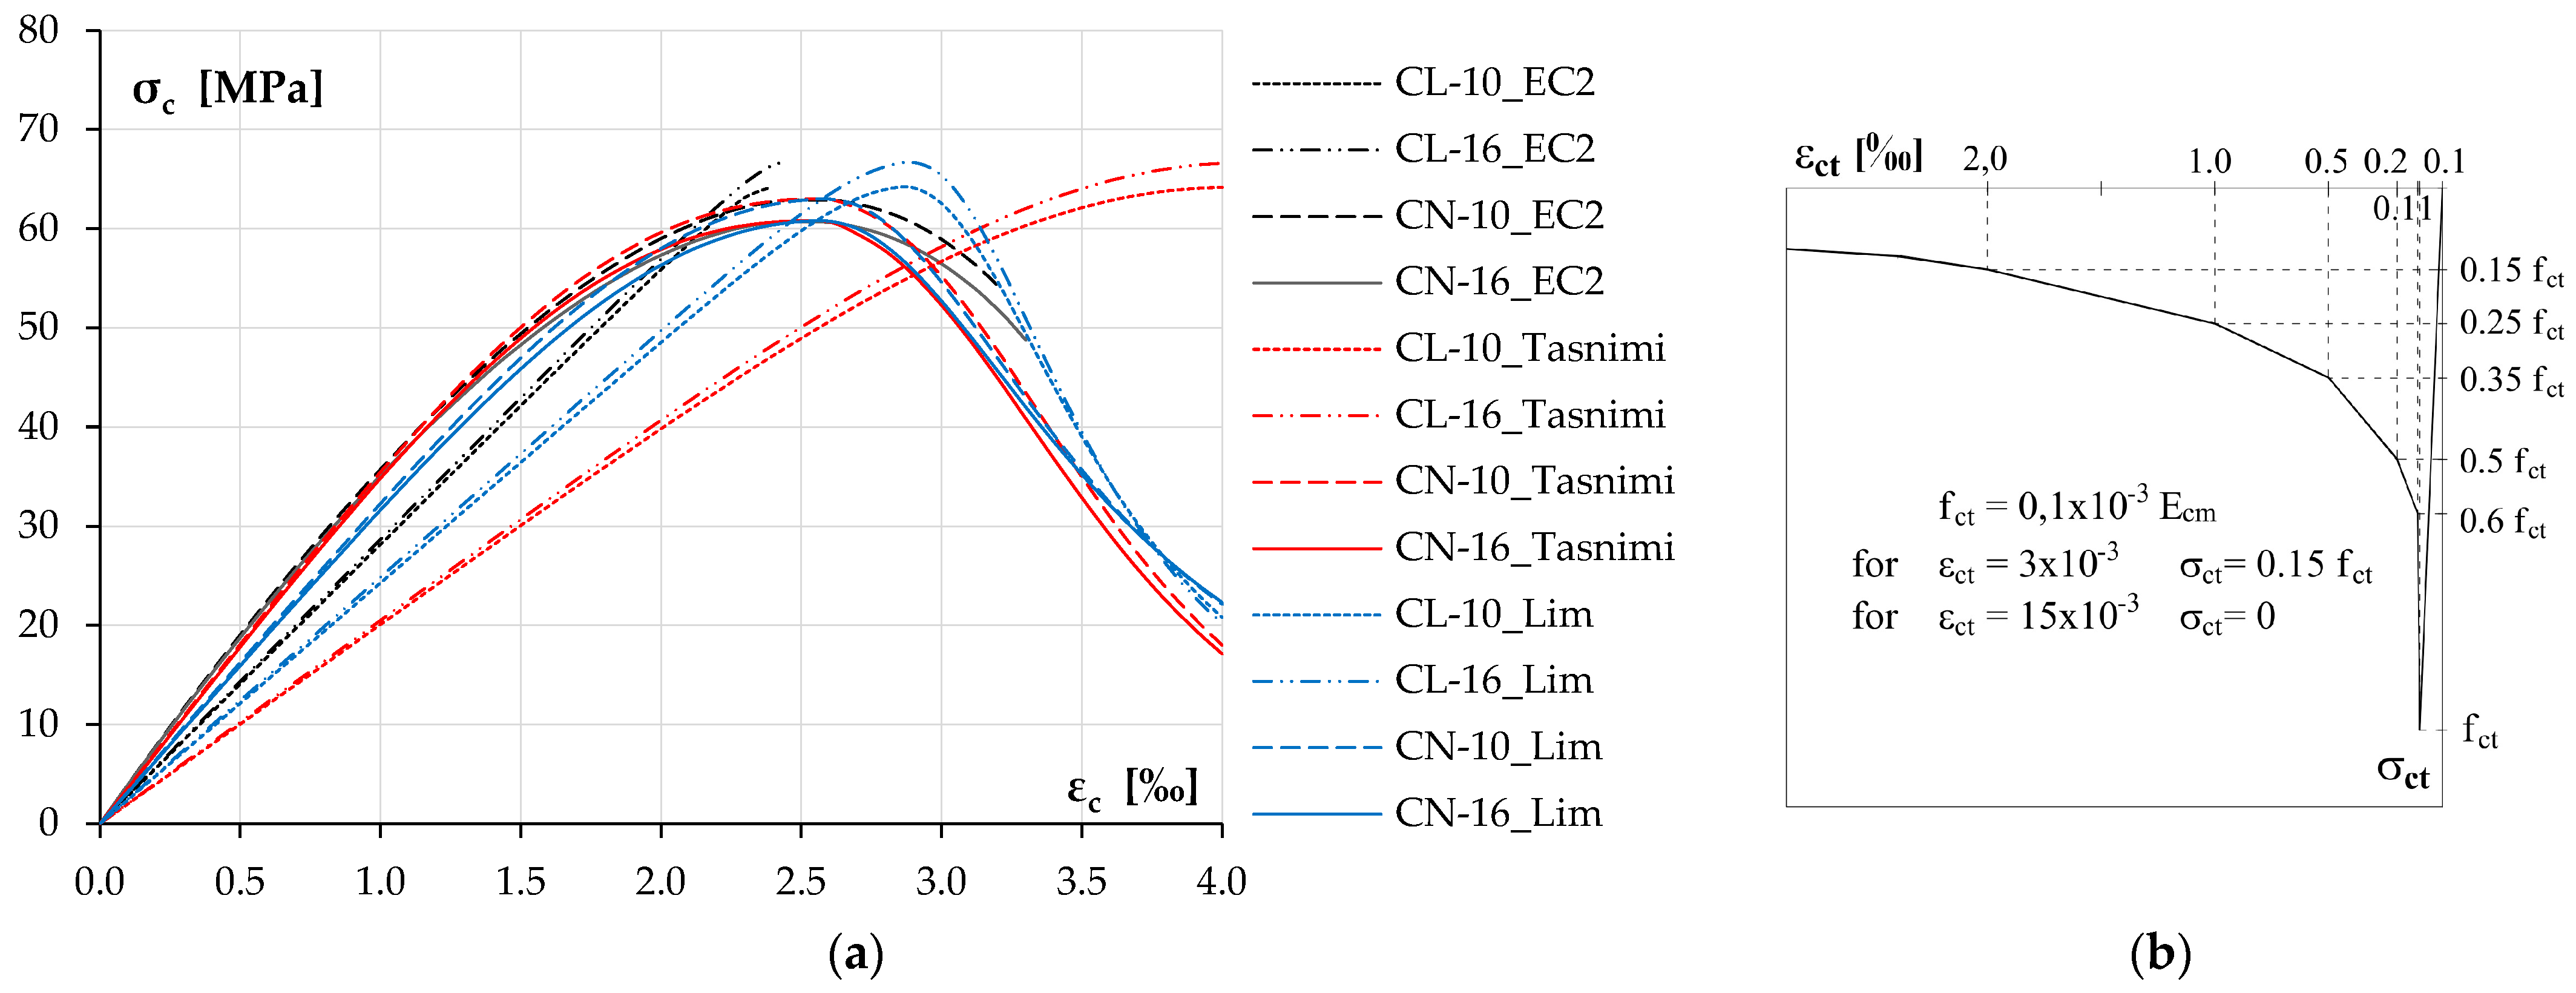
3.2.1. Numerical Model
| EC 2 [18] | Lim 2014 [31] | Tasnimi 2004 [32] |
|---|---|---|
| Model | ||
[30] | ||
| NWAC | ||
| LWAC | ||
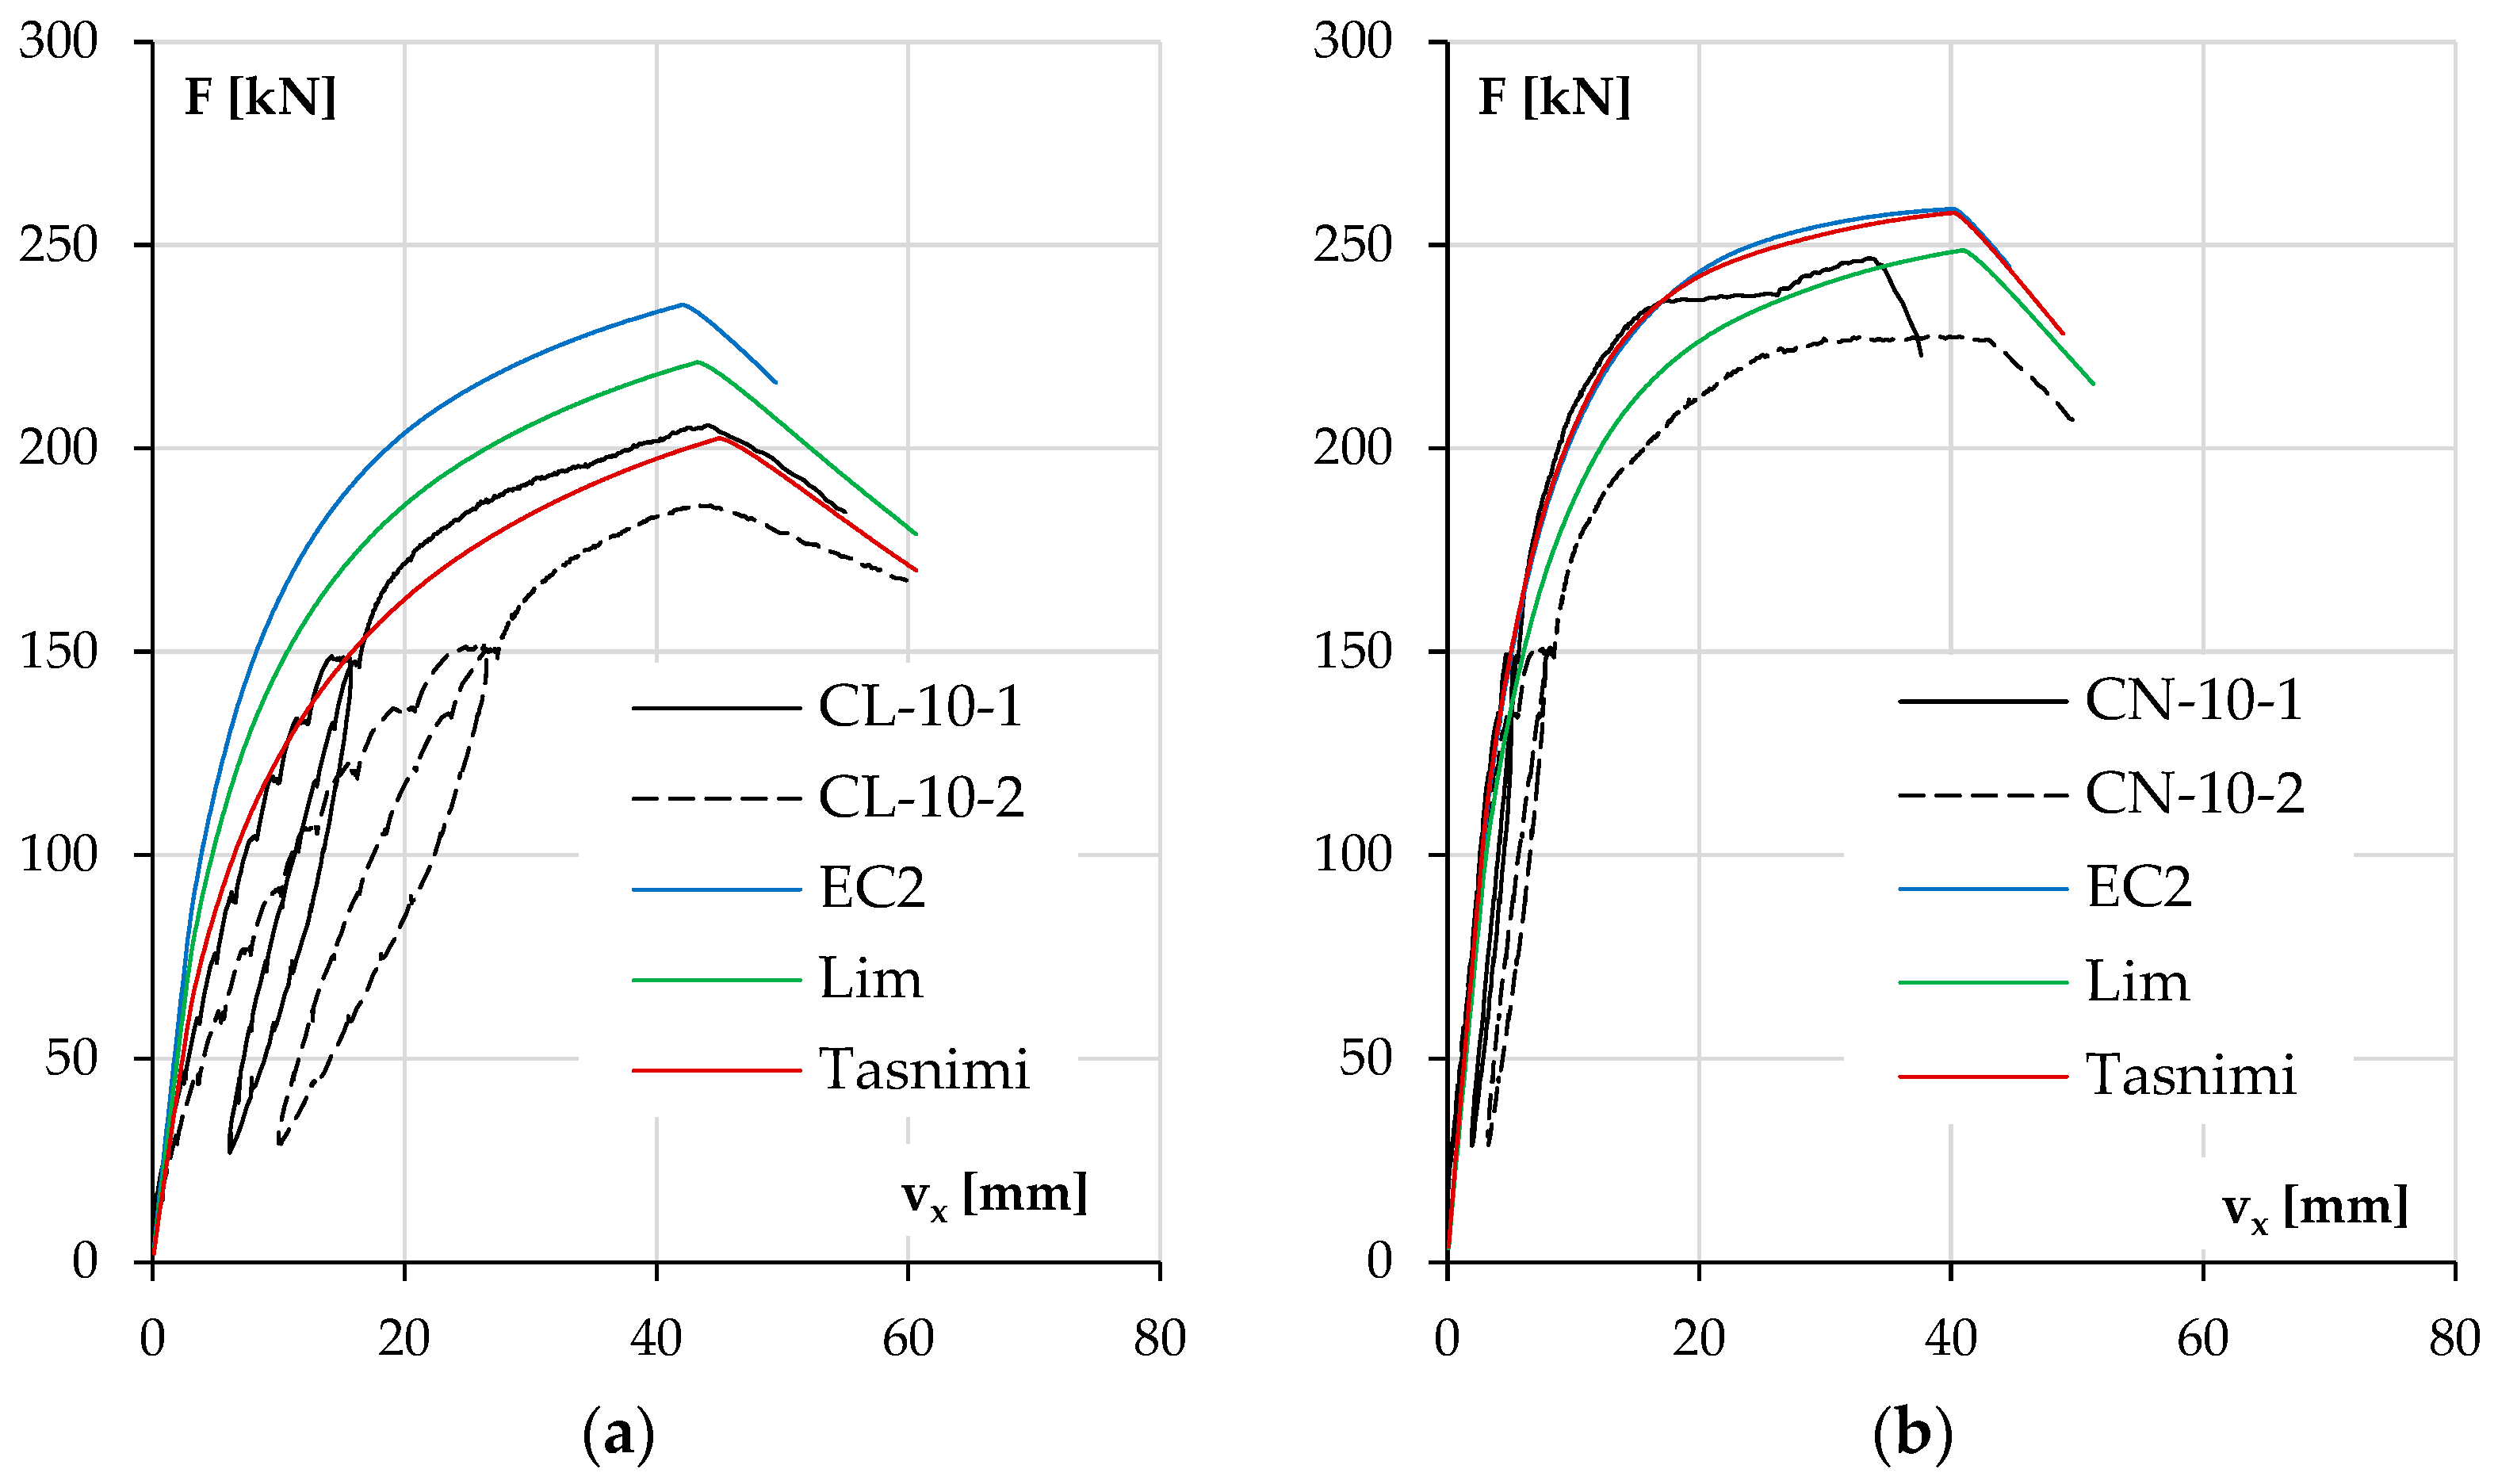
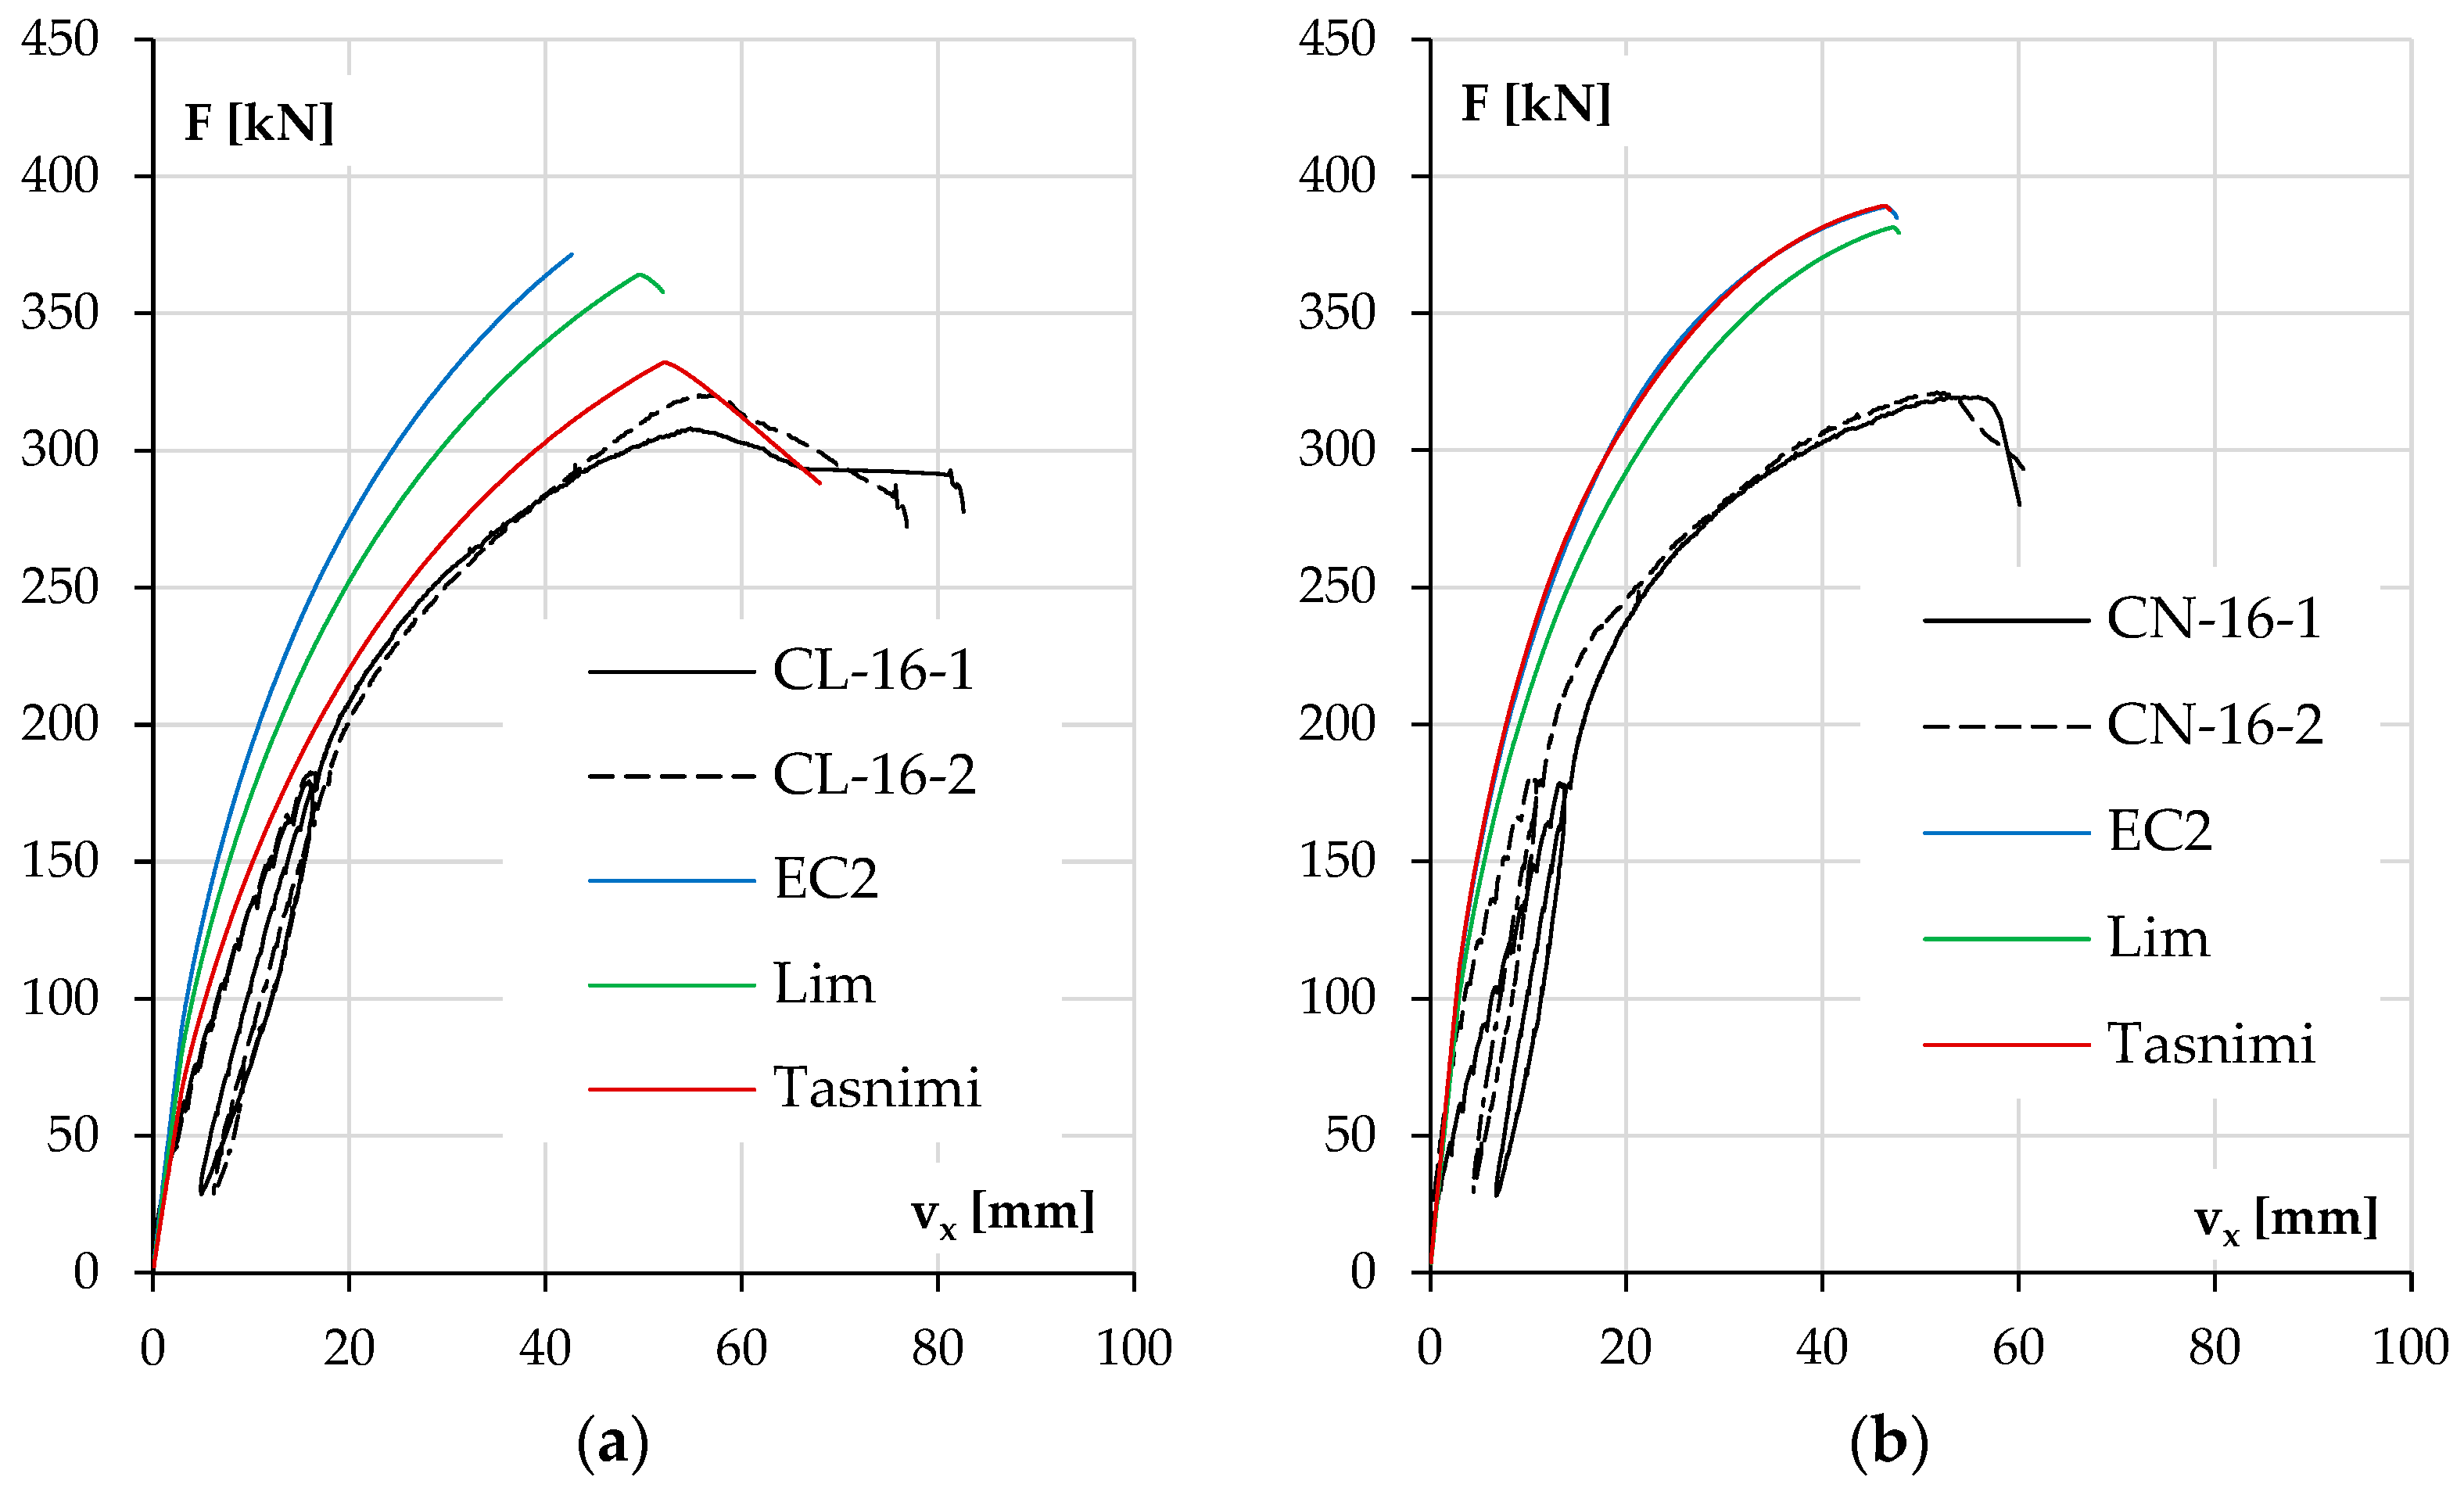
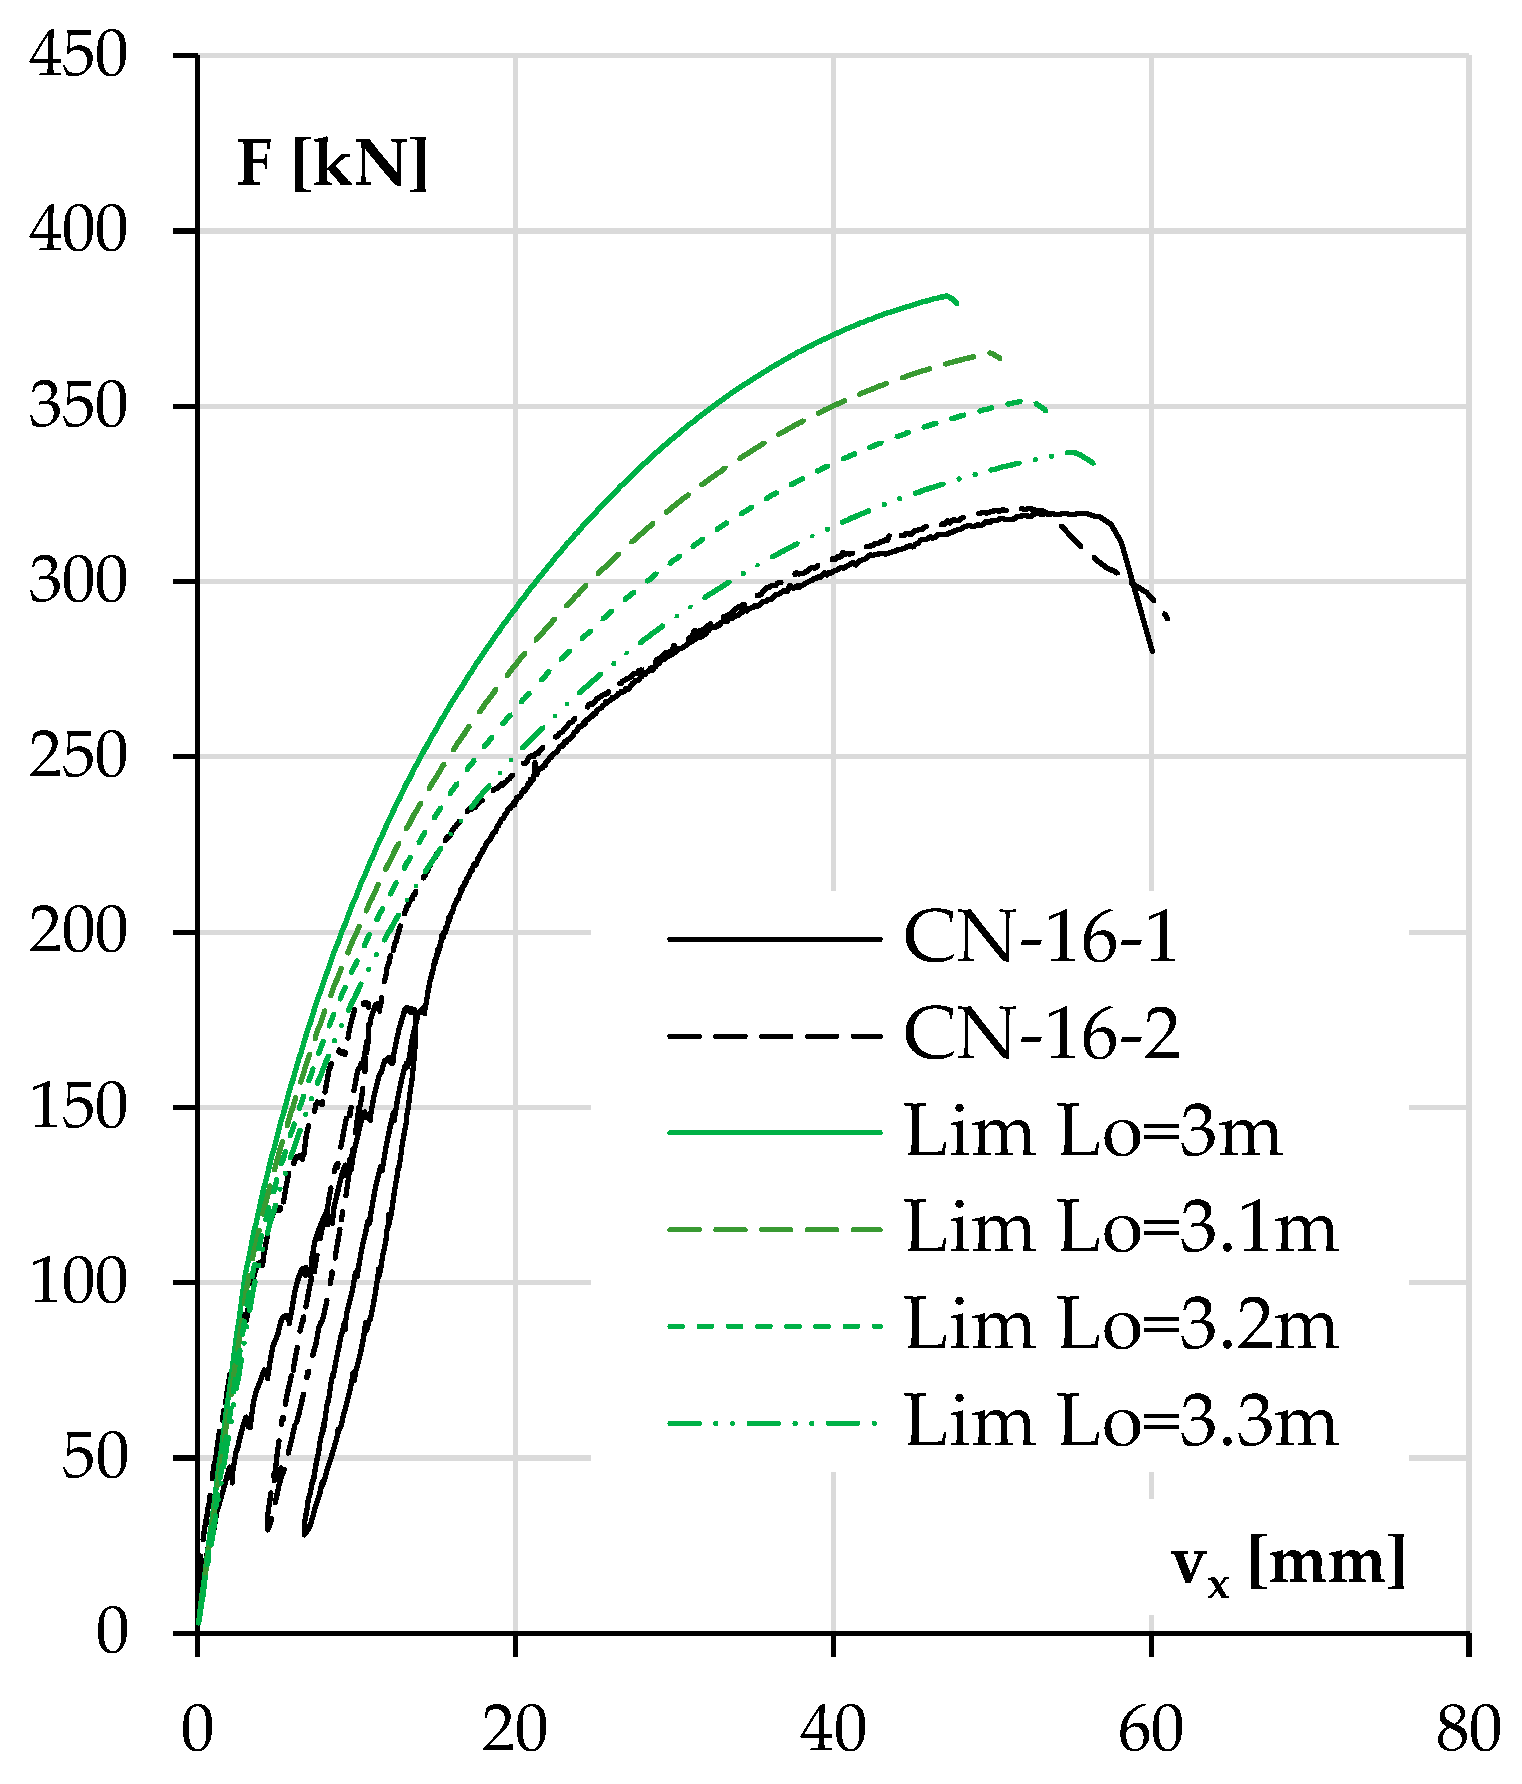
3.2.2. Validation of Numerical Models Against Experimental Data
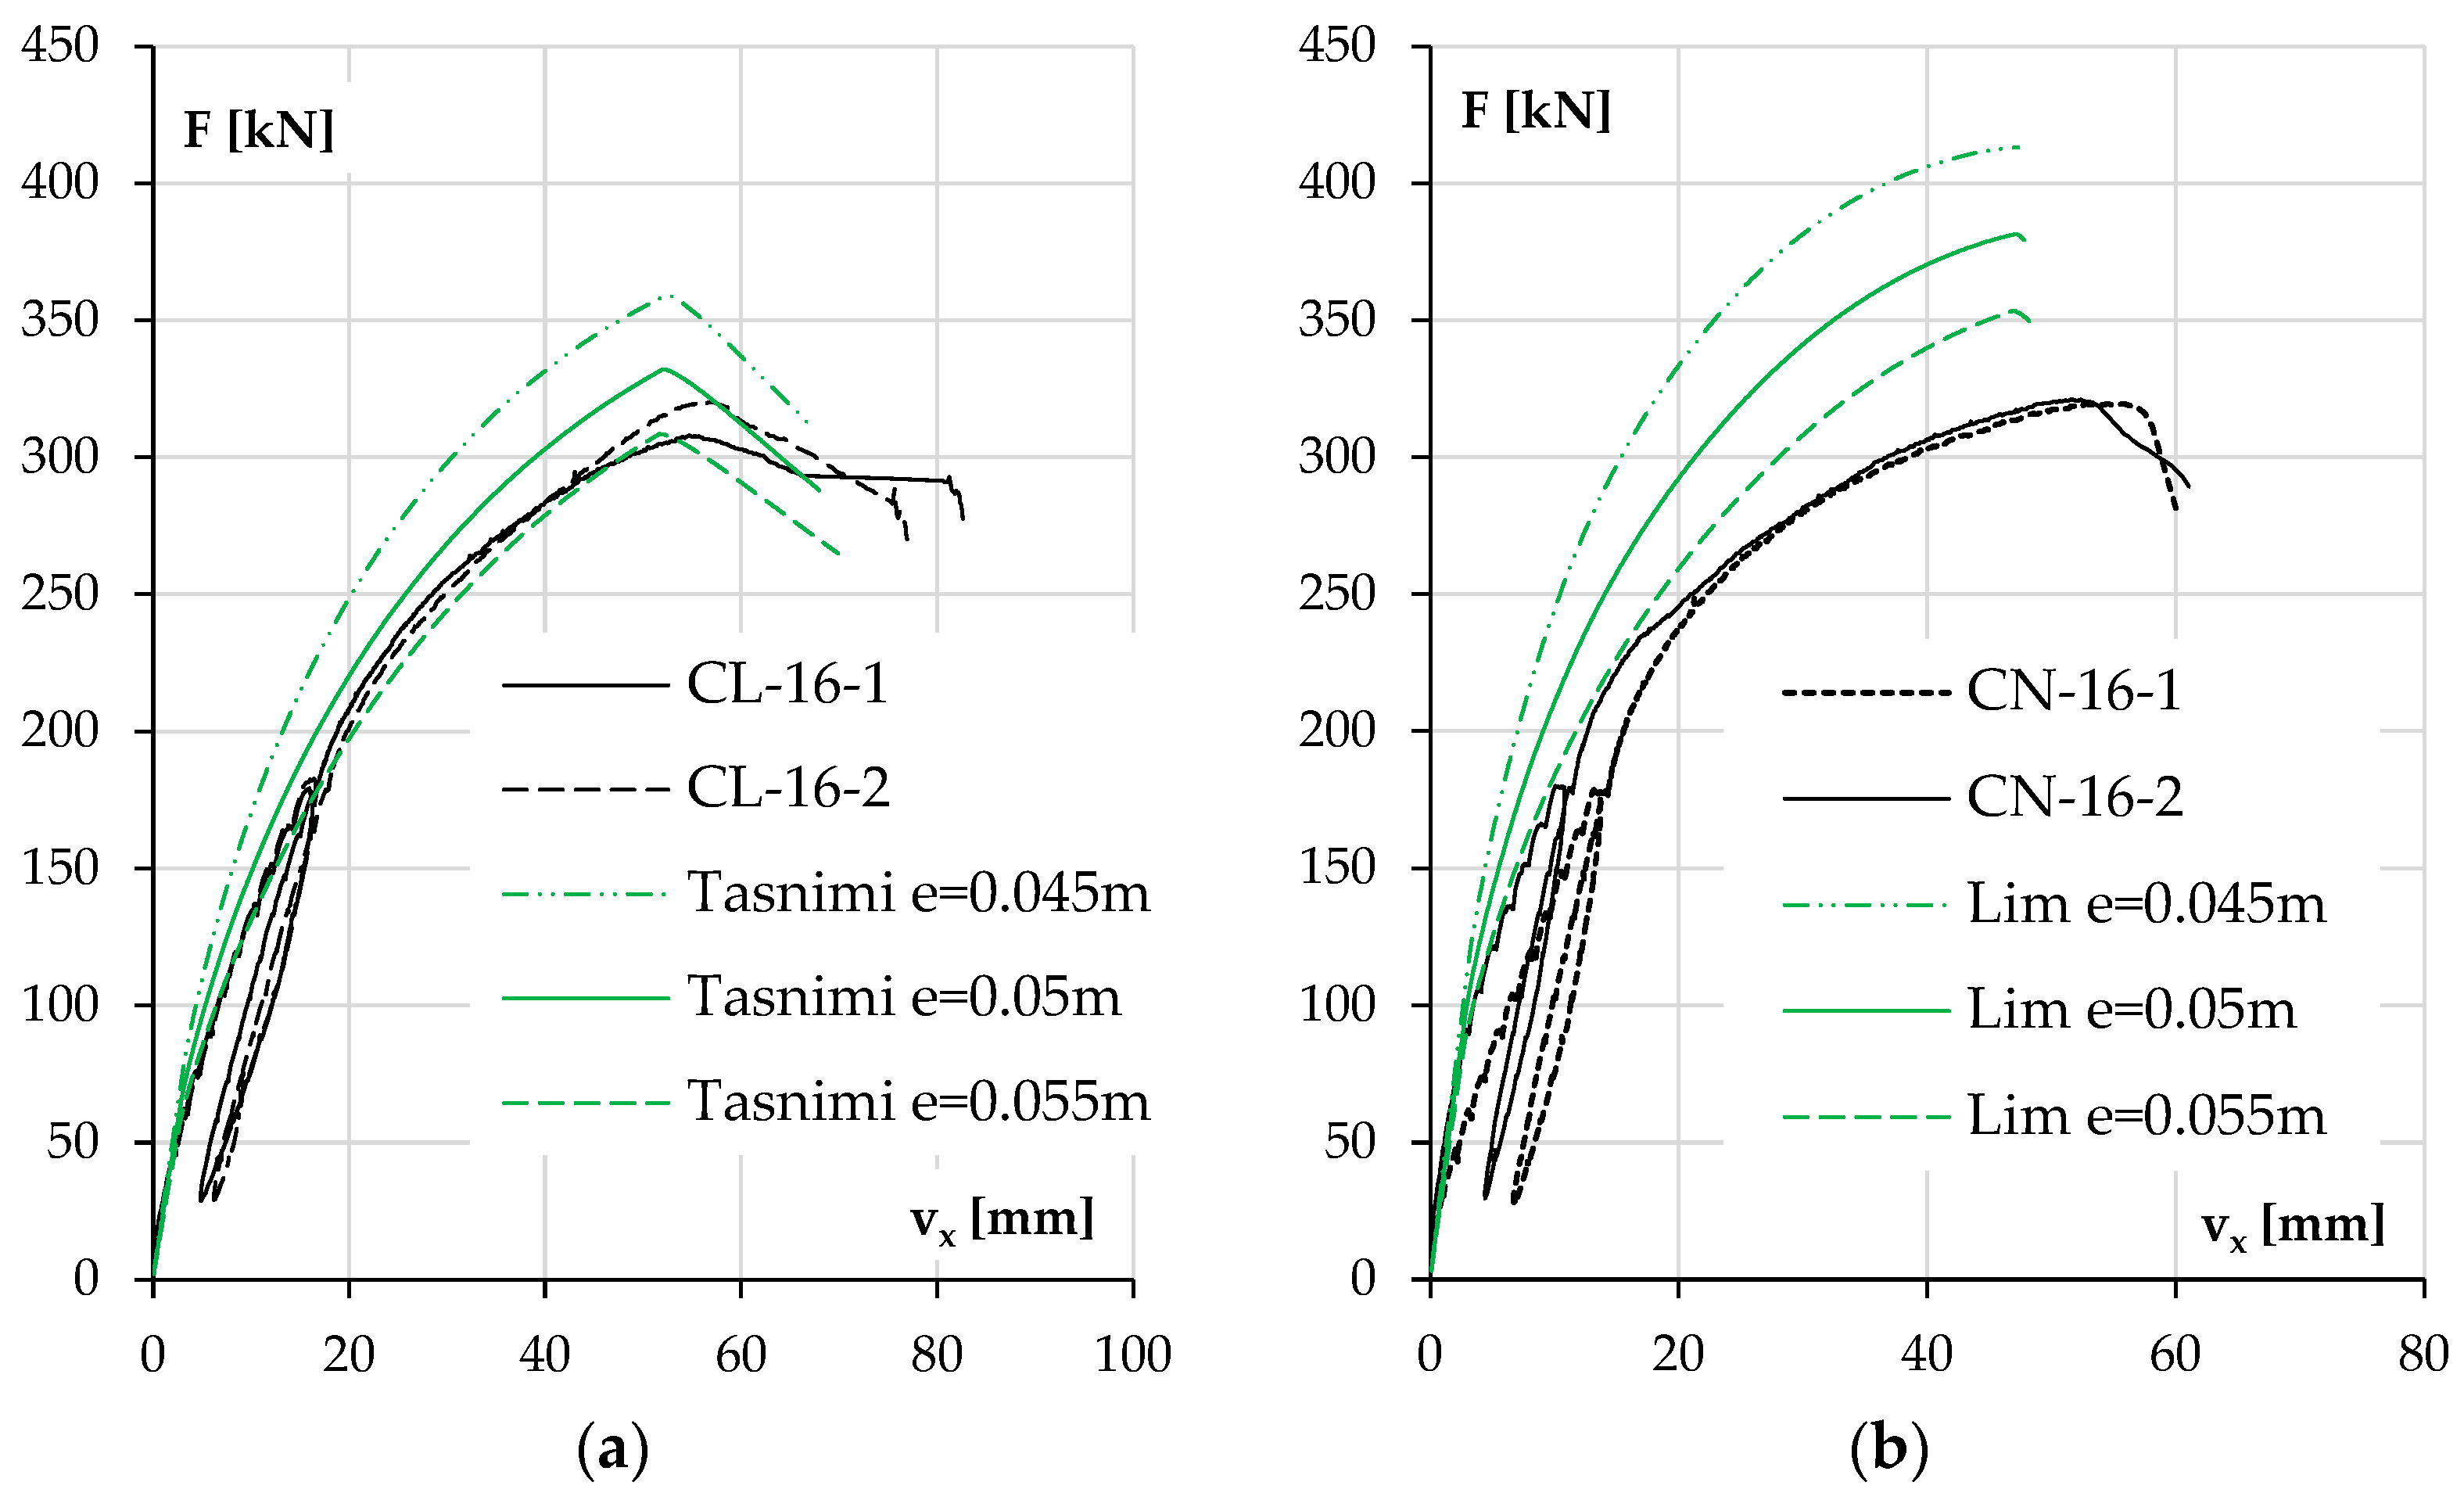
3.2.3. The Effects of Technical Defects on the Test Results
4. Discussion
5. Conclusions
Author Contributions
Funding
Institutional Review Board Statement
Informed Consent Statement
Data Availability Statement
Conflicts of Interest
References
- Thienel, K.C.; Haller, T.; Beuntner, N. Lightweight concrete-from basics to innovations. Materials 2020, 13, 1120. [Google Scholar] [CrossRef]
- Agrawal, Y.; Gupta, T.; Sharma, R.; Panwar, N.L.; Siddique, S. A Comprehensive Review on the Performance of Structural Lightweight Aggregate Concrete for Sustainable Construction. Constr. Mater. 2021, 1, 39–62. [Google Scholar] [CrossRef]
- Thienel, C.; Van Breugel, K. LWAC Material Properties-State-of-the-Art; Technical Report for EuroLightCon: Gouda, The Netherlands, 2000. [Google Scholar] [CrossRef]
- Abbas, A.; Mahadevan, M.; Prajapati, S.; Ayati, B.; Kanavaris, F. Development of low-carbon lightweight concrete using pumice as aggregate and cement replacement. In Proceedings of the International RILEM Conference on Synergising Expertise towards Sustainability and Robustness of Cement-based Materials and Concrete Structures, Milos, Greece 14–16 June 2023; Springer: Berlin/Heidelberg, Germany, 2023. [Google Scholar] [CrossRef]
- Najimi, M.; Pourkhorshidi, A.R.; Parhizka, T. Application of pumice aggregate in structural lightweight concrete. Asian J. Civ. Eng. 2012, 13, 43–54. [Google Scholar]
- Uysal, O.; Uslu, I.; Aktaş, C.B.; Chang, B.; Yaman, I.Ö. Physical and Mechanical Properties of Lightweight Expanded Clay Aggregate Concrete. Buildings 2024, 14, 1871. [Google Scholar] [CrossRef]
- Issa, A.S.; Al-Asadi, A.K. Mechanical properties of lightweight expanded clay aggregate (LECA) concrete. Sci. Rev. Eng. Environ. Sci. (SREES) 2022, 31, 161–175. [Google Scholar] [CrossRef]
- Islam, S.; Ara, G.; Akhtar, U.S. Development of lightweight structural concrete with artificial aggregate manufactured from local clay and solid waste materials. Heliyon 2024, 10, 15. [Google Scholar] [CrossRef]
- Wolfthaler, A.; Harsányi, P.; Schneider, M. Development and Performance of High Strength Lightweight Concrete with Perlites. In Lecture Notes in Civil Engineering; Springer Science and Business Media Deutschland GmbH: Berlin/Heidelberg, Germany, 2024; pp. 126–133. [Google Scholar] [CrossRef]
- Sengul, O.; Azizi, S.; Karaosmanoglu, F.; Tasdemir, M.A. Effect of expanded perlite on the mechanical properties and thermal conductivity of lightweight concrete. Energy Build. 2011, 43, 671–676. [Google Scholar] [CrossRef]
- Al-Naimi, H.K.; Abbas, A.A. Constitutive model for plain and fiber-reinforced lightweight concrete under compression. Struct. Concr. 2023, 24, 7625–7647. [Google Scholar] [CrossRef]
- Gołdyn, M.; Krawczyk, Ł.; Ryżyński, W.; Urban, T. Experimental Investigations on Punching Shear of Flat Slabs Made from Lightweight Aggregate Concrete. Arch. Civ. Eng. 2018, 64, 293–306. [Google Scholar] [CrossRef]
- Nadesan, M.S.; Dinakar, P. Structural concrete using sintered flyash lightweight aggregate: A review. Constr. Build. Mater. 2017, 154, 928–944. [Google Scholar] [CrossRef]
- Rodacka, M.; Domagała, L.; Szydłowski, R. Assessment of Properties of Structural Lightweight Concrete with Sintered Fly Ash Aggregate in Terms of Its Suitability for Use in Prestressed Members. Materials 2023, 16, 5429. [Google Scholar] [CrossRef] [PubMed]
- Patel, S.; Majhi, R.; Satpathy, H.; Nayak, A. Durability and microstructural properties of lightweight concrete manufactured with fly ash cenosphere and sintered fly ash aggregate. Constr. Build. Mater. 2019, 226, 579–590. [Google Scholar] [CrossRef]
- Shafigh, P.; Jumaat, M.Z.; Mahmud, H. Oil palm shell as a lightweight aggregate for production high strength lightweight concrete. Constr. Build. Mater. 2010, 25, 1848–1853. [Google Scholar] [CrossRef]
- Hamada, H.M.; Thomas, B.S.; Tayeh, B. Use of oil palm shell as an aggregate in cement concrete: A review. Constr. Build. Mater. 2020, 265, 120357. [Google Scholar] [CrossRef]
- EN 1992-1-1; Eurocode 2: Design of Concrete Structures–Part 1-1: General Rules and Rules for Buildings. European Committee of Standardization: Brussels, Belgium, 2004.
- Rossignolo, A.J.; Agnesini, M.V.; Morais, J.A. Properties of high-performance LWAC for precast structures with Brazilian lightweight aggregates. Cem. Concr. Compos. 2003, 2003. 25, 77–82. [Google Scholar] [CrossRef]
- Suraneni, P.; Anleu, P.C.B.; Flatt, R.J. Factors affecting the strength of structural lightweight aggregate concrete with and without fibers in the 1200–1600 kg/m3 density range. Mater. Struct. 2015, 49, 677–688. [Google Scholar] [CrossRef]
- Kołodziejczyk, E.; Waśniewski, T. Flexural Behaviour and Internal Forces Redistribution in LWAC Double-Span Beams. Materials 2021, 14, 5614. [Google Scholar] [CrossRef] [PubMed]
- Øverli, J.A.; Jensen, T.M. Increasing ductility in heavily reinforced LWAC structures. Eng. Struct. 2014, 62–63, 11–22. [Google Scholar] [CrossRef]
- Li, H.; Wei, Y.; Hu, Y.; Zhao, L.; Wang, G.; Zhang, Y. Experimental and theoretical analysis of FRP-confined square lightweight aggregate concrete columns under axial compression. Case Stud. Constr. Mater. 2024, 20, e02982. [Google Scholar] [CrossRef]
- Suparp, S.; Chaiyasarn, K.; Ali, N. Hemp FRRP Confined Lightweight Aggregate Concrete (LWAC) Circular Columns: Experimental and Analytical Study. Buildings 2022, 12, 1357. [Google Scholar] [CrossRef]
- Wu, T.; Wei, H.; Zhang, Y.; Liu, X. Axial compressive behavior of lightweight aggregate concrete columns confined with transverse steel reinforcement. Adv. Mech. Eng. 2018, 10, 1687814018766632. [Google Scholar] [CrossRef]
- Yang, K.-H.; Mun, J.-H.; Hwang, S.-H. Effect of concrete type on equivalent lateral confinement pressure in columns under axial loads. J. Build. Eng. 2022, 47. [Google Scholar] [CrossRef]
- Mun, J.-H.; Yang, K.-H.; Choi, M.-S.; Chang, C.-H. Confinement Effect on Axial Behavior of Lightweight Aggregate Concrete Columns. ACI Struct. J. 2021, 118, 267–277. [Google Scholar] [CrossRef]
- Wu, T.; Sun, L.; Wei, H. Uniaxial performance of circular hybrid fibre-reinforced lightweight aggregate concrete columns. Eng. Struct. 2021, 238, 112263. [Google Scholar] [CrossRef]
- Galeota, D.; Giammatteo, M.M.; Gregori, A. Ductility and strength in high-performance lightweight concrete columns. In Proceedings of the 3th World Conference on Earthquake Engineering, Vancouver, BC, Canada, 1–6 August 2004; pp. 81–91. [Google Scholar]
- Kołodziejczyk, E.; Waśniewski, T. Nonlinear analysis of lightweight aggregate concrete columns. Bud. i Arch. 2020, 19, 081–091. [Google Scholar] [CrossRef]
- Lim, J.C.; Ozbakkaloglu, T. Stress–strain model for normal- and light-weight concretes under uniaxial and triaxial compression. Constr. Build. Mater. 2014, 71, 492–509. [Google Scholar] [CrossRef]
- Tasnimi, A.A. Mathematical model for complete stress-strain curve prediction of normal, light-weight and high-strength concretes. Mag. Concr. Res. 2004, 56, 23–34. [Google Scholar] [CrossRef]
- Czkwianianc, A. and Kamińska, M. Metoda Nieliniowej Analizy Żelbetowych Elementów Prętowych; Warsaw Committee of Civil and Water Engineering of the Polish Academy of Sciences: Warsaw, Poland, 1993. [Google Scholar]


| Column | Geometry | Reinforcement | Type of Concrete | |||
|---|---|---|---|---|---|---|
| L | h | b | As (No 1) | Asw (No 2) | ||
| mm | mm | mm | mm | mm | ||
| CL-10-1 | 3000 | 140 | 250 | 4#10 | #8 at 150/50 | LWAC |
| CL-10-2 | LWAC | |||||
| CN-10-1 | NWAC | |||||
| CN-10-2 | NWAC | |||||
| CL-16-1 | 4#16 | LWAC | ||||
| CL-16-2 | LWAC | |||||
| CN-16-1 | NWAC | |||||
| CN-16-2 | NWAC | |||||
| Type of Concrete | Aggregate | CEM I 42.5 R | Water | w/c | Additives | |
|---|---|---|---|---|---|---|
| Course | Fine | |||||
| kg | kg | kg | kg | |||
| LWAC | 752 | 410 | 480 | 220 | 0.46 | Sika Fume–41 kg |
| NWAC | 1012 | 736 | 410 | 170 | 0.41 | Fly ash–30 kg VISCOCRETE 3088 M (SIKA)–2.66 kg BV 12 (SIKA)–1.02 kg |
| Column | Age Days | Concrete Properties on the Day of the Test 1 | ||||
|---|---|---|---|---|---|---|
| r | fc | Ec | fc,cube | fct,sp | ||
| kg/m3 | MPa | GPa | MPa | kg/m3 | ||
| CL-10-1 | 112 | 1860 | 62.4; 59.8 (61.1) | 19.1; 19.2 (19.2) | 68.9 | 2.5 |
| CL-10-2 | 128 | 1820 | 66.3; 68.2 (67.3) | 18.6; 18.9 (18.8) | 70.5 | 3.0 |
| CL-16-1 | 124 | 1861 | 65.9; 66.5 (66.2) | 19.2; 20.0 (19.6) | 63.6 | 3.5 |
| CL-16-2 | 135 | 1831 | 67.2; 67.0 (67.1) | 21.8; 21.4 (21.6) | 69.2 | 2.4 |
| CN-10-1 | 98 | 2289 | 62.7; 63.2; 62.3 (62.7) | 31.2; 30.5; 30.5 (30.7) | 65.1 | 5.3; 4.4 (4.9) |
| CN-10-2 | 118 | 2276 | 64.3; 60.5; 64.3 (63.0) | 31.4; 31.0; 31.2 (31.2) | 68.5 | 4.7; 4.8 (4.8) |
| CN-16-1 | 106 | 2292 | 59.9; 56.6; 61.3 (59.3) | 30.7; 28.6; 30.6 (30.0) | 73.9; 71.1 (72.5) | 4.7; 4.8 (4.8) |
| CN-16-2 | 127 | 2270 | 61.1; 63.4; 62.0 (62.2) | 32.3; 32.5; 32.1 (32.3) | 66.8; 65.4 (66.1) | 5.3; 5.5 (5.4) |
| Diameter | Net Area | Yield Strength fy | Tensile Strength fu | Yield Strain εy | Ultimate Strain εu | Modulus of Elasticity Es |
|---|---|---|---|---|---|---|
| mm | mm 2 | MPa | MPa | ‰ | ‰ | GPa |
| 8 | 51.4 | 534 (5/0.7%) 1 | 661 (5/0.2%) | - | 103 (5/1.3%) | 197 (5/2.1%) |
| 10 | 78.4 | 552 (5/2.1%) | 647 (5/1.5%) | 2.8 (5/1.7%) | 102 (5/4.1%) | 195 (5/2.5%) |
| 16 | 199.6 | 521 (5/1.1%) | 636 (5/1.1%) | 2.5 (5/1.4%) | 103 (5/11.5%) | 208 (5/1.5%) |
| Column | Final Results | |||
|---|---|---|---|---|
| fc/flc 1 | Fu | vxu | vyu | |
| MPa | kN | m | mm | |
| CL-10-1 | 61.1 | 206 | 0.044 | 0.000 |
| CL-10-2 | 67.3 | 186 | 0.044 | 0.001 2 |
| CN-10-1 | 62.7 | 247 | 0.034 | 0.012 |
| CN-10-2 | 63.0 | 228 | 0.039 | −0.001 |
| CL-16-1 | 66.2 | 308 | 0.054 | 0.005 |
| CL-16-2 | 67.1 | 320 | 0.057 | 0.001 |
| CN-16-1 | 59.3 | 320 | 0.056 | 0.001 |
| CN-16-2 | 62.2 | 321 | 0.052 | 0.000 |
| Column Type | Experimental Values 1 | Lim 2014 [31] Model | Tasnimi 2004 [32] Model | EC 2 Model | |||||
|---|---|---|---|---|---|---|---|---|---|
| r | fc | Ec | Ec | Ec | |||||
| kg/m3 | MPa | Gpa | ‰ | Gpa | ‰ | Gpa | ‰ | ‰ | |
| CL-10 | 1840 | 64.2 | 24.3 | 2.87 | 20.1 | 4.03 | 26.9 | 2.39 | 2.39 |
| CL-16 | 1846 | 66.7 | 24.9 | 2.90 | 20.5 | 4.09 | 27.4 | 2.44 | 2.44 |
| CN-10 | 2283 | 63.0 | 32.6 | 2.59 | 36.3 | 2.54 | 38.2 | 2.53 | 3.21 |
| CN-16 | 2281 | 60.8 | 32.0 | 2.57 | 35.8 | 2.51 | 37.8 | 2.50 | 3.32 |
Disclaimer/Publisher’s Note: The statements, opinions and data contained in all publications are solely those of the individual author(s) and contributor(s) and not of MDPI and/or the editor(s). MDPI and/or the editor(s) disclaim responsibility for any injury to people or property resulting from any ideas, methods, instructions or products referred to in the content. |
© 2025 by the authors. Licensee MDPI, Basel, Switzerland. This article is an open access article distributed under the terms and conditions of the Creative Commons Attribution (CC BY) license (https://creativecommons.org/licenses/by/4.0/).
Share and Cite
Kołodziejczyk, E.; Waśniewski, T.; Starý, V.; Dvořák, R.; Rabenda, M. Second-Order Effects in Lightweight Aggregate Concrete Slender Columns. Materials 2025, 18, 1312. https://doi.org/10.3390/ma18061312
Kołodziejczyk E, Waśniewski T, Starý V, Dvořák R, Rabenda M. Second-Order Effects in Lightweight Aggregate Concrete Slender Columns. Materials. 2025; 18(6):1312. https://doi.org/10.3390/ma18061312
Chicago/Turabian StyleKołodziejczyk, Ewelina, Tomasz Waśniewski, Vojtěch Starý, Richard Dvořák, and Martyna Rabenda. 2025. "Second-Order Effects in Lightweight Aggregate Concrete Slender Columns" Materials 18, no. 6: 1312. https://doi.org/10.3390/ma18061312
APA StyleKołodziejczyk, E., Waśniewski, T., Starý, V., Dvořák, R., & Rabenda, M. (2025). Second-Order Effects in Lightweight Aggregate Concrete Slender Columns. Materials, 18(6), 1312. https://doi.org/10.3390/ma18061312