
High-Quality Perovskite Thin Films for NO2 Detection: Optimizing Pulsed Laser Deposition of Pure and Sr-Doped LaMO3 (M = Co, Fe)


Abstract
1. Introduction
2. Research Material
3. Methodology and Research Techniques
3.1. Target Fabrication for PLD Process
3.2. Perovskite Thin Film Deposition
3.3. Research and Analytical Techniques Applied
4. Research Results and Observations
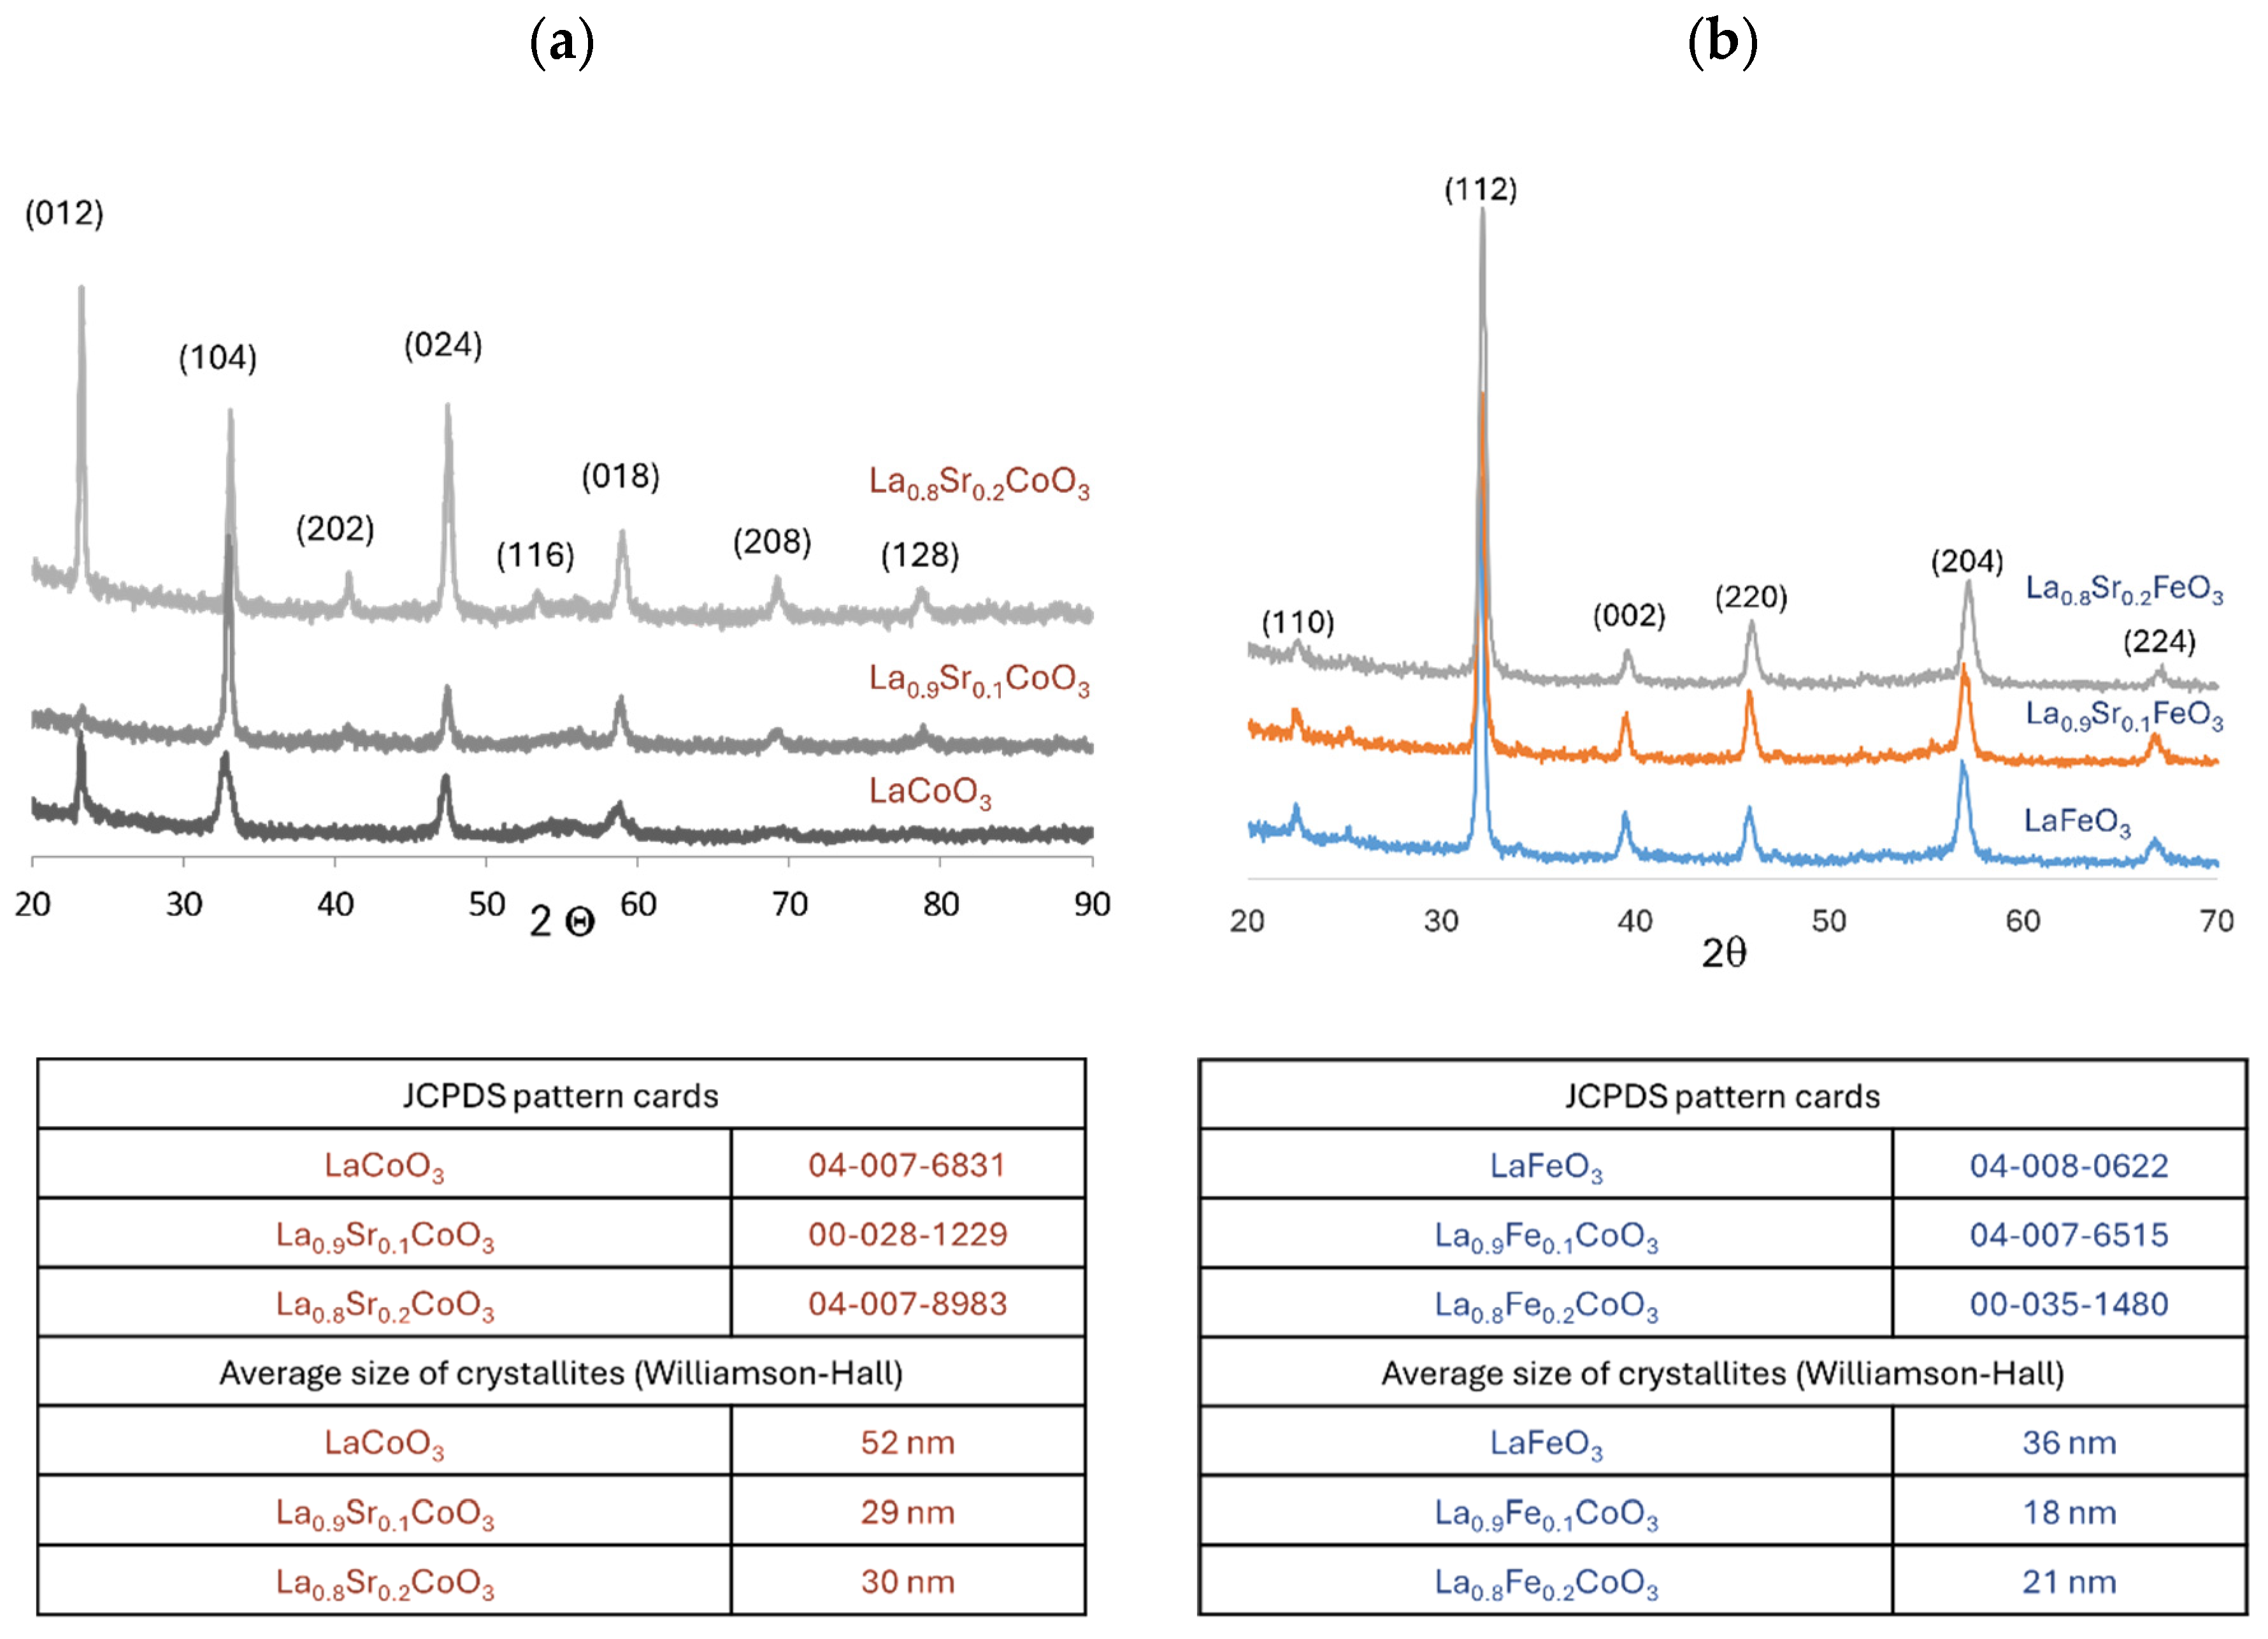
4.1. XRD Analysis
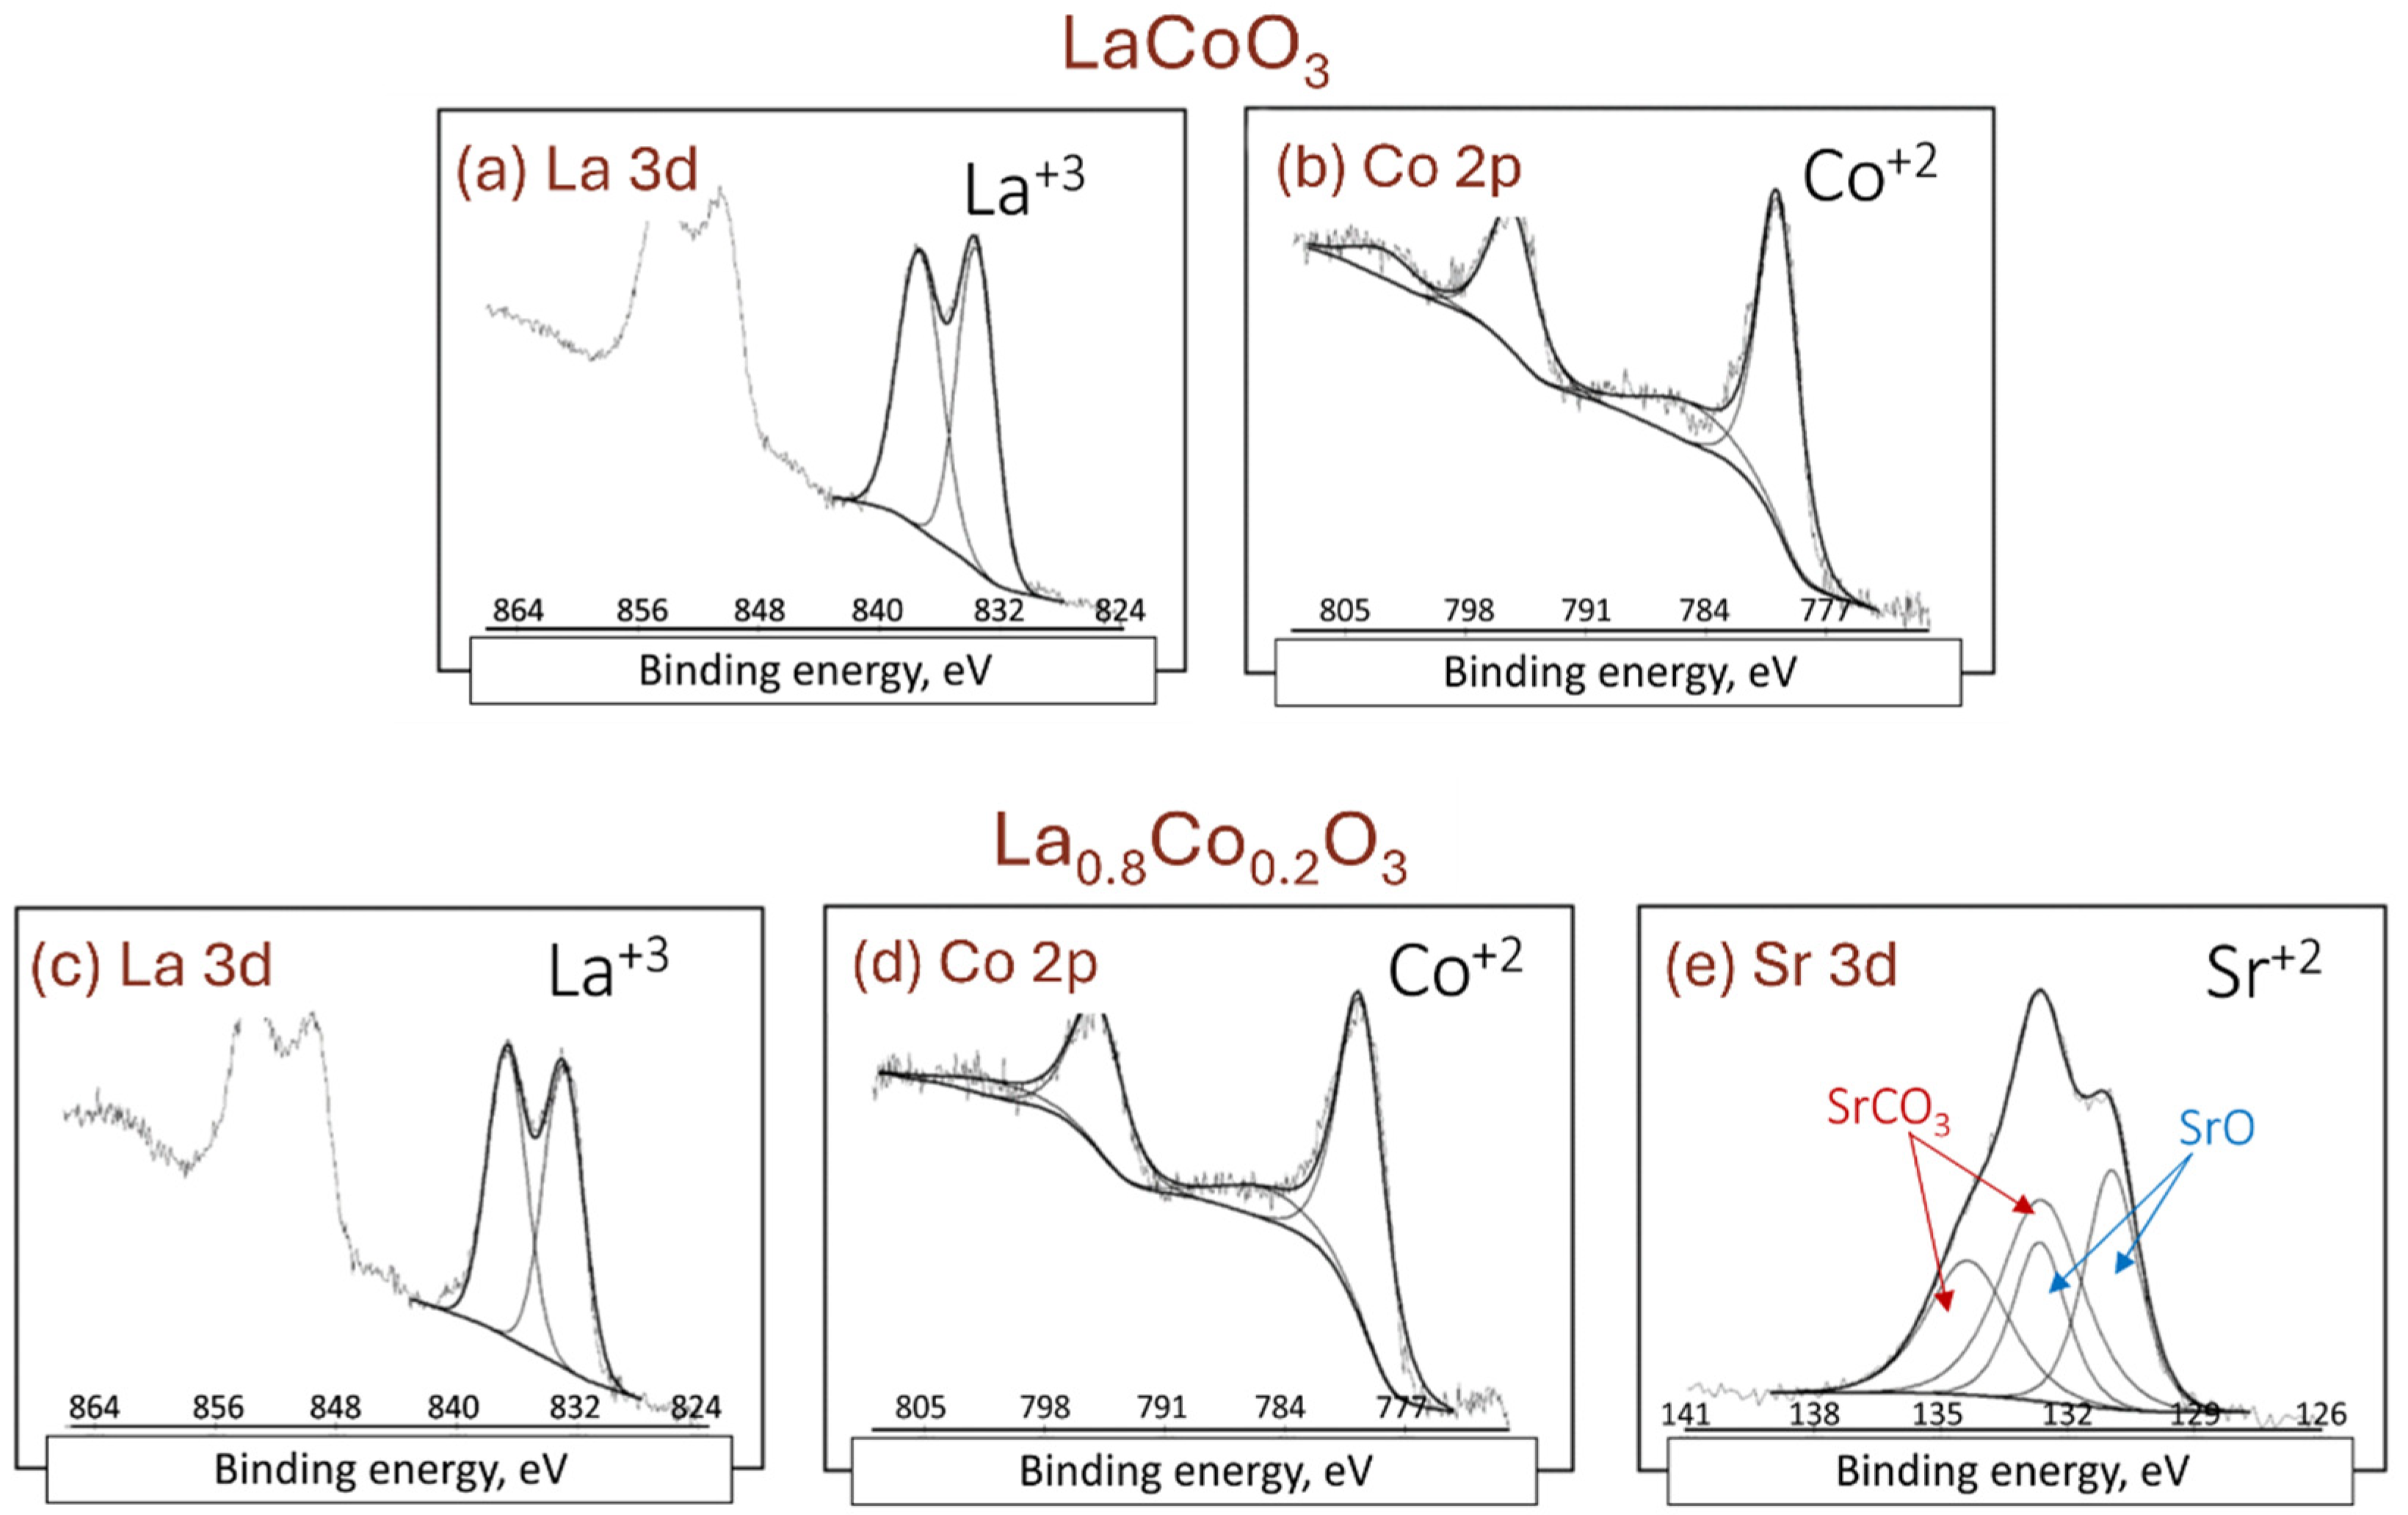
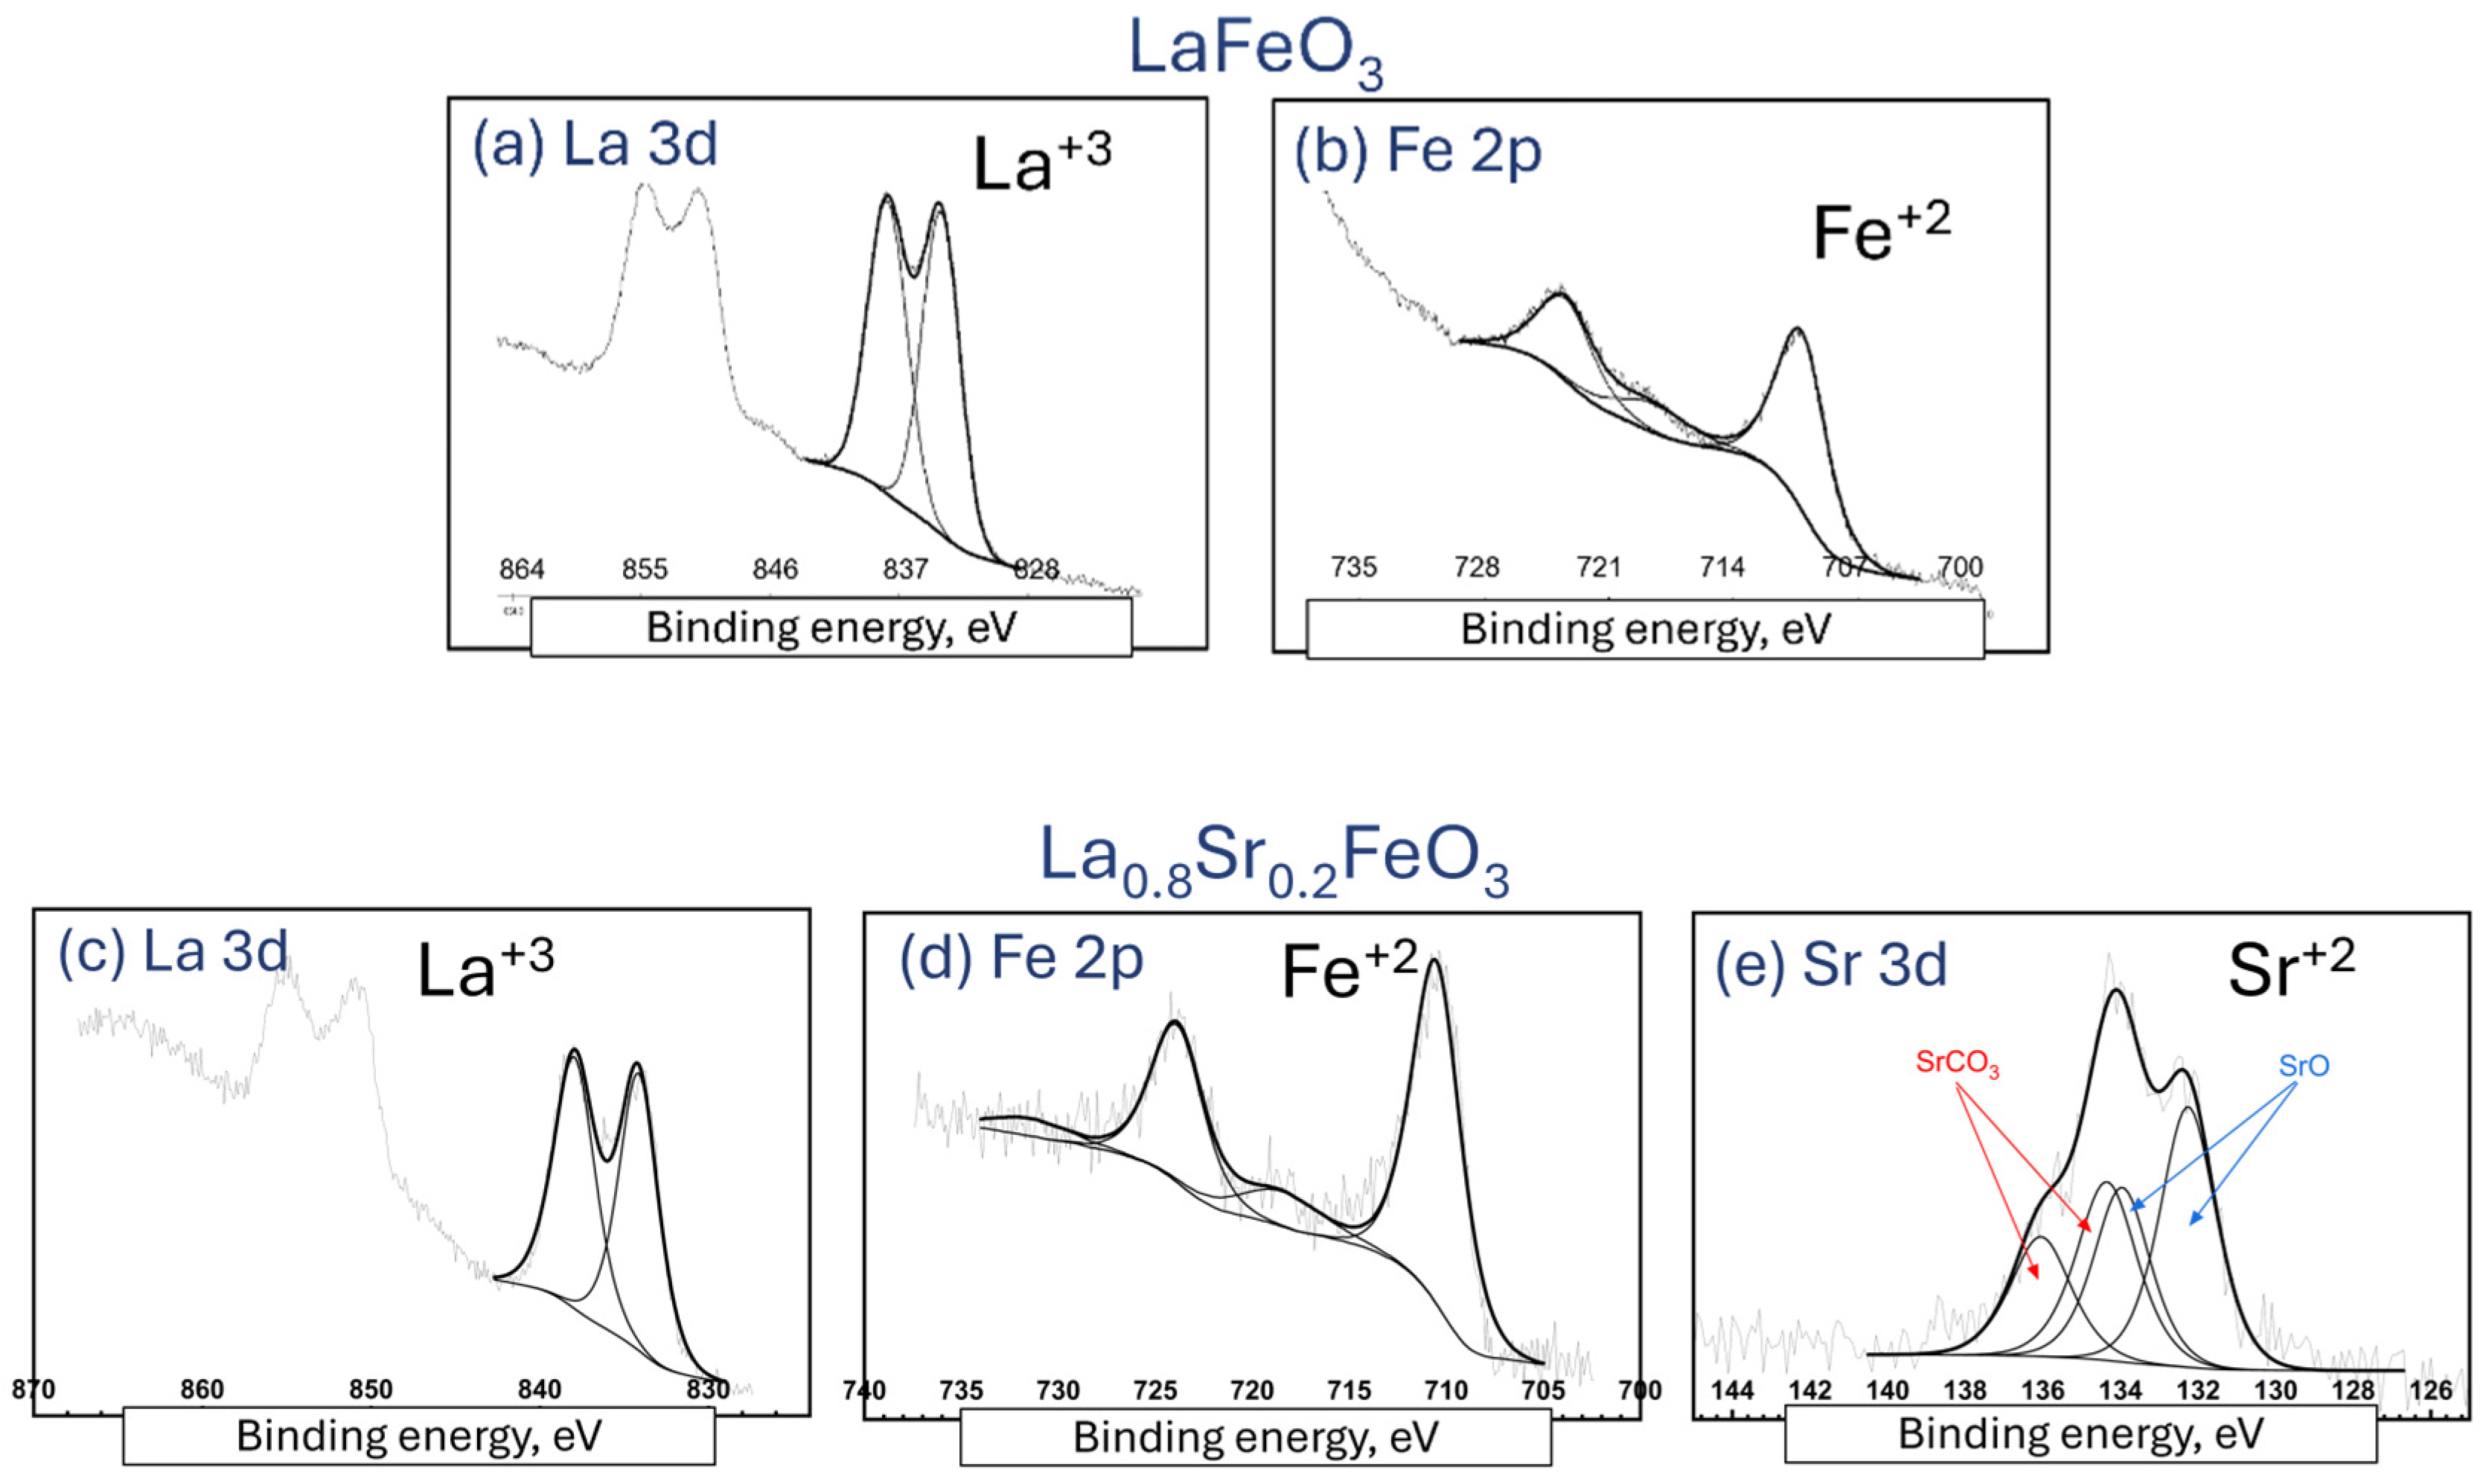
4.2. XPS Analysis
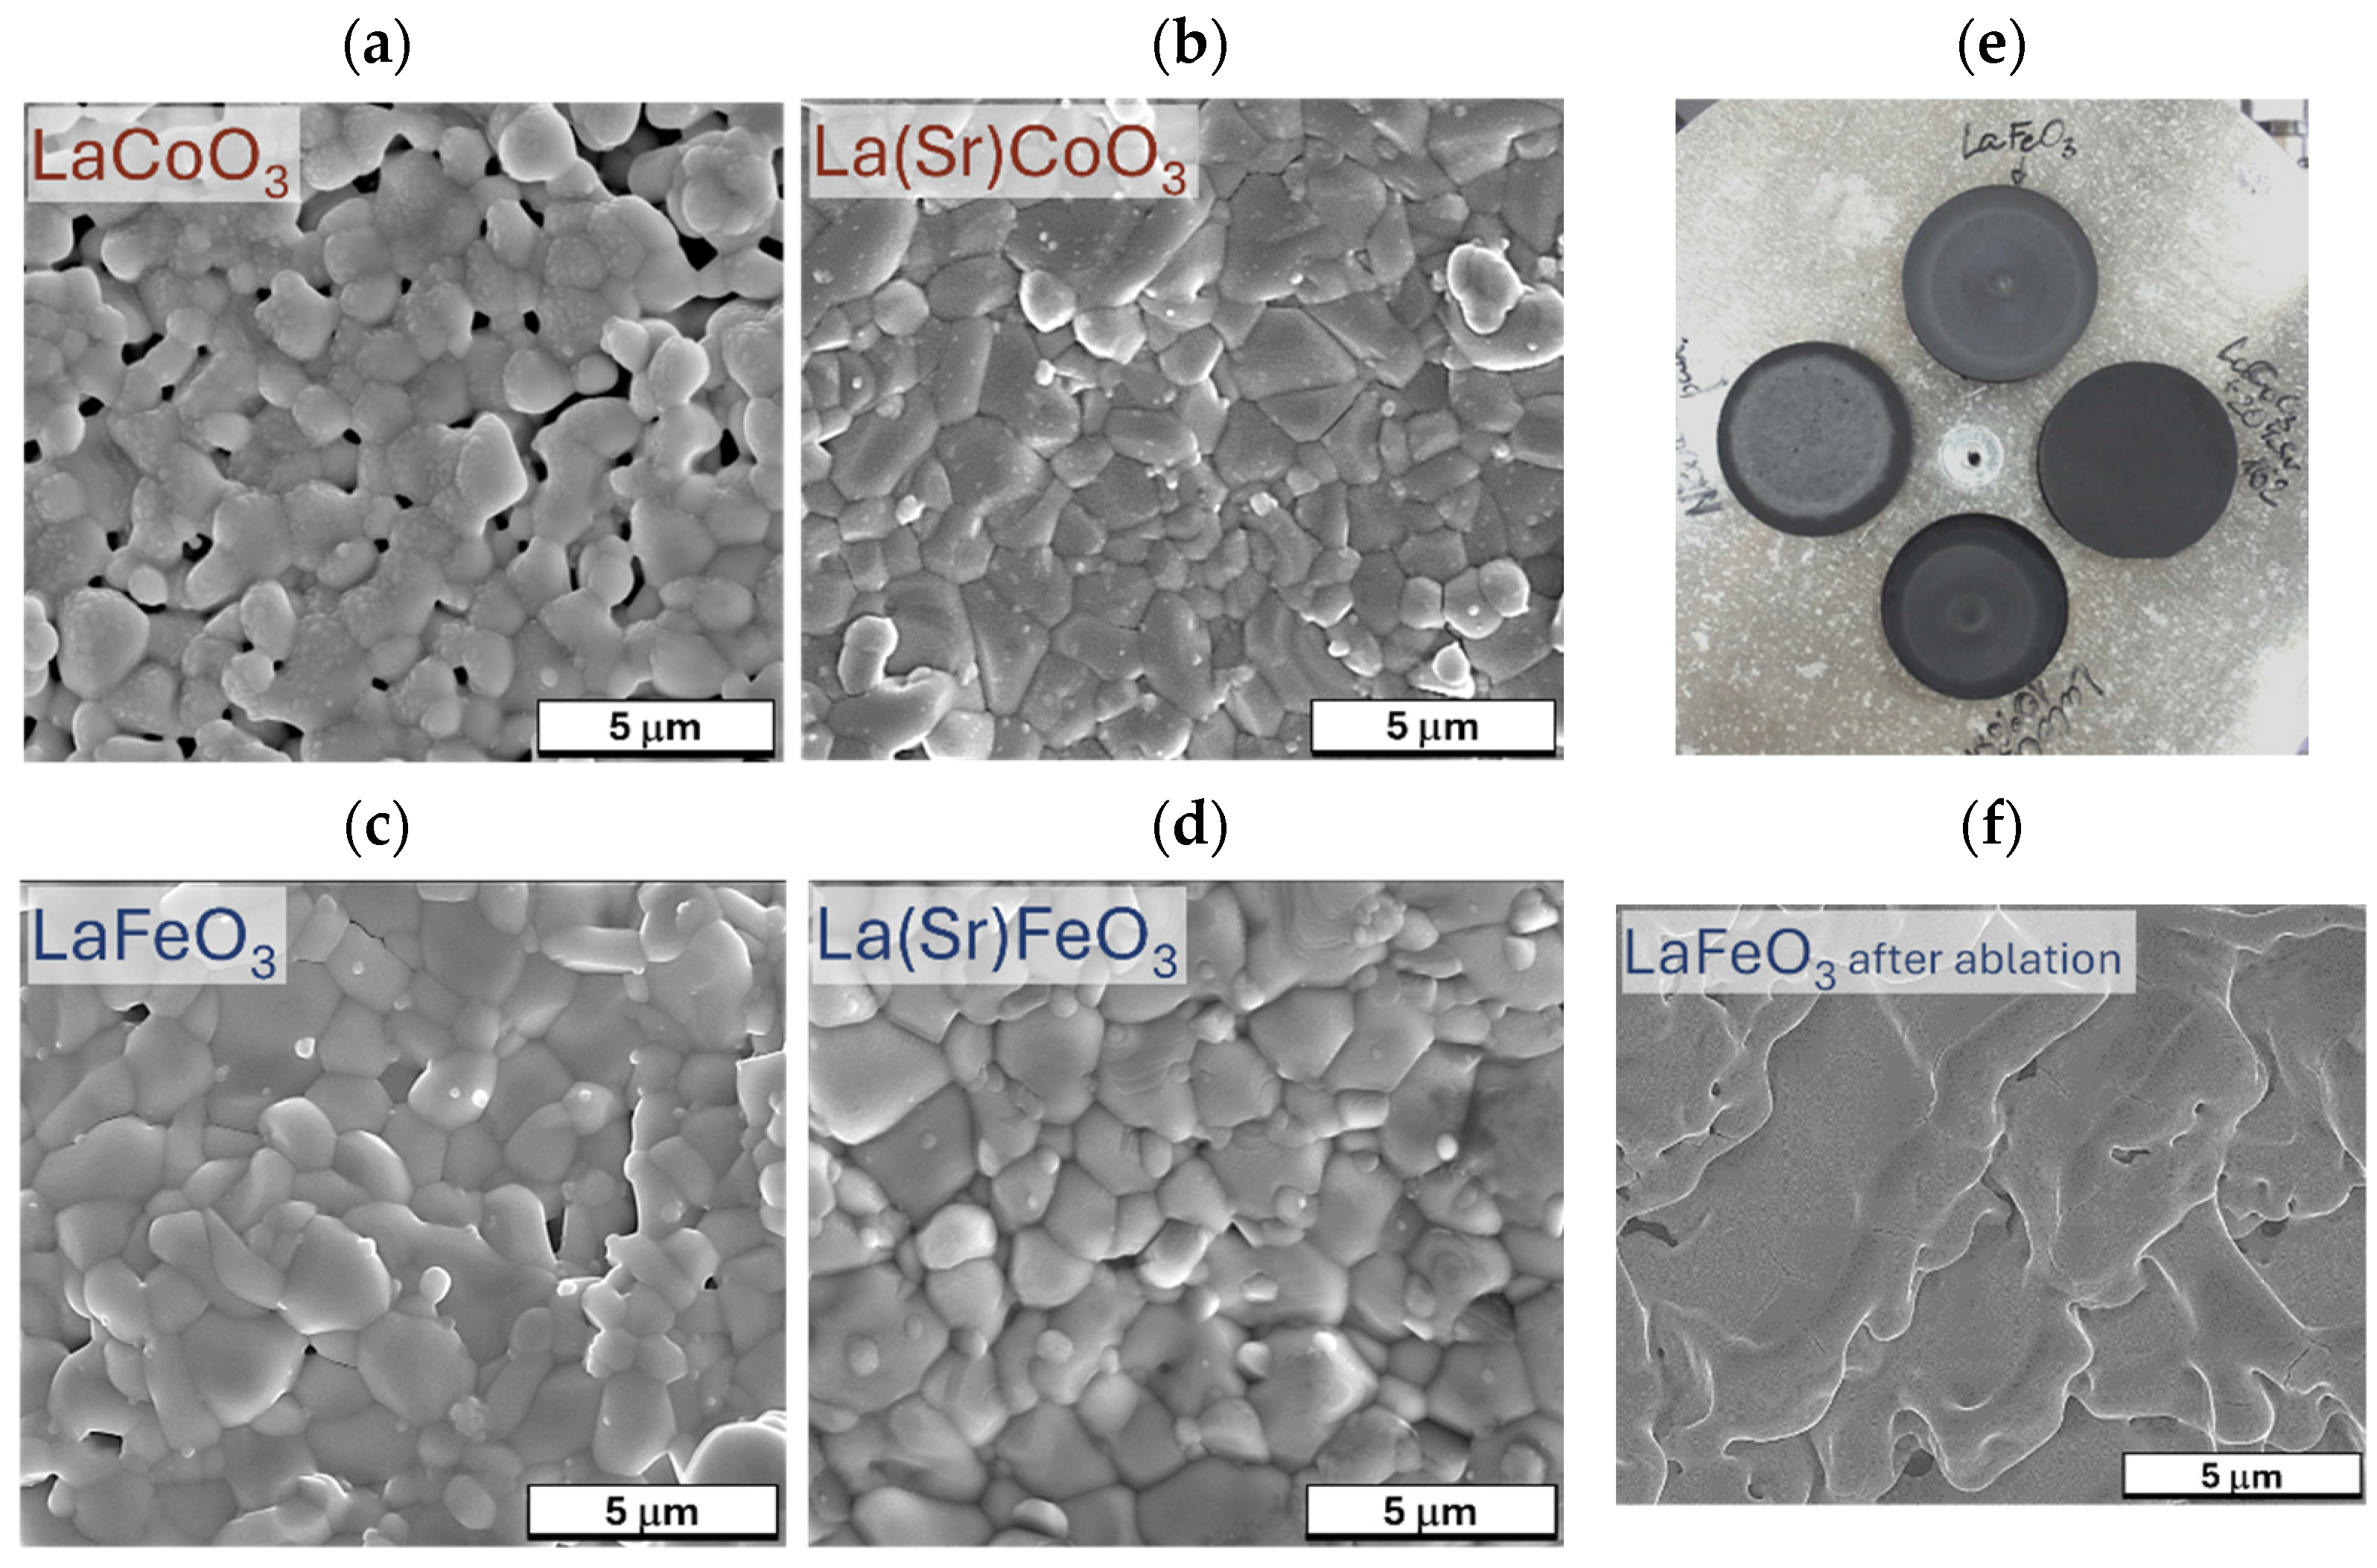
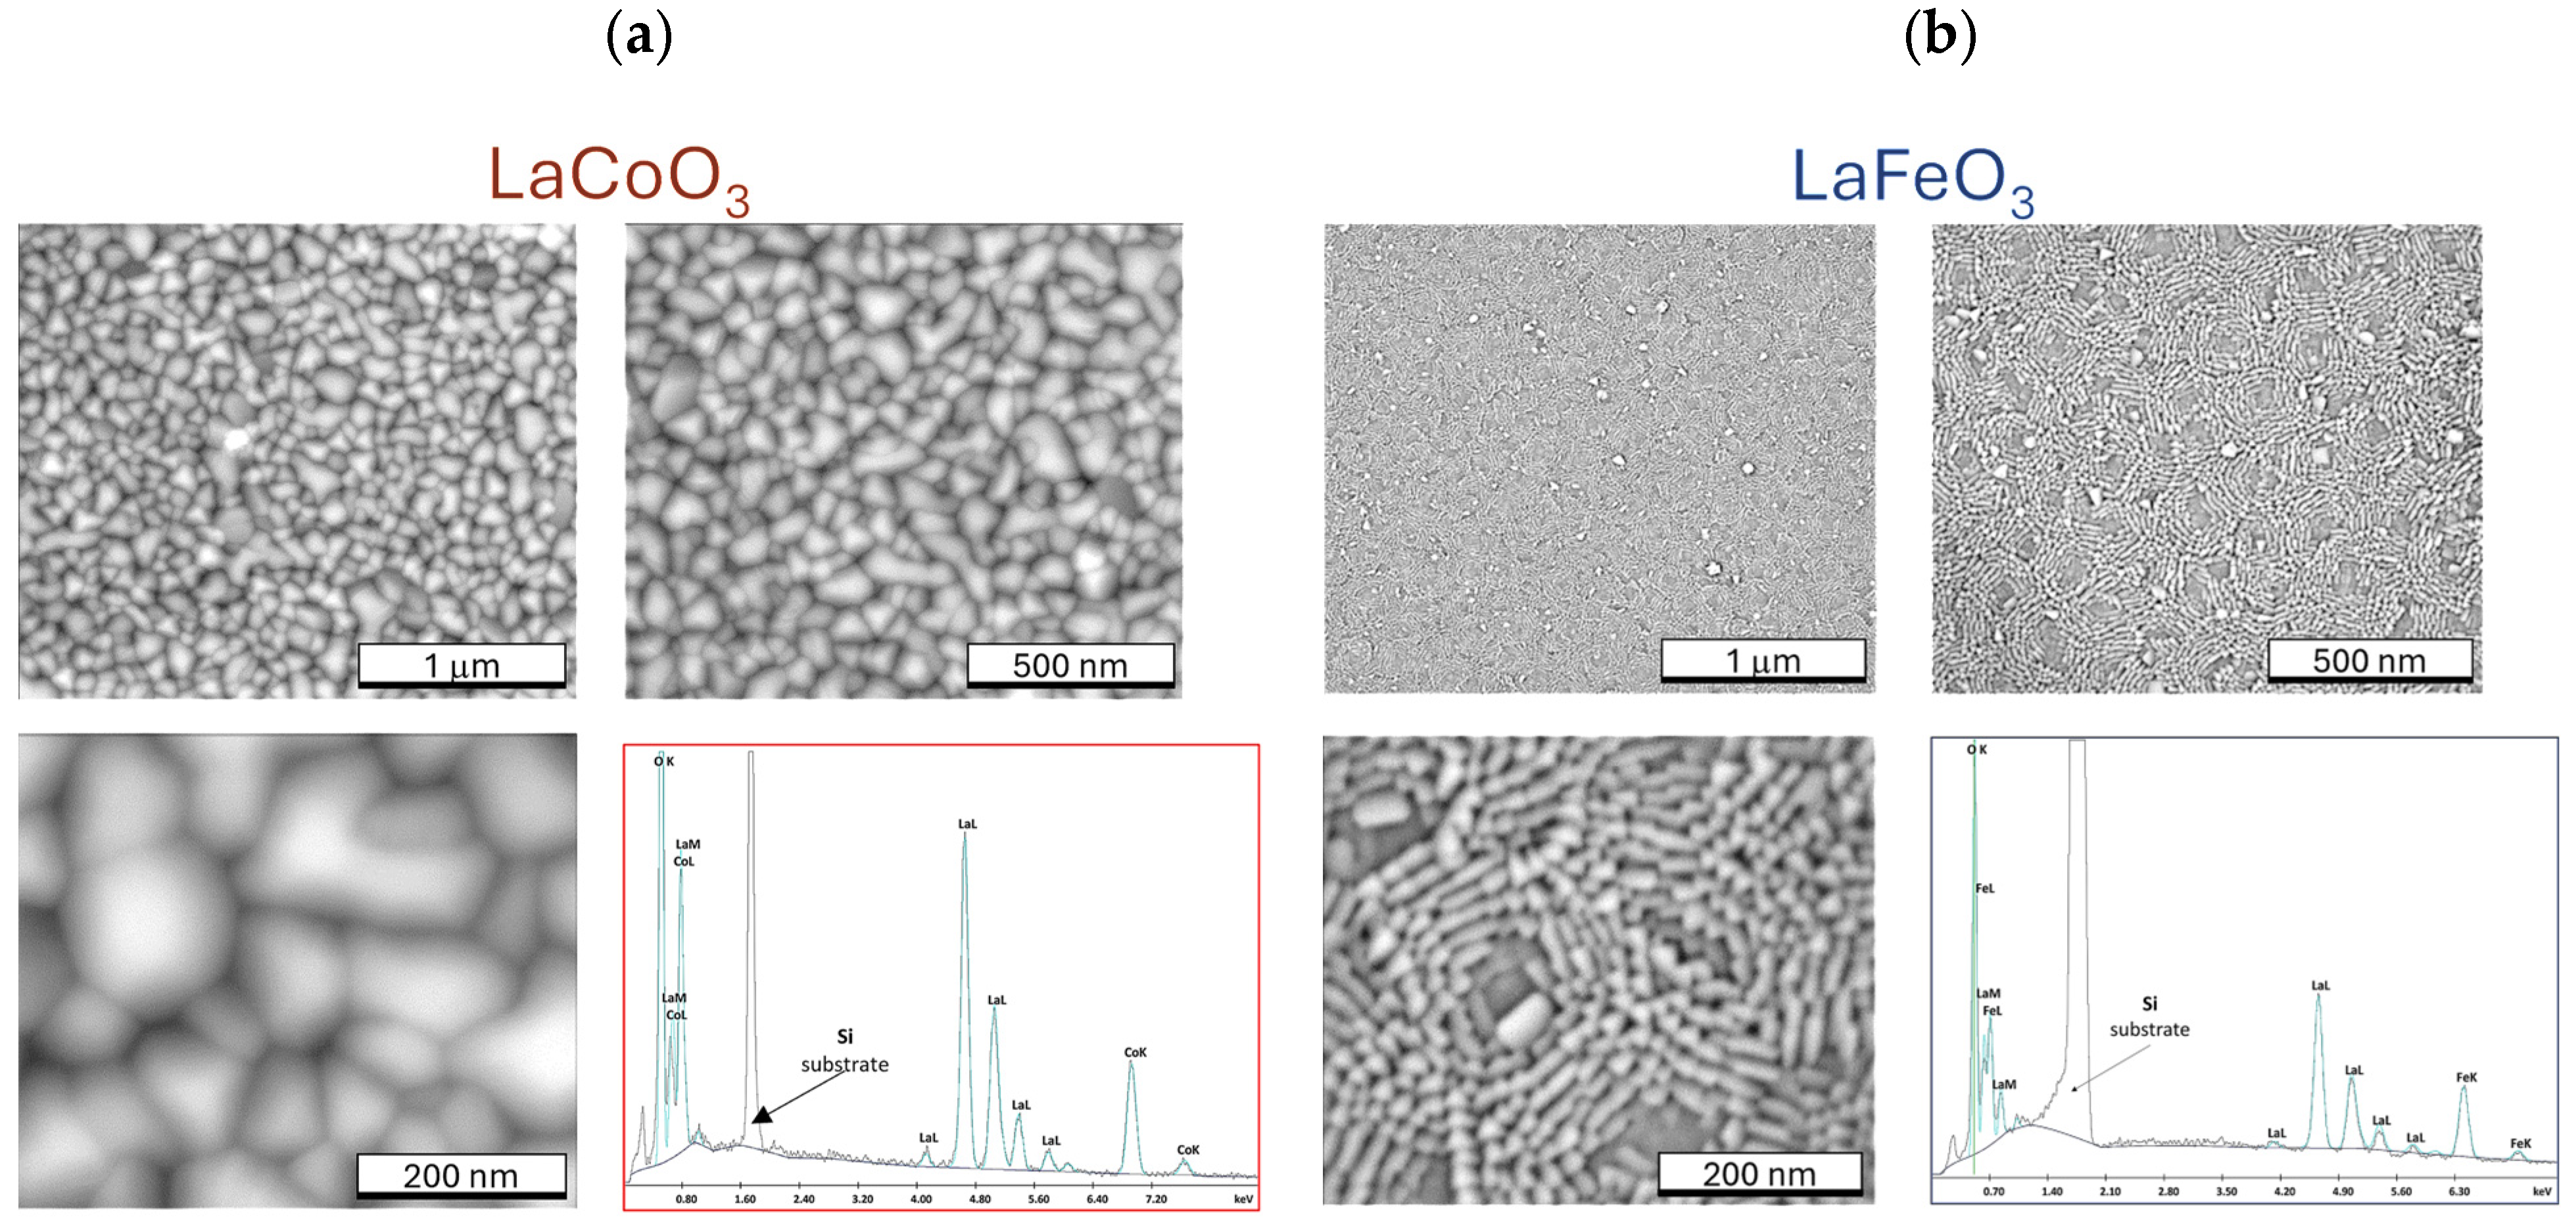
4.3. Microstructure of Thin Films (SEM Observation and EDS Analysis)
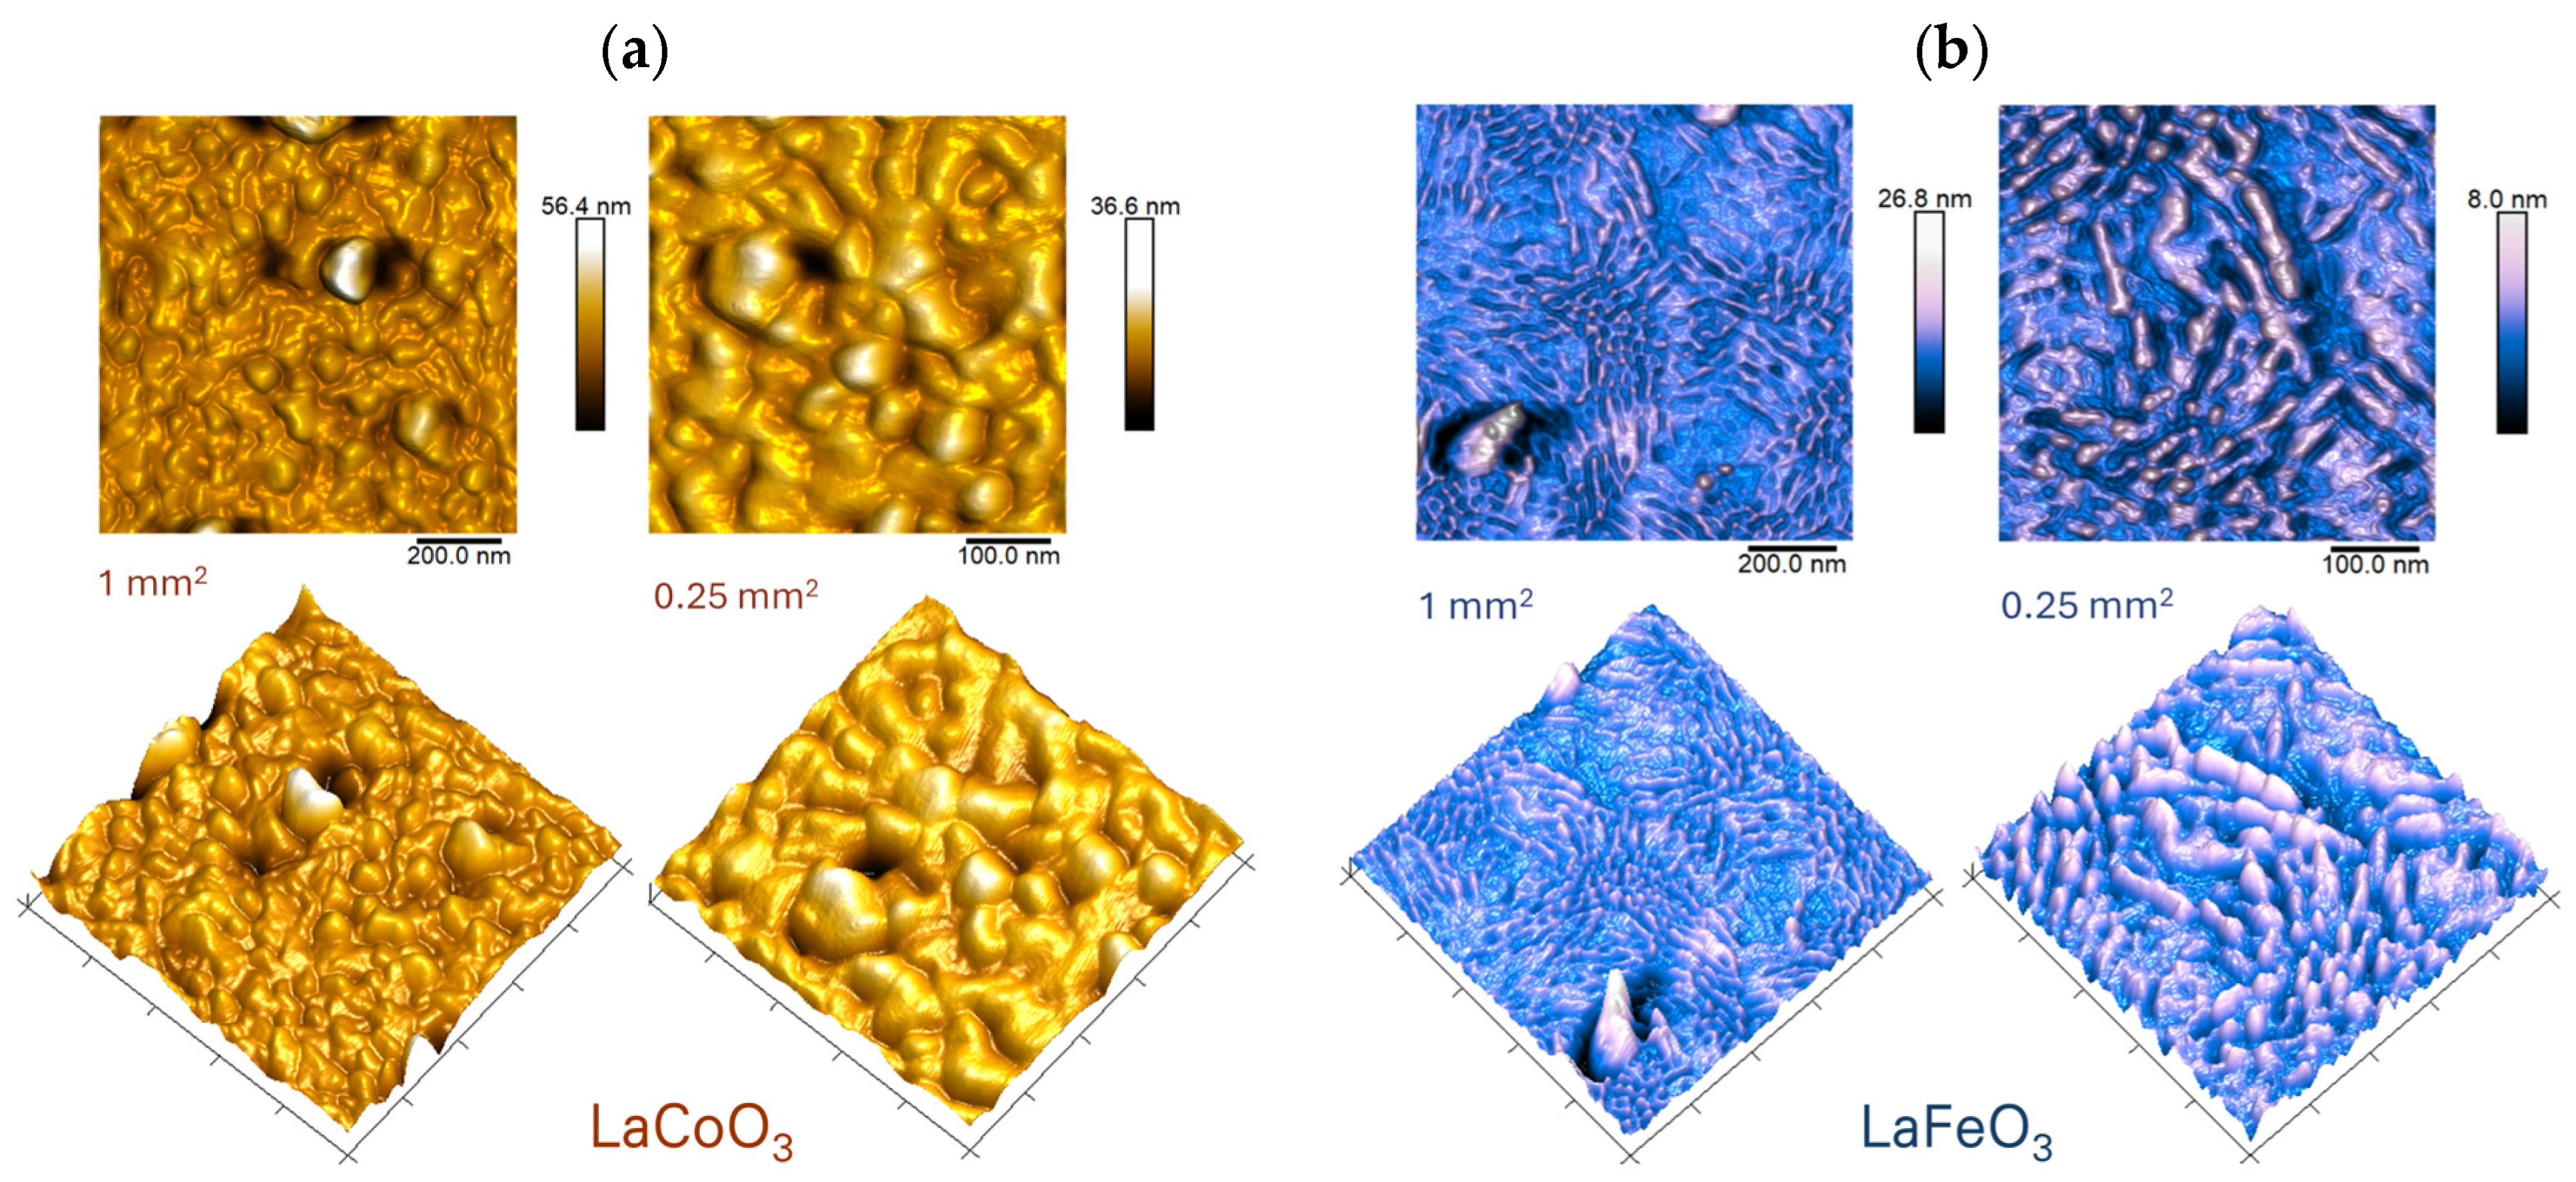
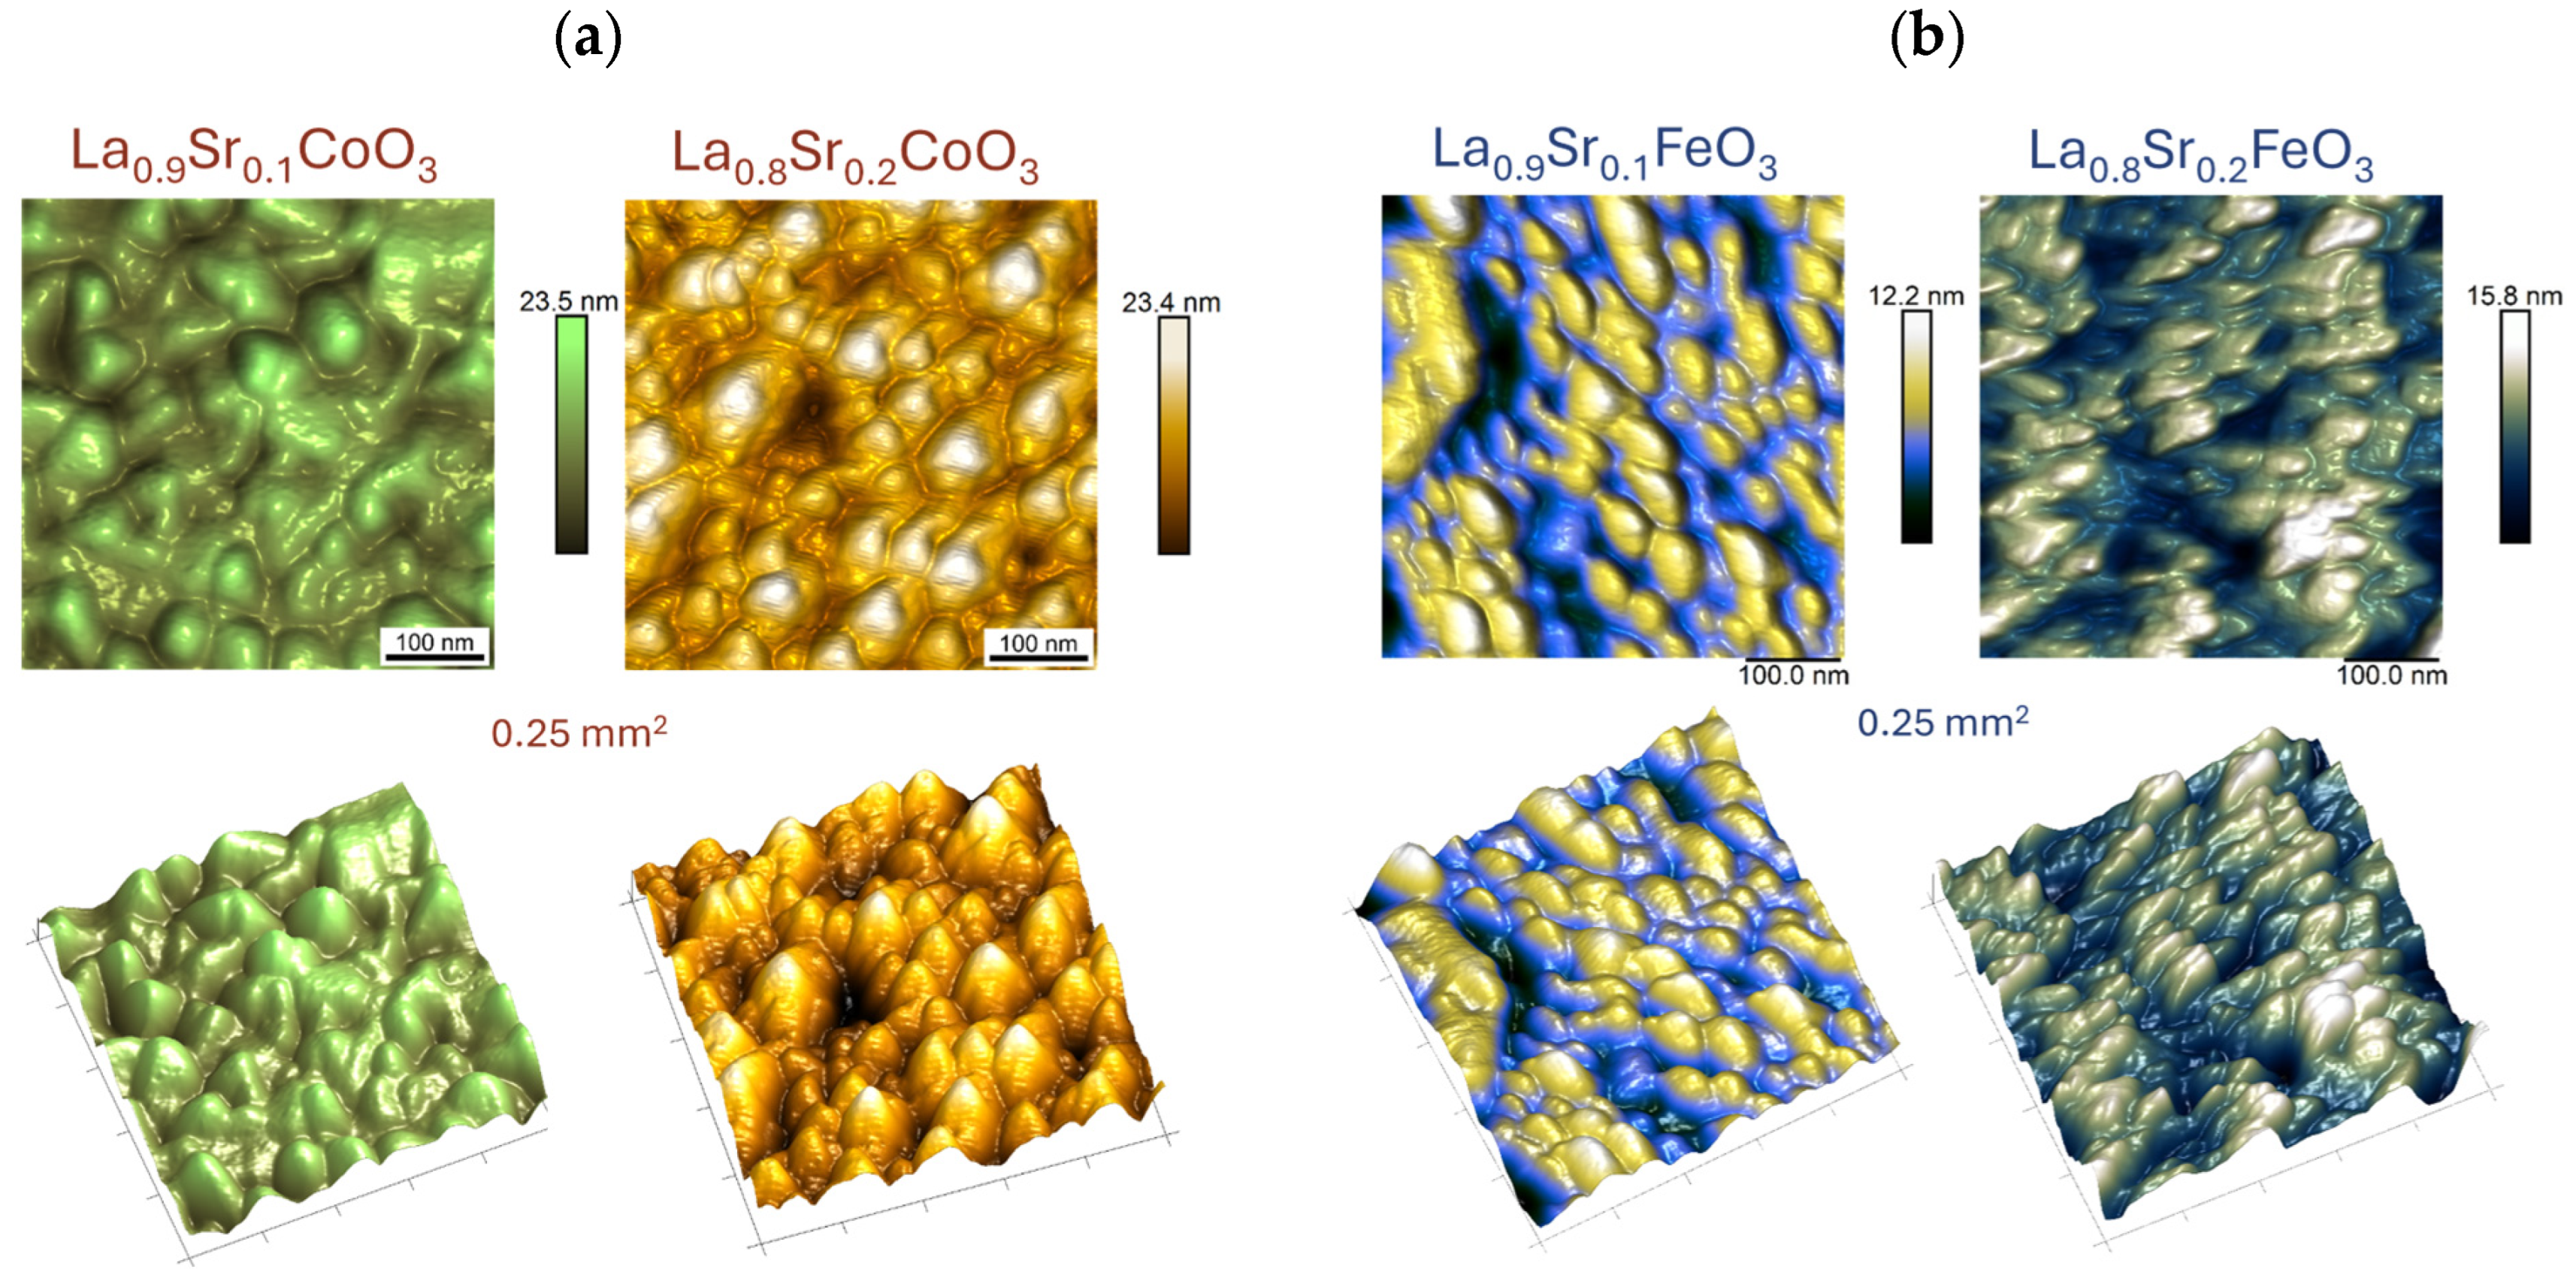
4.4. Topographic Analysis of Thin Film Surfaces (AFM Study and Roughness Parameter Measurements)
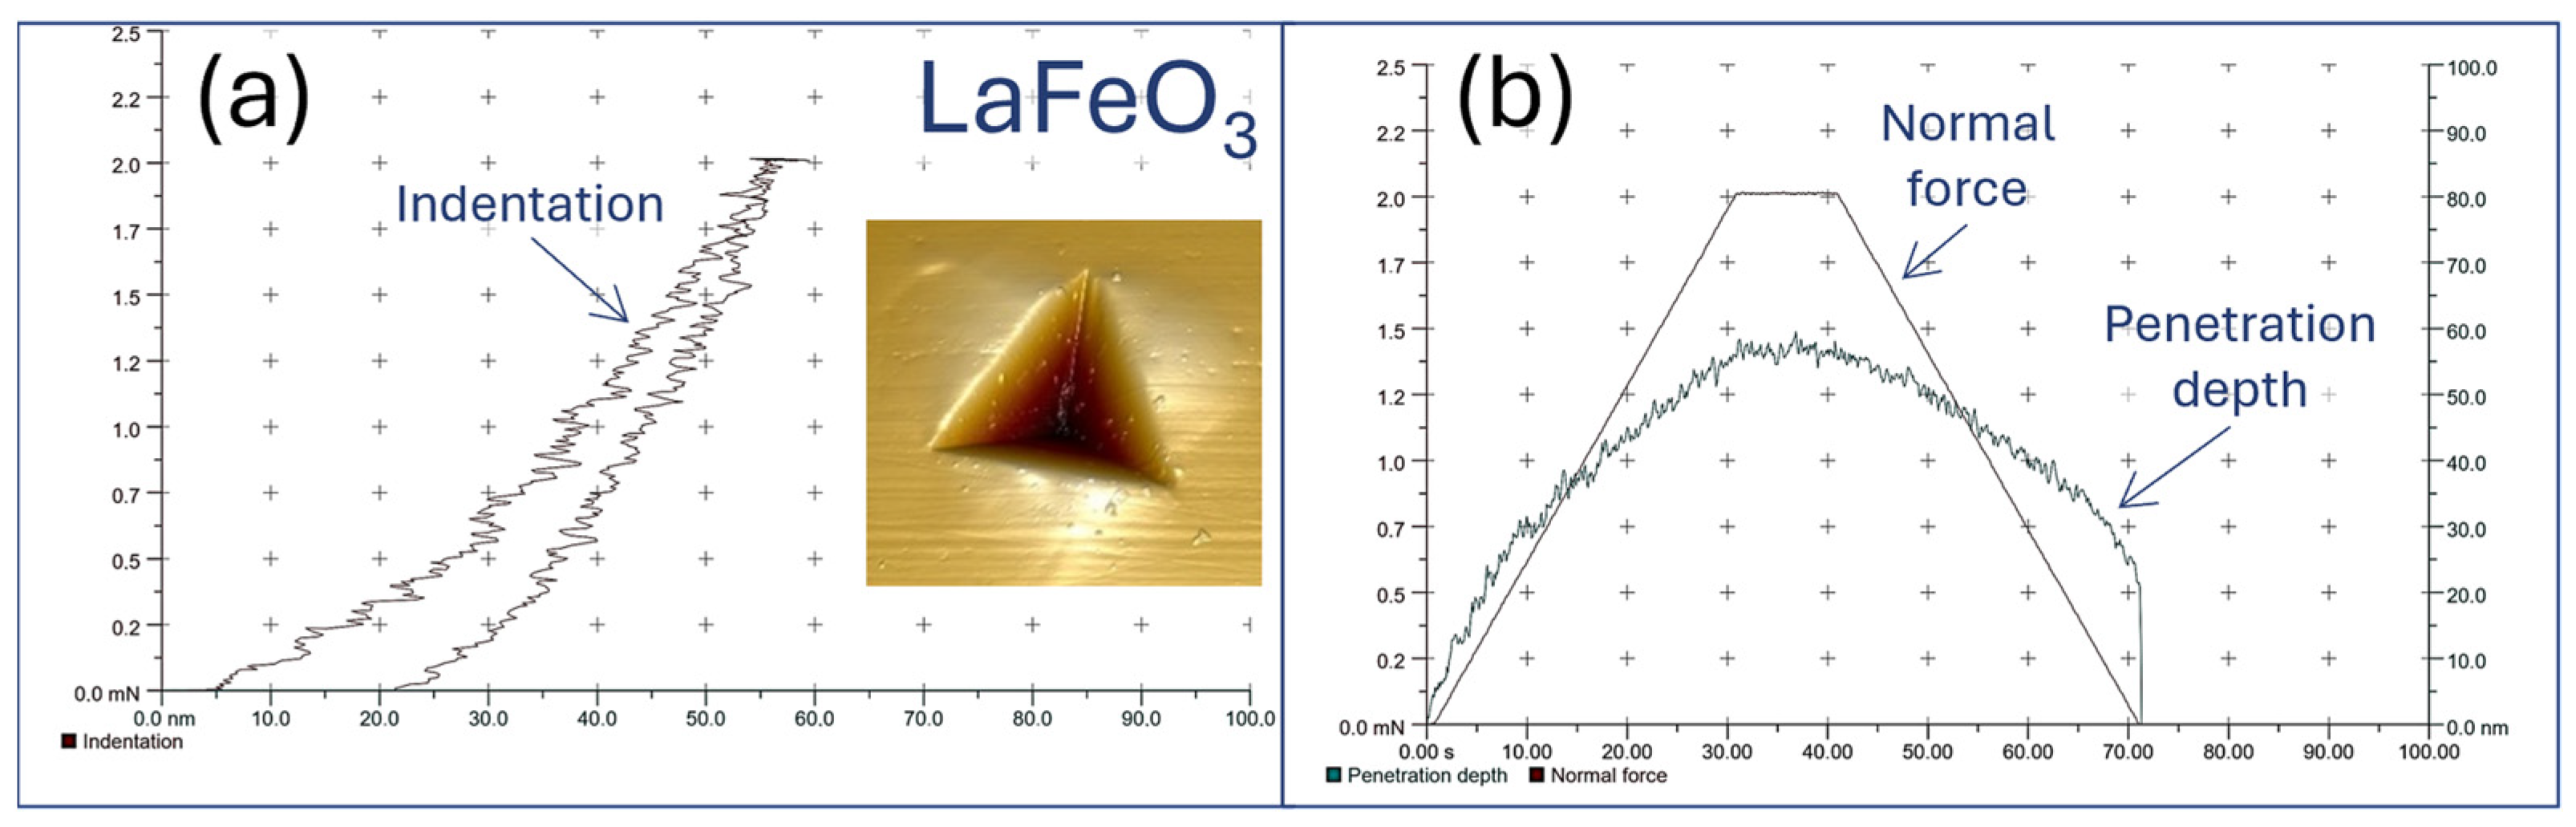
4.5. Nanoscale Hardness and Scratch Testing (Adhesion Measurements)
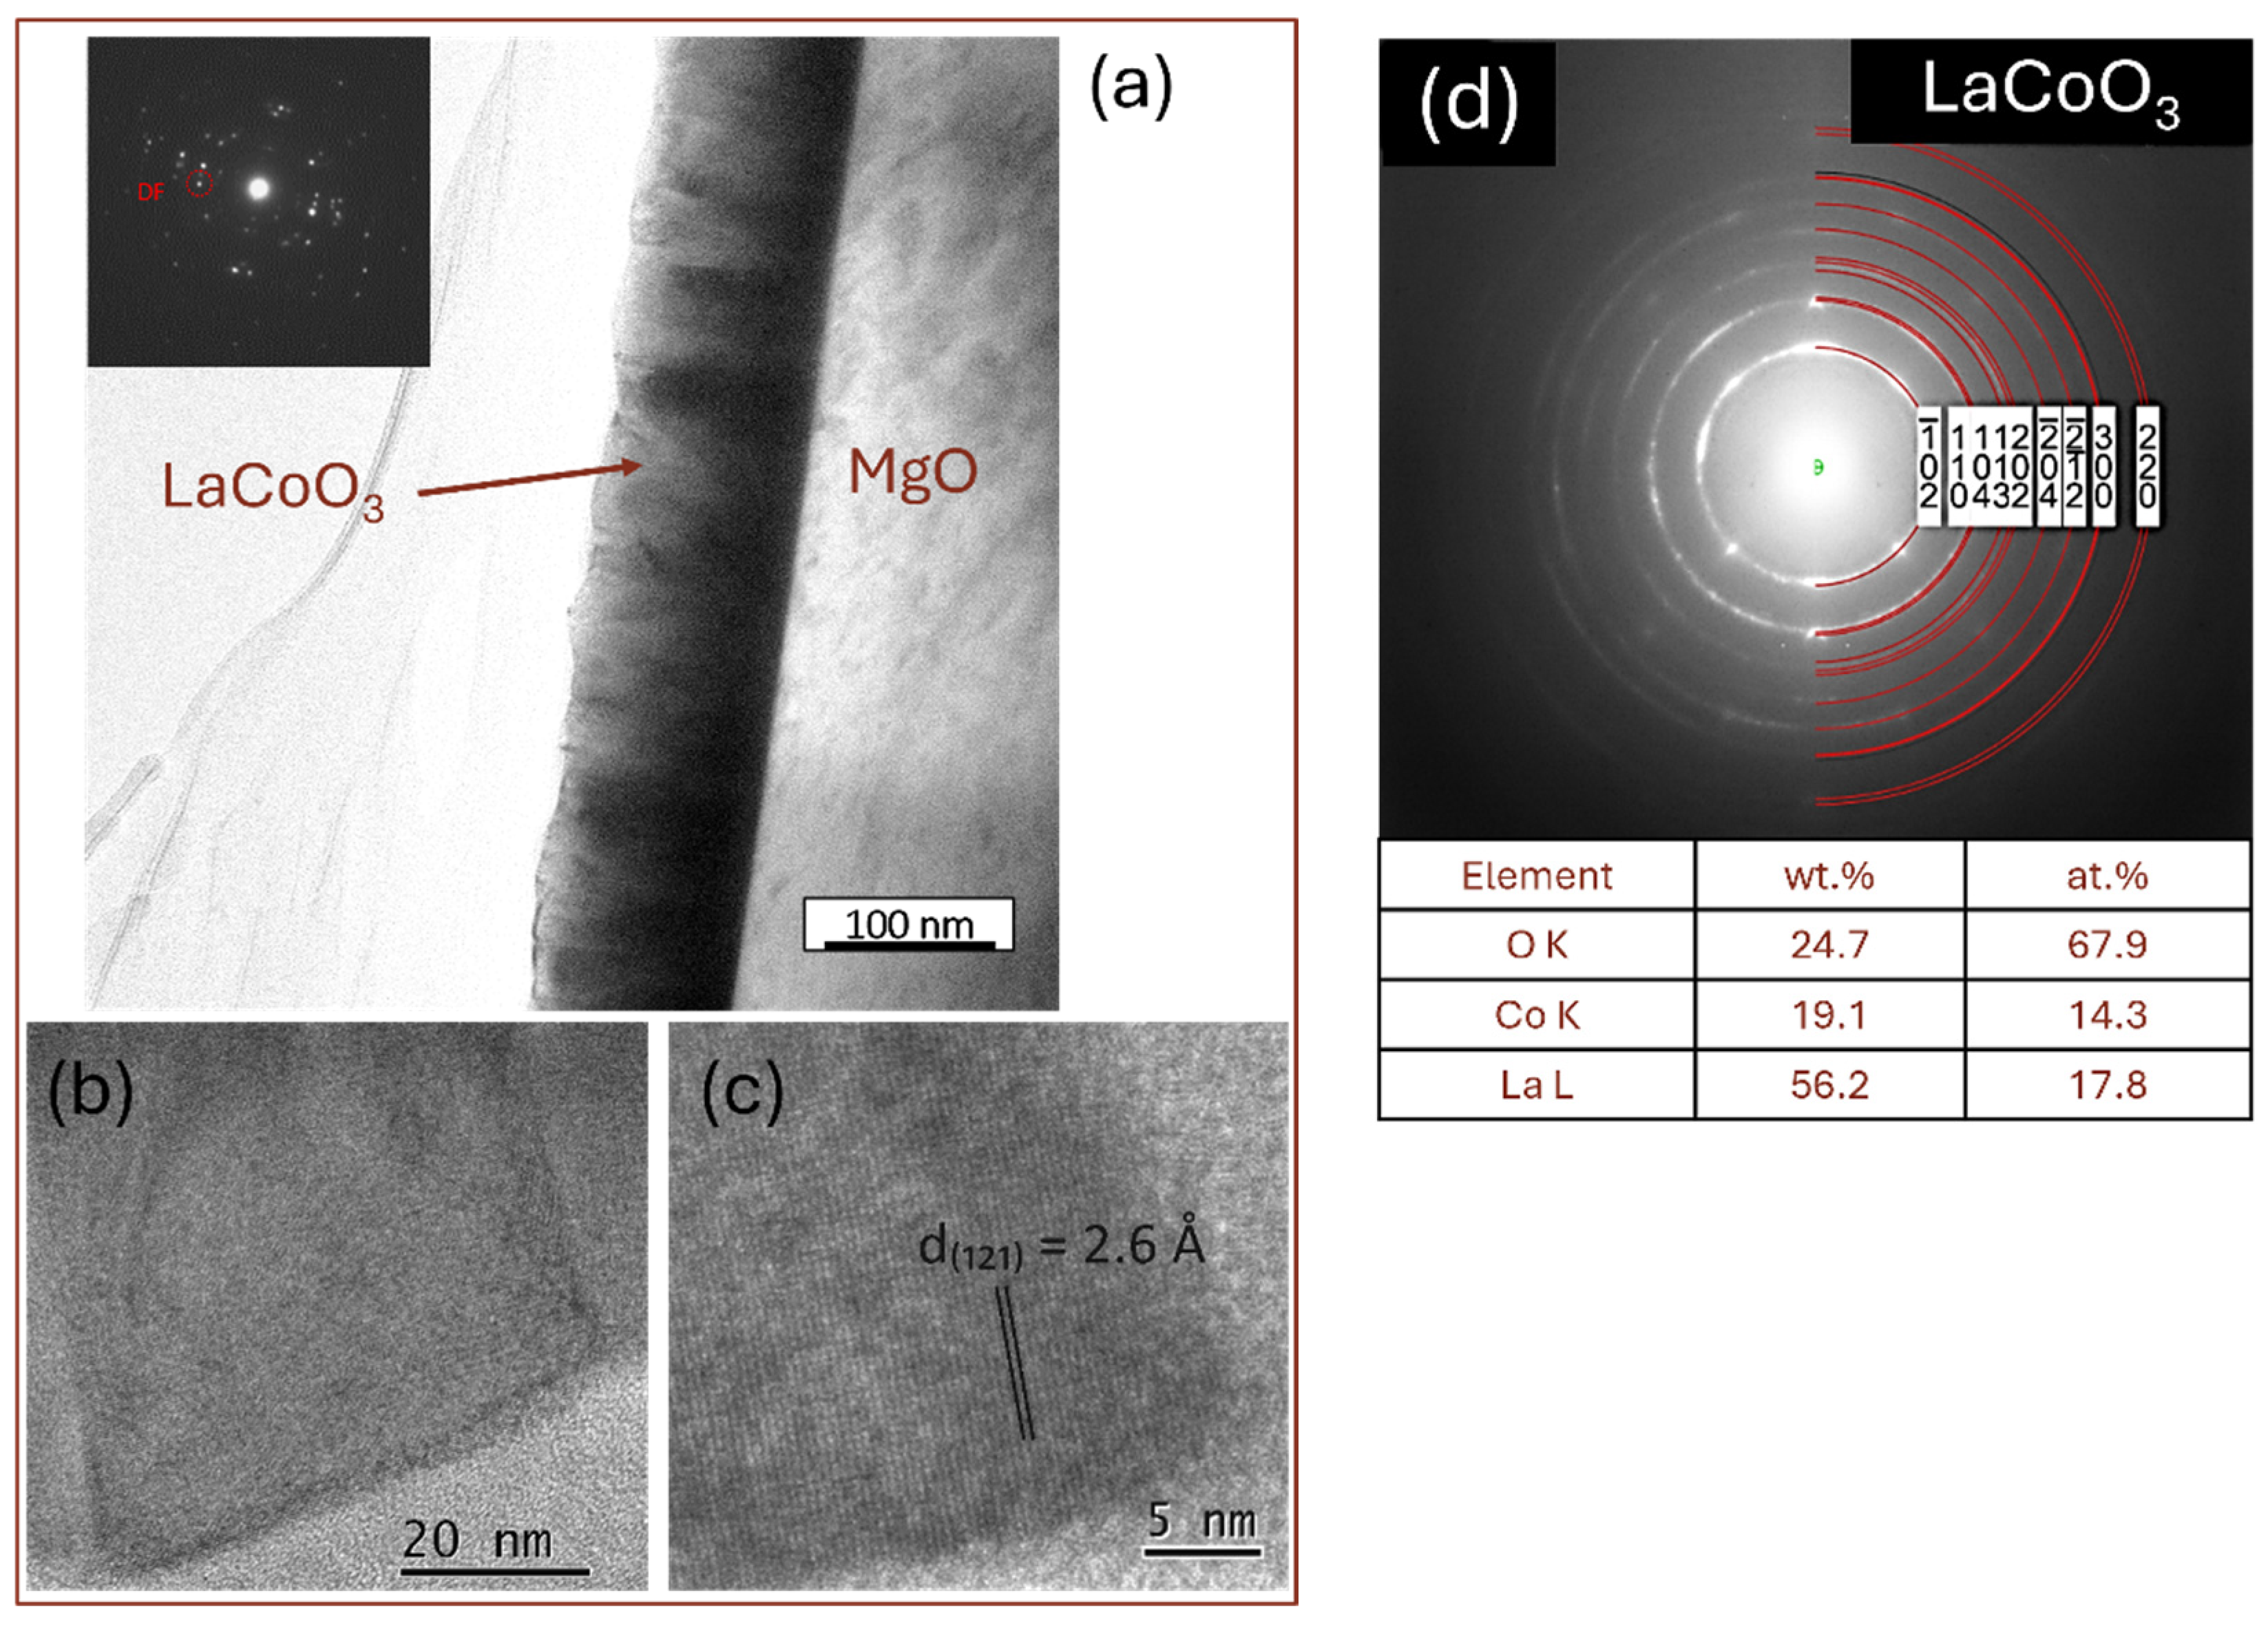
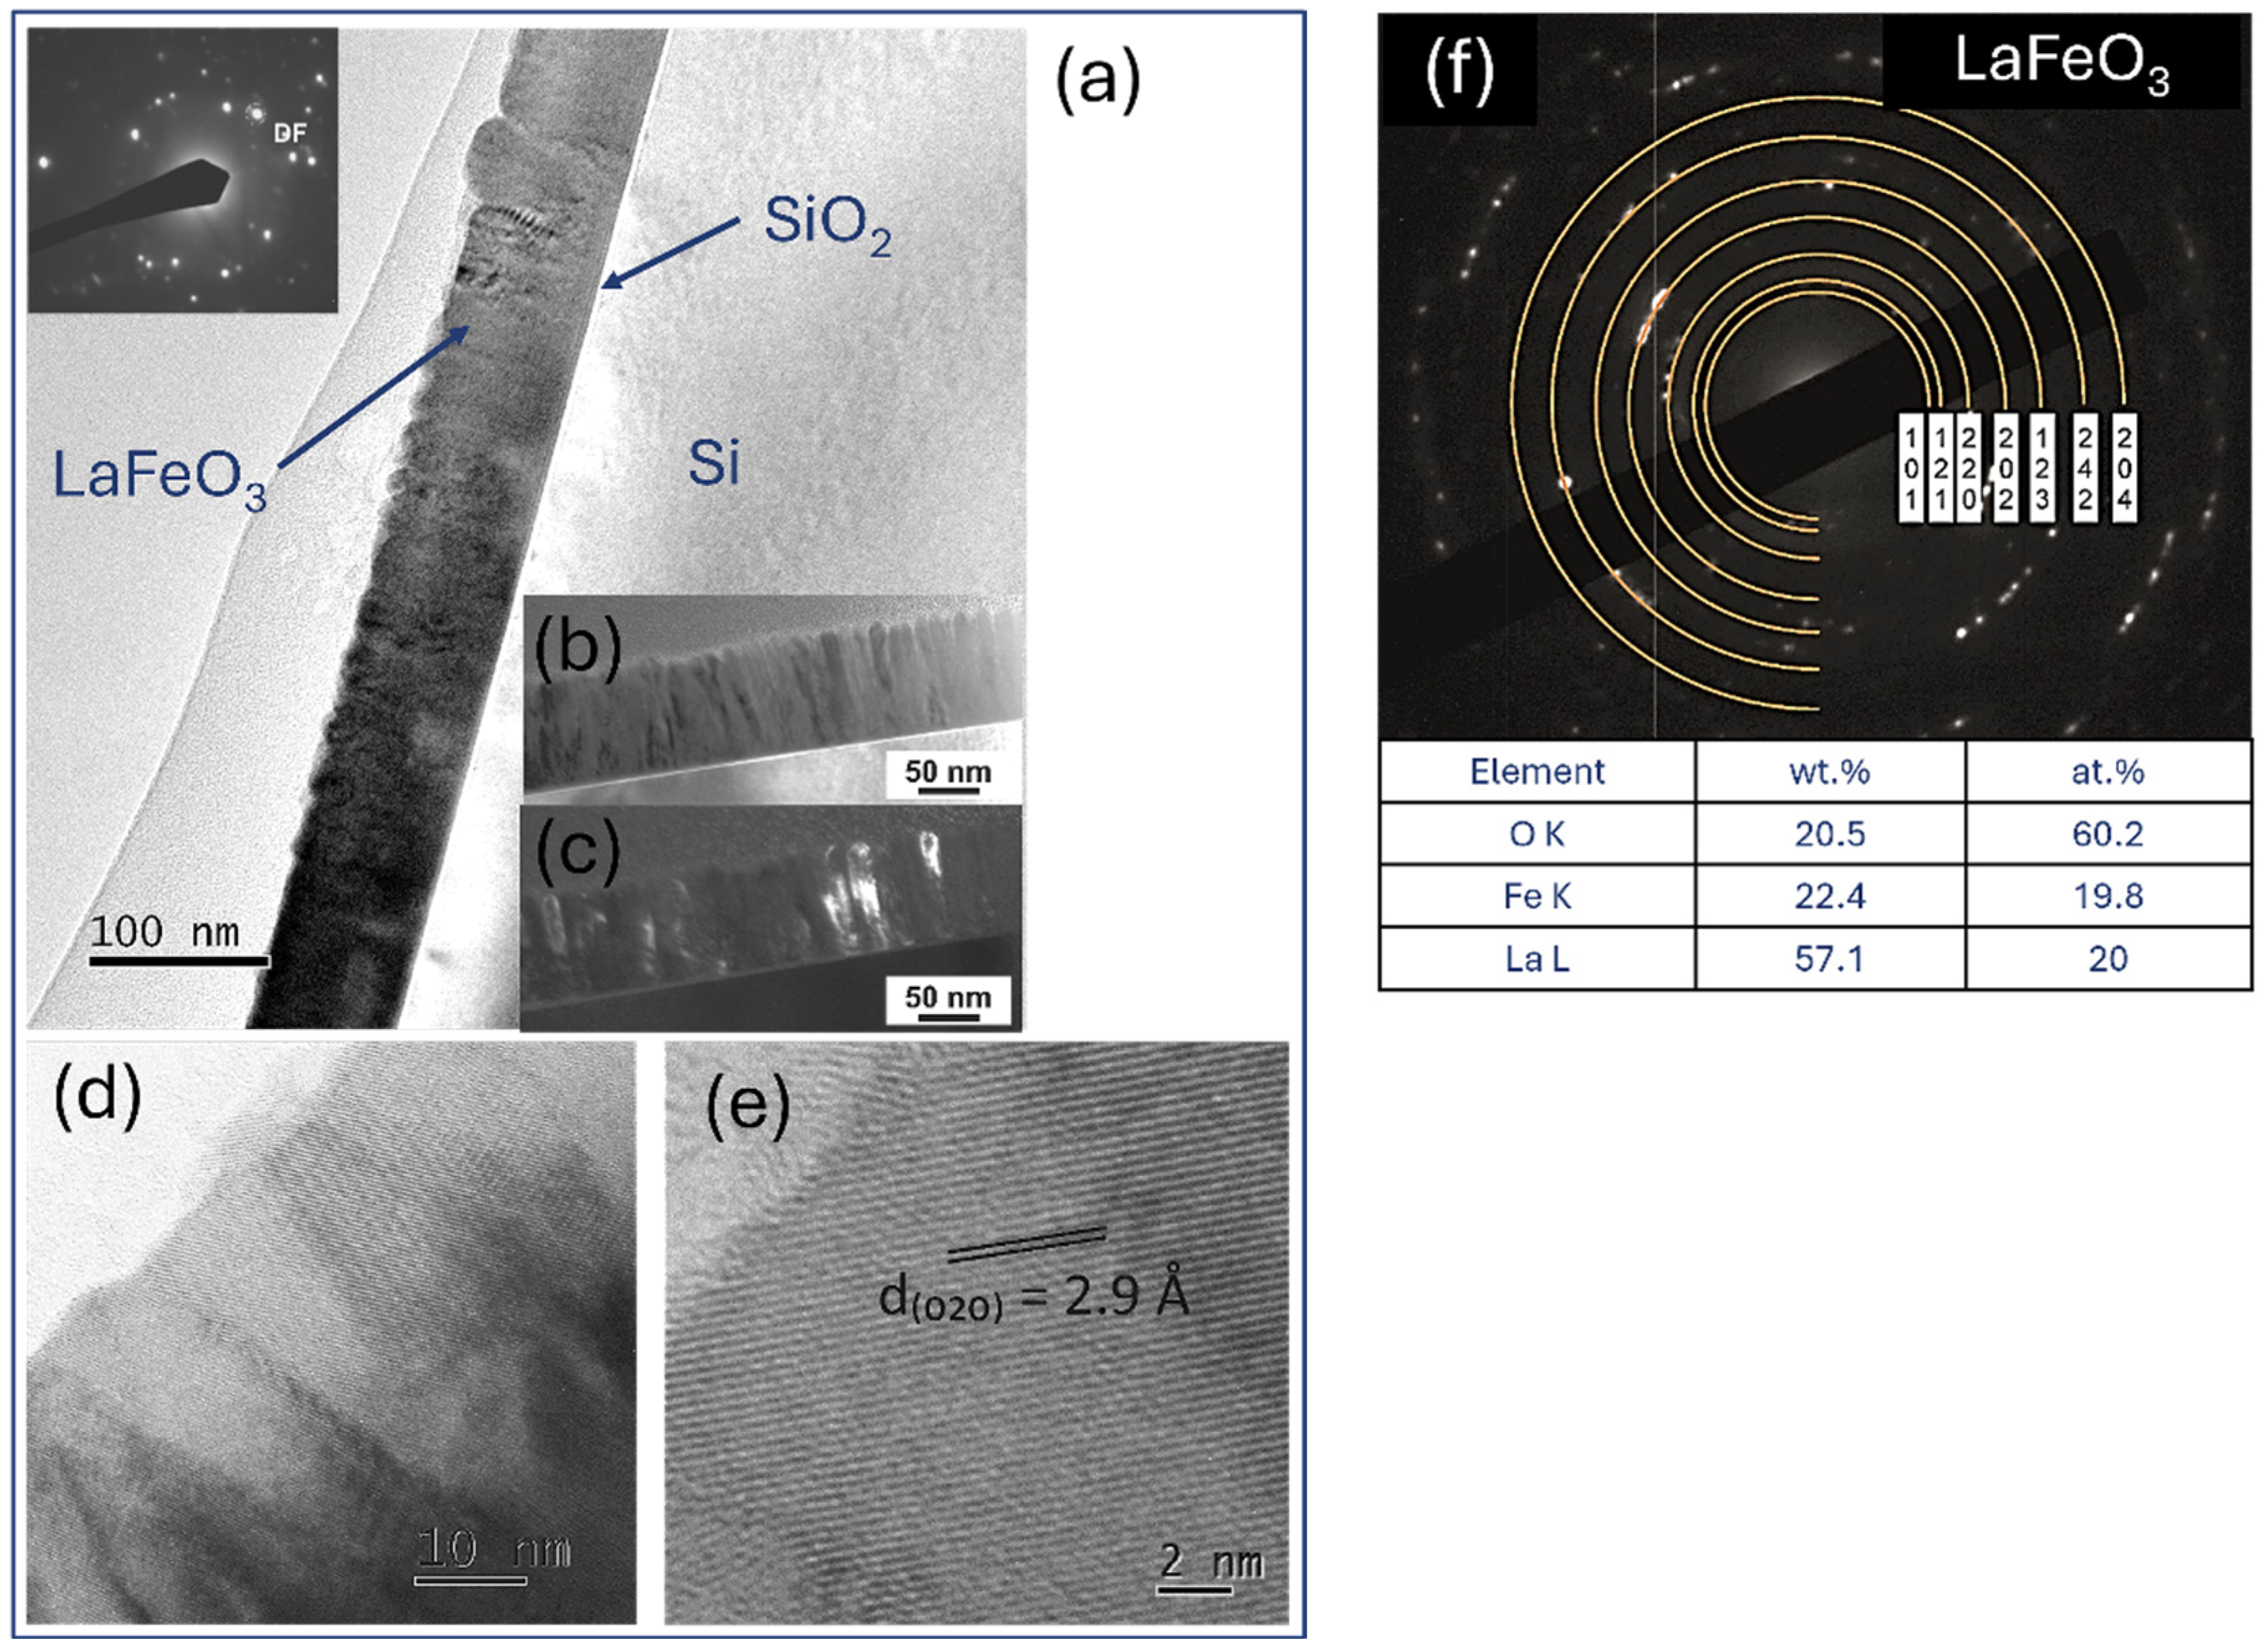
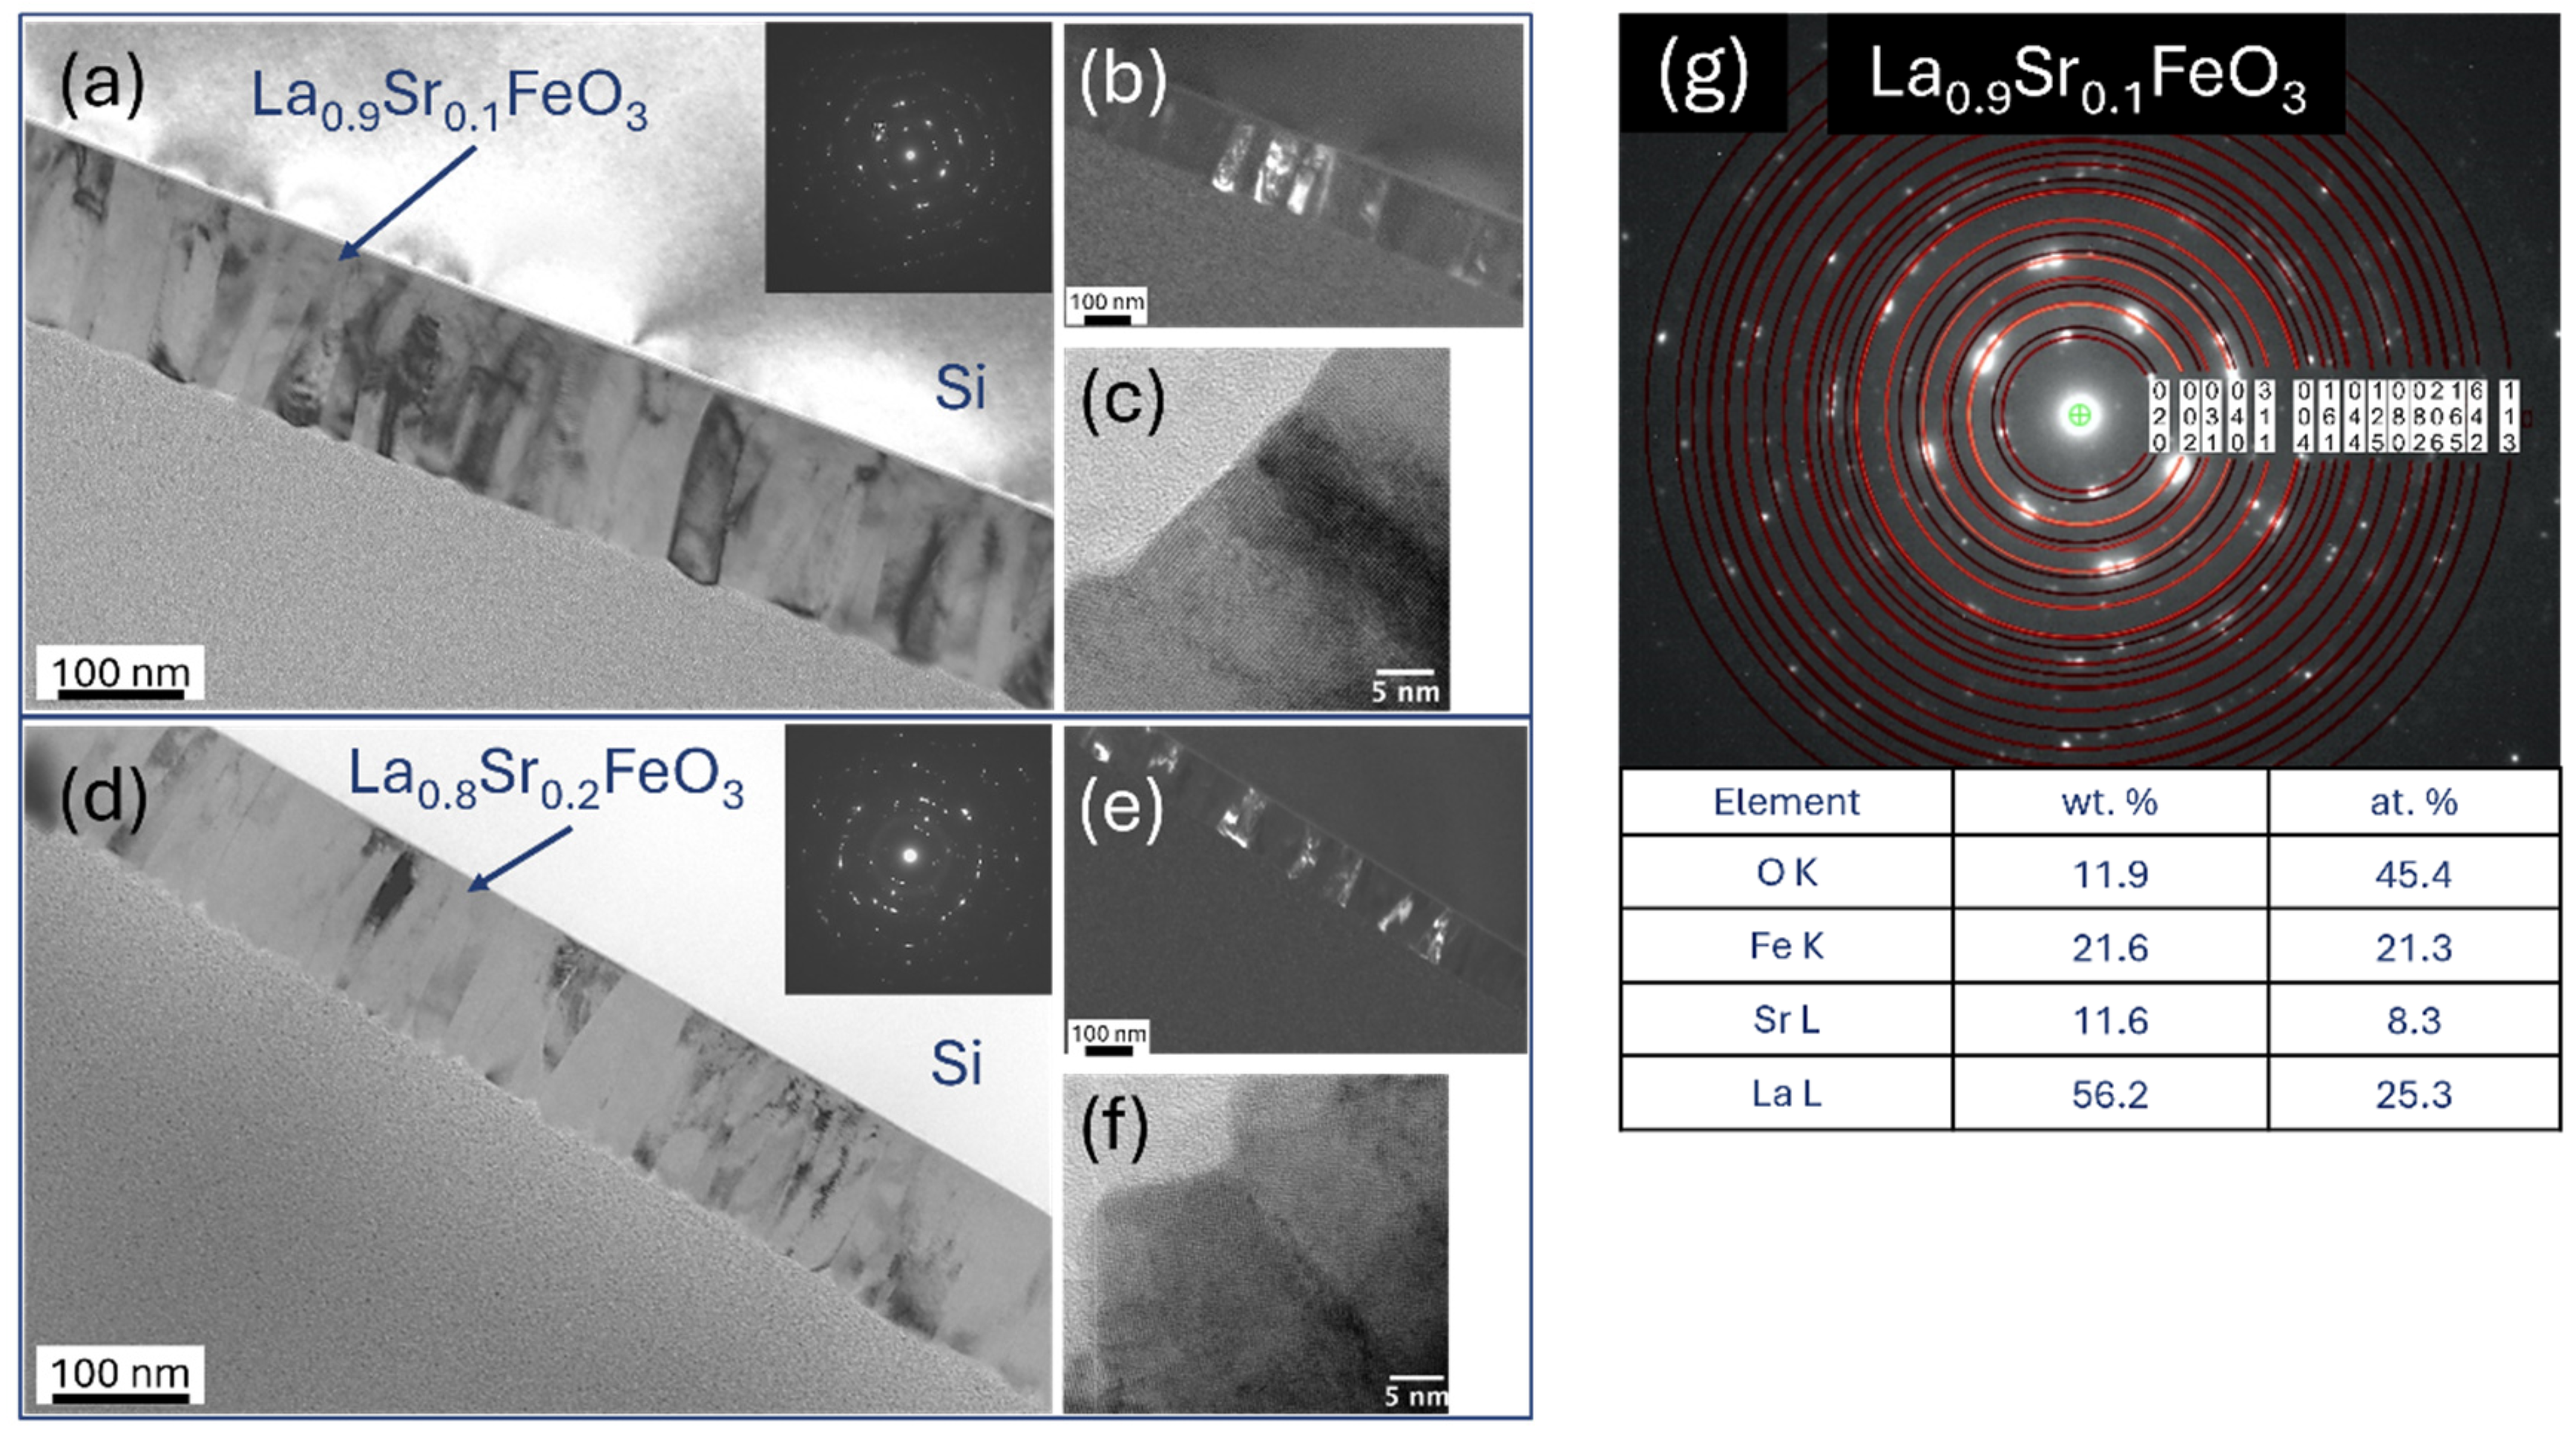
4.6. TEM Microstructure Investigation
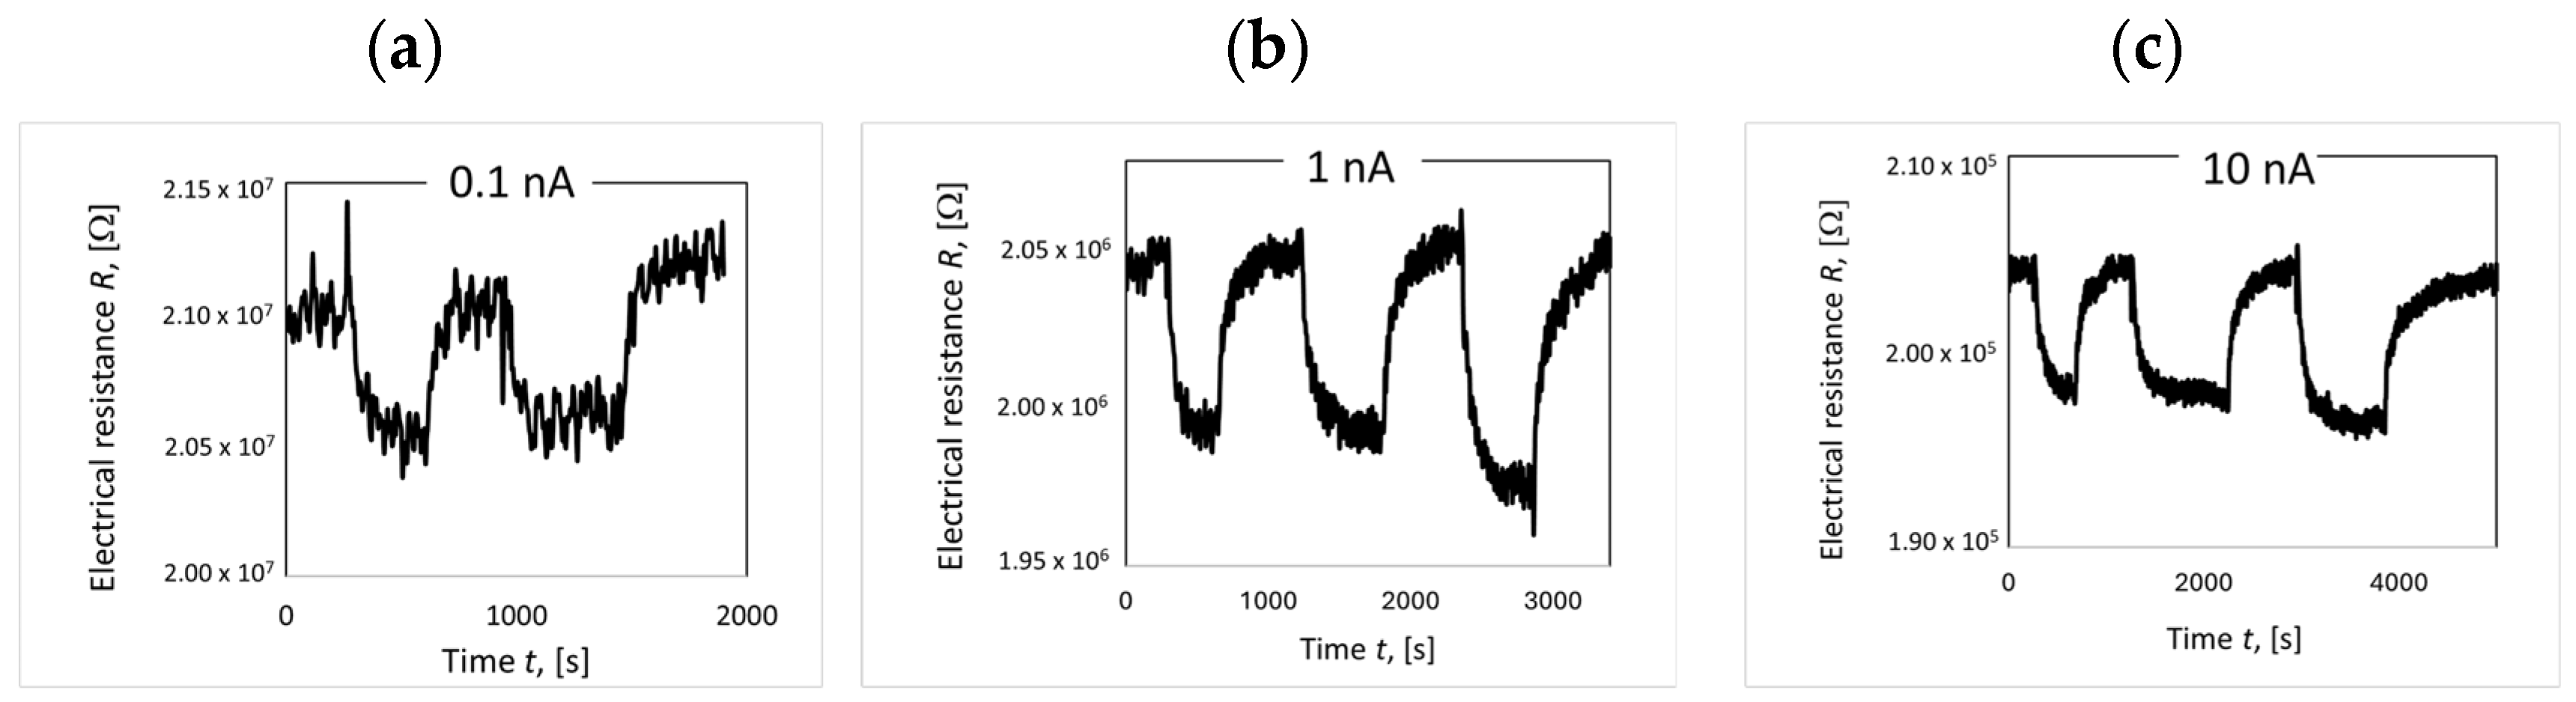
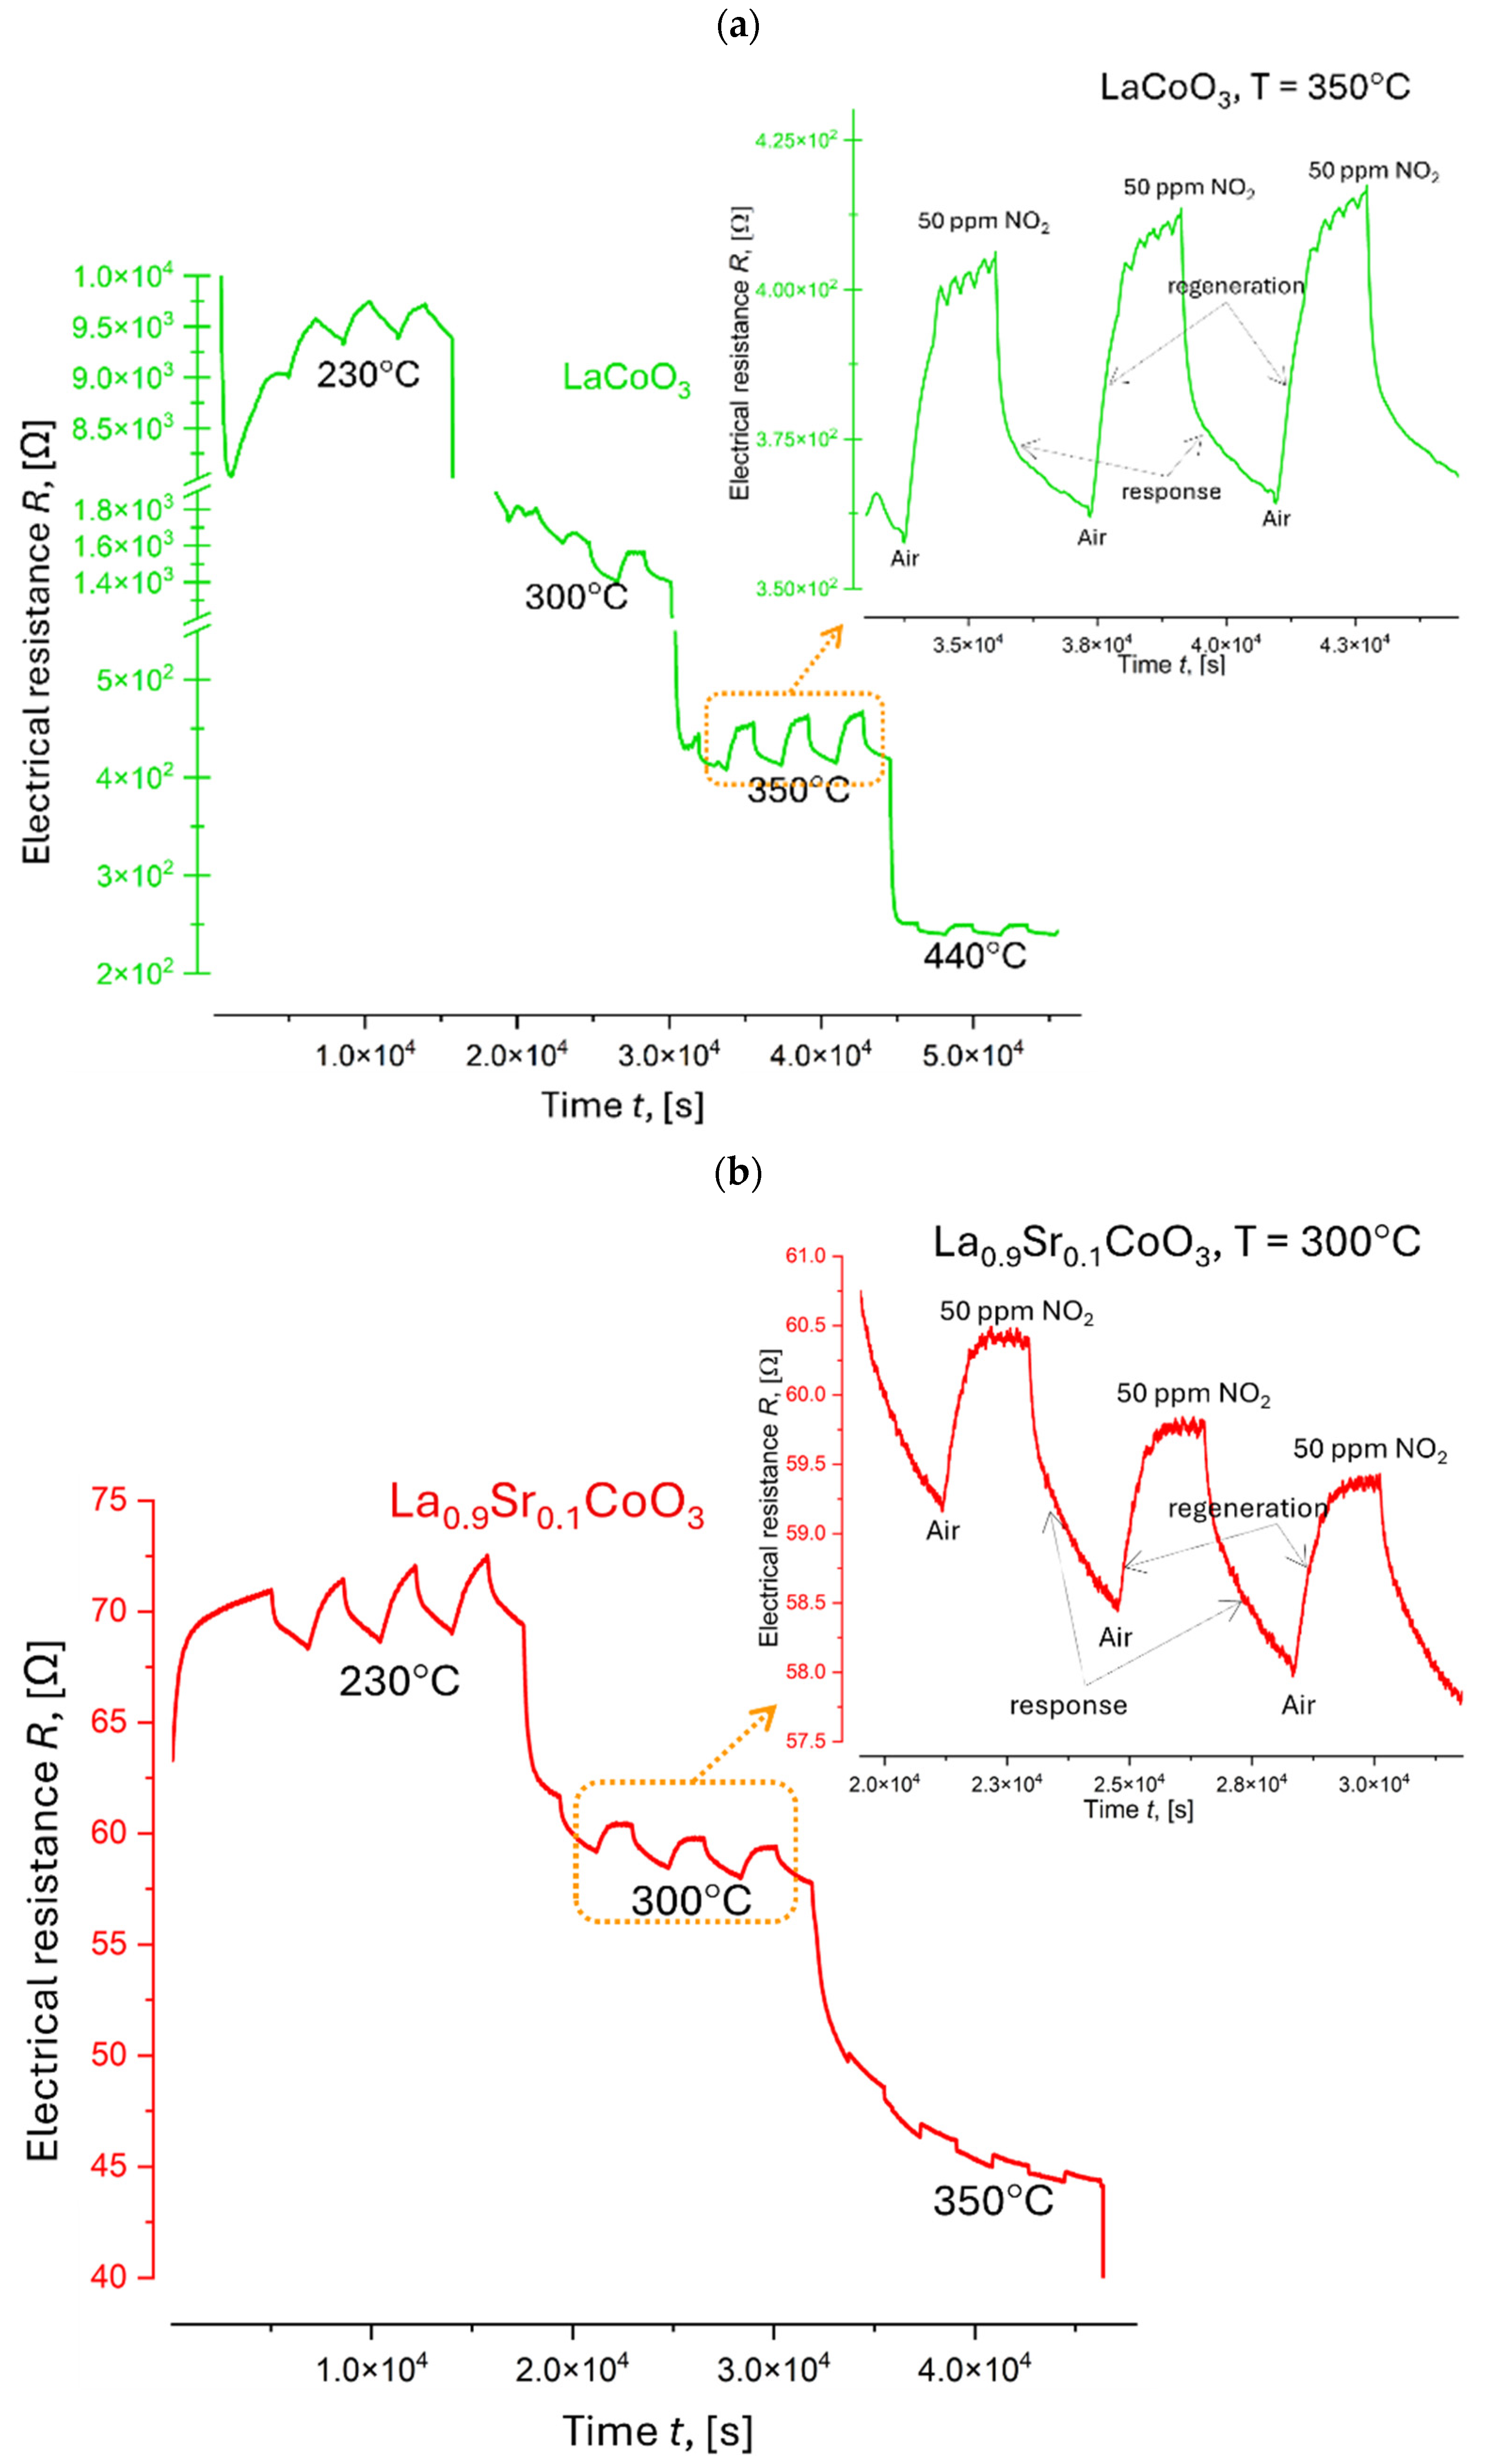
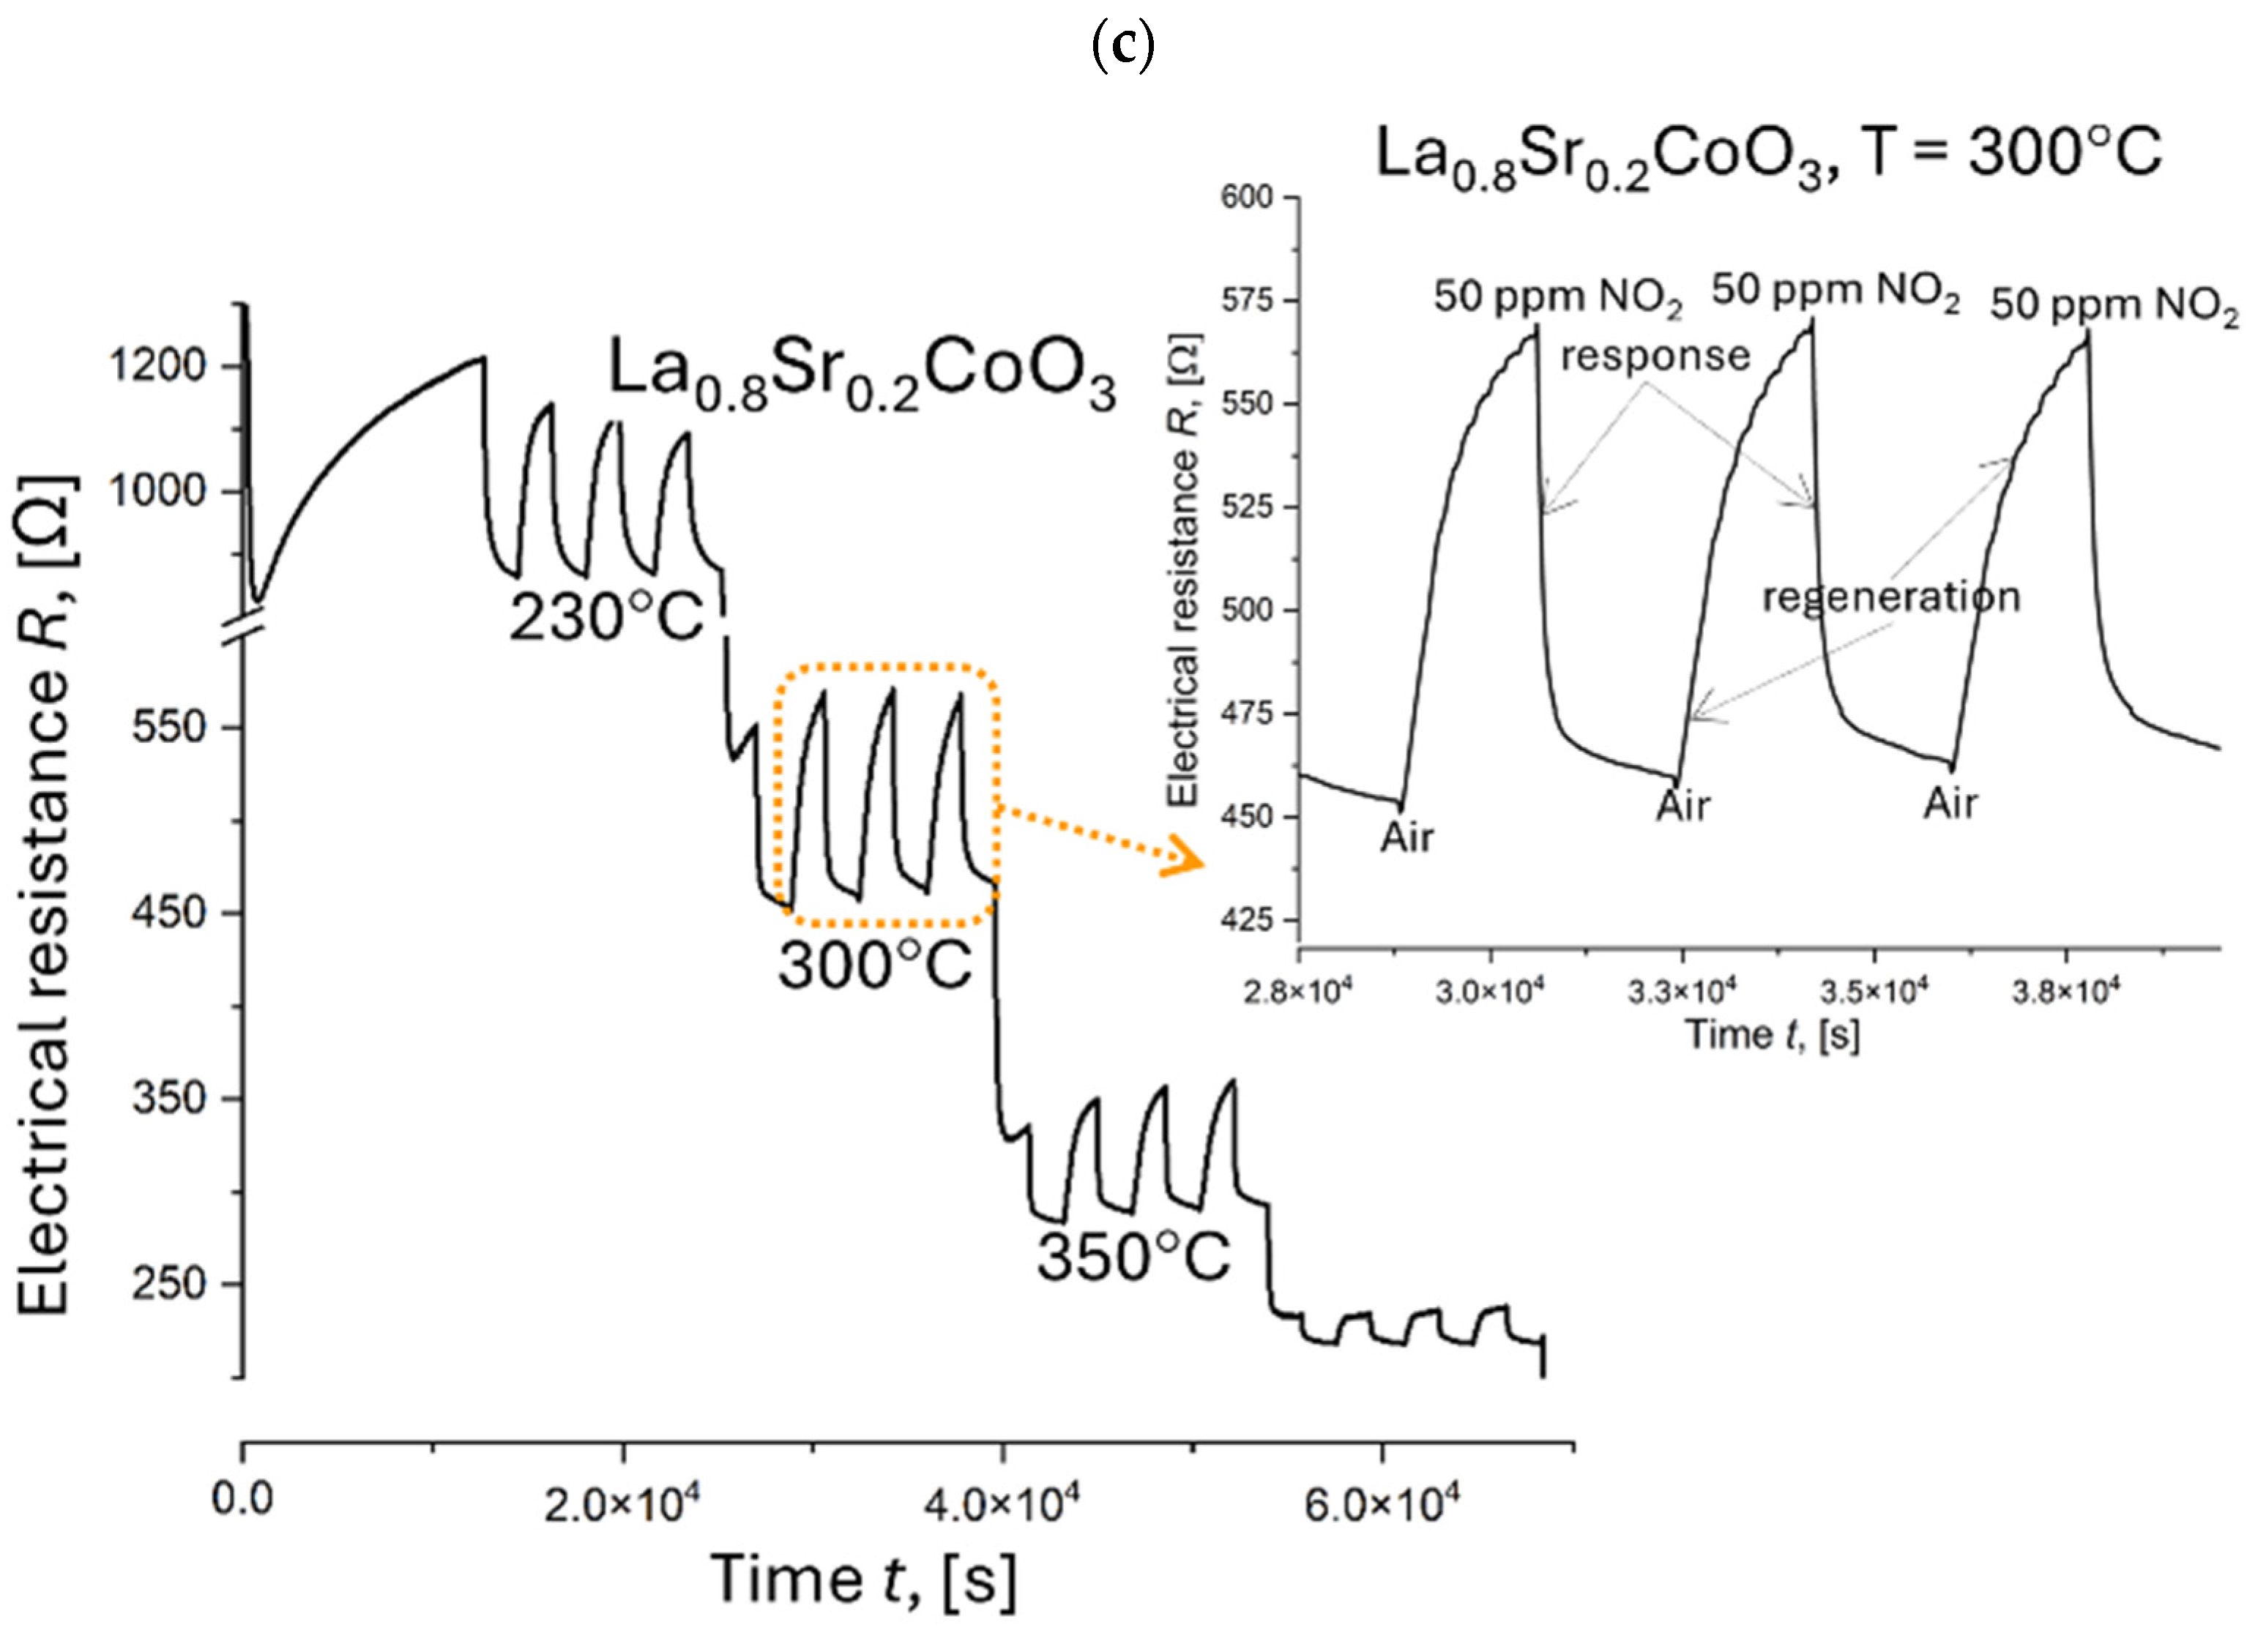
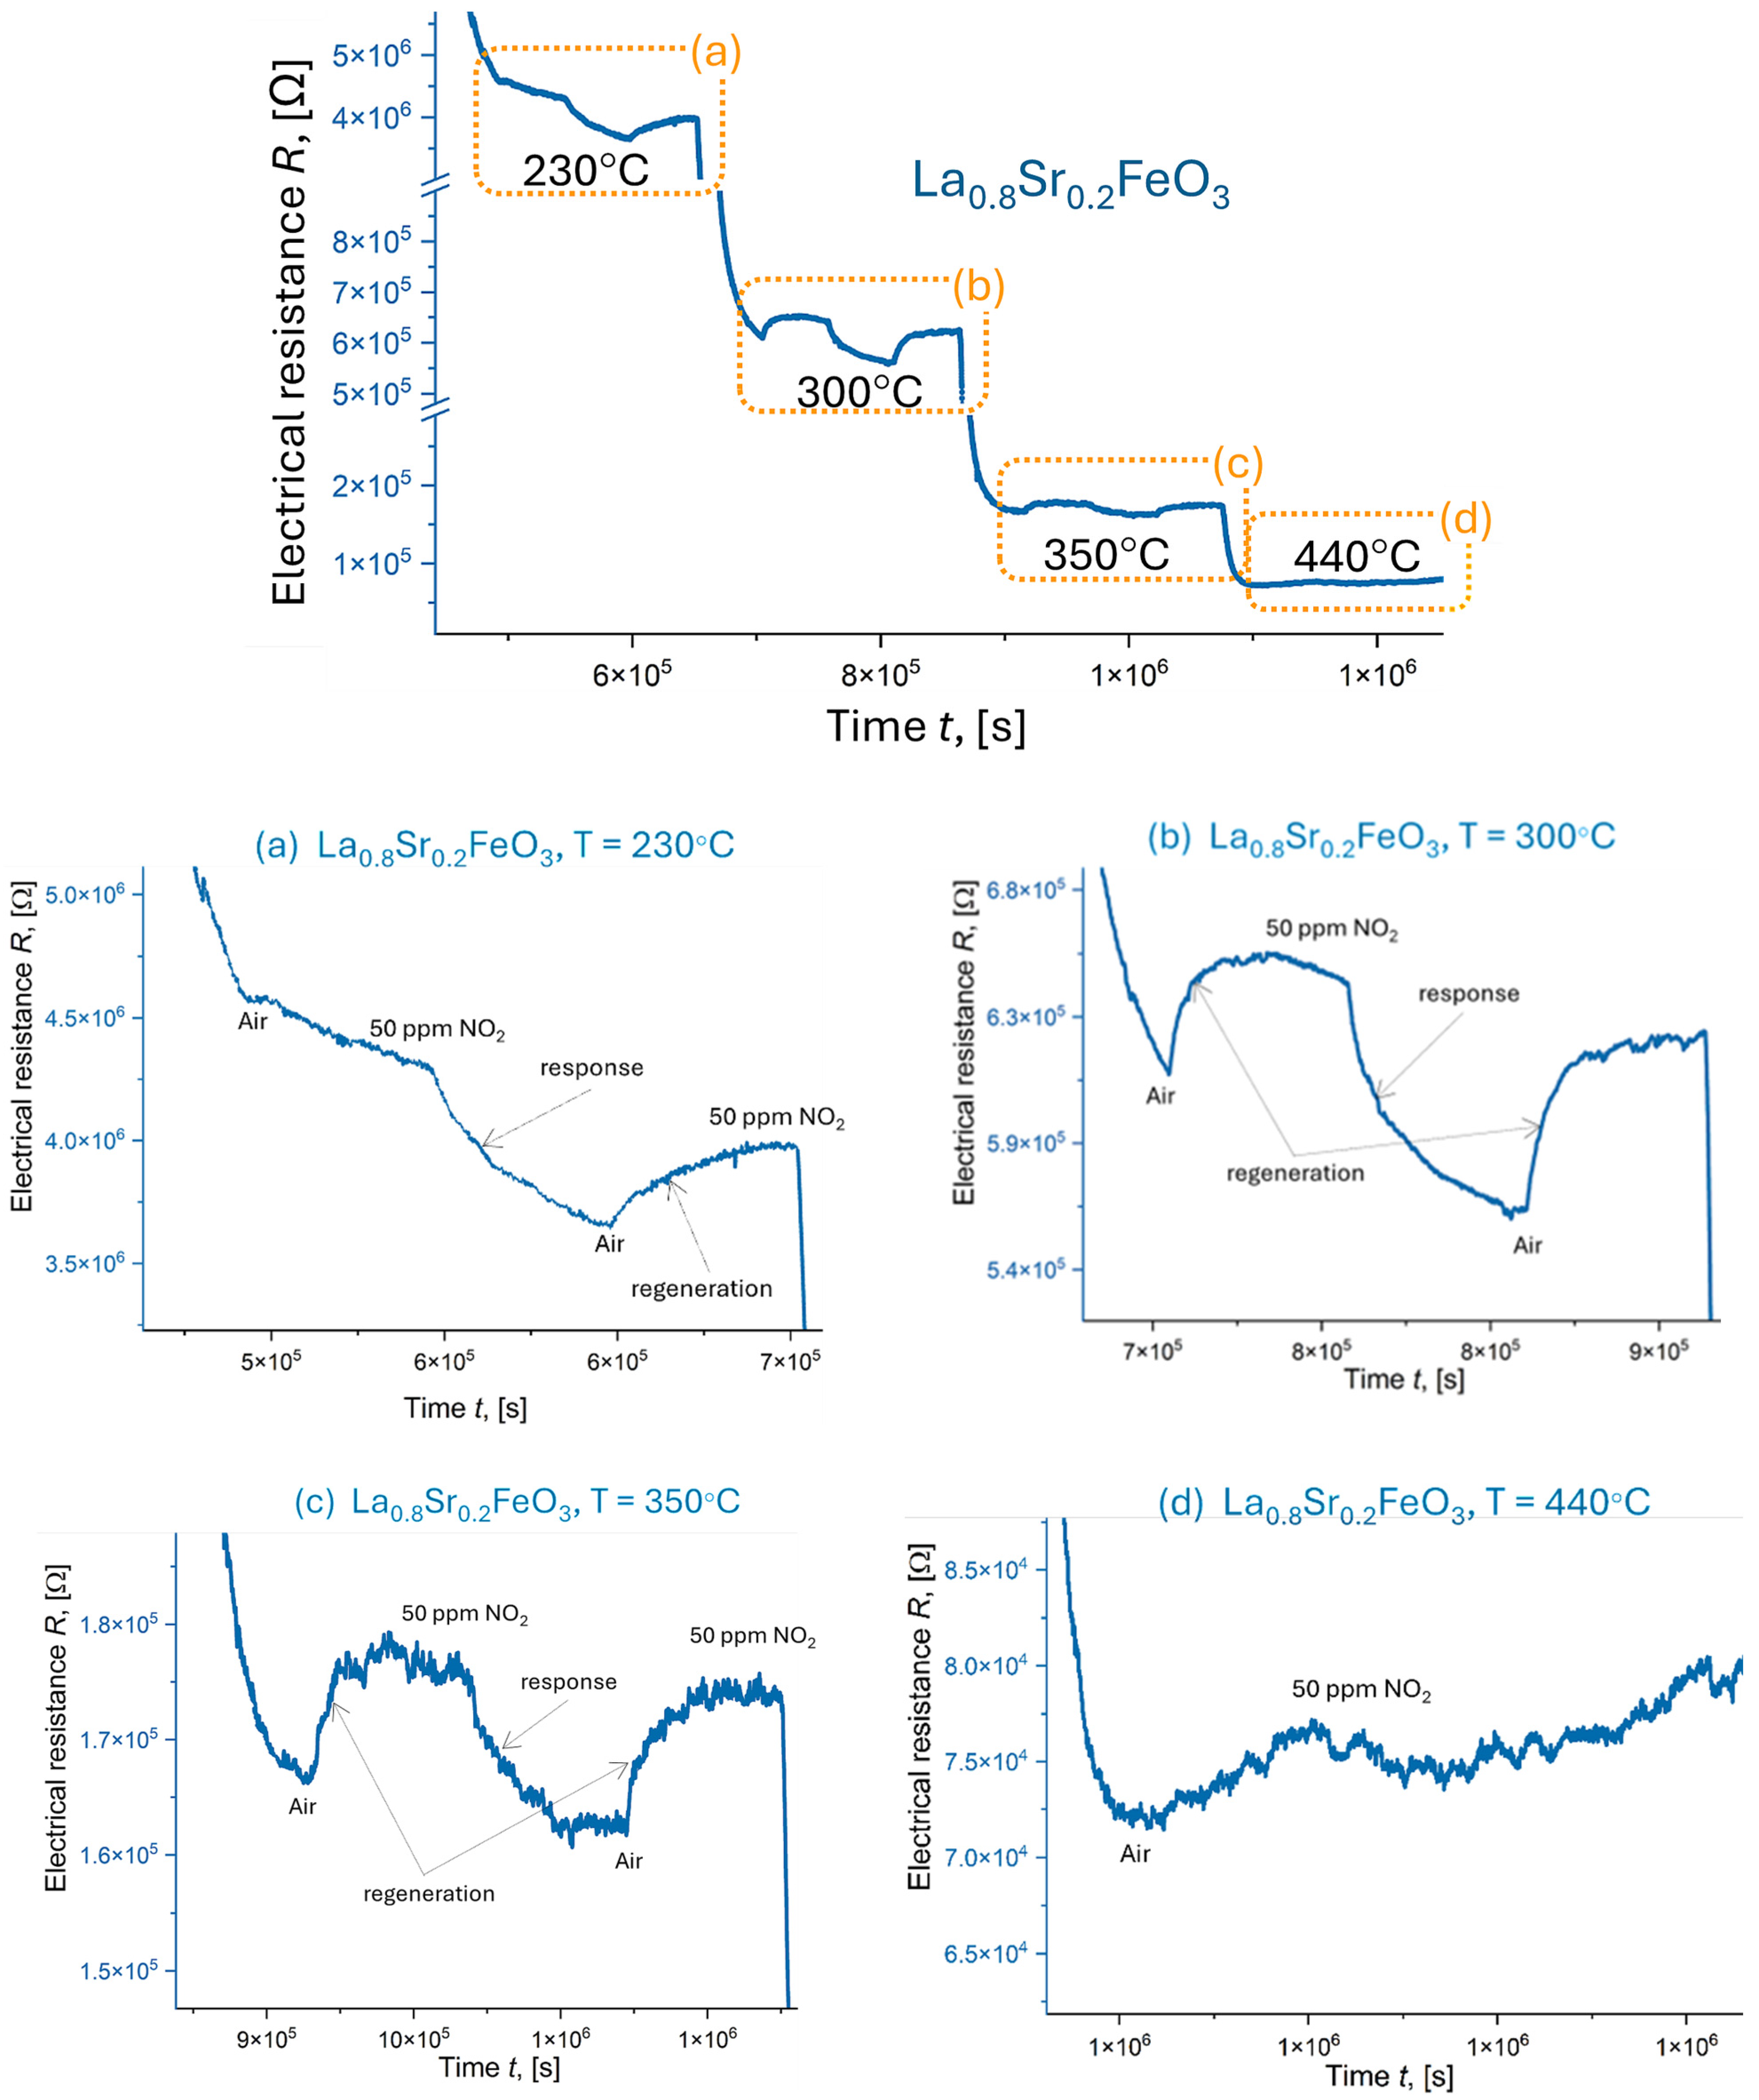
4.7. Electrical Resistance Measurements
5. Summary and Discussion
6. Conclusions
- Successful thin film deposition: High-quality, nanocrystalline thin films of LaCoO3, LaFeO3, and their Sr-doped variants were successfully deposited on Si and MgO substrates using PLD. The films exhibited a compact, columnar structure with minimal defects, confirming the suitability of PLD for depositing complex perovskite materials.
- Sr doping effects: Sr doping significantly influenced the microstructure and surface topography of the films. It led to a refinement of the surface structure, promoting the formation of smaller crystallites and a more homogenous surface topography, particularly in LaFeO3 films. This was confirmed by XRD, SEM, and AFM analyses.
- Enhanced mechanical properties: Sr doping generally improved the nanohardness and adhesion of the perovskite thin films to the Si substrate, suggesting potential benefits for sensor durability and stability.
- Electrical response to NO2: LaCoO3 and LaFeO3 thin films exhibited distinct electrical responses to NO2 gas. Sr-doped LaCoO3, particularly La0.8Sr0.2CoO3, showed promising sensing characteristics with high stability and increased sensitivity to NO2 at temperatures up to 350 °C. However, long response and recovery times were observed.
- Conductivity type transition in LaFeO3: Stoichiometric LaFeO3 exhibited a unique transition from n-type to p-type conductivity with increasing temperature in the presence of NO2 (50 ppm). This phenomenon, attributed to changes in the dominant charge carrier under varying oxygen partial pressure, highlights the importance of optimizing both temperature and gas pressure for resistive gas sensors.
- Sr doping stabilizes LaFeO3 response: Sr doping stabilized the catalytic activity of LaFeO3, resulting in faster response and recovery times and a more consistent response to NO2. However, increased noise at higher temperatures limited the sensitivity measurements.
Author Contributions
Funding
Institutional Review Board Statement
Informed Consent Statement
Data Availability Statement
Acknowledgments
Conflicts of Interest
References
- Stetter, J.R.; Penrose, W.R.; Yao, S. Sensors, Chemical Sensors, Electrochemical Sensors, and ECS. J. Electrochem. Soc. 2003, 150, S11–S16. [Google Scholar] [CrossRef]
- Najjar, Y. Gaseous Pollutants Formation and Their Harmful Effects on Health and Environment. Innov. Energy Policies 2011, 1, 1–9. [Google Scholar] [CrossRef]
- Espinoza-González, R.; Caamaño, J.; Castillo, X.; Orlandi, M.O.; Felix, A.A.; Flores, M.; Blanco, A.; Castro-Castillo, C.; Gracia, F. Selective NO2 Detection of CaCu3Ti4O12 Ceramic Prepared by the Sol-Gel Technique and DRIFT Measurements to Elucidate the Gas Sensing Mechanism. Materials 2023, 16, 3390. [Google Scholar] [CrossRef]
- Szczurek, A.; Gronstal, D.; Maciejewska, M. The Gas Sensing Drone with the Lowered and Lifted Measurement Platform. Sensors 2023, 23, 1253. [Google Scholar] [CrossRef]
- Ruben, H.-L.; Urquizo, J.; Silva, C.E.; Silva-Leon, J.; Wu, J.; Singh, P.; Soriano, G. Powering nodes of wireless sensor networks with energy harvesters for intelligent buildings: A review. Energy Rep. 2022, 8, 3809–3826. [Google Scholar] [CrossRef]
- Bradford, D.P.; Lindner, E. Medical Sensors for the Diagnosis and Management of Disease: The Physician Perspective. ACS Sens. 2017, 2, 1549–1552. [Google Scholar] [CrossRef]
- Fischer, S.; Pohle, R.; Farber, B.; Proch, R.; Kaniuk, J.; Fleischer, M.; Moos, R. Method for detection of NOx in exhaust gases by pulsed discharge measurements using standard zirconia-based lambda sensors. Sens. Actuators 2010, 147, 780–785. [Google Scholar] [CrossRef]
- Terzis, A.; Kirsch, M.; Vaikuntanathan, V.; Geppert, A.; Lamanna, G.; Weigand, B. Splashing characteristics of diesel exhaust fluid (AdBlue) droplets impacting on urea-water solution films. Exp. Therm. Fluid Sci. 2019, 102, 152–162. [Google Scholar] [CrossRef]
- Elkaee, S.; Phule, A.D.; Yang, J.H. Advancements in (SCR) technologies for NOx reduction: A comprehensive review of reducing agents. Process Saf. Environ. Prot. 2024, 184, 854–880. [Google Scholar] [CrossRef]
- Sensidyne_Gas-Detection-for-Power-Generation-Plants. Available online: https://sensidyne.com/wp-content/uploads/2024/05/Sensidyne_Gas-Detection-for-Power-Generation-Plants.pdf (accessed on 3 March 2025).
- Ayyala, S.K.; Covington, J.A. Nickel-Oxide Based Thick-Film Gas Sensors for Volatile Organic Compound Detection. Chemosensors 2021, 9, 247. [Google Scholar] [CrossRef]
- Bati, A.S.R.; Zhong, Y.L.; Burn, P.L.; Nazeeruddin, M.K.; Shaw, P.E.; Batmunkh, M. Next-generation applications for integrated perovskite solar cells. Commun. Mater. 2023, 4, 2. [Google Scholar] [CrossRef]
- Raghad, K.A.; Loucif, A.; Amer, M.S.; AlMayouf, A.M. Preparation and characterization of lanthanum-based perovskite oxides LaMO3 (M = Fe, Cr, Mn) thin films by electrophoretic deposition. Mater. Res. Express 2023, 10, 065902. [Google Scholar] [CrossRef]
- Jedrusik, M.; Cieniek, L.; Kopia, A.; Turquat, C.; Leroux, C. Structural characterization of LaCoO3 thin films grown by pulsed laser deposition. Arch. Metall. Mater. 2020, 65, 793–797. [Google Scholar] [CrossRef]
- Wang, L.M.; Lai, J.-H.; Wu, J.-I.; Kuo, Y.-K.; Chang, C.L. Effects of Ru substitution for Mn on La0.7Sr0.3MnO3 perovskites. J. Appl. Phys. 2007, 102, 023915. [Google Scholar] [CrossRef]
- Krishna Prasad, N.V.; Venkata Prasad, K.; Ramesh, S.; Phanidhar, S.V.; Venkata Ratnam, K.; Janardhan, S.; Manjunatha, H.; Sarma, M.S.S.R.K.N.; Srinivas, K. Ceramic Sensors: A mini-review of their applications. Front. Mater. 2020, 7, 593342. [Google Scholar] [CrossRef]
- Tho, N.D.; Huong, D.V.; Giang, H.T.; Ngan, P.Q.; Thai, G.H.; Thu, D.T.A.; Thu, D.T.; Tuoi, N.T.M.; Toan, N.N.; Thang, P.D.; et al. High temperature calcination for analyzing influence of 3d transition metals on gas sensing performance of mixed potential sensor Pt/YSZ/LaMO3 (M = Mn, Fe, Co, Ni). Electrochim. Acta 2016, 190, 215–220. [Google Scholar] [CrossRef]
- Goldschmidt, V.M.; Videnskaps-Akad, S.N.; Oslo, I. Geochemische Verteilungsgesetze der Elemente. Toler. Factor. Mat. Nat. 1926, 8, 529–533. [Google Scholar]
- Li, C.; Soh, K.C.K.; Wu, P. Formability of ABO3 perovskites. J. Alloys Compd. 2004, 1–2, 40–48. [Google Scholar] [CrossRef]
- Moradbeigi, M.; Razaghi, M. Investigation of optical and electrical properties of novel 4T all perovskite tandem solar cell. Sci. Rep. 2022, 12, 6733. [Google Scholar] [CrossRef]
- Di Battista, V.; Danielsen, P.H.; Gajewicz-Skretna, A.; Kedziorski, A.; Seiffert, S.B.; Ma-Hock, L.; Berthing, T.; Mortensen, A.; Sundermann, A.; Skjolding, L.M.; et al. Oxide-Perovskites for Automotive Catalysts Biotransform and Induce Multicomponent Clearance and Hazard. ACS Nano 2024, 18, 32672–32693. [Google Scholar] [CrossRef]
- Hu, Z.; Ran, C.; Zhang, H.; Chao, L.; Chen, Y.; Huang, W. The Current Status and Development Trend of Perovskite Solar Cells. Engineering 2023, 21, 15–19. [Google Scholar] [CrossRef]
- Biernacki, S.W. Temperature-induced spin-state transitions in LaCoO3: A two-level model. Phys. Rev. B 2006, 74, 184420. [Google Scholar] [CrossRef]
- Kleveland, K.; Orlovskaya, N.; Grande, T.; Moe, A.; Einarsrud, M.-A.; Breder, K.; Gogotsi, G. Ferroelastic Behavior of LaCoO3-Based Ceramics. J. Am. Ceram. Soc. 2001, 84, 2029–2033. [Google Scholar] [CrossRef]
- Afifah, N.; Saleh, R. Synthesis, Characterization and Catalytic Properties of Perovskite LaFeO3 Nanoparticles. J. Phys. Conf. Ser. 2016, 710, 012030. [Google Scholar] [CrossRef]
- Son, M.-K.; Seo, H.; Watanabe, M.; Shiratanibd, M.; Ishihara, T. Characteristics of crystalline sputtered LaFeO3 thin films as photoelectrochemical water splitting photocathodes. Nanoscale 2020, 12, 9653–9660. [Google Scholar] [CrossRef]
- Dai, Z.; Lee, C.-S.; Tian, Y.; Kimb, I.D.; Lee, J.-H. Highly reversible switching from P- to N-type NO2 sensing in a monolayer Fe2O3 inverse opal film and the associated P–N transition phase diagram. J. Mater. Chem. A 2015, 3, 3372–3381. [Google Scholar] [CrossRef]
- Lyubutin, I.S.; Dmitrieva, T.V.; Stepin, A.S. Dependence of exchange interactions on chemical bond angle in a structural series: Cubic perovskite-rhombic orthoferrite-rhombohedral hematite. J. Exp. Theor. Phys. 1999, 88, 590–597. [Google Scholar] [CrossRef]
- Sartipi, S.; Khodadadi, A.A.; Mortazavi, Y. Pd-doped LaCoO3 regenerative catalyst for automotive emissions control. Appl. Catal. B Environ. 2008, 83, 214–220. [Google Scholar] [CrossRef]
- Liu, S.T.; Wu, Y.; Jia, Y.Q. Spin and valence state equilibria of cobalt and magnetic properties of LaCoO3. J. Alloys Compd. 1993, 200, 171–176. [Google Scholar] [CrossRef]
- Chen, C.H.; Kruidhof, H.; Bouwmeester, H.J.M.; Burggraaf, A.J. Ionic conductivity of perovskite LaCoO3 measured by oxygen permeation technique. J. Appl. Electrochem. 1997, 27, 71–75. [Google Scholar] [CrossRef]
- Kharton, V.V.; Figueiredo, F.M.; Kovalevsky, A.V.; Viskup, A.P.; Naumovich, E.N.; Yaremchenko, A.A.; Bashmakov, I.A.; Marques, F.M.B. Processing, microstructure and properties of LaCoO3 ceramics. J. Eur. Ceram. Soc. 2001, 21, 2301–2309. [Google Scholar] [CrossRef]
- Sgourou, E.N.; Panayiotatos, Y.; Davazoglou, K.; Solovjov, A.L.; Vovk, R.V.; Chroneos, A. Self-Diffusion in Perovskite and Perovskite Related Oxides: Insights from Modelling. Appl. Sci. 2020, 10, 2286. [Google Scholar] [CrossRef]
- Mane, R.; Kim, H.; Han, K.; Kim, H.; Lee, S.S.; Roh, H.-S.; Lee, C.; Jeon, Y. Important factors of the A-site deficient Mn perovskites design affecting the CO oxidation activity. Catal. Today 2024, 425, 114347. [Google Scholar] [CrossRef]
- Tarasov, I.A.; Visotin, M.A.; Aleksandrovsky, A.S.; Kosyrev, N.N.; Yakovlev, I.A.; Molokeev, M.S.; Lukyanenko, A.V.; Krylov, A.S.; Fedorov, A.S.; Varnakov, S.N.; et al. Si/Fe flux ratio influence on growth and physical properties of polycrystalline β-FeSi2 thin films on Si(100) surface. J. Magn. Magn. Mater. 2017, 440, 144–152. [Google Scholar] [CrossRef]
- Pushpa, R.; Daniel, D.; Butt, D.P. Electronic properties of Ca doped LaFeO3: A first-principles study. Solid State Ion. 2013, 249–250, 184–190. [Google Scholar] [CrossRef]
- Mack, P. Spectroscopic Analysis of Solid Oxide Fuel Cell Material with XPS, Thermo Fisher Scientific. Available online: https://tools.thermofisher.com/content/sfs/brochures/AN52110-E-SolidOxideFuelCell0511MH.pdf (accessed on 5 February 2025).
- Jia, X.; Fan, H.; Lou, X.; Xu, J. Synthesis and gas sensing properties of perovskite CdSnO3 nanoparticles. Appl. Phys. A 2009, 94, 837–841. [Google Scholar] [CrossRef]
- Hong, H.; Sun, J.; Wu, C.; Liu, Z. High Performance Mixed Potential Type NO2 Gas Sensor Based on Porous YSZ Layer Formed with Graphite Doping. Sensors 2019, 19, 3337. [Google Scholar] [CrossRef]
- Cieniek, L.; Kac, S. Influence of Ca Content on the Structure and Properties of (Co, Ca)O Thin Films Deposited by PLD Technique. Acta Phys. Pol. 2010, 117, 803–807. [Google Scholar] [CrossRef]
- Jabeen, N.; Zaidi, A.; Hussain, A.; Hassan, N.U.; Ali, J.; Ahmed, F.; Khan, M.U.; Iqbal, N.; Elnasr, T.A.S.; Helal, M.H. Single- and Multilayered Perovskite Thin Films for Photovoltaic Applications. Nanomaterials 2022, 12, 3208. [Google Scholar] [CrossRef]
- Thornton, J.A. Structure-Zone Models of Thin Films. In Modeling of Optical Thin Films; SPIE: Bellingham, WA, USA, 1988. [Google Scholar] [CrossRef]
- Minh, N.Q.; Takahashi, T. Electrical conduction in ceramics. In Science and Technology of Ceramic Fuel Cells; Elsevier Science Ltd.: Amsterdam, The Netherlands, 1995; pp. 41–68. [Google Scholar] [CrossRef]
- Wahid, K.I.A.; Chaker, C.; Chaker, H. Ni-doped SnO2 thin films for NO2 gas sensing application. Sens. Actuators A Phys. 2023, 360, 114498. [Google Scholar] [CrossRef]
- Chen, D.; Yu, W.; Wei, L.; Ni, J.; Li, H.; Chen, Y.; Tian, Y.; Yan, S.; Mei, L.; Jiao, J. High sensitive room temperature NO2 gas sensor based on the avalanche breakdown induced by Schottky junction in TiO2-Sn3O4 nanoheterojunctions. J. Alloys Compd. 2022, 912, 165079. [Google Scholar] [CrossRef]
- Cantalini, C.; Wlodarski, W.; Sun, H.T.; Atashbar, M.Z.; Passacantando, M.; Santucci, S. NO2 response of In2O3 thin film gas sensors prepared by sol–gel and vacuum thermal evaporation techniques. Sens. Actuators B Chem. 2000, 65, 101–104. [Google Scholar] [CrossRef]
- Li, X.; Fu, L.; Karimi-Maleh, H.; Chen, F.; Zhao, S. Innovations in WO3 gas sensors: Nanostructure engineering, functionalization, and future perspectives. Heliyon 2024, 10, e27740. [Google Scholar] [CrossRef] [PubMed]
- Onrubia-Calvo, J.A.; Pereda-Ayo, B.; Cabrejas, I.; De-La-Torre, U.; González-Velasco, J.R. Ba-doped vs. Sr-doped LaCoO3 perovskites as base catalyst in diesel exhaust purification. Mol. Catal. 2020, 488, 110913. [Google Scholar] [CrossRef]


| Process Parameter | Value |
|---|---|
| Laser wavelength, λ (nm) | 266 (IV H) |
| Pulse Energy, E (mJ) | ~90 |
| Energy density, (J·cm−2) | ~2.0 |
| Target–substrate, d (mm) | ~50 |
| Oxygen partial pressure, pO2 (Pa) | 5.3 |
| Substrate temperature, Ts (°C) (radiative heater) | ~750 |
| Repetition rate, f (Hz) | 10 |
| Number of shots | 70,000 |
| Pulse deposition ratio (Å/pulse) | ~0.02 |
| Substrates | MgO [001] Si [001] |
| Thin Film | La | Sr | Co | O | ||||||||||||
|---|---|---|---|---|---|---|---|---|---|---|---|---|---|---|---|---|
| Thin Film | Droplets, Particles | Thin Film | Droplets, Particles | Thin Film | Droplets, Particles | Thin Film | Droplets, Particles | |||||||||
| wt.% | at.% | wt.% | at.% | wt.% | at.% | wt.% | at.% | wt.% | at.% | wt.% | at.% | wt.% | at.% | wt.% | at.% | |
| LaCoO3(stech.) | 56.5 | 20 | 24 | 20 | 19.5 | 60 | ||||||||||
| LaCoO3 | 56.3 | 19.7 | 58.7 | 21.0 | - | - | - | - | 23.6 | 18.3 | 21.7 | 18.2 | 20.1 | 62.0 | 19.6 | 60.8 |
| La0.9Sr0.1CoO3 | 42.1 | 12.7 | 45.4 | 15.1 | 9.8 | 4.1 | 10.3 | 4.7 | 19.7 | 13.1 | 20.3 | 15.7 | 28.4 | 70.1 | 24.0 | 64.5 |
| La0.8Sr0.2CoO3 | 29.5 | 7.6 | 32.0 | 9.0 | 20.9 | 8.5 | 22.2 | 9.9 | 16.9 | 10.3 | 17.3 | 11.5 | 32.7 | 73.6 | 28.5 | 69.6 |
| Thin Film | La | Sr | Fe | O | ||||||||||||
|---|---|---|---|---|---|---|---|---|---|---|---|---|---|---|---|---|
| Thin Film | Droplets, Particles | Thin Film | Droplets, Particles | Thin Film | Droplets, Particles | Thin Film | Droplets, Particles | |||||||||
| wt.% | at.% | wt.% | at.% | wt.% | at.% | wt.% | at.% | wt.% | at.% | wt.% | at.% | wt.% | at.% | wt.% | at.% | |
| LaFeO3 (stech.) | 57.2 | 20 | - | - | - | - | - | - | 23 | 20 | - | - | 19.8 | 60 | - | - |
| LaFeO3 | 57.4 | 19 | 63.3 | 25.5 | - | - | - | - | 20 | 16.4 | 21.6 | 21.6 | 22.6 | 64.6 | 15.1 | 52.9 |
| La0.9Sr0.1FeO3 | 55.1 | 24.2 | 53.5 | 23.0 | 11.1 | 7.7 | 11.8 | 8.1 | 22.0 | 22.7 | 22.3 | 22.6 | 11.9 | 45.4 | 12.4 | 46.4 |
| La0.8Sr0.2FeO3 | 40.4 | 13.9 | 33.5 | 10.5 | 22.3 | 12.2 | 25.8 | 12.8 | 17.3 | 14.0 | 17.3 | 12.8 | 20.0 | 59.9 | 23.5 | 63.9 |
| Sample/Thin Film | Roughness Parameter, (nm) | |||
|---|---|---|---|---|
| Rq | Ra | Rz | Rmax | |
| LaCoO3 | 2.4 | 1.8 | 14.7 | 20.7 |
| La0.9Co0.1O3 | 2.6 | 2.1 | 17.5 | 17.8 |
| La0.8Co0.2O3 | 3.2 | 2.6 | 18.7 | 21.4 |
| LaFeO3 | 0.9 | 0.7 | 5.6 | 6.3 |
| La0.9Fe0.1O3 | 1.7 | 1.4 | 8.6 | 13.1 |
| La0.8Fe0.2O3 | 2.3 | 1.8 | 11.9 | 17.0 |
| Thin Film/Substrate | Nanohardness HV | Indentation Hardness HIT, (GPa) | Young’s Modulus EIT, (GPa) | Penetration Depth hm, (nm) | Critical Load Lc, (mN) |
|---|---|---|---|---|---|
| LaCoO3/Si | 1538 ± 4 | 16.6 ± 0.2 | 184 ± 2 | 61 ± 3 | >18 ± 1.0 |
| La0.9Sr0.1CoO3/Si | 2382 ± 7 | 25.7 ± 0.3 | 196 ± 3 | 55 ± 2 | >24 ± 0.7 |
| La0.8Sr0.2CoO3/Si | 2157 ± 5 | 23.9 ± 0.3 | 191 ± 3 | 57 ± 2 | >21 ± 0.8 |
| LaFeO3/Si | 1233 ± 3 | 13.3 ± 0.1 | 222 ± 4 | 60 ± 3 | >13 ± 1.1 |
| La0.9Sr0.1FeO3/Si | 1798 ± 7 | 18.4 ± 0.2 | 189 ± 2 | 58 ± 2 | >19 ± 1.0 |
| La0.8Sr0.2FeO3/Si | 2291 ± 8 | 24.8 ± 0.2 | 191 ± 3 | 56 ± 2 | >22 ± 0.8 |
| Thin Film | Temperature T [°C] | NO2 Sensing Response, Resp | Thin Film Sensitivity to NO2, S [%] | Response Time tres, [min] | Recovery Time trec, [min] |
|---|---|---|---|---|---|
| LaCoO3 | 230 | 1.0 | 4.5 | 29 | 30 |
| 300 | 1.1 | 11.9 | 28 | 30 | |
| 350 | 1.1 | 14.1 | 29 | 30 | |
| 440 | 1.0 | 5.2 | 29 | 31 | |
| La0.9Sr0.1CoO3 | 230 | 1.1 | 9.7 | 30 | 29 |
| 300 | 1.1 | 5.5 | 30 | 29 | |
| 350 | 1.0 | 0.6 | 29 | 29 | |
| La0.8Sr0.2CoO3 | 230 | 1.3 | 30.5 | 30 | 29 |
| 300 | 1.2 | 24.8 | 30 | 29 | |
| 350 | 1.2 | 23.7 | 30 | 29 | |
| 440 | 1.1 | 7.5 | 30 | 29 |
| Thin Film | Temperature T [°C] | NO2 Sensing Response, Resp | Thin Film Sensitivity to NO2, S [%] | Response Time tres, [min] | Recovery Time trec, [min] |
|---|---|---|---|---|---|
| LaFeO3 | 230 | 0.3 | 67.0 | 21 | 9 |
| 300 | 0.4 | 61.0 | 25 | 11 | |
| 350 | 1.0 | 3.8 | 5 | 5 | |
| 400 | 2.7 | 75.0 | 19 | 14 | |
| 440 | 1.7 | 68.1 | 23 | 12 | |
| La0.9Sr0.1FeO3 | 230 | 1.0 | 4.8 | 14 | 15 |
| 300 | 1.1 | 8.6 | 15 | 14 | |
| 350 | 1.1 | 7.2 | 15 | 15 | |
| La0.8Sr0.2FeO3 | 230 | 1.2 | 17.9 | 15 | 15 |
| 300 | 1.1 | 14.4 | 15 | 15 | |
| 350 | 1.1 | 9.7 | 16 | 15 |
Disclaimer/Publisher’s Note: The statements, opinions and data contained in all publications are solely those of the individual author(s) and contributor(s) and not of MDPI and/or the editor(s). MDPI and/or the editor(s) disclaim responsibility for any injury to people or property resulting from any ideas, methods, instructions or products referred to in the content. |
© 2025 by the authors. Licensee MDPI, Basel, Switzerland. This article is an open access article distributed under the terms and conditions of the Creative Commons Attribution (CC BY) license (https://creativecommons.org/licenses/by/4.0/).
Share and Cite
Cieniek, L.; Kopia, A.; Kowalski, K.; Moskalewicz, T. High-Quality Perovskite Thin Films for NO2 Detection: Optimizing Pulsed Laser Deposition of Pure and Sr-Doped LaMO3 (M = Co, Fe). Materials 2025, 18, 1175. https://doi.org/10.3390/ma18051175
Cieniek L, Kopia A, Kowalski K, Moskalewicz T. High-Quality Perovskite Thin Films for NO2 Detection: Optimizing Pulsed Laser Deposition of Pure and Sr-Doped LaMO3 (M = Co, Fe). Materials. 2025; 18(5):1175. https://doi.org/10.3390/ma18051175
Chicago/Turabian StyleCieniek, Lukasz, Agnieszka Kopia, Kazimierz Kowalski, and Tomasz Moskalewicz. 2025. "High-Quality Perovskite Thin Films for NO2 Detection: Optimizing Pulsed Laser Deposition of Pure and Sr-Doped LaMO3 (M = Co, Fe)" Materials 18, no. 5: 1175. https://doi.org/10.3390/ma18051175
APA StyleCieniek, L., Kopia, A., Kowalski, K., & Moskalewicz, T. (2025). High-Quality Perovskite Thin Films for NO2 Detection: Optimizing Pulsed Laser Deposition of Pure and Sr-Doped LaMO3 (M = Co, Fe). Materials, 18(5), 1175. https://doi.org/10.3390/ma18051175