
Effect of Limestone Powder Fineness on the Physical and Mechanical Performance of Concrete

 ,
, Highlights
- A novel variant of green concrete, known as limestone powder concrete, was developed by substituting traditional mineral admixtures with limestone powder (LP).
- The study investigated the effects of different content levels and specific surface areas of LP on concrete slump, compressive strength, and bond-slip behavior with rebars, utilizing both experimental and theoretical analyses.
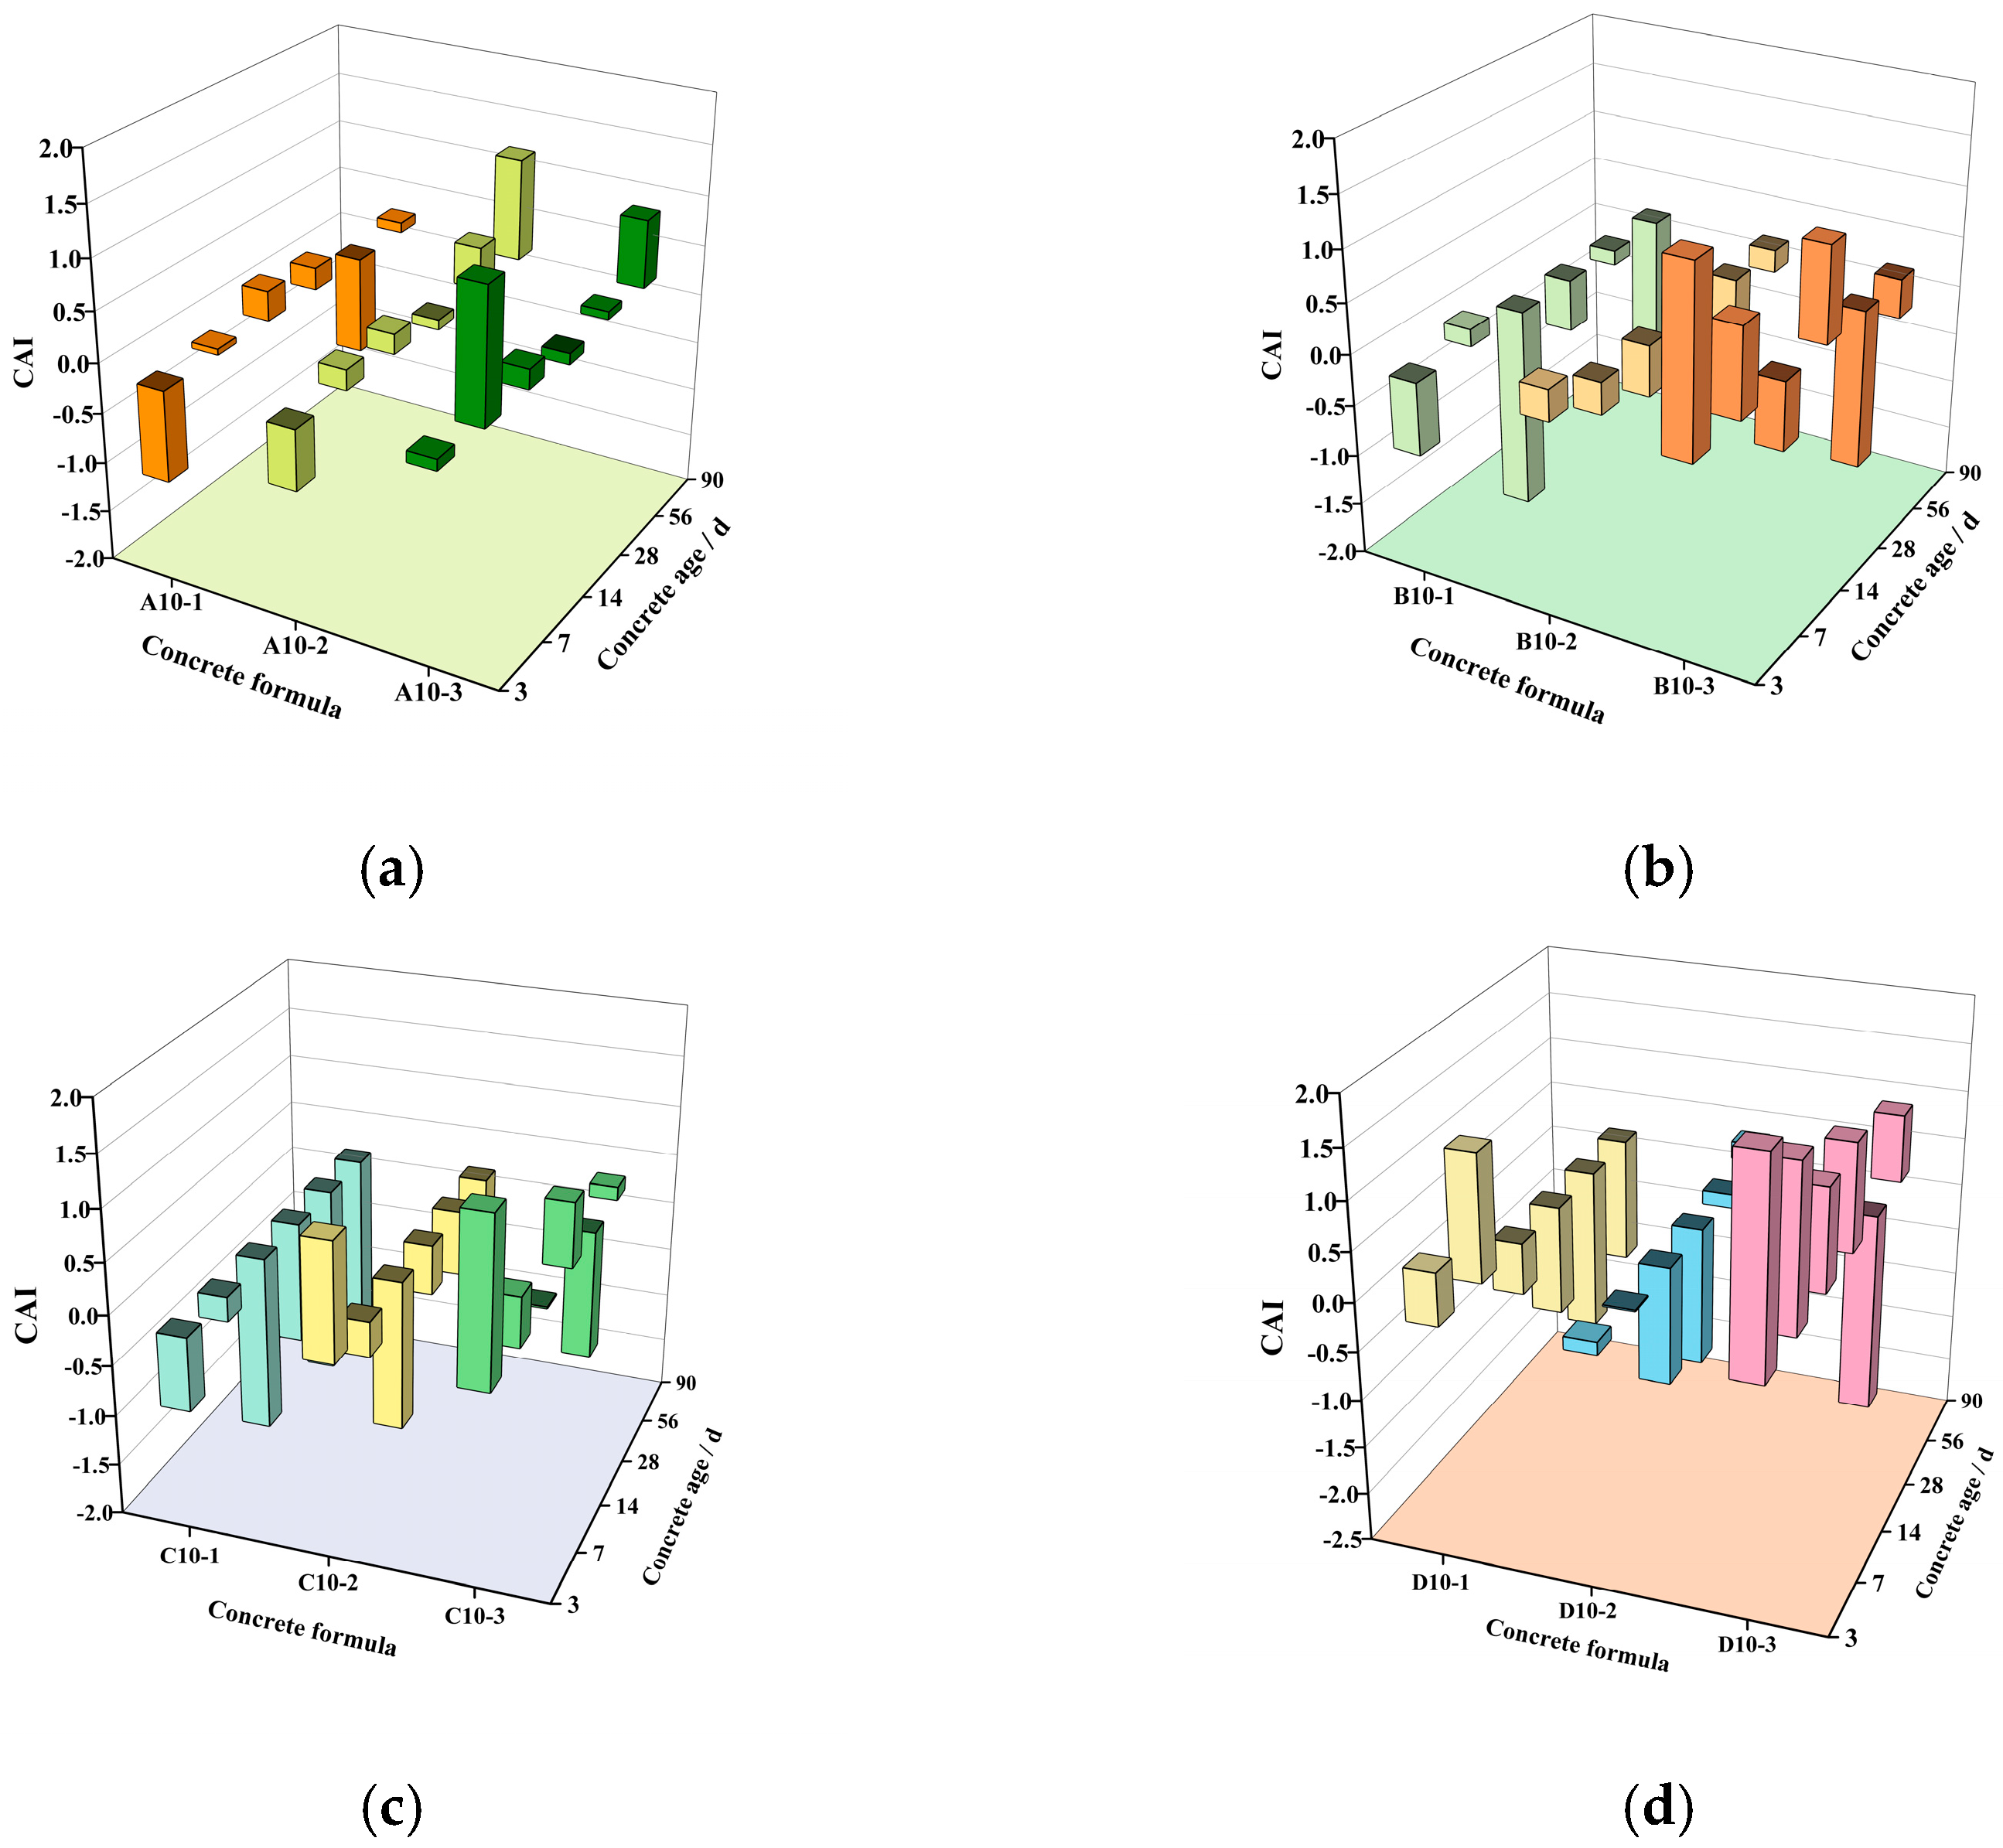
- The Compressive Activity Index (CAI) is introduced in this study to evaluate and quantify the compressive activity of LP. This index provides a theoretical foundation for its practical implementation.
Abstract
1. Introduction
2. Experimental Program
2.1. Materials
- (1)
- Cementitious material: P.O 52.5 cement, specific surface area of 300 m2/kg; limestone powder (LP), specific surface area of 350 m2/kg, 600 m2/kg, and 1000 m2/kg. The chemical composition of cement and LP is shown in Table 1.
- (2)
- Fine aggregate: natural river sand; the fineness modulus is 2.68, the apparent density is 2630 kg/m3, and the mud content is 1.27%.
- (3)
- Coarse aggregate: continuous graded crushed stone; the maximum particle size is 31.5 mm.
- (4)
- Mixing water: commonly used tap water.
- (5)
- Rebar: HRB400, diameter 16 mm; mechanical properties shown in Table 2.

| Elements | CaO | SiO2 | Al2O3 | Fe2O3 | K2O | Na2O | MgO | TiO2 | SO3 | MnO | Cl− | P | S |
|---|---|---|---|---|---|---|---|---|---|---|---|---|---|
| P.O 52.5 | 62.90 | 21.00 | 4.78 | 2.98 | 0.61 | 0.19 | 1.95 | 0.21 | 1.53 | / | / | / | / |
| LP | 51.00 | 2.27 | 0.46 | 0.24 | 0.18 | / | 1.95 | <0.01 | 1.53 | ≤0.01 | / | <0.01 | 0.09 |
| Rebar | Diameter (mm) | Length (mm) | Yield Strength (Mpa) | Ultimate Strength (Mpa) | Elongation (%) |
|---|---|---|---|---|---|
| HRB400 | 16 | 80 | 410 | 595 | 23.3 |
2.2. Mixture Proportions
2.3. Specimen Design
- (1)
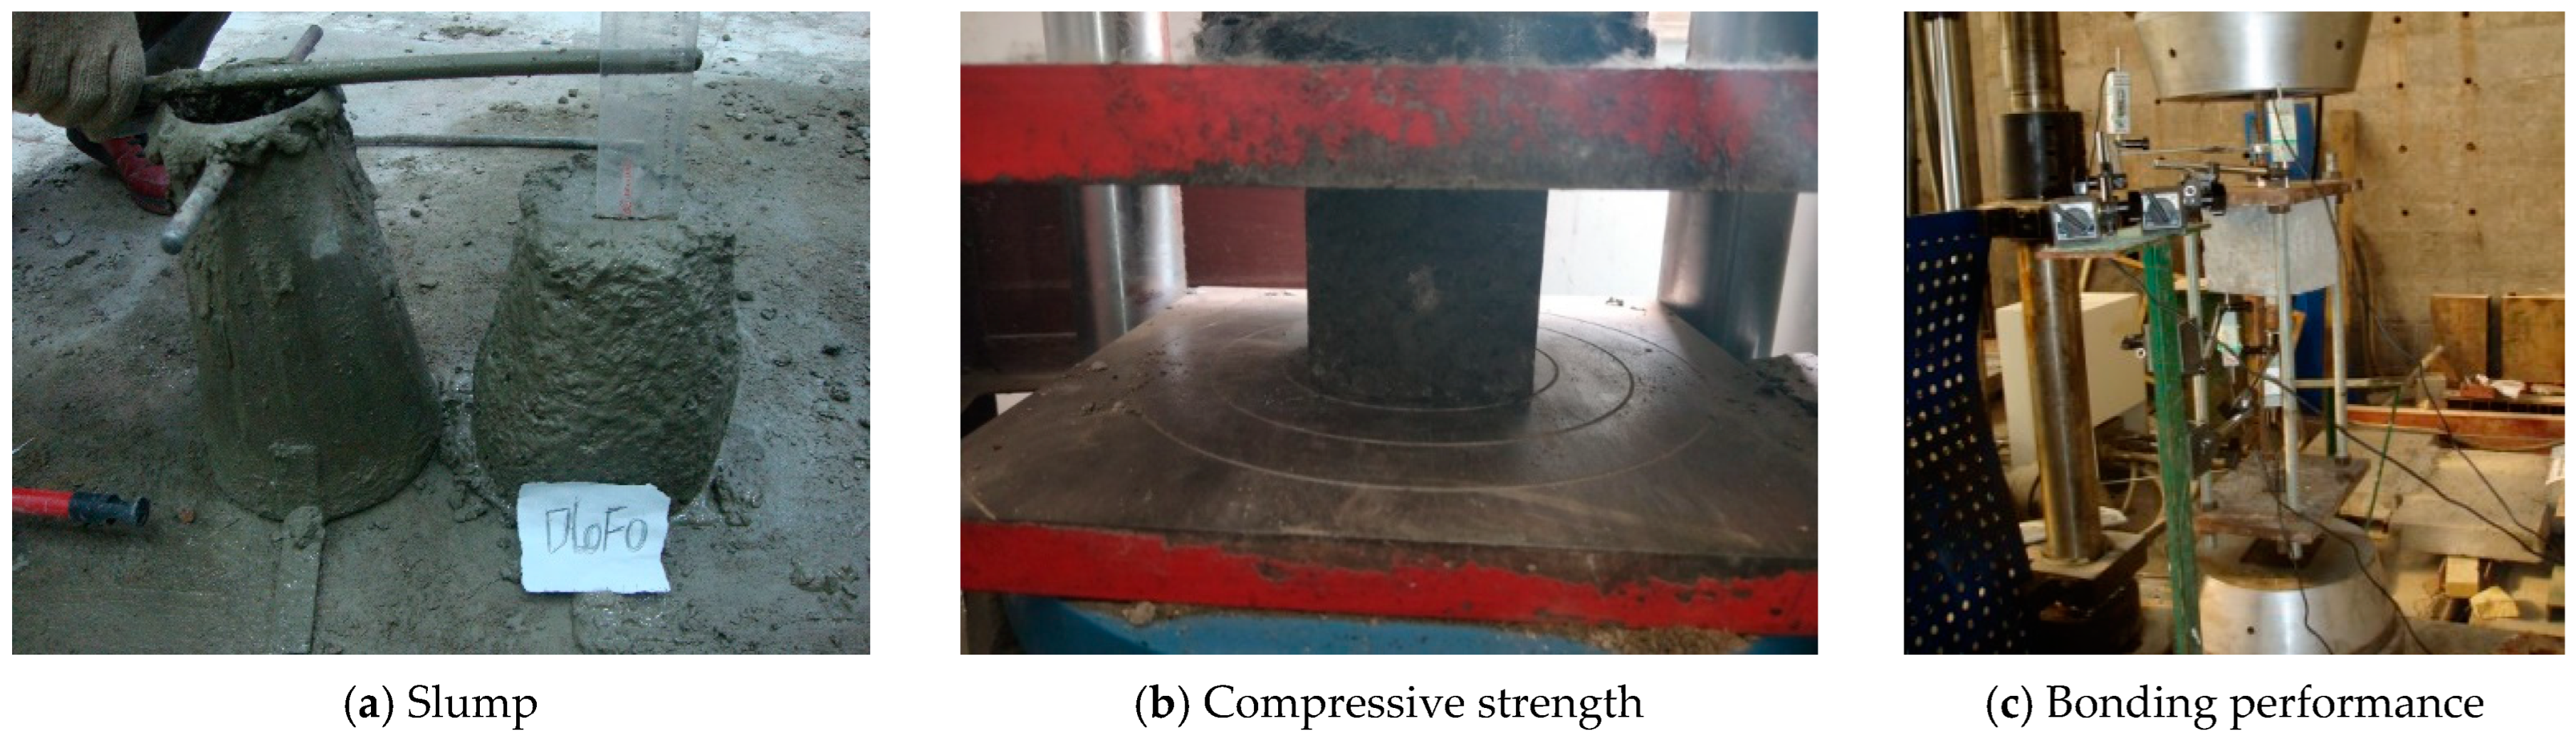
- Slump: The concrete mix ratios in Table 3 are sampled, and the slump test is carried out. The slump difference between limestone powder concrete and reference concrete is compared and analyzed.
- (2)
- Compressive strength: According to the concrete mix ratio in Table 3, 150 mm cube specimens of 6 ages (3 d, 7 d, 14 d, 28 d, 56 d, and 90 d) were produced for a total of 528 groups (1584). The specimens were cured to the corresponding age for compressive strength test. The number of the specimen is the same as that of the concrete mix ratio.
- (3)
- Bonding performance: (a) fixed water–binder ratio (W/B = 0.45) to study the effect of limestone powder content and specific surface area on the bonding performance. (b) Fixed limestone powder content (15%) and specific surface area (600 m2/kg); the effect of water–binder ratio on bonding performance was studied. (c) Select the B0 concrete mix ratio as the benchmark group. The detailed test scheme is shown in Table 4.
2.4. Test Methods
- (1)
- Use a slump meter to measure the slump of concrete. The concrete is evenly loaded into the barrel in three layers, and each layer is evenly mashed 25 times. After the top layer is mashed, it is flattened with a spatula, and the excess part is removed. After the slump cylinder is lifted, the slump value is obtained by measuring the difference between the height of the cylinder and the highest point of the concrete slump.
- (2)
- The compressive strength test was carried out by a YAW-3000 testing machine from Jinan Chenda Testing Machine Manufacturing Co., Ltd. (Jinan, China). After the specimen was wiped clean, it was placed in the center of the lower pressure plate, and the test machine was started and continuously and uniformly loaded until the specimen was sharply deformed and finally destroyed; the load value at this time was recorded.
- (3)
- In the bond performance test, the continuous displacement loading speed of 0.2 mm/min is carried out. At the same time, the displacement meter is set at both ends of the steel bar, and the relative slip between the loading end and the free end and the concrete is recorded until the bond failure, and the slip is recorded throughout the process.
3. Results and Discussions
3.1. Slump
3.1.1. LP Content
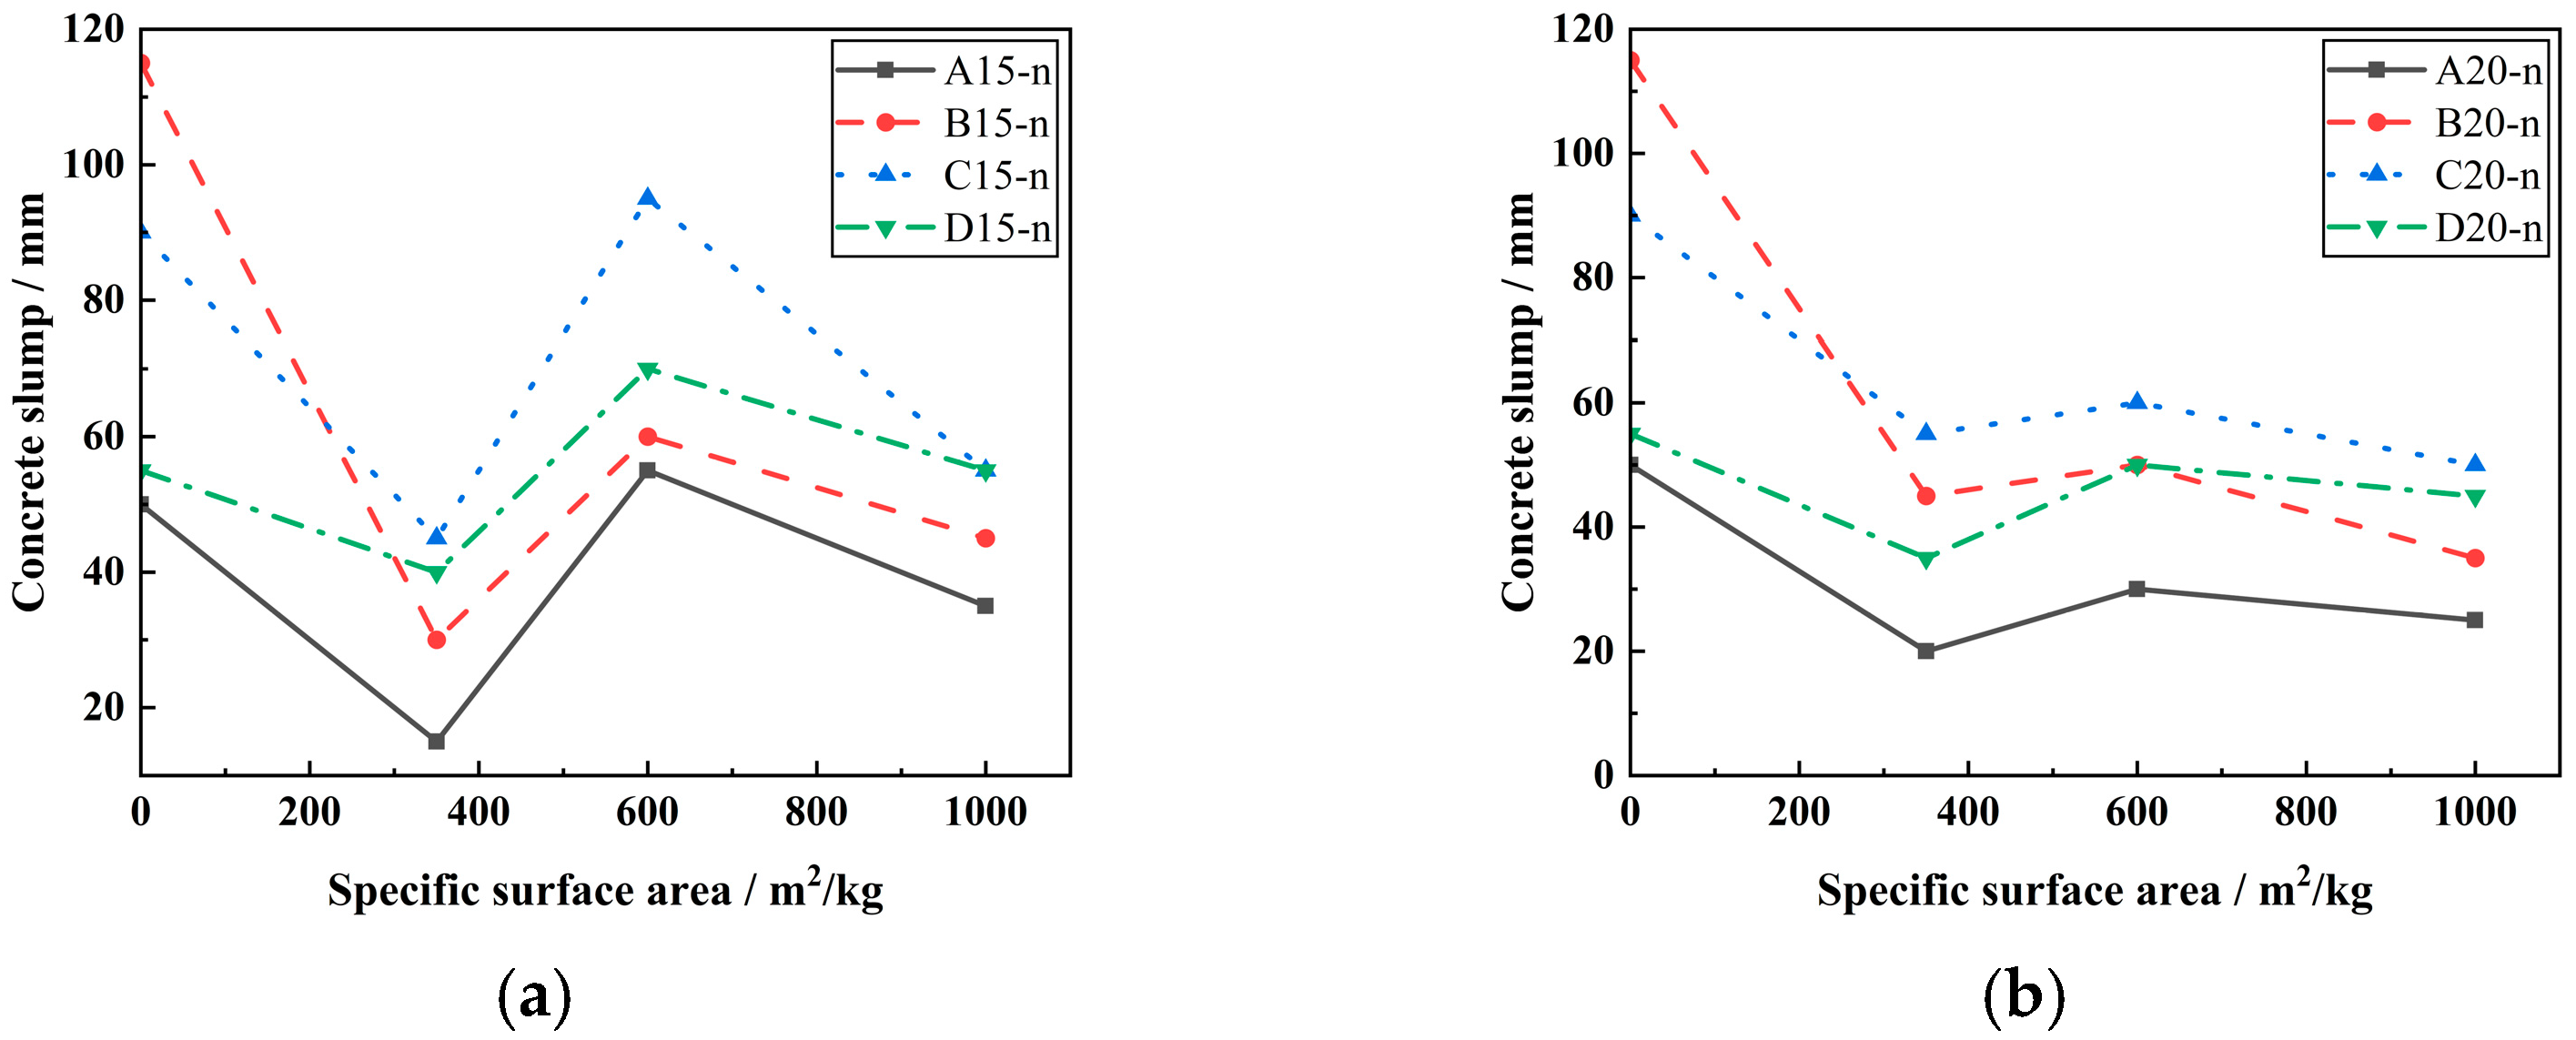
3.1.2. LP-Specific Surface Area
3.2. Compressive Strength
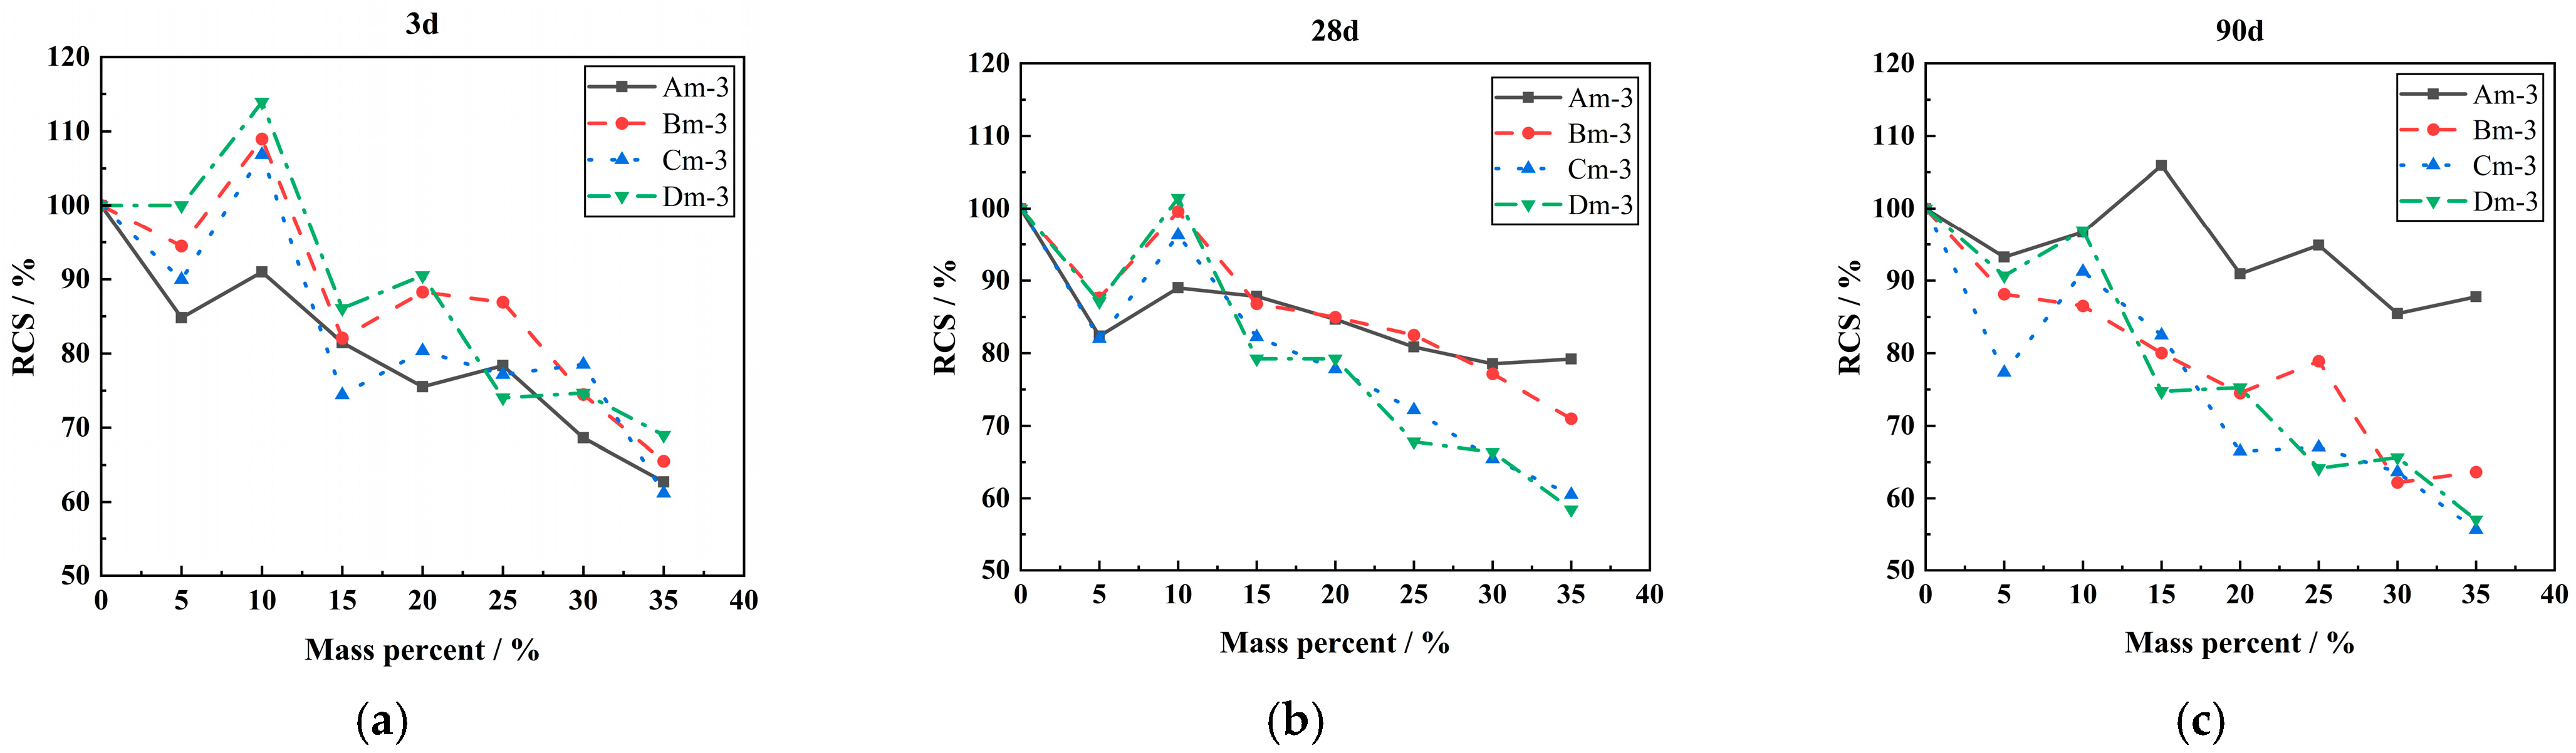
3.2.1. LP Content
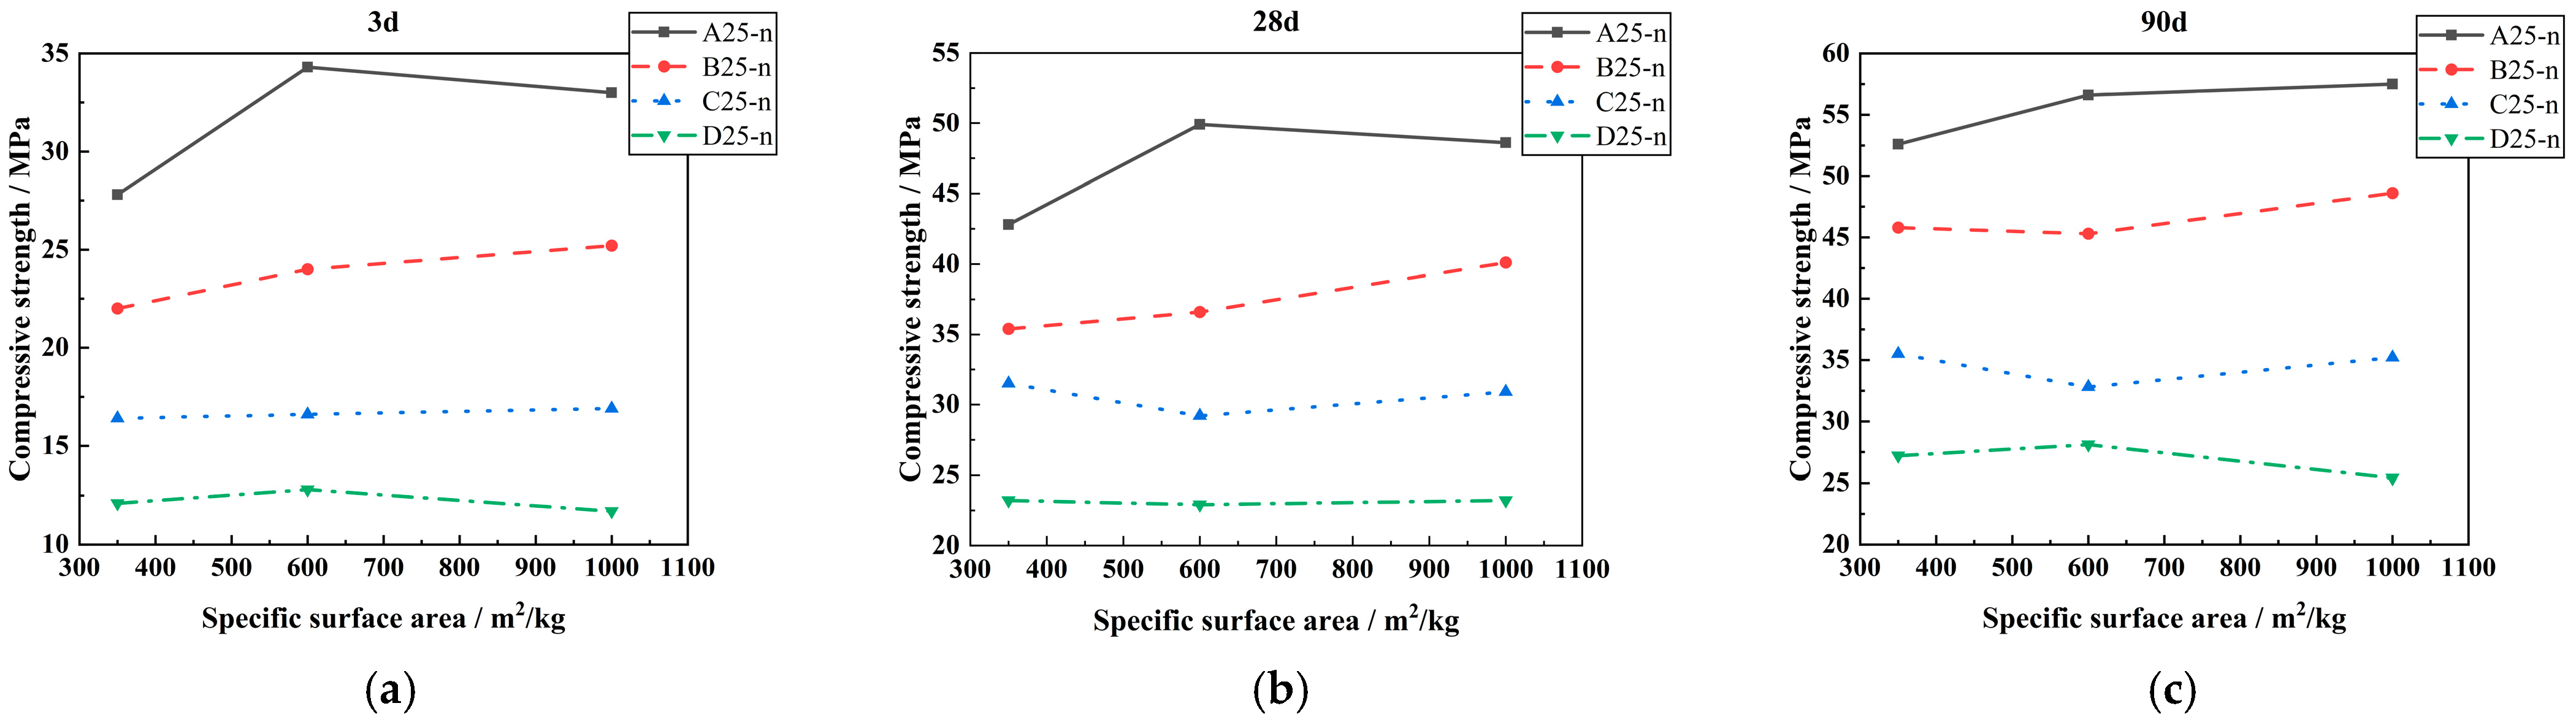
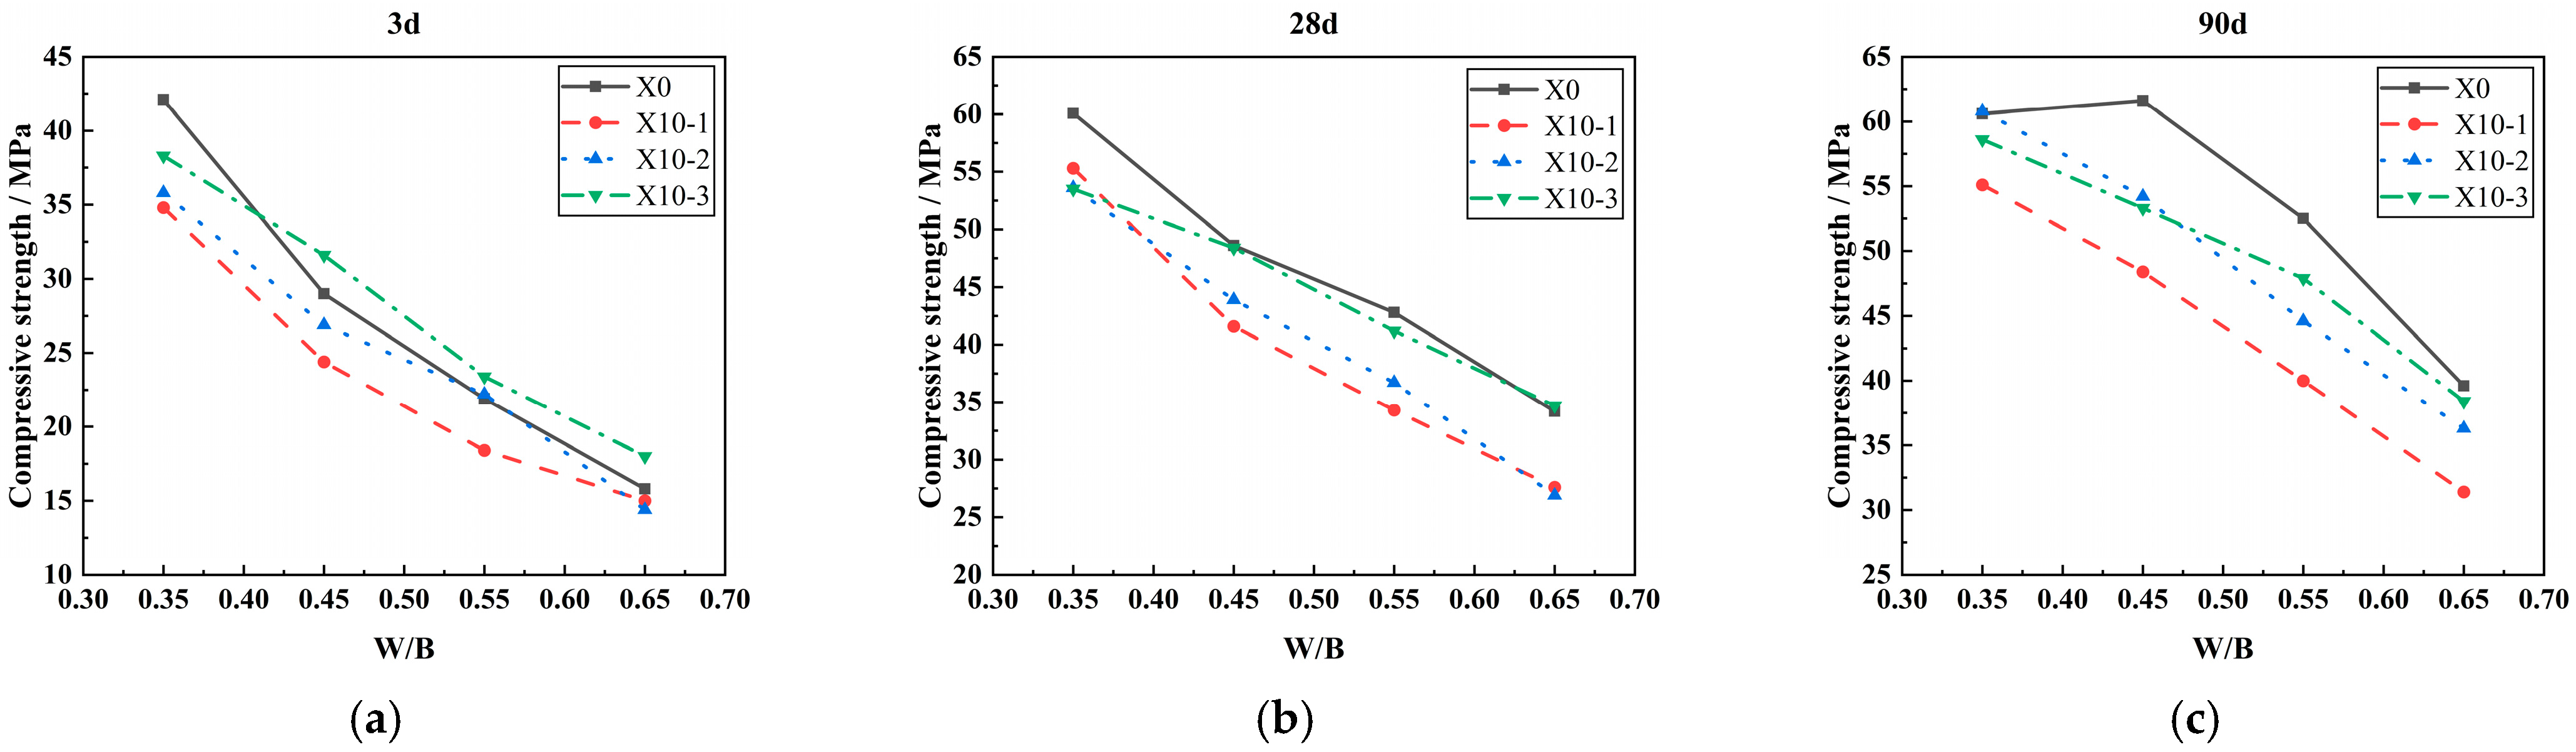
3.2.2. LP-Specific Surface Area
3.2.3. W/B
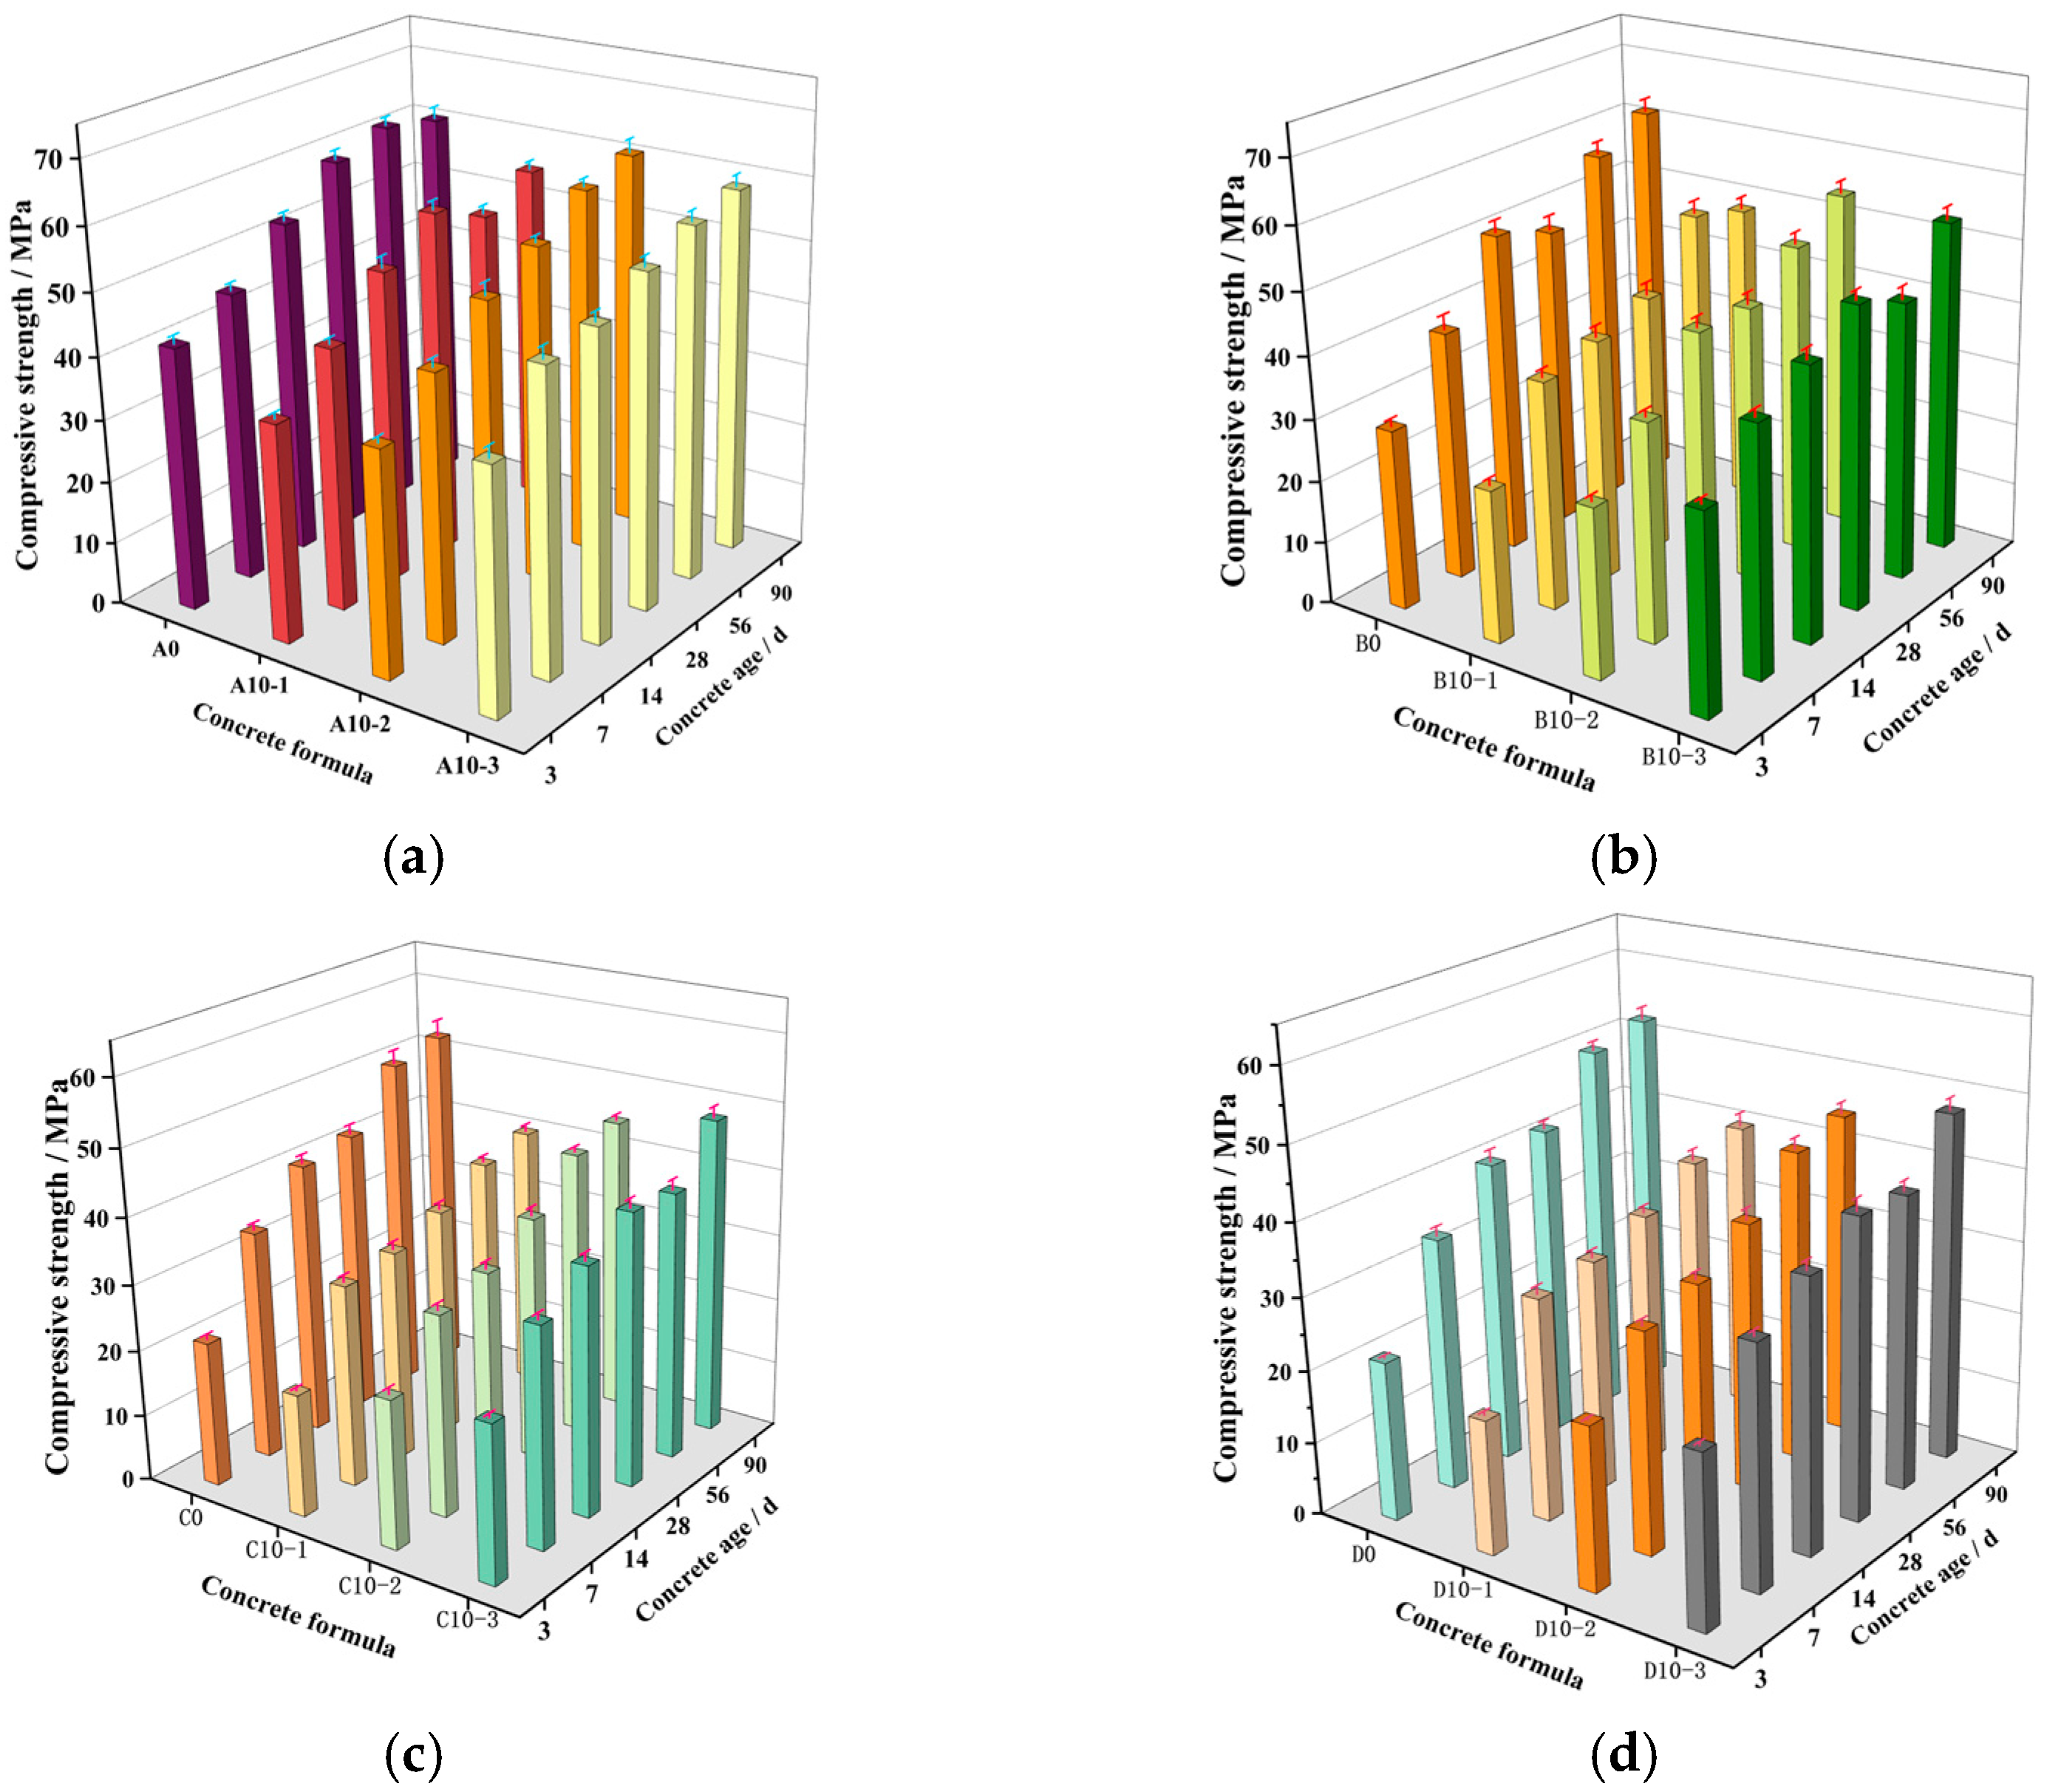
3.2.4. Ages
3.3. Bond-Slip Behaviors
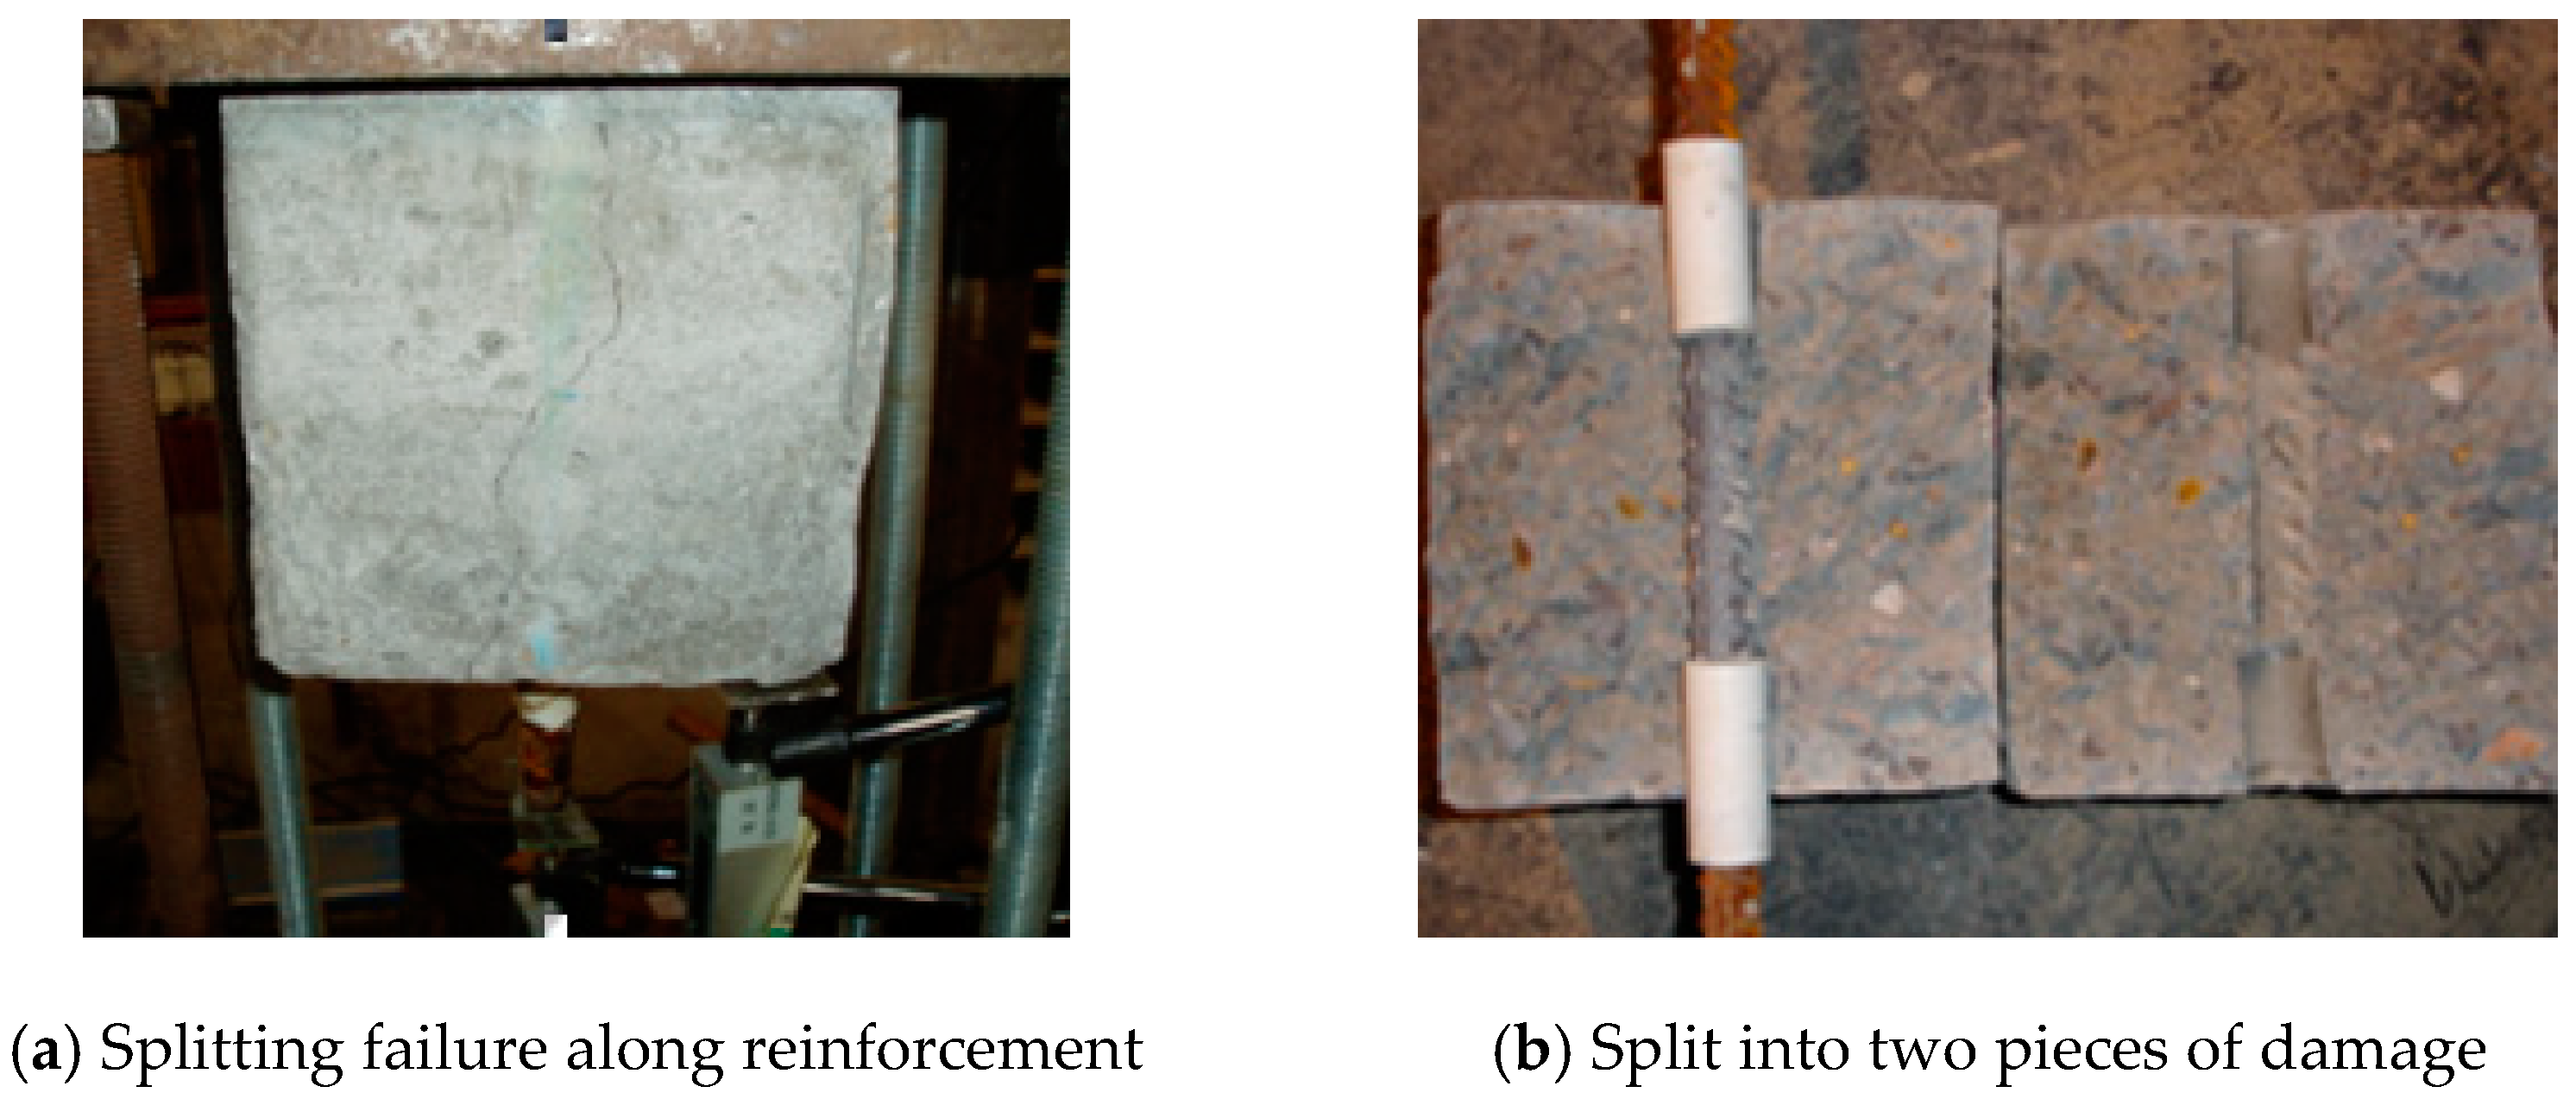
3.3.1. Failure Morphology
3.3.2. Bonding Strength
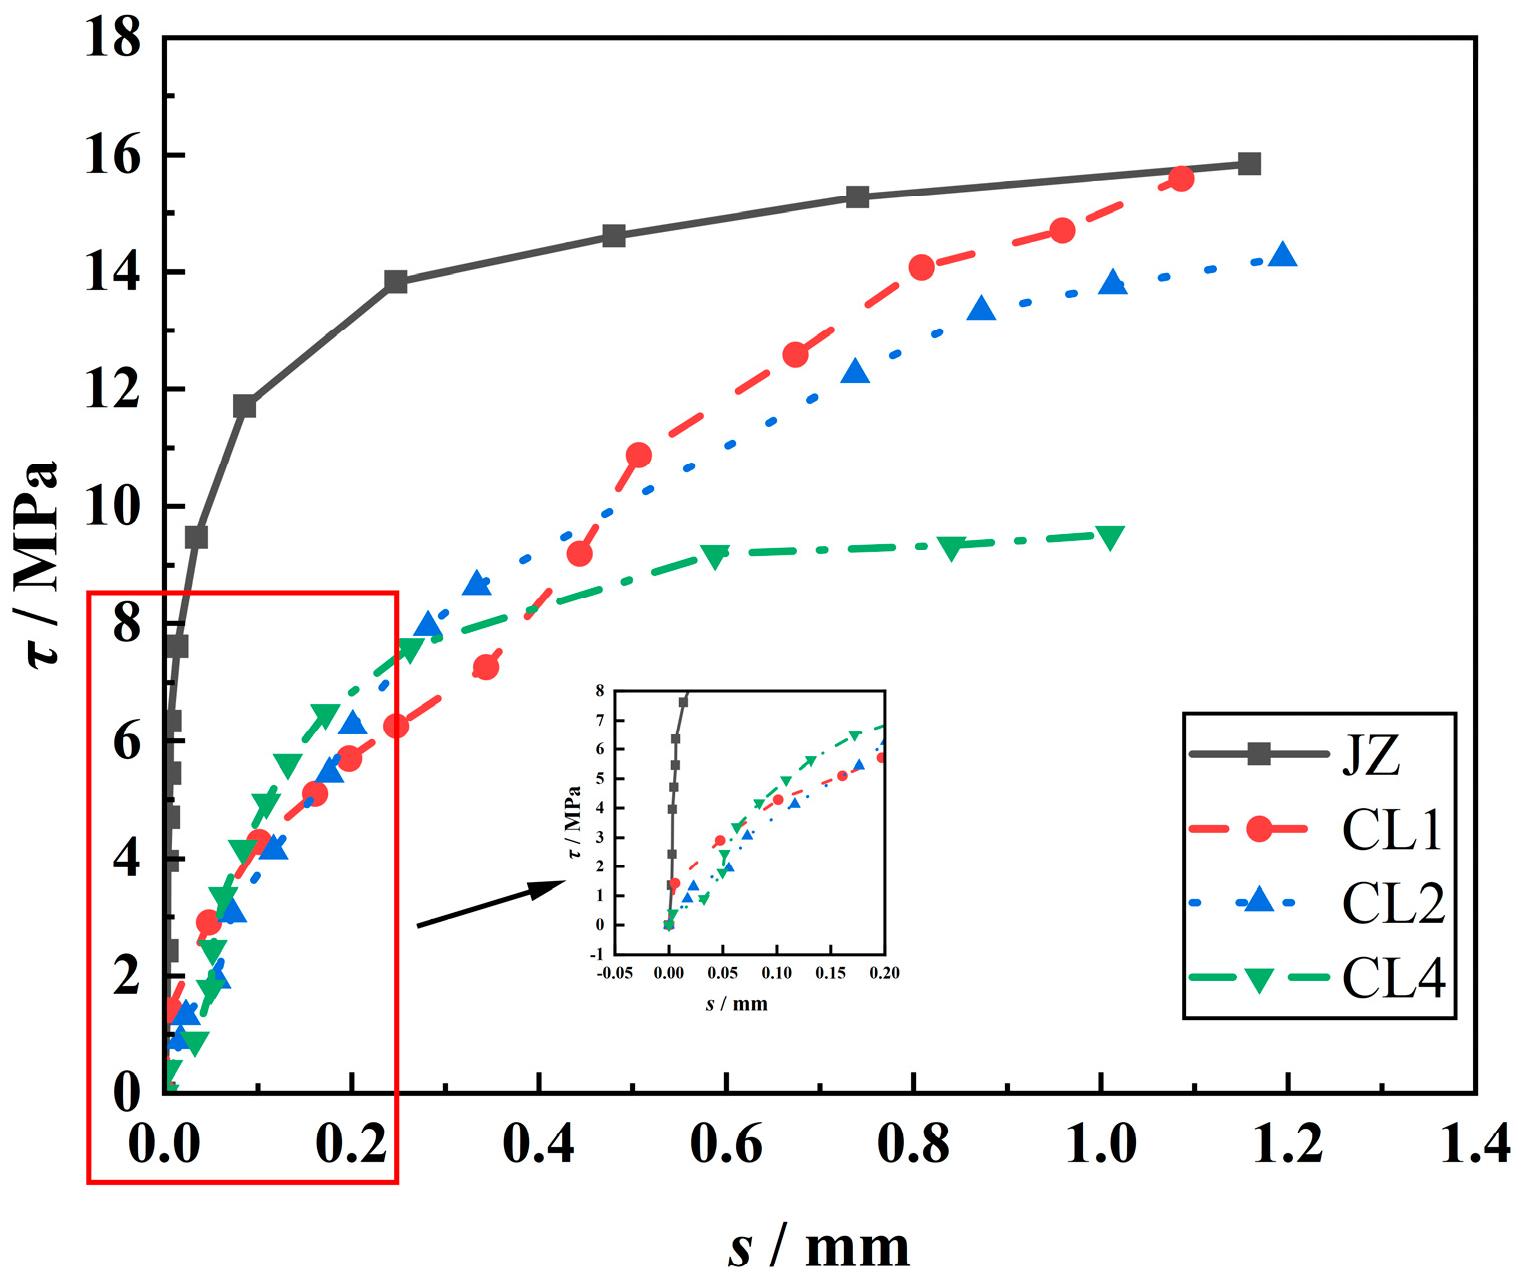
3.3.3. Effect of LP Content on τ-s Curves
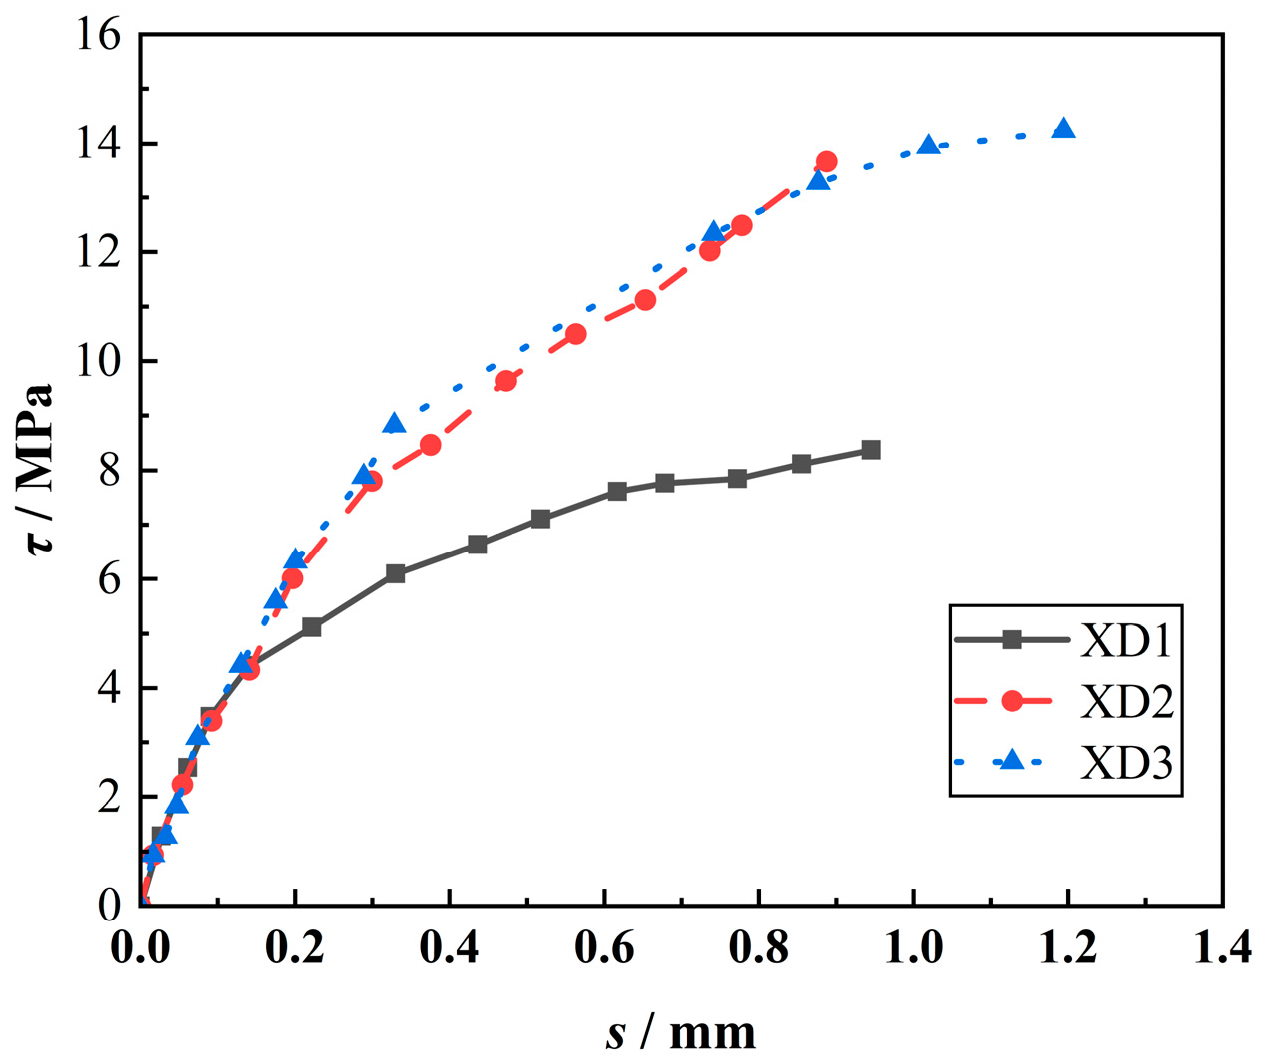
3.3.4. Effect of LP-Specific Surface Area on τ-s Curves
3.3.5. Effect of W/B on τ-s Curves
4. Compressive Activity of LP
5. Conclusions
- (1)
- Adding the optimal quantity of LP can improve the working performance of concrete. However, when the specific surface area of LP surpasses that of cement, augmenting the LP content would result in an elevation in water requirement, therefore diminishing the slump of concrete. Specifically, the optimal improvement in the slump of concrete occurs when the specific surface area of LP is 600 m2/kg and its content is 15%.
- (2)
- When the LP content is less than 15%, it can substantially enhance the compressive strength of concrete. In addition, LP with a specific surface area of 1000 m2/kg most improves concrete strength in the early stage, while limestone powder with a specific surface area of 600 m2/kg is optimal for improving strength in the later stage.
- (3)
- The variation trend of the τ-s curves of steel bar–LP concrete is similar to that of steel bar–ordinary concrete. However, the ultimate bond stress is inversely proportional to the content of LP and W/B and is proportional to the specific surface area of LP.
- (4)
- As an inert material, LP has a very low pozzolanic activity effect. The compressive activity index (CAI) proposed in this paper can effectively characterize this characteristic. CAI increases with the increase in LP-specific surface area and decreases with age. When CAI is negative, it indicates that LP reduces the strength of concrete.
- (5)
- LP can be used as a preferred alternative when traditional mineral admixtures (such as fly ash and slag) are in short supply or expensive. When the specific surface area of LP is 600 m2/kg, and the content is not more than 15%, the substitution effect is the best, which can significantly improve the physical and mechanical properties of concrete. In view of the limitations of the test, the follow-up study needs to further explore the coupling effect of LP and fly ash and slag on the performance of concrete.
Author Contributions
Funding
Institutional Review Board Statement
Informed Consent Statement
Data Availability Statement
Acknowledgments
Conflicts of Interest
References
- Danish, A.; Mosaberpanah, M.A.; Tuladhar, R.; Salim, M.U.; Yaqub, M.A.; Ahmad, N. Effect of cenospheres on the engineering properties of lightweight cementitious composites: A comprehensive review. J. Build. Eng. 2022, 49, 104016. [Google Scholar] [CrossRef]
- Islam, S.R.; Majumder, S.N.; Mutsuddy, R. Life cycle assessment and mechanical strength of cement composites with conventional, and recycled fine aggregate. Sustain. Struct. 2024, 4, 000052. [Google Scholar] [CrossRef]
- Tan, Y.Y.; Awang, H.; Kaus, N.H.M. Integration of fly ash and ground granulated blast furnace slag into palm oil fuel ash based geopolymer concrete: A review. Sustain. Struct. 2024, 4, 000050. [Google Scholar] [CrossRef]
- Arachchige, R.M.; Olek, J.; Rajabipour, F.; Peethamparan, S. Non-traditional aluminosilicate based alkali-activated mortars—Statistical optimization of solution parameters and processing conditions for optimal compressive strength, workability and setting time. Constr. Build. Mater. 2023, 409, 134096. [Google Scholar] [CrossRef]
- Kang, S.; Emerson, L.; Lee, J.; Ley, M.T. Determining the air-entraining admixture dosage in concrete with non-traditional coal ash. Mater. Struct. 2023, 56, 9. [Google Scholar] [CrossRef]
- Chowaniec-Michalak, A.; Czarnecki, S.; Sadowski, Ł.; Królicka, A. Recycling of waste limestone powders for the cleaner production of epoxy coatings: Fundamental understanding of the mechanical and microstructural properties. J. Clean. Prod. 2022, 372, 133828. [Google Scholar] [CrossRef]
- Espin, M.; Duran-Olivencia, F.; Valverde, J. Role of particle size on the cohesive behavior of limestone powders at high temperature. Chem. Eng. J. 2020, 391, 123520. [Google Scholar] [CrossRef]
- Ma, X.; Kaneko, T.; Tashimo, T.; Yoshida, T.; Kato, K. Use of limestone for SO2 removal from flue gas in the semidry FGD process with a powder-particle spouted bed. Chem. Eng. Sci. 2000, 55, 4643–4652. [Google Scholar] [CrossRef]
- Zhao, L.; He, T.; Niu, M.; Chang, X.; Wang, L.; Wang, Y. Effect of Limestone Powder Mixing Methods on the Performance of Mass Concrete. Materials 2024, 17, 617. [Google Scholar] [CrossRef]
- Wang, J.H. Corrosion damage of cement—Ground limestone cementitious materials under the environment of sulphate and chloride. J. Cent. South Univ. (Sci. Technol.) 2009, 40, 230–235. [Google Scholar]
- Ramezanianpour, A.A.; Ghiasvand, E.; Nickseresht, I.; Mahdikhani, M.; Moodi, F. Influence of various amounts of limestone powder on performance of Portland limestone cement concretes. Cem. Concr. Compos. 2009, 31, 715–720. [Google Scholar] [CrossRef]
- Aytekin, B.; Biricik, Ö.; Mardani, A. Influence of recycled concrete, marble, glass, and limestone powder, and utilization ratios on the compressive strength and alkali–silica reaction performance of mortar mixtures. Int. J. Environ. Sci. Technol. 2024, 21, 5585–5602. [Google Scholar] [CrossRef]
- Ma, R.; Zhang, L.; Song, Y.; Lin, G.; Qian, X.; Qian, K. Recycling stone powder as a partial substitute for cementitious materials into eco-friendly manufactured sand ultra-high performance concretes: Towards cleaner and more cost-effective construction production. J. Build. Eng. 2024, 92, 109772. [Google Scholar] [CrossRef]
- Tamma, V.R.; Pancharathi, R.K.; Bibekananda, M.; Pallapothu, S.N.R.G. Strength and microstructure characteristics of low-grade (LG) limestone-based cements for a sustainable concrete. Environ. Dev. Sustain. 2023, 26, 22907–22927. [Google Scholar] [CrossRef]
- Bazrafkan, A.; Habibi, A.; Sayari, A. Evaluation of mathematical models for prediction of slump, compressive strength and durability of concrete with limestone powder. Adv. Concr. Constr. 2020, 10, 463–478. [Google Scholar] [CrossRef]
- Zhu, P.; Jiang, L.; Chu, H.; Yu, Y.; Shi, Y.; Xu, N.; Liu, M. Cement with high-volume limestone powder: Effect of powder fineness on packing density, strength and hydration behaviour. Adv. Cem. Res. 2022, 34, 311–323. [Google Scholar] [CrossRef]
- Li, C. Study on compressive strength and sulfate corrosion resistance of limestone powder and waste glass powder mixed concrete. Mater. Res. Express 2024, 11, 025502. [Google Scholar] [CrossRef]
- Chang, X.; He, T.; Niu, M.; Zhao, L.; Wang, L.; Wang, Y. Influence of limestone powder mixing method on properties of manufactured sand concrete. Case Stud. Constr. Mater. 2024, 20, e02996. [Google Scholar] [CrossRef]
- Huo, J.; Li, C.; Hou, Y.; Cui, Q.; Pan, H. Study on Effect of Concrete Frost Resistance with Limestone Powder and Silicon Fume. In Proceedings of the International Conference on Architecture and Civil Engineering (ICACE), Changsha, China, 19–20 March 2016; pp. 320–325. [Google Scholar]
- Zhang, M.; Lv, H.; Zhou, S.; Wu, Y.; Zheng, X.; Yan, Q. Study on the Frost Resistance of Composite Limestone Powder Concrete against Coupling Effects of Sulfate Freeze–Thaw. Buildings 2023, 13, 2776. [Google Scholar] [CrossRef]
- Zhang, Z.; Gao, Y.; Qin, F.; Sun, F.; Huang, Y. Mechanical properties of sustainable high strength ECC with substitution of cement by limestone powder. Case Stud. Constr. Mater. 2023, 19, e02434. [Google Scholar] [CrossRef]
- Faheem, A.; Rizwan, S.A.; Bier, T.A. Properties of self-compacting mortars using blends of limestone powder, fly ash, and zeolite powder. Constr. Build. Mater. 2021, 286, 122788. [Google Scholar] [CrossRef]
- OChakkor, O.; Altan, M.F.; Canpolat, O.; Dilbas, H.; Uysal, M. Relative Performance of Limestone, Marble, and Basalt Powders in Replacement of a Recycled Fine Aggregate from Red Mud and Metakaolin-Based Geopolymer Mortar. Iran. J. Sci. Technol. Trans. Civ. Eng. 2022, 46, 2961–2974. [Google Scholar] [CrossRef]
- Chouhan, H.S.; Kalla, P.; Nagar, R.; Gautam, P.K.; Arora, A.N. Investigating use of dimensional limestone slurry waste as fine aggregate in mortar. Environ. Dev. Sustain. 2020, 22, 2223–2245. [Google Scholar] [CrossRef]
- Zhu, P.; Yang, G.; Jiang, L.; Shi, Y.; Xu, N.; Jin, M.; Gu, Y. Influence of high-volume limestone powder on hydration and microstructural development of cement. Adv. Cem. Res. 2021, 33, 197–209. [Google Scholar] [CrossRef]
- Mehta, P.K. Advancements in Concrete Technology. Concr. Int. 1999, 21, 69–76. [Google Scholar]
- Rashad, A.M.; Seleem, H.D.H. A Study on High Strength Concrete with Moderate Cement Content Incorporating Limestone Powder. Build. Res. J. 2014, 61, 43–58. [Google Scholar] [CrossRef]
- Park, C.; Jeong, W.-K.; Kim, K.-H. Fundamental Properties of Limestone Powder Added Cement Environment-Friendly Concrete for Concrete Pavement. Int. J. Highw. Eng. 2012, 14, 37–49. [Google Scholar]
- Shen, L.; Li, Q.; Ge, W.; Xu, S. The mechanical property and frost resistance of roller compacted concrete by mixing silica fume and limestone powder: Experimental study. Constr. Build. Mater. 2020, 239, 117882. [Google Scholar] [CrossRef]
- Irwanto, T.J.; Qadar, T. Influence of replacement Portland cement with white limestone powder from Madura as filler on hot asphalt mixture (hot mix) Asphalt Concrete Wearing Course (ACWC) on Marshall characteristic. J. Phys. Conf. Ser. 2019, 1375, 012026. [Google Scholar] [CrossRef]
- Donza, H.; Cabrera, O.; Irassar, E. High-strength concrete with different fine aggregate. Cem. Concr. Res. 2002, 32, 1755–1761. [Google Scholar] [CrossRef]
- Wang, R.; Zhang, Q.; Li, Y. Deterioration of concrete under the coupling effects of freeze–thaw cycles and other actions: A review. Constr. Build. Mater. 2022, 319, 126045. [Google Scholar] [CrossRef]
- Xiao, Q.H.; Li, Q.; Cao, Z.Y.; Tian, W.Y. The deterioration law of recycled concrete under the combined effects of freeze-thaw and sulfate attack. Constr. Build. Mater. 2019, 200, 344–355. [Google Scholar] [CrossRef]
- Adu-Amankwah, S.; Zajac, M.; Skoček, J.; Němeček, J.; Ben Haha, M.; Black, L. Combined influence of carbonation and leaching on freeze-thaw resistance of limestone ternary cement concrete. Constr. Build. Mater. 2021, 307, 125087. [Google Scholar] [CrossRef]
- Tikkanen, J.; Cwirzen, A.; Penttala, V. Freeze–thaw resistance of normal strength powder concretes. Mag. Concr. Res. 2015, 67, 71–81. [Google Scholar] [CrossRef]
- Tsivilis, S.; Batis, G.; Chaniotakis, E.; Grigoriadis, G.; Theodossis, D. Properties and behavior of limestone cement concrete and mortar. Cem. Concr. Res. 2000, 30, 1679–1683. [Google Scholar] [CrossRef]
- Irassar, E. Sulfate attack on cementitious materials containing limestone filler—A review. Cem. Concr. Res. 2009, 39, 241–254. [Google Scholar] [CrossRef]
- Sun, J.; Chen, Z. Influences of limestone powder on the resistance of concretes to the chloride ion penetration and sulfate attack. Powder Technol. 2018, 338, 725–733. [Google Scholar] [CrossRef]
- Wang, D.; Shi, C.; Farzadnia, N.; Shi, Z.; Jia, H. A review on effects of limestone powder on the properties of concrete. Constr. Build. Mater. 2018, 192, 153–166. [Google Scholar] [CrossRef]
- Wang, D.H.; Shi, C.J.; Farzadnia, N.; Shi, Z.G.; Jia, H.F.; Ou, Z.H. A review on use of limestone powder in cement-based materials: Mechanism, hydration and microstructures. Constr. Build. Mater. 2018, 181, 659–672. [Google Scholar] [CrossRef]
- Liu, J.; An, M.; Wang, Y.; Han, S.; Yu, Z. Research on the Relation between Slump Flow and Yield Stress of Ultra-High Performance Concrete Mixtures. Materials 2022, 15, 8104. [Google Scholar] [CrossRef] [PubMed]
- Zhao, Y.; Li, S.; Jin, B.; Li, S.; Zheng, C.; Wang, J. Study on the mechanical properties of self-compacting recycled aggregate concrete using CFB slag as fine aggregate. Phys. Chem. Earth 2023, 132, 103476. [Google Scholar] [CrossRef]
- Xiao, J.; Murong, Y.; Chen, X.; Liu, L.; Zhai, K.; Jiang, H.; Huang, L.; Wang, G. Research on the Bonding Performance of BFRP Bars with Reactive Powder Concrete. Buildings 2023, 13, 2083. [Google Scholar] [CrossRef]
- Yang, T.; Xu, S.; Liu, Z.; Li, J.; Wu, P.; Yang, Y.; Wu, C. Experimental and numerical investigation of bond behavior between geopolymer based ultra-high-performance concrete and steel bars. Constr. Build. Mater. 2022, 345, 128220. [Google Scholar] [CrossRef]
- Wu, Y.; Tang, P.; Lv, H.; Wei, W.; Zhou, S.; Liu, K. Degradation of the bond performance between composite limestone powder concrete and steel bars under a sulfate freeze–thaw environment. Constr. Build. Mater. 2023, 369, 130515. [Google Scholar] [CrossRef]
- Wang, C.; Yang, C.; Liu, F.; Wan, C.; Pu, X. Preparation of Ultra-High Performance Concrete with common technology and materials. Cem. Concr. Compos. 2012, 34, 538–544. [Google Scholar] [CrossRef]
- Popovics, S. Another Look at the Relationship between Strength and Composition of Concrete. ACI Mater. J. 2011, 108, 115–119. [Google Scholar]


| No. | LP Content (%) | LP Specific Surface Area (m2/kg) | W/B | Material Consumption Per Unit Volume (kg/m3) | fcu (Mpa) | Quantities | ||||
|---|---|---|---|---|---|---|---|---|---|---|
| CE | LP | NS | CS | W | ||||||
| A0 | 0 | / | 0.35 | 557 | 0 | 470 | 1174 | 195 | 60.1 | 1 |
| A5/10/15/20/25/30/35-1/2/3 | 5/10/15/20/25/30/35 | 350/600/1000 | 0.35 | / | / | 470 | 1174 | 195 | / | 21 |
| B0 | 0 | / | 0.45 | 433 | 0 | 563 | 1187 | 195 | 48.6 | 1 |
| B5/10/15/20/25/30/35-1/2/3 | 5/10/15/20/25/30/35 | 350/600/1000 | 0.45 | / | / | 563 | 1187 | 195 | / | 21 |
| C0 | 0 | / | 0.55 | 355 | 0 | 641 | 1175 | 195 | 42.8 | 1 |
| C5/10/15/20/25/30/35-1/2/3 | 5/10/15/20/25/30/35 | 350/600/1000 | 0.55 | / | / | 641 | 1175 | 195 | / | 21 |
| D0 | 0 | / | 0.65 | 300 | 0 | 711 | 1152 | 195 | 34.2 | 1 |
| D5/10/15/20/25/30/35-1/2/3 | 5/10/15/20/25/30/35 | 350/600/1000 | 0.65 | / | / | 711 | 1152 | 195 | / | 21 |
| Specimen Types | Specimen No. | Formulation No. | Variable | LP Content (%) | LP Specific Surface Area (m2/kg) | Strength Grades | c (mm) | la (mm) | d (mm) | Quantities |
|---|---|---|---|---|---|---|---|---|---|---|
| CL | CL1 | B5-3 | LP content | 5% | 1000 | C30 | 67 | 80 | 16 | 3 |
| CL2 | B15-3 | 15% | 1000 | C30 | 67 | 80 | 16 | 3 | ||
| CL3 | B20-3 | 20% | 1000 | C30 | 67 | 80 | 16 | 3 | ||
| CL4 | B25-3 | 25% | 1000 | C30 | 67 | 80 | 16 | 3 | ||
| XD | XD1 | B15-1 | LP-specific surface area | 15% | 350 | C30 | 67 | 80 | 16 | 3 |
| XD2 | B15-2 | 15% | 600 | C30 | 67 | 80 | 16 | 3 | ||
| XD3 | B15-3 | 15% | 1000 | C30 | 67 | 80 | 16 | / | ||
| SB | SB1 | A15-2 | W/B | 15% | 600 | C40 | 67 | 80 | 16 | 3 |
| SB2 | B15-2 | 15% | 600 | C30 | 67 | 80 | 16 | / | ||
| SB3 | C15-2 | 15% | 600 | C20 | 67 | 80 | 16 | 3 | ||
| JZ | JZ1 | B0 | / | 0 | / | C40 | 67 | 80 | 16 | 3 |
| Specimen Types | Specimen No. | W/B | LP Content (%) | LP Specific Surface Area (m2/kg) | Bonding Strength (MPa) |
|---|---|---|---|---|---|
| CL | CL1 | 0.45 | 5 | 1000 | 15.60 |
| CL2 | 0.45 | 15 | 1000 | 14.24 | |
| CL3 | 0.45 | 20 | 1000 | 12.62 | |
| CL4 | 0.45 | 25 | 1000 | 9.53 | |
| XD | XD1 | 0.45 | 15 | 350 | 8.37 |
| XD2 | 0.45 | 15 | 600 | 13.66 | |
| XD3(CL2) | 0.45 | 15 | 1000 | 14.24 | |
| SB | SB1 | 0.35 | 15 | 600 | 16.02 |
| SB2(XD2) | 0.45 | 15 | 600 | 13.66 | |
| SB3 | 0.55 | 15 | 600 | 12.76 | |
| JZ | JZ1 | 0.45 | 0 | / | 15.85 |
Disclaimer/Publisher’s Note: The statements, opinions and data contained in all publications are solely those of the individual author(s) and contributor(s) and not of MDPI and/or the editor(s). MDPI and/or the editor(s) disclaim responsibility for any injury to people or property resulting from any ideas, methods, instructions or products referred to in the content. |
© 2025 by the authors. Licensee MDPI, Basel, Switzerland. This article is an open access article distributed under the terms and conditions of the Creative Commons Attribution (CC BY) license (https://creativecommons.org/licenses/by/4.0/).
Share and Cite
Zhang, M.; Yang, Y.; Wu, Y.; Yu, J.; Pang, H.; Lv, H. Effect of Limestone Powder Fineness on the Physical and Mechanical Performance of Concrete. Materials 2025, 18, 835. https://doi.org/10.3390/ma18040835
Zhang M, Yang Y, Wu Y, Yu J, Pang H, Lv H. Effect of Limestone Powder Fineness on the Physical and Mechanical Performance of Concrete. Materials. 2025; 18(4):835. https://doi.org/10.3390/ma18040835
Chicago/Turabian StyleZhang, Mingming, Yuanqi Yang, Yuepeng Wu, Jianbo Yu, Haoran Pang, and Henglin Lv. 2025. "Effect of Limestone Powder Fineness on the Physical and Mechanical Performance of Concrete" Materials 18, no. 4: 835. https://doi.org/10.3390/ma18040835
APA StyleZhang, M., Yang, Y., Wu, Y., Yu, J., Pang, H., & Lv, H. (2025). Effect of Limestone Powder Fineness on the Physical and Mechanical Performance of Concrete. Materials, 18(4), 835. https://doi.org/10.3390/ma18040835