3.1. Phase and Microstructure of AlxCr1−xCoFeNi
The XRD patterns of the Al
xCr
1−xCoFeNi HEAs are shown in
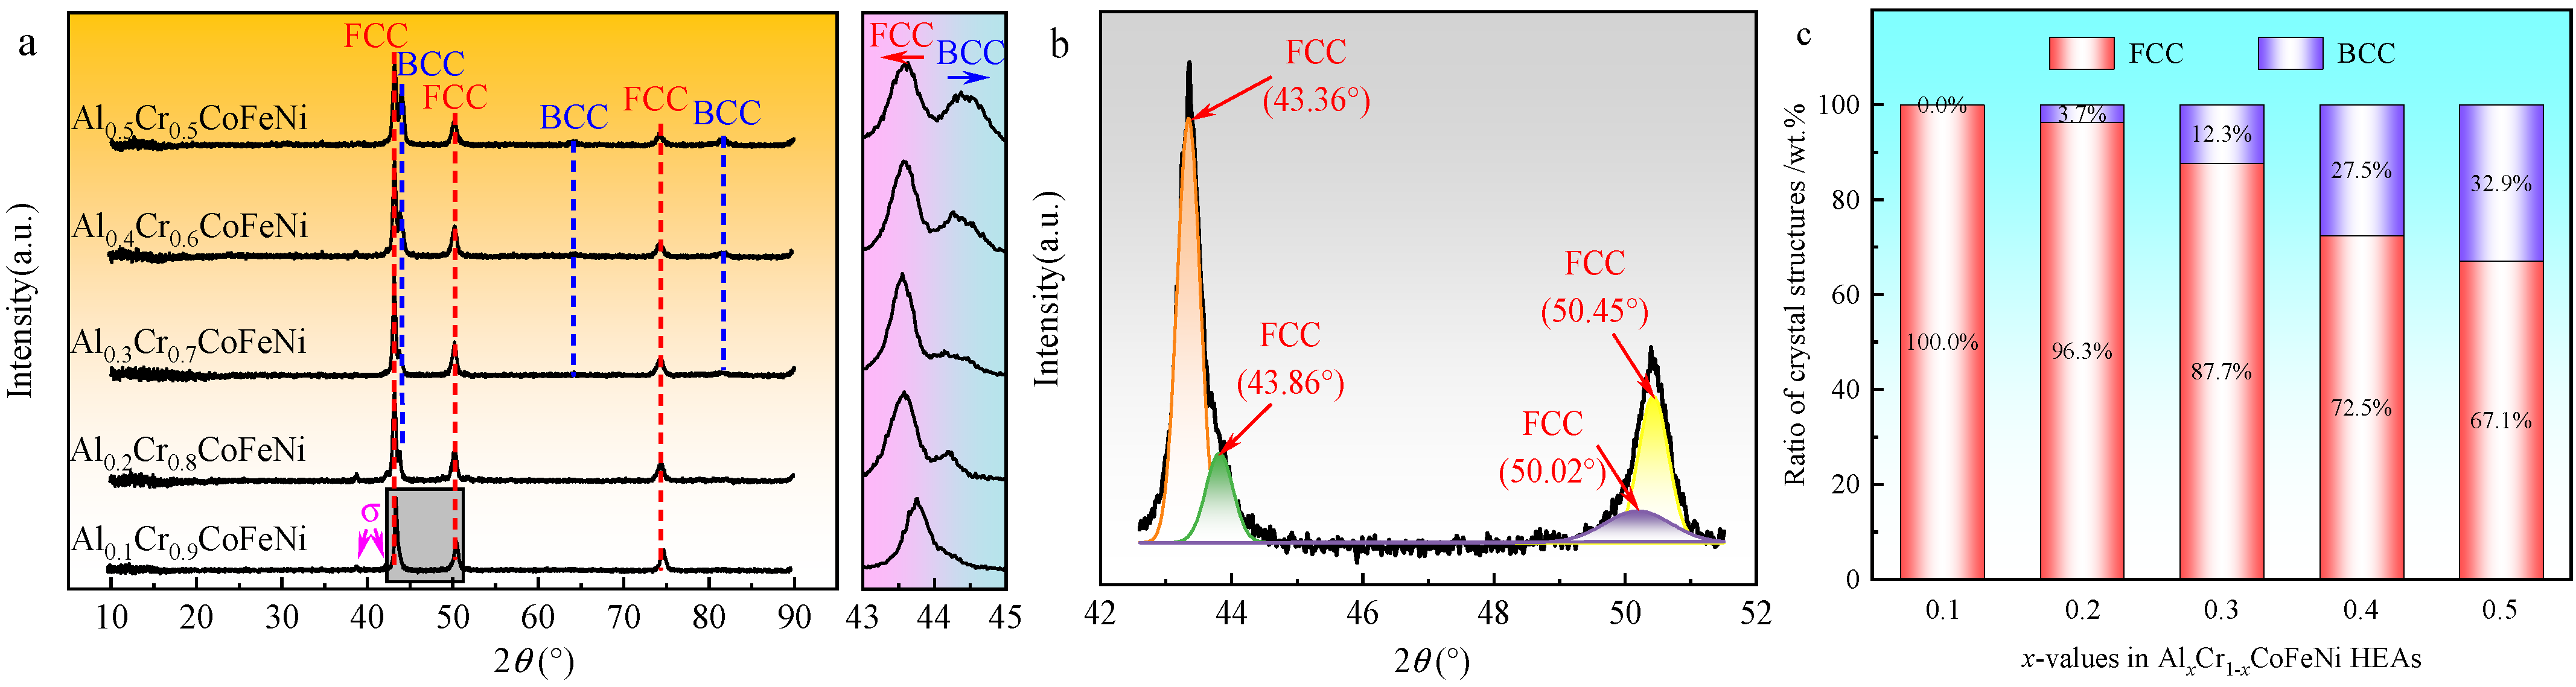
Figure 2a. The diffraction peak angles and peak intensities of the FCC phase identified in the figure were similar to the standard diffraction diagram (PDF#04-0850) for Ni, corresponding to crystallographic indices (1 1 1), (2 0 0), and (2 2 0). Similarly, the BCC phase corresponded to the standard diffraction diagram for Cr (PDF#06-0694) with crystallographic indices (1 1 0), (2 0 0), and (2 1 1). As shown in
Figure 2a, the alloy consisted of FCC + σ phase when
x = 0.1 and BCC peaks were observed in the XRD pattern when
x ≥ 0.2. As the value of
x increased, new diffraction peaks of BCC phase were observed in the XRD pattern and the peak intensity gradually increased. Following the implementation of peak fitting of the XRD pattern of the high-entropy alloy using Jade 6.5 software, the weight percentages of the FCC and BCC phases in the alloy were calculated, with the results presented in
Figure 2c. Due to the absence of an accurate PDF card, the two FCC phases in the Al
0.1Cr
0.9CoFeNi were calculated in unison. The sigma phase in the XRD spectrum is less abundant and was not included in the calculation. As demonstrated in
Figure 2c, as the Al content
x increases from 0.1 to 0.5, the mass percentage of the BCC phase in the Al
xCr
1−xCoFeNi HEAs increases from 0% to 32.9%.
The XRD patterns of the alloys were found to be compatible with the phase prediction results. From the magnified spectra of the 43°~45° region in
Figure 2a, it was observed that the main peak of the FCC phase gradually shifted to the left with the increment of x from 0.1 to 0.5, and part of the FCC phase transformed into the BCC phase. As with steel, the Al and Cr elements in the CoCrFeNi high-entropy alloy are BCC phase-forming elements [
23]. As demonstrated in
Table 2, the atomic size of the Al element exceeds that of the remaining four transition metals, and the atomic-level induced stress is amplified in higher atomic packing efficiency (APE) structures. It is well established that the BCC structure exhibits a lower APE in comparison to the FCC structure; furthermore, an increase in Al content is associated with an escalation in atomic-level stress. When the induced stress reaches a threshold, the FCC structure will transform to the BCC structure [
15,
24]. The atomic size of the Cr element exceeds that of Co, Fe and Ni; thus, an increase in the Cr content can also promote a similar structural transformation.
Figure 2b shows the results of the back-convolution operation on the diffraction peaks in the gray region of
Figure 2a [
25]. Based on the results, it could be inferred that the XRD pattern of Al
0.1Cr
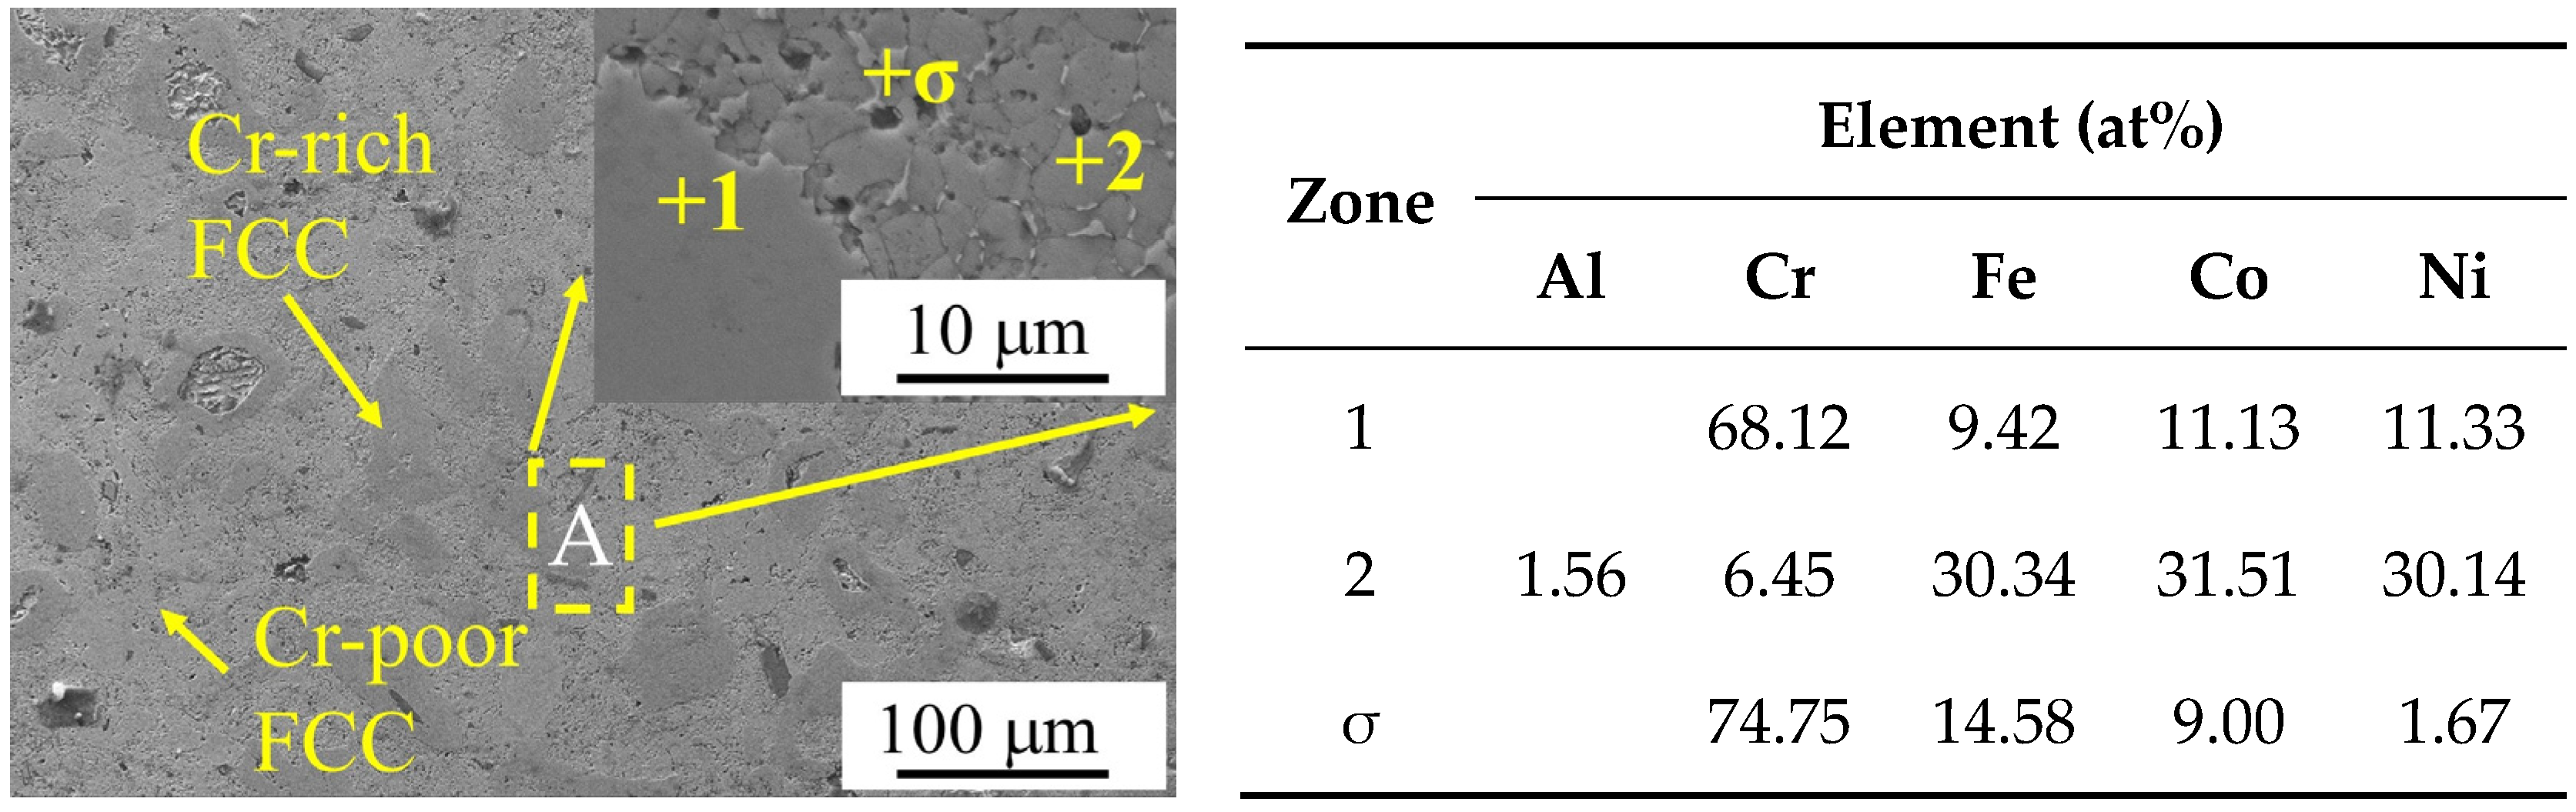
0.9CoFeNi was formed by the superposition of diffraction peaks with different structures. Combining the microstructure SEM images and the EDS results of the Al
0.1Cr
0.9CoFeNi alloy in
Figure 3, the structure of the alloy consisted of two FCC phases with a large variation in Cr element content and tiny σ phases. In
Figure 3, region 1 represents the Cr-rich FCC phase and region 2 represents the Cr-poor FCC phase. As illustrated in
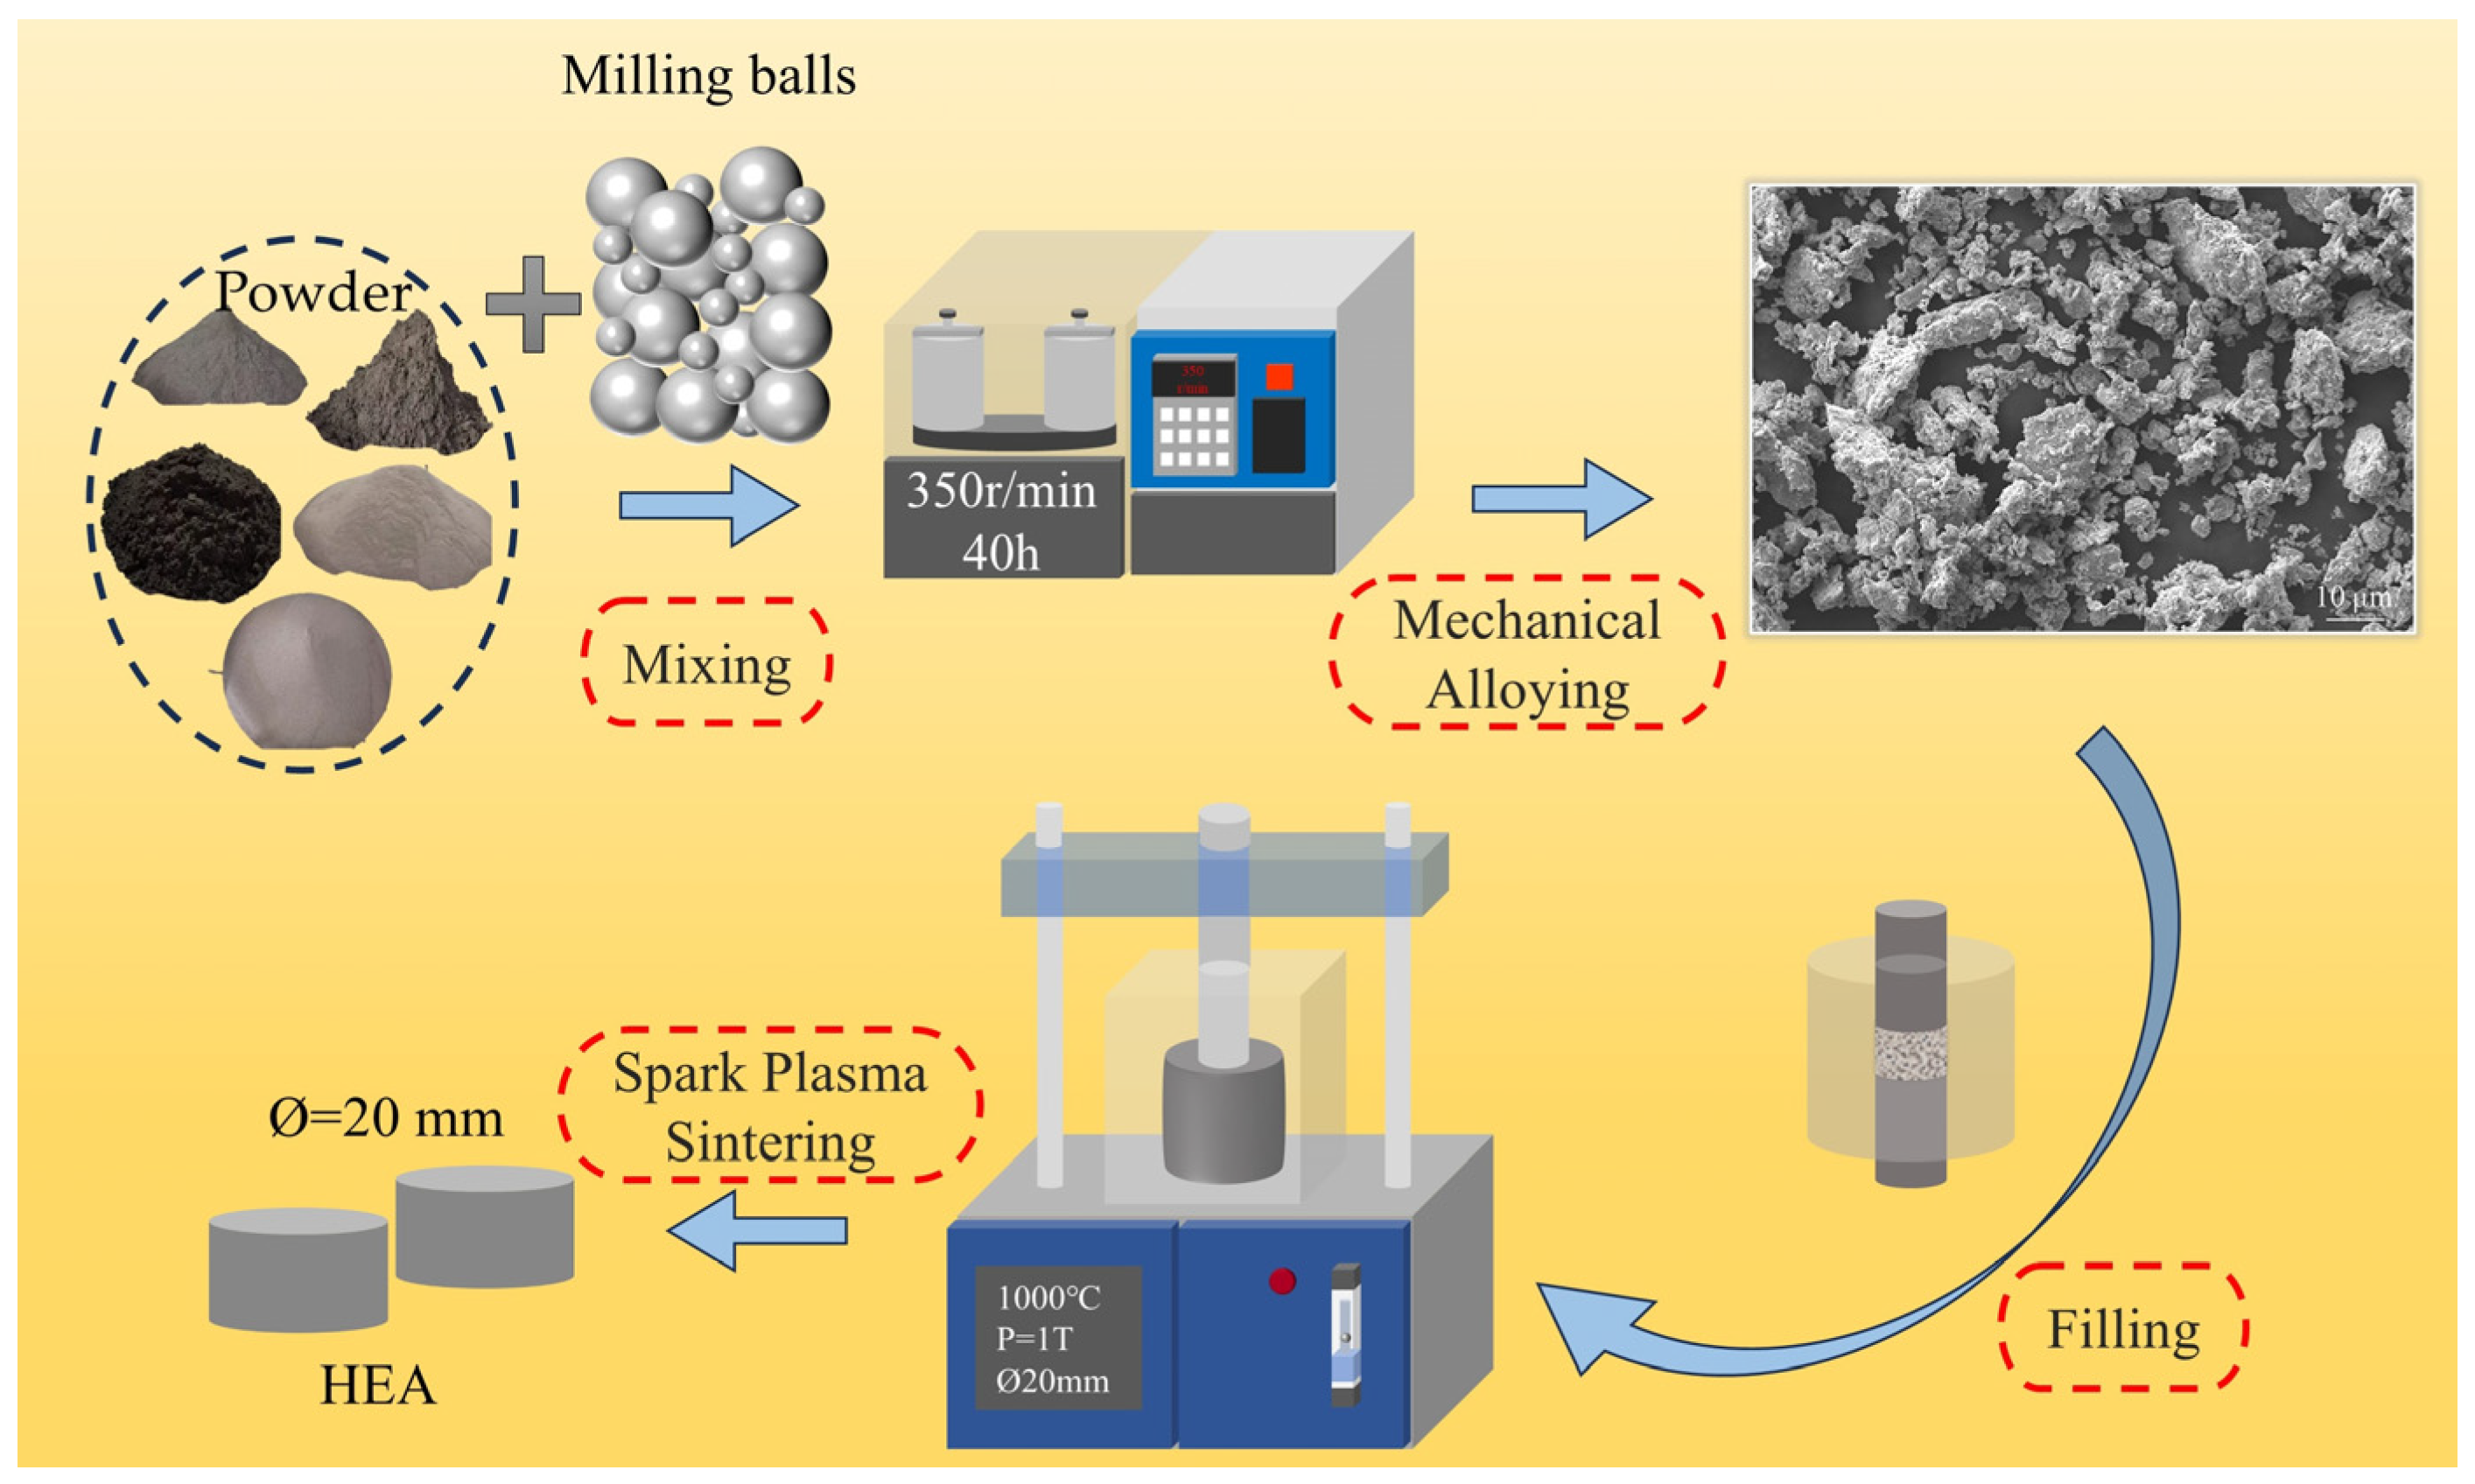
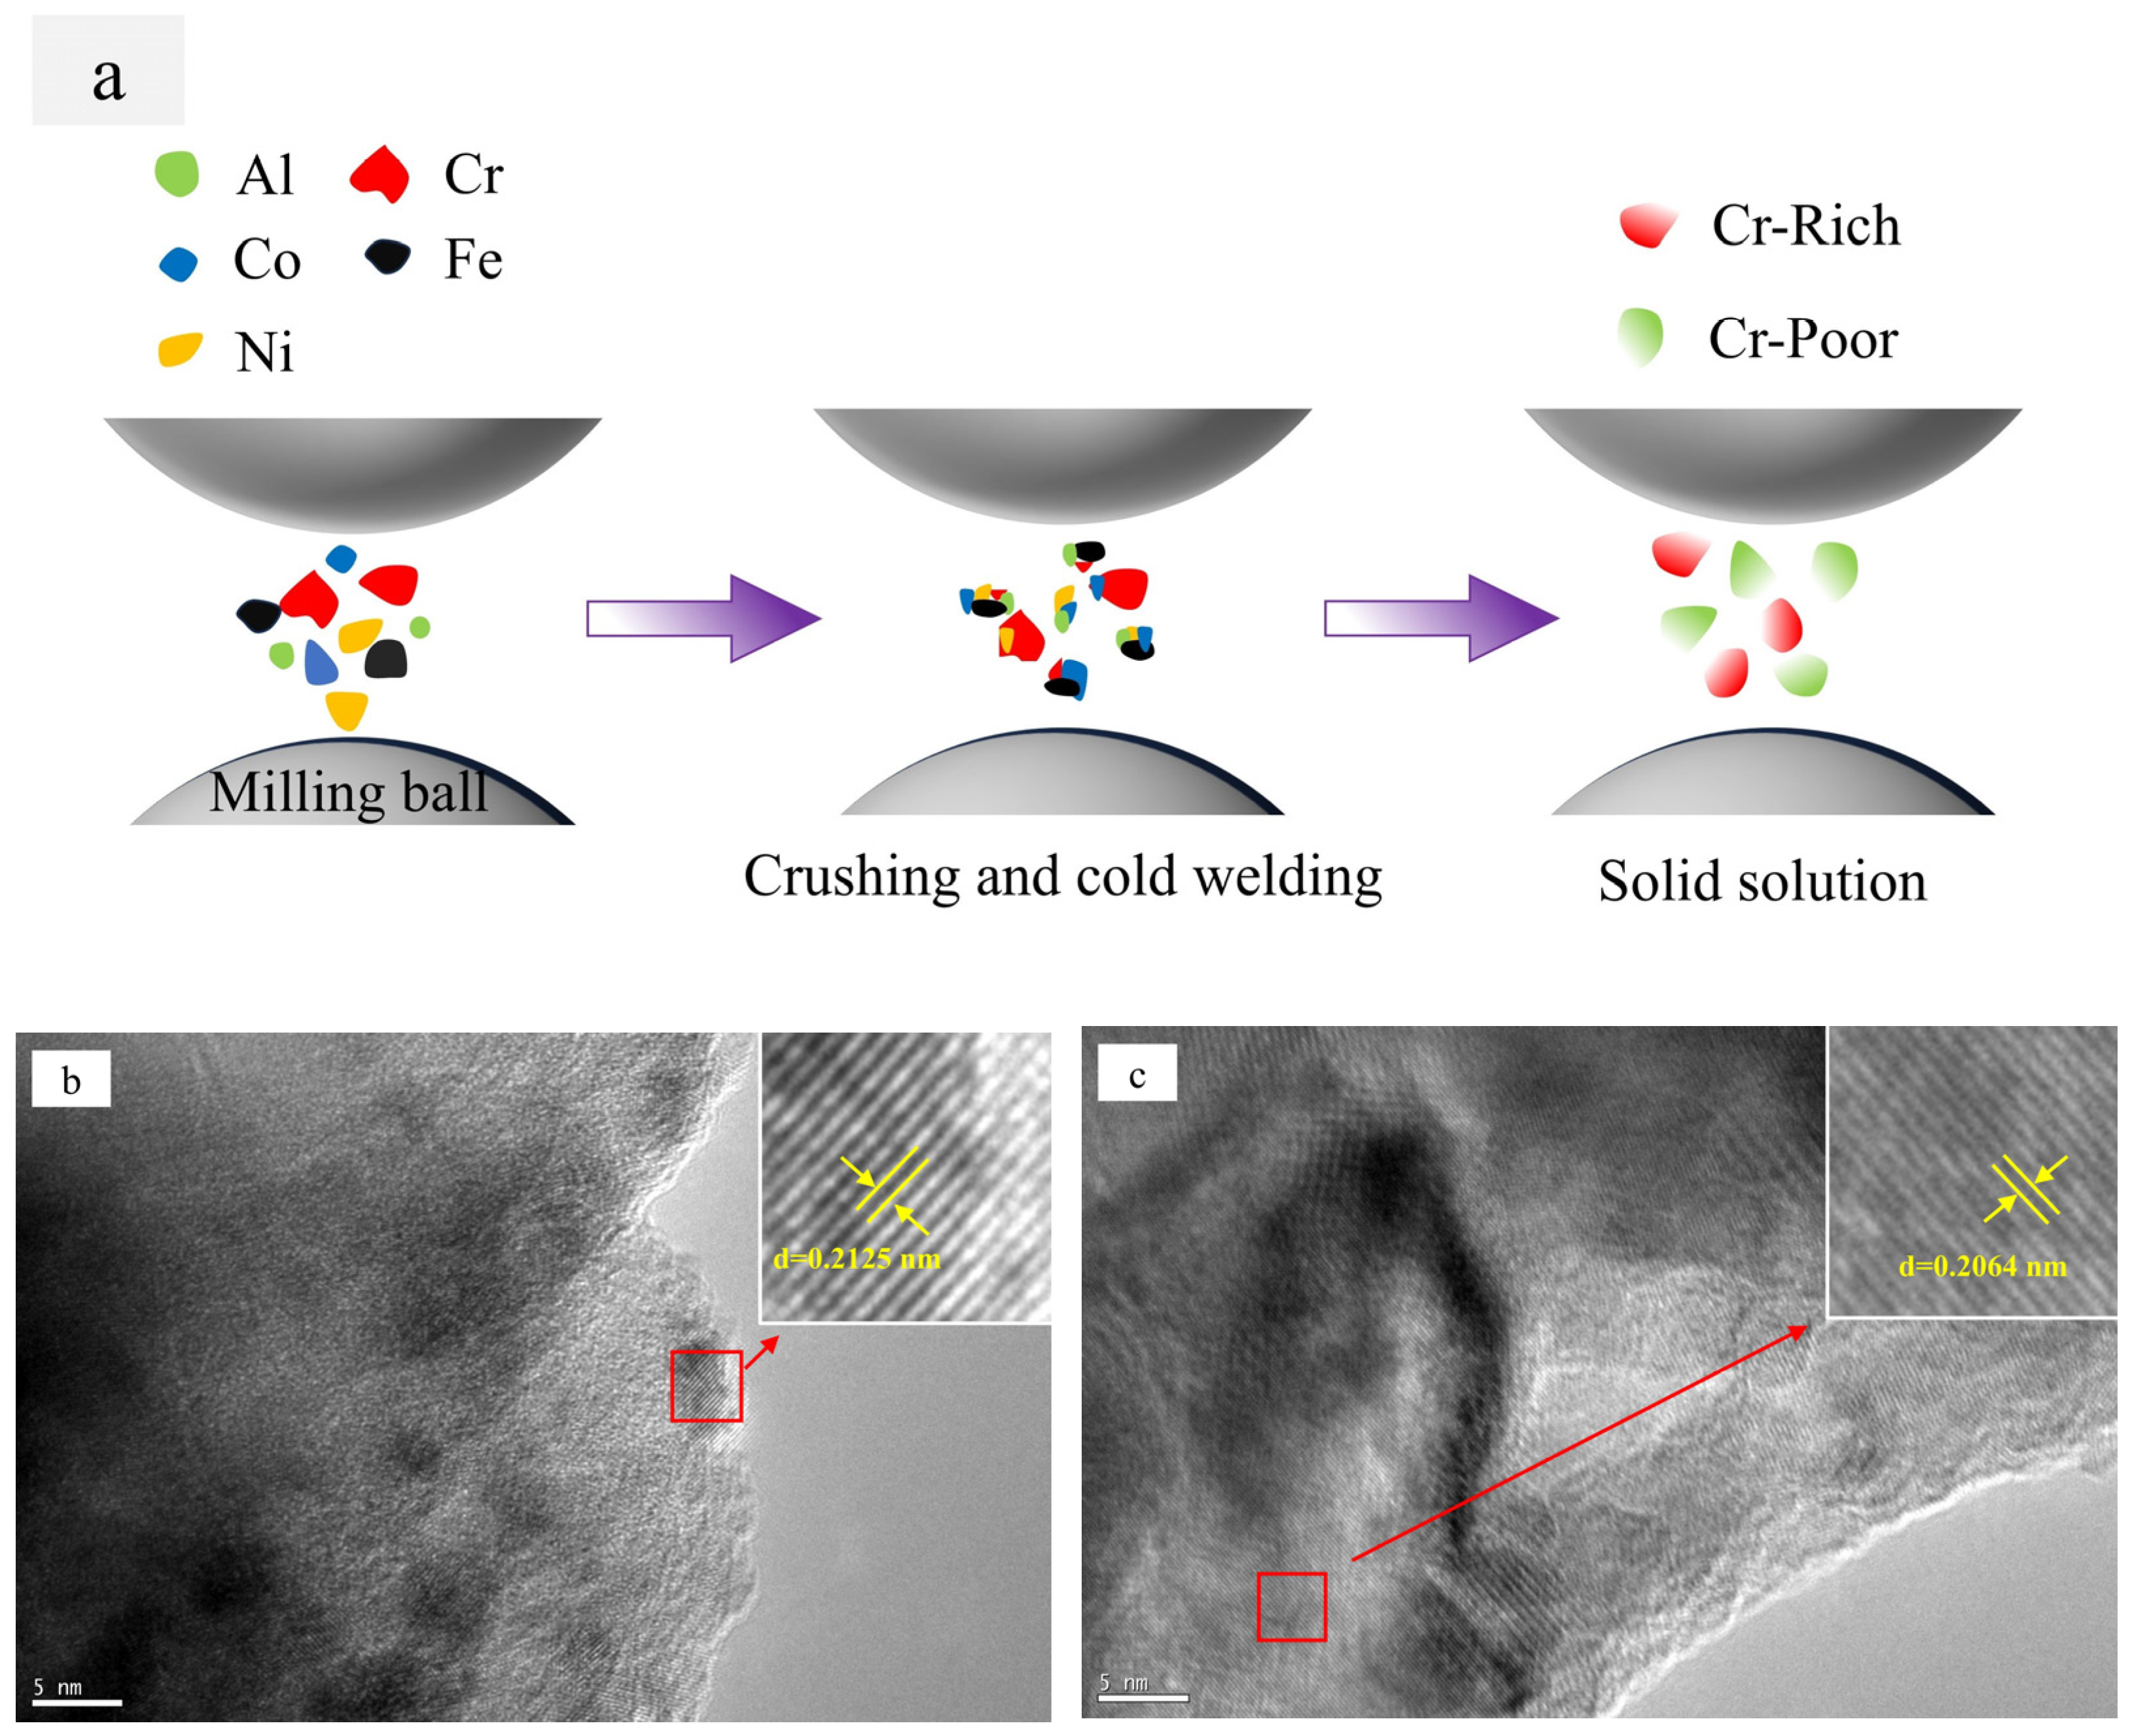
Figure 4, the mechanical alloying process involves subjecting metal powder to forces of friction and impact from milling balls, resulting in the fragmentation of the powder into fine particles. During the subsequent grain crushing and cold welding process, the Cr particles exhibit a significantly higher degree of hardness in comparison to the other four metal particles. The larger particles, which have not undergone complete crushing, cold weld with the smaller particles of the other metals. It is noteworthy that during this process, the Cr element exhibits signs of segregation. The diffusion of metallic elements can be categorized into two distinct processes: (1) Ni and Co dissolved into Fe of FCC to form the Cr-poor Fe (Ni, Co) FCC phase solid solution; and (2) Fe diffused into Cr to form the Fe-Cr BCC phase solid solution [
26].
Figure 4b,c present high-resolution transmission electron microscope images of Al
0.1Cr
0.9CoFeNi high-entropy alloy powder, respectively.
Figure 4b corresponds to the (1 1 1) crystal plane with a crystal plane spacing of d = 0.2125 nm in the FCC1 phase;
Figure 4c corresponds to the (1 1 1) crystal plane with a crystal plane spacing of d = 0.2064 nm in the FCC2 phase. It is evident that there are two FCC phases with analogous crystal plane spacings in the Al
0.1Cr
0.9CoFeNi alloy, which is in accordance with the analysis results depicted in
Figure 2b and
Figure 3. The Al0.1Cr0.9CoFeNi alloy exhibits both Cr-rich and Cr-poor FCC phases.
Ding et al. [
27] found that after replacing some of the Mn elements with Al elements in a CrMnFeCoNi high-entropy alloy with little interstitial concentration fluctuation, the atomic distribution of the alloy showed significant inhomogeneity, and obvious fluctuations in compositional concentration and frequent transverse slippage of dislocations were observed. Al and Cr elements contributed to the elemental bias phenomenon in Al
xCr
1−xCoFeNi HEAs, and the metal atoms could only diffuse to a small extent during SPS sintering, which largely maintained the inhomogeneity of the elemental distribution. It can be hypothesized that this is the reason for the formation of the Cr-poor phase and the Cr-rich phase in the alloy structure.
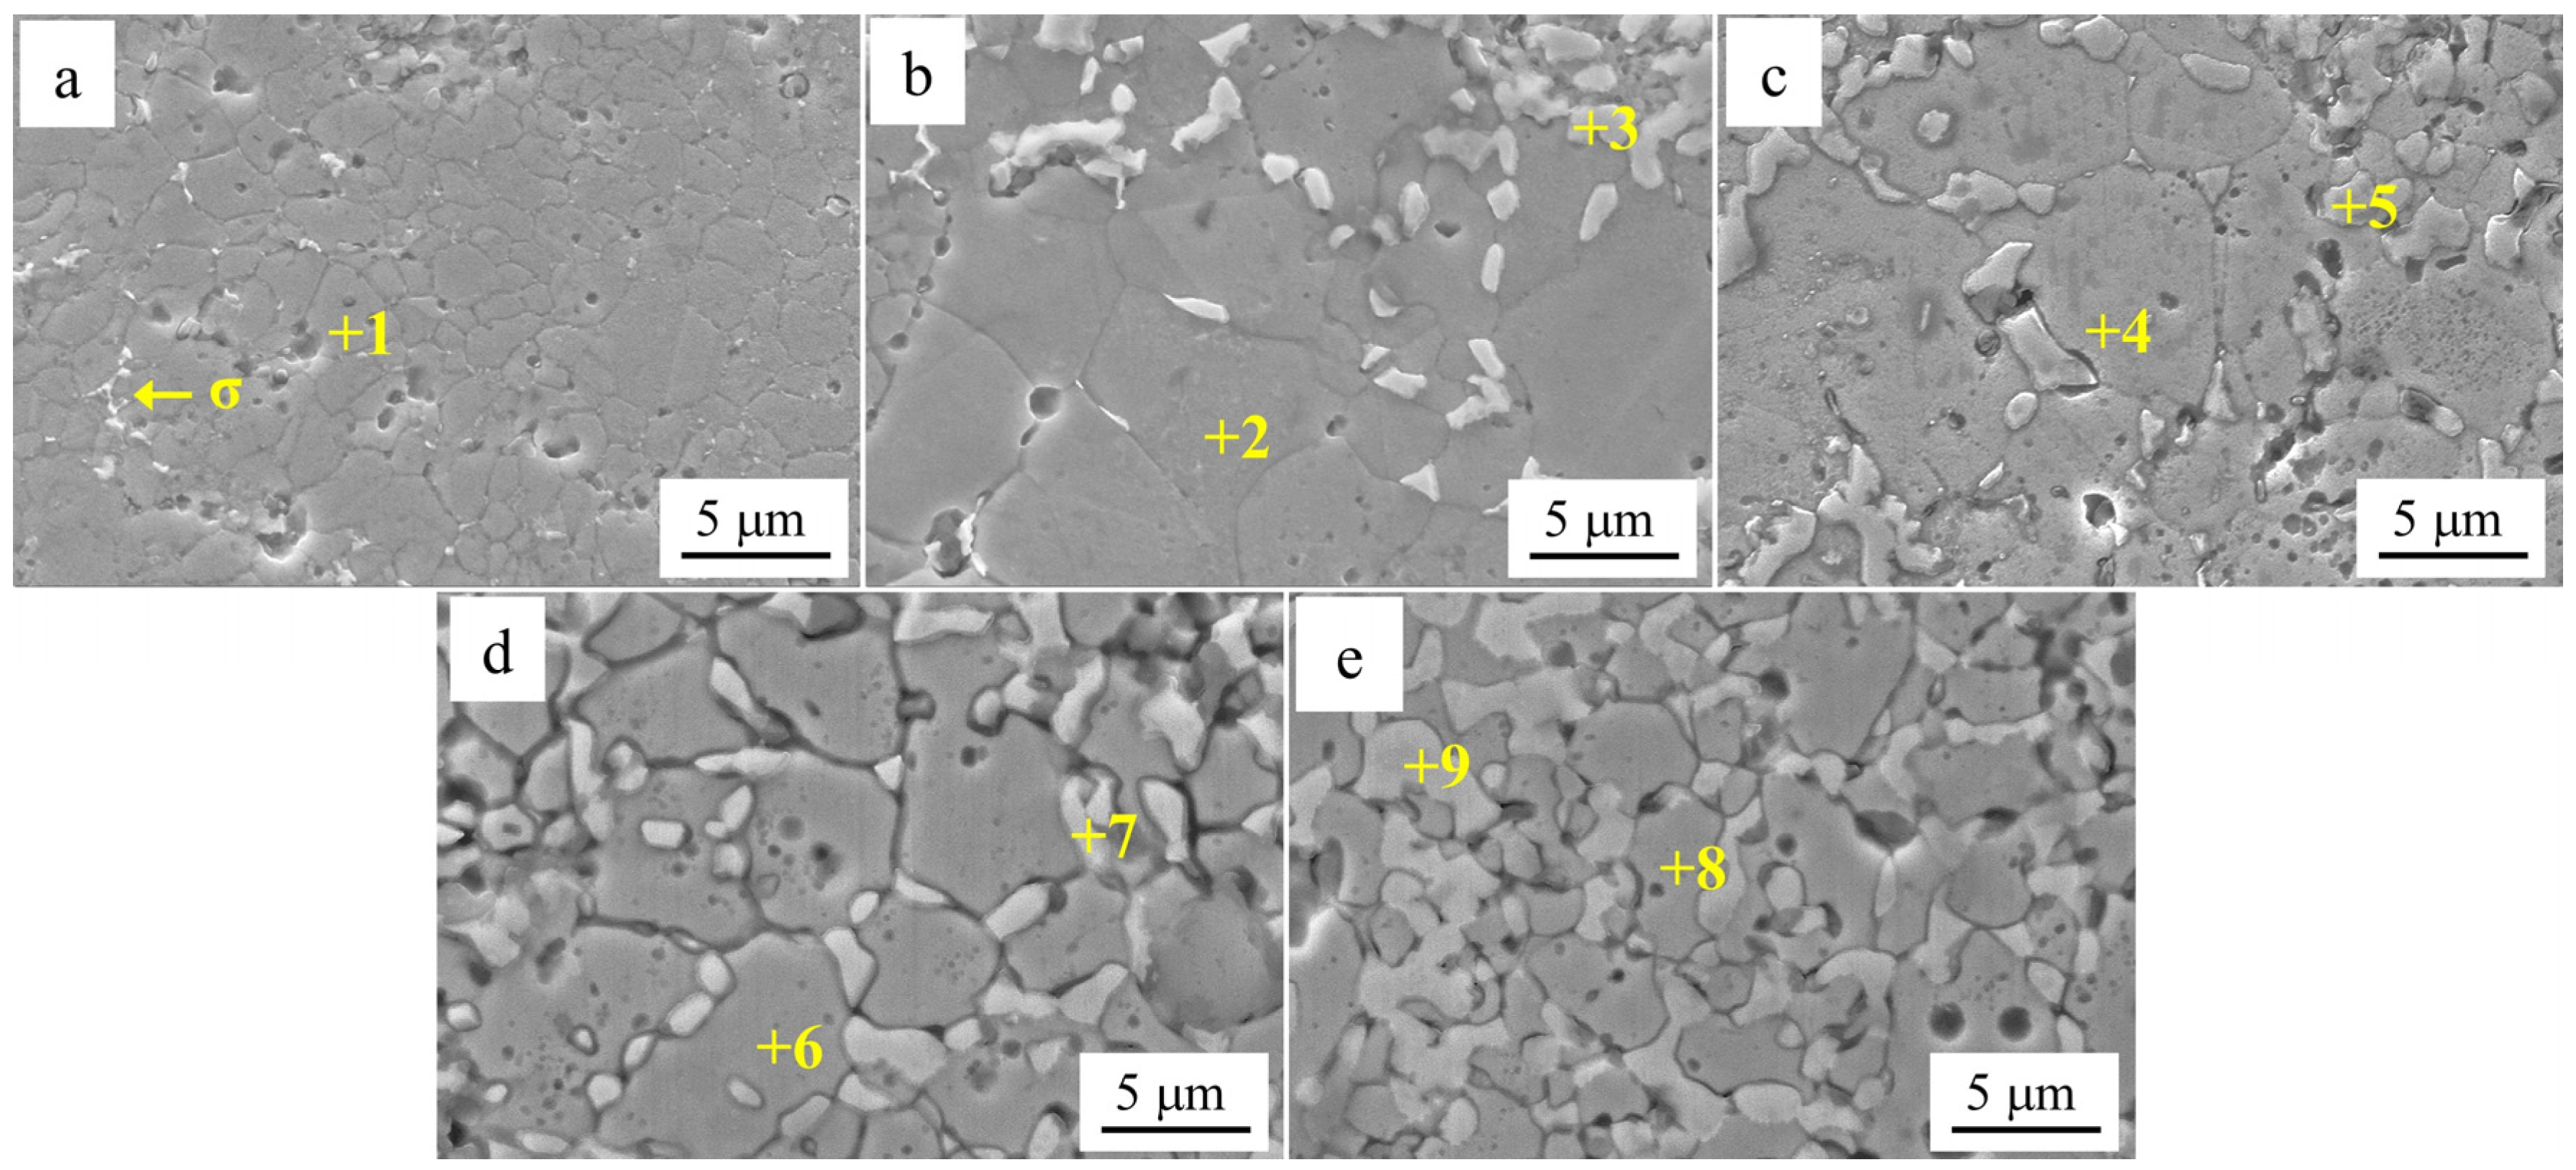
Figure 5 shows the SEM images of Al
xCr
1−xCoFeNi HEAs in the Cr-poor regions with
x = 0.1, 0.2, 0.3, 0.4, 0.5 according to
Figure 5a–e.
Table 4 shows the EDS analysis results of the marked regions in
Figure 5. As shown by the results of the SEM and EDS analyses, the Cr-poor region of the alloys consisted of isometric crystals of Cr-poor FCC and Cr-rich σ at
x = 0.1. At
x = 0.2, the Cr-poor region of the alloys consisted of isometric crystals of Cr-poor FCC, Cr-rich σ and Al-rich BCC. The number of BCC phases gradually increased as
x increased from 0.1 to 0.5.
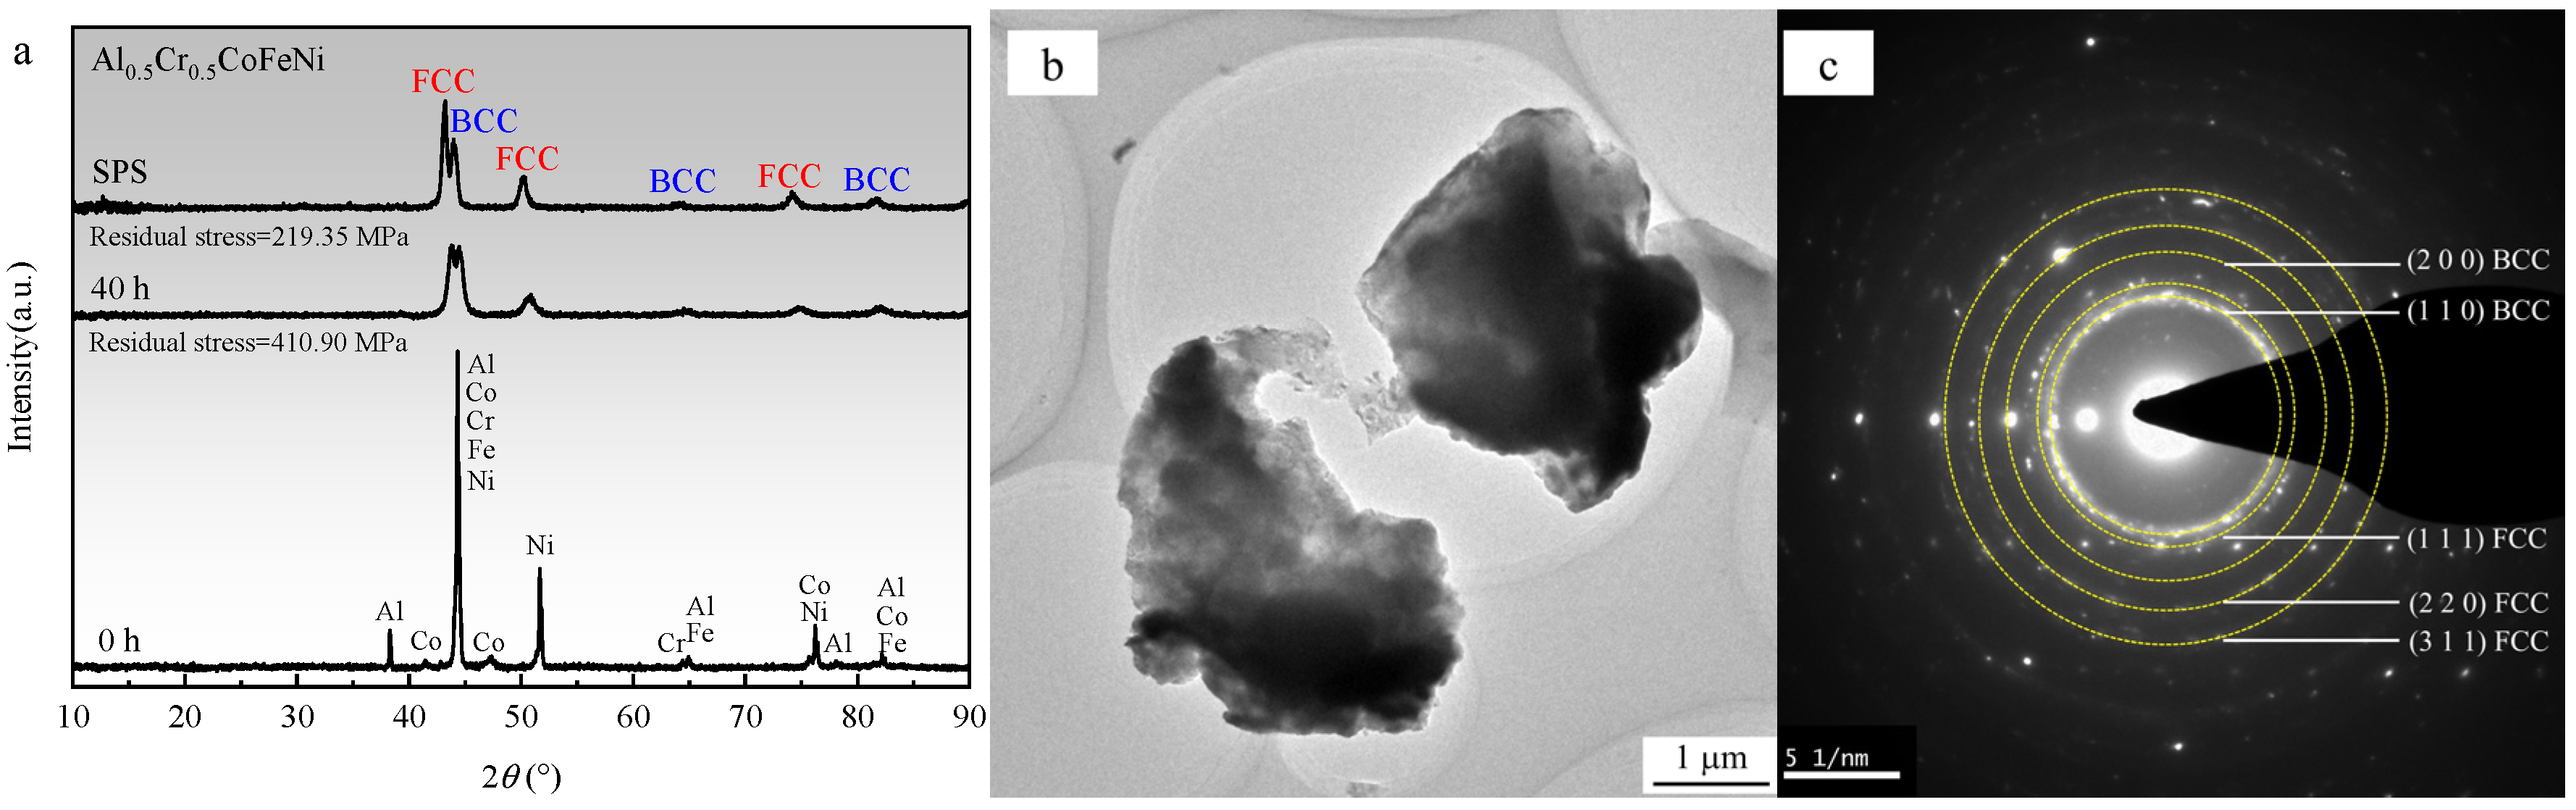
Figure 6a illustrates the XRD patterns of the Al
0.5Cr
0.5CoFeNi alloy in its as-received state, following 40 h of ball milling, and subsequent SPS sintering. It is evident from the figure that after 40 h of ball milling, the diffraction peaks of individual elements dissipate, giving rise to FCC and BCC solid solution diffraction peaks, thereby signifying the fundamental completion of the mechanical alloying process of the high-entropy alloy. The broadening of the diffraction peaks signifies a reduced grain size and elevated lattice distortion [
28]. Following SPS sintering, the position of the diffraction peaks remains predominantly unaltered; however, the intensity of the FCC phase diffraction peaks increases, and the diffraction peaks become marginally narrower, indicating an augmented grain size. Utilizing the values of elastic Young’s modulus and Poisson’s ratio provided in references [
29,
30], the residual stress of the alloy powder post-ball milling was calculated to be 410.90 MPa employing Jade 6.5, and the residual stress of the bulk alloy post-SPS sintering was determined to be 219.35 MPa. It is evident that during mechanical alloying, significant levels of residual stress are generated within the powder particles due to collisions, fragmentation, and cold welding. The heat release and densification processes during SPS sintering serve to reduce the residual stress.
Figure 6b,c present the TEM bright-field image and the selected area electron diffraction (SAED) pattern of Al
0.5Cr
0.5CoFeNi powder following 40 h of ball milling. As illustrated in
Figure 6b, the particle size of the powder is approximately 3 mm.
Figure 6c demonstrates that the SAED pattern reveals two distinct phases, which align closely with the XRD pattern analysis outcomes depicted in
Figure 6a, representing the FCC and BCC phases, respectively.
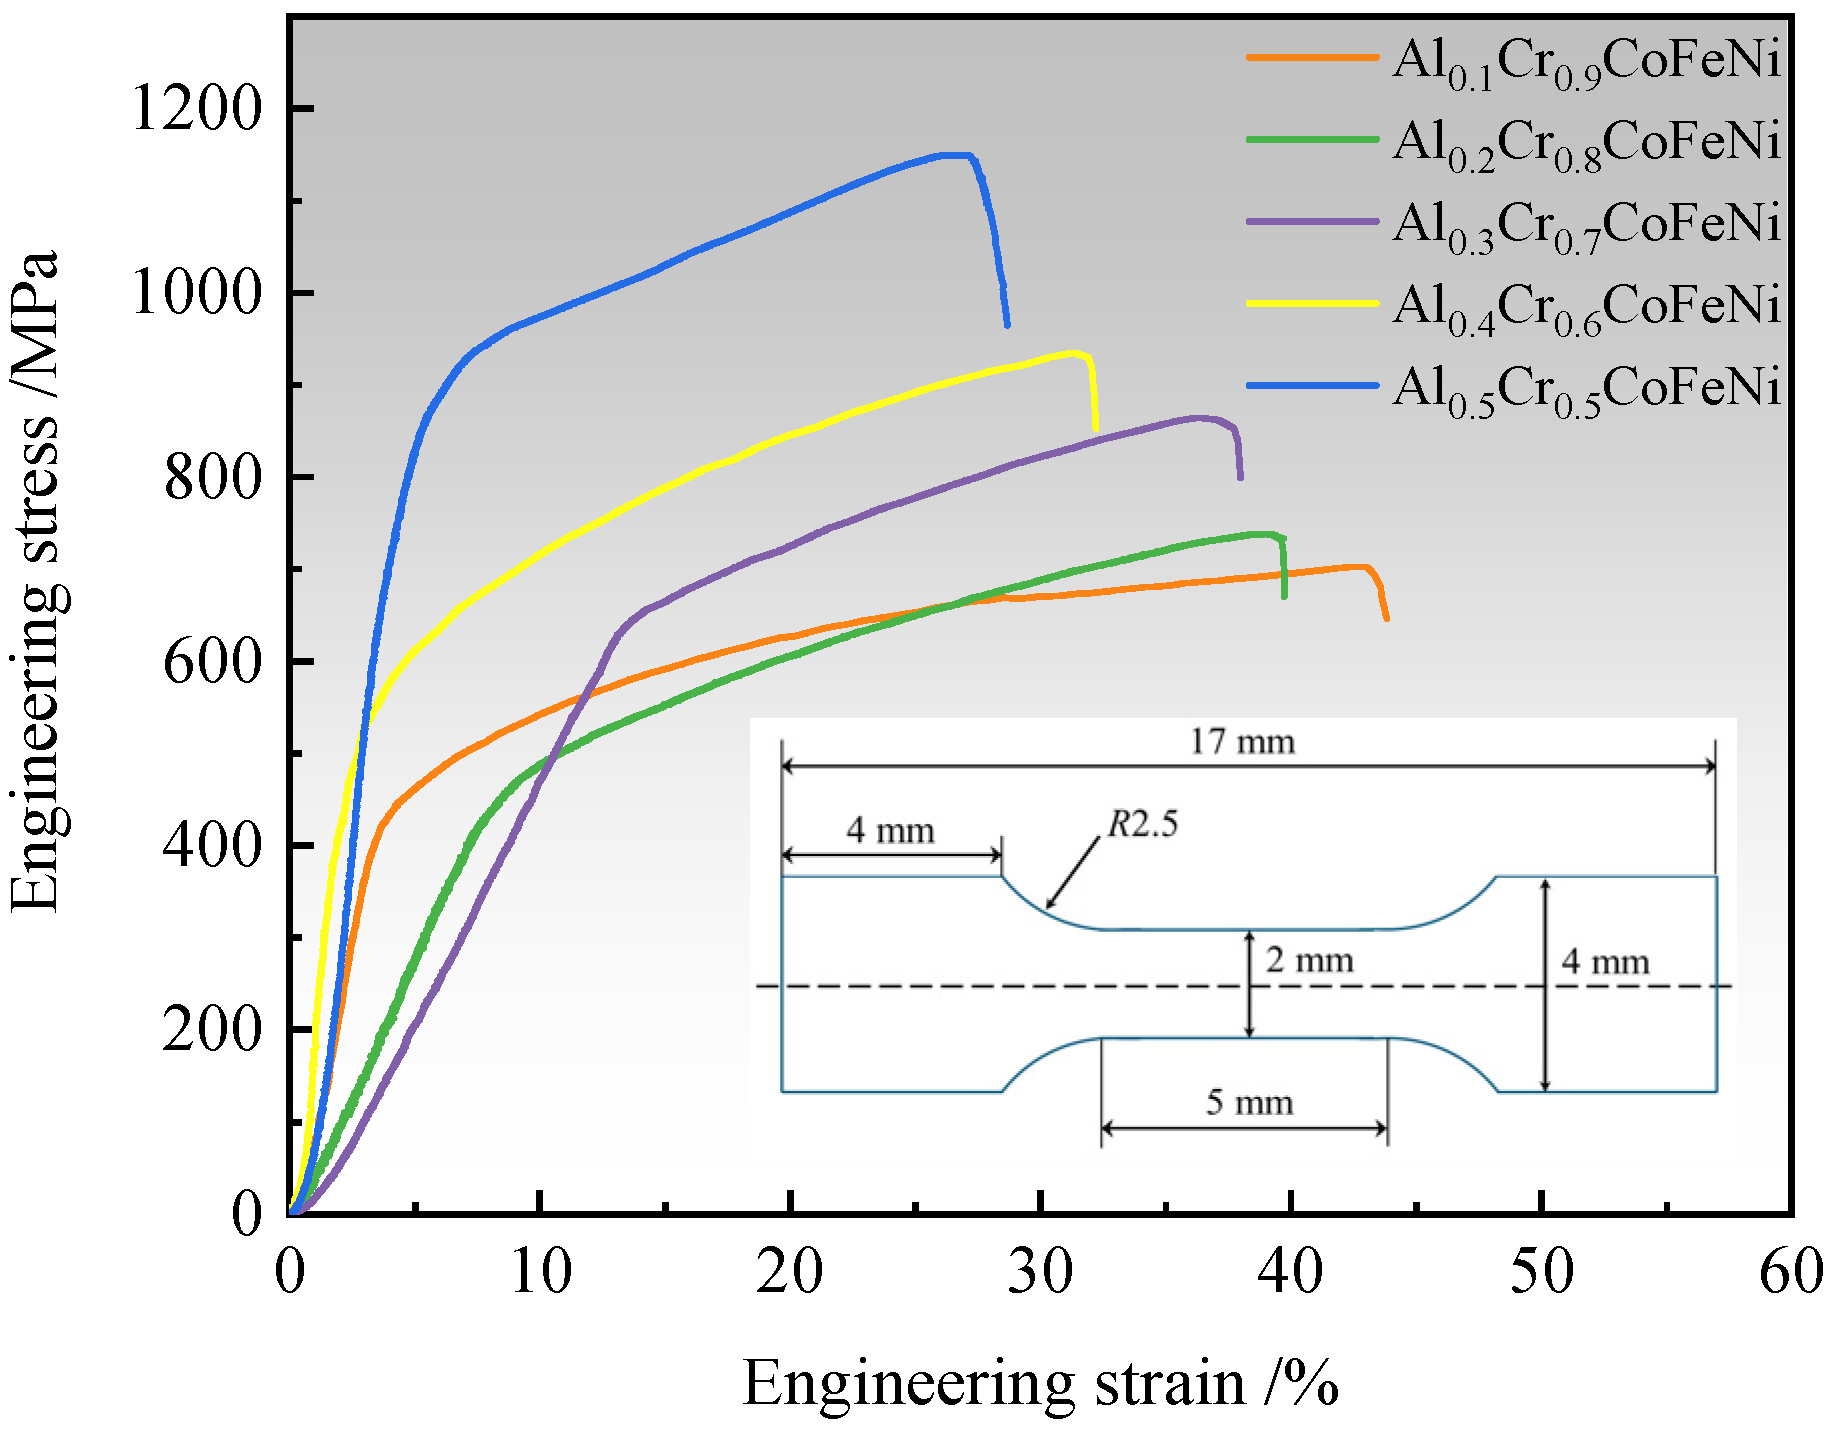
3.2. Tensile Properties
The mechanical properties of Al
xCr
1−xCoFeNi HEAs were studied by means of room-temperature tensile testing. As illustrated in
Figure 7, the engineering stress–strain curve of the alloy is presented. The yield strength (YS), ultimate tensile strength (UTS) and elongation obtained from the tensile curve are shown in
Table 5. The outcomes of the tensile testing indicate a systematic enhancement in the UTS of the Al
xCr
1−xCoFeNi HEAs with an increase in Al content, ranging from an initial value of 702.01 MPa at
x = 0.1 to a maximum of 1163.14 MPa. Concurrently, the alloy’s elongation exhibited a concurrent decline, from 43.01% to 26.98%. The YS of the HEAs demonstrates a gradual increasing trend. However, the YS of Al
0.3Cr
0.7CoFeNi is higher than that of Al
0.4Cr
0.6CoFeNi, and only slightly lower than that of Al
0.5Cr
0.5CoFeNi. The solid solution structure of high-entropy alloys is directly related to their mechanical properties. The XRD spectrum analysis results indicate that as the Al content
x increases from 0.1 to 0.5, the alloy’s phase transitions from FCC to FCC+BCC, with a concomitant gradual increase in the BCC phase content. The enhancement of the alloy’s tensile properties during plastic deformation is attributed to the interplay of two factors: the non-uniform distribution of composition and the interaction of two-phase grain boundaries [
31]. The UTS of Al
0.5Cr
0.5CoFeNi is reported to be up to 1163.14 MPa. The mechanical properties of the Al
xCr
1−xCoFeNi HEAs are comparable to the results of Xiong et al. [
32], but lower than the compression properties of AlCoCrFeNi HEAs prepared using the MA+SPS process [
33]. Two potential explanations for this discrepancy are proposed. Firstly, the manner in which the alloy is subjected to stress during the testing process differs. The SPS sintering process has been observed to yield alloys with residual stress and metastable phases [
34], which have the capacity to influence the outcomes of testing. Secondly, the sintering temperature and pressure also affect the microstructure and properties of the alloy. These factors will be the primary focus of subsequent research in this paper.
3.3. Hardness and Wear Resistance
The Vickers hardness of Al
xCr
1−xCoFeNi is listed in
Table 6. Among the alloys, Al
0.5Cr
0.5CoFeNi exhibits the greatest Vickers hardness, reaching 412.6 HV, which is higher than that of FeCoCrNi prepared by a similar preparation process [
35]. The number of BCC phases in Al
xCr
1−xCoFeNi was found to be positively correlated with the aluminum content. The presence of fewer slip systems in the BCC phase than in the FCC phase results in less ease of dislocation movement. Consequently, Al
0.5Cr
0.5CoFeNi with a greater number of BCC phases exhibits higher hardness [
15].
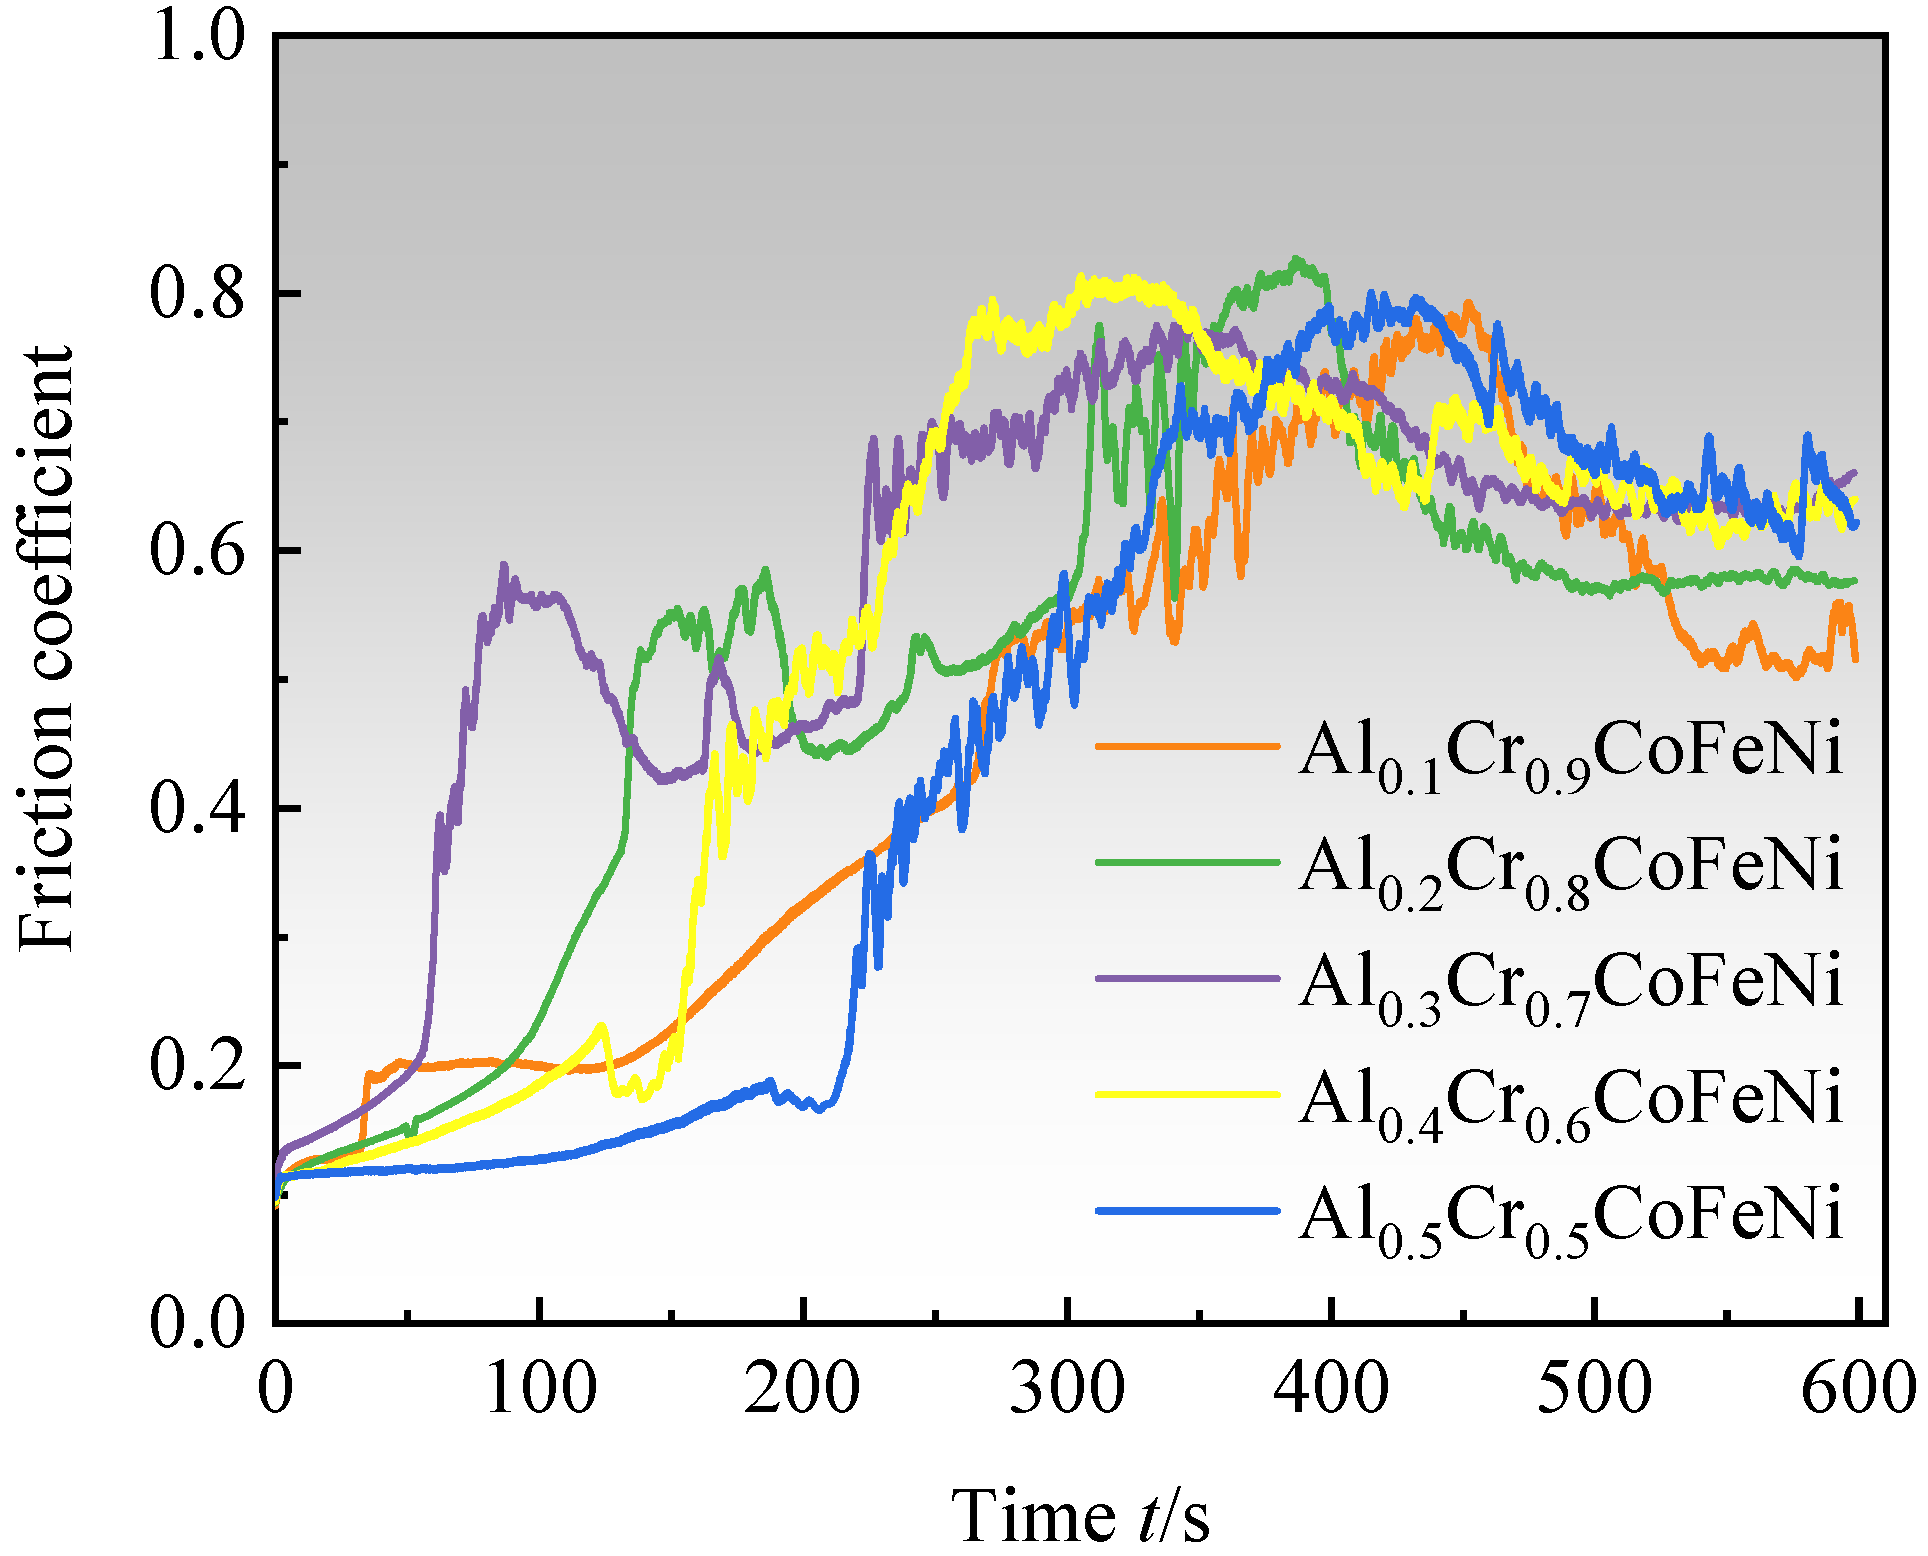
As illustrated in the graphical representation of the friction coefficient–time curves for the Al
xCr
1−xCoFeNi HEAs (
Figure 8), the experimental procedure is divided into three distinct phases. During the initial phase of the test (t ≤ 50 s), the predominant wear mechanism is adhesive wear. The friction coefficient begins at a low value and gradually increases as the grinding balls slide relative to the alloy surface, due to plastic deformation and solid welding, which causes the alloy particles to adhere to the surface of the grinding balls. (2) As the test progresses (50 s < t ≤ 400 s), the wear mechanism transitions to a combination of adhesive and abrasive wear. As a consequence of the generation of frictional heat, hard oxide particles begin to appear on the alloy surface, and these particles are also involved in the process of friction [
36]. The surface of the alloy is severely worn, and the coefficient of friction is increasing and reaches its peak value. (3) In the final stage of the test (t > 400 s), oxidative wear becomes the main mechanism. The generation of heat due to friction leads to the formation of a sufficiently thick and continuous oxide layer consisting of various oxides on the alloy friction surface. This oxide layer serves to protect the alloy surface from adhesive and abrasive wear. At this point, the formation of the oxide film and the wear rate reach an equilibrium, and the coefficient of friction tends to stabilize after a slight decrease. When the oxide film is stabilized, the coefficient of friction tends to increase gradually with the increase in x-value, and the lowest coefficient of friction of 0.513 was found for Al
0.1Cr
0.9CoFeNi. The wear resistance of Al
xCr
1−xCoFeNi is better than that of FeCoCrNi alloys produced by laser melting and cladding [
37].
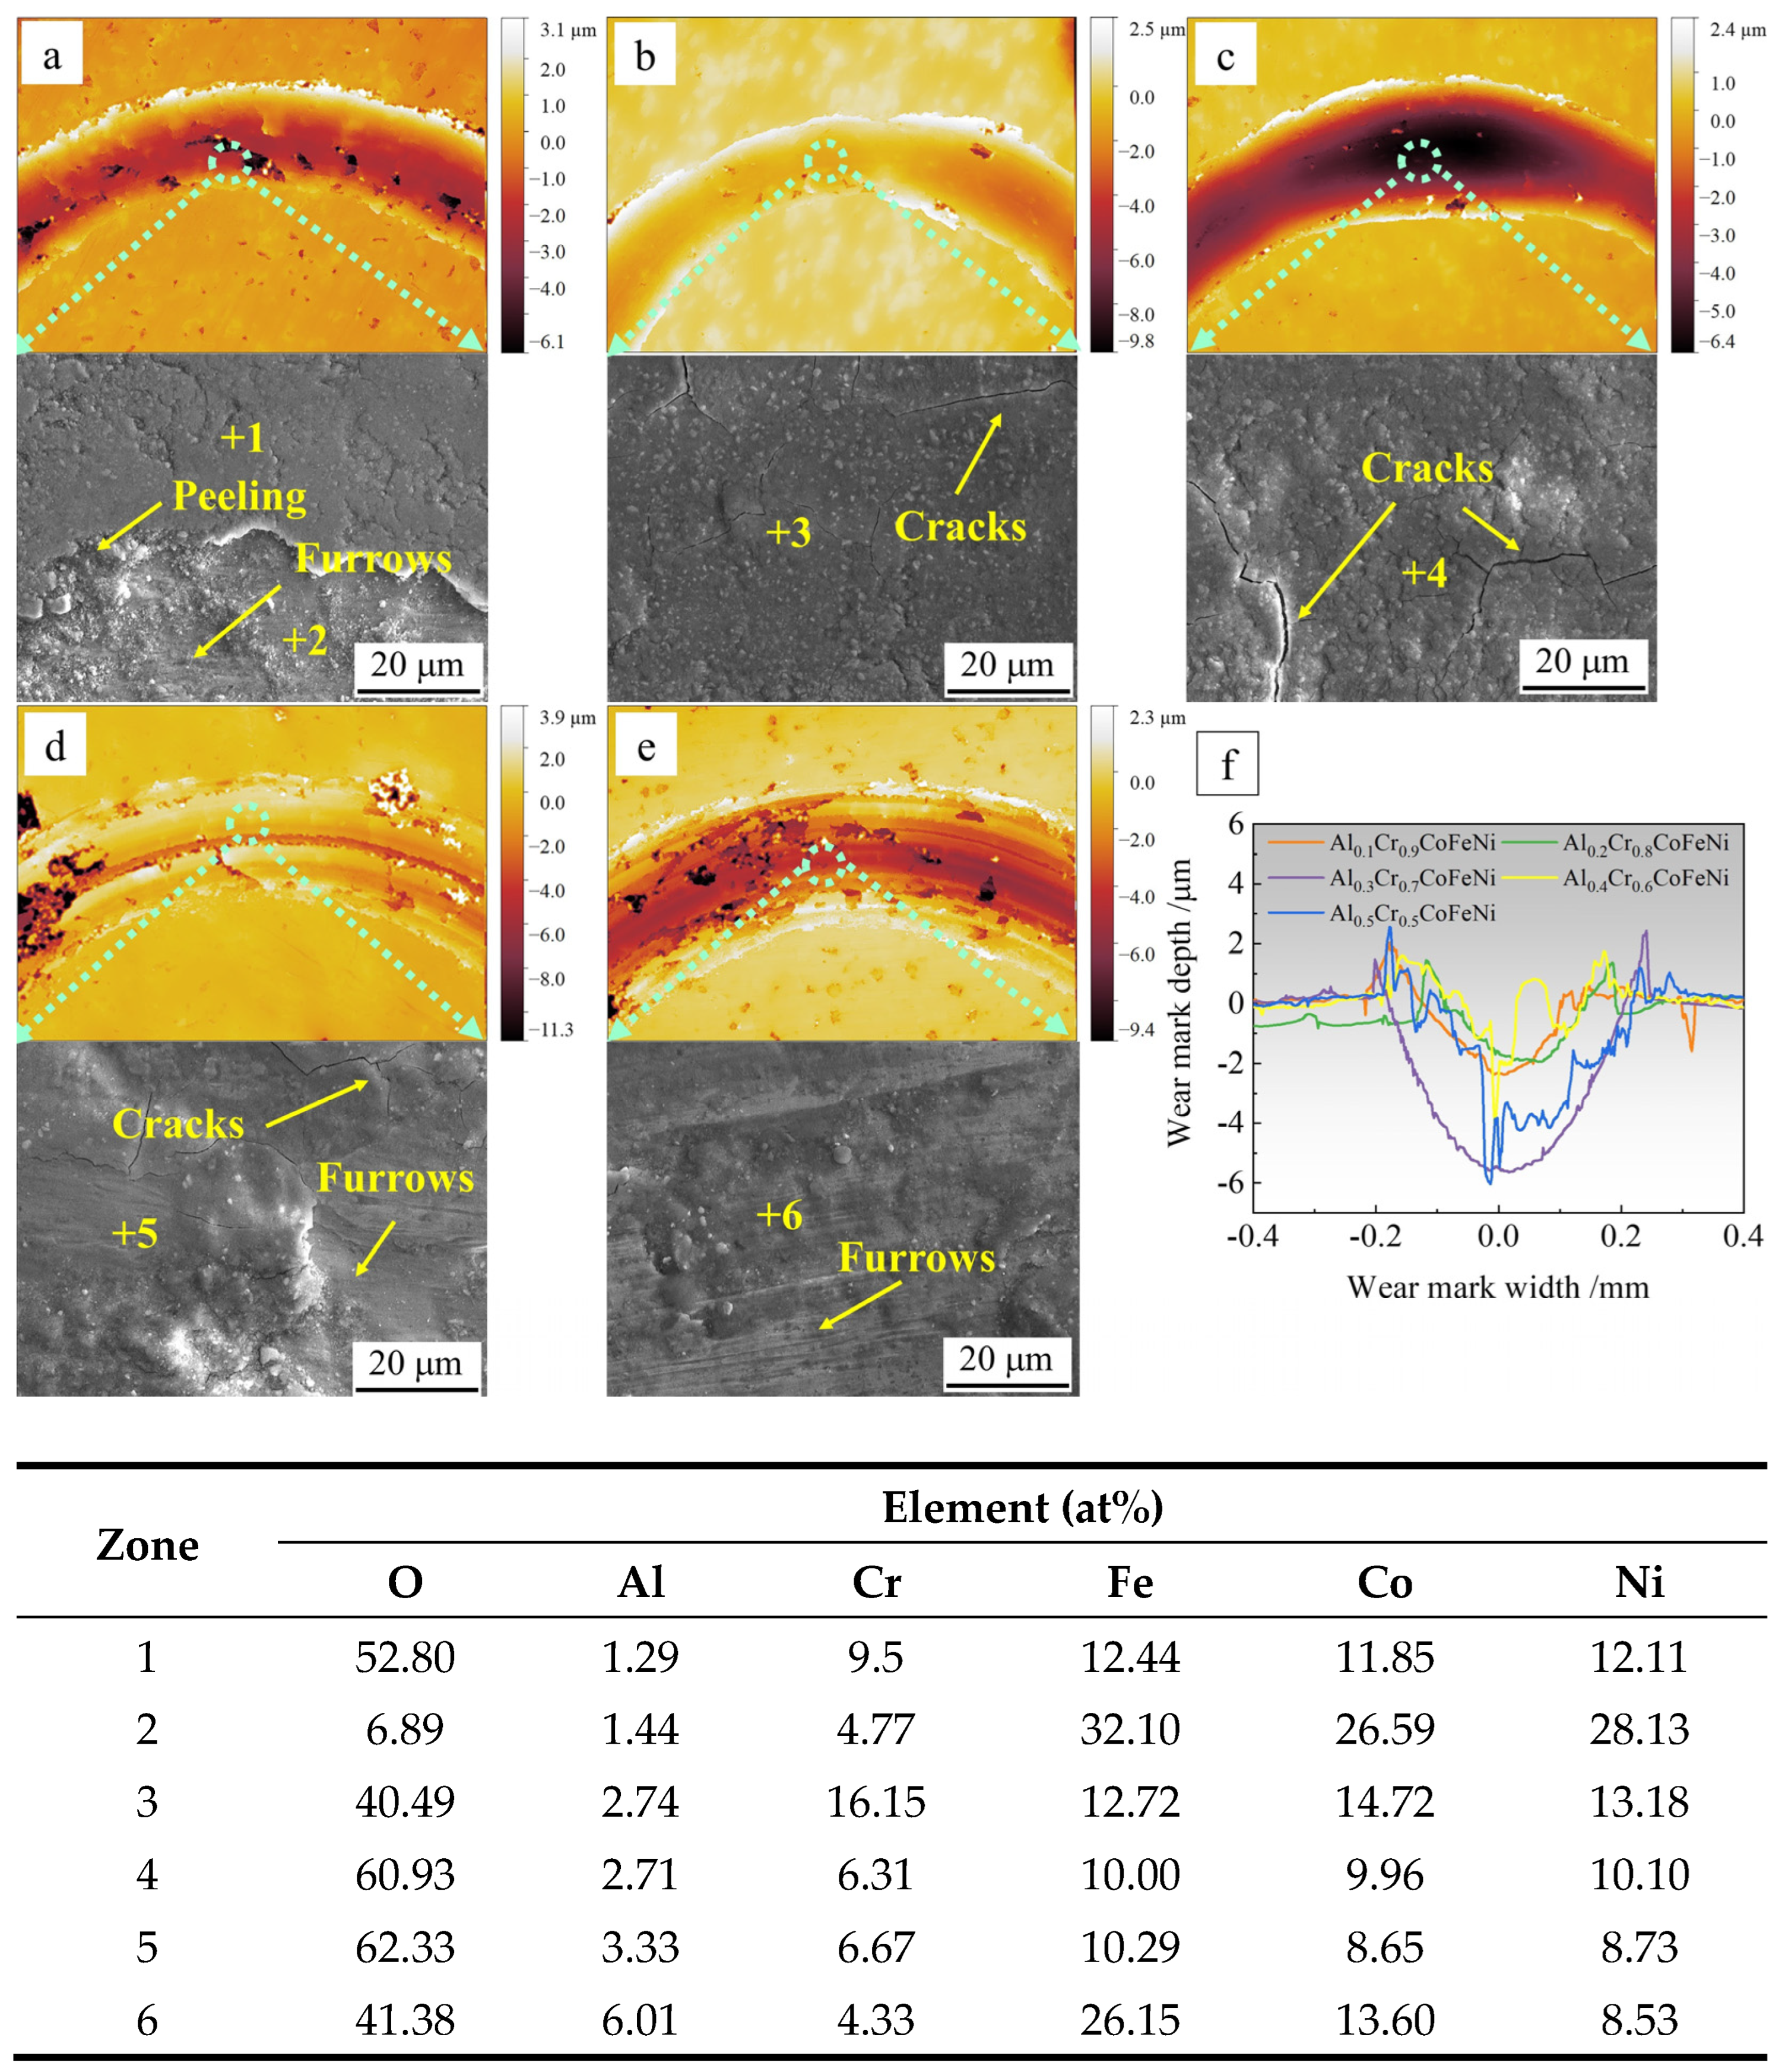
Figure 9 presents the topographic images and compositional analysis of the wear marks of the Al
xCr
1−xCoFeNi HEAs following the completion of the friction test. The values of
x correspond to the following compositions: 0.1, 0.2, 0.3, 0.4, 0.5. In
Figure 9a–e, respectively, the scale bar represents depth, with 0 mm corresponding to the position of the original plane of the alloy specimen. The area with discontinuous and darker colors in the wear marks indicates the position of the oxide film flaking off. The abrasion marks of oxide wear are relatively flat in
Figure 9a–c, while the abrasion marks in
Figure 9d,e contain grooves of varying depths.
Figure 9f depicts a longitudinal cross-section of the abrasive wear marks. The wear rate of the alloy is calculated using the following formula:
K =
V/(
F ×
L), where
V is the wear volume,
F is the normal force (set at 10 N), and
L is the total sliding length [
38]. The calculation results are presented in
Table 7. As demonstrated in
Figure 9f and
Table 7, the abrasive grains of Al
0.1Cr
0.9CoFeNi and Al
0.2Cr
0.8CoFeNi exhibit superficial wear marks and possess a comparatively diminutive wear rate of approximately 0.020 × 10
−3 mm
3/Nm. The wear marks of Al
0.3Cr
0.7CoFeNi are the widest and deepest, and the wear rate is the largest, at 0.141 × mm
3/Nm. In contrast, the depth of wear for Al
0.4Cr
0.6CoFeNi and Al
0.5Cr
0.5CoFeNi exhibits significant fluctuations, with a higher wear rate compared to Al
0.1Cr
0.9CoFeNi and Al
0.2Cr
0.8CoFeNi. The EDS analysis of the midpoint of the abrasive marks revealed a high concentration of oxygen (O) elements, indicative of an oxide film resulting from oxidative wear. This finding was corroborated by the analysis of the friction coefficient–time curves.
The SEM images of the friction positions and the EDS analysis results of the marked points demonstrate that the friction positions contain a considerable number of O elements. The research results cited in references [
36,
37,
38] demonstrate that during oxidative friction, an oxide layer composed of various metal oxides, including Al, Fe, and Cr, forms on the surface of the abrasion marks of the AlCoCrFeNi HEAs. Furthermore, the even fine abrasion marks on the oxide film can be clearly observed in
Figure 9d,e, which are the typical characteristics of oxidative wear and coincide with the results of the analysis of the friction coefficient–time curves. In
Figure 9a, position 1 is the oxide film, and position 2 is the surface of the alloy matrix, and fine abrasion marks can be observed. The oxide film generated during the friction process is harder and more brittle than the alloy, and it is susceptible to rupture and the formation of cracks, or even spallation, when the temperature is repeatedly raised and lowered during the friction process [
39]. The test results indicate that the Al
0.1Cr
0.9CoFeNi alloy exhibits the lowest friction coefficient and wear rate, demonstrating superior wear resistance. As indicated by the research findings of Vo and Deng [
36,
38], during the initial stage of alloy oxidation at the friction trace, the elements Al and Cr oxidize, resulting in the formation of an Al
2O
3 or Cr
2O
3 oxide layer. At this stage, the uniformity and continuity of the oxide layer phase have the greatest impact on the friction process. During the initial stage of oxidation friction, an oxide layer with Cr
2O
3 as the main component will first form on the surface of the Al
0.1Cr
0.9CoFeNi alloy. This connected and dense oxide layer protects the alloy substrate during friction. Subsequent friction processes involve the oxidation of additional metal elements, leading to the formation of an oxide layer comprising a mixture of metal oxides. The oxide layer’s composition undergoes changes during the process, with the Al element increasing the prevalence of Al
2O
3 and Cr
2O
3 in the initial layer. During friction, the different phases experience varying levels of strain, resulting in the fragmentation of the oxide layer. These fragments act as abrasive particles, leading to enhanced wear on the substrate.
3.4. Electrochemical Performance
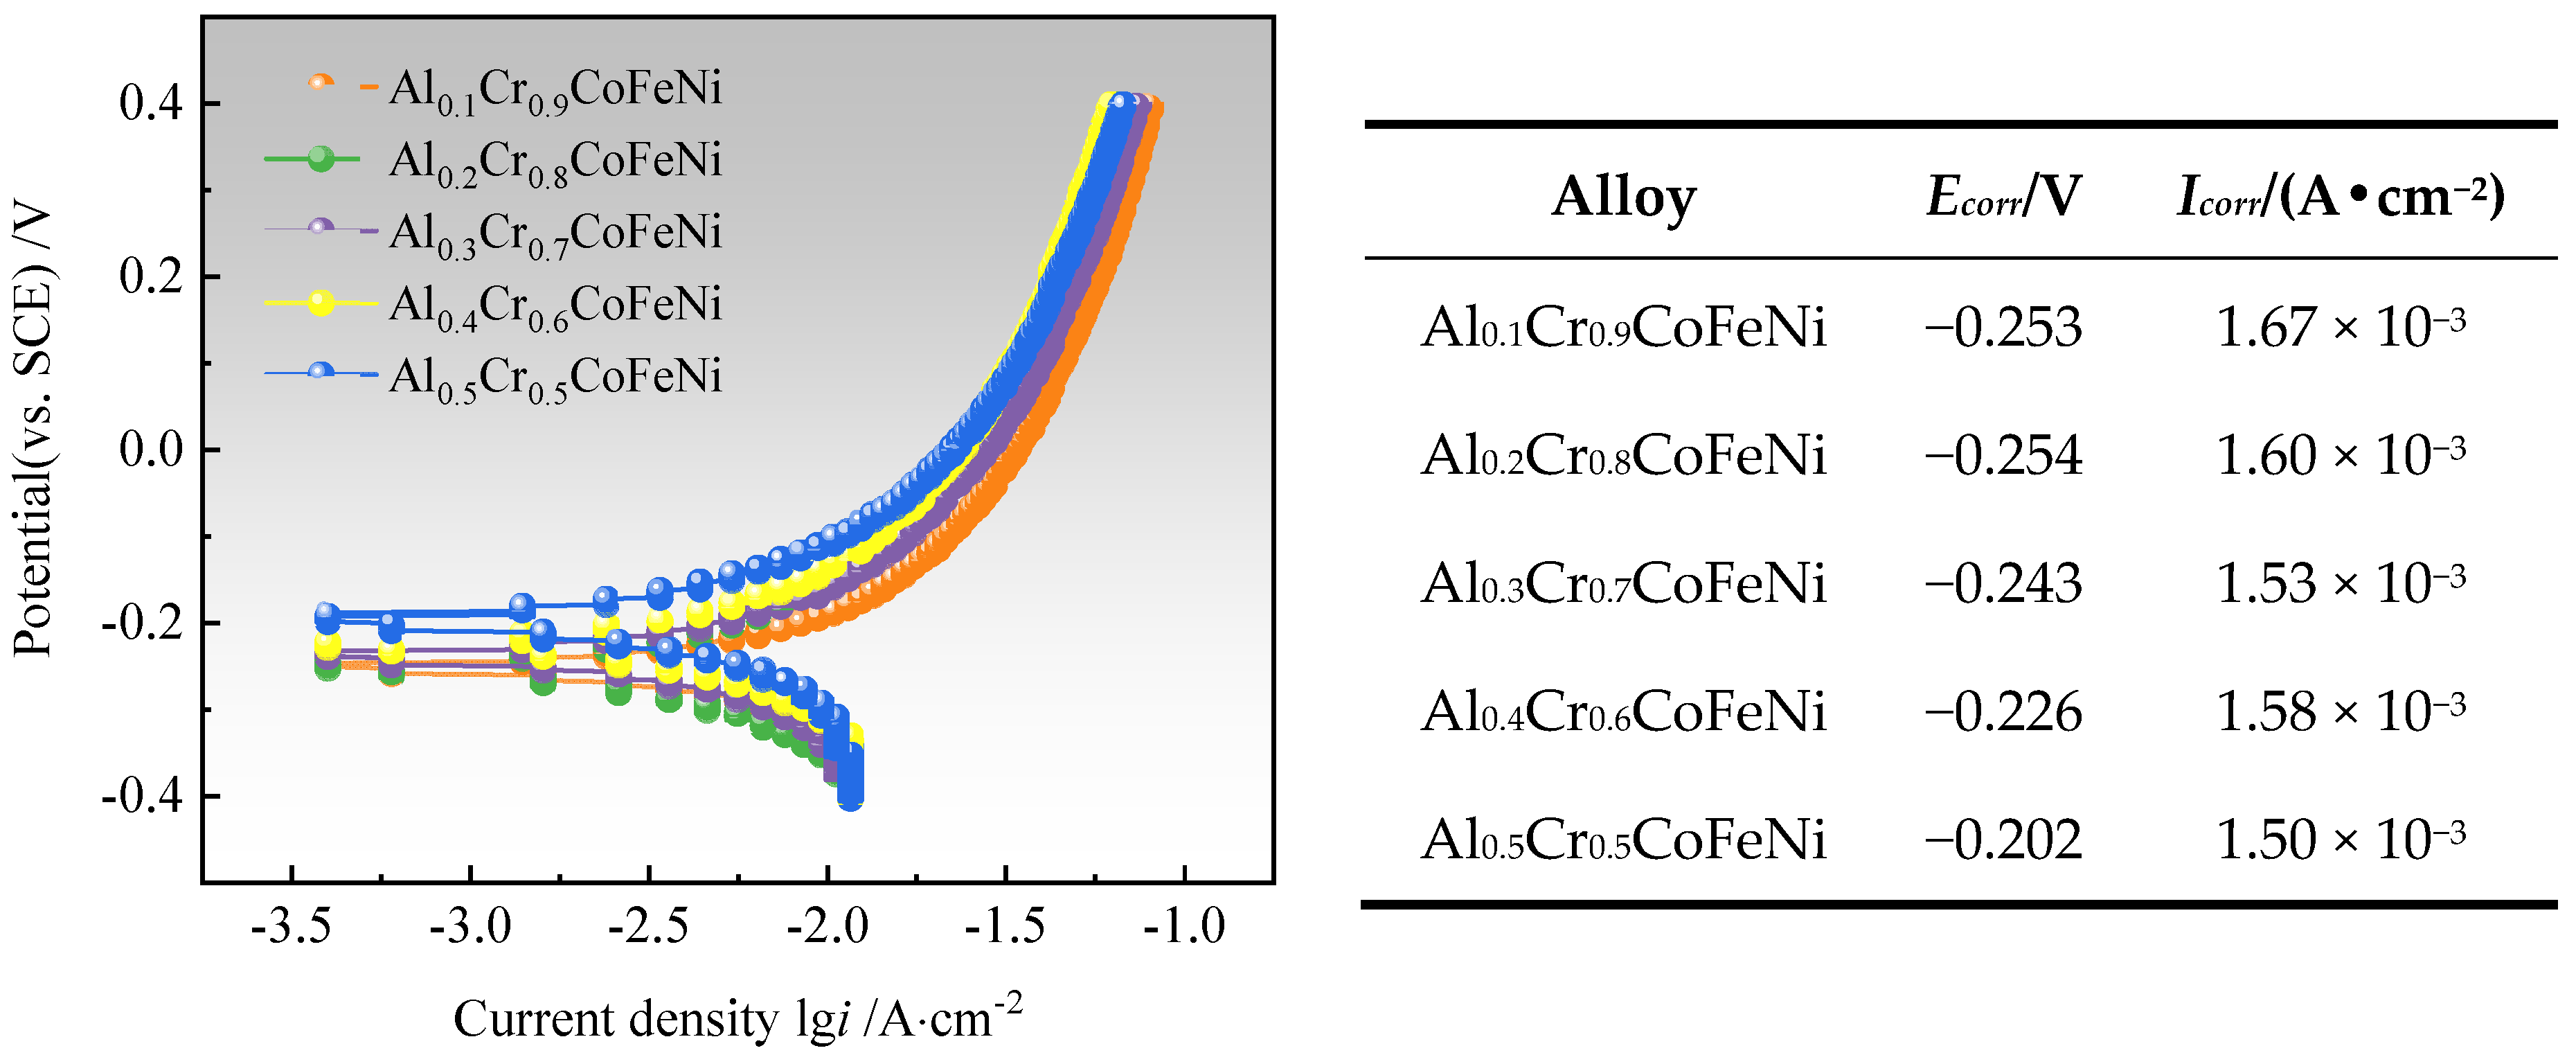
Figure 10 illustrates the Tafel test curves of Al
xCr
1−xCoFeNi HEAs in a 3.5 wt.% NaCl solution, along with the self-corrosion potential (
Ecorr) and the self-corrosion current density (
Icorr) of the alloy, which were calculated by the extrapolation method [
40]. It was observed that the value of
Ecorr was maximum at −0.202 V when
x = 0.5, and Al
0.5Cr
0.5CoFeNi exhibited the least tendency to corrode in neutral solution [
41]. Its corrosion resistance was slightly superior to that of Al
0.5CuFeNiCoCr alloy prepared by powder metallurgy by Jiang et al. [
42].
Al
xCr
1−xCoFeNi HEAs invariably contain both a Cr-rich phase and a Cr-poor phase. In a 3.5 wt% NaCl solution, the Cr-rich phase functions as the cathode, while the Cr-poor phase functions as the anode. Due to the uneven distribution of the Cr element, a substantial potential difference exists between the two phases, thereby forming a micro-electrical couple. The dissolution of the anode phase is preferential, leading to a substantial surge in the self-corrosion current density. Consequently, the electrochemical corrosion process manifests as selective corrosion. The single-phase high-entropy alloy exhibits a uniform composition and structure, is devoid of local potential differences, exhibits a weak galvanic effect, and has a relatively low self-corrosion current. The electrochemical corrosion process is predominantly pitting corrosion [
43]. Based on Faraday’s law, it was known that the density of corrosion current and the corrosion rate is proportional to the relationship. The corrosion rate of Al
0.5Cr
0.5CoFeNi was minimum, and its corrosion resistance was better than other alloys in this work.
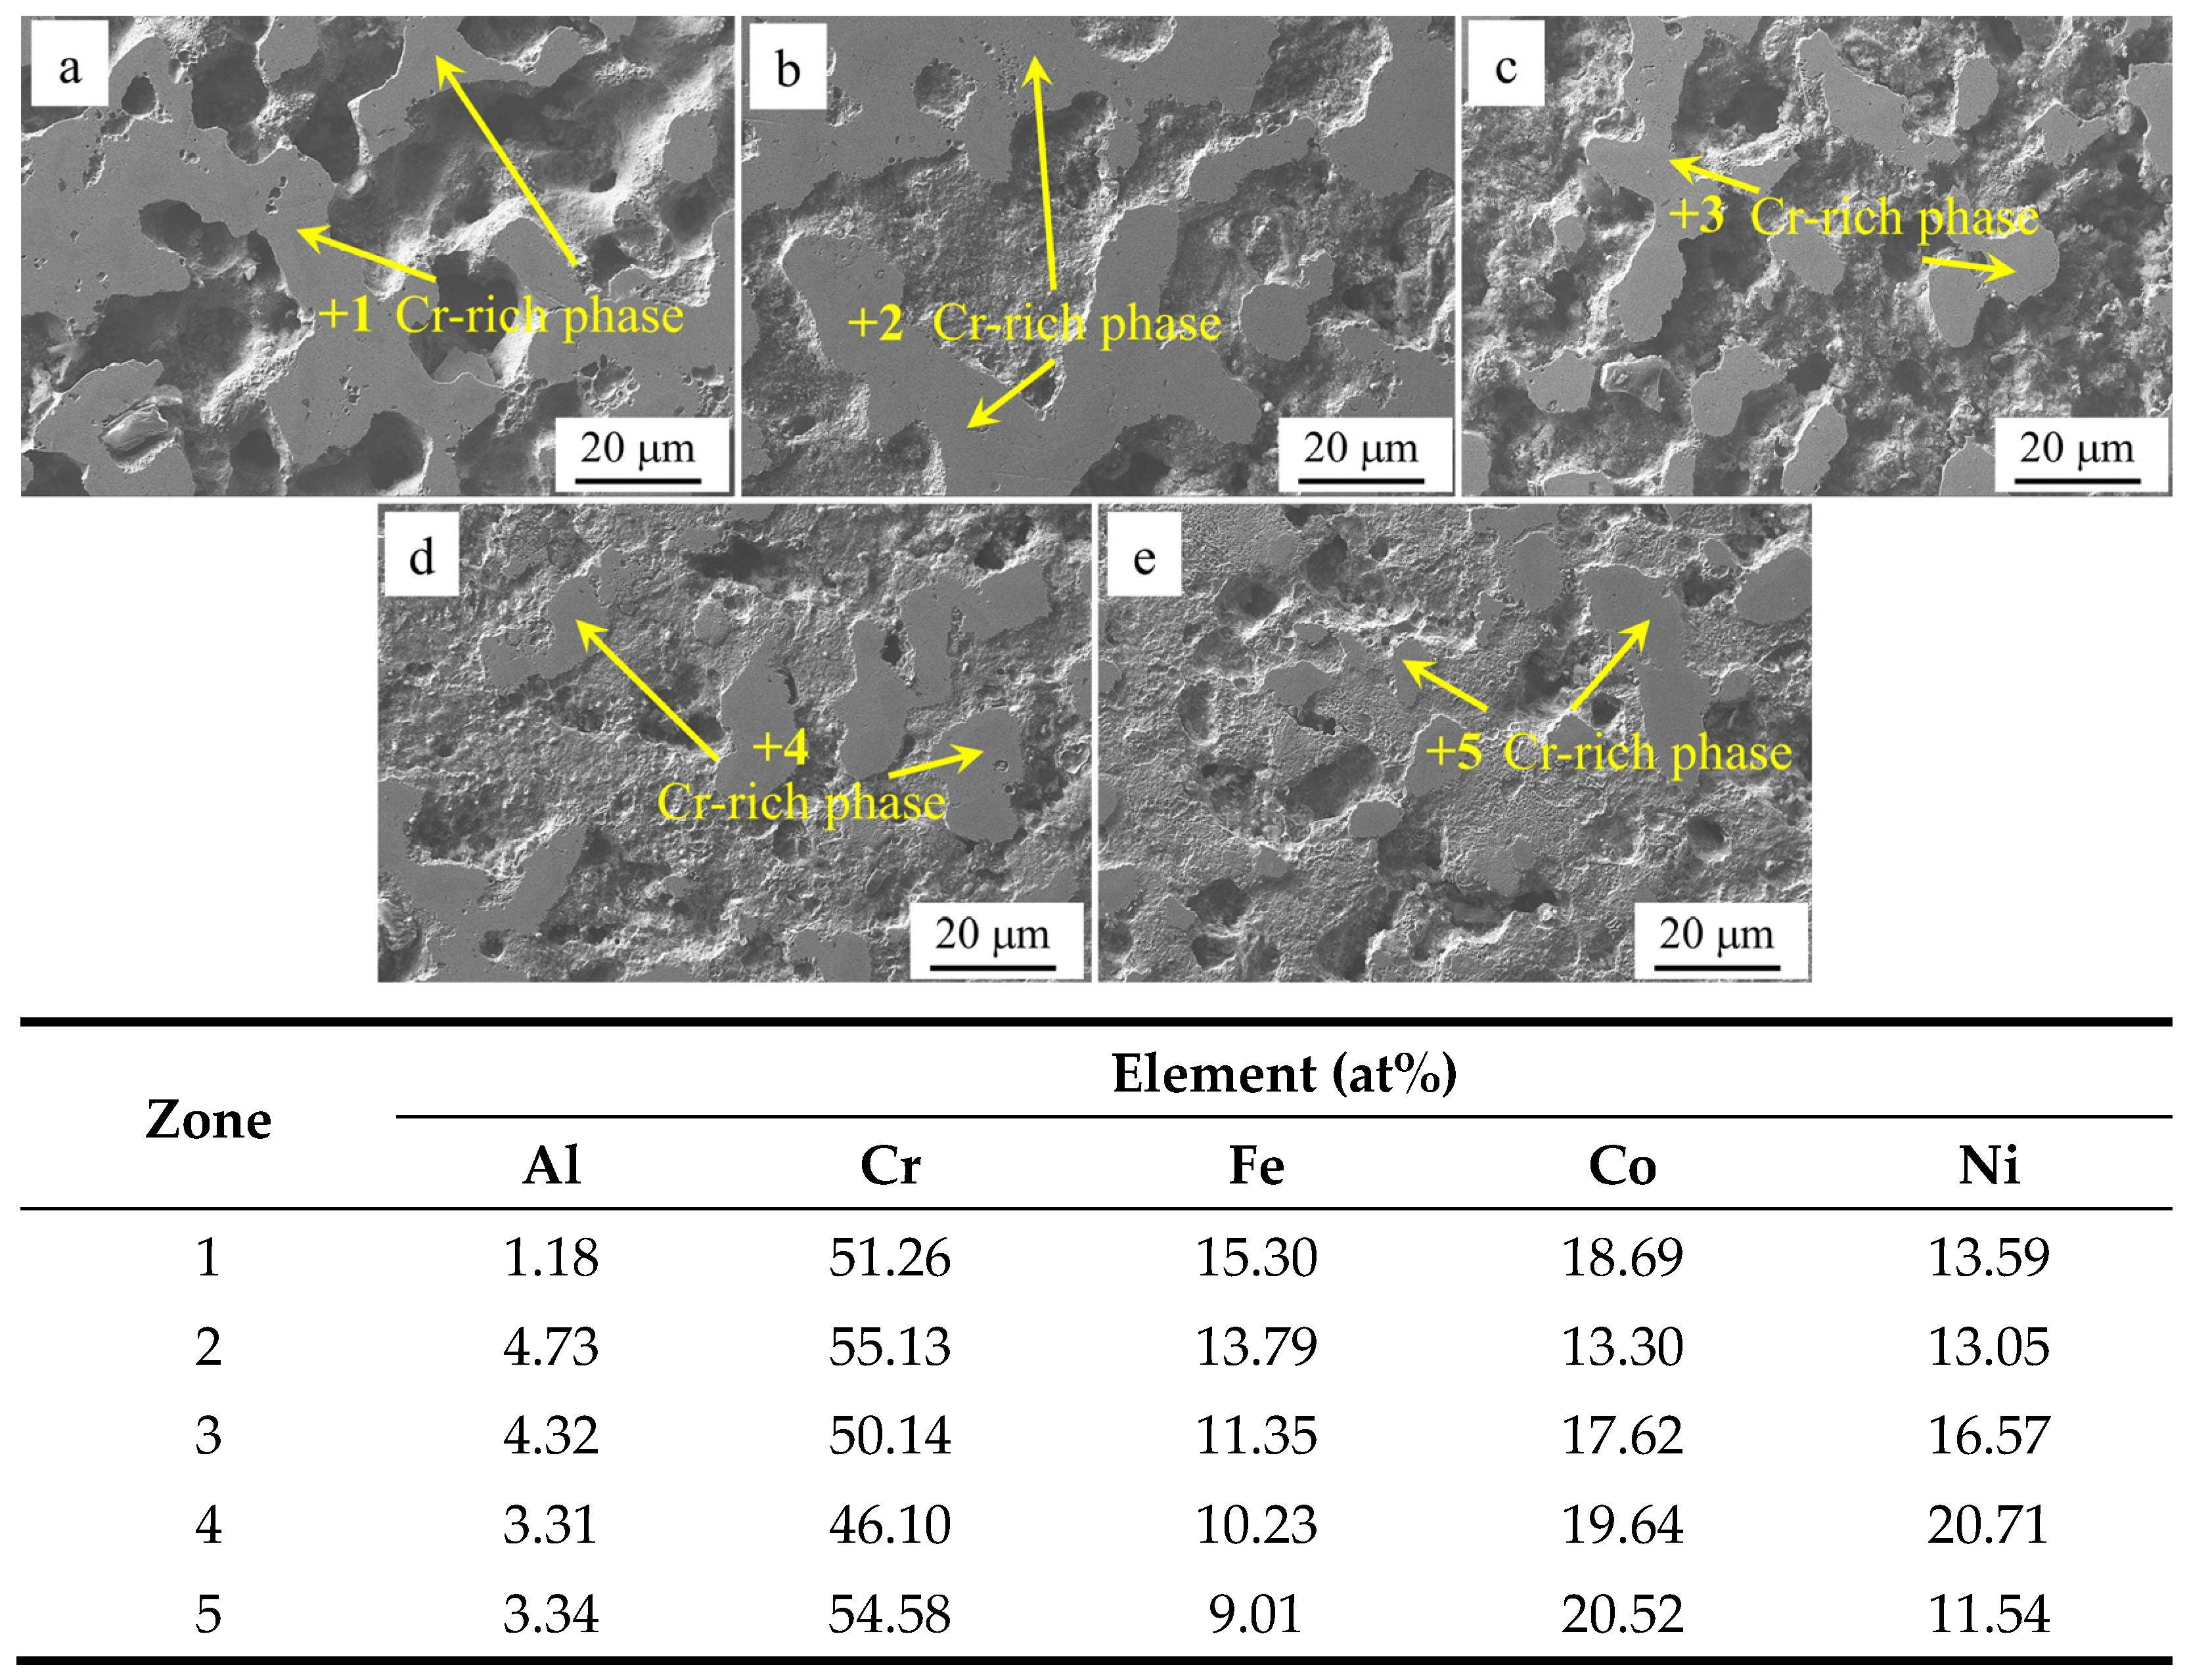
Figure 11 presents the SEM images of the surface of Al
xCr
1−xCoFeNi HEAs and the results of the EDS analysis of the marked areas following the Tafel test. The comprehensive analysis indicates that the potential of the Cr element in neutral solution NaCl is higher than that of the Al and Fe elements. The Cr-rich FCC phase is the cathode, and the cathodic reaction is 1/2O
2 + H
2O + 2e
−→2OH
−. The bias of the Cr element is the reason for the selective corrosion of the alloy. As the value of
x increases from 0.1 to 0.5, the number of Cr-rich FCC phases of the Al
xCr
1−xCoFeNi HEAs decreases, and the cathode area decreases in parallel. Consequently, as the x-value of the Al elemental content increases, the self-corrosion current density decreases, the self-corrosion potential of the alloy gradually increases, the corrosion resistance is improved, and the Al
0.5Cr
0.5CoFeNi alloy exhibits the most favorable corrosion resistance.


 ,
, 
