
Dual Roles of PTSA in Electrical Conductivity of PEDOT:PTSA with Large Seebeck Coefficient


Abstract

1. Introduction
2. Materials and Methods
3. Results
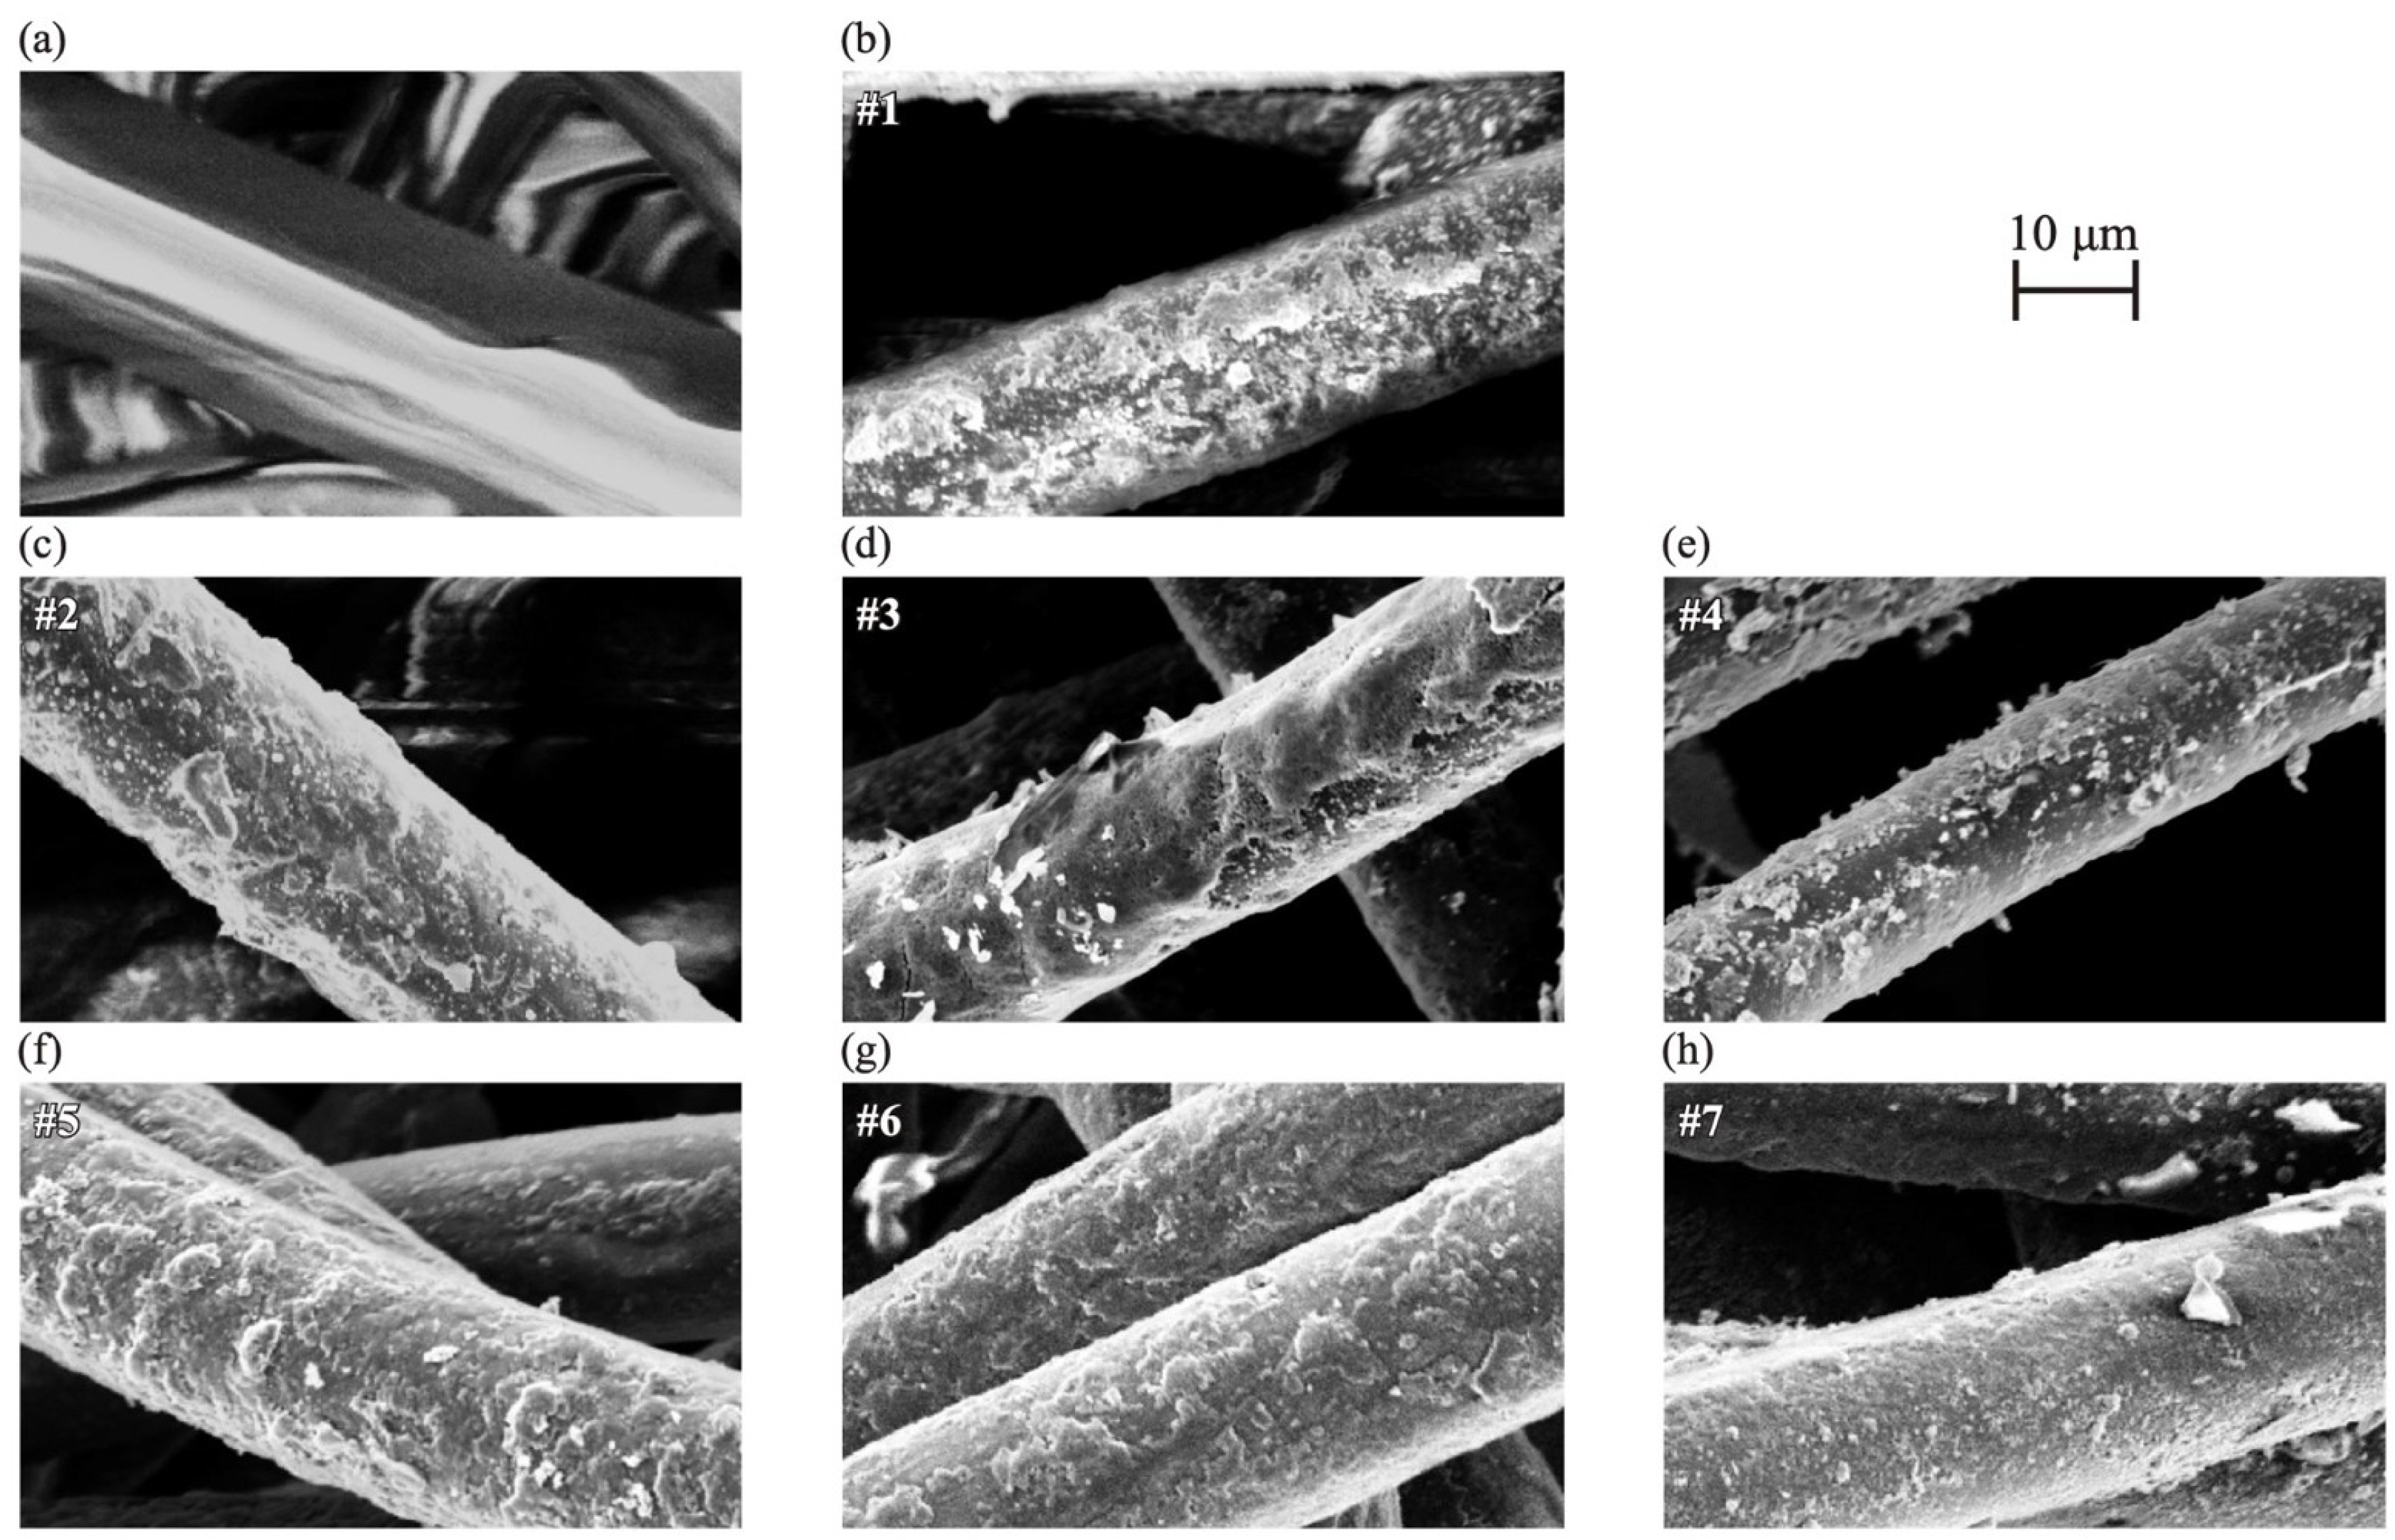
3.1. SEM
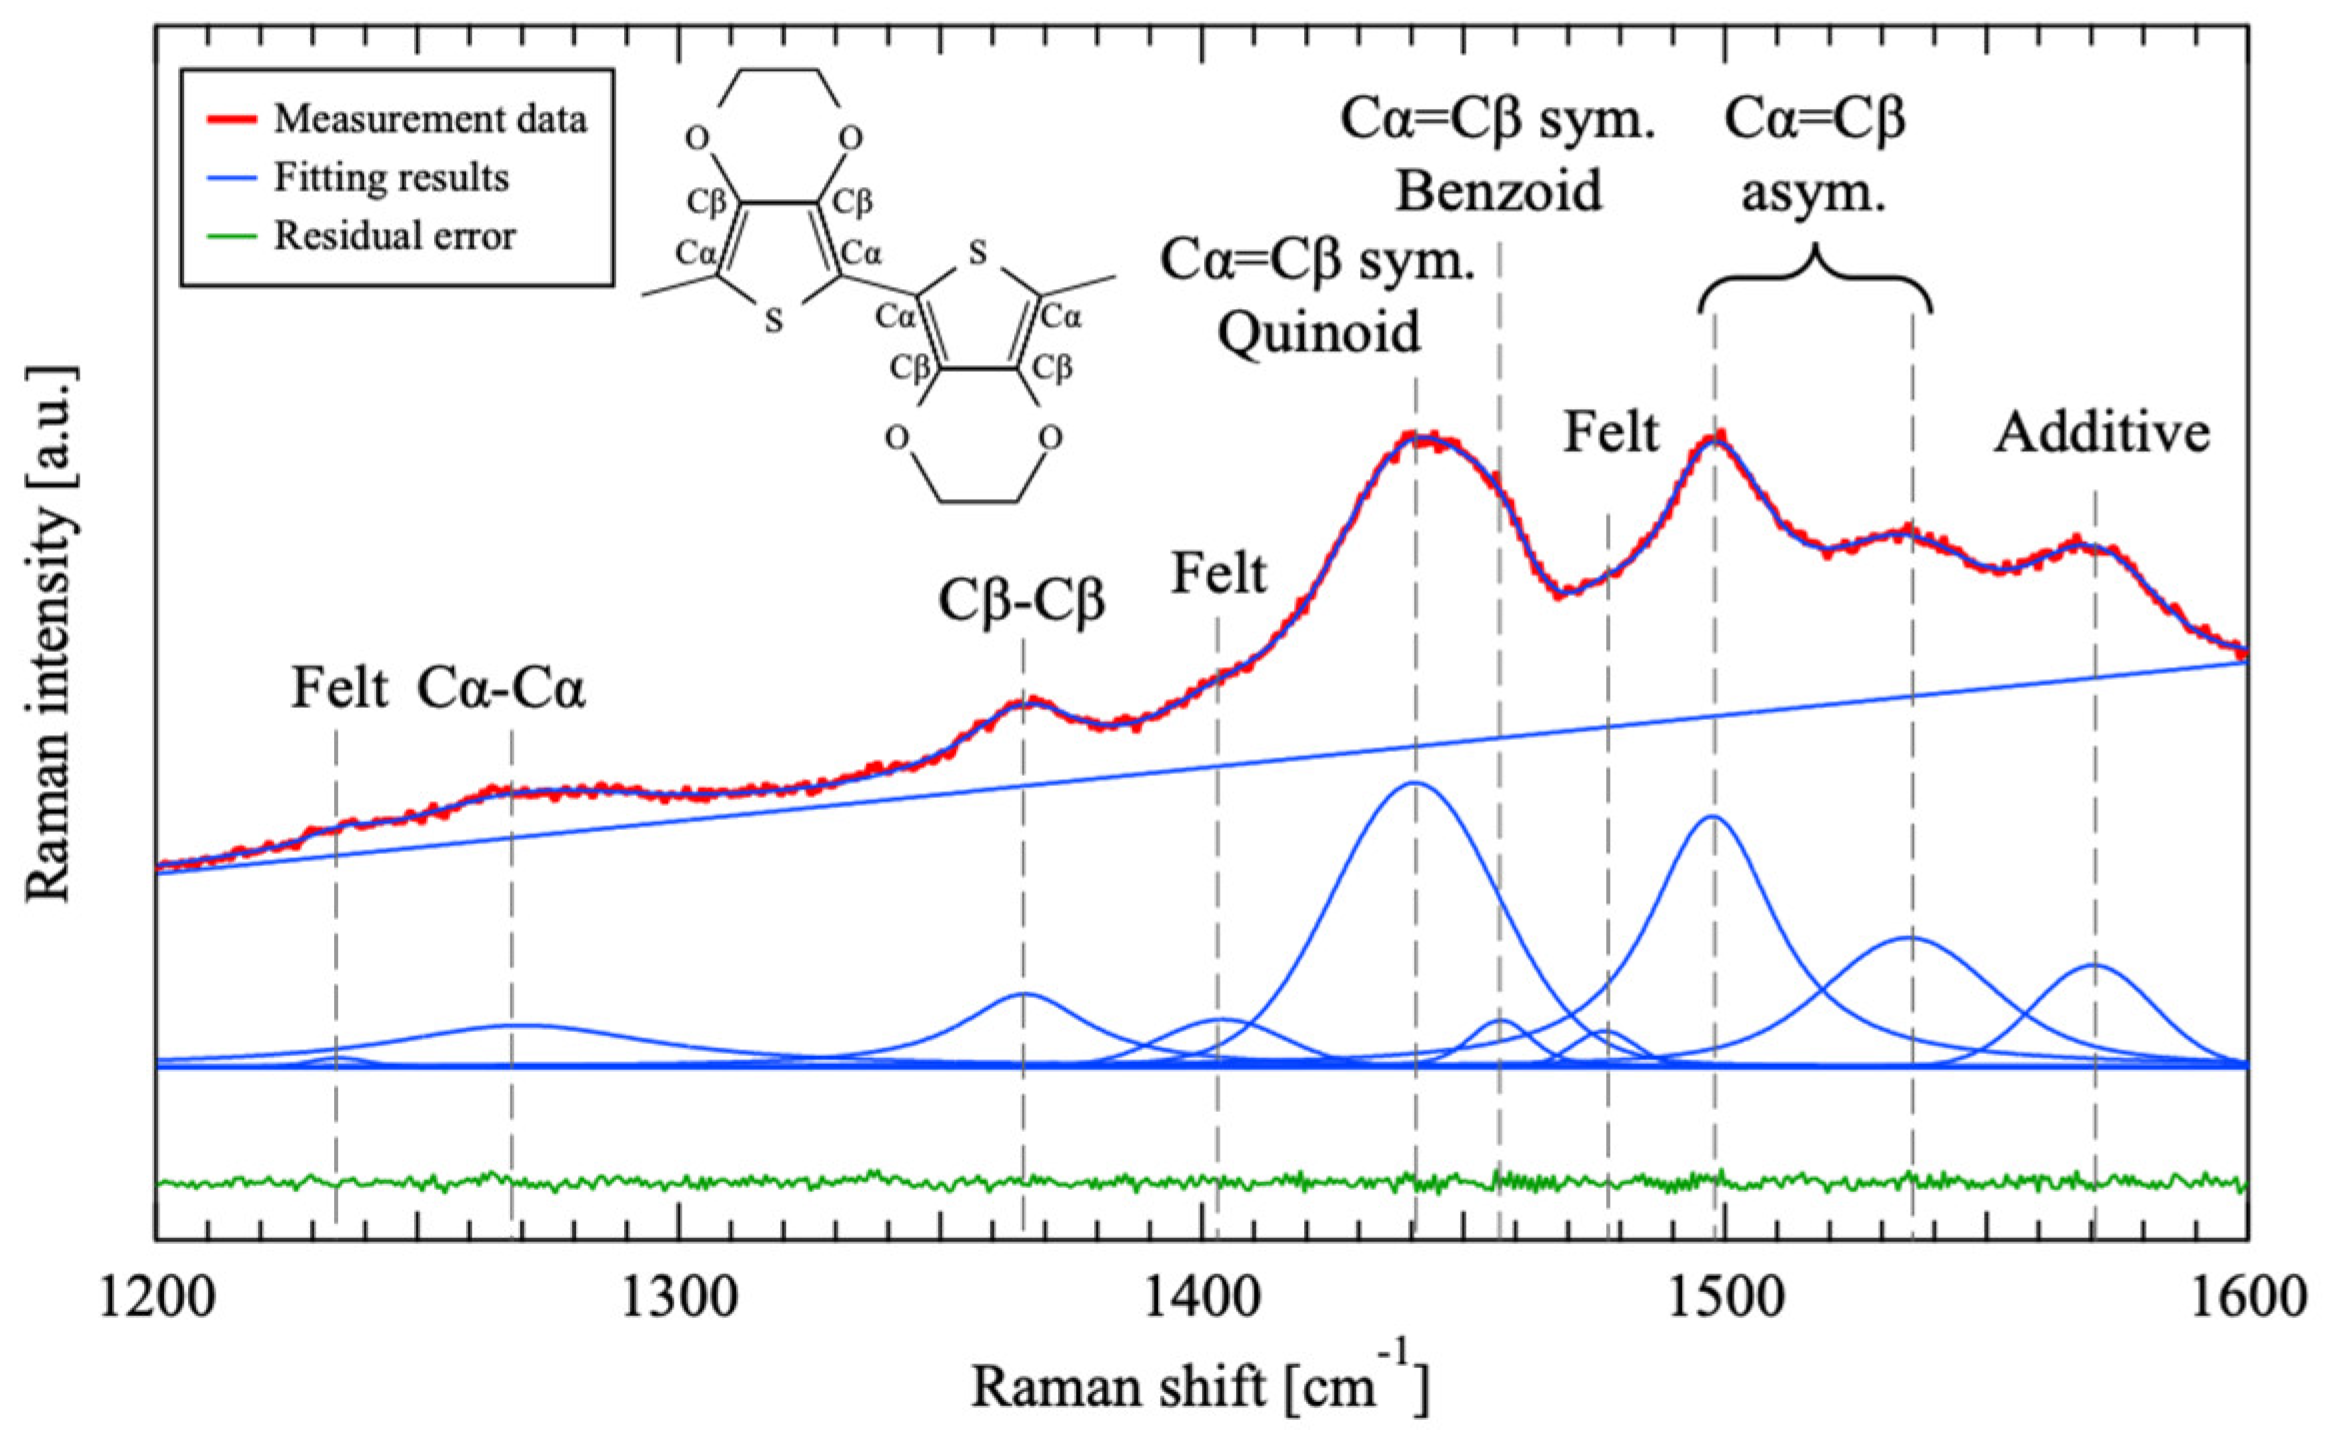
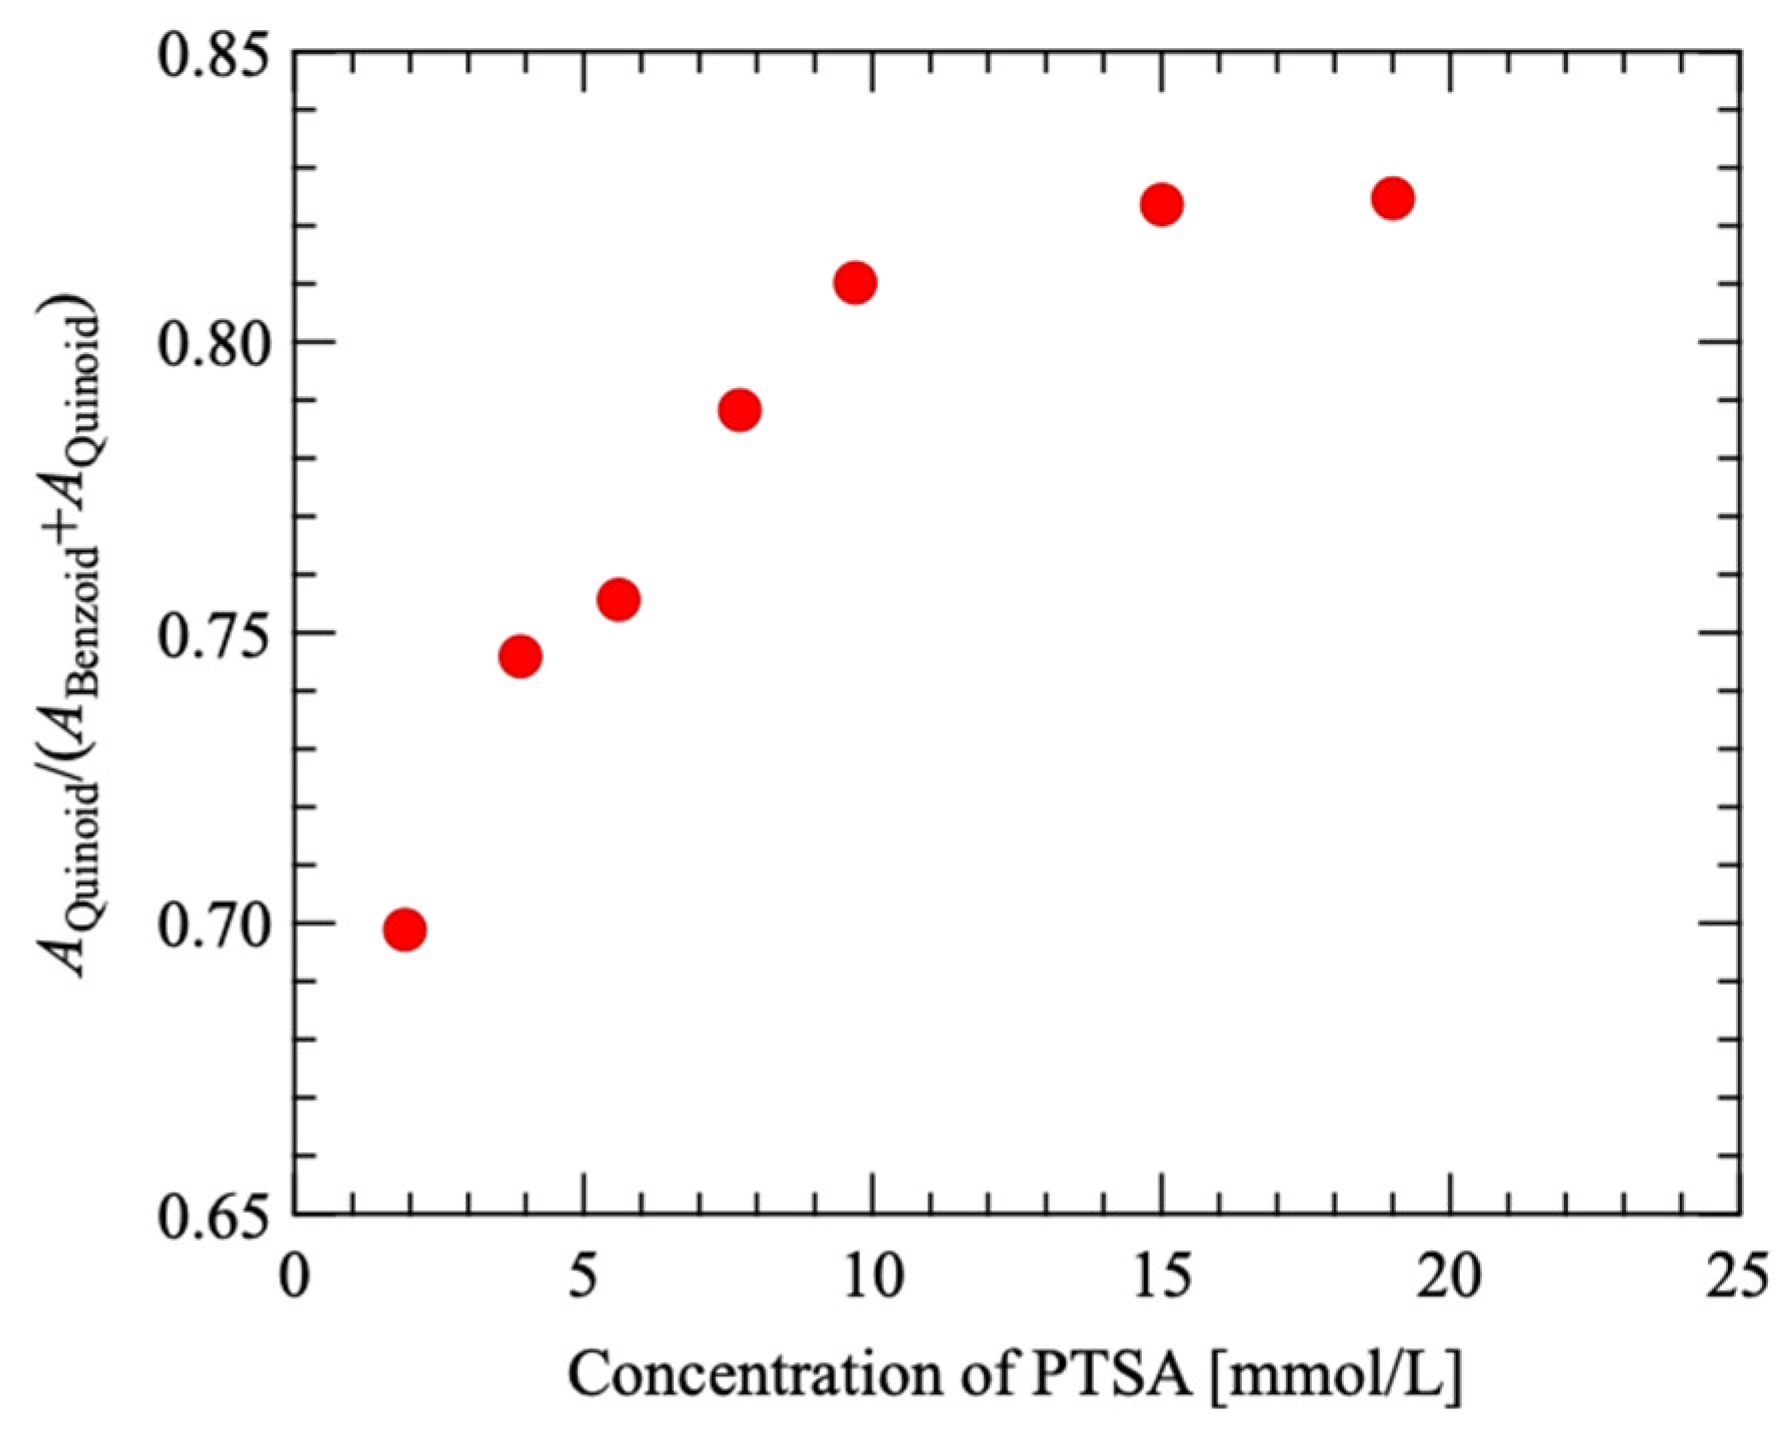
3.2. Raman Scattering Spectroscopy
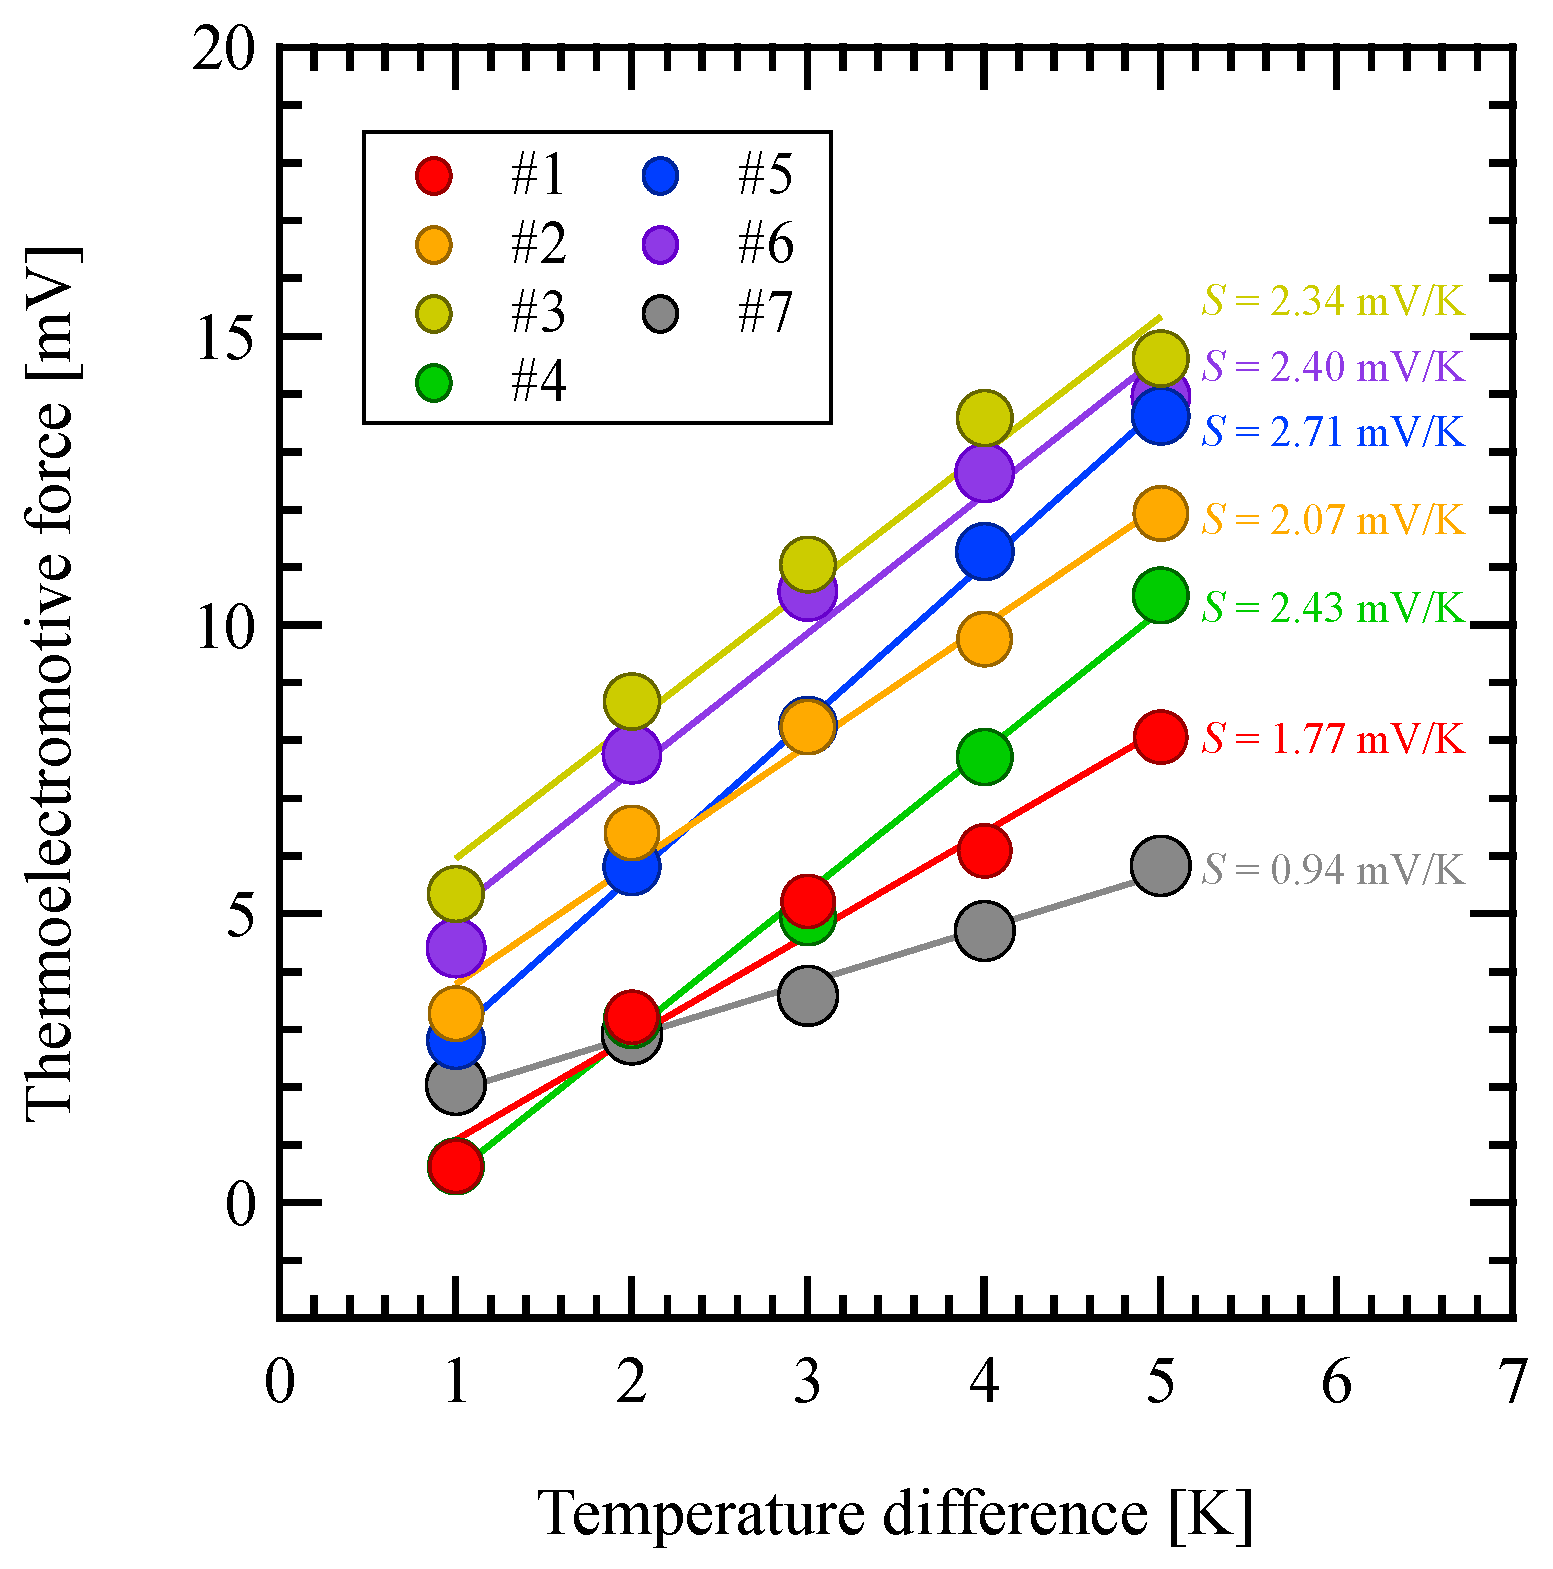
3.3. Thermoelectromotive Force
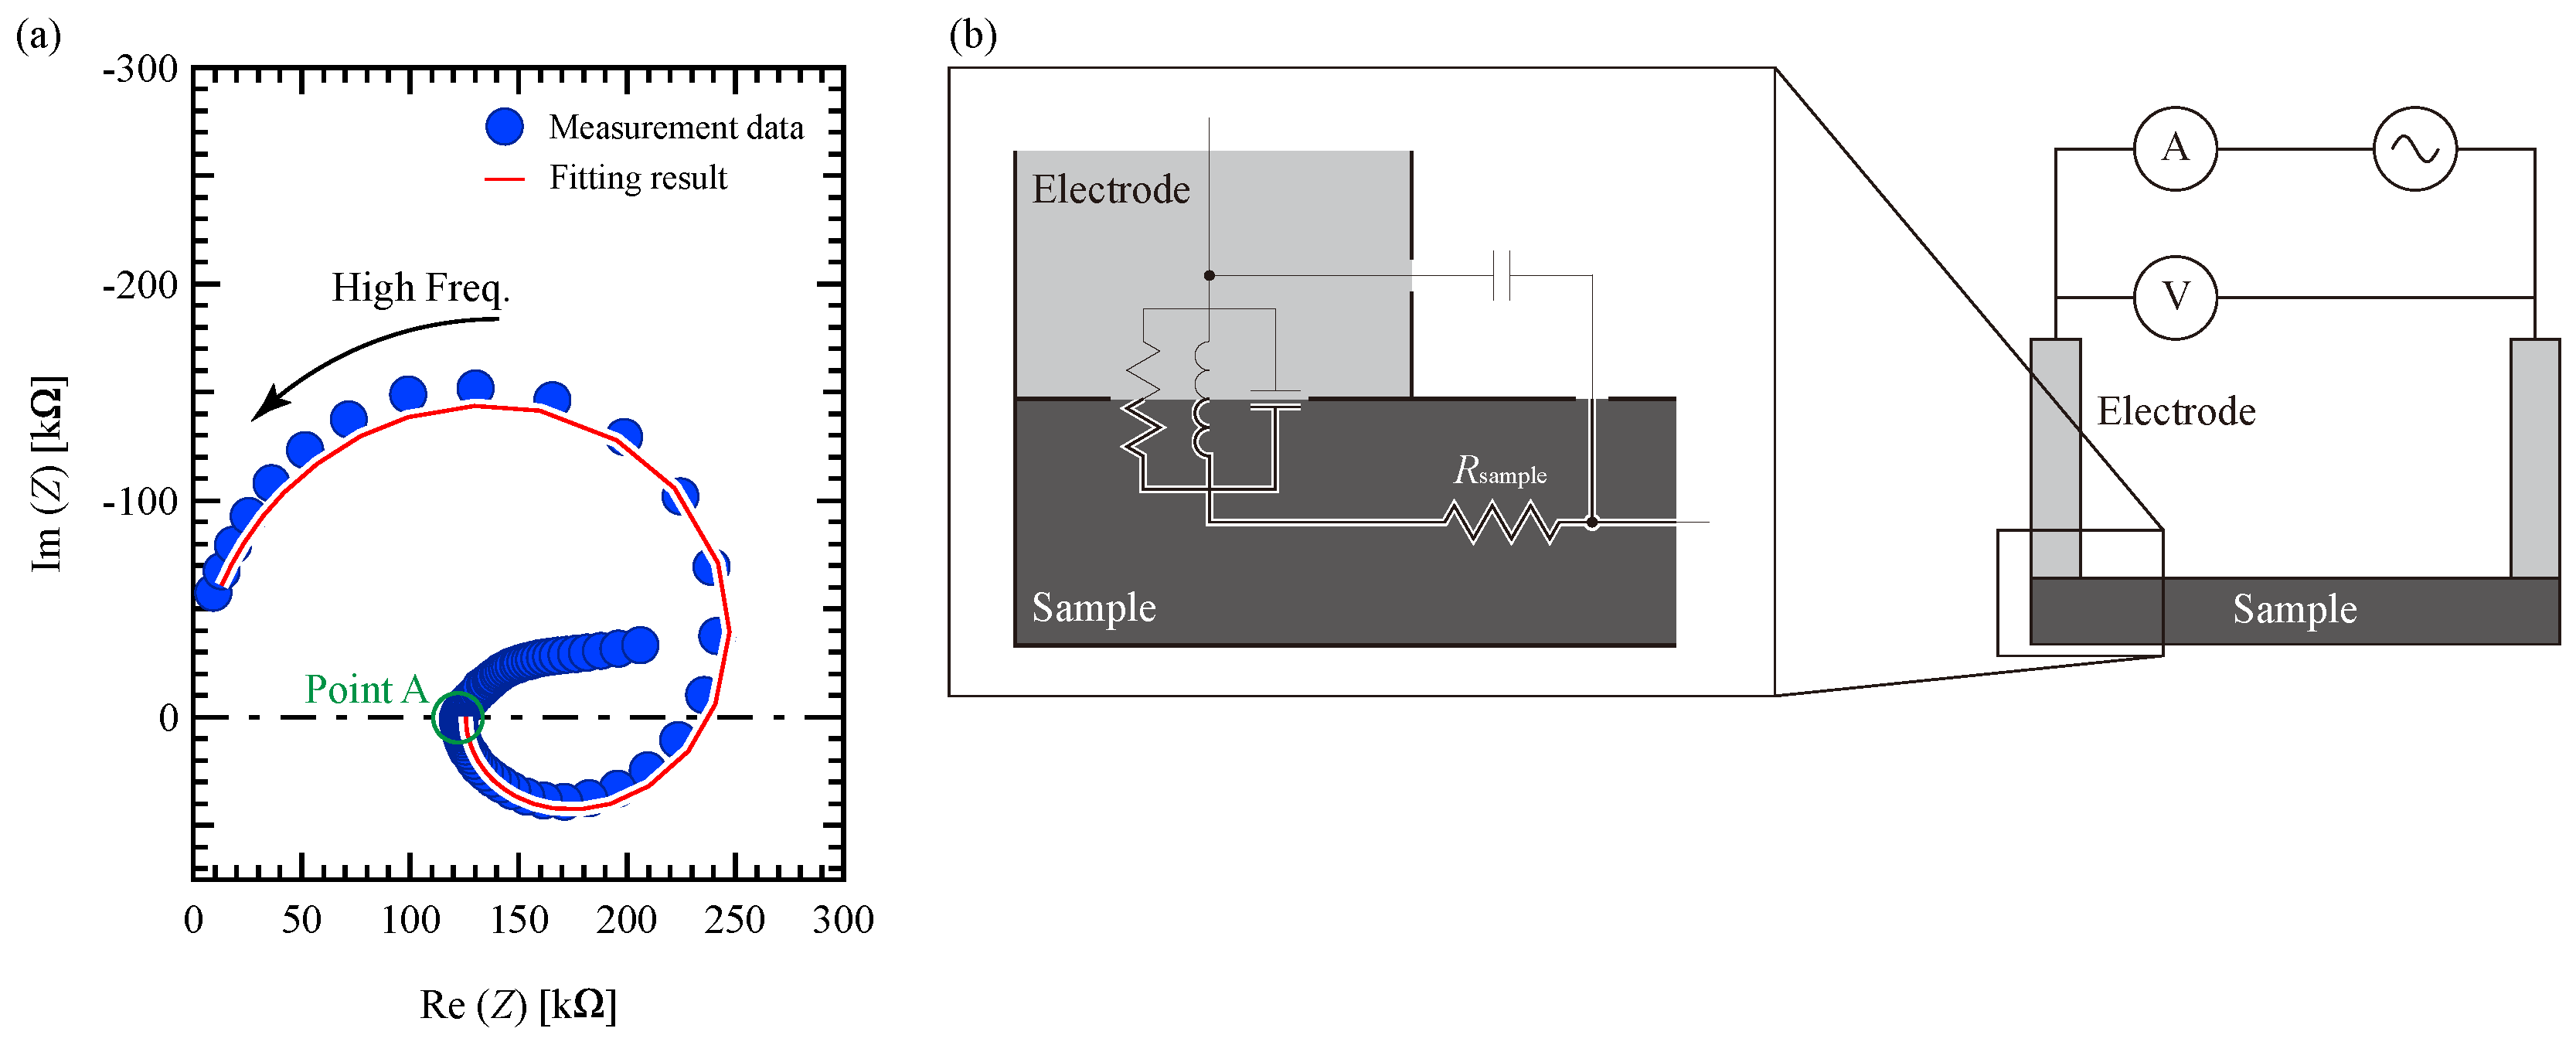
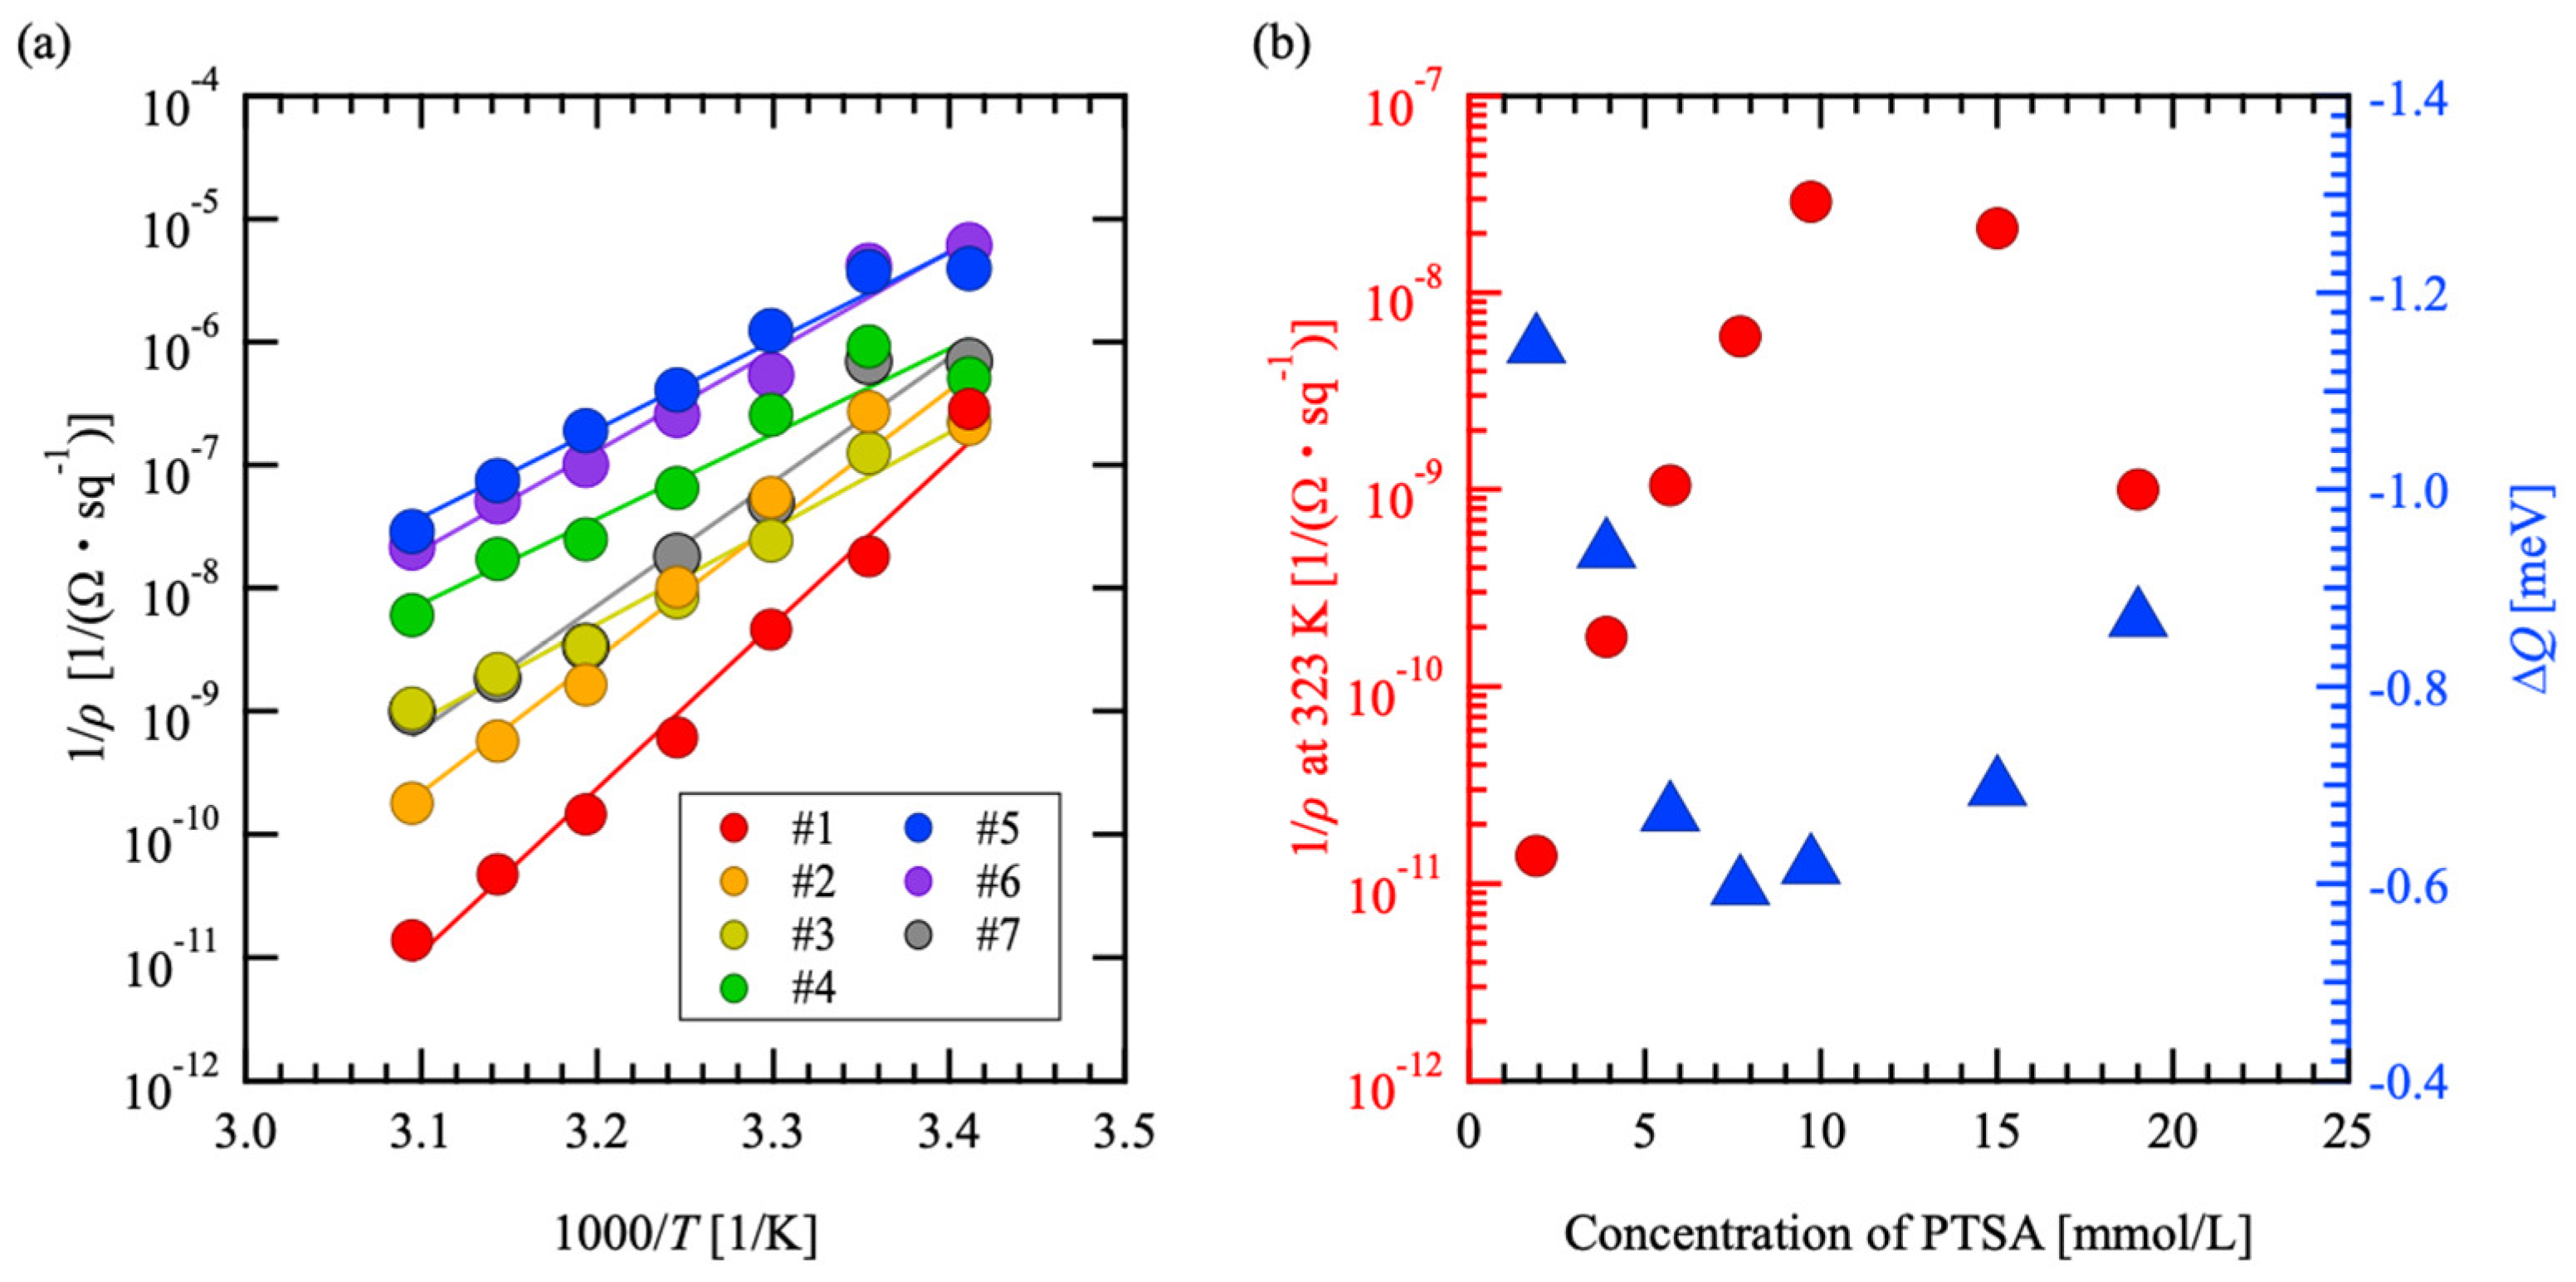
3.4. Sheet Resistivity
4. Conclusions
Author Contributions
Funding
Data Availability Statement
Conflicts of Interest
References
- Sanislav, T.; Mois, G.D.; Zeadally, S.; Folea, S.C. Energy Harvesting Techniques for Internet of Things (IoT). IEEE Access 2021, 9, 39530–39549. [Google Scholar] [CrossRef]
- Yang, C.-C.; Pandey, R.; Tu, T.-Y.; Cheng, Y.-P.; Chao, P.C.-P. An efficient energy harvesting circuit for batteryless IoT devices. Microsyst. Technol. 2019, 26, 195–207. [Google Scholar] [CrossRef]
- Hentati, A.; Jaafar, W.; Frigon, J.F.; Ajib, W. Analysis of the interdelivery time in IoT energy harvesting wireless sensor networks. IEEE Internet Things J. 2020, 8, 4920–4930. [Google Scholar] [CrossRef]
- Park, H.; Lee, D.; Park, G.; Park, S.; Khan, S.; Kim, J.; Kim, W. Energy Harvesting Using Thermoelectricity for IoT (Internet of Things) and E-Skin Sensors. J. Phys. Energy 2019, 1, 042001. [Google Scholar] [CrossRef]
- Im, J.-P.; Kim, J.H.; Lee, J.W.; Woo, J.Y.; Im, S.Y.; Kim, Y.; Eom, Y.-S.; Choi, W.C.; Kim, J.S.; Moon, S.E. Self-powered autonomous wireless sensor node by using silicon-based 3D thermoelectric energy generator for environmental monitoring application. Energies 2020, 13, 674. [Google Scholar] [CrossRef]
- Rowe, D.M. CRC Handbook of Thermoelectrics; CRC Press: Boca Raton, FL, USA, 1995. [Google Scholar]
- Omer, S.A.; Infield, D.G. Design optimization of thermoelectric devices for solar power generation. Sol. Energ. Mat. Sol. C. 1998, 53, 67–82. [Google Scholar] [CrossRef]
- Fujima, T.; Shimizu, N.; Arimatsu, H. p-n control of AlMgB14-based thermoelectric materials by metal site occupancy. Materials 2019, 12, 632. [Google Scholar] [CrossRef]
- Maruyama, S.; Miyazaki, Y.; Hayashi, K.; Kajitani, T.; Mori, T. Excellent p-n control in a high temperature thermoelectric boride. Appl. Phys. Lett. 2012, 101, 152101. [Google Scholar] [CrossRef]
- Yan, H.; Sada, N.; Toshima, N. Thermal transporting properties of electrically conductive polyaniline films as organic thermoelectric materials. J. Therm. Anal. Calorim. 2002, 69, 881–887. [Google Scholar] [CrossRef]
- Feng-Xing, J.; Jing-Kun, X.; Bao-Yang, L.; Yu, X.; Rong-Jin, H.; Lai-Feng, L. Thermoelectric performance of Poly(3,4-ethylenedioxythiophene): Poly(styrenesulfonate). Chin. Phys. Lett. 2008, 25, 2202. [Google Scholar] [CrossRef]
- Moses, D.; Denenstein, A. Experimental determination of the thermal conductivity of a conducting polymer: Pure and heavily doped polyacetylene. Phys. Rev. B 1984, 30, 2090. [Google Scholar] [CrossRef]
- Xu, S.; Hong, M.; Shi, X.-L.; Wang, Y.; Ge, L.; Bai, Y.; Wang, L.; Dargusch, M.; Zou, J.; Chen, Z.-G. High-Performance PEDOT:PSS Flexible Thermoelectric Materials and Their Devices by Triple Post-Treatments. Chem. Mater. 2019, 31, 5238–5244. [Google Scholar] [CrossRef]
- Andersson, H.; Šuly, P.; Thungström, G.; Engholm, M.; Zhang, R.; Mašlík, J.; Olin, H. PEDOT: PSS Thermoelectric Generators Printed on Paper Substrates. J. Low Power Electron. Appl. 2019, 9, 14. [Google Scholar] [CrossRef]
- Kim, G.-H.; Shao, L.; Zhang, K.; Pipe, K.P. Engineered doping of organic semiconductors for enhanced thermoelectric efficiency. Nat. Mater. 2013, 12, 719–723. [Google Scholar] [CrossRef]
- Wei, S.; Zhang, Y.; Lv, H.; Deng, L.; Chen, G. SWCNT Network Evolution of PEDOT:PSS/SWCNT Composites for Thermoelectric Application. Chem. Eng. J. 2022, 428, 131137. [Google Scholar] [CrossRef]
- Kim, C.; Lopez, D.H. Energy Filtering and Phonon Scattering Effects in Bi2Te3–PEDOT:PSS Composite Resulting in Enhanced n-Type Thermoelectric Performance. Appl. Phys. Lett. 2022, 120, 063903. [Google Scholar] [CrossRef]
- Liu, S.; Li, H.; Fan, X.; He, C. Enhanced Thermoelectric Performance of Conducting Polymer Composites by Constructing Sequential Energy-Filtering Interfaces and Energy Barriers. Compos. Sci. Technol. 2022, 221, 109347. [Google Scholar] [CrossRef]
- Crispin, X.; Jakobsson, F.L.E.; Crispin, A.; Grim, P.C.M.; Andersson, P.; Volodin, A.; Van Haesendonck, C.; Van Der Auweraer, M.; Salaneck, W.R.; Berggren, M. The origin of the high conductivity of poly(3,4-ethylenedioxythiophene)- poly(styrenesulfonate) (PEDOT-PSS) plastic electrodes. Chem. Mater. 2006, 18, 4354–4360. [Google Scholar] [CrossRef]
- Thomas, J.P.; Zhao, L.; McGillivray, D.; Leung, K.T. High-efficiency hybrid solar cells by nanostructural modification in PEDOT:PSS with co-solvent addition. J. Mater. Chem. A 2014, 2, 2383–2389. [Google Scholar] [CrossRef]
- Lee, I.; Kim, G.W.; Yang, M.; Kim, T.S. Simultaneously Enhancing the Cohesion and Electrical Conductivity of PEDOT:PSS Conductive Polymer Films using DMSO Additives. ACS Appl. Mater. Interfaces 2016, 8, 302–310. [Google Scholar] [CrossRef]
- Maity, S.; Kulsi, C.; Banerjee, S.; Das, S.; Chatterjee, K. Dependence of thermoelectric power and electrical conductivity on structural order of PEDOT-Tos-graphene nanocomposite via charge carrier mobility. Mater. Res. Express 2019, 6, 105095. [Google Scholar] [CrossRef]
- Liang, L.; Wang, X.; Wang, M.; Liu, Z.; Chen, G.; Sun, G. Flexible poly(3,4-ethylenedioxythiophene)-tosylate/SWCNT composite films with ultrahigh electrical conductivity for thermoelectric energy harvesting. Compos. Commun. 2021, 25, 100701. [Google Scholar] [CrossRef]
- Fujima, T.; Uchiyama, K.; Yasumoro, K.; Ito, T.; Tabata, E. A PSS-free PEDOT conductive film supported by a hierarchical Nanoporous Layer Glass. Macromol. Mater. Eng. 2018, 303, 1800183. [Google Scholar] [CrossRef]
- Yasumoro, K.; Fujita, Y.; Arimatsu, H.; Fujima, T. A new composite structure of PEDOT/PSS: Macro-separated layers by a Polyelectrolyte Brush. Polymers 2020, 12, 456. [Google Scholar] [CrossRef]
- Arimatsu, H.; Osada, Y.; Takagi, R.; Fujima, T. First-Principle Study on p-n Control of PEDOT-Based Thermoelectric Materials by PTSA Doping. Polymers 2021, 13, 3518. [Google Scholar] [CrossRef]
- Osada, Y.; Takagi, R.; Arimatsu, H.; Fujima, T. Giant Seebeck Effect in PEDOT Materials with Molecular Strain. arXiv 2024, arXiv:2410.23573. [Google Scholar] [CrossRef]
- Tamburri, E.; Sarti, S.; Orlanducci, S.; Terranova, M.L.; Rossi, M. Study of PEDOT conductive polymer films by admittance measurements. Mater. Chem. Phys. 2011, 125, 397–404. [Google Scholar] [CrossRef]
- Semaltianos, N.G.; Logothetidis, S.; Hastas, N.; Perrie, W.; Romani, S.; Potter, R.J.; Dearden, G.; Watkins, K.G.; French, P.; Sharp, M. Modification of the Electrical Properties of PEDOT:PSS by the Incorporation of ZnO Nanoparticles Synthesized by Laser Ablation. Chem. Phys. Lett. 2010, 484, 283–289. [Google Scholar] [CrossRef]
- Ouyang, J.; Xu, Q.; Chu, C.-W.; Yang, Y.; Li, G.; Shinar, J. On the Mechanism of Conductivity Enhancement in Poly(3,4-Ethylenedioxythiophene):Poly(Styrene Sulfonate) Film through Solvent Treatment. Polymer 2004, 45, 8443–8450. [Google Scholar] [CrossRef]
- Ali, M.Z.; Ishak, K.M.K.; Zawawi, M.A.M.; Jaafar, M.; Zulkifli, M.; Ahmad, Z. Simultaneous enhancement of conductivity and Seebeck coefficient of PEDOT:PSS by triflic acid treatment for flexible thermoelectric generator. Synth. Met. 2022, 286, 117037. [Google Scholar] [CrossRef]
- Nguyen, T.Q.; Breitkopf, C. Determination of diffusion coefficients using impedance spectroscopy data. J. Electrochem. Soc. 2018, 165, E826–E831. [Google Scholar] [CrossRef]
- Guerrero, A.; Garcia-Belmonte, G.; Mora-Sero, I.; Bisquert, J.; Kang, Y.S.; Jacobsson, T.J.; Correa-Baena, J.-P.; Hagfeldt, A. Properties of Contact and Bulk Impedances in Hybrid Lead Halide Perovskite Solar Cells Including Inductive Loop Elements. J. Phys. Chem. C 2016, 120, 8023–8032. [Google Scholar] [CrossRef]
- Ghahremanirad, E.; Bou, A.; Olyaee, S.; Bisquert, J. Inductive loop in the impedance response of perovskite solar cells explained by surface polarization model. J. Phys. Chem. Lett. 2017, 8, 1402–1406. [Google Scholar] [CrossRef]
- Menkuer, M.; Ozkazanc, H. Anticorrosive properties of PPy|Co3O4 composite films coated on Al-1050 in OXA-DBSA mix electrolyte. Synth. Met. 2019, 254, 10–21. [Google Scholar] [CrossRef]
- Gonzales, C.; Guerrero, A.; Bisquert, J. Transition from Capacitive to Inductive Hysteresis: A Neuron-Style Model to Correlate I–V Curves to Impedances of Metal Halide Perovskites. J. Phys. Chem. C 2022, 126, 13560–13578. [Google Scholar] [CrossRef]
- Bisquert, J.; Garcia-Belmonte, G.; Pitarch, A.; Bolink, H. Negative capacitance caused by electron injection through interfacial states in organic light-emitting diodes. Chem. Phys. Lett. 2006, 422, 184–191. [Google Scholar] [CrossRef]
- Kaviani, S.; Mohammadi Ghaleni, M.; Tavakoli, E.; Nejati, S. Electroactive and conformal coatings of oxidative chemical vapor deposition polymers for oxygen electroreduction. ACS Appl. Polym. Mat. 2019, 1, 552–560. [Google Scholar] [CrossRef]
- Ghafourisaleh, S.; Popov, G.; Leskela, M.; Putkonen, M.; Ritala, M. Oxidative MLD of conductive PEDOT thin films with EDOT and ReCl5 as precursors. ACS omega 2021, 6, 17545–17554. [Google Scholar] [CrossRef]
- Versaci, M.; Laganà, F.; Morabito, F.C.; Palumbo, A.; Angiulli, G. Adaptation of an Eddy Current Model for Characterizing Subsurface Defects in CFRP Plates Using FEM Analysis Based on Energy Functional. Mathematics 2024, 12, 2854. [Google Scholar] [CrossRef]
- Liu, W.D.; Yin, L.C.; Li, L.; Yang, Q.; Wang, D.Z.; Li, M.; Shi, X.L.; Liu, Q.; Bai, Y.; Gentle, I.; et al. Grain boundary re-crystallization and sub-nano regions leading to high plateau figure of merit for Bi2Te3 nanoflakes. Energy Environ. Sci. 2023, 16, 5123–5135. [Google Scholar] [CrossRef]
- Du, M.; Wen, Y.; Chen, Z.; Xu, Y.; Qin, J.; Cheng, H.; Du, Y.; Zhang, K.; Shin, S.; Ouyang, J. A Polymer Film with Very High Seebeck Coefficient and Overall Thermoelectric Properties by Secondary Doping, Dedoping Engineering and Ionic Energy Filtering. Adv. Funct. Mater. 2025, 35, 2411815. [Google Scholar] [CrossRef]

| Sample Number | EDOT [μmol/L] | SPS [mmol/L] | PTSA [mmol/L] |
|---|---|---|---|
| #1 | 12 | 14 | 1.9 |
| #2 | 12 | 14 | 3.9 |
| #3 | 12 | 14 | 5.6 |
| #4 | 12 | 14 | 7.7 |
| #5 | 12 | 14 | 9.7 |
| #6 | 12 | 14 | 15 |
| #7 | 12 | 14 | 19 |
Disclaimer/Publisher’s Note: The statements, opinions and data contained in all publications are solely those of the individual author(s) and contributor(s) and not of MDPI and/or the editor(s). MDPI and/or the editor(s) disclaim responsibility for any injury to people or property resulting from any ideas, methods, instructions or products referred to in the content. |
© 2025 by the authors. Licensee MDPI, Basel, Switzerland. This article is an open access article distributed under the terms and conditions of the Creative Commons Attribution (CC BY) license (https://creativecommons.org/licenses/by/4.0/).
Share and Cite
Arimatsu, H.; Osada, Y.; Takagi, R.; Ohira, Y.; Hijikata, T.; Fujima, T. Dual Roles of PTSA in Electrical Conductivity of PEDOT:PTSA with Large Seebeck Coefficient. Materials 2025, 18, 619. https://doi.org/10.3390/ma18030619
Arimatsu H, Osada Y, Takagi R, Ohira Y, Hijikata T, Fujima T. Dual Roles of PTSA in Electrical Conductivity of PEDOT:PTSA with Large Seebeck Coefficient. Materials. 2025; 18(3):619. https://doi.org/10.3390/ma18030619
Chicago/Turabian StyleArimatsu, Hideki, Yuki Osada, Ryo Takagi, Yosuke Ohira, Tomoki Hijikata, and Takuya Fujima. 2025. "Dual Roles of PTSA in Electrical Conductivity of PEDOT:PTSA with Large Seebeck Coefficient" Materials 18, no. 3: 619. https://doi.org/10.3390/ma18030619
APA StyleArimatsu, H., Osada, Y., Takagi, R., Ohira, Y., Hijikata, T., & Fujima, T. (2025). Dual Roles of PTSA in Electrical Conductivity of PEDOT:PTSA with Large Seebeck Coefficient. Materials, 18(3), 619. https://doi.org/10.3390/ma18030619