Article

Comparative Study of Machine Learning for Predicting Compressive Strength in Oyster Shell Cementitious Composites

Department of Civil Engineering, Chosun University, 10 Chosundae 1-gil, Dong-Gu, Gwangju 61452, Republic of Korea
*
Author to whom correspondence should be addressed.
These authors contributed equally to this work.
Materials 2025, 18(23), 5314; https://doi.org/10.3390/ma18235314
Submission received: 3 November 2025 / Revised: 19 November 2025 / Accepted: 20 November 2025 / Published: 25 November 2025

Highlights

What are the main findings?
  • Superplasticizer and cement had the strongest Pearson correlations with compressive strength.
  • Random forest achieved the highest performance among the base models, with R2 = 0.8411.
  • LightGBM was identified as the optimal model, effectively capturing nonlinear patterns in the data.
What are the implications of the main findings?
  • Ensemble models accurately predict compressive strength of oyster shell cementitious composites.
  • Insights into the relative importance and directional influence of input variables are provided.
  • Reliable evaluation of the structural performance of composites incorporating waste oyster shells.

Abstract

Annual oyster production in southern Korea reaches about 300,000 tons, generating an equivalent amount of waste oyster shells. Most are illegally dumped or stockpiled along coastlines, causing serious environmental issues. This study utilized machine learning to predict the compressive strength of oyster shell cementitious composites. A total of 336 datasets were used, including 189 experimental results and 147 from published literature. Input variables were water-to-cement ratio (W/C), silica fume, blast furnace slag, superplasticizer content, and curing conditions. Algorithm selection compared the performance of Ridge Regression, Support Vector Regression, Artificial Neural Network, and Random Forest (RF), with RF exhibiting the highest predictive performance (R2 = 0.8411). Ensemble algorithms including XGBoost, AdaBoost, Extra Trees, and LightGBM were optimized using GridSearchCV. Among these, LightGBM showed the best predictive capability with a mean absolute error of 3.1671, mean squared error of 17.8054, root mean square error of 4.2196, and R2 of 0.9042. SHAP analysis revealed that W/C and superplasticizer were the most influential variables. Oyster shells showed a negative correlation with sand, indicating the role of oyster shells as a substitute material. Thus, cementitious composites can maintain compressive strength and serve as sustainable construction materials when waste oyster shells are incorporated with appropriate admixtures.

1. Introduction

The southern coastal region of Korea produces approximately 300,000 tons of oysters annually, ranking second worldwide in output. This production generates approximately 300,000 tons of waste oyster shells every year and only about 30% are recycled. The remaining shells are dumped or stockpiled along coastlines, which leads to severe environmental problems [1,2,3]. In response, the Ministry of Oceans and Fisheries in Korea recently revised legislation to allow marine waste to be used as construction materials [4,5]. This regulatory change has stimulated research on recycling waste oyster shells as construction materials [6,7,8]. Waste oyster shells exhibit strength and permeability similar to those of natural sand, and the CaCO3 content of approximately 90% ensures that incorporation into cementitious composites does not interfere with hydration reactions. Owing to these characteristics, the potential of waste oyster shells as a sand replacement has been widely investigated [9,10,11].
The feasibility of waste oyster shells as a replacement for sand has been investigated previously [12,13,14]. Kim et al. [15] completely replaced sand with waste oyster shells in cementitious composites, achieving compressive strengths exceeding 30 MPa under both freshwater and sodium chloride solution curing conditions. Hong and Choudhury [16] incorporated up to 40% waste oyster shells as a partial sand replacement and reported that the high absorption rate and porous structure of waste oyster shells reduced concrete workability. Luo et al. [17] completely replaced natural aggregates with waste oyster shells and confirmed the applicability of the concrete for structural purposes. Lin et al. [18] found that 20% waste oyster shells enhanced resistance to dynamic impact. Further research has emphasized performance improvements through the combined use of waste oyster shells and supplementary materials. Cha et al. [19] revealed that admixtures containing SiO2 promoted the formation of C–S–H during hydration, enhancing compressive strength. The findings confirmed the feasibility of waste oyster shells as eco-friendly replacements for limestone and sand. Yang et al. [20] found that 10% waste oyster shells achieved comparable long-term strength to conventional concrete while improving resistance to carbonation and chemical attack. Yoon et al. [21] varied the waste oyster shell contents from 0% to 80% and observed a reduction in compressive strength with increasing replacement ratio owing to the porous and lightweight nature of the shells. Overall, these studies indicate that cementitious composites can maintain sufficient compressive strength and serve as sustainable construction materials when waste oyster shells are combined with appropriate admixtures.
Accurate measurement of the compressive strength of cementitious composites is essential to ensure structural safety and durability. However, traditional evaluation methods require long curing periods and repeated compressive strength testing, highlighting the need for reliable predictive techniques [22,23,24,25]. Machine learning has shown strong potential in predicting compressive strength by learning nonlinear relationships from diverse datasets [26,27,28,29]. Recently, many studies have applied machine learning to predict the compressive strength of cementitious composites [30,31,32,33,34]. In addition, recent research has adopted machine learning to predict structural member capacity and confinement behavior in reinforced concrete systems, which further indicates the applicability of data driven approaches in civil engineering [35,36,37,38]. Yeh [39] applied artificial neural networks (ANN) to predict the strength of high-performance concrete, finding stronger correlations than models based on regression. DeRousseau et al. [40] applied machine learning to field-placed concrete, revealing that tree-based models performed best when capturing nonlinear compressive strength behaviors. Jia et al. [41] used ensemble learning methods and confirmed through SHAP analysis that water-to-binder ratio and curing conditions were the most influential variables. Nguyen-Sy et al. [42] predicted uniaxial compressive strengths by incorporating mixture proportions and curing age as input variables, identifying tree-based ensemble models as superior. Yu et al. [43] proposed a self-learning support vector machine (SVM) model enhanced with cat swarm optimization, achieving higher predictive accuracy than conventional SVM models. Feng et al. [44] presented an adaptive boosting-based machine learning model to predict the compressive strength of concrete, which achieved higher predictive accuracy than ANN and SVM models. Inqiad et al. [45] compared Multi-Expression Programming, eXtreme Gradient Boosting (XGBoost), and Random Forest (RF) for predicting the compressive strength of self-compacting concrete at 28 days, with XGBoost achieving the highest correlation coefficient. Wang et al. [46] investigated RF, XGBoost, and Support Vector Regression (SVR) for mixtures containing fly ash and slag, concluding that XGBoost consistently outperformed other models in terms of the root mean square error (RMSE), R2, and mean absolute error (MAE). Wang et al. [47] further applied interpretable machine learning techniques, demonstrating high predictive performance (R2 = 0.928 for training and R2 = 0.966 for testing) with XGBoost, while SHAP analysis confirmed that the most influential variables were consistent with the established concrete theory. Abdelsattar et al. [48] implemented deep residual neural networks combined with variance-based sensitivity analysis for pozzolanic concrete, achieving an R2 of 0.94 on the test set and identifying silica fume and volcanic ash as critical contributors to strength development. These findings indicate that accurate prediction of compressive strength is essential to ensure the structural stability and durability of cementitious composites, and machine learning offers a reliable approach for this purpose.
This study applied machine learning to predict the compressive strength of cementitious composites in which sand was replaced with waste oyster shells. The study was conducted in five stages, namely, data preparation, correlation analysis, performance evaluation, optimal model selection, and ensemble model analysis (Figure 1). In the data preparation process, datasets were constructed using input and output variables related to oyster shell cementitious composites. Standardization and one-hot encoding were applied during preprocessing [49,50,51]. This approach was utilized to ensure reliable prediction performance and identify key influencing variables. Through this process, the most effective detailed model for predicting the compressive strength of oyster shell cementitious composites was identified.

2. Experimental Program

2.1. Experimental Process

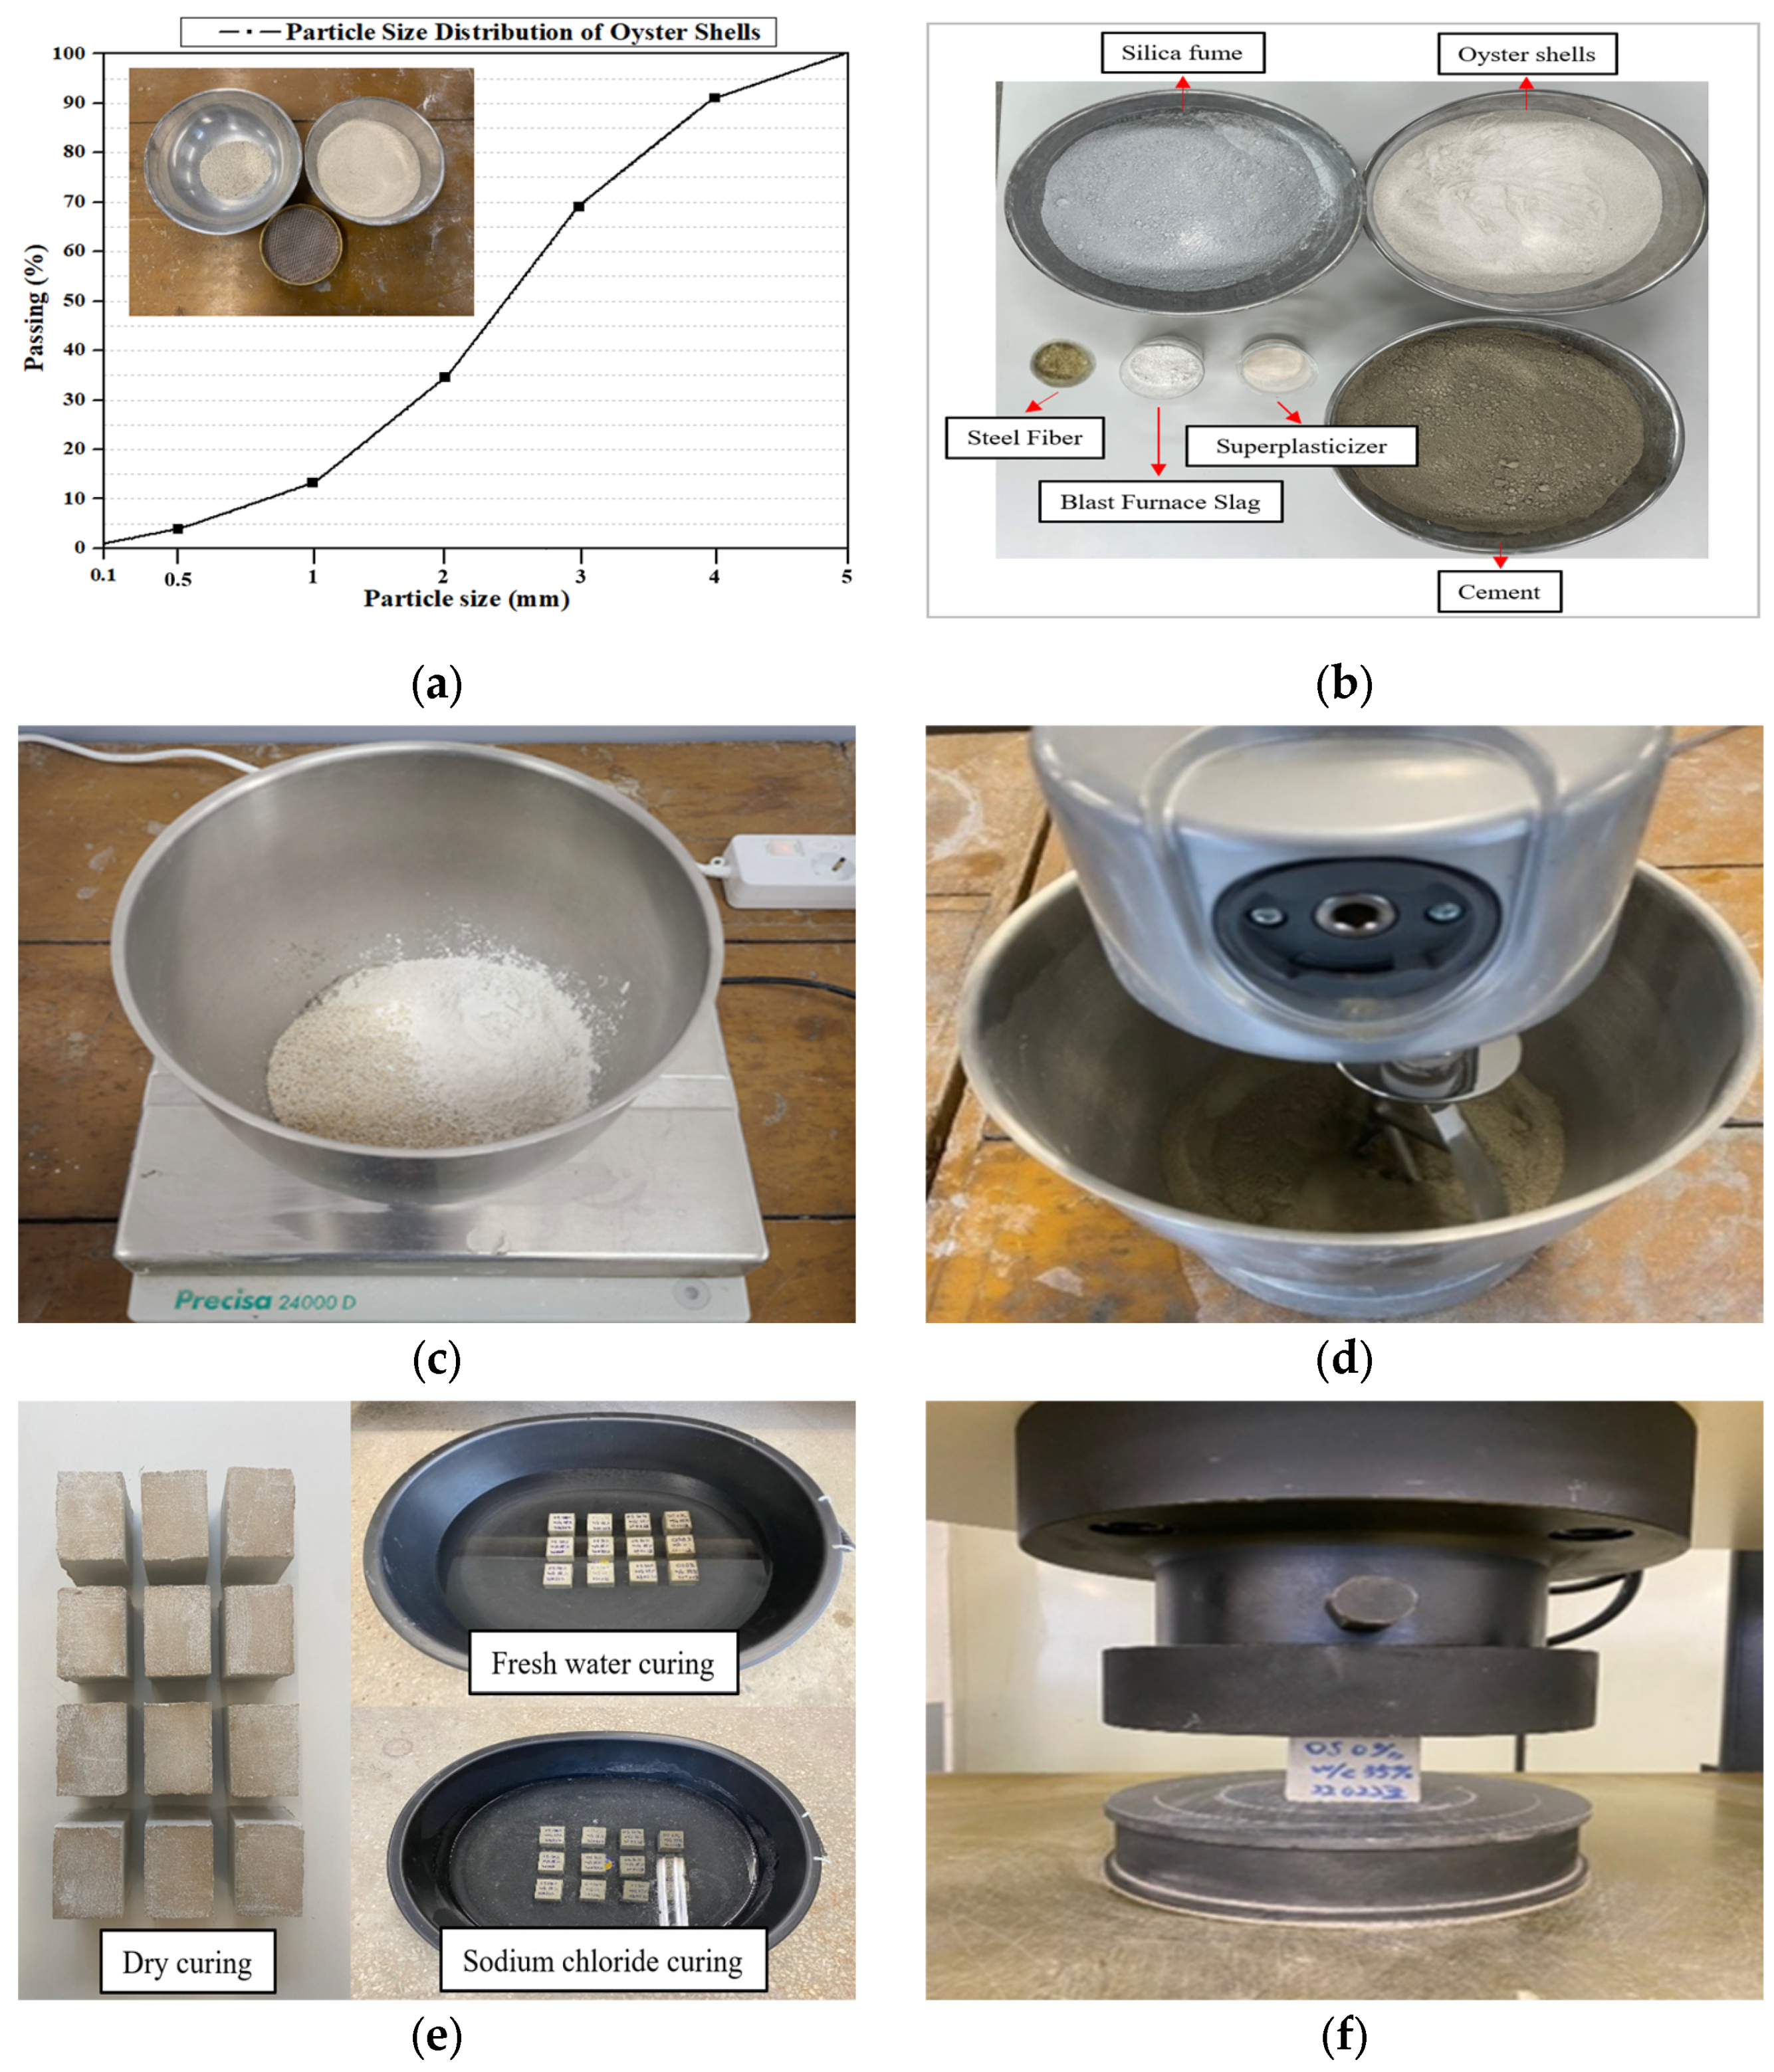
Figure 2 presents the experimental procedure for measuring the compressive strength of oyster shell cementitious composites. The waste oyster shells used in this study were obtained from Tongyeong, located on the southern coast of the Republic of Korea. To obtain the same particle size as Standard Sand No. 6 (0.35–0.7 mm), sieve analysis was performed using a #30 sieve with a mesh size of 600 μm (Figure 2a). Figure 2b shows the materials used in the oyster shell cementitious composite. Type 1 Ordinary Portland Cement was used, and chemical admixtures satisfying ASTM specifications were incorporated [52,53,54,55]. As shown in Figure 2c, cement, waste oyster shells, and admixtures were weighed prior to mixing. The measured materials were then placed into a mixing bowl and homogenized (Figure 2d). The fabricated oyster shell cementitious composite specimens had dimensions of 50 × 50 × 50 mm. Curing was conducted under three conditions—dry curing, freshwater curing, and sodium chloride curing (Figure 2e). Finally, compressive strength was measured using a Universal Testing Machine (UTM) with a capacity of 1000 kN, according to the ASTM C109 standards. The cross-sectional loading area was set to 2500 mm2, and the load was applied at a displacement rate of 1 mm/min. A low-capacity load cell range was selected on the UTM to ensure adequate sensitivity and accuracy for the small specimens. Figure 2f shows the compressive strength testing setup in accordance with ASTM C109 [56].

2.2. Datasets

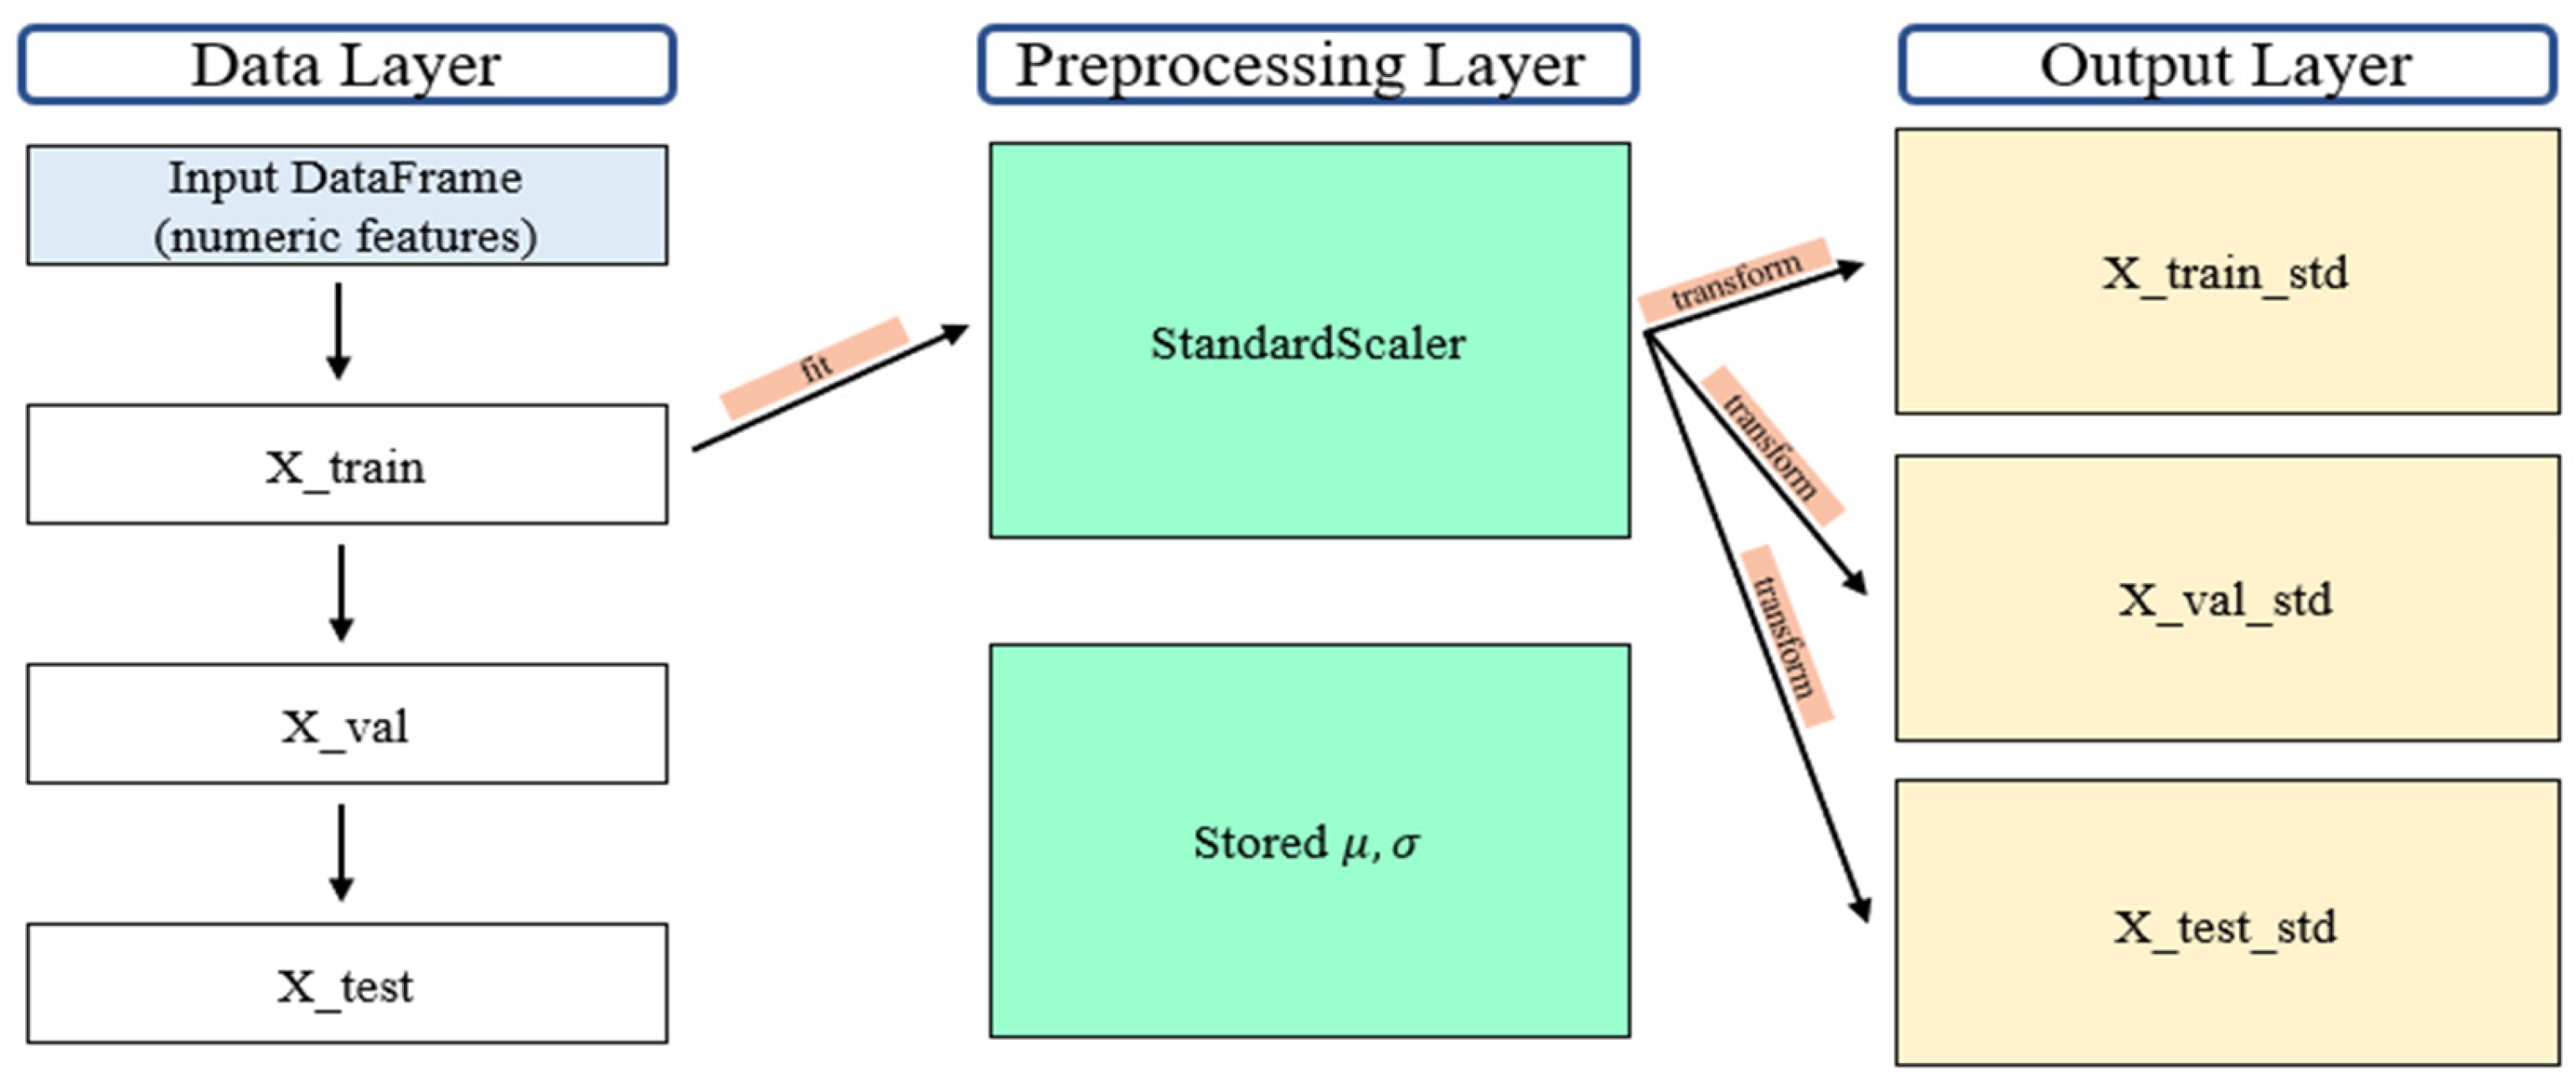
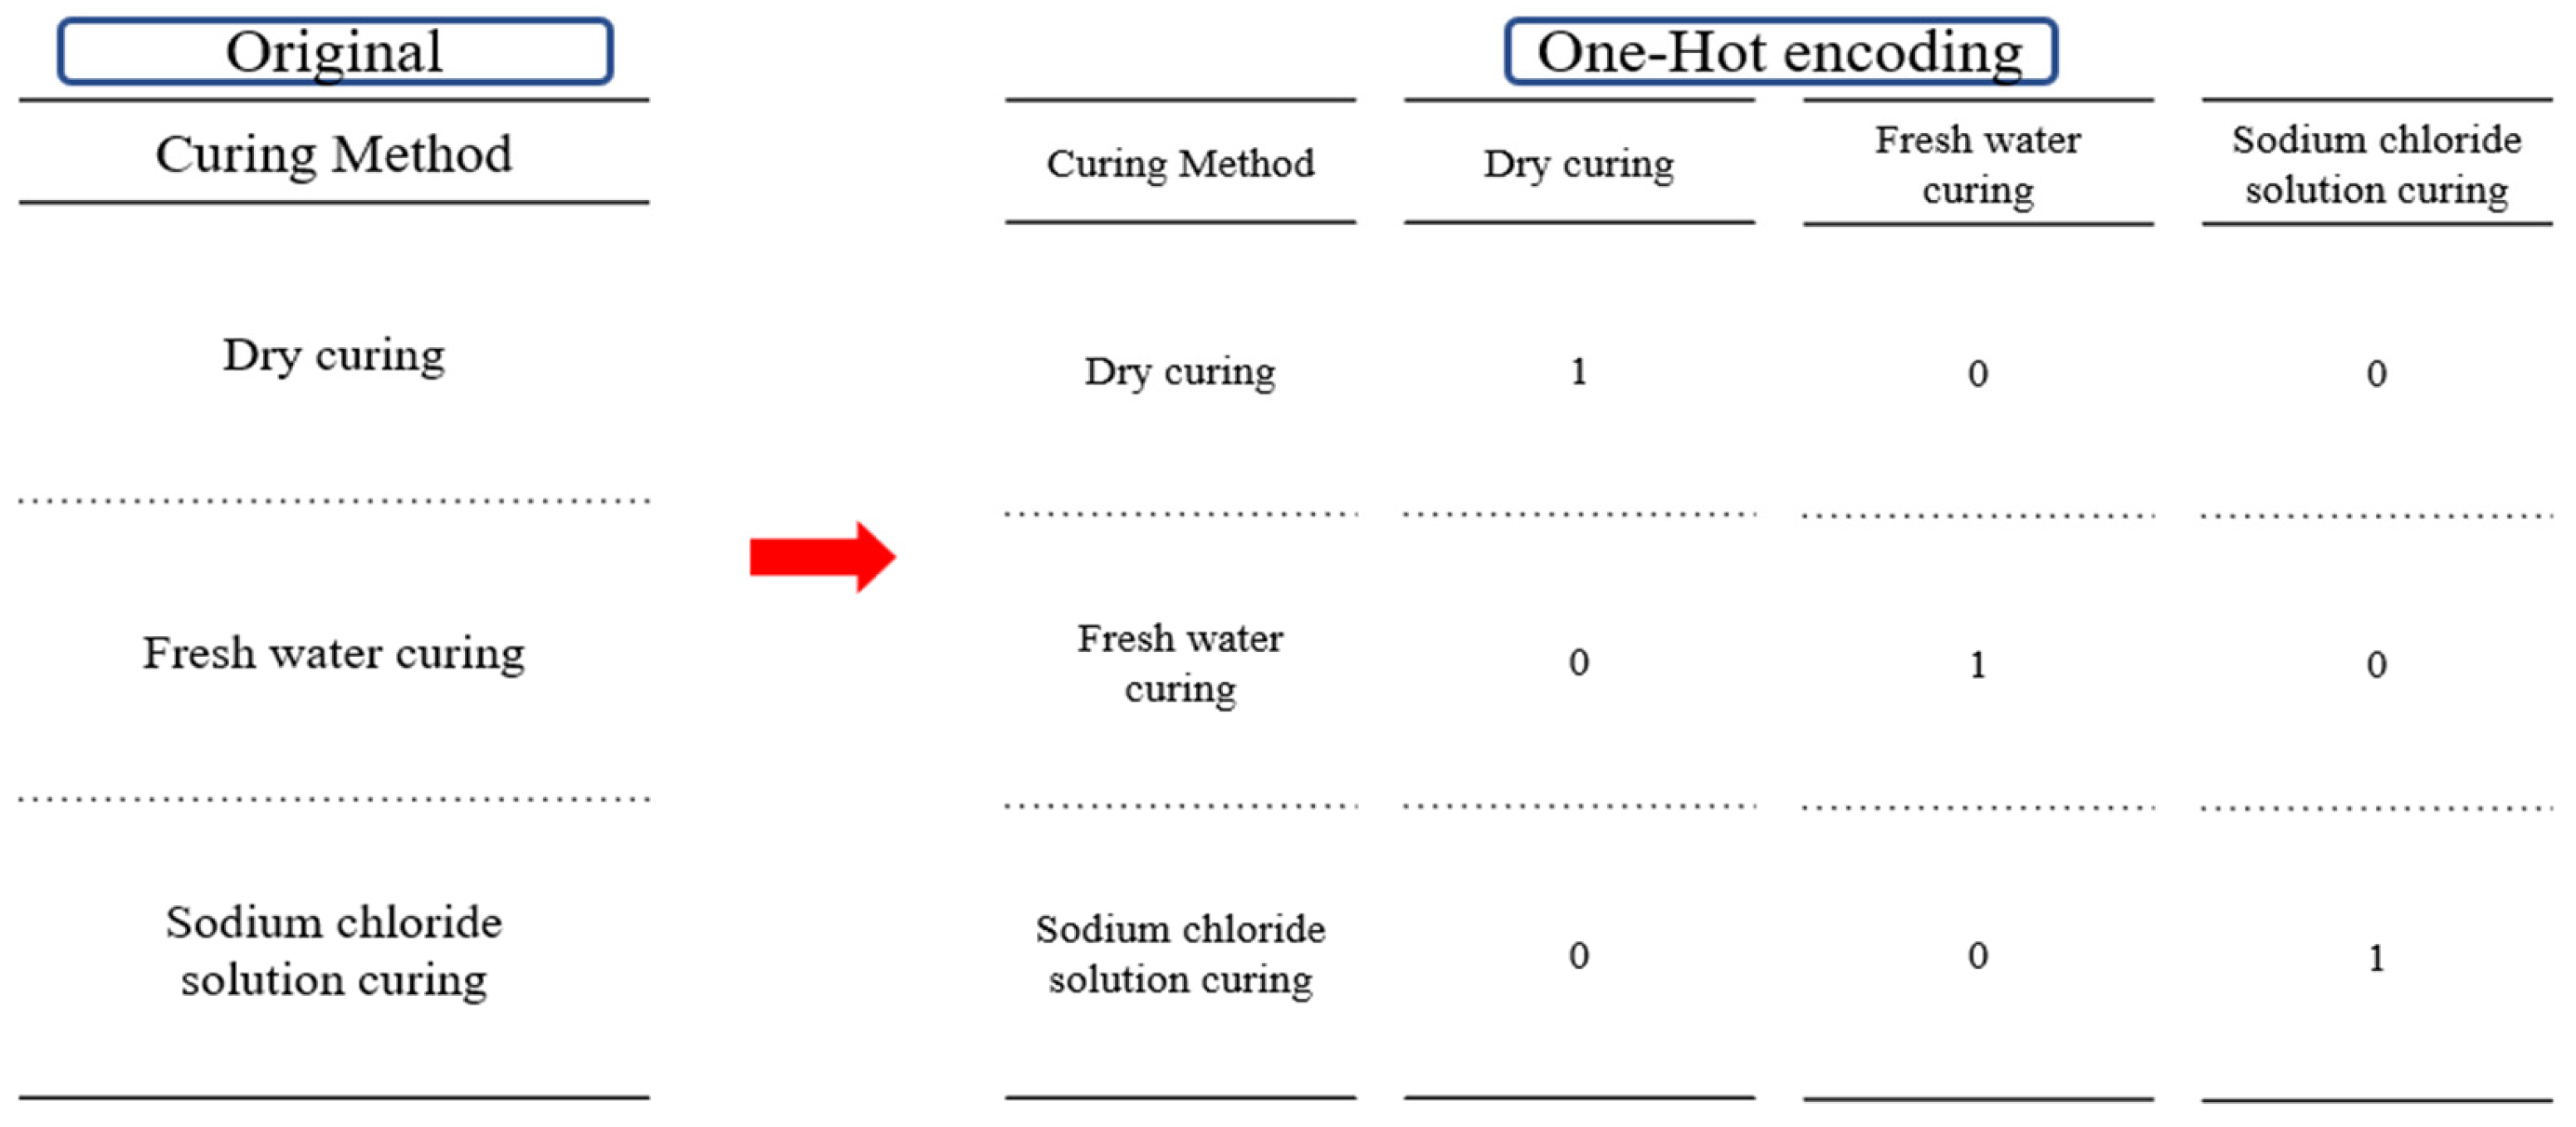
Compressive strength serves as a key indicator of structural stability and durability in cementitious composites, and therefore, this study designated compressive strength as the output variable. A total of 336 data points were used to construct the dataset, comprising 189 experimental results and 147 data points collected from published literature (Supplementary Material File). The input variables included basic mixture components such as cement, oyster shells, sand, aggregate, and water-to-cement ratio (W/C), as well as supplementary materials including silica fume, blast furnace slag, steel fiber, fly ash, and superplasticizer. Additional variables such as curing days, particle size, cross-sectional area, and curing conditions (dry curing, freshwater curing, sodium chloride curing) were incorporated to represent long-term strength development and environmental influences (Table 1). The compressive strength references for oyster shell cementitious composites are summarized in Table 2. All variables listed in Table 1 were used in the final model, and units for material proportions were expressed as mass ratio percentages. No missing data were present in the dataset. Therefore, no imputation was required. Cross-section was included because specimen size influences stress distribution and failure behavior during compression. Particle size was considered because packing density and pore structure associated with aggregate size affect hydration characteristics and compressive strength. To improve the stability of the learning process, standardization was applied to reduce scale differences among input variables (Figure 3). For categorical variables, one-hot encoding was applied to transform them into binary vectors (Figure 4). For example, the curing condition was divided into three categories (dry curing, freshwater curing, and sodium chloride curing), and each category was represented by a binary value of True (1) or False (0). This preprocessing enabled the model to effectively learn from both continuous and categorical variables. The dataset was divided into training validation and testing subsets, with 30% used as the test set and the remaining portion further split into training and validation sets to ensure generalization and prevent overfitting.

3. Research Method

3.1. Correlation Analysis

The Pearson correlation coefficient is a statistical measure used to evaluate the linear relationship between two continuous variables [60,61,62]. The coefficient ranges from −1 to +1, where values close to +1 indicate a strong positive linear correlation, values near 0 indicate no linear relationship, and values close to −1 indicate a strong negative linear correlation. The coefficient is defined as the covariance of the two variables divided by the product of their standard deviations, as shown in Equation (1). The Taylor diagram provides a graphical representation that simultaneously visualizes correlation coefficients and standard deviations between predicted and observed values. This method complements Pearson correlation analysis by enabling comparative evaluation of correlation strength and variance characteristics.
r = i = 1 n ( x i x ¯ ) ( y i y ¯ ) i = 1 n ( x i x ¯ ) 2 i = 1 n ( y i y ¯ ) 2
Here, r denotes the Pearson correlation coefficient between variables x and y , n is the number of data points, x i and y i represent the individual data values, and x ¯ and y ¯ are the respective means of x and y .
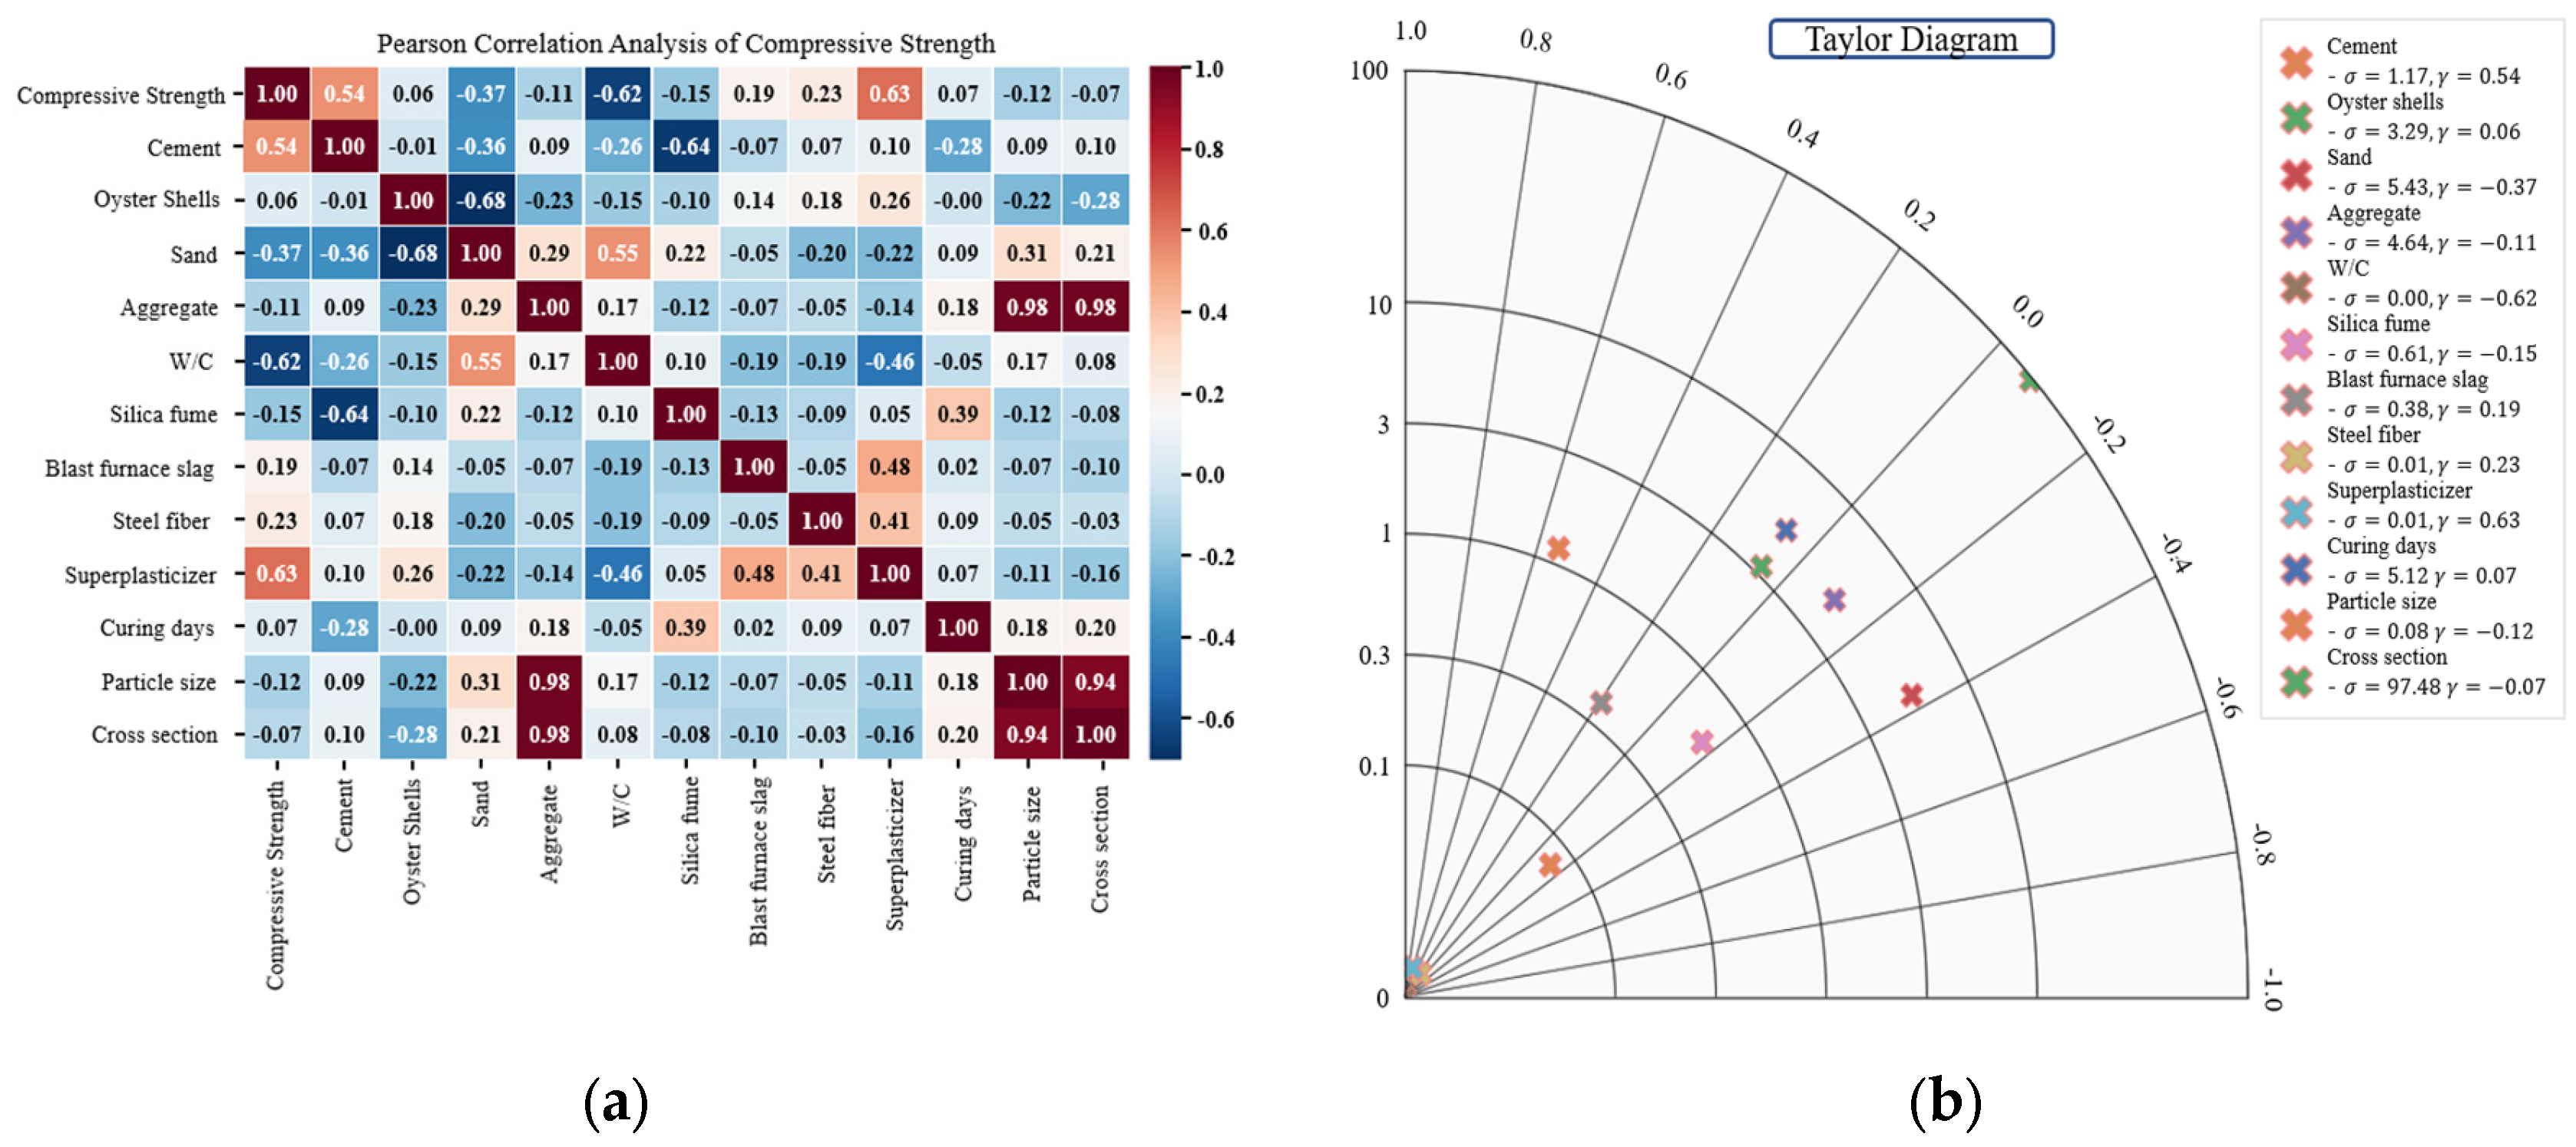
The correlation analysis results are presented in Figure 5. Superplasticizer (0.63) and cement (0.54) exhibited the strongest positive correlations with compressive strength (Figure 5a). This can be attributed to the role of superplasticizer in maintaining workability at low W/C ratios and enhancing hydration reactions, while cement contributes to strength development through the formation of calcium-silicate-hydrate (C–S–H). Steel fiber (0.23) showed a weak positive correlation. In contrast, W/C (−0.62) exhibited the strongest negative correlation, while sand (−0.37) and silica fume (−0.15) also showed negative correlations. A particularly strong negative correlation (−0.68) was observed between oyster shells and sand, confirming the role of oyster shells as substitute materials. The Taylor diagram further supported these findings, indicating that superplasticizer and cement were associated with high correlation coefficients and stable variance (Figure 5b). In contrast, W/C and sand exhibited negative correlations and high variability, identifying these variables as key factors contributing to strength reduction. Although oyster shells showed only a weak correlation with compressive strength, the strong negative correlation between oyster shells and sand was consistent with the Pearson analysis.

3.2. Background on Machine Learning Algorithms

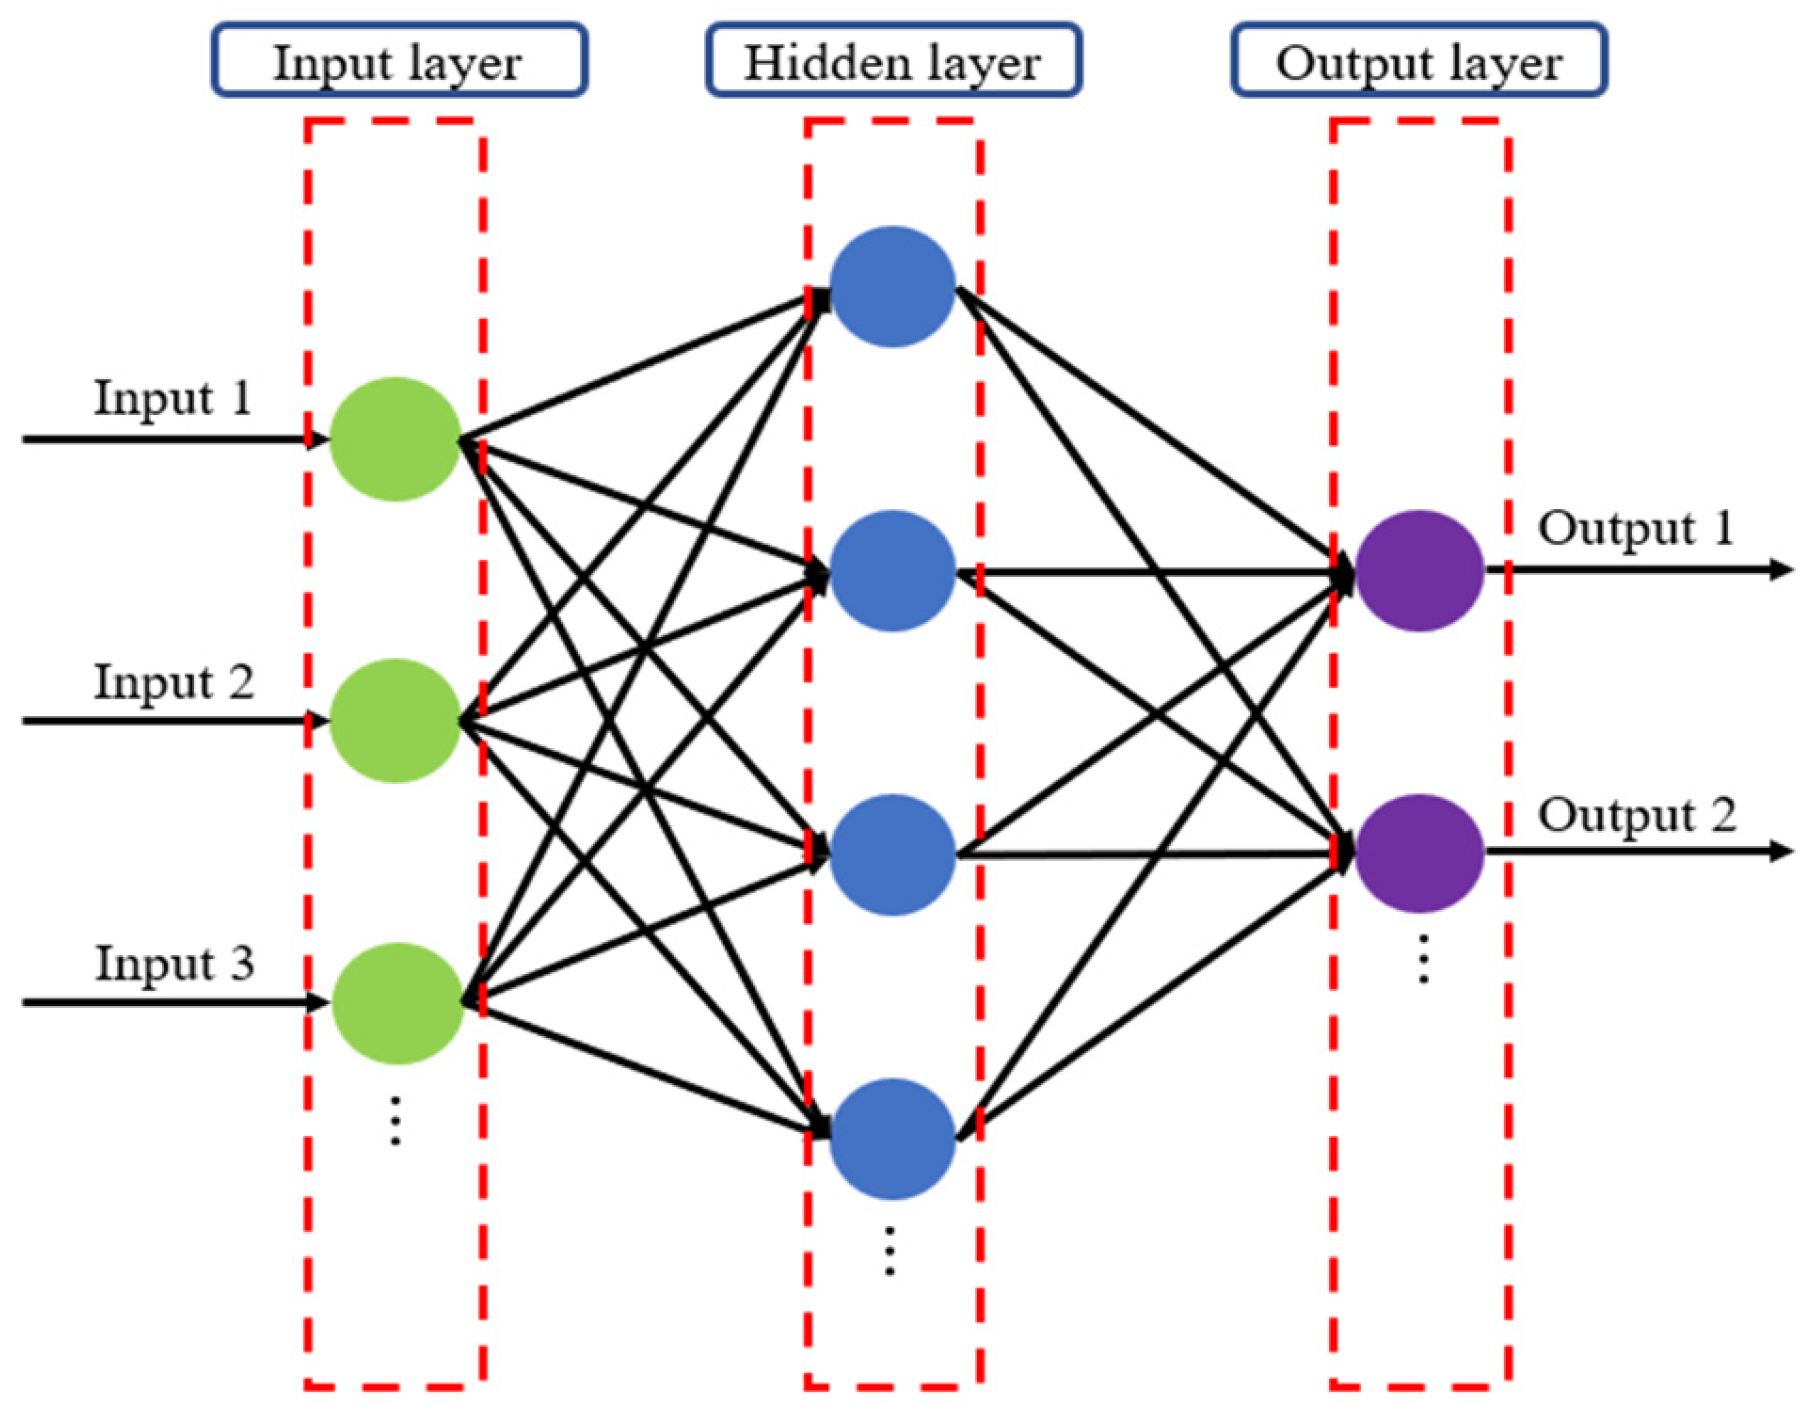
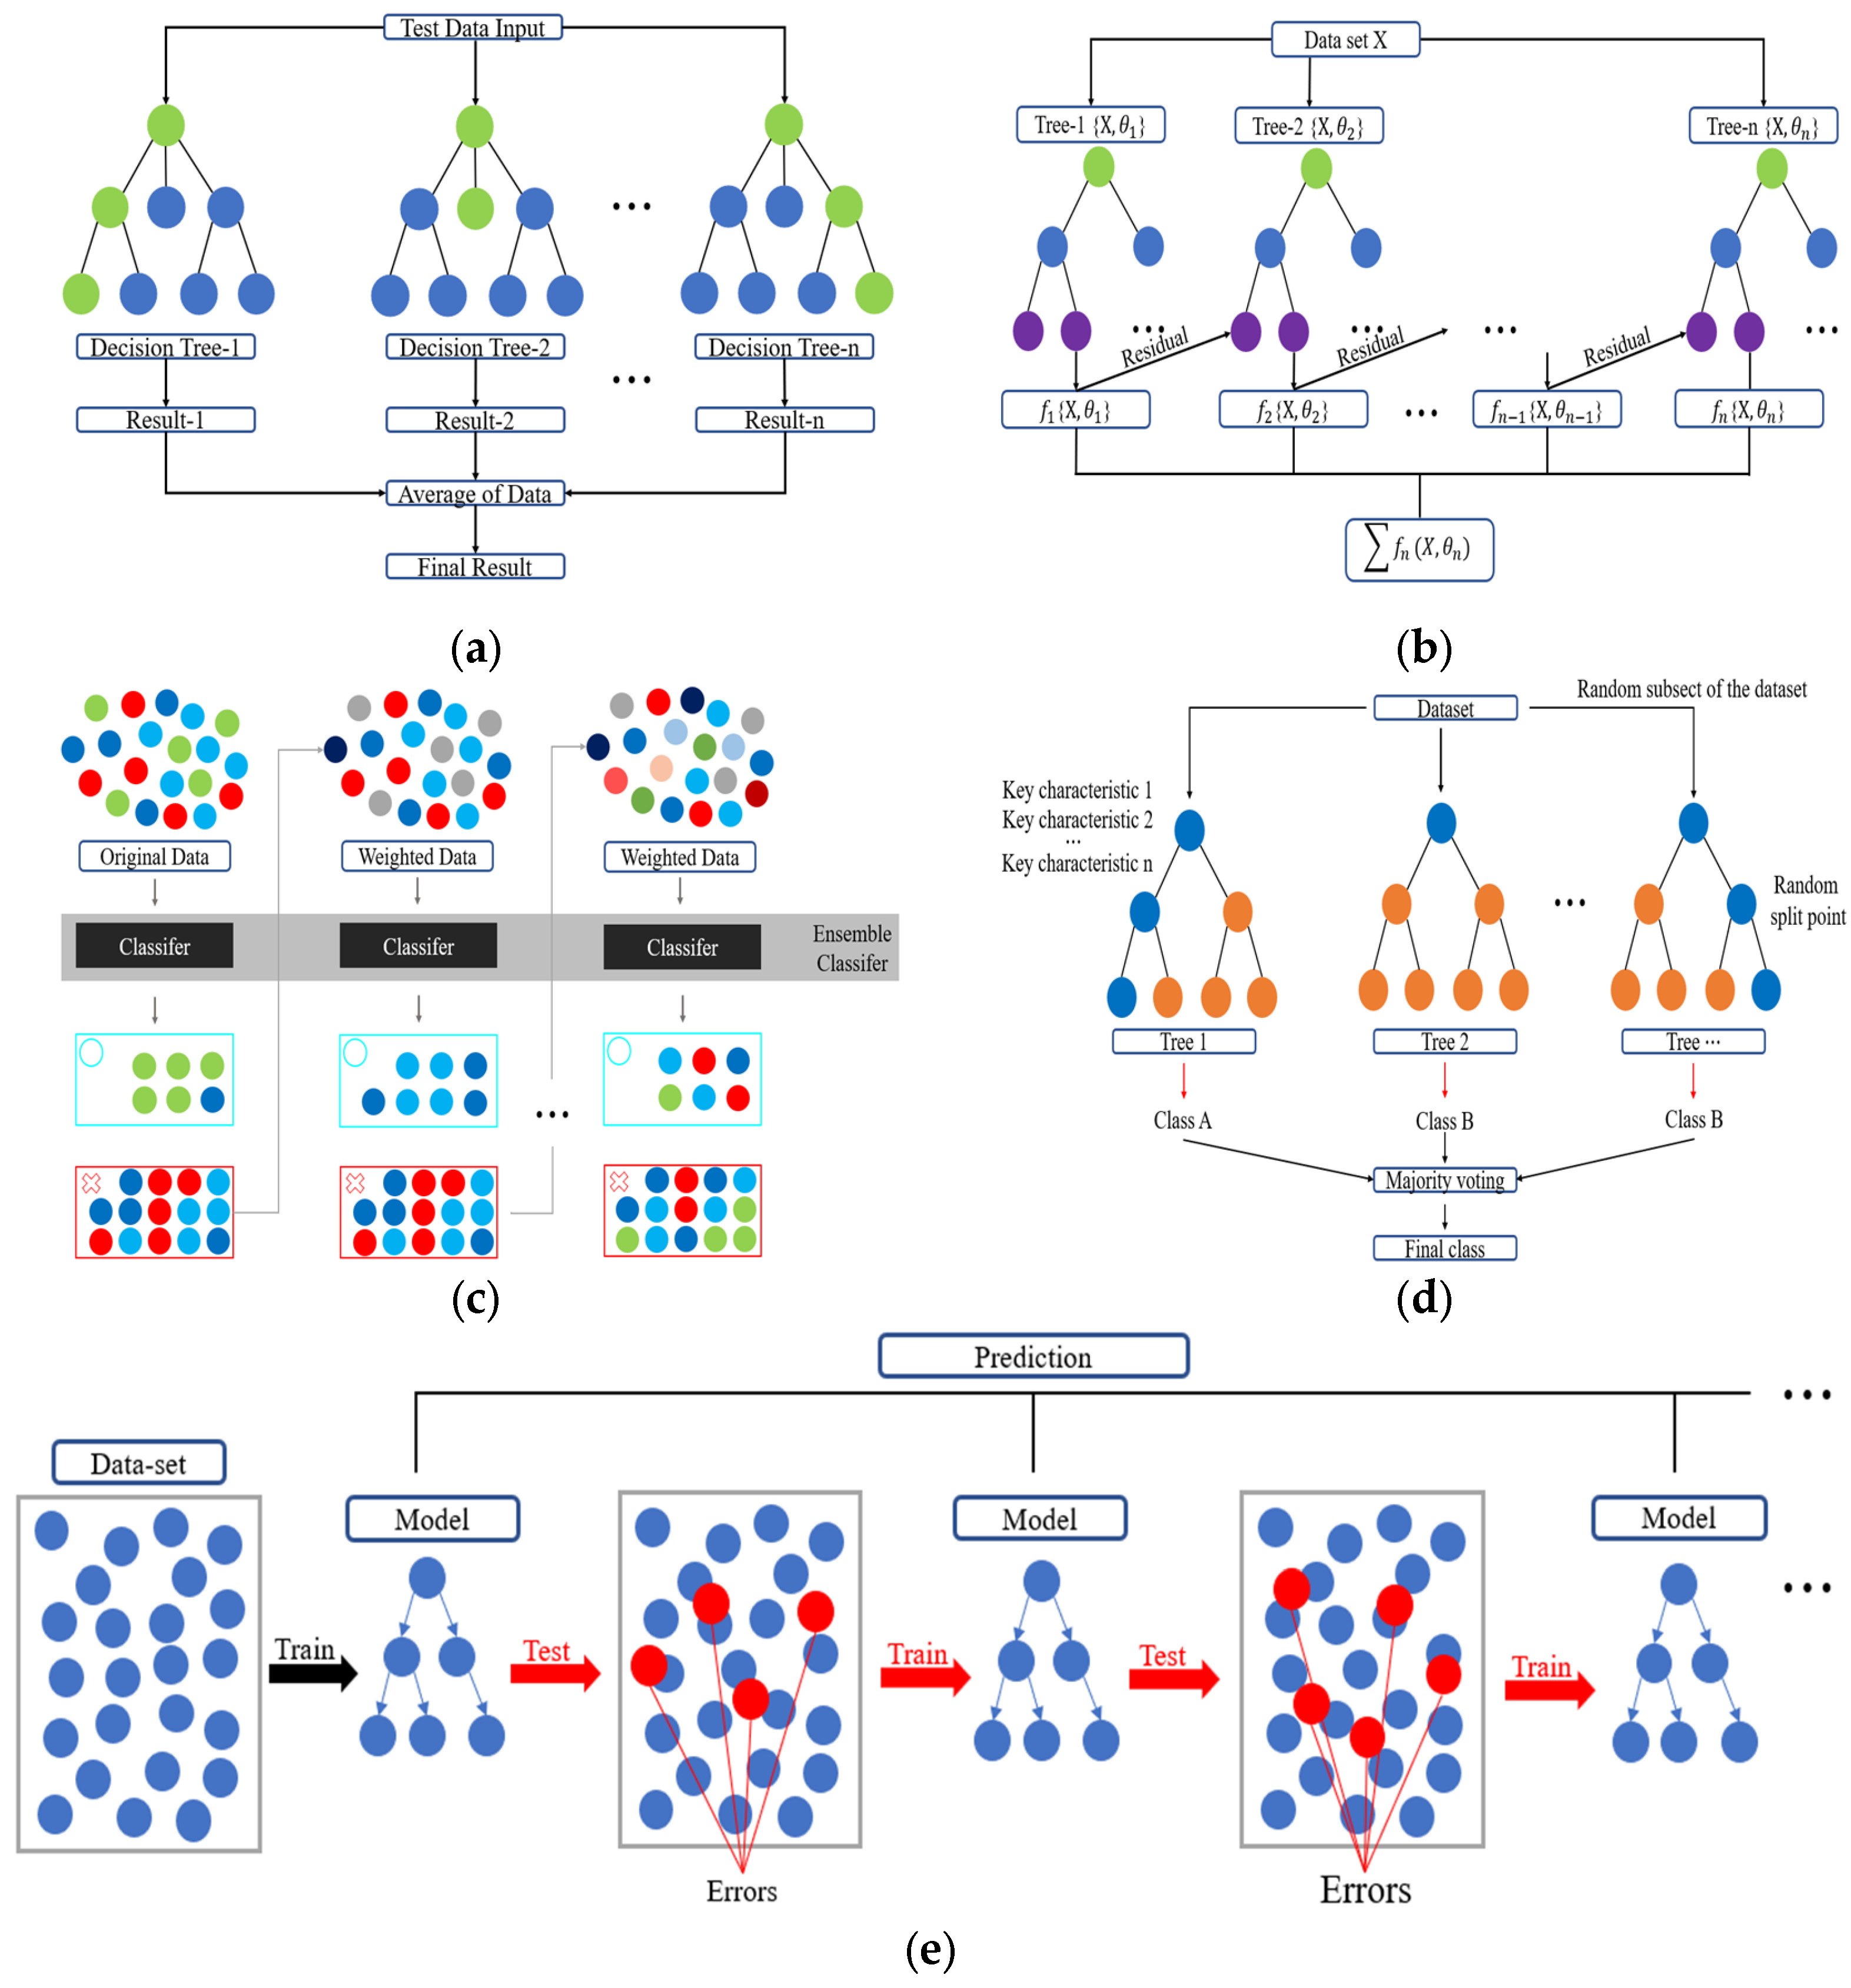
This study utilized a range of regression and ensemble-based models to predict the compressive strength of oyster shell cementitious composites. The analysis was conducted in two stages. In the first stage, both regression models and ensemble models were compared to identify the optimal algorithm, and the characteristics of each model are summarized below. Ridge Regression (RR) applies L2 regularization to mitigate multicollinearity and ensure stable predictions [63]. By penalizing large regression coefficients, RR reduces the risk of overfitting when strong correlations exist among input variables, thereby improving performance (Figure 6). SVR uses kernel functions to effectively model nonlinear relationships. Input data are transformed into a high-dimensional feature space through kernel mapping, where SVR establishes an optimal decision boundary to reflect nonlinear dependencies [64]. Figure 7 presents the SVR architecture. ANNs are based on multilayer perceptrons and can model complex nonlinearities and interactions between input variables (Figure 8). In this study, the ANN model consisted of two hidden layers with 100 and 50 neurons using ReLU activation and Adam optimization, and early stopping was applied to prevent overfitting. Depending on the number of hidden layers and activation functions, ANN is capable of learning diverse patterns and achieving strong predictive performance when sufficient training data are available [65]. RF combines multiple decision trees to reduce variance and prevent overfitting [66]. In addition, RF provides the advantage of quantifying variable importance (Figure 9a).
In the second stage, additional ensemble models were evaluated to refine the selection of the optimal predictive model. XGBoost integrates boosting with regularization to deliver high predictive performance and computational efficiency [67]. The algorithm incorporates regularization terms and supports parallel learning, making the method effective for large-scale data processing (Figure 9b). Adaptive Boosting (AdaBoost, Figure 9c) improves performance by assigning higher weights to misclassified data and combining weak learners sequentially into a strong predictor [68]. Extra Trees incorporate randomness in both feature selection and data sampling during tree construction, which enhances computational efficiency and reduces variance (Figure 9d). Light Gradient Boosting Machine (LightGBM, Figure 9e) uses a leaf-wise tree growth strategy [69]. This approach enables fast training speed and high accuracy for large datasets, while also providing advantages in handling imbalanced data and optimizing memory usage [70]. The optimal model for predicting the compressive strength of oyster shell cementitious composites was determined by systematically comparing the performance of these regression and ensemble-based algorithms.

3.3. Performance Metrics

The predictive performance of oyster shell cementitious composites was evaluated using four statistical indices that include MAE, Mean Squared Error (MSE), RMSE, and the coefficient of determination (R2) [71,72]. For MAE, MSE, and RMSE, values closer to 0 indicate higher predictive accuracy, while for R2, values closer to 1 indicate stronger explanatory power. The calculation formulas are presented below.
MAE measures the average absolute difference between observed and predicted values, reflecting the mean prediction error (Equation (2)).
M A E = 1 n i = 1 n y i y i ^ ,
where n is the number of data points, y i represents the observed value, and y ^ i is the predicted value.
MSE and RMSE evaluate the squared error between observed and predicted values. MSE represents the mean of squared errors (Equation (3)). RMSE is the square root of MSE, indicating the magnitude of average prediction error (Equation (4)).
M S E = 1 n i = 1 n ( y i y i ^ ) 2
R M S E = 1 n i = 1 n ( y i y i ^ ) 2
R2 measures the proportion of variance in observed values explained by the model (Equation (5)).
R 2 = 1 i = 1 n ( y i y i ^ ) 2 i = 1 n ( y i y ¯ ) 2
where n is the number of data points, y i represents the observed value, y ^ i is the predicted value, and y ¯ denotes the mean of the observed values.

4. Results and Discussion

4.1. Algorithm Performance Comparison and Optimal Model Selection

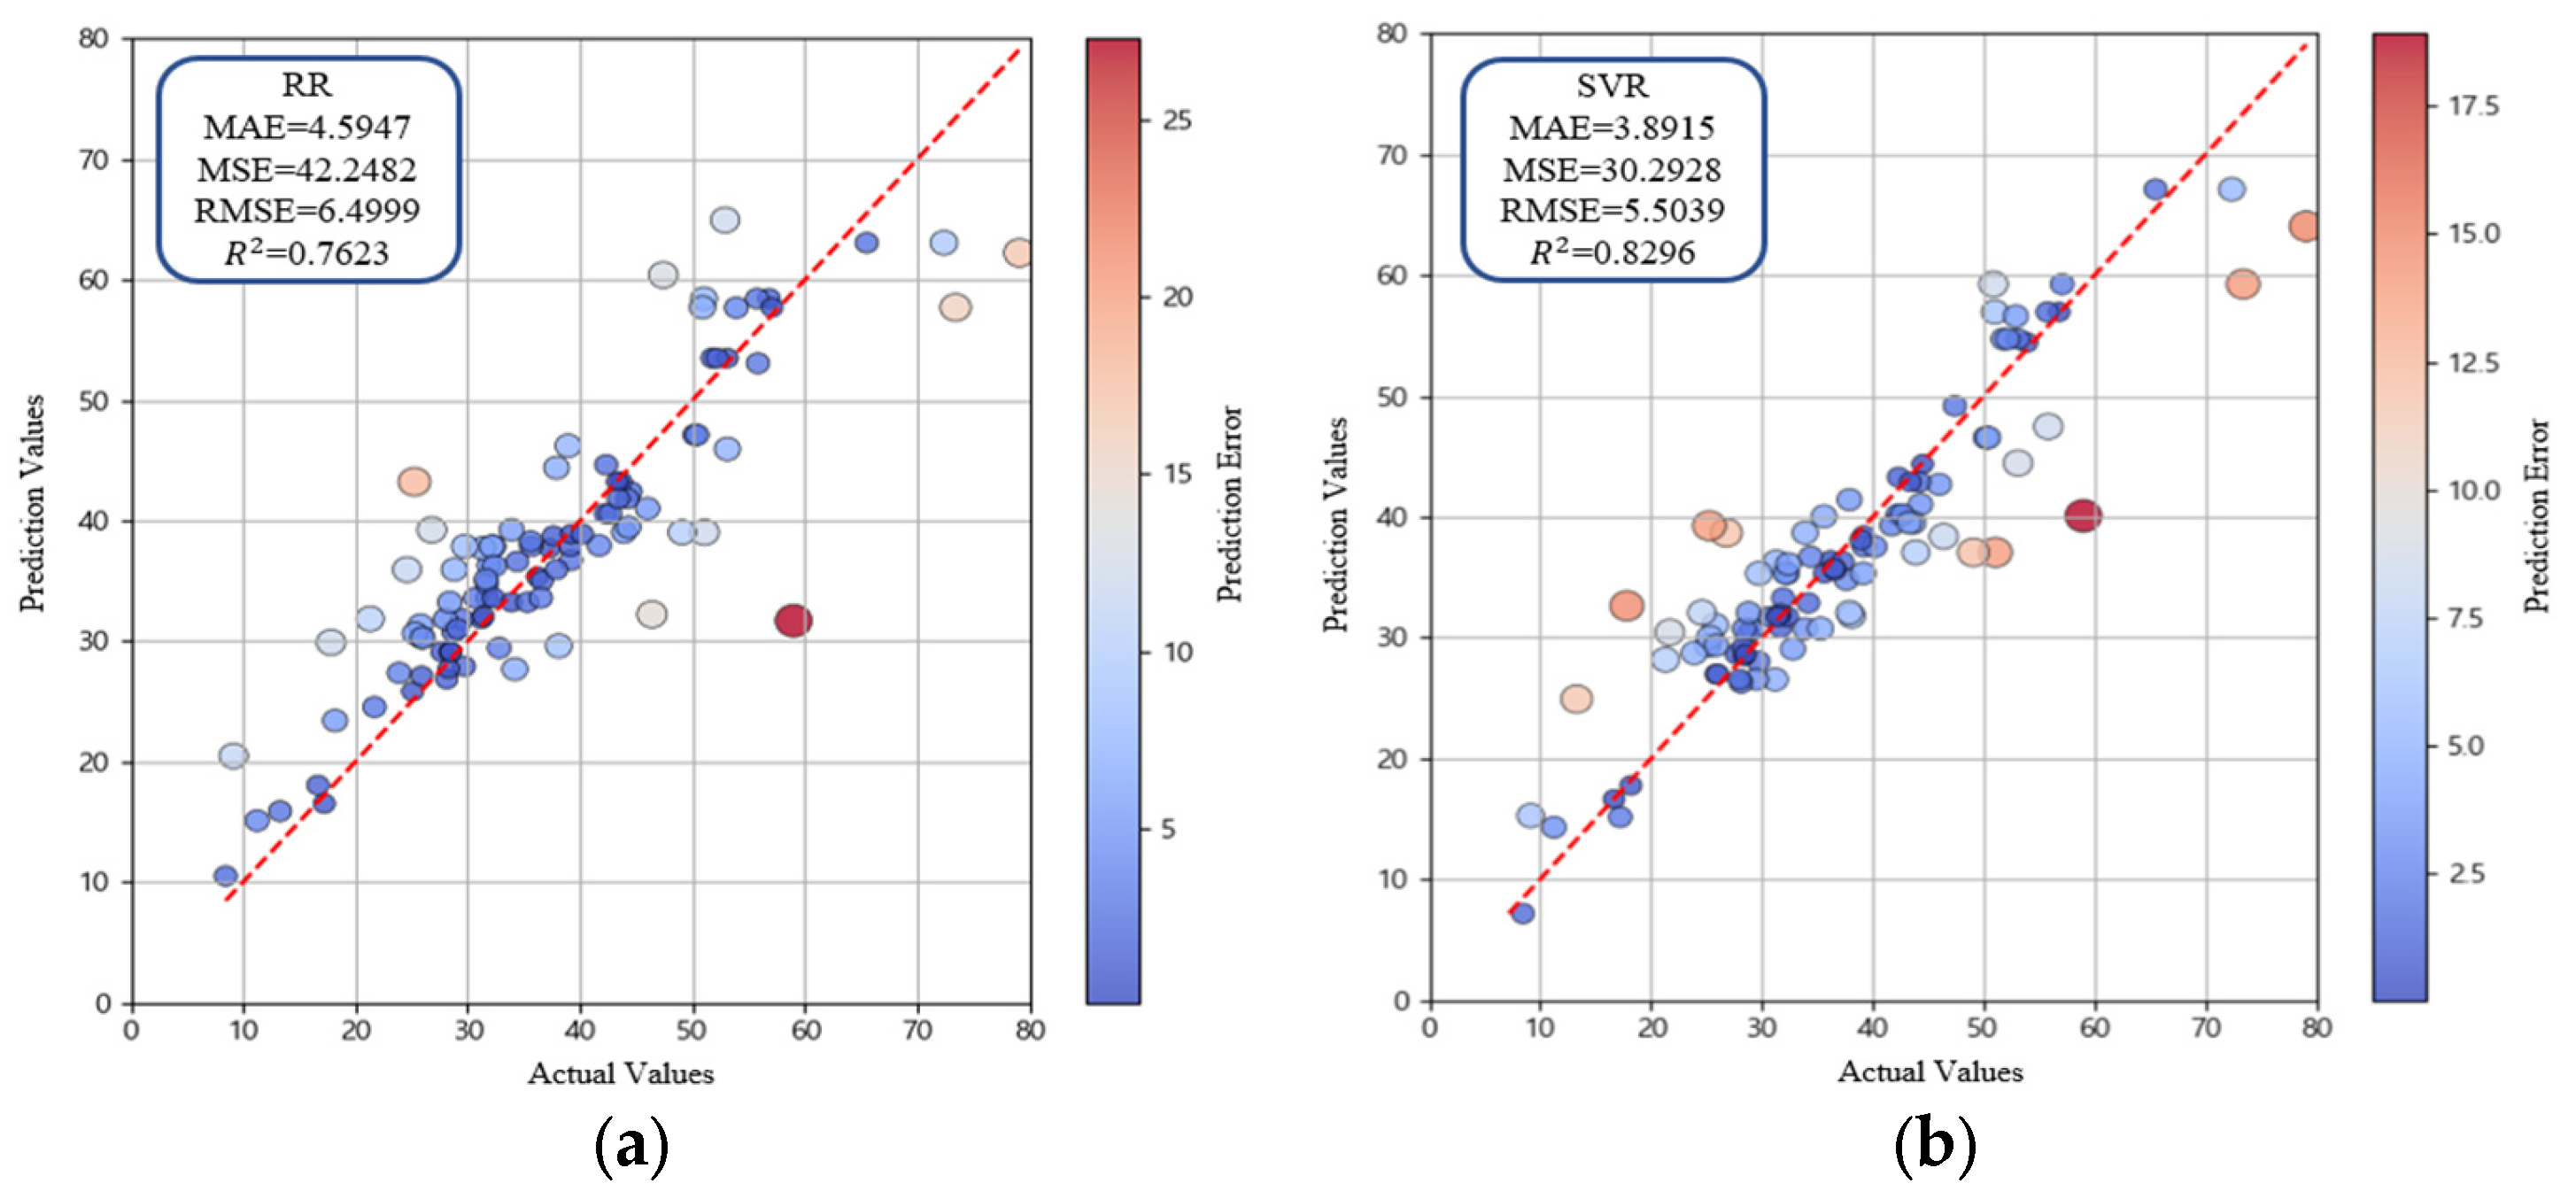
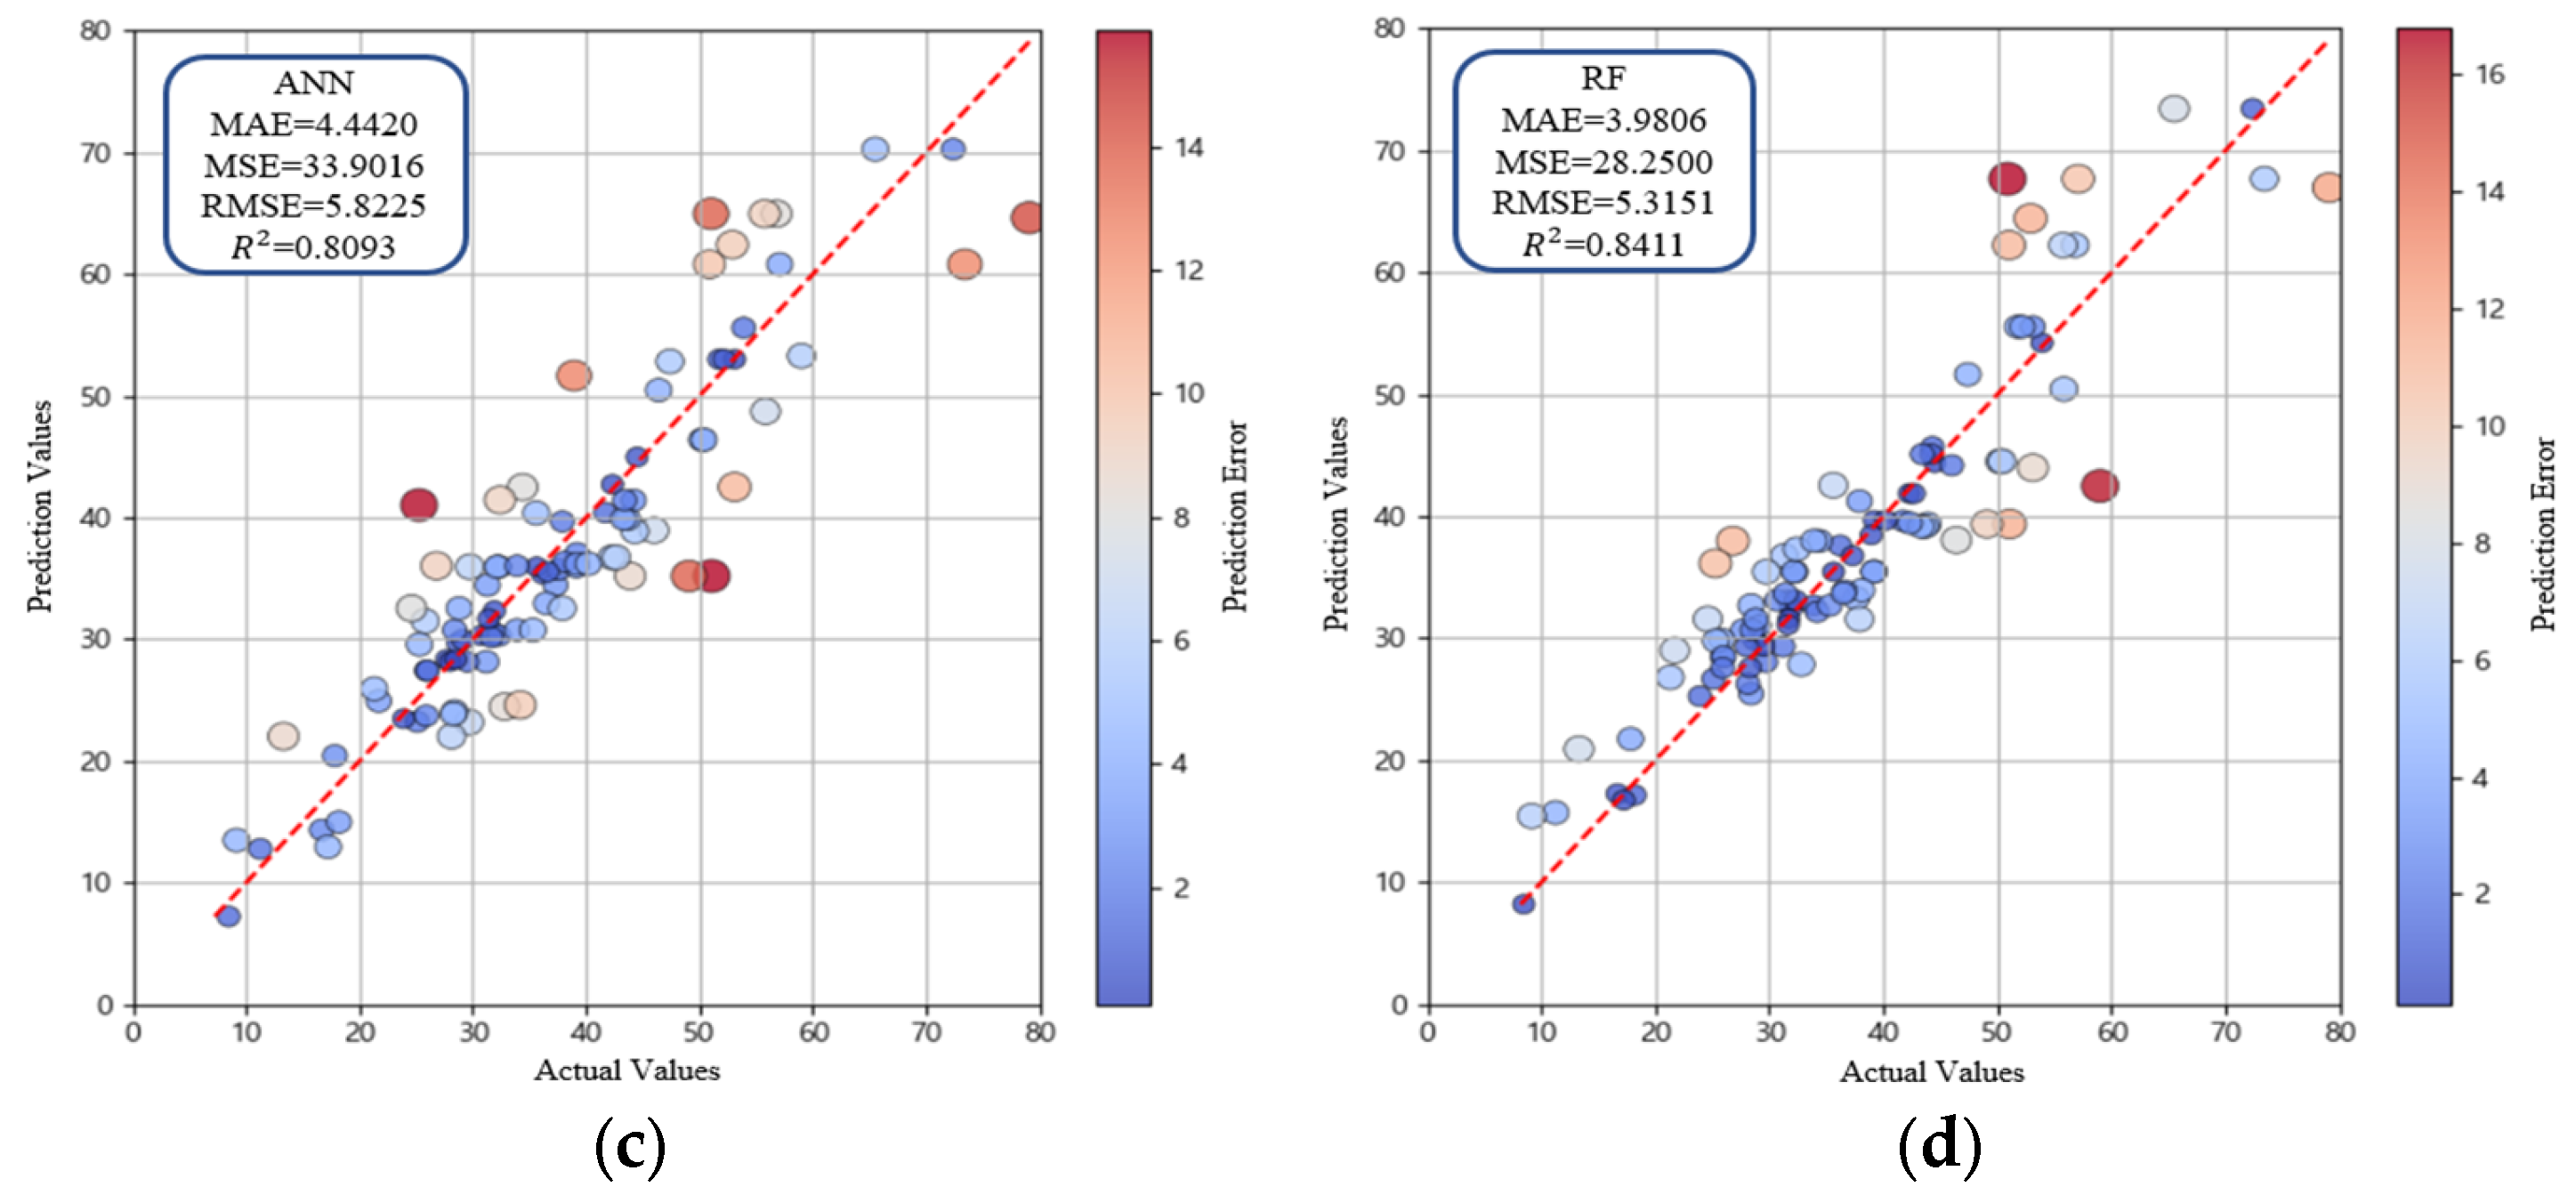
The performances of RR, SVR, ANN, and RF are summarized in Table 3. Among these, RR exhibited the lowest predictive performance. This result can be attributed to linear assumptions of the model, which are insufficient to learn nonlinear relationships in the dataset (Figure 10a). By contrast, SVR effectively handled nonlinear data because of its kernel-based learning approach, achieving more stable performance compared with RR (Table 3, Figure 10b). ANN, despite the multilayer structure designed to capture complex nonlinear interactions, showed lower predictive accuracy than SVR owing to the limited dataset size and inherent structural constraints (Table 3, Figure 10c). In contrast, RF outperformed all other models (Table 3). The ensemble architecture of RF integrates multiple decision trees and effectively compensates for the limitations of individual regression models by modeling nonlinear interactions among variables and reducing variance, thereby achieving higher predictive accuracy than other regression-based models (Figure 10d). Cross validation score consistency confirmed that model performance differences were statistically reliable. Consequently, RF was identified as the most effective base algorithm and further analysis focused on additional ensemble models excluding RF to identify the optimal predictive approach for oyster shell cementitious composites.

4.2. Detailed Analysis of Ensemble Models

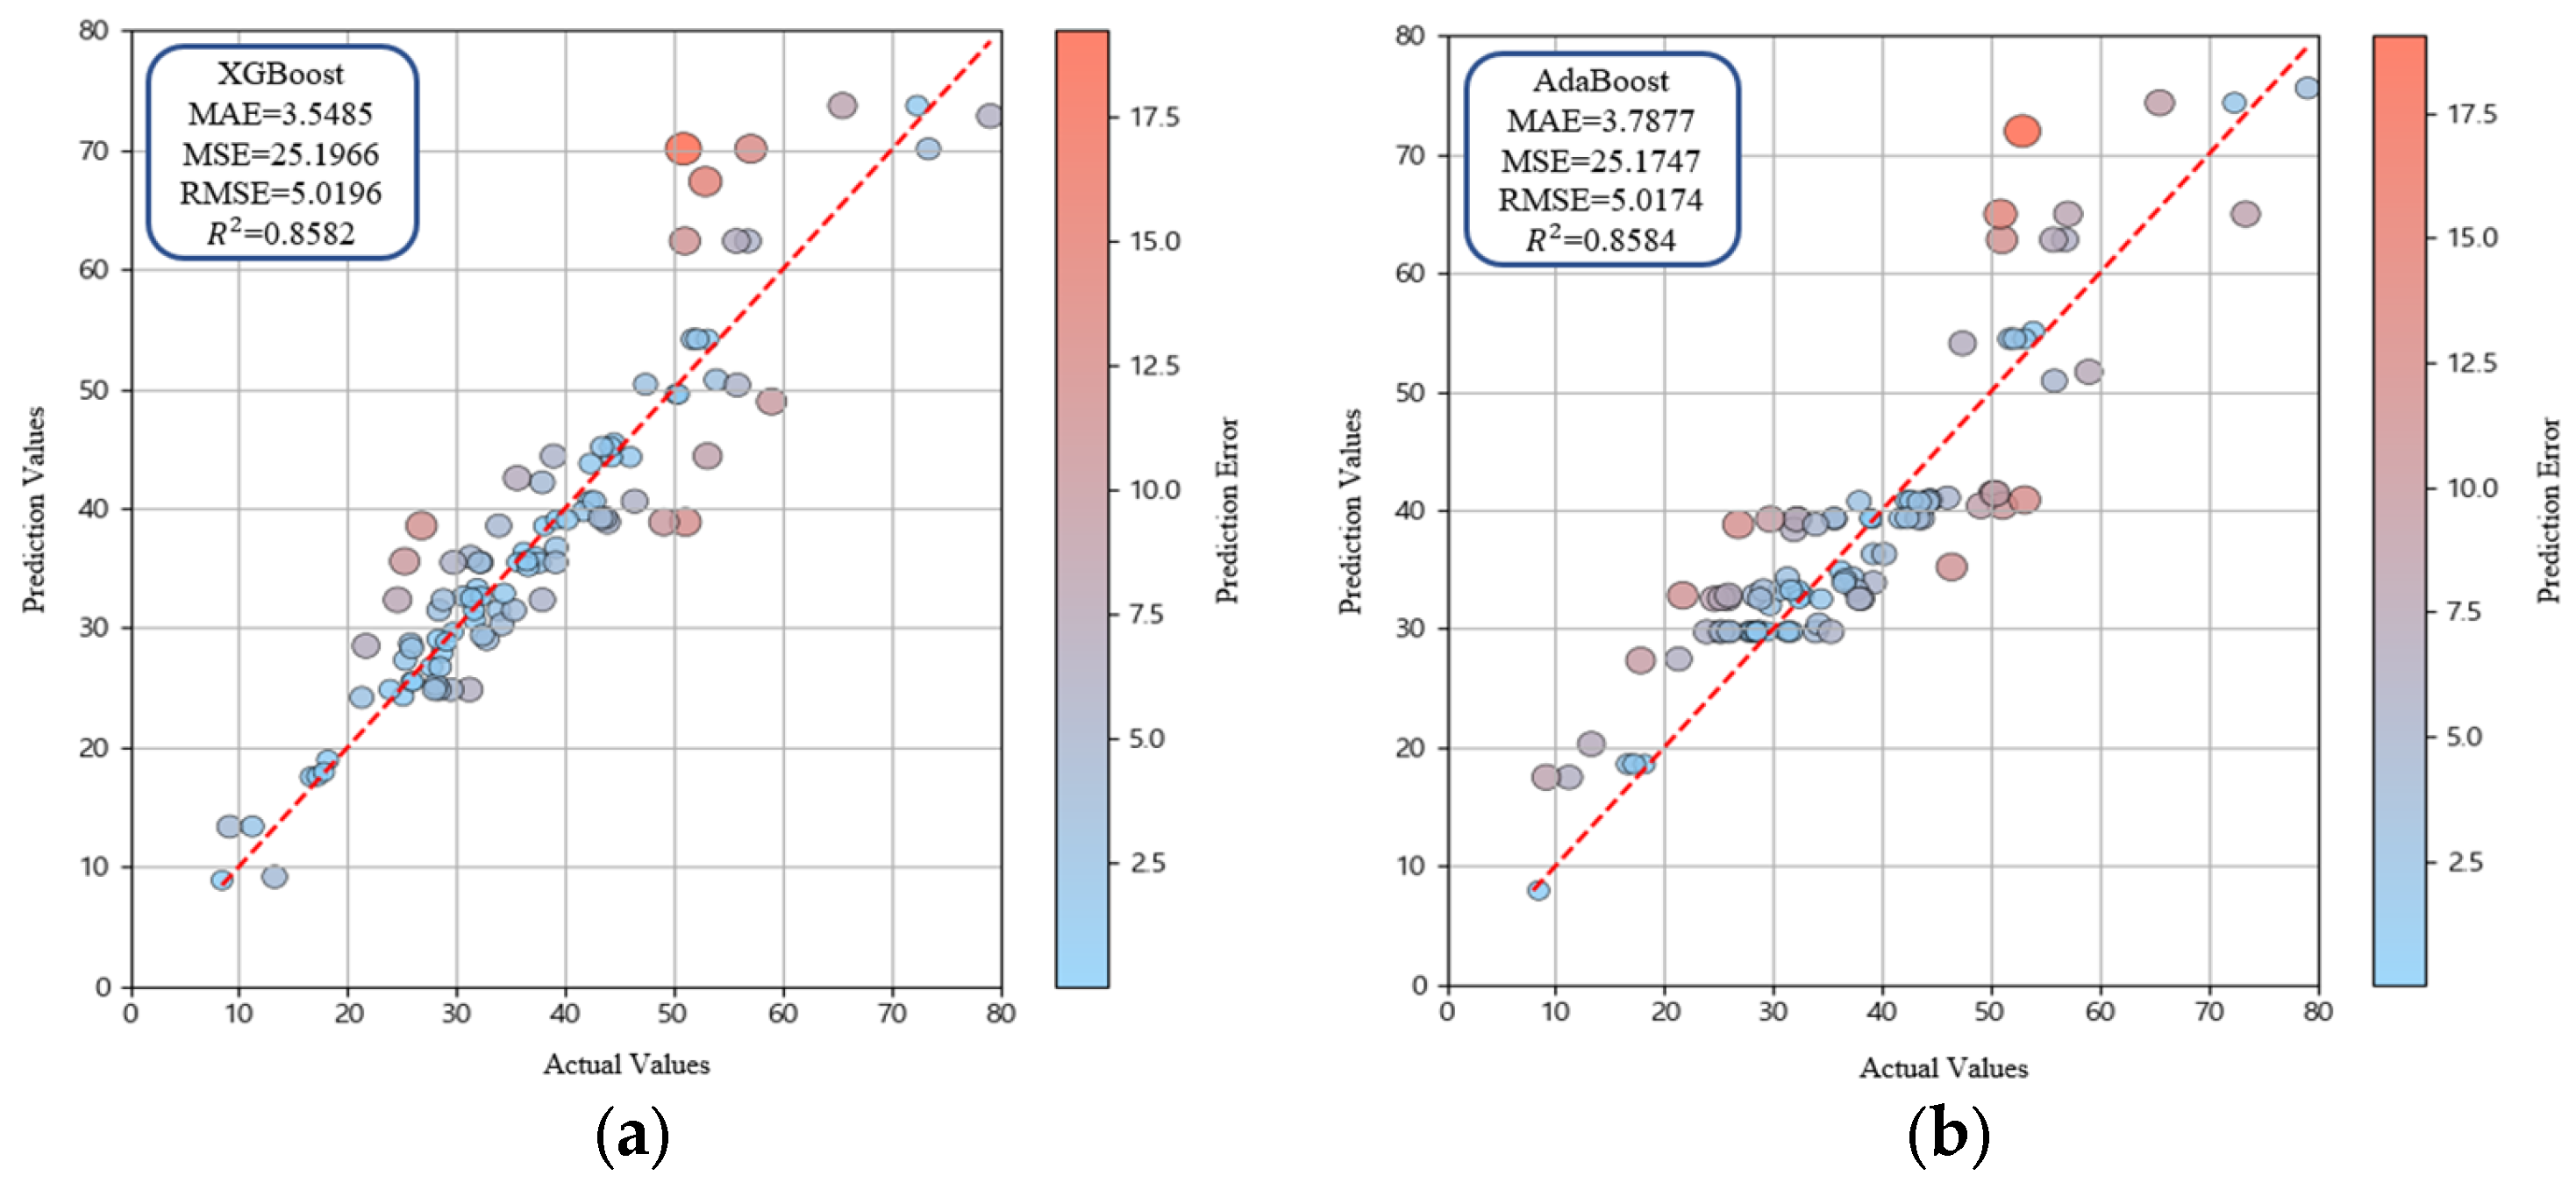
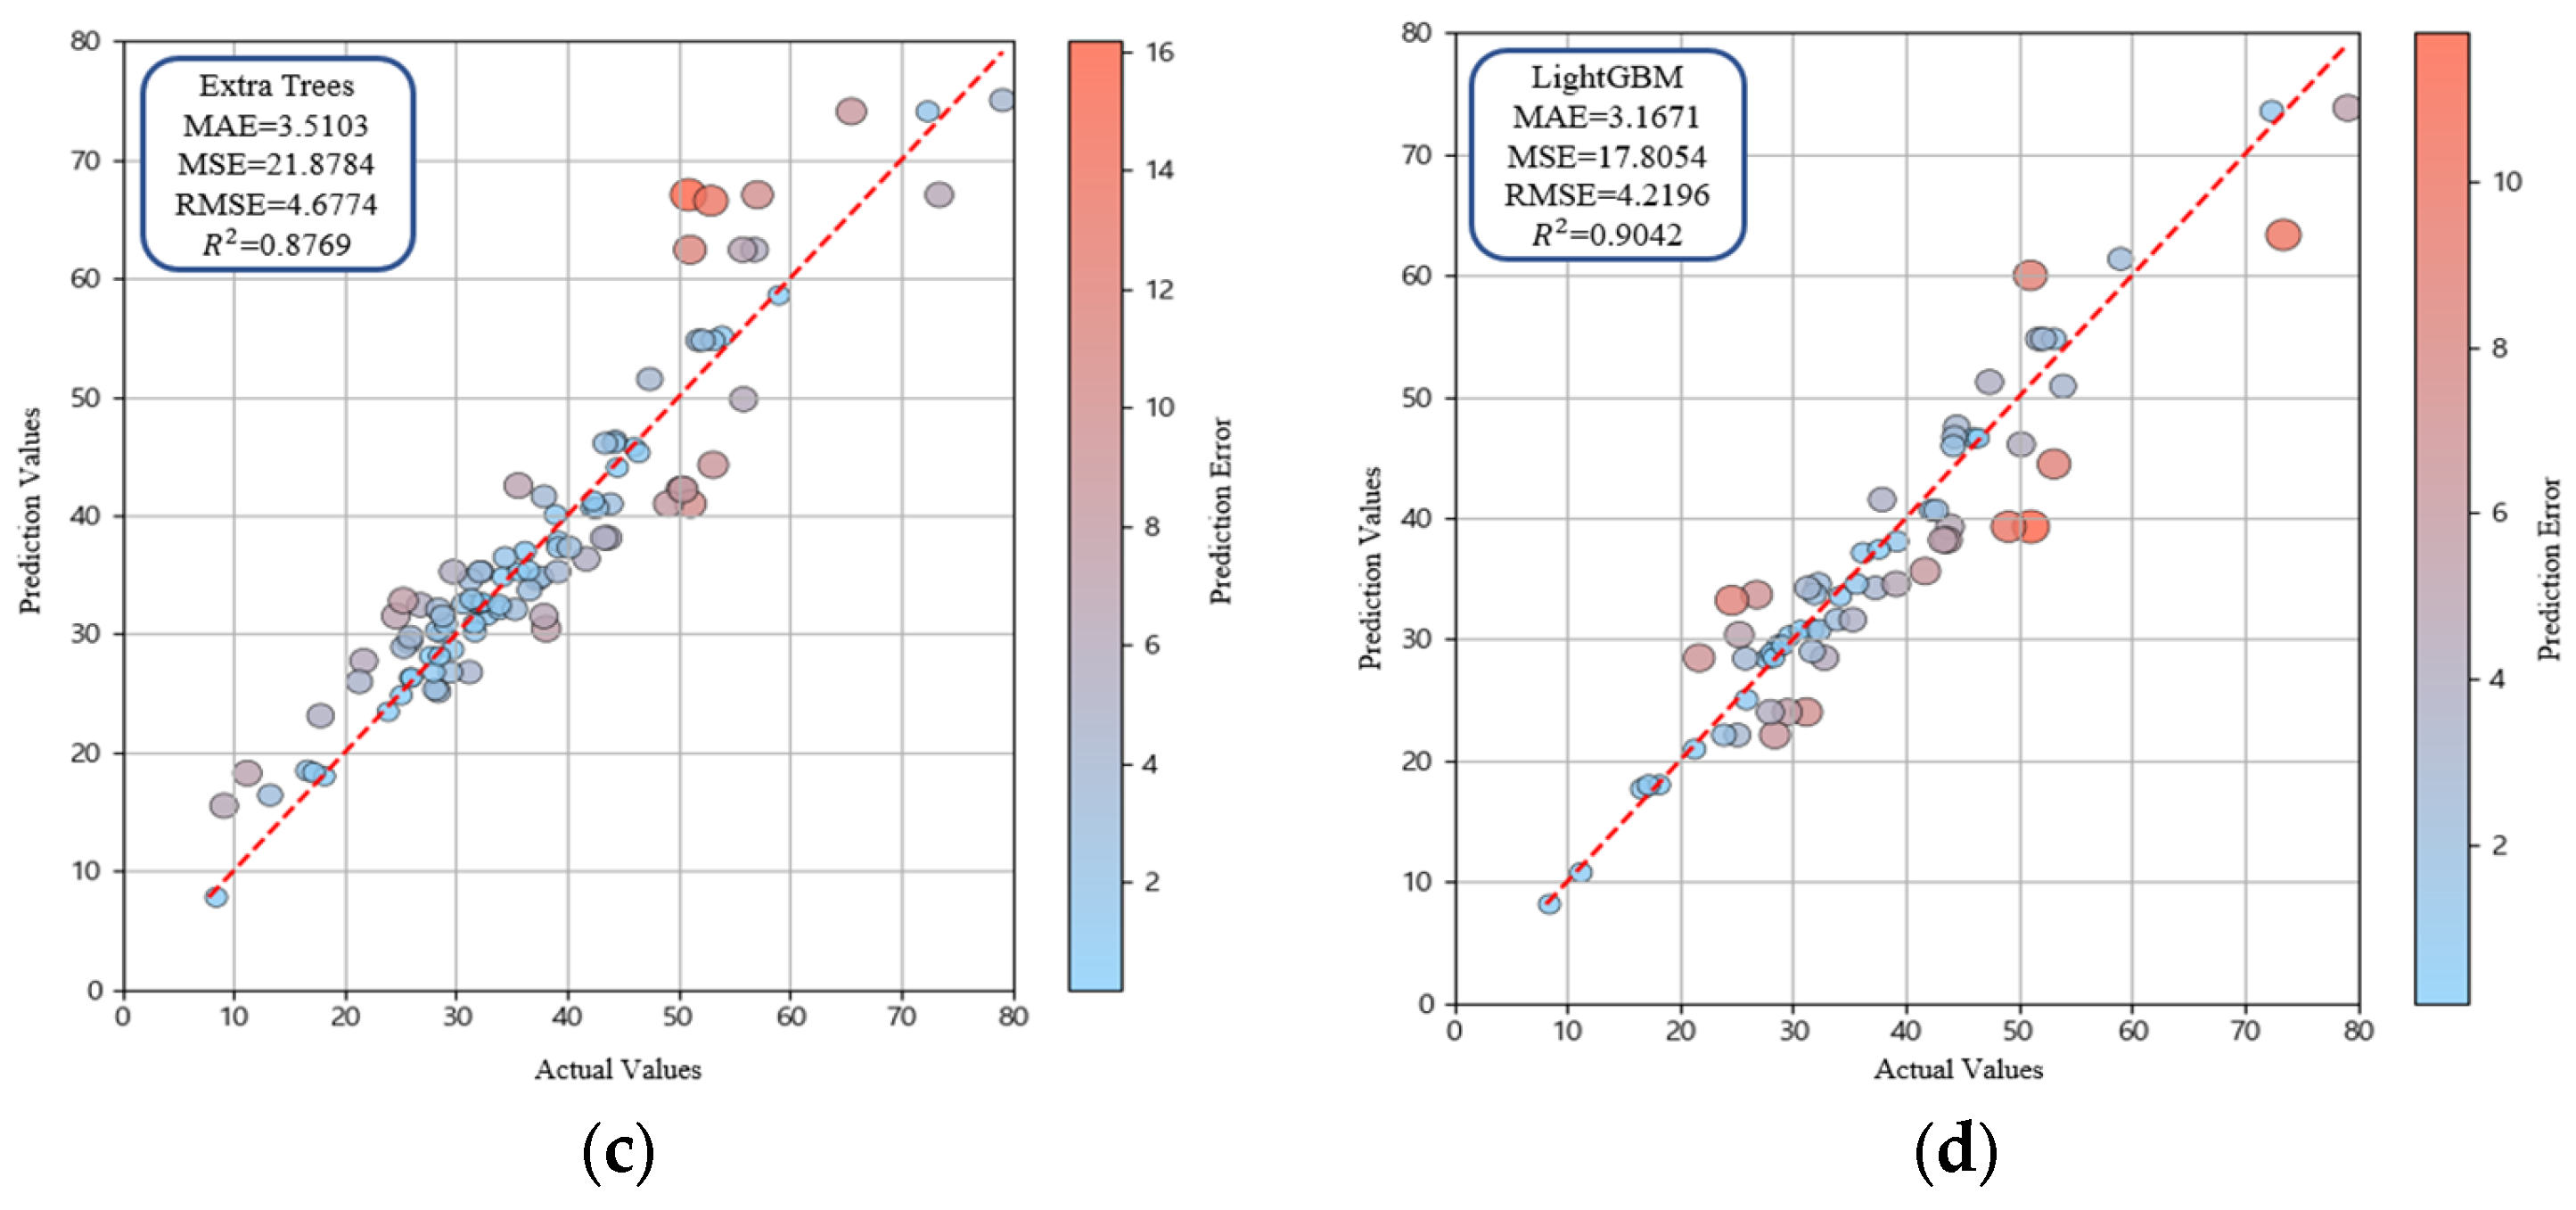
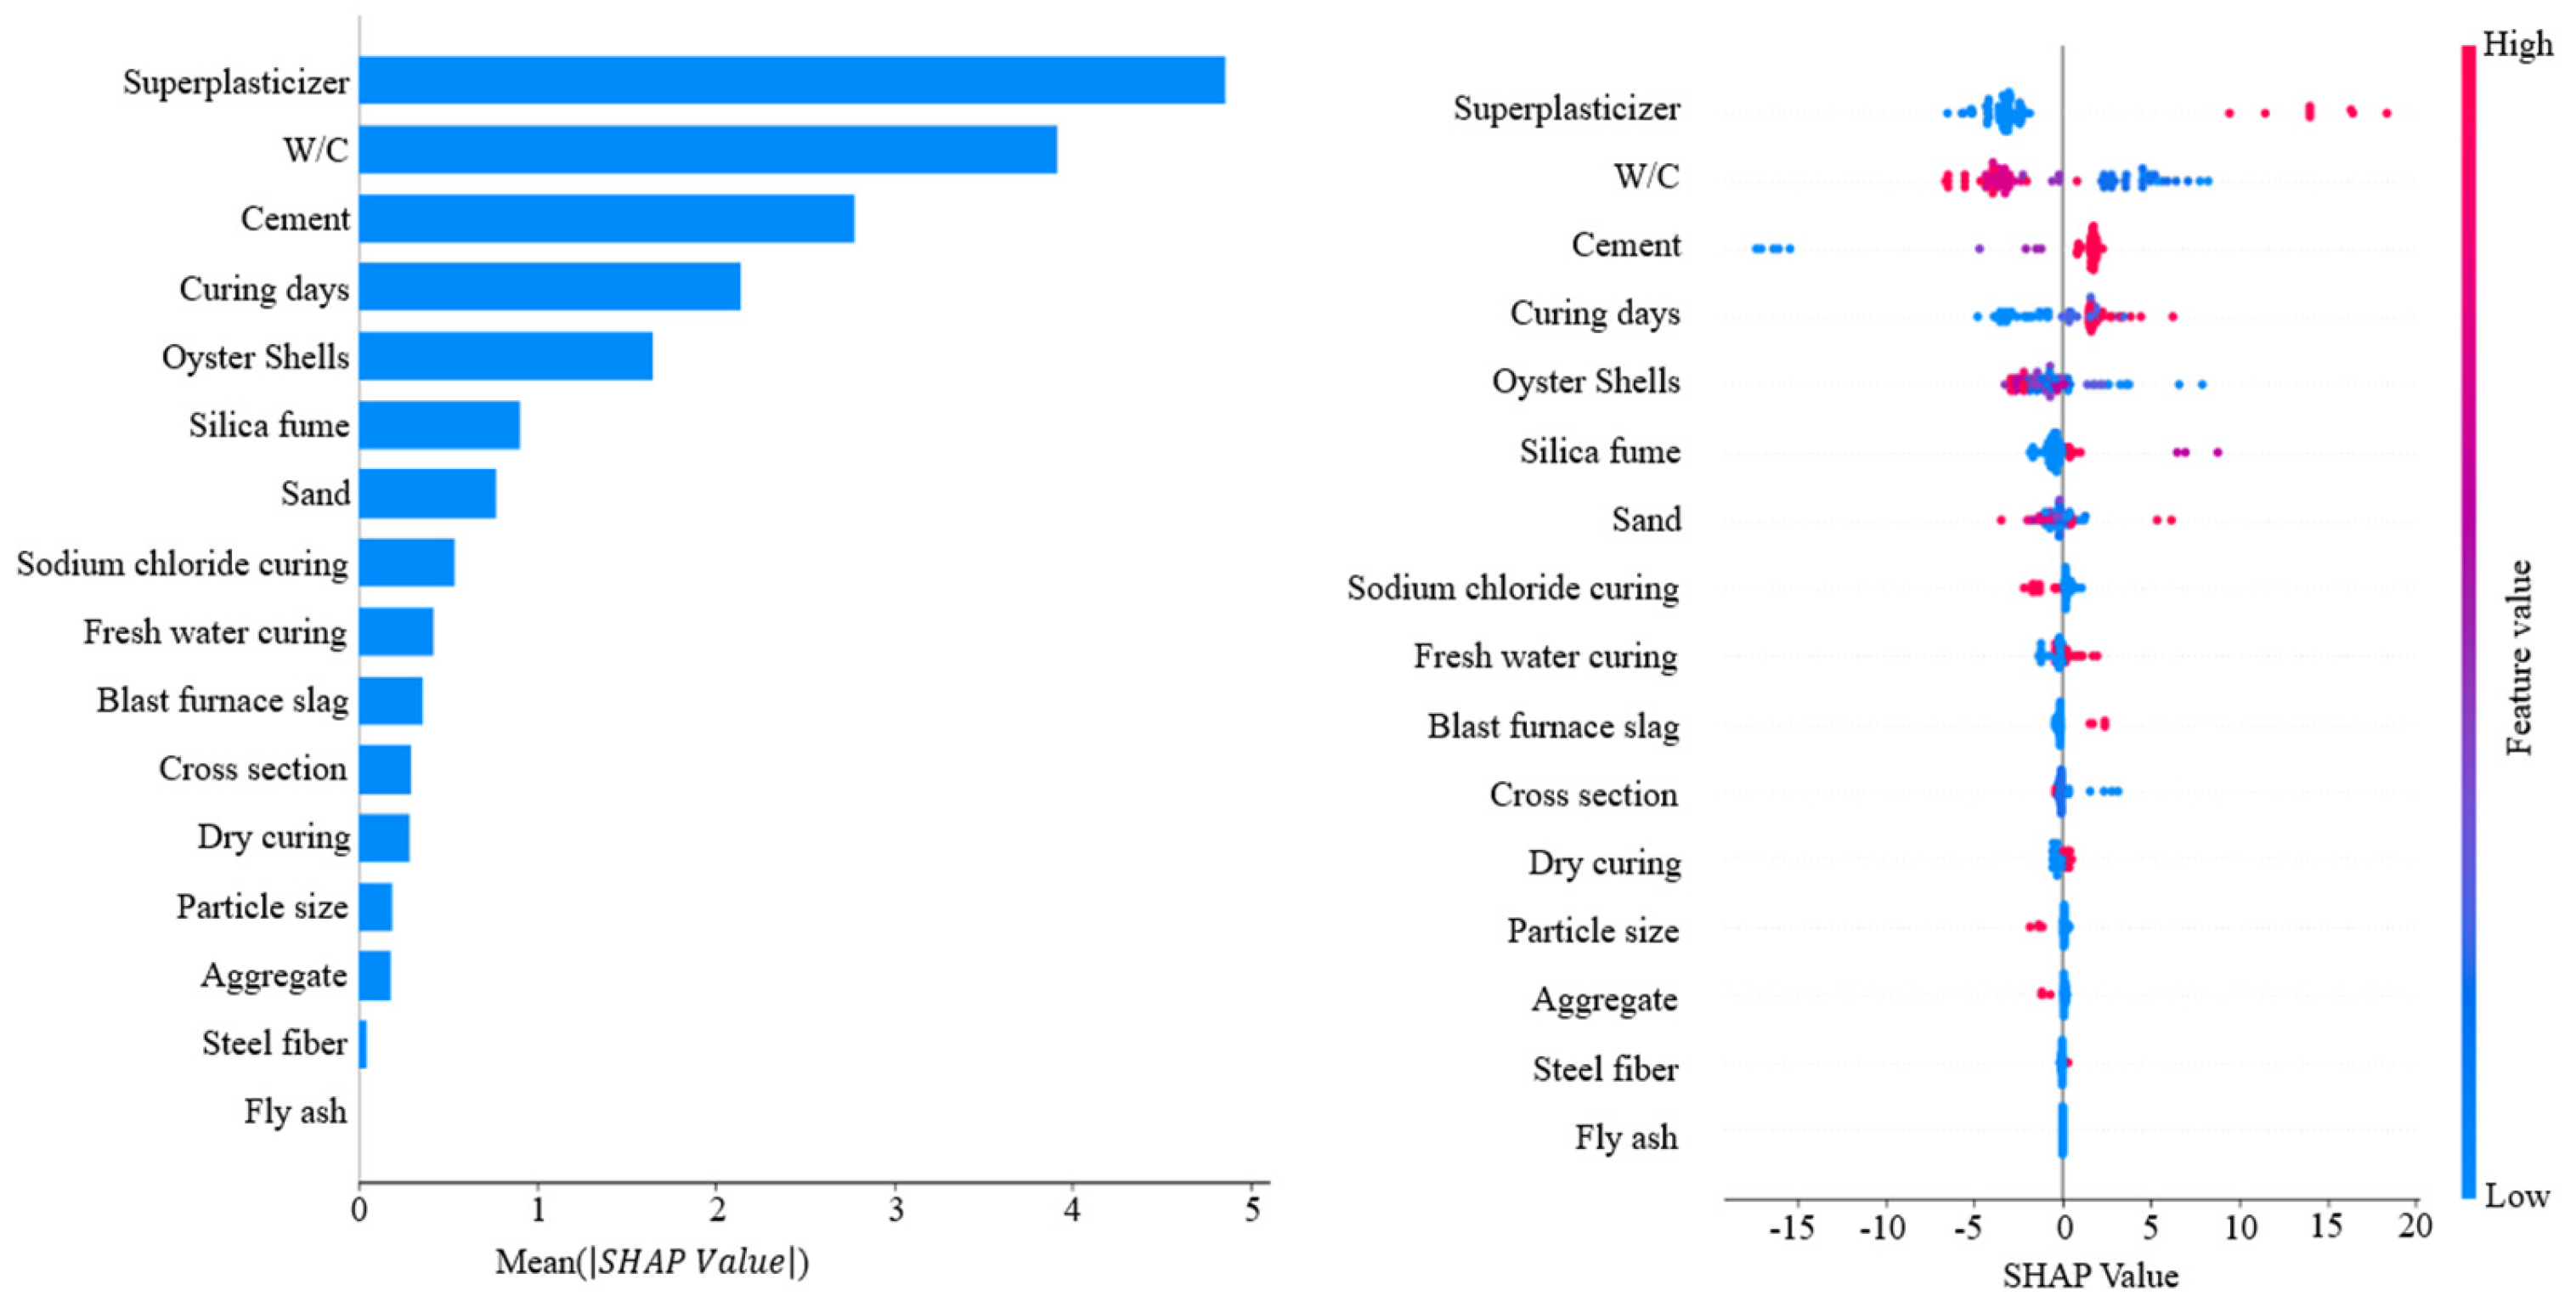
To optimize predictive accuracy, hyperparameter tuning was conducted using GridSearchCV [73,74]. Hyperparameter ranges were selected based on values commonly applied in previous studies and through an initial exploratory tuning phase to identify effective search boundaries. Parameters such as learning rate, maximum tree depth, and the number of estimators were adjusted, and cross-validation was applied to determine the optimal combinations. This process minimized overfitting and maximized model performance, and overfitting was additionally verified by analyzing training and validation loss trends and through assessment of stable performance on an independent test subset. The final hyperparameter settings are presented in Table 4, and the predictive results after tuning are summarized in Table 5. XGBoost improved prediction by iteratively correcting residuals of individual trees, but its performance was relatively lower than that of LightGBM. AdaBoost, which assigns higher weights to misclassified samples during iterative training, showed performance comparable to XGBoost. Extra Trees, which incorporates randomness into both feature selection and data sampling, reduced variance and delivered stable predictions. LightGBM showed superior performance to all other ensemble models (Figure 11). This enhanced performance was attributed not only to the leaf-wise growth strategy but also to efficient histogram-based feature grouping, regularization capability and high computational efficiency, which enhanced the model ability to represent nonlinear patterns in the dataset. Additionally, cross-validation score consistency confirmed that model performance differences were statistically reliable. Finally, SHAP analysis was conducted to quantify the contribution of each input variable and to interpret variable importance (Figure 12). Superplasticizer and W/C exhibited the highest SHAP values, indicating that these variables had a dominant influence on compressive strength prediction. Cement and curing days exhibited relatively high contributions, indicating key variables affecting compressive strength. Oyster shells showed an intermediate contribution and the strong negative correlation with sand confirmed the role of oyster shells as substitute materials. Distribution plots revealed that superplasticizer and cement generally had positive SHAP values, indicating a tendency to increase compressive strength, whereas W/C displayed negative SHAP values, confirming strength reduction at higher ratios. Curing days exhibited positive SHAP values, clearly showing strength improvement with longer curing periods. These results highlight that ensemble models not only predict the compressive strength of oyster shell cementitious composites with high accuracy but also provide interpretable insights into the relative importance and directional influence of input variables [75,76].

5. Conclusions

This study utilized a total of 336 datasets comprising 189 experimental results and 147 data points obtained from literature to predict the compressive strength of oyster shell cementitious composites. The datasets were preprocessed using standardization and one-hot encoding, and input and output variables were established accordingly. Correlations were analyzed through Pearson correlation coefficients and Taylor diagrams. The optimal algorithm was first determined by comparing RR, SVR, and ANN regression models with an ensemble model (RF). Subsequently, additional ensemble models including XGBoost, AdaBoost, Extra Trees, and LightGBM were analyzed to identify the most effective detailed model. Finally, SHAP analysis was performed to interpret the contribution, magnitude and direction of influence of each input variable.
  • Pearson correlation analysis revealed that superplasticizer (0.63) and cement (0.54) exhibited the strongest positive correlations with compressive strength. In contrast, W/C (−0.62), sand (−0.37), and silica fume (−0.15) showed negative correlations. The strongest negative correlation (−0.68) was found between oyster shells and sand, confirming the substitutive relationship between these two materials. These trends were consistent with the Taylor diagram.
  • In the comparison of predictive algorithms, RR showed the lowest performance with R2 = 0.7623. SVR (R2 = 0.8296) and ANN (R2 = 0.8093) partially captured nonlinear patterns, resulting in improved accuracy relative to RR. RF achieved the highest performance among the base models with R2 = 0.8411, showing the effectiveness of the model in reducing variance and mitigating overfitting. Accordingly, ensemble modeling was identified as the most suitable approach.
  • Further ensemble analysis excluded RF and focused on XGBoost, AdaBoost, Extra Trees, and LightGBM. Hyperparameter tuning was performed using GridSearchCV. LightGBM achieved the highest predictive accuracy with MAE = 3.1671, MSE = 17.8056, RMSE = 4.2196, and R2 = 0.9042, confirming the superiority of the LightGBM model among the four models. Extra Trees produced stable performance by reducing variance through randomized splitting criteria, while XGBoost and AdaBoost improved accuracy using boosting techniques but showed lower performance compared with LightGBM. Overall, LightGBM was identified as the optimal detailed model, effectively capturing nonlinear patterns in the data.
  • SHAP analysis confirmed that superplasticizer and W/C were the most influential variables while cement and curing days also contributed significantly. Oyster shells showed moderate influence and could function as a substitute material because negative correlation with sand was observed. Distribution plots indicated that superplasticizer and cement generally had positive SHAP values whereas W/C showed negative SHAP values. Curing days exhibited positive SHAP values, which confirms strength improvement with extended curing. These results indicate that oyster shell cementitious composites can maintain compressive strength and serve as sustainable construction materials when waste oyster shells are incorporated with appropriate admixtures.

Supplementary Materials

The following supporting information can be downloaded at: https://www.mdpi.com/article/10.3390/ma18235314/s1.

Author Contributions

Conceptualization, J.K. and D.K.; methodology, J.K. and D.K.; investigation, W.J. and S.K.; data curation, J.K. and S.K.; writing—original draft preparation, J.K. and W.J.; writing—review and editing, J.K. and H.L.; visualization, J.K. and S.K.; supervision, H.L.; project administration, H.L. All authors have read and agreed to the published version of the manuscript.

Funding

This research was supported by the National Research Foundation of Korea (NRF) grant funded by the Korea government (MSIT) (No. RS-2025-02233037) and the Regional Innovation System & Education (RISE) program through the Gwangju RISE Center, funded by the Ministry of Education (MOE) and the Gwangju Metropolitan City, Republic of Korea (2025-RISE-05-013).

Data Availability Statement

The original contributions presented in the study are included in the article or Supplementary Material, and further inquiries can be directed to the corresponding author.

Conflicts of Interest

The authors declare no conflicts of interest.

Abbreviations

The following abbreviations are used in this manuscript:
W/Cwater-to-cement ratio
SFSilica fume
BFSBlast furnace slag
RRRidge recession
SVRSupport vector regression
ANNArtificial neural network
RFRandom forest
MAEMean Absolute Error
MSEMean Squared Error
RMSERoot Mean Squared Error
XGBoosteXtreme Gradient Boosting
AdaBoostAdaptive Boosting
LightGBMLight Gradient Boosting Machine

References

  1. Yoon, H.; Park, S.; Lee, K.; Park, J. Oyster shell as substitute for aggregate in mortar. Waste Manag. Res. 2004, 22, 158–170. [Google Scholar] [CrossRef]
  2. Kim, J.H.; Yoo, S.H. Public perspective on the environmental impacts of sea sand mining: Evidence from a choice experiment in South Korea. Resour. Policy 2020, 69, 101811. [Google Scholar] [CrossRef]
  3. Jung, U.I.; Kim, B.J. Characteristics of mortar containing oyster shell as fine aggregate. Materials 2022, 15, 7301. [Google Scholar] [CrossRef]
  4. Korea Ministry of Oceans and Fisheries. Reducement of Environmental Pollution Caused by Marine Waste. Press Release. 3 February 2021. Available online: https://www.mof.go.kr (accessed on 15 August 2025).
  5. Government of The Republic of Korea. Marine Waste and Marine Polluted Sediment Management Act (Act No. 18065); Government of The Republic of Korea: Seoul, Republic of Korea, 2021. [Google Scholar]
  6. Kim, M.O.; Lee, M.K. Strength and microstructural changes in cementitious composites containing waste oyster shell powder. Buildings 2023, 13, 3078. [Google Scholar] [CrossRef]
  7. Ruslan, H.N.; Muthusamy, K.; Syed Mohsin, S.M.S.; Jose, R.; Omar, R. Oyster shell waste as a concrete ingredient: A review. Mater. Today Proc. 2022, 48, 713–719. [Google Scholar] [CrossRef]
  8. Kwon, S.J.; Wang, X.Y. A hydration-based integrated model to evaluate properties development and sustainability of oyster shell powder–cement binary composites. Buildings 2024, 14, 1578. [Google Scholar] [CrossRef]
  9. Bellei, P.; Torres, I.; Solstad, R.; Flores-Colen, I. Potential use of oyster shell waste in the composition of construction composites: A review. Buildings 2023, 13, 1546. [Google Scholar] [CrossRef]
  10. Oh, S.E.; Chung, S.Y.; Kim, K.; Han, S.H. Comparative analysis of the effects of waste shell aggregates on the material properties of cement mortars. Constr. Build. Mater. 2024, 412, 134887. [Google Scholar] [CrossRef]
  11. Seo, J.H.; Park, S.M.; Yang, B.J.; Jang, J.G. Calcined oyster shell powder as an expansive additive in cement mortar. Materials 2019, 12, 1322. [Google Scholar] [CrossRef]
  12. Kuo, W.T.; Wang, H.Y.; Shu, C.Y.; Su, D.S. Engineering properties of controlled low-strength materials containing waste oyster shells. Constr. Build. Mater. 2013, 46, 128–133. [Google Scholar] [CrossRef]
  13. Liao, Y.; Wang, X.; Wang, L.; Yin, Z.; Da, B.; Chen, D. Effect of waste oyster shell powder content on properties of cement-metakaolin mortar. Case Stud. Constr. Mater. 2022, 16, e01088. [Google Scholar] [CrossRef]
  14. Chen, D.; Pan, T.; Yu, X.; Liao, Y.; Zhao, H. Properties of hardened mortars containing crushed waste oyster shells. Environ. Eng. Sci. 2019, 36, 1079–1088. [Google Scholar] [CrossRef]
  15. Kim, J.; Cha, I.; Jo, B.; Lee, H. Evaluation of compressive strength of eco-friendly cementitious composites incorporating waste oyster shells under sodium chloride solution exposure. Case Stud. Constr. Mater. 2025, 23, e04944. [Google Scholar] [CrossRef]
  16. Hong, Y.M.; Choudhury, S.R. The substitution effect of the fine aggregate in concrete with oyster shell. Materials 2024, 17, 6148. [Google Scholar] [CrossRef]
  17. Luo, K.; Zhang, M.; Jiang, Q.; Wang, S.; Zhuo, X. Evaluation of using oyster shell as a complete replacement for aggregate to make eco-friendly concrete. J. Build. Eng. 2024, 84, 108587. [Google Scholar] [CrossRef]
  18. Lin, Y.; Ren, Y.; Ge, T.; Al-Ajamee, M.; Xu, Y.; Mohamed, A.A.M.S.; Ma, L.; Zhang, H. Effects of waste oyster shell replacing fine aggregate on the dynamic mechanical characteristics of concrete. Sci. Rep. 2024, 14, 19800. [Google Scholar] [CrossRef]
  19. Cha, I.; Kim, J.; Lee, H. Enhancing compressive strength in cementitious composites through effective use of wasted oyster shells and admixtures. Buildings 2023, 13, 2787. [Google Scholar] [CrossRef]
  20. Yang, E.I.; Kim, M.Y.; Park, H.G.; Yi, S.T. Effect of partial replacement of sand with dry oyster shell on the long-term performance of concrete. Constr. Build. Mater. 2010, 24, 758–765. [Google Scholar] [CrossRef]
  21. Yoon, G.L.; Kim, B.T.; Kim, B.O.; Han, S.H. Chemical–mechanical characteristics of crushed oyster-shell. Waste Manag. 2003, 23, 825–834. [Google Scholar] [CrossRef]
  22. Altuncı, Y.T. A comprehensive study on the estimation of concrete compressive strength using machine learning models. Buildings 2024, 14, 3851. [Google Scholar] [CrossRef]
  23. Baghabra Al-Amoudi, O.S.B.; Al-Kutti, W.A.; Ahmad, S.; Maslehuddin, M. Correlation between compressive strength and certain durability indices of plain and blended cement concretes. Cem. Concr. Compos. 2009, 31, 672–676. [Google Scholar] [CrossRef]
  24. Marchewka, A.; Ziolkowski, P.; García Galán, S. Real-time prediction of early concrete compressive strength using AI and hydration monitoring. Sci. Rep. 2025, 15, 15463. [Google Scholar] [CrossRef] [PubMed]
  25. Sah, A.K.; Hong, Y.M. Performance comparison of machine learning models for concrete compressive strength prediction. Materials 2024, 17, 2075. [Google Scholar] [CrossRef] [PubMed]
  26. Shaaban, M.; Amin, M.; Selim, S.; Riad, I.M. Machine learning approaches for forecasting compressive strength of high-strength concrete. Sci. Rep. 2025, 15, 25567. [Google Scholar] [CrossRef] [PubMed]
  27. Mustapha, I.B.; Abdulkareem, M.; Jassam, T.M.; AlAteah, A.H.; Al-Sodani, K.A.A.; Al-Tholaia, M.M.H.; Nabus, H.; Alih, S.C.; Abdulkareem, Z.; Ganiyu, A. Comparative analysis of gradient-boosting ensembles for estimation of compressive strength of quaternary blend concrete. Int. J. Concr. Struct. Mater. 2024, 18, 20. [Google Scholar] [CrossRef]
  28. Qing, S.; Li, C. Data-driven prediction on critical mechanical properties of engineered cementitious composites based on machine learning. Sci. Rep. 2024, 14, 15322. [Google Scholar] [CrossRef]
  29. Uddin, M.N.; Shanmugasundaram, N.; Praveenkumar, S.; Li, L.Z. Prediction of compressive strength and tensile strain of engineered cementitious composite using machine learning. Int. J. Mech. Mater. Des. 2024, 20, 671–716. [Google Scholar] [CrossRef]
  30. Al-Shamasneh, A.R.; Mahmoodzadeh, A.; Karim, F.K.; Saidani, T.; Alghamdi, A.; Alnahas, J.; Sulaiman, M. Application of machine learning techniques to predict the compressive strength of steel fiber reinforced concrete. Sci. Rep. 2025, 15, 30674. [Google Scholar] [CrossRef]
  31. Sobuz, M.H.R.; Aditto, F.S.; Datta, S.D.; Kabbo, M.K.I.; Jabin, J.A.; Hasan, N.M.S.; Khan, M.M.H.; Rahman, S.M.A.; Raazi, M.; Zaman, A.A.U. High-strength self-compacting concrete production incorporating supplementary cementitious materials: Experimental evaluations and machine learning modelling. Int. J. Concr. Struct. Mater. 2024, 18, 67. [Google Scholar] [CrossRef]
  32. Singh, R.; Tipu, R.K.; Mir, A.A.; Patel, M. Predictive modelling of flexural strength in recycled aggregate-based concrete: A comprehensive approach with machine learning and global sensitivity analysis. Iran. J. Sci. Technol. Trans. Civ. Eng. 2024, 49, 1089–1114. [Google Scholar] [CrossRef]
  33. Haruna, S.I.; Zhu, H.; Ibrahim, Y.E.; Yang, J.; Farouk, A.I.B.; Shao, J.; Adamu, M.; Ahmed, O.S. Sustainable polyurethane-based polymer concrete: Mechanical and non-destructive properties with machine learning technique. Int. J. Concr. Struct. Mater. 2025, 19, 62. [Google Scholar] [CrossRef]
  34. Han, S.; Heo, T.; Yeum, C.M.; Kim, K.; Choi, J.; Tia, M. Machine learning approach to rapidly evaluate curling of concrete pavement. Int. J. Concr. Struct. Mater. 2024, 18, 71. [Google Scholar] [CrossRef]
  35. Lai, B.L.; Bao, R.L.; Zheng, X.F.; Vasdravellis, G.; Mensinger, M. Machine-learning assisted analysis on the seismic performance of steel reinforced concrete composite columns. Structures 2024, 68, 107065. [Google Scholar] [CrossRef]
  36. Megahed, K.; Mahmoud, N.S.; Abd-Rabou, S.E.M. Application of machine learning models in the capacity prediction of RCFST columns. Sci. Rep. 2023, 13, 20878. [Google Scholar] [CrossRef] [PubMed]
  37. Ma, C.; Cao, J.; Pan, K.; Zeng, J.J. Prediction of shear capacity of RC columns and discussion on shear contribution via the explainable machine learning. Structures 2024, 69, 107562. [Google Scholar] [CrossRef]
  38. Cui, R.; Yang, H.; Li, J.; Xiao, Y.; Yao, G.; Yu, Y. Machine learning-based prediction of compressive strength in circular FRP-confined concrete columns. Front. Mater. 2024, 11, 1408670. [Google Scholar] [CrossRef]
  39. Yeh, I.C. Modeling of strength of high-performance concrete using artificial neural networks. Cem. Concr. Res. 1998, 28, 1797–1808. [Google Scholar] [CrossRef]
  40. DeRousseau, M.A.; Laftchiev, E.; Kasprzyk, J.R.; Rajagopalan, B.; Srubar, W.V., III. A comparison of machine learning methods for predicting the compressive strength of field-placed concrete. Constr. Build. Mater. 2019, 228, 116661. [Google Scholar] [CrossRef]
  41. Jia, J.F.; Chen, X.Z.; Bai, Y.L.; Li, Y.L.; Wang, Z.H. An interpretable ensemble learning method to predict the compressive strength of concrete. In Structures; Elsevier: Amsterdam, The Netherlands, 2022; Volume 46, pp. 201–213. [Google Scholar] [CrossRef]
  42. Nguyen-Sy, T.; Wakim, J.; To, Q.D.; Vu, M.N.; Nguyen, T.D.; Nguyen, T.T. Predicting the compressive strength of concrete from its compositions and age using the extreme gradient boosting method. Constr. Build. Mater. 2020, 260, 119757. [Google Scholar] [CrossRef]
  43. Yu, Y.; Li, W.; Li, J.; Nguyen, T.N. A novel optimised self-learning method for compressive strength prediction of high performance concrete. Constr. Build. Mater. 2018, 184, 229–247. [Google Scholar] [CrossRef]
  44. Feng, D.C.; Liu, Z.T.; Wang, X.D.; Chen, Y.; Chang, J.Q.; Wei, D.F.; Jiang, Z.M. Machine learning-based compressive strength prediction for concrete: An adaptive boosting approach. Constr. Build. Mater. 2020, 230, 117000. [Google Scholar] [CrossRef]
  45. Inqiad, W.B.; Siddique, M.S.; Alarifi, S.S.; Butt, M.J.; Najeh, T.; Gamil, Y. Comparative analysis of various machine learning algorithms to predict 28-day compressive strength of Self-compacting concrete. Heliyon 2023, 9, e22036. [Google Scholar] [CrossRef] [PubMed]
  46. Wang, M.; Kang, J.; Liu, W.; Su, J.; Li, M. Research on prediction of compressive strength of fly ash and slag mixed concrete based on machine learning. PLoS ONE 2022, 17, e0279293. [Google Scholar] [CrossRef] [PubMed]
  47. Wang, W.; Zhong, Y.; Liao, G.; Ding, Q.; Zhang, T.; Li, X. Prediction of compressive strength of concrete specimens based on interpretable machine learning. Materials 2024, 17, 3661. [Google Scholar] [CrossRef] [PubMed]
  48. Abdelsattar, D.M.; Owais, M.; Fahmy, M.F.M.; Osman, R.; Nafadi, M.K. Optimizing pozzolanic concrete mixtures using machine learning and global sensitivity analysis techniques. Int. J. Concr. Struct. Mater. 2025, 19, 77. [Google Scholar] [CrossRef]
  49. Saeheaw, T. Interpretable machine learning framework for non-destructive concrete strength prediction with physics-consistent feature analysis. Buildings 2025, 15, 2601. [Google Scholar] [CrossRef]
  50. Gazi, M.U.; Hasan, M.T.; Debnath, P. Few-shot meta-learning for concrete strength prediction: A model-agnostic approach with SHAP analysis. AI Civ. Eng. 2025, 4, 20. [Google Scholar] [CrossRef]
  51. Vargas, J.F.; Oviedo, A.I.; Ortega, N.A.; Orozco, E.; Gómez, A.; Londoño, J.M. Machine-learning-based predictive models for compressive strength, flexural strength, and slump of concrete. Appl. Sci. 2024, 14, 4426. [Google Scholar] [CrossRef]
  52. ASTM A820/A820M-22; Standard Specification for Steel Fibers for Fiber-Reinforced. Concrete Communications; ASTM International: West Conshohocken, PA, USA, 2021.
  53. ASTM C989; Standard Specification for Slag Cement for Use in Concrete and Mortars. Annual Book of ASTM Standards; ASTM International: West Conshohocken, PA, USA, 2019.
  54. ASTM C1240-20; Standard Specification for Silica Fume Used in Cementitious Mixtures. ASTM International: West Conshohocken, PA, USA, 2020.
  55. ASTM C494; Standard Specification for Chemical Admixtures for Concrete. ASTM International: West Conshohocken, PA, USA, 2019.
  56. ASTM C109; Standard Test Method for Compressive Strength of Hydraulic Cement Mortars (Using 2-In, or [50-mm] Cube Specimens). Annual Book of ASTM Standards; ASTM International: West Conshohocken, PA, USA, 2016.
  57. Liao, Y.; Shi, H.; Zhang, S.; Da, B.; Chen, D. Particle size effect of oyster shell on mortar: Experimental investigation and modeling. Materials 2021, 14, 6813. [Google Scholar] [CrossRef]
  58. Chen, D.; Zhang, P.; Pan, T.; Liao, Y.; Zhao, H. Evaluation of the eco-friendly crushed waste oyster shell mortars containing supplementary cementitious materials. J. Clean. Prod. 2019, 237, 117811. [Google Scholar] [CrossRef]
  59. Pinto Dabés Guimarães, A.C.; Nouailletas, O.; Perlot, C.; Grégoire, D. Granular skeleton optimisation and the influence of the cement paste content in bio-based oyster shell mortar with 100% aggregate replacement. Sustainability 2024, 16, 2297. [Google Scholar] [CrossRef]
  60. Yehia, S.A.; Fayed, S.; Zakaria, M.H.; Shahin, R.I. Prediction of RC T-Beams Shear Strength based on machine learning. Int. J. Concr. Struct. Mater. 2024, 18, 52. [Google Scholar] [CrossRef]
  61. Tran, N.; Van Tran, M.; Tran, P.; Nguyen, A.K.; Nguyen, C.Q. Eco-friendly 3D-printed concrete using steel slag aggregate: Buildability, printability and mechanical properties. Int. J. Concr. Struct. Mater. 2024, 18, 66. [Google Scholar] [CrossRef]
  62. Zalhaf, N.M. Application of artificial neural network for prediction of concrete–high-performance concrete interfacial bond strength after exposure to elevated temperature. Int. J. Concr. Struct. Mater. 2025, 19, 31. [Google Scholar] [CrossRef]
  63. Hoerl, A.E.; Kennard, R.W. Ridge regression: Biased estimation for nonorthogonal problems. Technometrics 1970, 12, 55–67. [Google Scholar] [CrossRef]
  64. Smola, A.J.; Schölkopf, B. A tutorial on support vector regression. Stat. Comput. 2004, 14, 199–222. [Google Scholar] [CrossRef]
  65. Adeli, H. Neural networks in civil engineering: 1989–2000. Comput. Aid. Civ. Infrastruct. Eng. 2001, 16, 126–142. [Google Scholar] [CrossRef]
  66. Breiman, L. Random forests. Mach. Learn. 2001, 45, 5–32. [Google Scholar] [CrossRef]
  67. Bentéjac, C.; Csörgő, A.; Martínez-Muñoz, G. A comparative analysis of gradient boosting algorithms. Artif. Intell. Rev. 2021, 54, 1937–1967. [Google Scholar] [CrossRef]
  68. Cao, Y.; Miao, Q.G.; Liu, J.C.; Gao, L. Advance and prospects of AdaBoost algorithm. Acta Autom. Sin. 2013, 39, 745–758. [Google Scholar] [CrossRef]
  69. Geurts, P.; Ernst, D.; Wehenkel, L. Extremely randomized trees. Mach. Learn. 2006, 63, 3–42. [Google Scholar] [CrossRef]
  70. Zhang, J.; Mucs, D.; Norinder, U.; Svensson, F. LightGBM: An effective and scalable algorithm for prediction of chemical toxicity–application to the Tox21 and mutagenicity data sets. J. Chem. Inf. Model. 2019, 59, 4150–4158. [Google Scholar] [CrossRef] [PubMed]
  71. Yan, H.J.; Xie, N. Optimized machine learning algorithms for predicting the punching shear resistance of flat slabs with transverse reinforcement. Int. J. Concr. Struct. Mater. 2024, 18, 76. [Google Scholar] [CrossRef]
  72. Yoon, J.; Yonis, A.; Park, S.; Rajabipour, F.; Pyo, S. Prediction of the R 3 test-based reactivity of supplementary cementitious materials: A machine learning approach utilizing physical and chemical properties. Int. J. Concr. Struct. Mater. 2024, 18, 75. [Google Scholar] [CrossRef]
  73. Kim, J.; Lee, D. Comparative study on hyperparameter tuning for predicting concrete compressive strength. Buildings 2025, 15, 2173. [Google Scholar] [CrossRef]
  74. Ghafari, S.; Nejad, F.M.; Sheikh-Akbari, A.; Kazemi, H. Automating the determination of low-temperature fracture resistance curves of normal and rubberized asphalt concrete in single-edge notched beam tests using convolutional neural networks. Constr. Build. Mater. 2024, 428, 136376. [Google Scholar] [CrossRef]
  75. Park, W.Y.; Moon, J. Machine learning based reactivity prediction of fly ash type F produced from South Korea. Int. J. Concr. Struct. Mater. 2023, 17, 58. [Google Scholar] [CrossRef]
  76. Al Adnan, M.; Babur, M.; Farooq, F.; Shahid, M.; Ahmed, Z.; Das, P. Prediction of split tensile strength of fiber-reinforced recycled aggregate concrete utilizing machine learning models with SHAP analysis. Hybrid Adv. 2025, 11, 100507. [Google Scholar] [CrossRef]
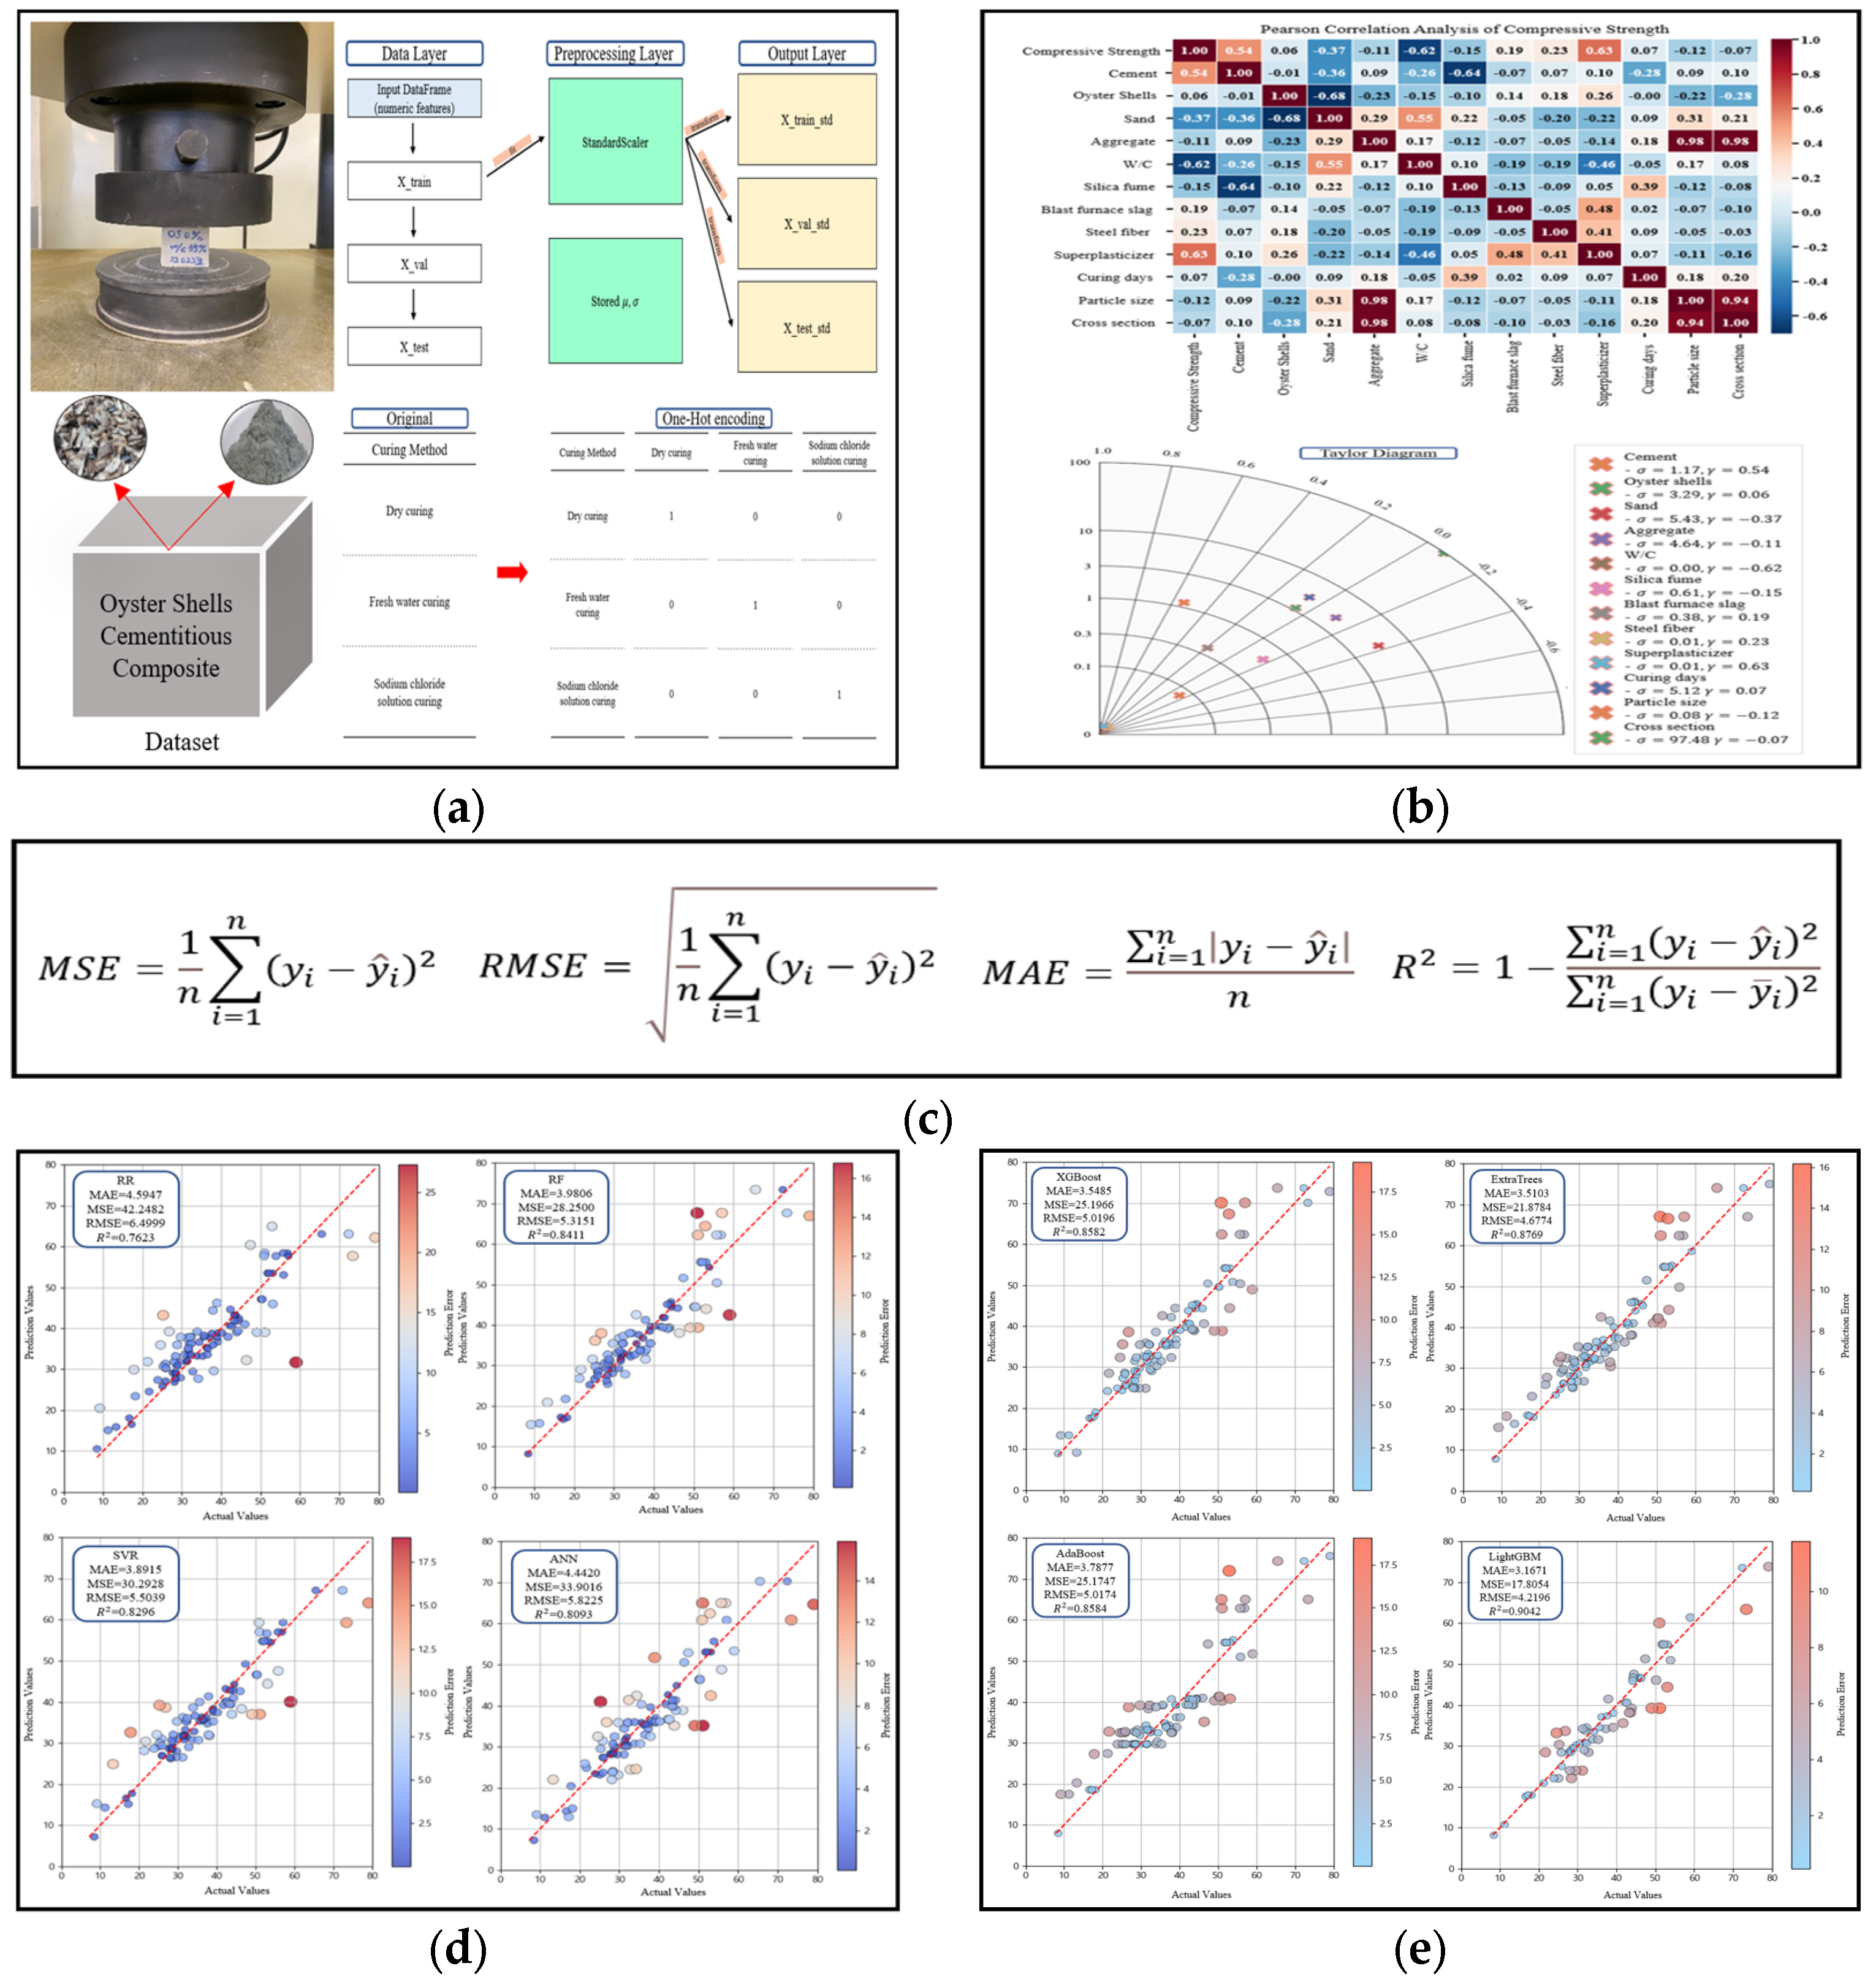
Figure 1. Research flowchart for predicting the compressive strength of oyster shell cementitious composites [15]: (a) Data preparation; (b) correlation analysis; (c) performance metrics; (d) Optimal model selection (RR, RF, SVR, ANN); (e) Emsemble model analysis (XGBoost, AdaBoost, ExtraTrees, LightGBM).
Materials 18 05314 g001
Figure 2. Experimental process [15]: (a) Sieve analysis of oyster shell; (b) material preparation; (c) measuring materials; (d) mixing; (e) curing; (f) measurement of compressive strength.
Materials 18 05314 g002
Figure 3. Standardization process of the dataset.
Materials 18 05314 g003
Figure 4. One-hot encoding process.
Materials 18 05314 g004
Figure 5. Correlation analysis results: (a) Pearson correlation heatmap; (b) Taylor diagram.
Materials 18 05314 g005
Figure 6. Ridge Regression (RR) architecture.
Materials 18 05314 g006
Figure 7. Support Vector Regression (SVR) architecture.
Materials 18 05314 g007
Figure 8. Artificial Neural Network (ANN) architecture.
Materials 18 05314 g008
Figure 9. Architectures of ensemble learning models: (a) Random Forest (RF); (b) XGBoost; (c) Adaboost; (d) Extra Trees; (e) LightGBM.
Materials 18 05314 g009
Figure 10. Performance comparison of machine learning algorithms for optimal model selection; (a) Ridge Regression (RR); (b) Support Vector Regression (SVR); (c) ANN; (d) Random Forest (RF).
Materials 18 05314 g010aMaterials 18 05314 g010b
Figure 11. Performance comparison of ensemble learning algorithms: (a) XGBoost; (b) AdaBoost; (c) Extra Trees; (d) LightGBM.
Materials 18 05314 g011aMaterials 18 05314 g011b
Figure 12. SHAP analysis results.
Materials 18 05314 g012
Table 1. Input variables with units and ranges for oyster shell cementitious composites.
VariablesUnitRange of Data
Cement%25–100
Oyster Shell0–227
Sand0–300
Aggregate0–267
Silica fume0–25
Blast furnace slag0–40
Steel fiber0–1
Fly ash0–40
Superplasticizer0–0.5
W/C-0.3–0.5
Curing daydays3–365
Particle size μ m 0.15–5
Cross-section m m 2 1600–7854
Curing Type-Dry curing
Fresh water curing
Sodium chloride curing
Table 2. Literature containing compressive strength data of oyster shell cementitious composites.
IndexData CountReference
190–21324[19]
214–2229[57]
223–23412[58]
235–2384[14]
239–24810[11]
249–28840[6]
310–32718[59]
328–3369[8]
Table 3. Performance comparison of optimal machine learning algorithms.
Machine Learning ModelMAEMSERMSE R 2
RR4.594742.24826.49990.7623
SVR3.891530.29285.50390.8296
ANN4.442033.90165.82250.8093
RF3.980628.25005.31510.8411
Table 4. Hyperparameter settings of ensemble learning models.
XGBoostcolsample_bytree0.7
learning_rate0.1
max_depth3
n_estimators200
Subsample0.7
Adaboostmax_depth6
learning_rate0.1
n_estimators200
Extra TreesBootstrapFalse
max_depth10
max_features0.8
min_samples_leaf1
min_samples_split2
n_estimators500
LightGBMcolsample_bytree0.8
learning_rate0.05
max_depth−1
min_child_samples10
num_leaves31
reg_lambda1.0
Subsample0.8
Table 5. Performance comparison of ensemble learning models.
Machine Learning ModelMAEMSERMSE R 2
XGBoost3.548525.19665.01960.8582
Adaboost3.787725.17475.01740.8584
Extra Trees3.510321.87844.67740.8769
LightGBM3.167117.80544.21960.9042
Disclaimer/Publisher’s Note: The statements, opinions and data contained in all publications are solely those of the individual author(s) and contributor(s) and not of MDPI and/or the editor(s). MDPI and/or the editor(s) disclaim responsibility for any injury to people or property resulting from any ideas, methods, instructions or products referred to in the content.