Article

Ultra-Strong Transparent ZnAl2O4 Glass-Ceramics via Controlled Crystallization and Ion Exchange

1
Department of Glass and Glass-Ceramics, Mendeleev University of Chemical Technology, Moscow 125047, Russia
2
Physics Faculty, Southern Federal University, Rostov-on-Don 344090, Russia
3
School of Chemical, Materials and Biological Engineering, The University of Sheffield, Sheffield S1 3JD, UK
4
Physics Section, MMV, Banaras Hindu University, Varanasi 221005, India
*
Author to whom correspondence should be addressed.
Materials 2025, 18(22), 5230; https://doi.org/10.3390/ma18225230
Submission received: 29 October 2025 / Revised: 12 November 2025 / Accepted: 14 November 2025 / Published: 19 November 2025

Abstract

Enhancing the mechanical strength of transparent glass-ceramics (TGCs) without compromising their optical performance remains a key challenge for advanced optical and photonic materials. Among aluminosilicate systems, ZnO–MgO–Al2O3–SiO2 (ZMAS) glasses are particularly attractive due to their ability to form ZnAl2O4-based nanostructures; however, their ion-exchange (IE) strengthening has not been systematically explored due to the absence of single-charged cations in their composition. In this study, a sodium-modified ZMAS glass was developed to enable efficient chemical strengthening while preserving glass-forming ability and optical clarity. Controlled two-stage heat treatment produced TGCs containing 5 mol% Na2O, composed solely of ZnAl2O4 (gahnite) nanocrystals with an average size of 4–5 nm. The obtained TGCs showed a Vickers hardness of ~8.5 GPa, increasing to ~10–10.5 GPa after ion exchange in molten KNO3 at 450 °C, without changes in phase composition or optical transmittance. Compared with literature data on alkali-containing TGCs, the developed material demonstrates a higher hardness level while maintaining full transparency. The results reveal a practical route toward chemically strengthened ZnAl2O4-based glass-ceramics combining optical clarity, high hardness, and damage tolerance for optical, photonic, and protective applications.

1. Introduction

Improving the mechanical reliability of transparent glasses an d glass-ceramics remains a key challenge for applications in aerospace systems, optoelectronics, precision optics, and photonic devices, where high optical clarity must be combined with resistance to surface damage and cracking. Two industrially mature routes are widely used to increase strength: thermal tempering [1] and chemical strengthening by ion exchange (IE) [2,3,4]. In parallel, the transition from a homogeneous glass to a glass-ceramic, via controlled crystallization, often provides a substantial gain in hardness and damage tolerance while preserving transparency when the microstructure is nanometric and uniformly distributed [5,6,7,8].
Ion-exchange strengthening of transparent glass-ceramics (TGCs) is particularly attractive because a compressive surface layer can be superimposed on a fine, mechanically robust glass-ceramic framework. Successful IE of glass-ceramics, however, requires that the residual glassy phase contains a sufficient concentration of alkali cations amenable to substitution (Li+/Na+ → K+). Compositional tuning to increase the alkali content may, in turn, alter the crystallization pathway—phase selection, kinetics, and even the balance between bulk and surface crystallization—and thereby jeopardize transparency if coarse or mismatched phases precipitate.
Among aluminosilicate families, the most explored chemistries for TGCs strengthened by IE include Li2O–Al2O3–SiO2 (LAS) [9,10,11,12], MgO–Al2O3–SiO2 (MAS) [13], ZnO–Al2O3–SiO2 (ZAS) [14,15,16,17], and their combinations (e.g., ZMAS) [13,18,19]. To enhance IE efficiency, Na2O is often introduced into LAS-type glasses to facilitate Li+→Na+→K+ exchange, either in one step (KNO3/NaNO3 melts) or in staged protocols (Na+ exchange followed by K+ exchange) [10,15]. Table 1 compiles representative literature data for TGCs containing alkali species, covering salt compositions, IE schedules, and the resulting mechanical properties. Despite differences in test conditions (especially Vickers loads), these reports generally place pre-IE Vickers hardness in the range ≈6–8 GPa; post-IE strengthening typically raises microhardness to ≈7–9 GPa.
Within ZMAS-type systems, IE-compatible formulations pose a particular challenge. For example, in a Na2O-rich composition (6ZnO–12MgO–8Na2O–17Al2O3–52.5SiO2–3TiO2–1.5ZrO2) [13], part of Na2O is consumed by Na2TiSiO5 crystallization alongside spinels (ZnAl2O4/MgAl2O4); the highest reported hardness (~8.2 GPa) was accompanied by a transmittance of only ~60–80% (380–780 nm) for 2 mm thick samples, likely due to coarse (>40 nm) crystals. In contrast, low-Na ZMAS glass (1.1 mol% Na2O) crystallized into a ZnAl2O4-based TGC with microhardness near 9 GPa [23]; however, the low alkali content limits the subsequent IE efficiency. Recent work demonstrated that increasing Na2O to 5 mol% preserves glass-forming ability (bulk casts ~200 g without devitrification) and enables moderate strengthening of the glass by IE (from 6.7 to 8.1 GPa) [24]. The crystallization behavior of this 5 mol% Na2O ZMAS composition, its ability to yield a transparent spinel-based TGC, and its response to ion exchange have not yet been established.
Despite extensive studies on lithium- and magnesium-aluminosilicate systems, the development of chemically strengthened transparent glass-ceramics in the ZnO–MgO–Al2O3–SiO2 family remains limited. The main challenge lies in achieving an alkali-rich residual glass phase—necessary for efficient ion exchange—while maintaining controlled bulk crystallization that preserves optical transparency.
In this context, the present study explores a Na2O-modified ZMAS glass designed to balance glass-forming ability, nanocrystallization behavior, and ion-exchange capability. We show that moderate Na2O incorporation enables the formation of a fully transparent ZnAl2O4-based nanostructure suitable for subsequent ion-exchange strengthening without altering the phase composition or optical clarity. This approach advances the understanding of how nanostructural design and ion-exchange strengthening can be effectively combined in ZMAS-type glass-ceramics, opening opportunities for the development of mechanically durable transparent materials for optical, photonic, and protective applications.

2. Materials and Methods

2.1. Glass Composition and Batching

The target (nominal) glass composition investigated in this work (hereafter 5Na, mol%) was: 20.1 ZnO; 10.0 MgO; 5.0 Na2O; 9.8 Al2O3; 48.0 SiO2; 5.9 TiO2; 1.2 ZrO2. This composition features a ZnO/MgO ratio of ~2:1 and thus differs markedly from the formulation reported in [13], where ZnO/MgO ≈ 1:2. Analytical-grade raw materials were used: SiO2 (≥99.99%), ZrO2 (≥99.99%), ZnO (≥99.5%), TiO2 (≥99.99%), Na2CO3 (≥99.8%), MgO (≥98.0%), and Al(OH)3 (≥97.0%). The weighed powders were homogenized by mechanical mixing for 4 h and then charged into a corundum crucible.

2.2. Melting, Casting, and Annealing

Melting was carried out in a bottom-loading furnace equipped with MoSi2 heating elements. The batch was loaded into a corundum crucible (Al2O3, 99.9%) and heated to 1550 °C, held for 1 h at the maximum temperature, and the melt was then cast into a preheated metal mold to produce bulk glass. The castings were annealed at 550 °C for 4 h in a muffle furnace to relieve residual internal stresses.

2.3. Controlled Crystallization

Annealed glasses were cut and polished, then subjected to a two-step heat treatment in a muffle furnace. The nucleation stage was performed at 660 °C for 4 h (in the vicinity of Tg), followed by a crystal-growth stage conducted at temperatures near the first DSC exotherm for 10–110 h. The resulting TGC are denoted 5Na–X–Y, where X is the heat treatment temperature and Y is the holding time (h).

2.4. Ion Exchange Treatment

Ion exchange (IE) of both the parent glass and the TGC was conducted in a pure KNO3 melt at 450 °C for 12, 24, 48, 72, 96, and 120 h. After IE, samples were withdrawn from the salt bath and subjected to inertial cooling in a preheated muffle furnace to minimize thermal shock and relax thermal stresses. Residual salts were removed by rinsing in distilled water.

2.5. Characterization of Structure and Properties

Differential scanning calorimetry (DSC) was performed by means of a thermal analyzer STA 449 F3 Jupiter (Netzsch, Selb, Germany) in a Pt crucible, at a heating rate of 10 °C/min in Ar. The glass transition temperature (Tg) was determined as the extrapolated onset of the transition, while exopeak temperatures (Tp) were defined as the peak extremum temperature in DSC curves. X-ray diffraction (XRD) patterns of powdered samples were recorded by means of a diffractometer D2 Phaser (Bruker, Karlsruhe, Germany) employing nickel-filtered CuKα radiation. Crystalline phases were identified by comparing the peak position and relative intensities in the X-ray diffraction pattern with the ICDD PDF-2 database. XRD data were collected between 10 and 60 2θ, with a step size of 0.02° and a counting time of 0.3 s per step. XRD patterns were refined using the Rietveld method as implemented in the GSAS-II v5.6.0 code [25]. Optical transmission spectra were recorded over 300–800 nm using a UV-Vis spectrophotometer (UV-3600, Shimadzu, Kyoto, Japan) on the 1.5 mm thick samples. The microstructure of the glass and TGC samples was examined using high-resolution transmission electron microscopy (HRTEM, JEM-2100Plus, JEOL, Peabody, MA, USA) operated at an accelerating voltage of 200 kV. Bulk glass samples were ground to fine powders in an agate mortar and ultrasonically dispersed in ethanol. A drop of the resulting suspension was deposited onto a carbon-coated copper grid and dried under ambient conditions for approximately 20 min. Bright-field TEM images were recorded from multiple regions of each grid to obtain statistically representative microstructural data. The digital micrographs were analyzed using ImageJ software (version 1.53n). NTEGRA Spectra Spectrometer (NT-MDT Co., Zelenograd, Moscow, Russia) with the Ar laser beam (488 nm excitation wavelength) was used to record Raman spectra of the bulk samples.
Vickers microhardness was measured using an HVS-1000 tester (Laizhou Huayin Testing Instrument Co., Ltd., Laizhou, Shandong, China) under a 200 g load with a 10 s dwell time. The Vickers hardness was calculated as
H V = 1.854   F d 2  
where F is the applied load and d is the mean indentation diagonal. For each specimen, ≥20 indents were performed for statistical reliability.

3. Results and Discussion

3.1. Structure and Thermal Behavior of the Parent Glass

The glass composition containing 5 mol% Na2O was selected based on our previous research [24]. An increase in Na2O content beyond this level led to partial crystallization during casting, hindering the formation of a homogeneous bulk glass. To determine the characteristic thermal transitions, DSC was performed on monolithic samples of the 5Na glass.
As shown in Figure 1a, the DSC curve exhibits a distinct glass transition at 662 °C, followed by two exothermic peaks at 760 °C (Tp1) and 960 °C (Tp2), corresponding to the primary and secondary crystallization stages, respectively. These data were used to establish the temperature parameters for controlled nucleation and crystal growth in the subsequent heat-treatment procedure.
To evaluate the relationship between surface and bulk crystallization, DSC measurements were also conducted on glass samples of identical mass in both powdered and monolithic forms (Figure S1). The two DSC curves display nearly identical shapes, with only a slight shift of the exothermic peaks toward higher temperatures for the powdered sample. This minimal difference indicates that the crystallization of the 5Na glass proceeds predominantly via a bulk mechanism. This conclusion is further supported by the complete coincidence of the XRD patterns obtained for powdered and monolithic samples heat-treated under identical conditions (660 °C—4 h—760 °C—10 h, Figure S2).
The amorphous structure of the 5Na glass was confirmed by XRD and TEM analyses. The XRD pattern exhibits a single broad diffuse halo centered near 2θ ≈ 30° (Figure 1b), confirming the absence of crystalline phases. TEM images of the glass show overall homogeneous contrast, yet reveal faint nanoscale compositional modulations, indicative of liquid–liquid phase separation typical for ZMAS-type glasses (Figure 1c,d). The corresponding SAED patterns display diffuse rings without discrete reflections, confirming that both phases remain fully amorphous. Such phase separation is a well-known precursor for controlled crystallization in ZnO/MgO–Al2O3–SiO2 glasses, providing chemically enriched regions that subsequently act as favorable sites for nucleation of crystallites during heat treatment.
The relatively high glass transition temperature (Tg = 662 °C) of the 5Na composition, well above the typical ion-exchange temperature (≈450 °C), implies that structural relaxation during ion exchange is negligible, ensuring the stability of the glass matrix during chemical strengthening. Structural relaxation refers to the temperature-dependent rearrangement of the glass network toward equilibrium through viscous flow or atomic diffusion; at temperatures far below Tg, the glass structure remains rigid and cannot relax the stresses generated during ion exchange.

3.2. Crystallization Behavior and Phase Evolution

The temperature–time parameters for two-step crystallization were selected following the approach previously applied to transparent ZMAS glass-ceramics with 1.1 mol% Na2O [23]. The nucleation stage was carried out at 660 °C for 4 h (near Tg), followed by a crystal growth stage within 750–850 °C for 10–110 h. Samples heat-treated at 750–760 °C for 10 h retained full transparency, while increasing the temperature to 770 °C led to slight opalescence, and further heating to 785 °C and above produced opaque glass-ceramics.
The evolution of crystalline phases depending on temperature and holding time is shown in Figure 2. At 750–770 °C (Figure 2a), all diffraction peaks correspond to the zinc aluminate ZnAl2O4 (PDF #01-074-1138), indicating that a single spinel-type phase is formed in this temperature range. Further heating to 785–800 °C (Figure 2b) results in the appearance of additional reflections assigned to zinc silicate Zn2SiO4 (PDF #01-085-0453). The intensity of these peaks increases with temperature, and at 850 °C, weak peaks of forsterite Mg2SiO4 (PDF #01-076-0851) also appear. At this stage, silicate phases dominate over the spinel, causing a pronounced decrease in transparency.
For samples treated isothermally at 750 °C for 10–110 h (Figure 2c,d), the diffraction data reveal a time-dependent phase evolution. Up to ~25 h, ZnAl2O4 remains the only crystalline phase, while its mean crystallite size, calculated using the Scherrer equation from the (311) reflection at 36.3°, remains constant at ~4–5 nm. Prolonged holding (>60 h) promotes the formation of Zn2SiO4, accompanied by optical opacity due to increased scattering on larger (~25–60 nm) silicate crystallites.
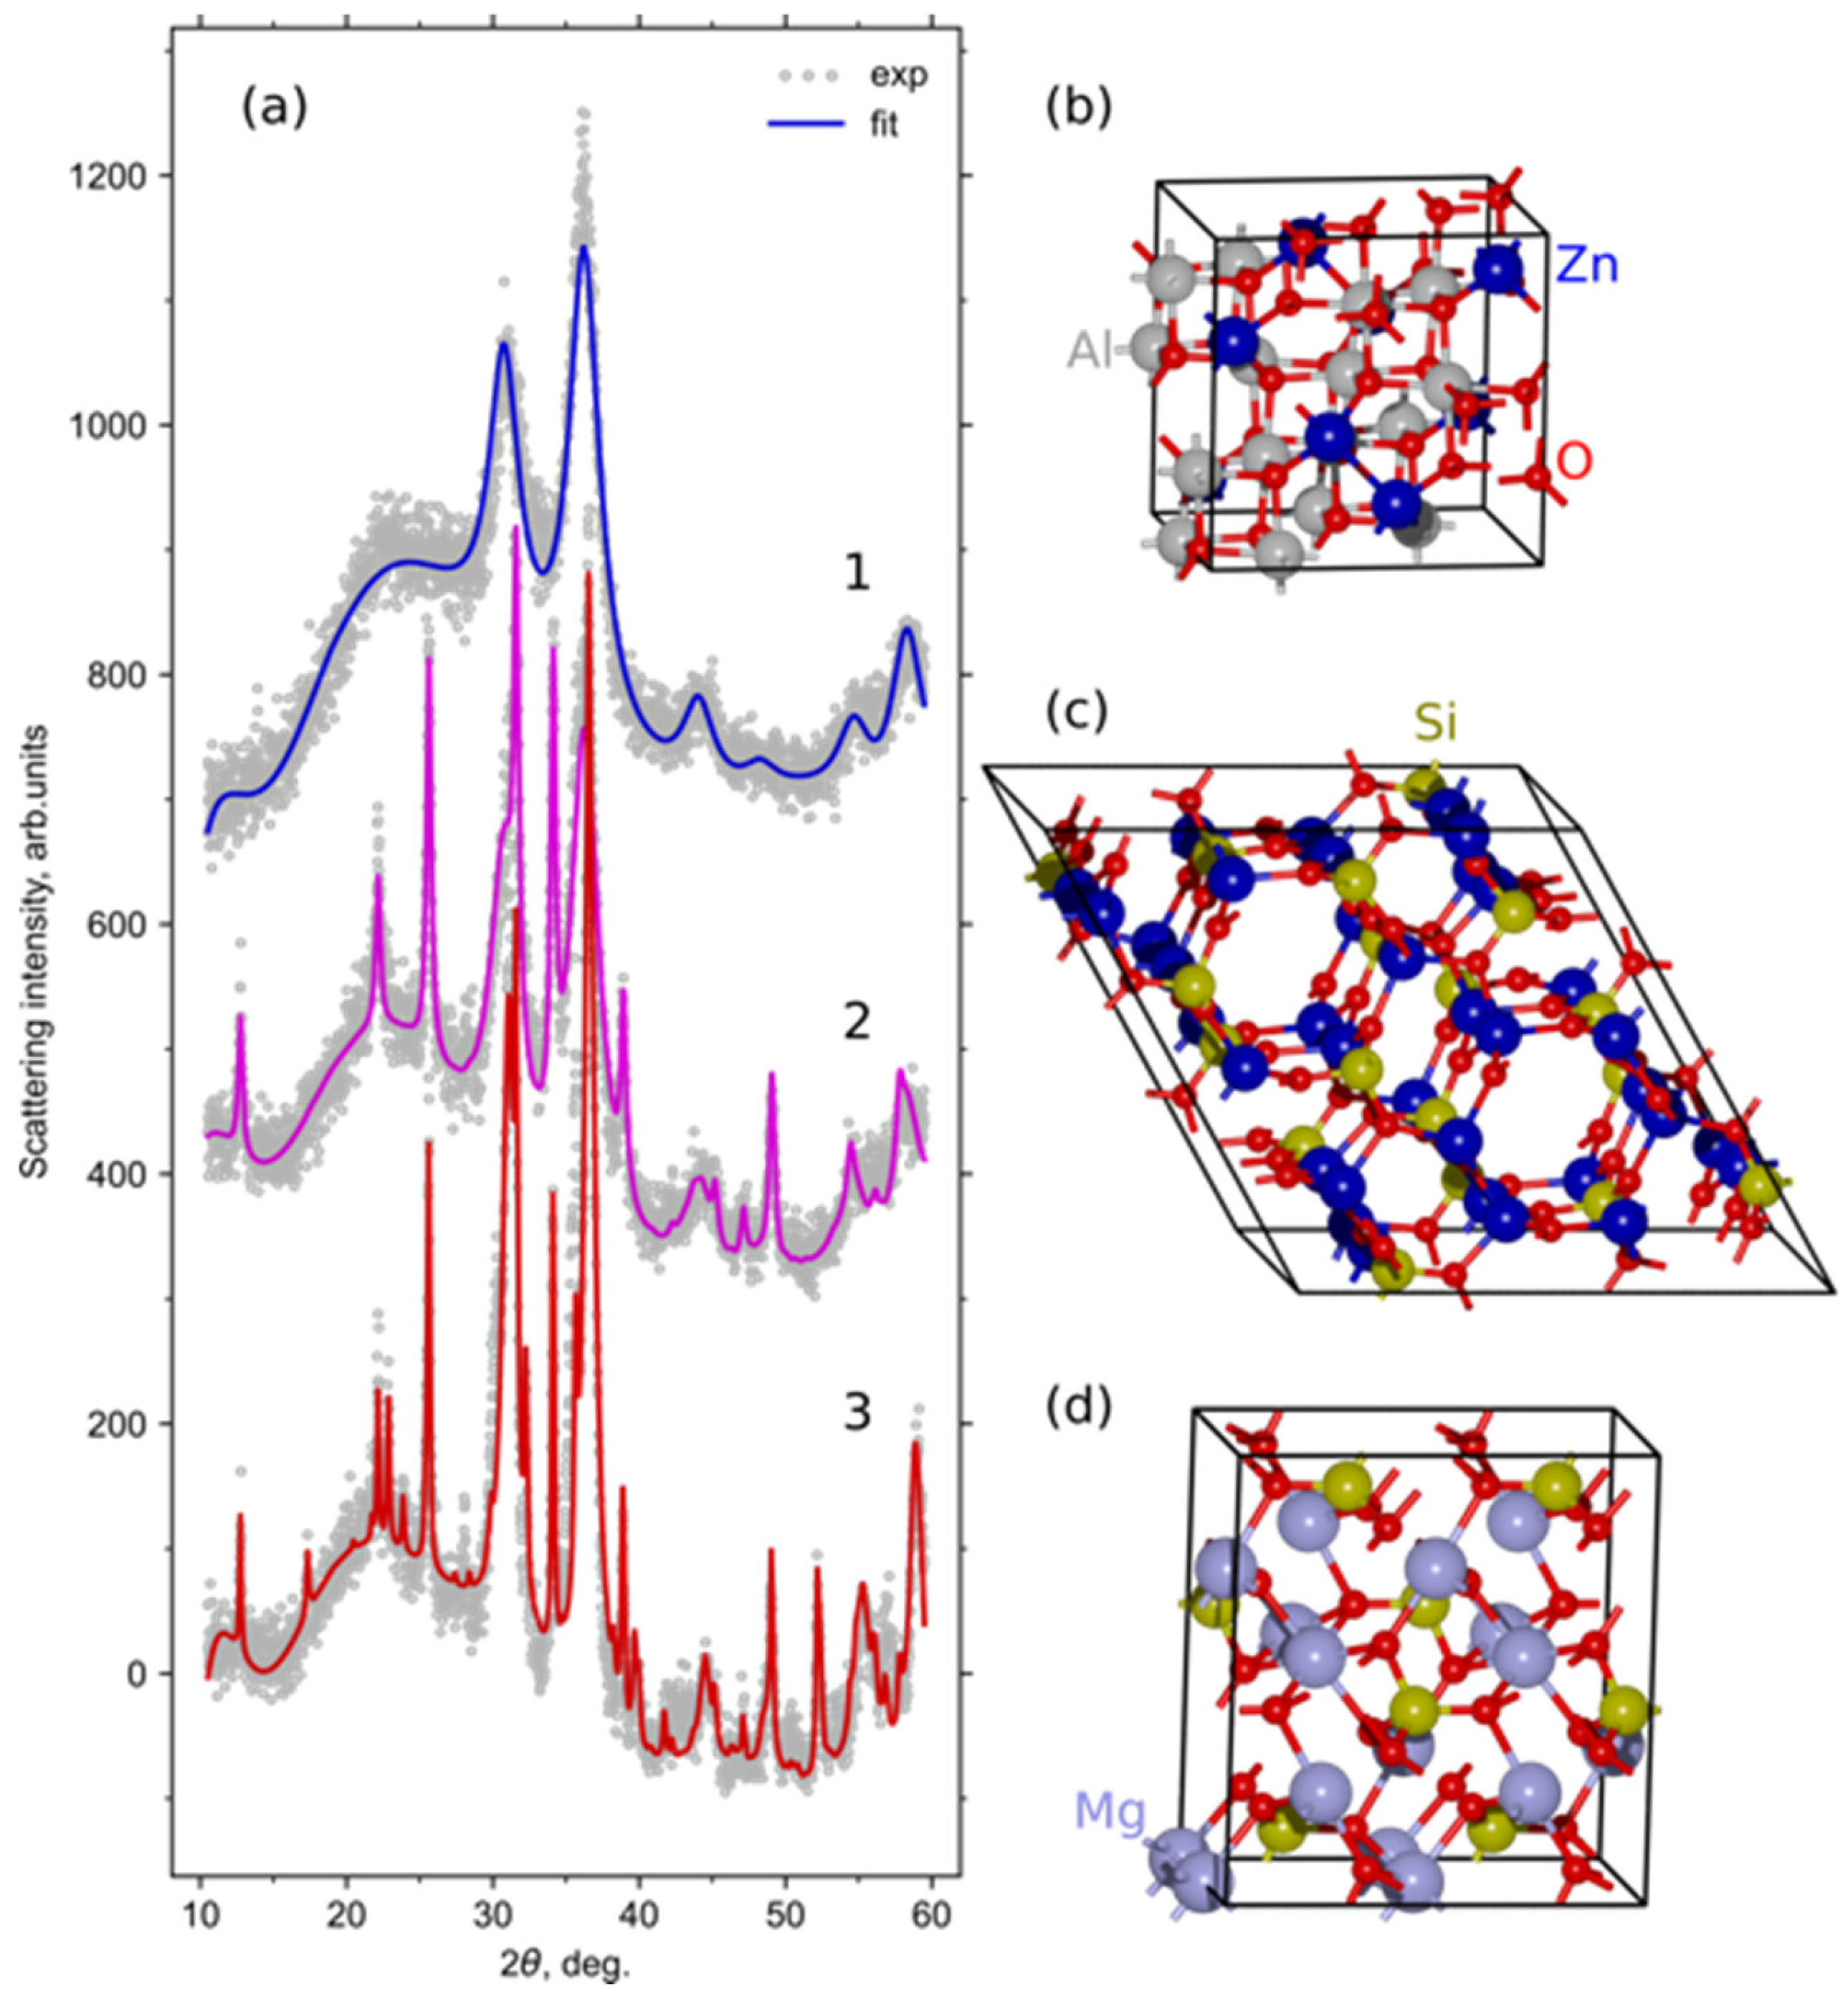
A detailed Rietveld refinement was performed on the set of selected samples (5Na-750-10, 5Na-760-10, 5Na-850-10, and others). The refinement employed structural models from the Crystallography Open Database (COD) [26] for ZnAl2O4 (ID 9007017, 9 reflections), Zn2SiO4 (ID 9014832, 98 reflections), and Mg2SiO4 (ID 9000535, 46 reflections). The lattice parameters (a), coherent scattering domain sizes (D), and metal site occupancies (Zn:Mg ratios) were refined simultaneously. Partial cation substitution between Zn2+ and Mg2+ sites was allowed, resulting in simulated intensities closely matching the experimental profiles. The flexible background “Chebyschev-1” function with 10 parameters was used to subtract diffuse peaks of glass phases.
The experimental and calculated XRD patterns, along with corresponding fits, are shown in Figure 3, and the numerical results are summarized in Table 2. The refinement quality, expressed as the goodness of fit (GOF), ranged between 1.1 and 1.5, which is acceptable for nanocrystalline glass-ceramic systems with residual amorphous background. Representative fits for other samples are provided in the Supporting Information (Figures S3–S8).
A further improvement of the fitting quality may require variation in thermal vibration parameters, stresses, and size distributions influencing the XRD pattern. However, for the considered experimental data, such fine-tuning will give high cross-correlations between varied parameters and decrease the reliability of the obtained data. Also note that the interpretation of the obtained Zn:Mg ratios may be ambiguous since we cannot reliably distinguish the replacement of a heavier Zn atom (Z = 30) by a lighter Mg atom (Z = 12) and the formation of Zn vacancies by studying XRD data only. However, our interpretation is justified by the increase in electronic density in Mg silicate phases, which cannot be due to vacancy formations.
The refined parameters indicate that for transparent samples (e.g., 5Na-750-10 and 5Na-760-10), ZnAl2O4 is the only crystalline phase present. Its cubic lattice parameter is a = 8.21–8.23 Å, which is approximately 1% larger than that of the stoichiometric reference ZnAl2O4 (8.09 Å). This expansion likely results from partial substitution of Zn2+ by Mg2+ in tetrahedral sites, consistent with the refined cation occupancy ratios of Zn:Mg = 55:45–48:52.
With increasing temperature and holding time, the relative fraction of ZnAl2O4 decreases while silicate phases emerge. At 800 °C, the glass-ceramics consist of approximately 86 wt.% ZnAl2O4, 5 wt.% Zn2SiO4, and 9 wt.% Mg2SiO4, whereas at 850 °C, the phase composition shifts to 72 wt.% ZnAl2O4, 10 wt.% Zn2SiO4, and 18 wt.% Mg2SiO4. The silicate crystallites exhibit sizes between 25 and 60 nm, while spinel nanocrystals remain around 4–10 nm, preserving a fine-grained structure even at high temperatures.
No crystalline phases of ZrO2 or TiO2 were detected, which can be attributed to their low content in the base glass and the overlap of their most intense reflections with the broad spinel peaks. The refined results thus confirm that controlled crystallization at 750–760 °C for 10–25 h yields a uniform nanocrystalline ZnAl2O4 spinel phase with minor cation disorder (Zn–Mg intermixing), responsible for the combination of high transparency and mechanical stability.
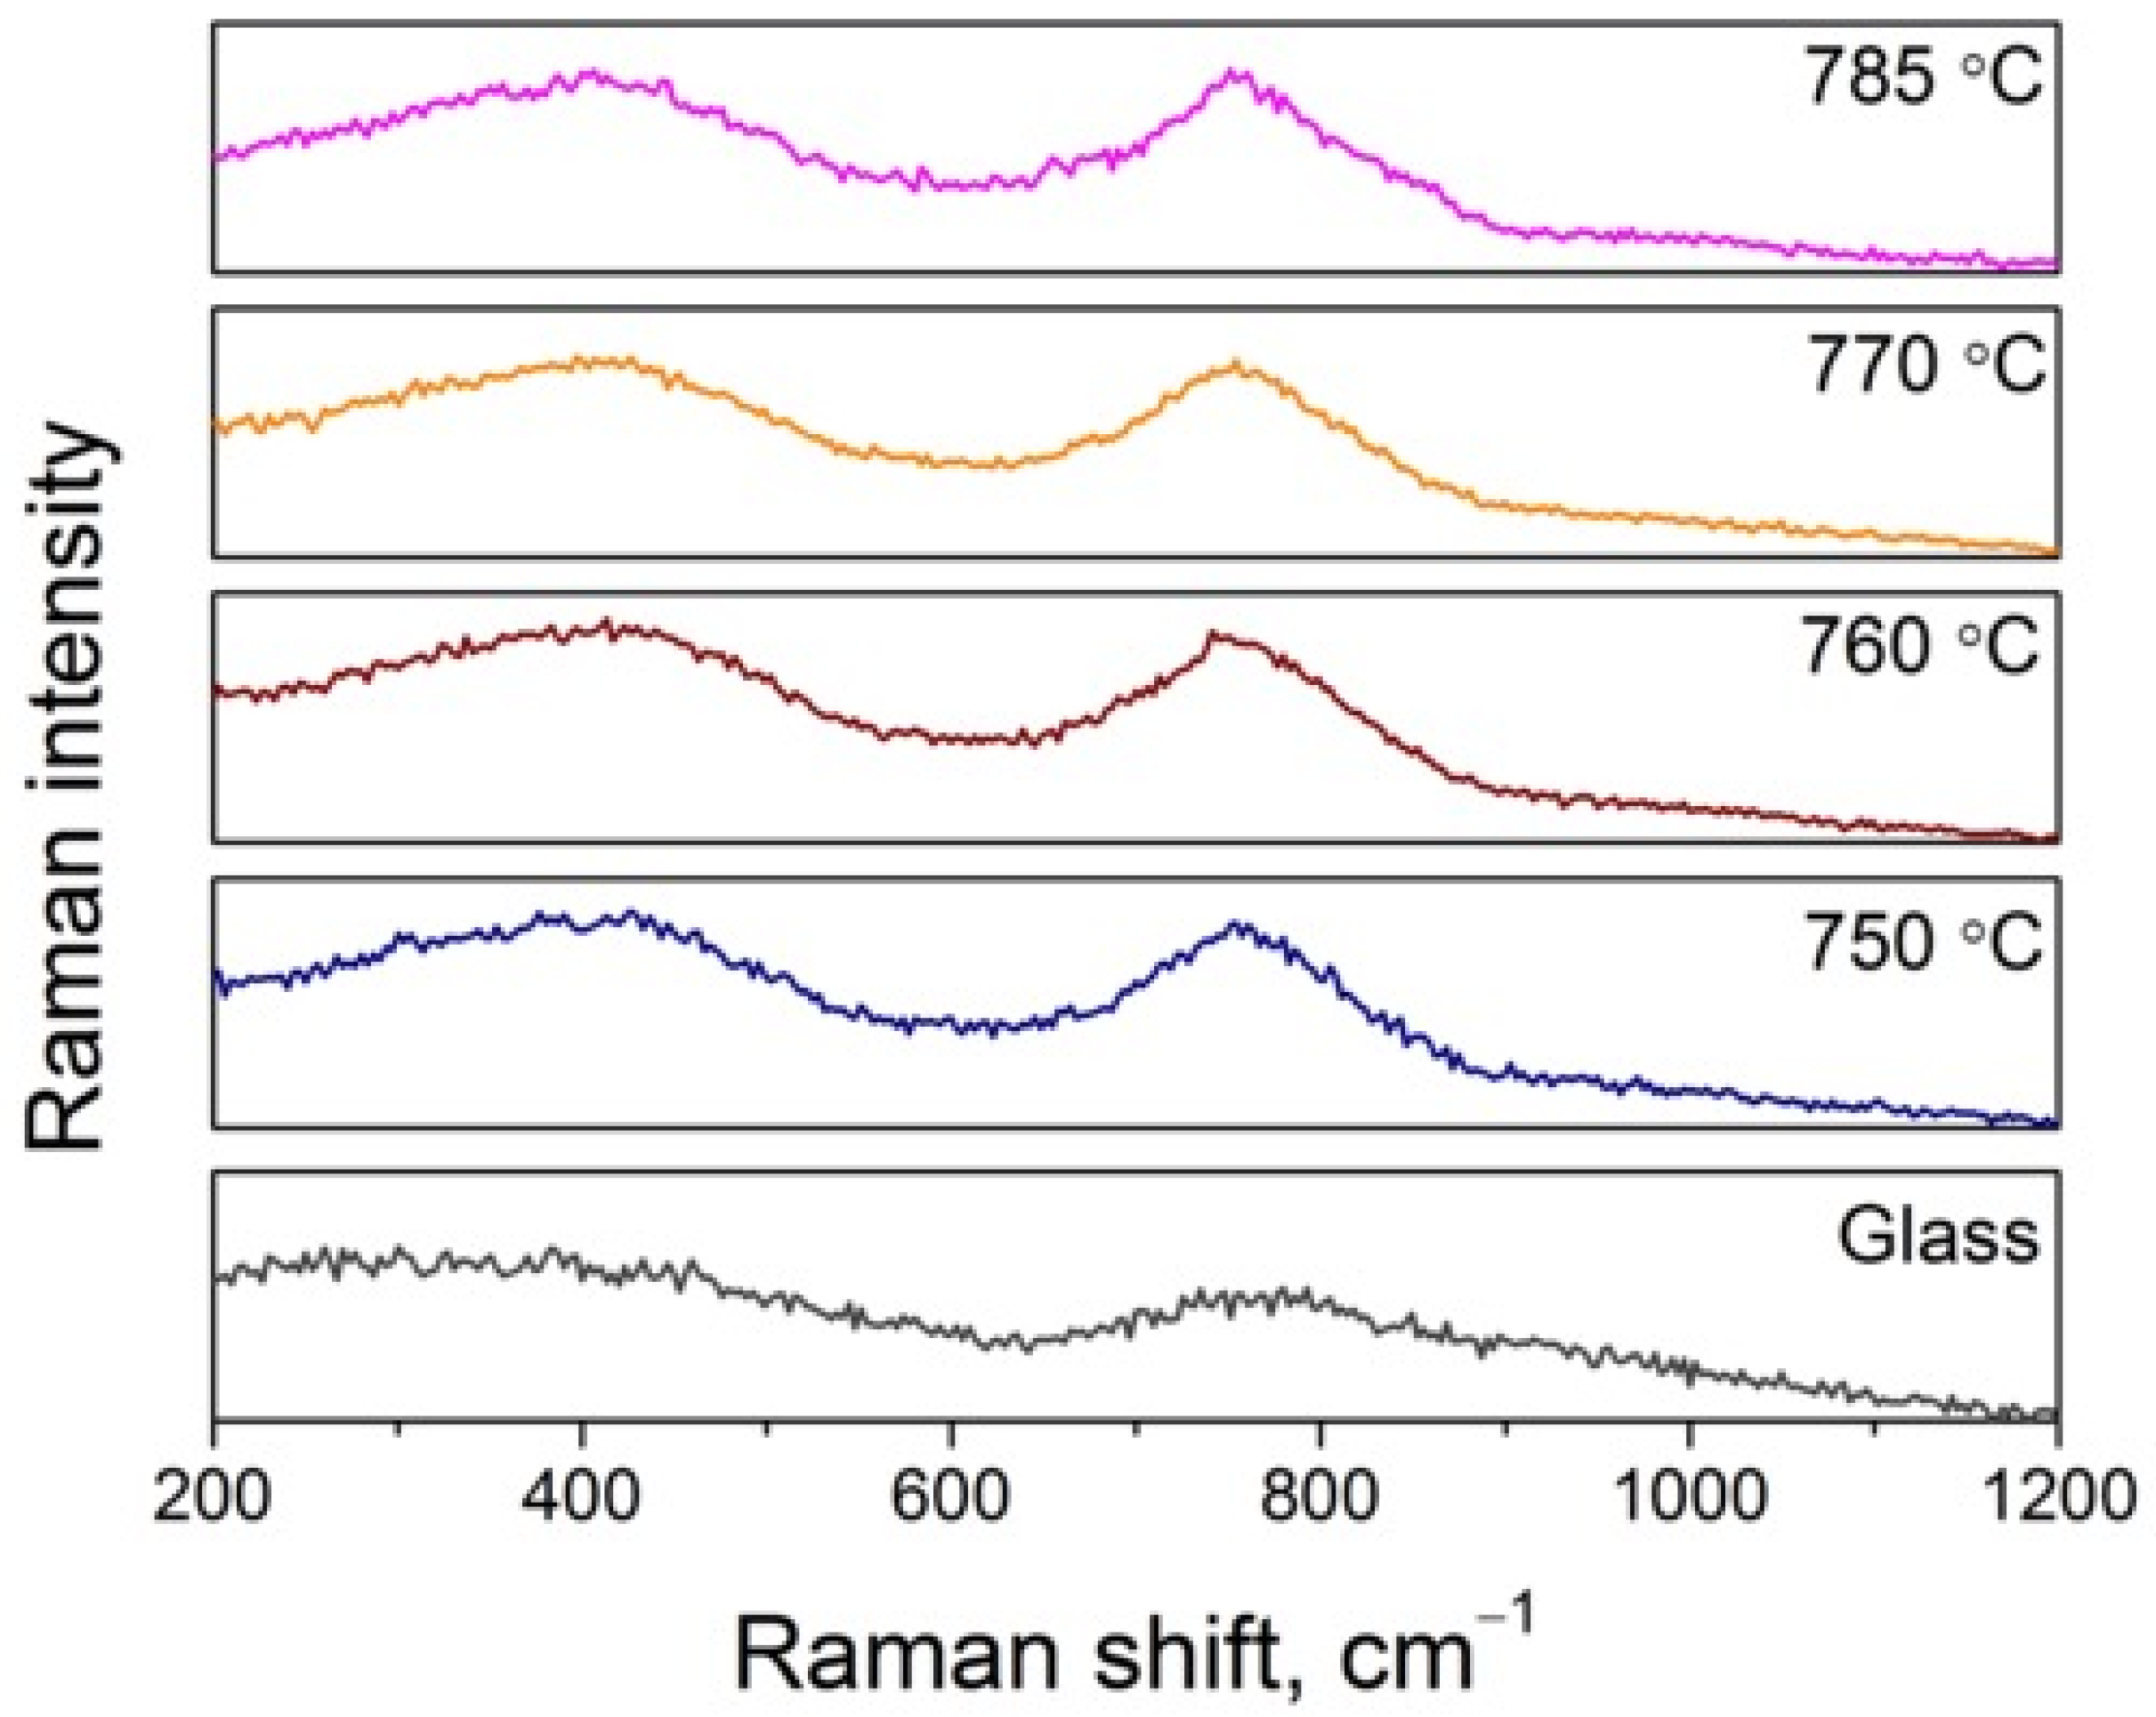
Raman spectra of the parent glass and the glass-ceramics heat-treated at different temperatures are shown in Figure 4. The spectrum of the parent 5Na glass is broad and diffuse, exhibiting a weak, poorly resolved band near 800–850 cm−1, which can be attributed to Si–O and Al–O stretching vibrations in a chemically heterogeneous glass network. Such spectral broadening is typical of glasses undergoing liquid–liquid phase separation, which is also evident from the TEM observations showing nanometric contrast variations in the glass matrix.
Upon heat treatment at 750–785 °C, two distinct Raman bands become apparent at approximately 415 cm−1 and 760 cm−1. The former corresponds to Zn–O symmetric stretching vibrations in the cubic spinel ZnAl2O4 [27,28], while the latter is assigned to Al–O symmetric stretching vibrations of [AlO]x units within the ZnAl2O4 lattice [29,30]. All spectra in this temperature range display the same set of features, and only the intensity of both bands increases slightly with temperature, indicating the growth and ordering of the gahnite nanocrystals rather than the formation of new phases. These observations confirm that the crystallization of the 5Na glass proceeds through phase-separation and the development of ZnAl2O4 nanocrystals, in full agreement with the XRD data.
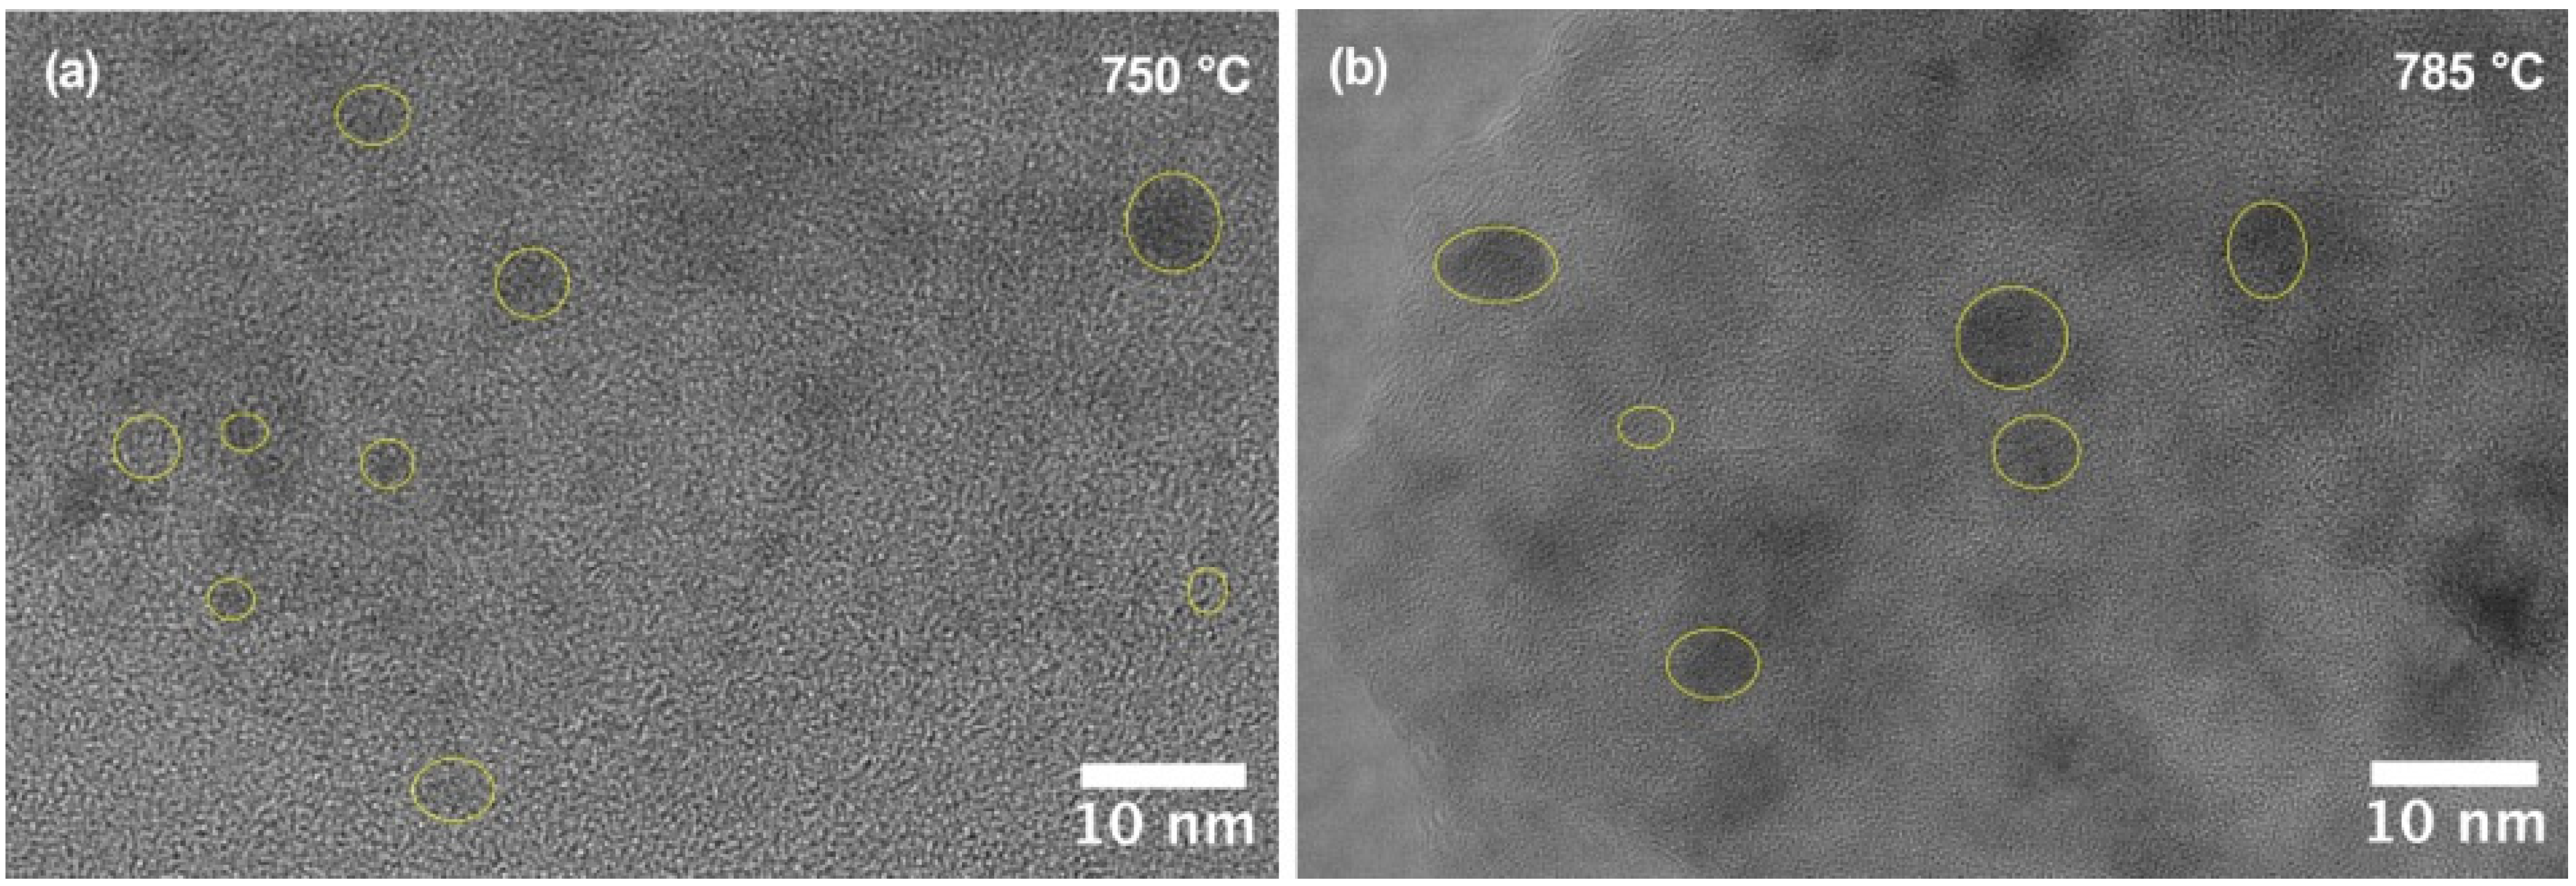
Representative HRTEM images of the glass-ceramics heat-treated at 750 °C and 785 °C are shown in Figure 5. After heat treatment at 750 °C (Figure 5a), the material exhibits a homogeneous nanostructure with uniformly dispersed crystalline domains of ZnAl2O4 embedded in the glassy matrix. The nanocrystals are nearly spherical and their average size does not exceed 4–5 nm, consistent with the value estimated from XRD data. Lattice fringes corresponding to the (311) and (400) planes of cubic ZnAl2O4 are locally resolved, confirming the single-phase spinel structure of the crystalline component.
When the crystallization temperature is increased to 785 °C (Figure 5b), the contrast variations become more pronounced, and individual nanocrystals grow slightly in size, reaching 6–8 nm. Nevertheless, the material still maintains a fine and uniformly distributed nanocrystalline structure without the formation of secondary crystalline phases or large aggregates. The observed microstructural evolution supports the Raman and XRD results, indicating that the heat treatment up to 785 °C promotes growth and ordering of gahnite nanocrystals.

3.3. Mechanical Properties and Ion-Exchange Strengthening

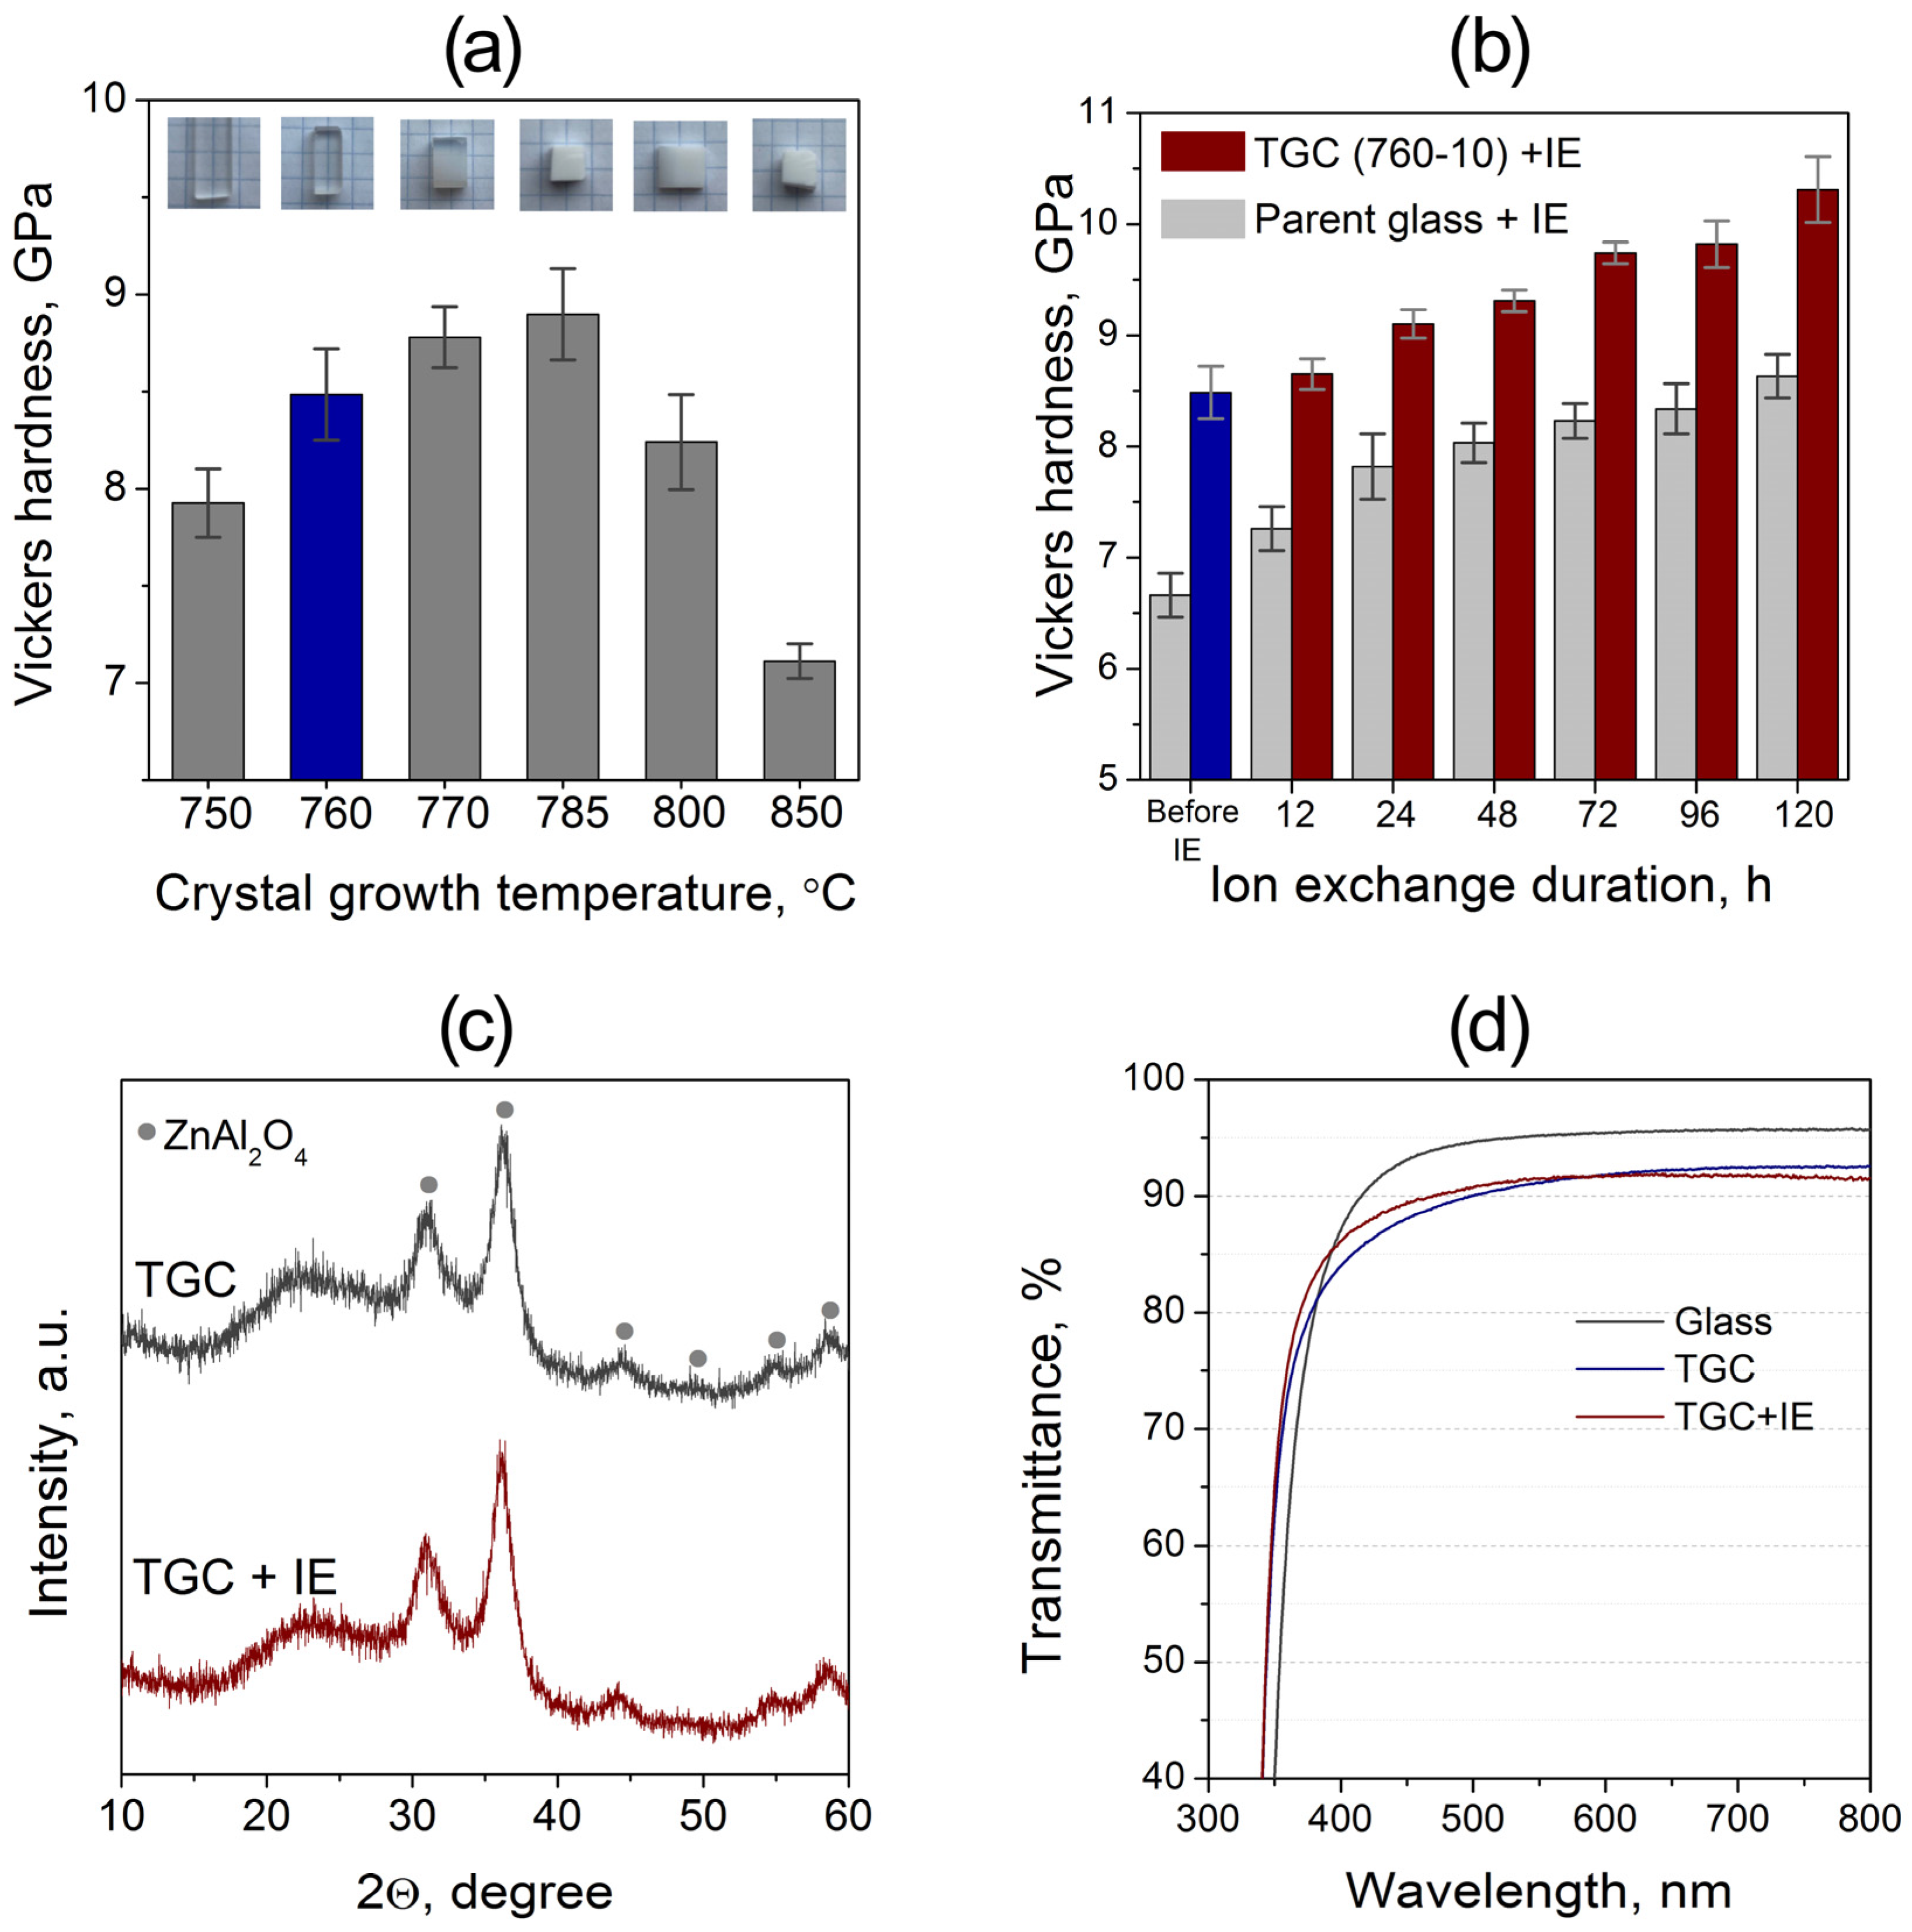
The dependence of the Vickers hardness on the temperature of the crystal-growth stage is presented in Figure 6a. The parent 5Na glass shows an average hardness of 6.7 GPa. Two-stage heat treatment leads to a noticeable increase in hardness by about 1–2 GPa, yielding values in the range of 7.9–8.9 GPa depending on the temperature of the second stage. Samples treated at 750–760 °C remain fully transparent, while heating to 770 °C results in opalescence, and at 785 °C and above, the material becomes opaque. The highest hardness among the transparent glass-ceramics is achieved for the sample crystallized at 760 °C, reaching ≈8.5 GPa. The gradual rise in hardness up to 770–785 °C correlates with the growth and structural ordering of ZnAl2O4 nanocrystals revealed by TEM and Raman spectroscopy, whereas the subsequent decrease in hardness at higher temperatures is associated with the coarsening of crystallites and the appearance of secondary silicate phases, which deteriorate both the mechanical and optical properties.
The influence of IE in molten KNO3 at 450 °C on the hardness of the parent glass and of the TGC 5Na–760–10 is shown in Figure 6b. For both materials, the hardness increases steadily with the duration of IE, indicating the formation of a compressive stress layer as Na+ ions are replaced by K+ in the surface region. During the first 24 h, the increase in hardness is more pronounced for the glass, likely due to the absence of crystal–matrix interfaces that hinder alkali diffusion. At longer treatment times (≥ 24 h), the rate of hardness growth becomes similar for both materials. After 120 h, the hardness of the ion-exchanged TGC reaches ≈10–10.5 GPa, clearly exceeding that of the ion-exchanged glass. The higher strengthening efficiency in TGC arises from the restricted Na+ mobility in the nanocrystalline spinel matrix, which promotes a steeper concentration gradient and higher compressive stress near the surface. Although saturation is not yet reached after 120 h, further improvement would likely be marginal and of limited technological relevance given the long processing time required.
To determine whether prolonged contact with molten salt affects the crystalline structure of the TGC, XRD patterns of the 5Na–760–10 sample were recorded before and after 120 h of IE (Figure 6c). The diffraction profiles are identical and fully indexed to ZnAl2O4, showing no additional peaks or shifts, which indicates that the IE process does not modify the phase composition or lattice parameters of the crystalline phase. The optical transmission spectra (Figure 6d) confirm that the ion-exchanged TGC retains high transparency in the 400–800 nm range, with only a minor reduction compared to the parent glass.
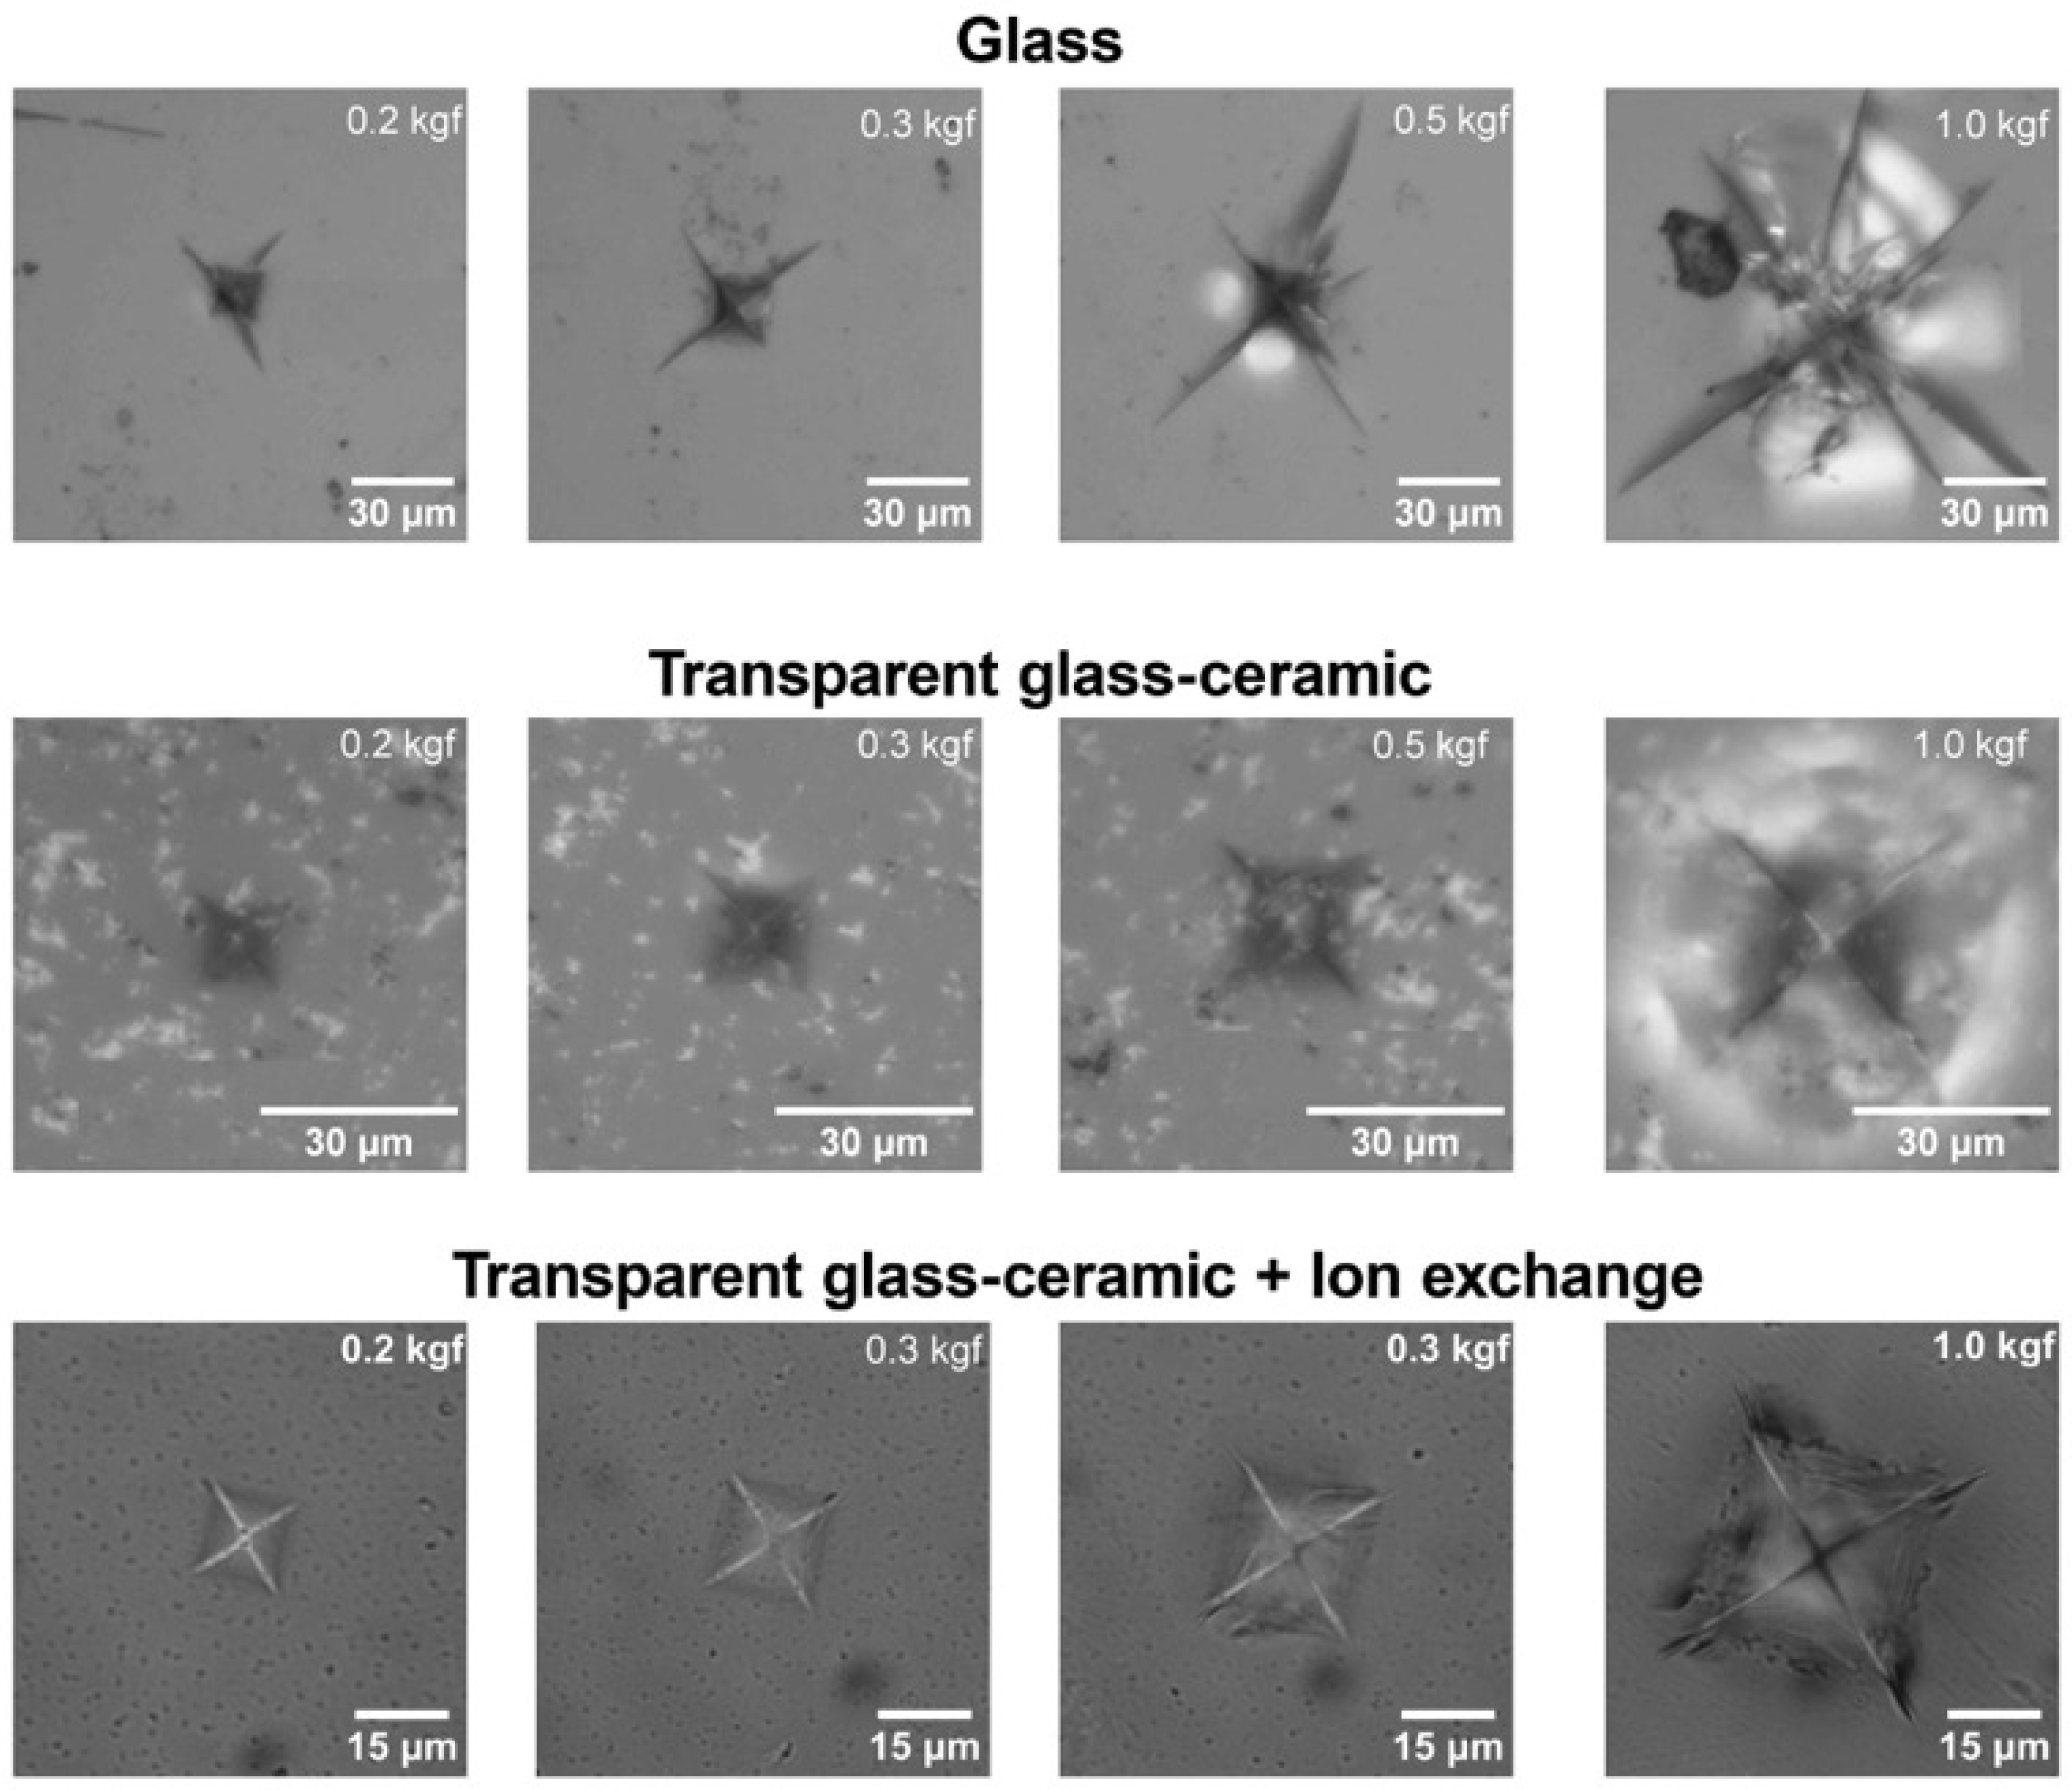
The optical micrographs of Vickers indents obtained under different loads for the parent glass, transparent glass-ceramic, and ion-exchanged glass-ceramic are shown in Figure 7. All imprints exhibit the characteristic square shape of the Vickers indenter. For the parent glass, radial cracks emanate from the corners of the indent even at the lowest applied load (0.2 kgf), and their number and length increase progressively with increasing load. After crystallization at 760 °C, the resulting TGC demonstrates a markedly improved crack resistance: no visible cracks are observed up to 0.5 kgf, and only at 1 kgf do minor damage zones appear around the indentation, associated with the brittle response of the residual glassy phase.
In contrast, the ion-exchanged TGC exhibits significantly enhanced resistance to indentation-induced fracture. Even at the maximum applied load (1 kgf), only small, short cracks appear from some indent corners, while the surrounding surface remains intact and free from mirror-like reflections typical of brittle fracture. This behavior confirms that the combination of a fine-grained ZnAl2O4 nanocrystalline framework and the compressive surface layer formed during ion exchange effectively suppresses crack propagation and improves the overall damage tolerance of the material.
Together with the hardness data, these results demonstrate that moderate crystallization at 750–760 °C followed by ion-exchange treatment in molten KNO3 yields transparent glass-ceramics possessing both high surface hardness (>10 GPa) and outstanding resistance to cracking—properties crucial for mechanically loaded transparent components.
The obtained results can be compared with previously reported data summarized in Table 1. For most alkali-containing transparent glass-ceramics, the microhardness before ion exchange typically lies in the range of 6–8 GPa, increasing to 7–9 GPa after IE treatment [9,10,11,12,13,14,15,16,18,20]. In contrast, the present ZnO–MgO–Al2O3–SiO2 system demonstrates higher hardness levels (8.5 GPa before IE and ≈10–10.5 GPa after IE) while maintaining high optical transparency in the 400–800 nm range. This performance surpasses that of previously studied ZMAS-type glass-ceramics [13,14], where coarse or mixed-phase crystallization limited transparency and further ion-exchange efficiency. The superior mechanical response of the present material can be attributed to the formation of a uniform nanocrystalline ZnAl2O4 spinel network combined with a compressive surface layer produced during ion exchange, which together ensure both high hardness and resistance to crack propagation.

4. Conclusions

Transparent ZMAS glass-ceramics containing 5 mol% Na2O were successfully fabricated via a controlled two-stage heat treatment. The parent glass exhibited an amorphous structure with nanoscale compositional fluctuations, indicating the occurrence of liquid–liquid phase separation. DSC and XRD analyses revealed two exothermic crystallization events, while controlled crystallization at 660 °C for 4 h and 750–760 °C for 10 h produced transparent glass-ceramics consisting solely of ZnAl2O4 (gahnite) nanocrystals with an average size of 4–5 nm. Raman spectroscopy and HRTEM confirmed that increasing the temperature to 785 °C leads only to the growth and ordering of the spinel phase, without the formation of secondary silicates.
The optimal combination of high transparency and mechanical strength was achieved for samples crystallized at 760 °C, exhibiting a Vickers hardness of ≈8.5 GPa. Subsequent ion exchange in molten KNO3 at 450 °C further increased the hardness to ≈10–10.5 GPa without altering the phase composition or transparency. The strengthened samples demonstrated a pronounced resistance to crack initiation and propagation under indentation.
Compared with literature data on alkali-containing transparent glass-ceramics (Table 1), the obtained material shows a higher hardness level while maintaining optical transparency, indicating the efficiency of the selected composition and processing route. Overall, the study demonstrates that moderate crystallization followed by ion exchange provides an effective route to produce transparent, mechanically durable ZnAl2O4-based glass-ceramics, combining optical clarity with enhanced surface hardness. Such materials are promising for applications requiring high optical transparency and mechanical reliability, including protective and structural components in optical and photonic devices, display and cover glasses, micro-optical elements, and transparent armor systems, where improved resistance to surface damage and cracking is critical. Future work will focus on evaluating the thermal-shock resistance, long-term stability, and scalability of the synthesis and ion-exchange strengthening processes to assess their potential for practical implementation.

Supplementary Materials

The following supporting information can be downloaded at: https://www.mdpi.com/article/10.3390/ma18225230/s1, Figure S1: DSC measurements on glass samples of identical mass in powdered and monolithic forms; Figure S2: XRD patterns for powdered and monolithic samples heat-treated under identical conditions 660 °C—4 h—760 °C—10 h; Figures S3–S8: The illustration of fitting qualities of the XRD patterns for the samples.

Author Contributions

Conceptualization, I.V. and G.S.; methodology, V.S. (Vitaliy Savinkov); validation, M.O. and M.G.; investigation, N.G., K.T. and D.V.; writing—original draft preparation, I.V. and G.S.; writing—review and editing, L.A. and V.S. (Vladimir Sigaev); visualization, I.V. and L.A.; project administration, V.S. (Vladimir Sigaev); funding acquisition, V.S. (Vladimir Sigaev). All authors have read and agreed to the published version of the manuscript.

Funding

This work was supported by a Grant from the Russian Science Foundation (RSF Project No. 25-43-01075).

Institutional Review Board Statement

Not applicable.

Informed Consent Statement

Not applicable.

Data Availability Statement

The original contributions presented in this study are included in the article/Supplementary Material. Further inquiries can be directed to the corresponding author.

Conflicts of Interest

The authors declare no conflicts of interest.

References

  1. Yang, P.; Wang, Y.; Li, X.; Han, T.; Shi, X. Effect of Physical Tempering on the Mechanical Properties of Aluminosilicate Glass. J. Non Cryst. Solids 2023, 619, 122574. [Google Scholar] [CrossRef]
  2. Berneschi, S.; Righini, G.C.; Pelli, S. Towards a Glass New World: The Role of Ion-Exchange in Modern Technology. Appl. Sci. 2021, 11, 4610. [Google Scholar] [CrossRef]
  3. Zhen, W.; Zhenbiao, H.; Tao, S.; Fenghua, Z.; Yulong, L.; Sheikh, M.Z.; Xiang, W.; Yinmao, W. A Comparative Study on the Effect of Loading Speed and Surface Scratches on the Flexural Strength of Aluminosilicate Glass: Annealed vs. Chemically Strengthened. Ceram. Int. 2018, 44, 11239–11256. [Google Scholar] [CrossRef]
  4. Banapour Ghaffari, O.; Eftekhari Yekta, B.; Zakeri-Nasrabadi, M. Estimating “Depth of Layer” (DOL) in Ion-Exchanged Glasses Using Explainable Machine Learning. Materialia 2024, 33, 102027. [Google Scholar] [CrossRef]
  5. Seidel, S.; Dittmer, M.; Wisniewski, W.; Höland, W.; Rüssel, C. Effect of the ZrO2 Concentration on the Crystallization Behavior and the Mechanical Properties of High-Strength MgO–Al2O3–SiO2 Glass–Ceramics. J. Mater. Sci. 2017, 52, 1955–1968. [Google Scholar] [CrossRef]
  6. Lu, J.; Wang, H.; Li, Y.; Zhou, Y.; Jiang, W. Effect of Metastable Phase on the Crystallization and Mechanical Properties of MgO-Al2O3-SiO2 Glass-Ceramics without Nucleating Agents. Ceram. Int. 2023, 49, 7737–7745. [Google Scholar] [CrossRef]
  7. Beall, G.H.; Comte, M.; Dejneka, M.J.; Marques, P.; Pradeau, P.; Smith, C. Ion-Exchange in Glass-Ceramics. Front. Mater. 2016, 3, 41. [Google Scholar] [CrossRef]
  8. Shakhgildyan, G.Y.; Ojovan, M.I. Inhomogeneities in Glass: From Defects to Functional Nanostructures. Encyclopedia 2025, 5, 136. [Google Scholar] [CrossRef]
  9. Zhang, T.; Zhang, Z.; Han, J.; Wang, J.; Liu, C.; Ruan, J. The Structure and Properties of Chemical Strengthened Transparent Lithium Disilicate Glass Ceramics with Various P2O5 Contents. J. Non Cryst. Solids 2022, 588, 121626. [Google Scholar] [CrossRef]
  10. Mu, Y.; Qiu, J.; Wu, L.; Tian, X.; Wang, J.; Li, L.; Han, J. Ion-Exchange Induced Mechanical Properties Enhancement and Microstructural Modifications of Transparent Lithium Aluminosilicate Glass-Ceramics. Ceram. Int. 2024, 50, 14878–14883. [Google Scholar] [CrossRef]
  11. Zheng, W.; Gao, Z.; Huang, M.; Zhang, H.; Yuan, J.; Tian, P.; Peng, Z.; Du, X. Chemical Strengthening of Lithium Aluminosilicate Glass-Ceramic with Different Crystallinity. J. Non Cryst. Solids 2022, 598, 121940. [Google Scholar] [CrossRef]
  12. Li, X.C.; Meng, M.; Li, D.; Wei, R.; He, L.; Zhang, S.F. Strengthening and Toughening of a Multi-Component Lithium Disilicate Glass-Ceramic by Ion-Exchange. J. Eur. Ceram. Soc. 2020, 40, 4635–4646. [Google Scholar] [CrossRef]
  13. Li, W.; Xiang, W.; Li, C.; Wang, J.; Li, L.; Han, J. Influence of Pre-Heating Treatment on the Crystallization and Ion-Exchange Behavior of MgO-Al2O3-SiO2 Glass-Ceramics. Ceram. Int. 2024, 50, 42933–42938. [Google Scholar] [CrossRef]
  14. Wang, S.; Guo, Y.; Lu, Y.; Liu, C.; Deng, Z.; Han, N.; Cui, J. Microstructure and Ion-Exchange Properties of Transparent Glass-Ceramics Containing Zn2TiO4/α-Zn2SiO4 Nanocrystals. J. Eur. Ceram. Soc. 2022, 42, 3595–3602. [Google Scholar] [CrossRef]
  15. Guo, Y.; Wang, J.; Ruan, J.; Han, J.; Xie, J.; Liu, C. Microstructure and Ion-Exchange Properties of Glass-Ceramics Containing ZnAl2O4 and β-Quartz Solid Solution Nanocrystals. J. Eur. Ceram. Soc. 2021, 41, 5331–5340. [Google Scholar] [CrossRef]
  16. Guo, Y.; Liu, C.; Wang, J.; Ruan, J.; Xie, J.; Han, J.; Deng, Z.; Zhao, X. Effects of Alkali Oxides and Ion-Exchange on the Structure of Zinc-Alumino-Silicate Glasses and Glass-Ceramics. J. Eur. Ceram. Soc. 2022, 42, 576–588. [Google Scholar] [CrossRef]
  17. Shakhgildyan, G.; Avakyan, L.; Atroshchenko, G.; Vetchinnikov, M.; Zolikova, A.; Ignat’eva, E.; Ziyatdinova, M.; Subcheva, E.; Bugaev, L.; Sigaev, V. Ultra-Broadband Plasmon Resonance in Gold Nanoparticles Precipitated in ZnO-Al2O3-SiO2 Glass. Ceramics 2024, 7, 562–578. [Google Scholar] [CrossRef]
  18. Lu, J.; Wang, H.; Zhu, J.; Zheng, Q.; Ding, L.; Jiang, W. Preparation and Characterization of High-Strength Glass-Ceramics via Ion-Exchange Method. Materials 2021, 14, 5477. [Google Scholar] [CrossRef]
  19. Shakhgildyan, G.Y.; Alekseev, R.O.; Golubev, N.V.; Savinkov, V.I.; Naumov, A.S.; Presnyakova, N.N.; Sigaev, V.N. One-Step Crystallization of Gahnite Glass-Ceramics in a Wide Thermal Gradient. ChemEngineering 2023, 7, 37. [Google Scholar] [CrossRef]
  20. Alzahrani, A.S. Novel Ion-Exchangeable Nepheline Glass-Ceramics for Dental Application. J. Eur. Ceram. Soc. 2023, 43, 5682–5690. [Google Scholar] [CrossRef]
  21. Tian, X.; Chen, Z.; Mu, Y.; Ji, C.; Li, L.; Wu, L.; Qiu, J.; Wang, J.; Han, J. Promotion of Phase Transformation on Ion-Exchange: Transparent Glass-Ceramics with Ultra-High Flexural Strength and Impact Resistance. J. Eur. Ceram. Soc. 2026, 46, 117885. [Google Scholar] [CrossRef]
  22. Xu, G.; Zhang, J.; He, H.; Dong, J.; Liu, J.; Wang, F.; Liao, Q.; Li, M.; Gu, Y.; Liu, L.; et al. The Effect of Ion Exchange on the Properties of MgO-Al2O3-SiO2 Transparent Glass-Ceramics. Ceram. Int. 2025, 51, 33245–33253. [Google Scholar] [CrossRef]
  23. Shakhgil’dyan, G.Y.; Savinkov, V.I.; Shakhgil’dyan, A.Y.; Alekseev, R.O.; Naumov, A.S.; Lopatkina, E.V.; Sigaev, V.N. Effect of Sitallization Conditions on the Hardness of Transparent Sitalls in the System ZnO–MgO–Al2O3–SiO2. Glass Ceram. 2021, 77, 426–428. [Google Scholar] [CrossRef]
  24. Veselov, I.A.; Naumov, A.S.; Savinkov, V.I.; Fedotov, S.S.; Alekseev, R.O.; Ignatieva, E.S.; Shakhgildyan, G.Y.; Sigaev, V.N. Ion Exchange Strengthening of Glasses of the ZnO–MgO–Al2O3–SiO2 Glass-Ceramic-Forming System with an Increased Content of Na2O. Glass Ceram. 2024, 81, 11–16. [Google Scholar] [CrossRef]
  25. Toby, B.H.; Von Dreele, R.B. GSAS-II: The Genesis of a Modern Open-Source All Purpose Crystallography Software Package. J. Appl. Crystallogr. 2013, 46, 544–549. [Google Scholar] [CrossRef]
  26. Gražulis, S.; Daškevič, A.; Merkys, A.; Chateigner, D.; Lutterotti, L.; Quirós, M.; Serebryanaya, N.R.; Moeck, P.; Downs, R.T.; Le Bail, A. Crystallography Open Database (COD): An Open-Access Collection of Crystal Structures and Platform for World-Wide Collaboration. Nucleic Acids Res. 2012, 40, D420–D427. [Google Scholar] [CrossRef]
  27. Golubkov, V.V.; Dymshits, O.S.; Petrov, V.I.; Shashkin, A.V.; Tsenter, M.Y.; Zhilin, A.A.; Kang, U. Small-Angle X-Ray Scattering and Low-Frequency Raman Scattering Study of Liquid Phase Separation and Crystallization in Titania-Containing Glasses of the ZnO–Al2O3–SiO2 System. J. Non Cryst. Solids 2005, 351, 711–721. [Google Scholar] [CrossRef]
  28. Alekseeva, I.; Baranov, A.; Dymshits, O.; Ermakov, V.; Golubkov, V.; Tsenter, M.; Zhilin, A. Influence of CoO Addition on Phase Separation and Crystallization of Glasses of the ZnO–Al2O3–SiO2–TiO2 System. J. Non Cryst. Solids 2011, 357, 3928–3939. [Google Scholar] [CrossRef]
  29. Ghose, S.; Choudhury, N.; Chaplot, S.L.; Pal Chowdhury, C.; Sharma, S.K. Lattice Dynamics and Raman Spectroscopy of Protoenstatite Mg2Si2O6. Phys. Chem. Miner. 1994, 20, 469–477. [Google Scholar] [CrossRef]
  30. Okuno, M.; Zotov, N.; Schmücker, M.; Schneider, H. Structure of SiO2–Al2O3 Glasses: Combined X-Ray Diffraction, IR and Raman Studies. J. Non Cryst. Solids 2005, 351, 1032–1038. [Google Scholar] [CrossRef]
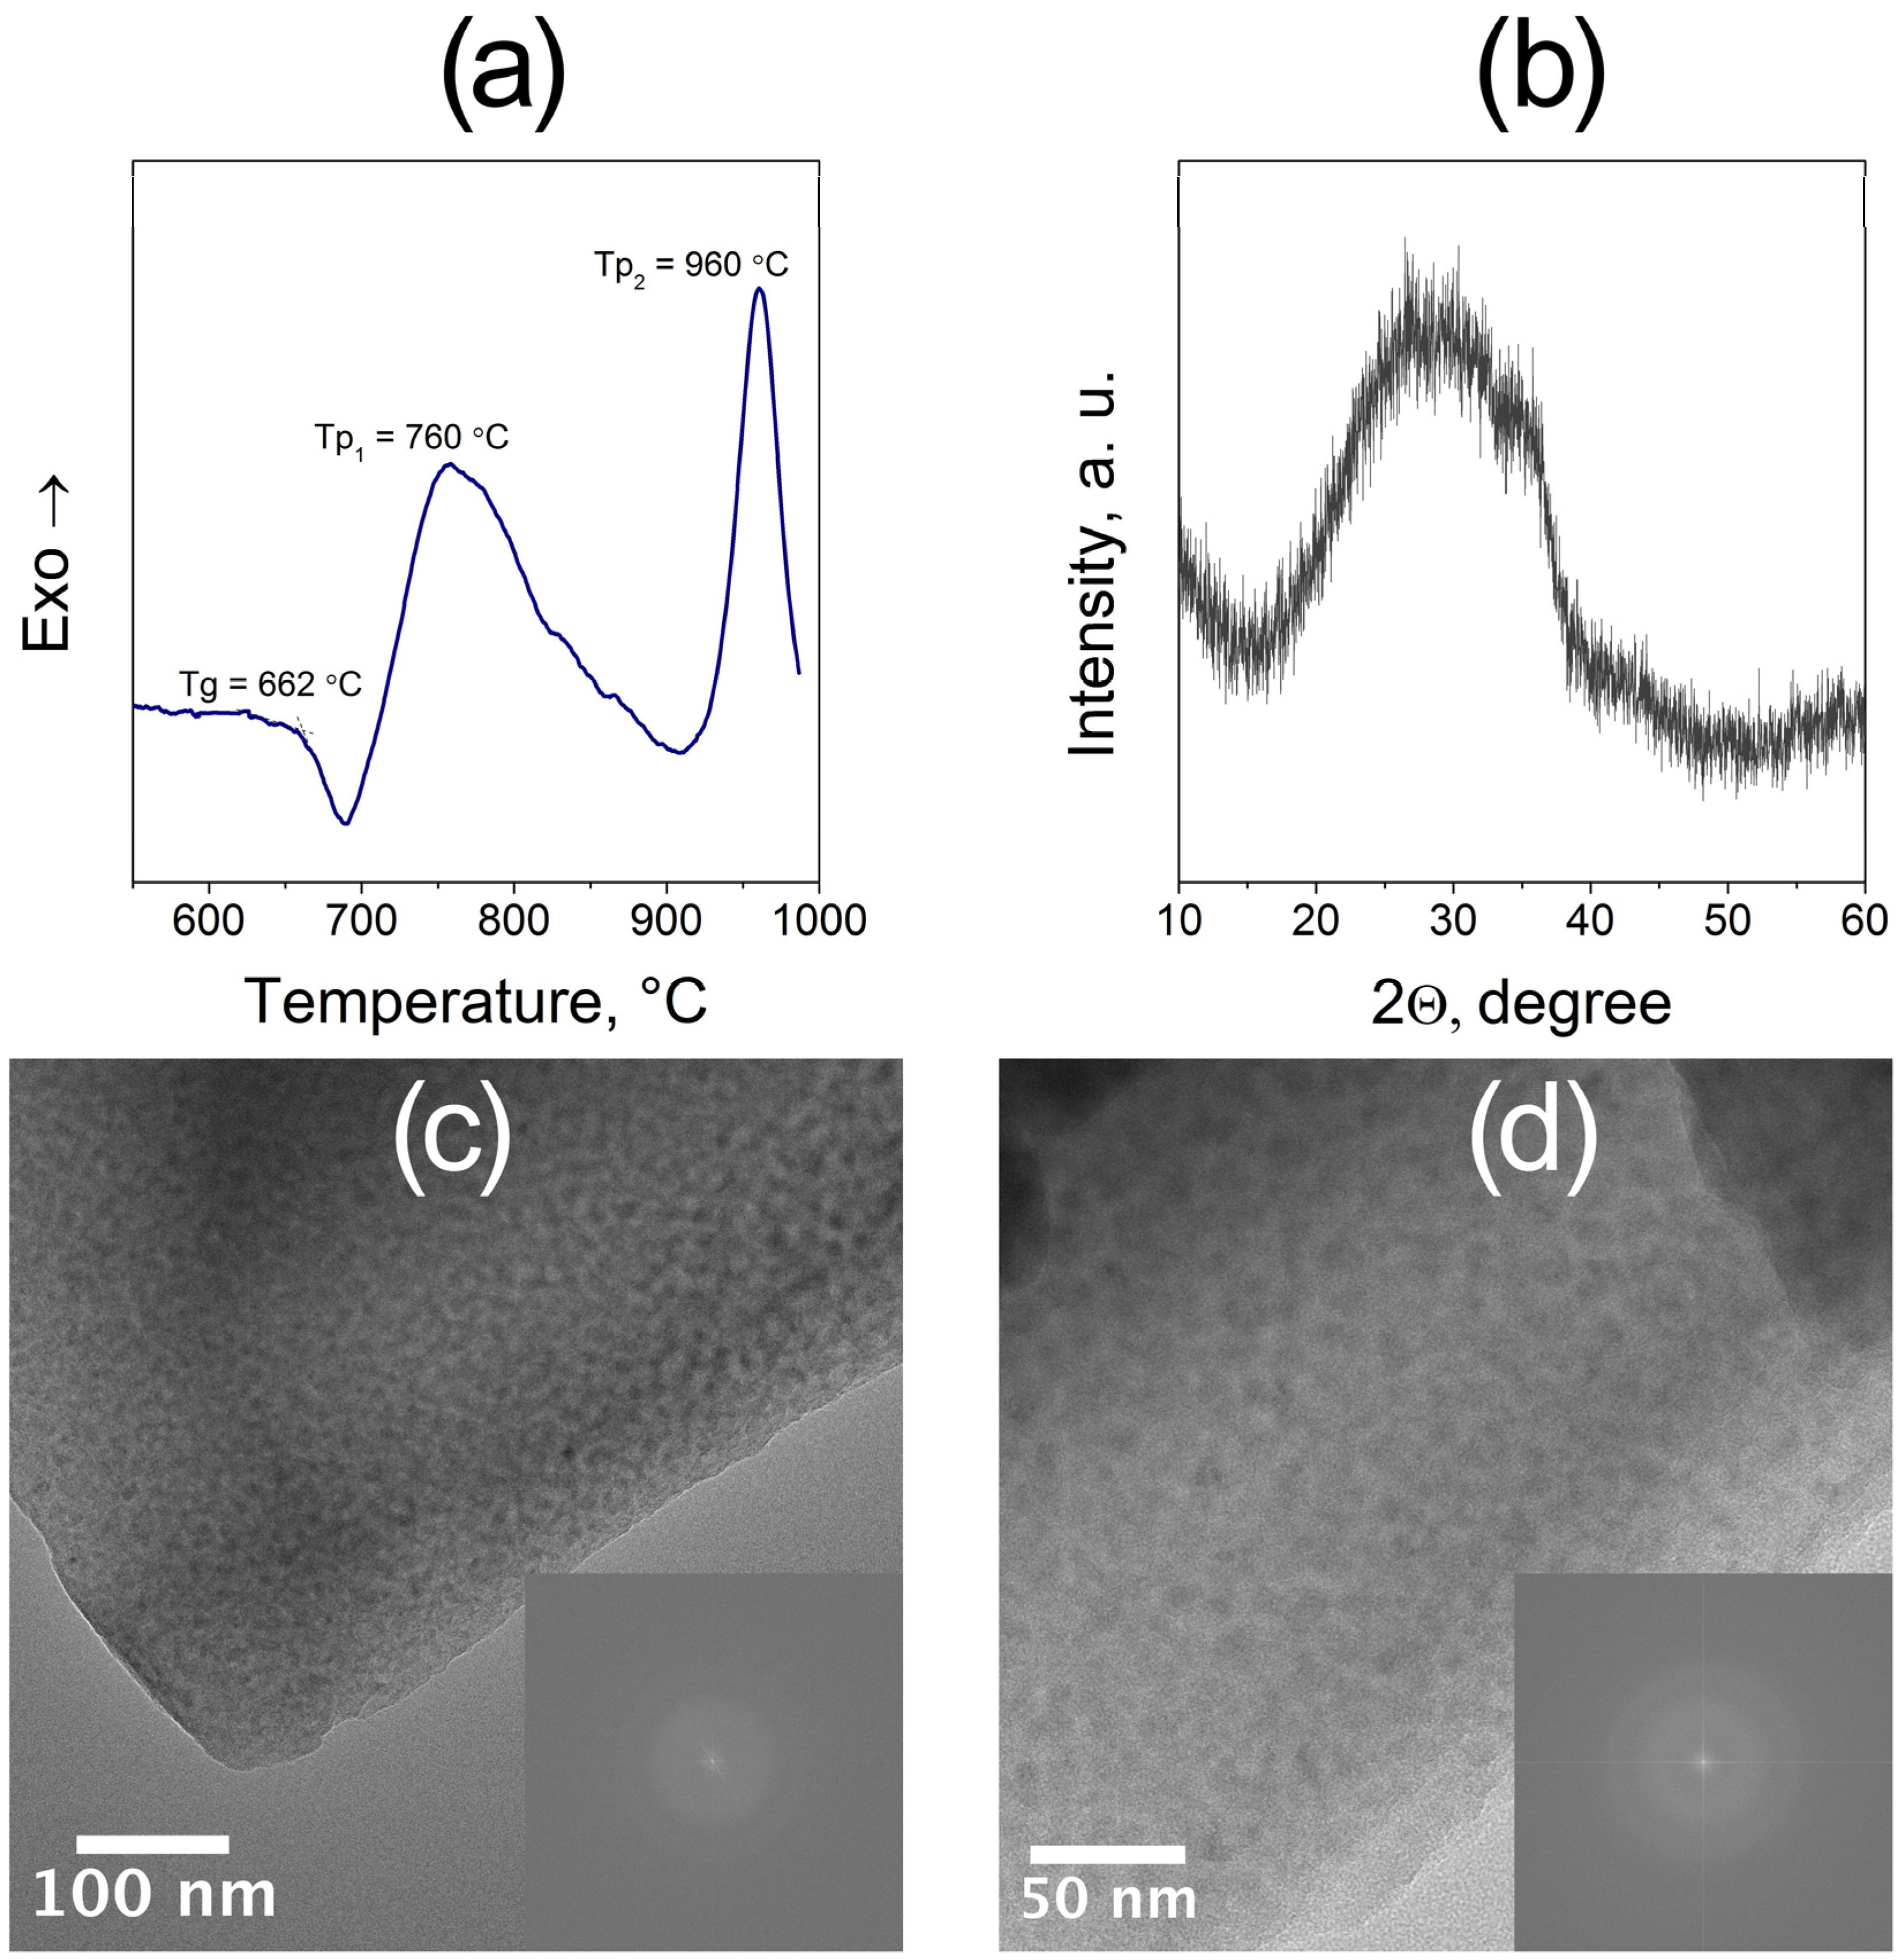
Figure 1. (a) DSC curve of the parent glass showing the glass transition temperature and two exothermic peaks corresponding to the sequential crystallization stages. (b) XRD pattern of parent glass confirming its amorphous structure. (c,d) HRTEM images of parent glass at different magnifications with corresponding SAED patterns (insets) showing diffuse rings typical of an amorphous matrix.
Materials 18 05230 g001
Figure 2. XRD patterns of the 5Na TGC heat-treated at different temperatures and durations: (a,c) transparent samples containing only ZnAl2O4 spinel; (b,d) opaque samples containing additional Zn2SiO4 and Mg2SiO4 phases.
Materials 18 05230 g002
Figure 3. (a) Experimental XRD patterns (dots) and fitted theoretical curves (lines) obtained from Rietveld refinement for selected 5Na TGC: 1-5Na-750-10, 2-5Na-750-110, 3-5Na-850-10. Panels (bd) illustrate the refined crystal structures of ZnAl2O4, Zn2SiO4, and Mg2SiO4 phases.
Materials 18 05230 g003
Figure 4. Raman spectra of the parent 5Na glass and TGCs heat-treated at different temperatures for 10 h.
Materials 18 05230 g004
Figure 5. HRTEM images of TGC heat-treated at (a) 750 °C and (b) 785 °C. Yellow circles indicate ZnAl2O4 nanocrystals in the glassy matrix.
Materials 18 05230 g005
Figure 6. (a) Dependence of the Vickers hardness of 5Na glass-ceramics on the temperature of the crystal-growth stage (10 h). Insets show photographs of the samples illustrating the gradual loss of transparency with increasing crystallization temperature. (b) Evolution of Vickers hardness during IE for the parent glass and the TGC 5Na–760–10. (c) XRD patterns of the TGC before and after 120 h of IE. (d) Optical transmission spectra of the parent glass, the TGC, and the IE TGC.
Materials 18 05230 g006
Figure 7. Optical micrographs of Vickers indents obtained under different loads (0.2–1.0 kgf) for (top) the parent glass, (middle) the TGC, and (bottom) the ion-exchanged TGC.
Materials 18 05230 g007
Table 1. Literature data on the composition and properties of TGC before and after ion-exchange strengthening.
Glass System and Alkali Oxide Content (mol.%)Main Crystalline PhaseSalt Composition and IE Treatment ConditionsVickers Hardness,
GPa (Load, kgf)
Ref.
LAS
Li2O—21
Na2O—1
Li2Si2O5
LiAlSi4O10
Before IE
Na0.95K0.05NO3
410 °С—4 h
410 °С—6 h
410 °С—8 h
410 °С—10 h
7.78 (n/a)

8.53 (n/a)
8.87 (n/a)
8.64 (n/a)
8.55 (n/a)
[9]
LAS
Li2O—15
Na2O—9
K2O—1
LiAlSiO4Before IE
(Na0.8K0.2)NO3
420 °C—4 h
7.03 (0.2)

7.62 (0.2)
[10]
LAS
Li2O—21.6
LiAlSi4O10Before IE
NaNO3
450 °C—6 h
6.95 (0.2)

7.45 (0.2)
[11]
LS
Li2O—27.5
Li2Si2O5Before IE
NaNO3
315 °C—12 h
385 °С—1 h
450 °С—1 h
5.9 (0.05)

6.5 (0.05)
6.3 (0.05)
6.2 (0.05)
[12]
ZMAS
Na2O—8
ZnAl2O4
MgAl2O4
Before IE
KNO3
440 °C—4 h
7.2 (0.2)

8.3 (0.2)
[13]
ZAS
Na2O—8.5
Zn2TiO4
Zn2SiO4
Before IE
KNO3
410 °C—4 h
430 °С—4 h
450 °С—4 h
6.6 (0.2)

7.8 (0.2)
7.7 (0.2)
7.6 (0.2)
[14]
LZAS
Li2O—5.95
ZnAl2O4
LiAlSi4O10
Before IE
NaNO3 460 °C—4 h ->
KNO3 460 °C—4 h
7.45 (0.2)

8.1 (0.2)
[15]
ZAS
Na2O–10.5
ZnO
Zn2SiO4
Before IE
KNO3
460 °C—8 h
6.3 (0.2)

7.6 (0.2)
[16]
LAS
Li2O—12.4
Na2O—2.8
β-SiO2
LiAlSi2O6
Li2SiO3
Before IE
KNO3
400 °C—10 h
420 °C—10 h
440 °C—10 h
5.2 (0.01)

7.3 (0.01)
7.4 (0.01)
7.7 (0.01)
[18]
NAS
Na2O—15
NaAlSiO4Before IE
KNO3
600 °C—8 h
4.4 (n/d)

6.3(n/d)
[20]
LAS
Li2O—15
Na2O—9
LiAlSiO4
NaAlSiO4
Before IE
Na0.85K0.15NO3
430 °C—4 h
450 °C—4 h
470 °C—4 h
490 °C—4 h ->
KNO3
380 °C—4 h
400 °C—4 h
420 °C—4 h
440 °C—4 h
7.4 (0.2)

7.5 (0.2)
7.5 (0.2)
7.5 (0.2)
7.5 (0.2)

8.0 (0.2)
8.1 (0.2)
8.2 (0.2)
8.1 (0.2)
[21]
ZMAS
Na2O—5.9
MgAl2O4
ZnAl2O4
SnO2
ZrO2
Before IE
Na0.02K0.98NO3
450 °C—5 h
470 °C—5 h
490 °C—5 h
7.0 (0.2)

8.0 (0.2)
8.1 (0.2)
8.2 (0.2)
[22]
Table 2. Refined structural parameters of crystalline phases in 5Na TGC obtained from Rietveld analysis: lattice parameters (a), crystallite size (D), cation occupancies (Zn:Mg), phase fractions, and goodness of fit (GOF). The measurement uncertainty falling at the last digit is shown in brackets.
SampleCrystalline PhasePhase Fraction, wt.%Cell Parameters, ÅCrystallite Size, nmSite Occupancy
Zn:Mg
GOF
5Na-750-10ZnAl2O41008.223 (3)3.7 (1)55:45 (2)1.52
5Na-760-10ZnAl2O41008.207 (3)4.1 (1)52:48 (2)1.27
5Na-750-25ZnAl2O41008.234 (3)3.8 (1)48:52 (2)1.27
5Na-750-110ZnAl2O4838.220 (3)3.9 (1)57:43 (2)1.35
Zn2SiO41713.905 (4), 9.302 (2)25.8 (7)45:55 (5)
5Na-800-10ZnAl2O4868.205 (2)5.0 (1)62:38 (1)1.39
Zn2SiO4513.94 (2), 9.28 (1)12 (1)100:0 *
Mg2SiO494.762 (4), 10.222 (7), 6.000 (5)28.8 (4)0:100 *
5Na-850-10ZnAl2O4728.141 (2)9.9 (2)81:19 (3)2.07
Zn2SiO41013.909 (4), 9.307 (2)66 (5)80:20 (10)
Mg2SiO4184.769 (2), 10.239 (4), 5.982 (3)56 (6)15:85 (3)
5Na-700-24ZnAl2O4808.204 (6)3.3 (1)49:51 (3)1.12
Zn2SiO4714.51 (3), 8.38(1)3 (1)100:0 *
Mg2SiO4134.69 (3), 10.09 (6), 6.08 (4)7 (2)0:100 *
ReferenceZnAl2O4-8.085---
Zn2SiO4-13.971, 9.334--
Mg2SiO4-4.752, 10.193, 5.977--
* Site occupancies for minor phases were fixed due to their small fraction.
Disclaimer/Publisher’s Note: The statements, opinions and data contained in all publications are solely those of the individual author(s) and contributor(s) and not of MDPI and/or the editor(s). MDPI and/or the editor(s) disclaim responsibility for any injury to people or property resulting from any ideas, methods, instructions or products referred to in the content.