Article

In Search of Ultra-Black Ceramic Pigments Using Microwaves: Delafossite Cuprates CuMO2 (M = Mn, Fe, Cr)

1
Department of Inorganic and Organic Chemistry, University Jaume I, 12071 Castelló de la Plana, Castelló, Spain
2
Department of Mechanic Engineering and Construction, University Jaume I, 12071 Castelló de la Plana, Castelló, Spain
*
Author to whom correspondence should be addressed.
Materials 2025, 18(21), 4910; https://doi.org/10.3390/ma18214910
Submission received: 21 September 2025 / Revised: 14 October 2025 / Accepted: 15 October 2025 / Published: 27 October 2025

Abstract

Cuprate delafossite phases such as CuMnO2 (crednerite) and CuFeO2, as well as iron- and manganese-doped mcconnellite composites, were investigated as candidates for producing intense black ceramic pigments via conventional solid-state synthesis. Both electric kiln and fast dielectric (microwave) firing methods were employed, with mcconnellite (CuCrO2) used as a reference pigment. Microwave firing led to a marked improvement in sample blackness compared to conventional electric firing. Among the delafossite phases, only mcconnellite subjected to microwave-assisted firing (RVis = 1.40%, corresponding to 98.60% visible light absorption) emerges, pending further optimization, as a promising candidate for an ultra-black ceramic pigment (RVis < 1%) under optimized glaze conditions (ZnO-free) and a firing temperature of 1000 °C. Considering the pigments in powder form, microwave-fired crednerite (RVis = 4.85%, 95.15% absorption) and iron- and iron–manganese-doped mcconnellite composites (RVis = 3.27% and 3.23%, respectively) appear as potential candidates for deep-black pigments (RVis < 3%), benefiting from the composite effect between the delafossite phase and the associated chromium spinel. Moreover, microwave-fired crednerite also demonstrates noteworthy potential for deep-black coloration in glazed samples (RVis = 4.27%, 95.73% absorption).

1. Introduction

Discovered by Friedel in 1873, the mineral CuFeO2 [1], named delafossite in honour of the French mineralogist and crystallographer Gabriel Delafosse, gave its name to the ABO2 oxide family (delafossites), which have recently attracted growing scientific interest [2,3,4], particularly since Kawazoe et al. demonstrated the coexistence of optical transparency and p-type conductivity in CuAlO2 [5,6]. Delafossite cuprates, with the general formula ABO2 (A+ = Cu; B3+ = Mn, Fe, Cr), possess a layered structure composed of BO6 octahedral sheets linked by linearly coordinated O–A+–O dumbbells. Pabst (1939) first described the trigonal delafossite structure (space group R-3m), while Köhler and Jansen later reported the equivalent hexagonal modification (space group P63/mmc) [7,8]. At room temperature, however, crednerite (CuMnO2) adopts a unique monoclinic layered structure consisting of edge-shared MnO6 octahedra and linearly coordinated Cu+ ions. This arrangement is interpreted as a Jahn–Teller distortion of the delafossite structure induced by Mn3+ ions, making crednerite an intriguing derivative of the delafossite family with promising potential in catalytic applications [9].
The commercial sprayable coating Vantablack (a portmanteau of VANTA, “Vertically Aligned Nanotube Arrays,” and “black”) is an ultra-black surface (L*a*b*= 0.2/0.9/–1; visible reflectance RVis = 0.035%) produced by chemical vapour deposition (CVD). It absorbs up to 99.965% of incident visible light [10,11]. Ultra-black surfaces conceal surface irregularities and textures, eliminate glare, and render objects nearly invisible, making them highly valuable in space science and optical applications; for instance, in enhancing telescope sensitivity and suppressing stray light in precision optical instruments. In general, an ultra-black surface is defined as one that absorbs more than 99% of incident light (RVis < 1%) [10,11]. By contrast, commercial black pigments typically exhibit RVis values below 5%, while Industry Tint Reference Black (ITRB) coatings reach approximately RVis ≈ 3%. Therefore, a deep-black surface may be defined as one that absorbs more than 97% of visible light, corresponding to RVis < 3%.
In nature, several organisms exhibit ultrablack pigmentation as an adaptive trait shaped by selective pressures within their environments. This pigmentation enhances the visibility of sexually selected colours in peacock spiders and birds-of-paradise, provides thermoregulatory or camouflage advantages to vipers, and aids butterflies in evading predators. Such anti-reflective mechanisms based on ultrablack pigmentation play a crucial role in survival and reproductive success [12].
To produce ultrablack coloration, organisms have evolved sophisticated mechanisms centred on eumelanin (from the Greek εὖ μέλας, meaning “true black”). Eumelanin, the black component of the melanin pigment family, is synthesized through melanogenesis; a biochemical process involving the oxidation of the amino acid tyrosine to 5,6-dihydroxyindole, followed by polymerization [13]. However, while eumelanin can generate a deep black colour, it may still exhibit surface gloss, as seen in shiny fur or feathers. In contrast, ultrablack coloration lacks gloss and instead appears matte, owing to hierarchical surface microstructures that modulate light interactions and minimize reflection. Similarly, the microstructure morphology of Vantablack coatings is critical for achieving their exceptional light-absorbing properties [10,11].
Table 1 reports a comparison of black colours published in the recent literature. Commercial black pigments are derived from cobalt ferrochromite (DCMA 13-40-9) and nickel ferrochromite (DCMA 13-50-9), though it is easy to find industrial pigments using other cations, such as Mn. The usual L*a*b* parameters of ferrochromite commercial powder are around 41.0/1.0/1.0 that improve when dispersed in glaze (5 wt%) to values around 33.0/1.0/0.0 with an estimated reflectance in visible range RVis of 3.5 and 4.5% in powder and glaze, respectively [14,15].
In a recent study [11], the authors investigated the potential to develop intense black ceramic pigments comparable to, or surpassing, carbon black (L*a*b* = 20.2/0.1/0.1; visible, near-infrared, and total reflectance values RVis/RNIR/R = 3/3/3%). Carbon black is widely regarded as the reference standard for black inorganic pigments used in paints; however, its poor thermal stability makes it unsuitable for high-temperature ceramic applications.
This goal could be achieved using various cuprates based on spinels, such as CuCr2O4 [16] or mcconnellite [17]. The tetragonal distorted spinel CuCr2O4 improves the black colour of ferrochromites, showing the powder L*a*b* = 40.5/0.1/−0.1 and RVis/RNIR/R = 4.2/3.4/3.8, which improves when was 0.5 wt% glazed in soda-lime glass (800 °C) (L*a*b* = 26.3/−0.3/−0.5 and RVis/RNIR/R = 3.8/4.5/4.1), reflecting the 96.2% of visible light incident. Likewise, exploring the effect of microwave synthesis on cuprates, using dielectric firing assisted by microwaves (60 min at 800 W), mcconnellite-synthesized pigment powder shows a good black shade (L*a*b* = 36.5/−4.8/−0.8 and RVis/RNIR/R = 9.9/11.2/10.5), and 5 wt% glazed in a zinc-free ceramic glaze with maturation point at 1000 °C produces an intense coloured black glaze surface with L*a*b* = 11.3/−0.6/−3.0, associated with RVis/RNIR/R = 1.4/1.9/1.6, thus reflecting 98.6% of the visible light, which borders on ultrablack behaviour. The microstructure of powder prepared by fast dielectric firing and the nature of the glaze enhances the black yield of the glassy coating. Likewise, the presence of zinc in the glaze composition should be avoided, because it reacts with the pigment to produce high stability zinc spinel such as gahnite ZnAl2O4 or ZnCr2O4 and exsolve copper (II) in the glassy matrix, creating a shift in colour to green-blue shades [16,17]. Other cuprates such as CuFe5O8 are codoped with 0.2 molar of MnO2 and 0.75 molar of Ni2O3; using 6.25% of MgO as a mineraliser produces black powders of L*a*b* = 21.36/1.10/−0.24 and 5 wt% when glazed at 1000 °C (with 5.12 wt% of ZnO in its composition). This improves the black colour to L*a*b* = 16.95/−0.18/−0.12, which is lower than that obtained by the simple mcconnellite but better than that of CuCr2O4 and ferrochromite spinels [18]. Four other important black pigments, such as Cr–hematite to Mn–melilite, were utilized for glazes in [19] and are also included in Table 1. The chromium-doped hematite with RVis of 4 and 4% in powder and glaze at 1000 °C, respectively, and the perovskite YMnO3 with RVis of 3 and 7% in powder and glaze at 1000 °C, respectively, stood out. Therefore, from the literature data, delafossite cuprates appear as possible candidates to produce ultrablack ceramic pigments.
In this study, the use of other delafossite cuprates, including CuMnO2 and CuFeO2, as well as iron- and manganese-doped mcconnellite composites, was investigated as potential candidates for producing intense black ceramic pigments. The materials were synthesized via conventional solid-state methods and fired using both electric kilns and fast dielectric (microwave) furnaces, with mcconnellite (CuCrO2) employed as the reference pigment. To the best of our knowledge, the synthesis, characterization, and application of cuprate delafossites (crednerite, delafossite, and mcconnellite) as ceramic pigments in glazes aimed at achieving ultrablack (RVis < 1%) or deep-black (RVis < 3%) surfaces have not previously been reported.

2. Materials and Methods

Delafossite CuMO2 (M = Mn,Fe,Cr) pigments were synthesized by solid-state method using tenorite CuO, eskolaite Cr2O3, bixbyite Mn2O3, and hematite Fe2O3 oxides as precursors, with a particle size of 0.3–5 µm (supplied by QUIMIALMEL SA, Castelló, Spain, 99.8 wt% purity). The precursors were mechanically homogenized in an electric grinder (20,000 rpm) for 5 min and then fired at 1100 °C for 3 h in electric kiln and also using fast microwave-assisted dielectric firing [20,21].
This hybrid microwave-assisted heat treatment of solid reactant mixtures is conducted in a closed kiln internally coated with a susceptor, which functions as an external heater during the initial stage of microwave irradiation [22]. Upon exposure to microwaves, the susceptor rapidly increases in temperature and transfers heat to the reactant mixture by radiation and/or conduction. Once the mixture reaches the critical temperature of the irradiated material, it begins to absorb microwave energy directly and continues heating autonomously.
In this study, dielectric firing was performed using a conventional microwave equipment operating at 900 W and 2.45 GHz, equipped with a cylindrical kiln for preheating the reactant mixture. The kiln (inner dimensions: height 4.5 cm, diameter 13.5 cm) was constructed from aluminosilicate fibreboard (density: 0.3 g cm−3), a material transparent to microwaves with penetration depths of 0.007 m at room temperature and 0.0025 m at 1300 °C. The kiln interior was coated with α-SiC (hexagonal, density: 3.2 g cm−3) serving as a susceptor (Glass Fusing & Cutting Tools, Tianjin, China; product code 1282151), as previously described in [17]. The temperature during firing was estimated using Process Temperature Control Rings, M.E. SCHUPP, Aachen, Germany (PTCR, ETH type, 850–1100 °C). Based on PTCR shrinkage measurements taken with a micrometre, the estimated temperatures reached approximately 950 °C after 20 min, 1050 °C after 30 min, and 1150 °C after 60 min of irradiation.
X-ray Diffraction (XRD) was performed on a Siemens D5000 diffractometer using Cu Kα radiation (10–70°2θ range, scan rate 0.03°2θ, 5 s per step and 40 kV and 20 mA conditions). Additional XRD processes with the addition of 30 wt% of α-Al2O3 as an internal measurement pattern (10–70°2θ range, scan rate 0.02°2θ, 10 s per step and 40 kV and 20 mA conditions) were performed for cell parameters estimations. The lattice constants were determined from corrected peak positions using α-Al2O3 as standard and least square refinement programmes.
The L*a*b* colour parameters of samples were measured according to the CIE-L*a*b* (Commission Internationale de l’Éclairage) [23], using an X-Rite SP60 spectrometer with standard lighting D65 and a 10° observer. L* measures the lightness (100 = white, 0 = black) and a* and b* the chromatic components (−a* = green, +a* = red, −b* = blue, +b* = yellow).
The tolerance ΔE* (based on the L*a*b* parameters), is evaluated using Equation (1):
Δ E * = Δ L * 2 + Δ a * 2 + Δ b * 2
UV–Vis–NIR spectra of the samples were recorded using a Jasco V-670 diffuse reflectance spectrophotometer. The optical band gaps were estimated using the Tauc method [24]. For the optimized pigments, optical reflectance spectra were collected over the 350–2500 nm range. The total solar reflectance (R), the solar reflectance in the near-infrared range (RNir), and the solar reflectance in the visible range (RVis) were evaluated from the UV–Vis–NIR diffuse reflectance spectra. These parameters were calculated as the ratio between the integral of the measured spectral irradiance multiplied by the solar irradiance and the integral of the solar irradiance over the same wavelength interval, namely 350–2500 nm for R, 700–2500 nm for RNIR, and 350–700 nm for RVis, as expressed in Equation (2):
R = 350 2500 r λ i λ d λ 350 2500 i λ d λ
where r(λ) is the dimensionless spectral reflectance measured from UV–Vis–NIR spectroscopy and ) is the standard solar irradiance (Wm−2nm−1), according to the American Society for Testing and Materials (ASTM)’s Standard G173-03 [25] The solar absorption spectrum of the samples, representing their wavelength-dependent absorption relative to solar irradiance, was calculated by evaluating the numerator and denominator of the equation at each wavelength.
The pigmenting capacity of the samples was evaluated by incorporating the pigment into a double-firing frit, zinc-free, with a maturation point of 1000 °C (composition in wt%: SiO2 72, Na2O 14, K2O 1.5, CaO 9, Al2O3 2.3; average grain size: 3–20 μm; supplied by Torrecid S.A., l’Alcora, Spain). Glazed samples were prepared on white stoneware tile substrates. The glaze was manually mixed with the pigment and water in a weight ratio of 100:5:40 using an agate mortar and applied to a thickness of approximately 1500 μm using the Doctor Blade technique. A 40% shrinkage of the glaze layer was observed after firing.
Molten glazes interact with pigment particles through dissolution or chemical reactions, potentially leading to pigment degradation or colour alteration. The aggressiveness of the glaze depends on both its chemical composition and the firing temperature. The Dry Color Manufacturers Association classifies pigment powders into three categories [26,27]:
-
Category A deals with pigments suspended in glass matrixes which require the highest degree of heat stability and chemical resistance to withstand the attack of molten glass.
-
Category B deals with pigments suspended in plastics and other polymers, which require only moderate heat stability.
-
Category C deals with pigments suspended in liquid vehicles, which require little, or no heat stability.
Ceramic pigments belong to Category A, showing stability and chemical resistance to molten ceramic glazes: Vantablack and Carbon Black belong to Category C and B, respectively.
In the field of polymers, Carbon Black is the reference standard for deep-black shades. The Industry Tint Reference Black (ITRB) is a standardized Carbon Black material used to evaluate the tinting strength of other Carbon Black pigments in polymers, following ASTM D3265 [28] or ISO 5435 [29] test methods. These methods involve mixing the black standard with zinc oxide and a liquid organic plasticizer. The resulting paste is mulled, homogenized, and spread as a layer of uniform thickness. Its light reflectance is then measured with a reflectometer and compared to a paste prepared with the sample under investigation.
Three specific metrics are used to quantify the degree of blackness based on tristimulus values ((X, Y, Z) for the sample and (Xn, Yn, Zn) for the reference): (a) blackness (My = 100 log10(Yn/Y)) measures the overall degree of blackness and is directly related to reflectance; (b) jetness or darkness (Mc = 100 [log10(Xn/X) + log10(Yn/Y) − log10(Zn/Z)]) reflects the colour-dependent black value, influenced by primary particle size, surface area, and dispersion in the polymer; and (c) undertone (dM = Mc − My) indicates whether the black exhibits a brown-reddish undertone (dM < 0), is neutral (dM = 0), or shows a bluish undertone (dM > 0), the latter often being preferred [30,31]. These metrics, however, are not directly applicable to ceramic pigments, which must remain stable at high temperatures when incorporated into ceramic glazes.

3. Results and Discussion

3.1. Characterization of Powders: Effect of Microwaves Firing

Figure 1 and Table 2 summarize the properties of the powders (fired in an electric kiln and via microwave irradiation for 30 min at 900 W) and of samples containing 5 wt% pigment glazed in a ZnO-free frit with a maturation temperature of 1000 °C.
All powders fired in the electric furnace exhibited a dark black appearance. However, subtle undertones were observed: manganese crednerite displayed a reddish-brown hue (a* > 0), iron delafossite powders exhibited a bluish undertone (b* < 0), and mcconnellite showed a greenish undertone (a* < 0). The visible-range reflectance (RVis) follows the sequence 1MnCE < 3CrCE < 2FeCE, corresponding to a blackness order of 1MnCE > 3CrCE > 2FeCE. This trend is consistent with the increasing band gap (in the NIR range) and decreasing ΔE* values with increasing blackness (Table 2).
For microwave-fired powders, the RVis sequence differs (1MnMW < 3FeMW < 2CrMW) and is associated with increasing ΔE*, although the band gap values are comparable to those of the electrically fired samples and follow the same sequence. Microwave firing reduced RVis for the Mn and Fe samples, enhancing their blackness, whereas the Cr sample exhibited a slightly higher RVis under microwave firing compared to the electric-fired sample.
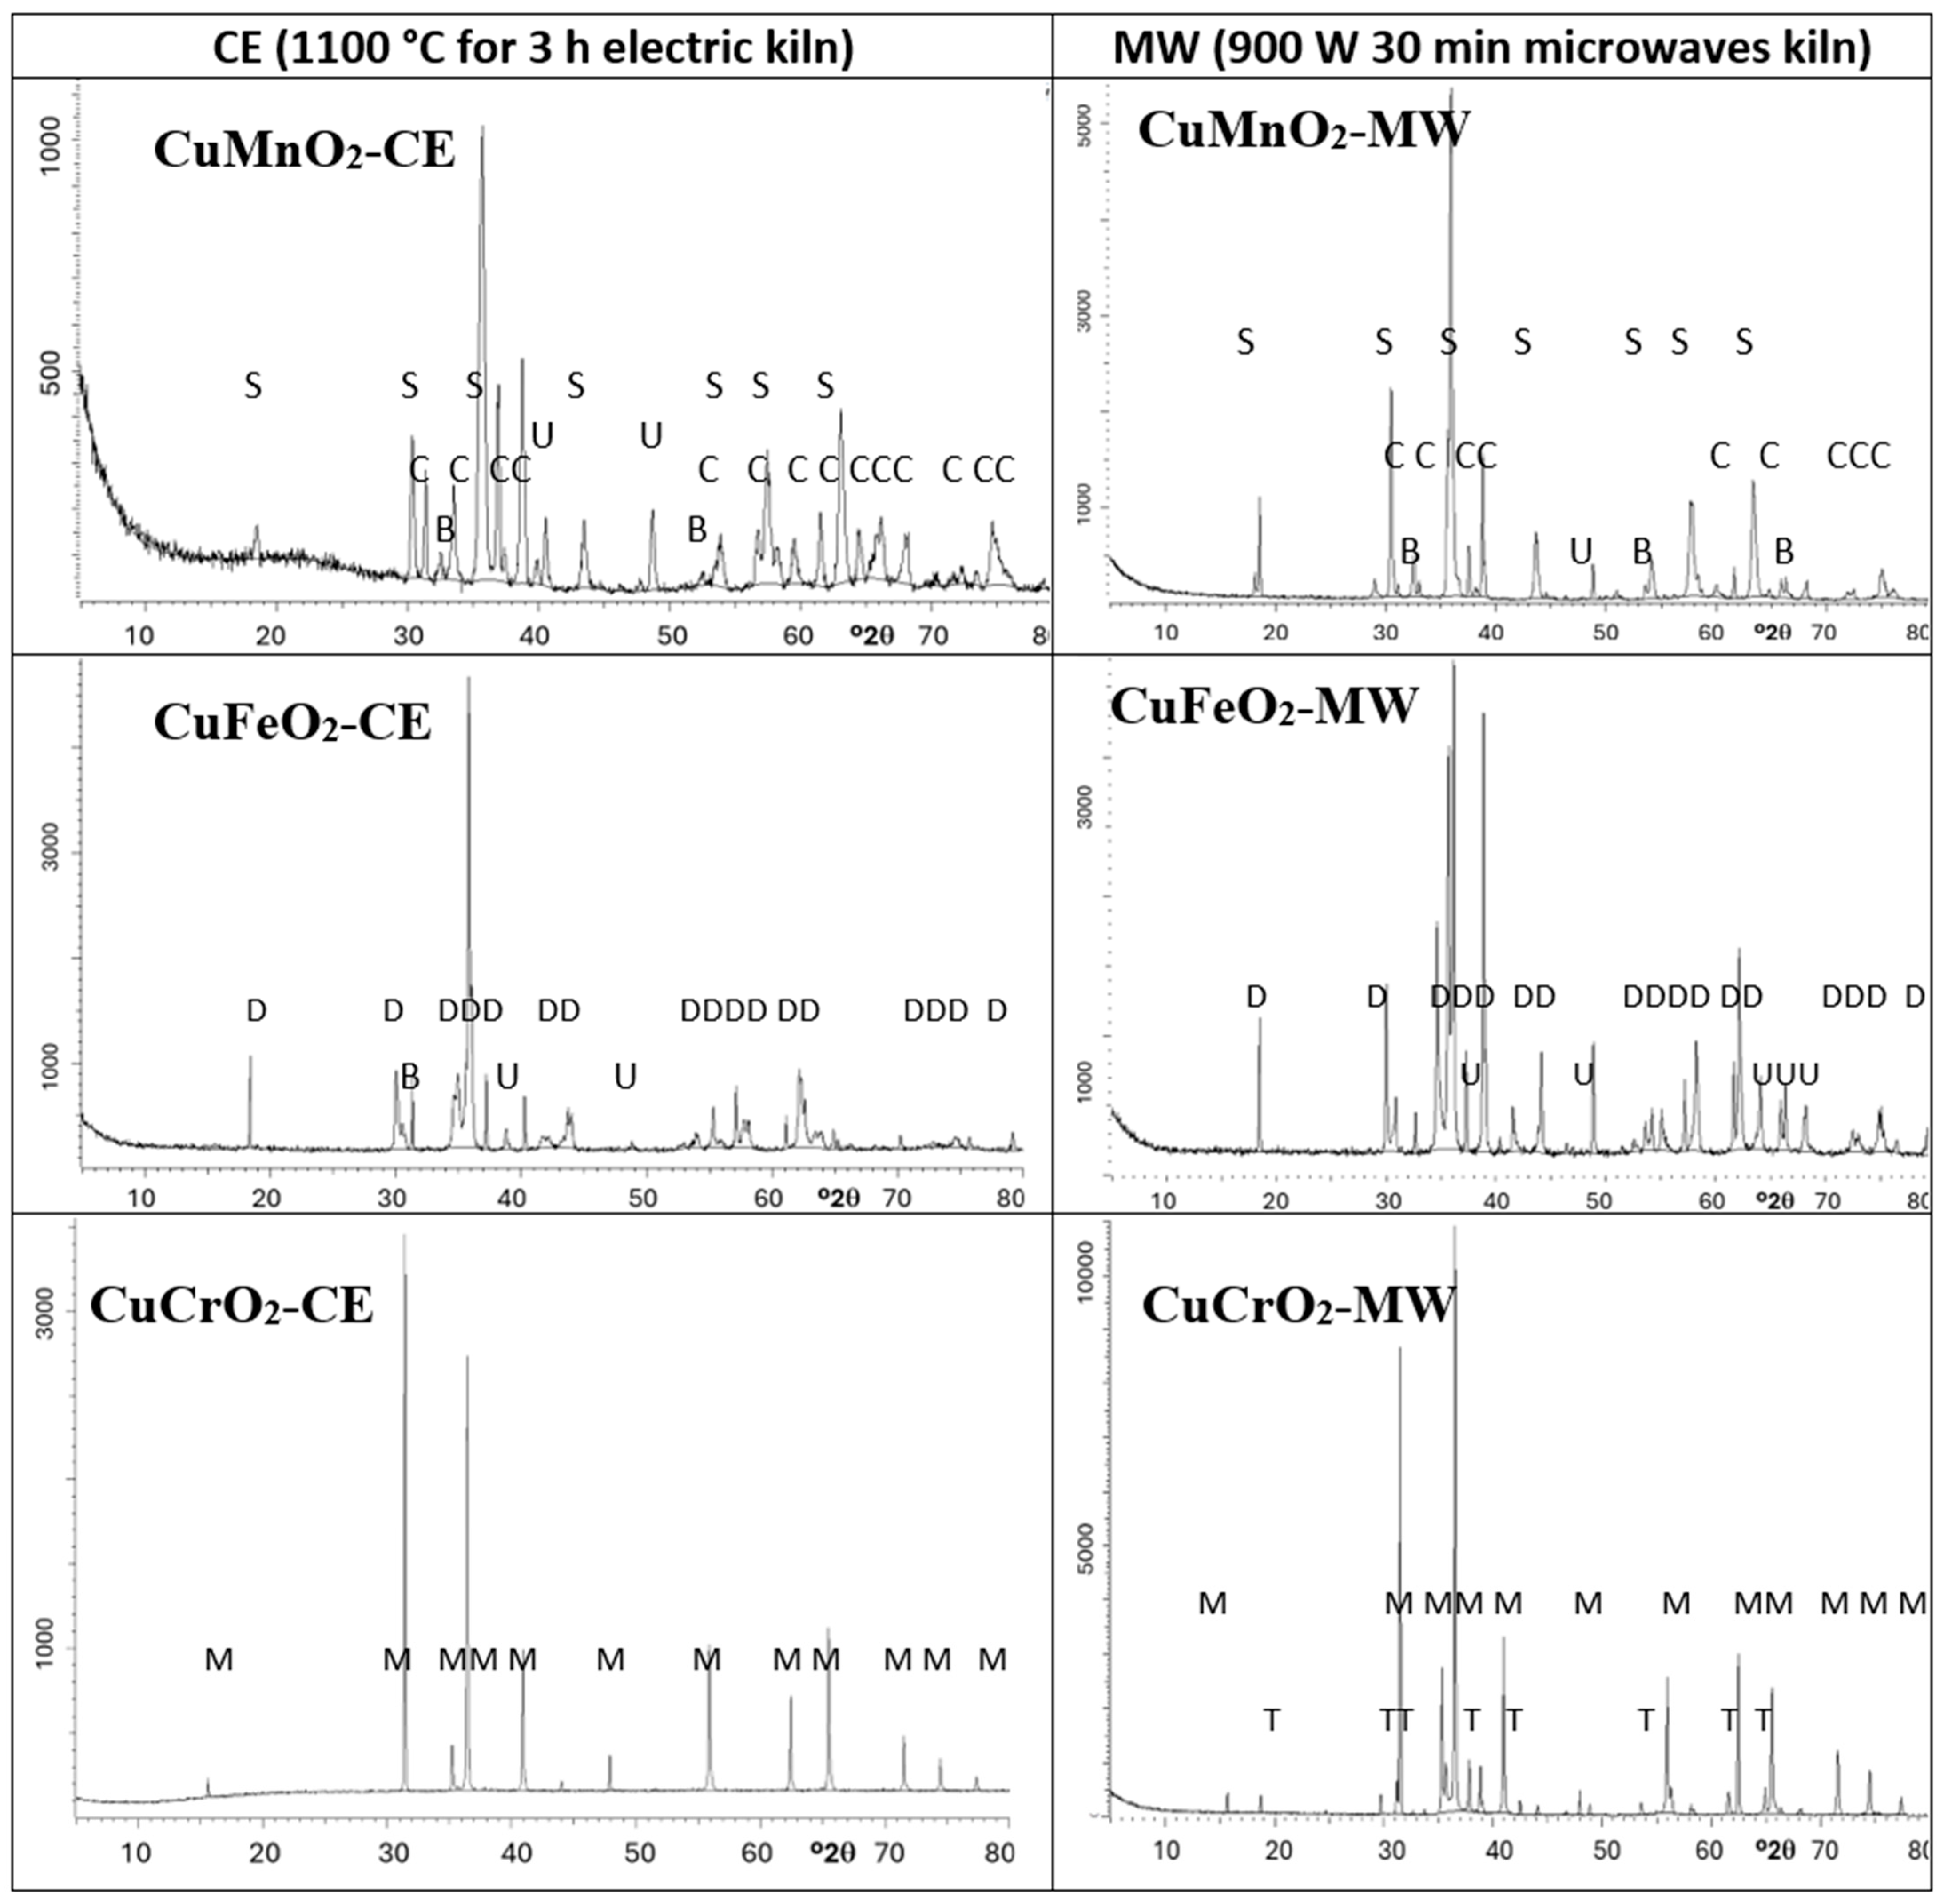
The XRD diffractograms of samples are shown in Figure 2 and the crystalline phases identified are summarized in Table 3.
In the case of crednerite (CuMnO2), the spinel phase CuMn2O4 crystallizes alongside monoclinic crednerite under conventional electric kiln firing. However, when synthesized using a microwave kiln (1MnMW), crednerite exhibits very weak XRD peak intensities. Residual peaks corresponding to CuO and Mn2O3 are also detected in both samples. The observed phase composition aligns with the Cu–Mn–O phase equilibria [32], where crednerite is metastable at room temperature and its formation is strongly dependent on the heat treatment of the oxide mixture. As reported in [33,34,35], the XRD pattern of CuMnO2, prepared via low-temperature exchange reactions and essentially free of impurities, can be indexed to a monoclinic crednerite structure (space group C2/m). Thermogravimetric analysis (TGA) reveals an oxygen uptake, resulting in a reversible transition to the oxygen-rich spinel CuxMn2–xO₄ (x ≈ 1.03). Subsequent firing above 940 °C induces oxygen loss, converting the oxide back to Cu1.1Mn0.9O2, with residual spinel remaining as an impurity. At 1150 °C, CuMnO2 undergoes peritectic melting, and XRD indicates the coexistence of cubic spinel and CuO/Cu2O phases. Consistently, sample 1MnCE was observed to melt after firing at 1200 °C for three hours.
The indexing of monoclinic crednerite CuMnO2 (C2/m ICDD 50-0860) diffraction peaks for 1MnCE indicates a unit-cell volume slightly larger than previously reported values (V = 93.5(3) Å3, compared with 92.5 Å3 by Trari et al. [33] and 92.1 Å3 in the literature [34,35]) (Table 4). CuMnO2 forms a solid solution of the general composition Cu+1−x−2yCu2+yMn3+1−xMn4+xO2, with cationic defects located within O–Cu–O dumbbells. In copper manganite, CO conversion is governed by the redox equilibrium Cu+ + Mn3+ ⟷ Cu2+ + Mn4+, where CO chemisorbs on Cu2+/Mn4+ sites and O2 on Cu+/Mn3+ sites [36]. The ionic radius of Cu+ (0.60 Å, CN = 2) in O–Cu–O dumbbells is larger than that of Cu2+, whereas Mn3+ in octahedral coordination (0.72 Å for low spin; 0.785 Å for high spin) is larger than Mn4+ (0.67 Å) [37]. Consequently, the substitution of Cu2+ into O–Cu–O sites, accompanied by the reduction of Mn4+ to Mn3+ in octahedra, leads to lattice expansion, producing a net dilation consistent with the experimentally observed unit-cell volume. The indexing of peaks of spinel CuMn2O4 as cubic phase (Fd3m ICDD 74–2422) for 1MnCE and 1MnMW gives a cell parameter of a = 8.308(1) Å, which is very close to the literature data [38] (Table 4).
The different compositions of the samples, with a composite of spinel and crednerite undergoing the electric firing and the spinel as the only phase undergoing microwave firing, explains the slight decrease in RVis in the microwave-fired sample (5.47 and 4.85% for 1MnCE and 1MnMW, respectively), indicating the lower black colour of the crednerite CuMnO2 than that of the CuCr2O4 spinel. However, additional factors may also be involved, such as the so-called “composite effect” arising from pigments composed of different elements and compounds. This effect can modify the reflection, absorption, and scattering of light, thereby generating distinct colour characteristics. Furthermore, the size and morphology of pigment particles influence their optical behaviour: larger particles generally enhance light scattering, whereas smaller particles promote greater light absorption. In this case, the composite effect may contribute to the enhanced blackness of 1MnCE, while the smaller particle size of 1MnMW) likely intensifies its black appearance. The combined influence of these factors accounts for the slightly increased blackness observed in 1MnMW.
For delafossite CuFeO2, both samples display intense peaks corresponding to the delafossite phase (space group R-3m). In contrast to the electrically fired sample (2FeCE), which exhibits only very weak peaks of unreacted oxides, the microwave-fired sample (2FeMW) shows pronounced peaks corresponding to tenorite (CuO). The indexing of the delafossite peaks (ICDD 75-2146; Table 4) reveals lattice parameters slightly lower than those reported in the literature [39]. Specifically, the cell volume of the delafossite in 2FeCE is marginally smaller than that of 2FeMW (V = 136.0(3) and 135.8(3) Å3 for 2FeMW and 2FeCE, respectively, compared to 136.8668 Å3 in reference [39]).
The composite effect in sample 2FeMW (CuO intimately mixed with CuFeO2), along with the possibly lower blackness of delafossite compared with tenorite CuO, can explain the decrease in RVis for the microwave-fired powder (6.87% and 6.45% for 2FeCE and 2FeMW, respectively).
For the reference mcconnellite, XRD analysis shows that CuCrO2 crystallizes as the predominant phase in both electrically fired (3CrCE) and microwave-fired (3CrMW) samples. In the electrically fired 3CrCE, only mcconnellite peaks are observed. In contrast, the microwave-fired 3CrMW exhibits weak peaks correspond to a tetragonally distorted spinel, CuCr2O4. The indexing of the mcconnellite peaks (space group R3m, ICDD 39-0247; Table 4) indicates lattice parameters slightly higher than those reported in the literature [40,41]. Specifically, the cell volume of mcconnellite in 3CrMW is marginally larger than in 3CrCE (V = 127.9731 Å3 in reference [40,41], 129.7(4) Å3 for 3CrMW, and 129.9(5) Å3 for 3CrCE).
The high content of black-coloured mcconnellite in the 3CrCE sample explains the slight increase in RVis (i.e., a decrease in blackness) in the microwave-fired sample (RVis = 6.10% and 6.98% for 3CrCE and 3CrMW, respectively)
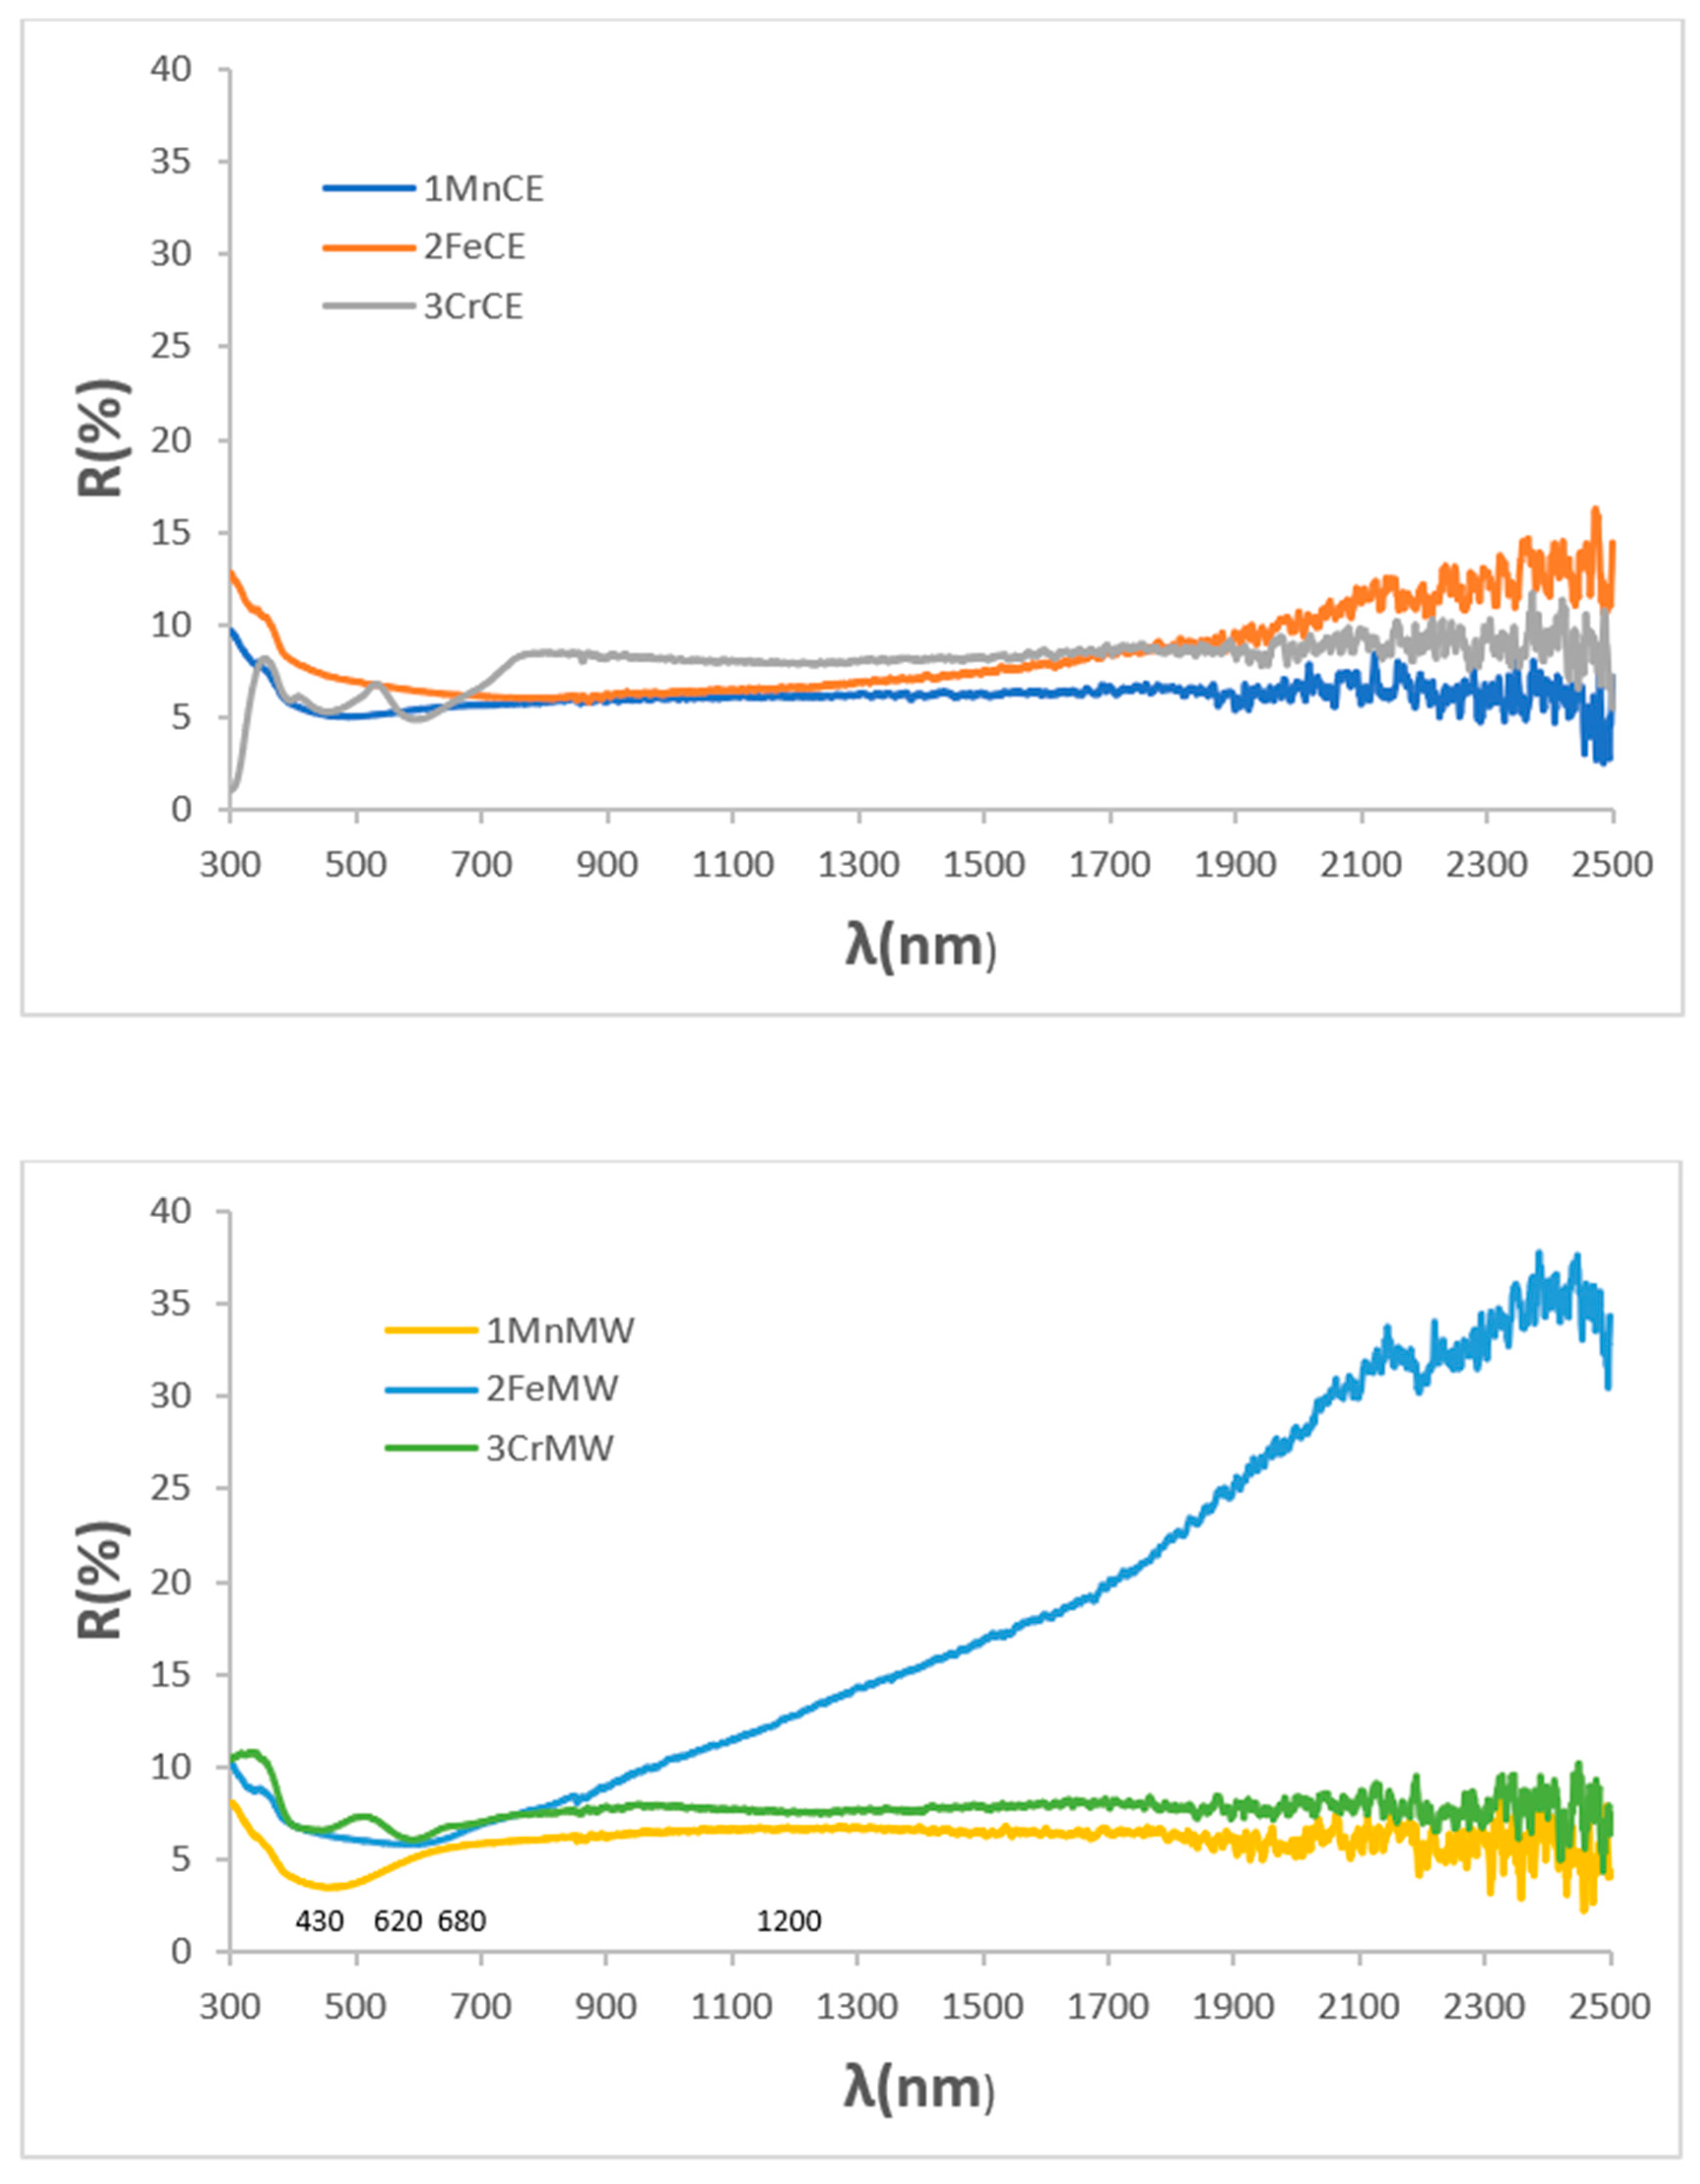
Figure 3 presents the UV–Vis–NIR diffuse reflectance spectra of the powders. Both manganese-containing samples exhibit nearly featureless spectra, with only a very weak band at 310 nm and an additional reflectance minimum at 430 nm for the microwave-fired 1MnMW sample. Similarly, the iron delafossite powder (2FeCE), which consists predominantly of CuFeO2, shows a mostly featureless spectrum with a weak minimum at 310 nm. In contrast, the microwave-fired 2FeMW powder displays a pronounced increase in reflectance in the NIR region, consistent with the presence of CuO detected by XRD. The reference mcconnellite exhibits largely featureless spectra in both firing conditions, with weak minima (corresponding to absorbance maxima), observed at 430, 620, 680, and 1200 nm. These features are attributed to Cr3+ (d3) electronic transitions in octahedral coordination: 4A2g(4F) → 4T1g(4F) at 430 nm, 4A2g(4F) → 4T2g(4F) at 680 nm, and 4A2g(4F) → 2E_g(2G) at 1200 nm. The absorption at 620 nm is assigned to low-coordinated Cu+ ions in the O–Cu+–O dumbbells of the mcconnellite structure [42].
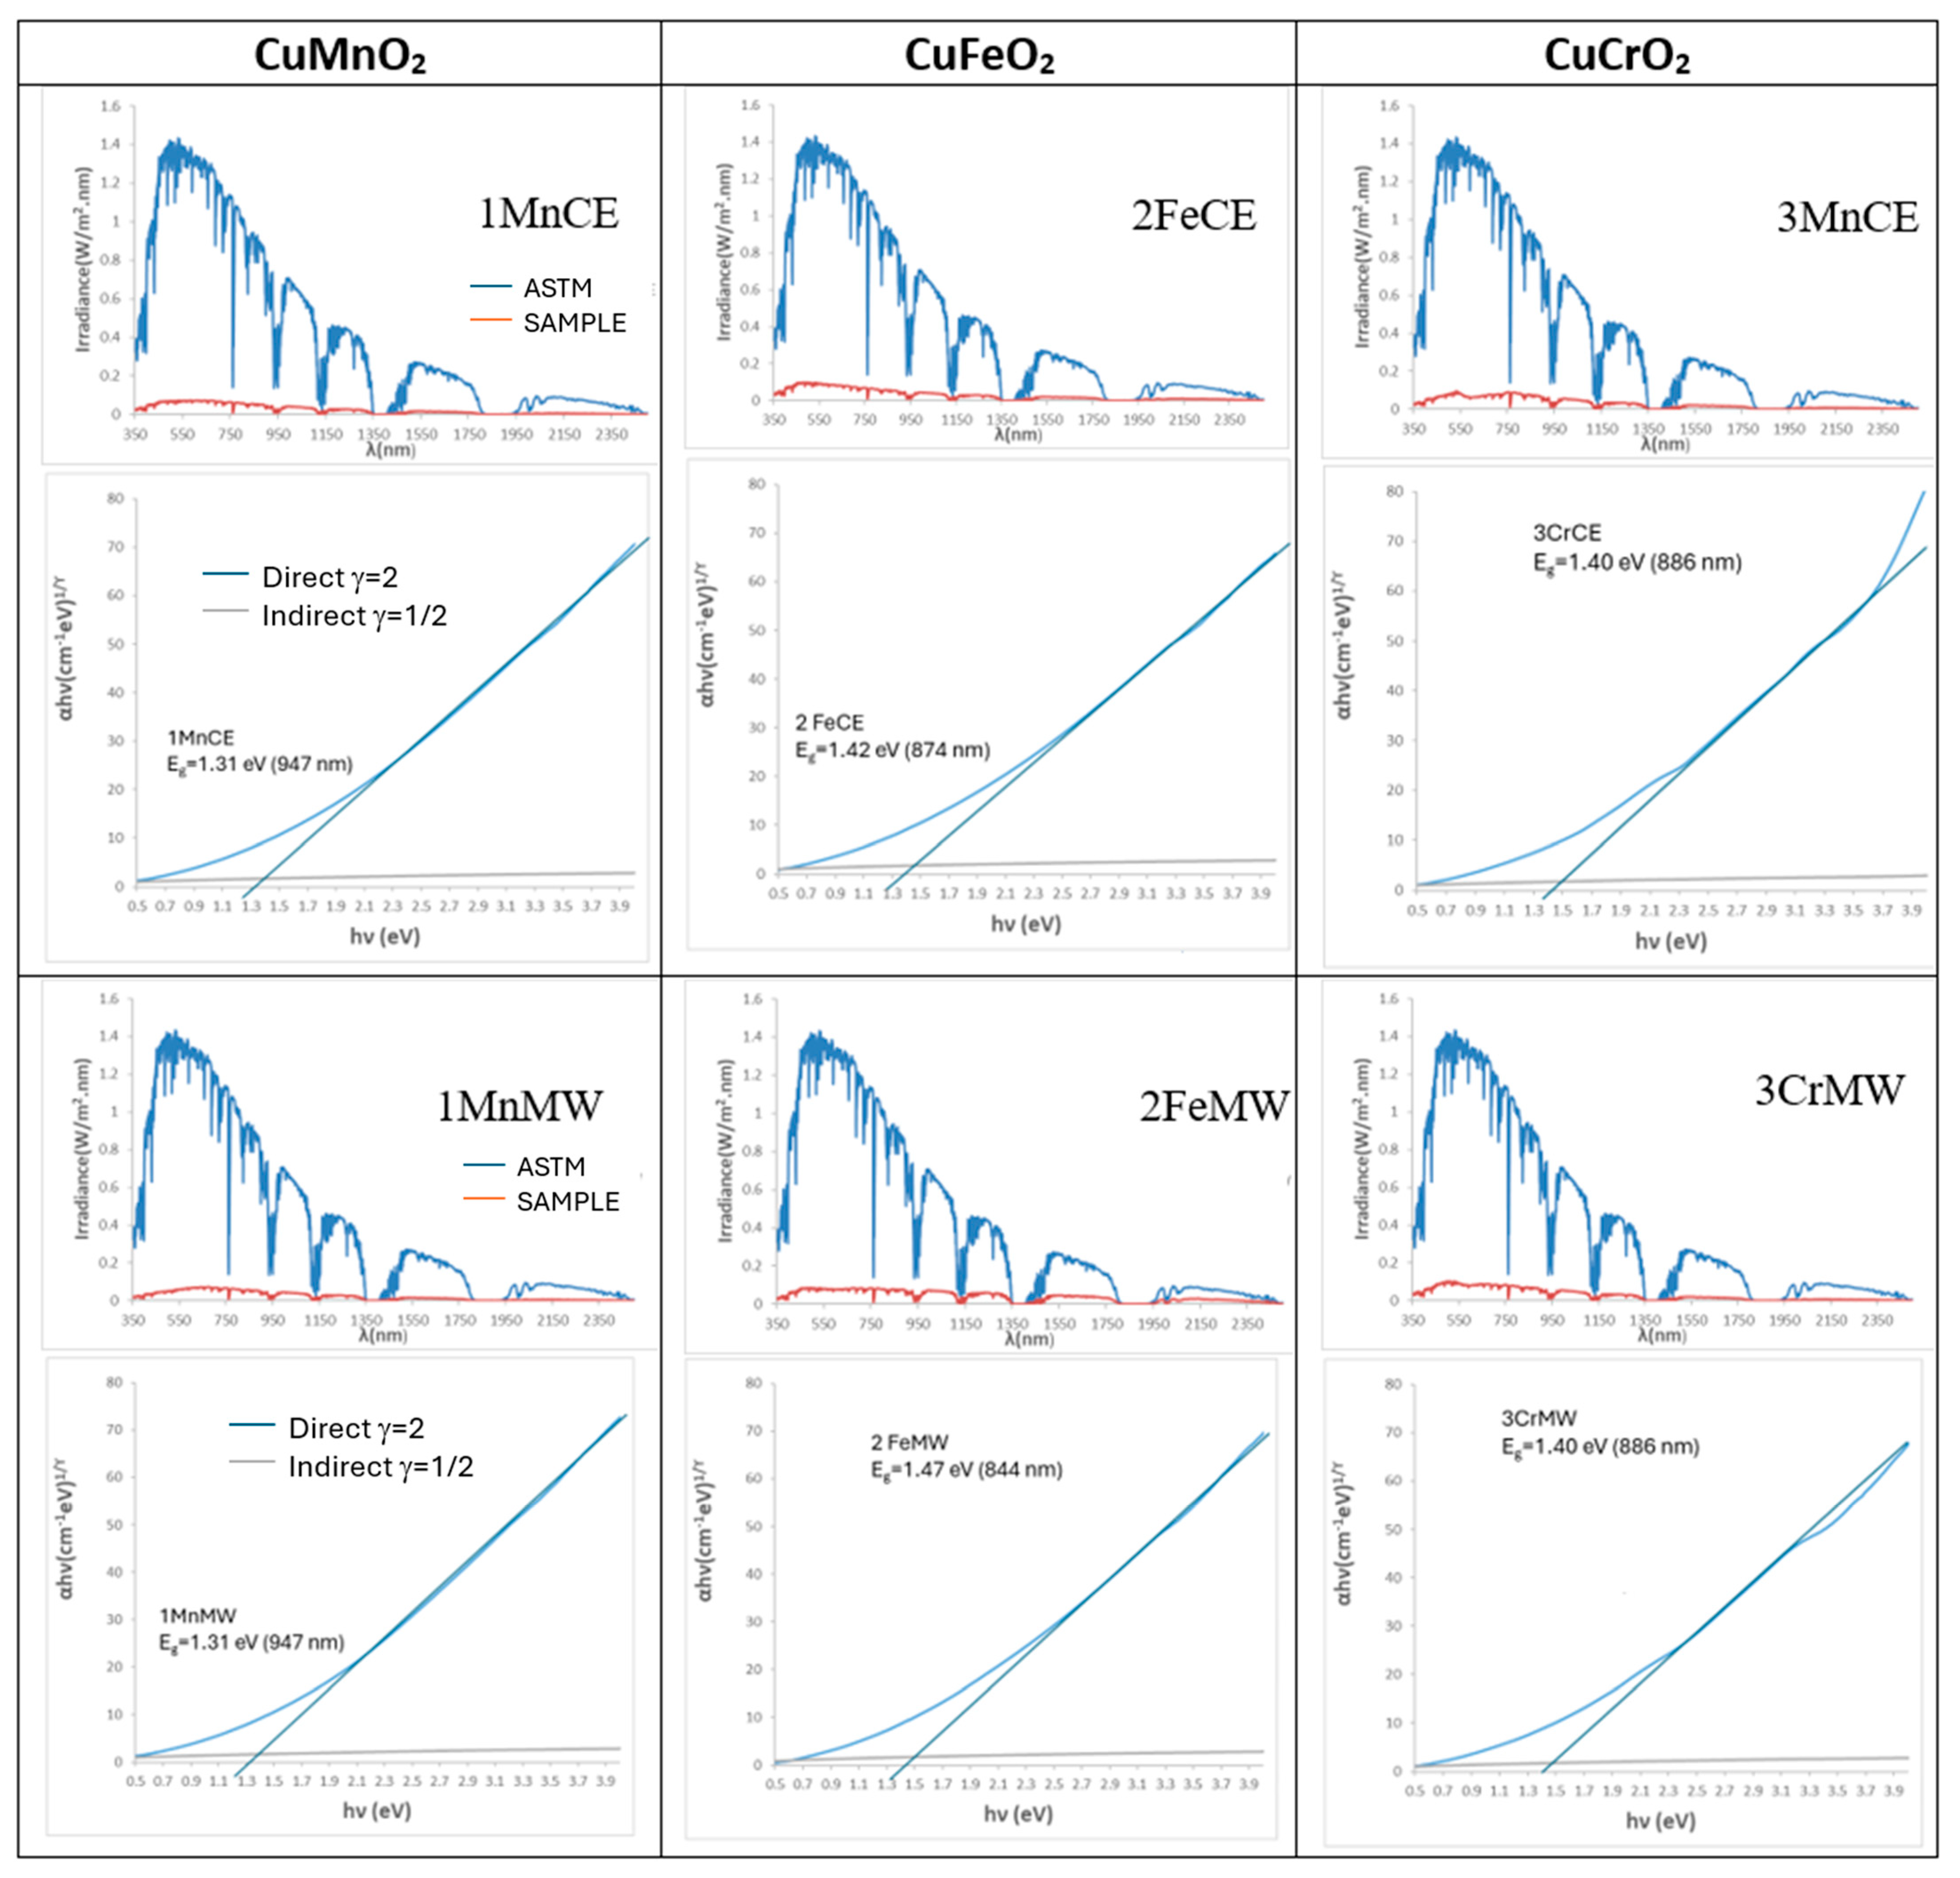
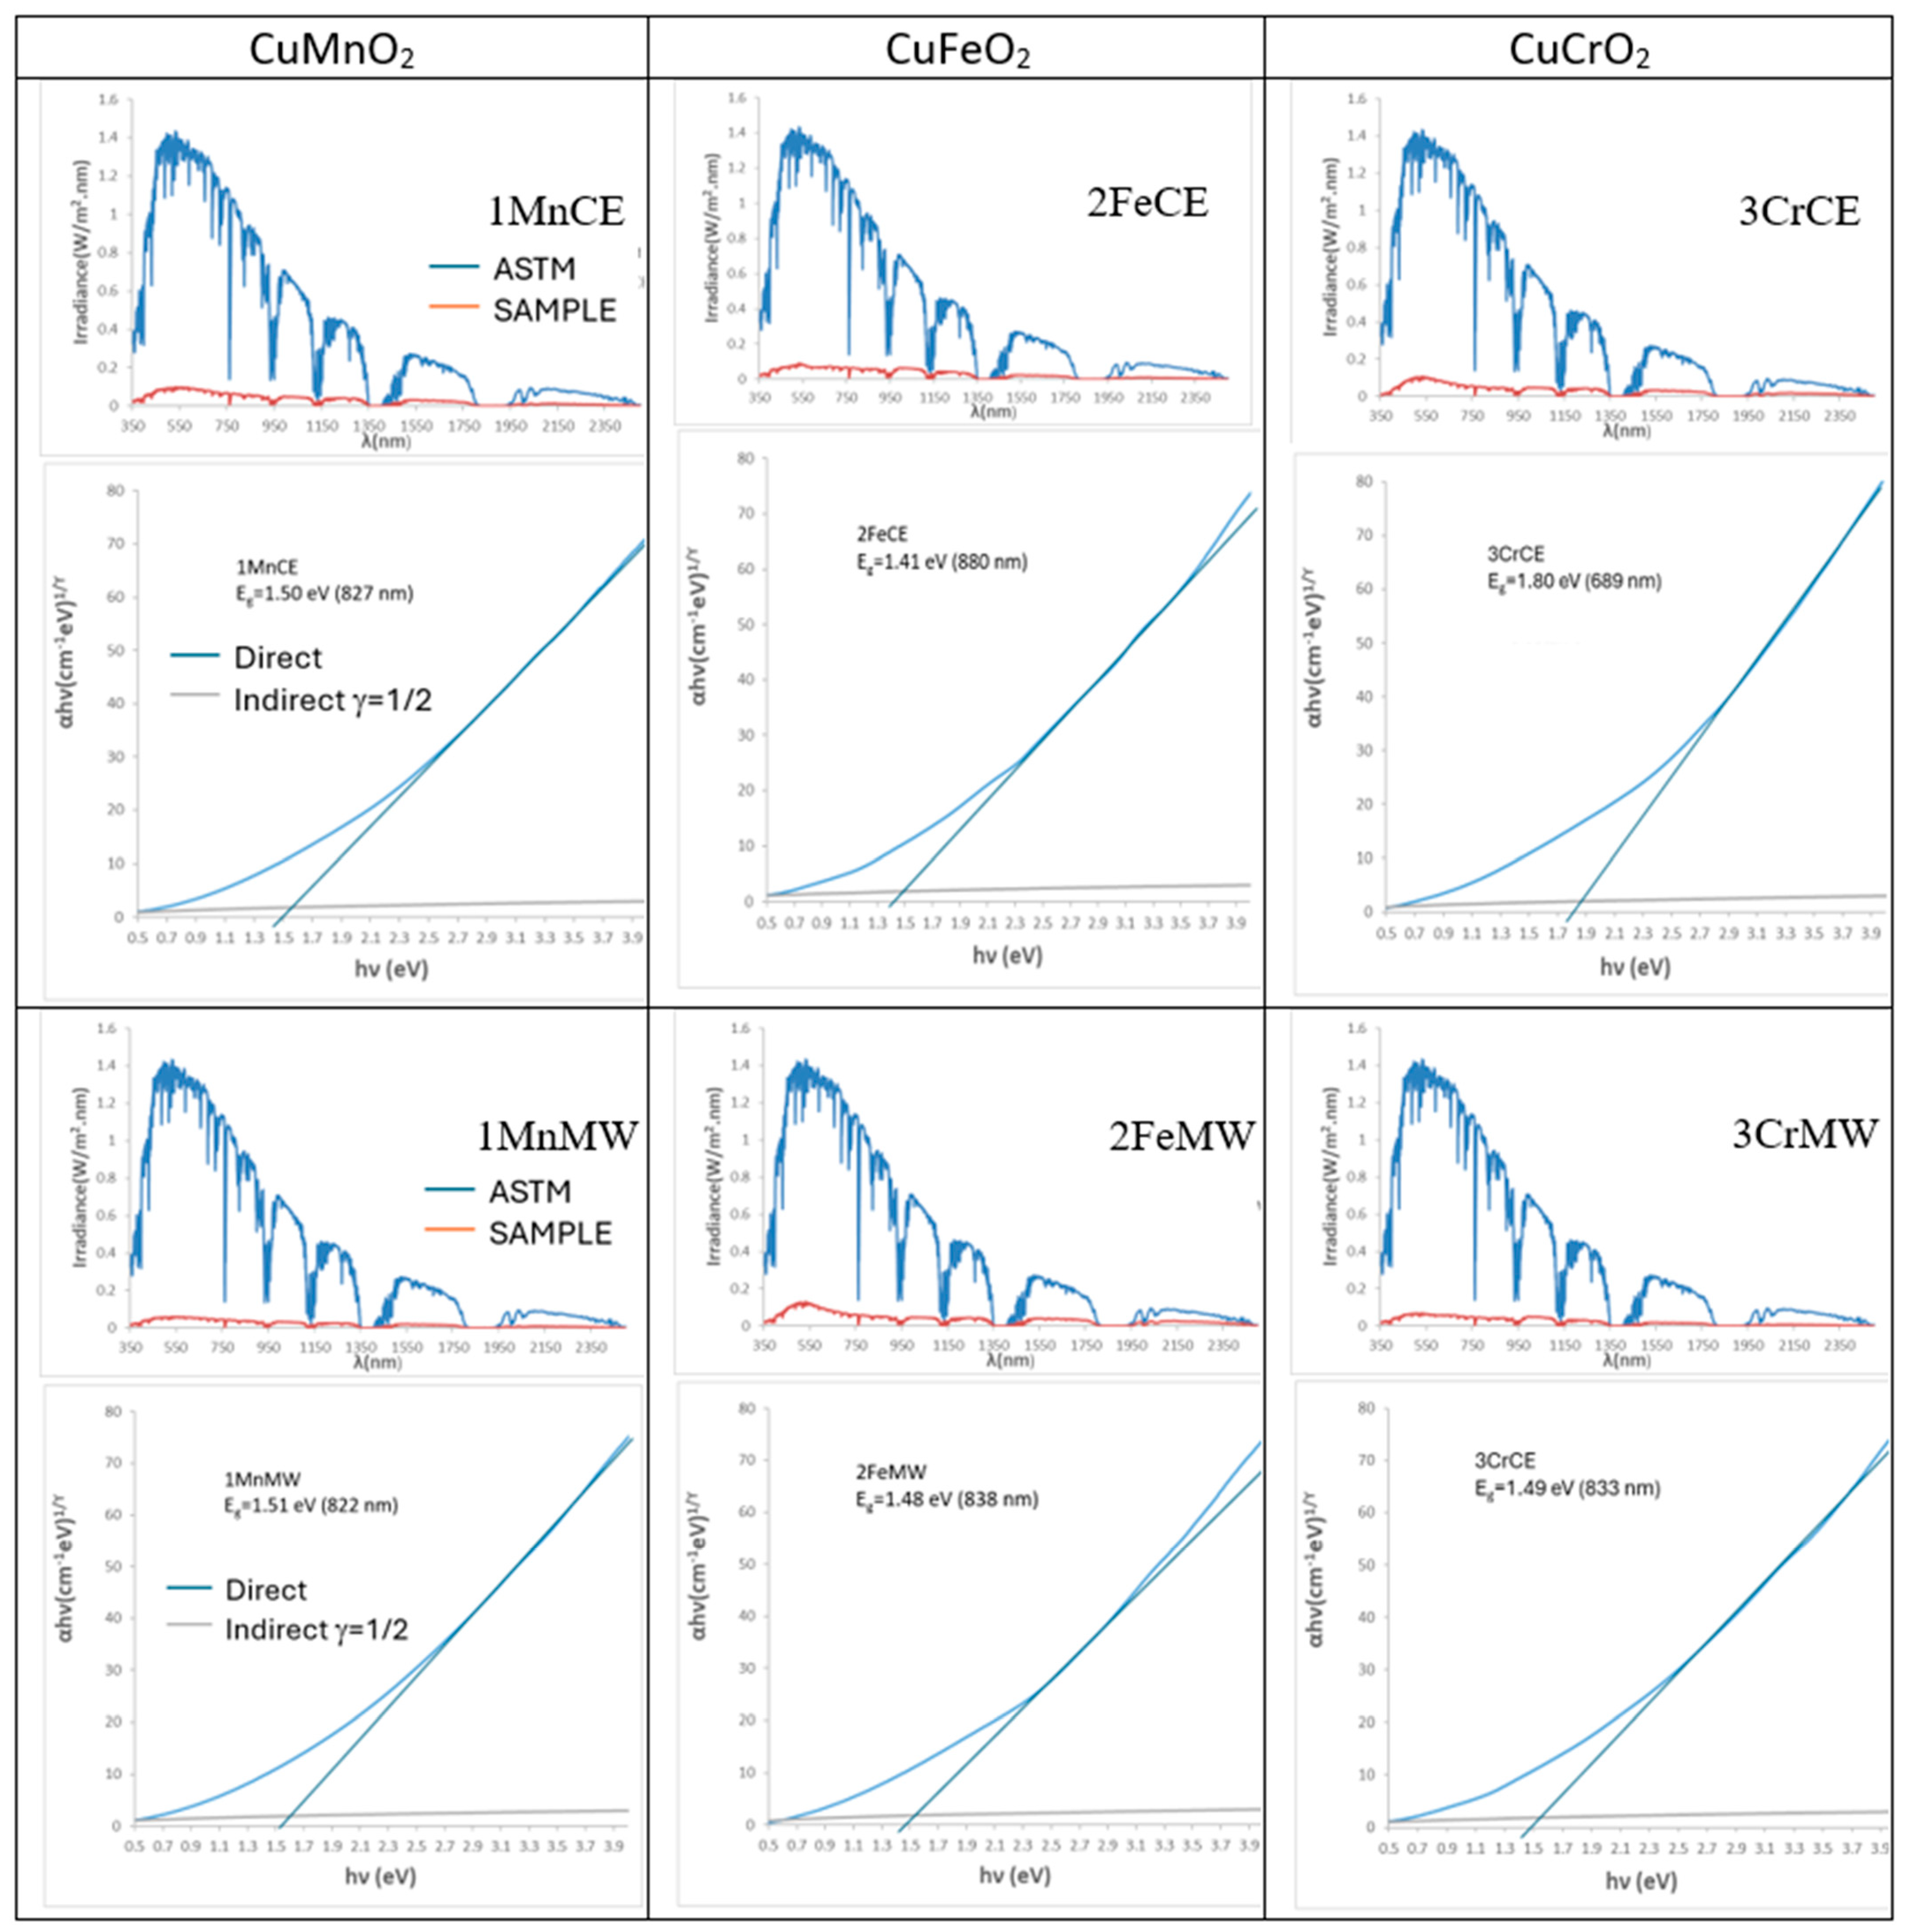
Figure 4 presents the solar reflectance spectra and Tauc plots of the powders. The band gaps are identical for the crednerite and mcconnellite samples under both electric- and microwave-firing conditions (1.31 eV and 1.40 eV, respectively). In contrast, the iron delafossite samples exhibit different band gaps due to the presence of CuO in the microwave-fired 2FeMW sample. The solar spectra highlight the strong absorption of solar radiation by all intense black powders across both the visible and near-infrared regions.
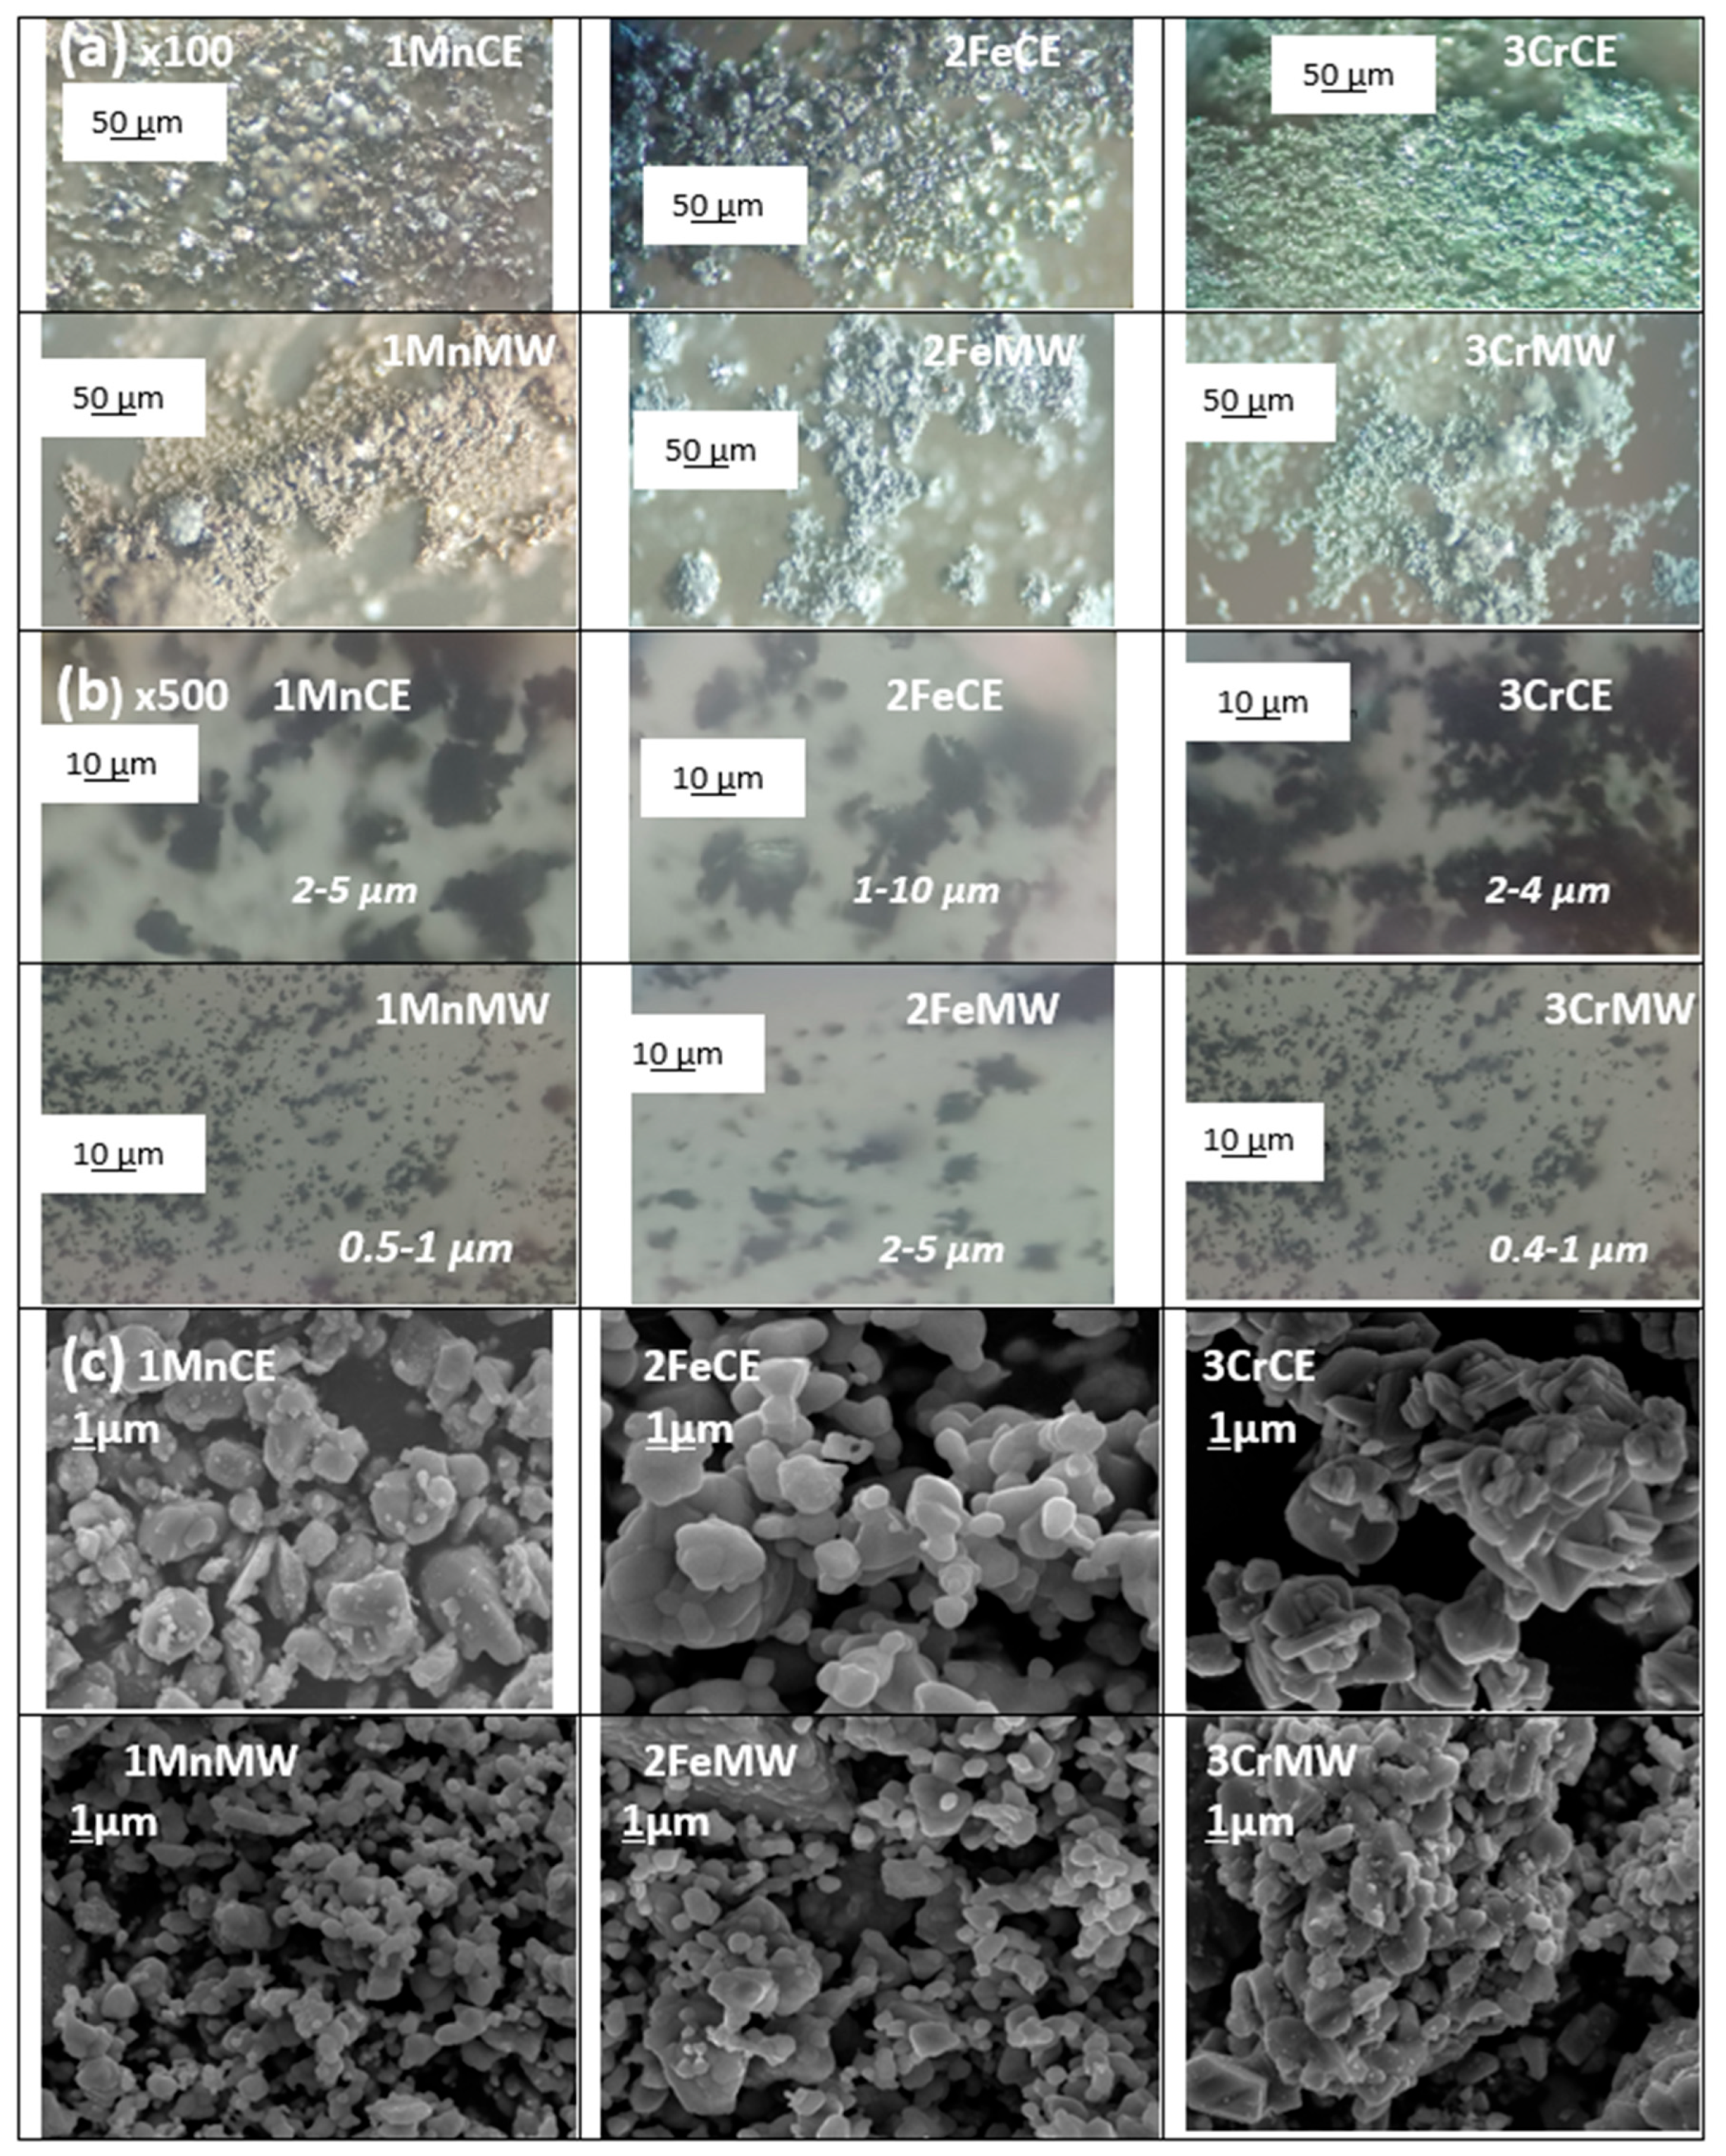
Figure 5 shows optical images of the powders at two magnifications (×100 and ×500) alongside SEM micrographs. The ×100 optical images reveal that manganese crednerite exhibits a brown undertone, iron delafossite a bluish undertone, and mcconnellite a greenish undertone, consistent with the L*a*b* colour parameters. The analysis of the ×500 optical images and SEM micrographs allows the estimation of particle size, indicating that microwave firing produces smaller particles in all cases compared to electric firing. Particle size has a moderate influence on the blackness of the powders: RVis decreases slightly for manganese and iron powders and for mcconnellite in the microwave-fired samples. The effect of particle size is expected to be more pronounced in glazed samples, as smaller particles increase the number of colour points per unit volume within the glassy matrix, enhancing the perceived blackness.

3.2. Characterization of 5 wt% Glazed Samples in Double Firing Frit with Maturation Point at 1000 °C, Zinc-Free, Using Electric Firing for Glazing

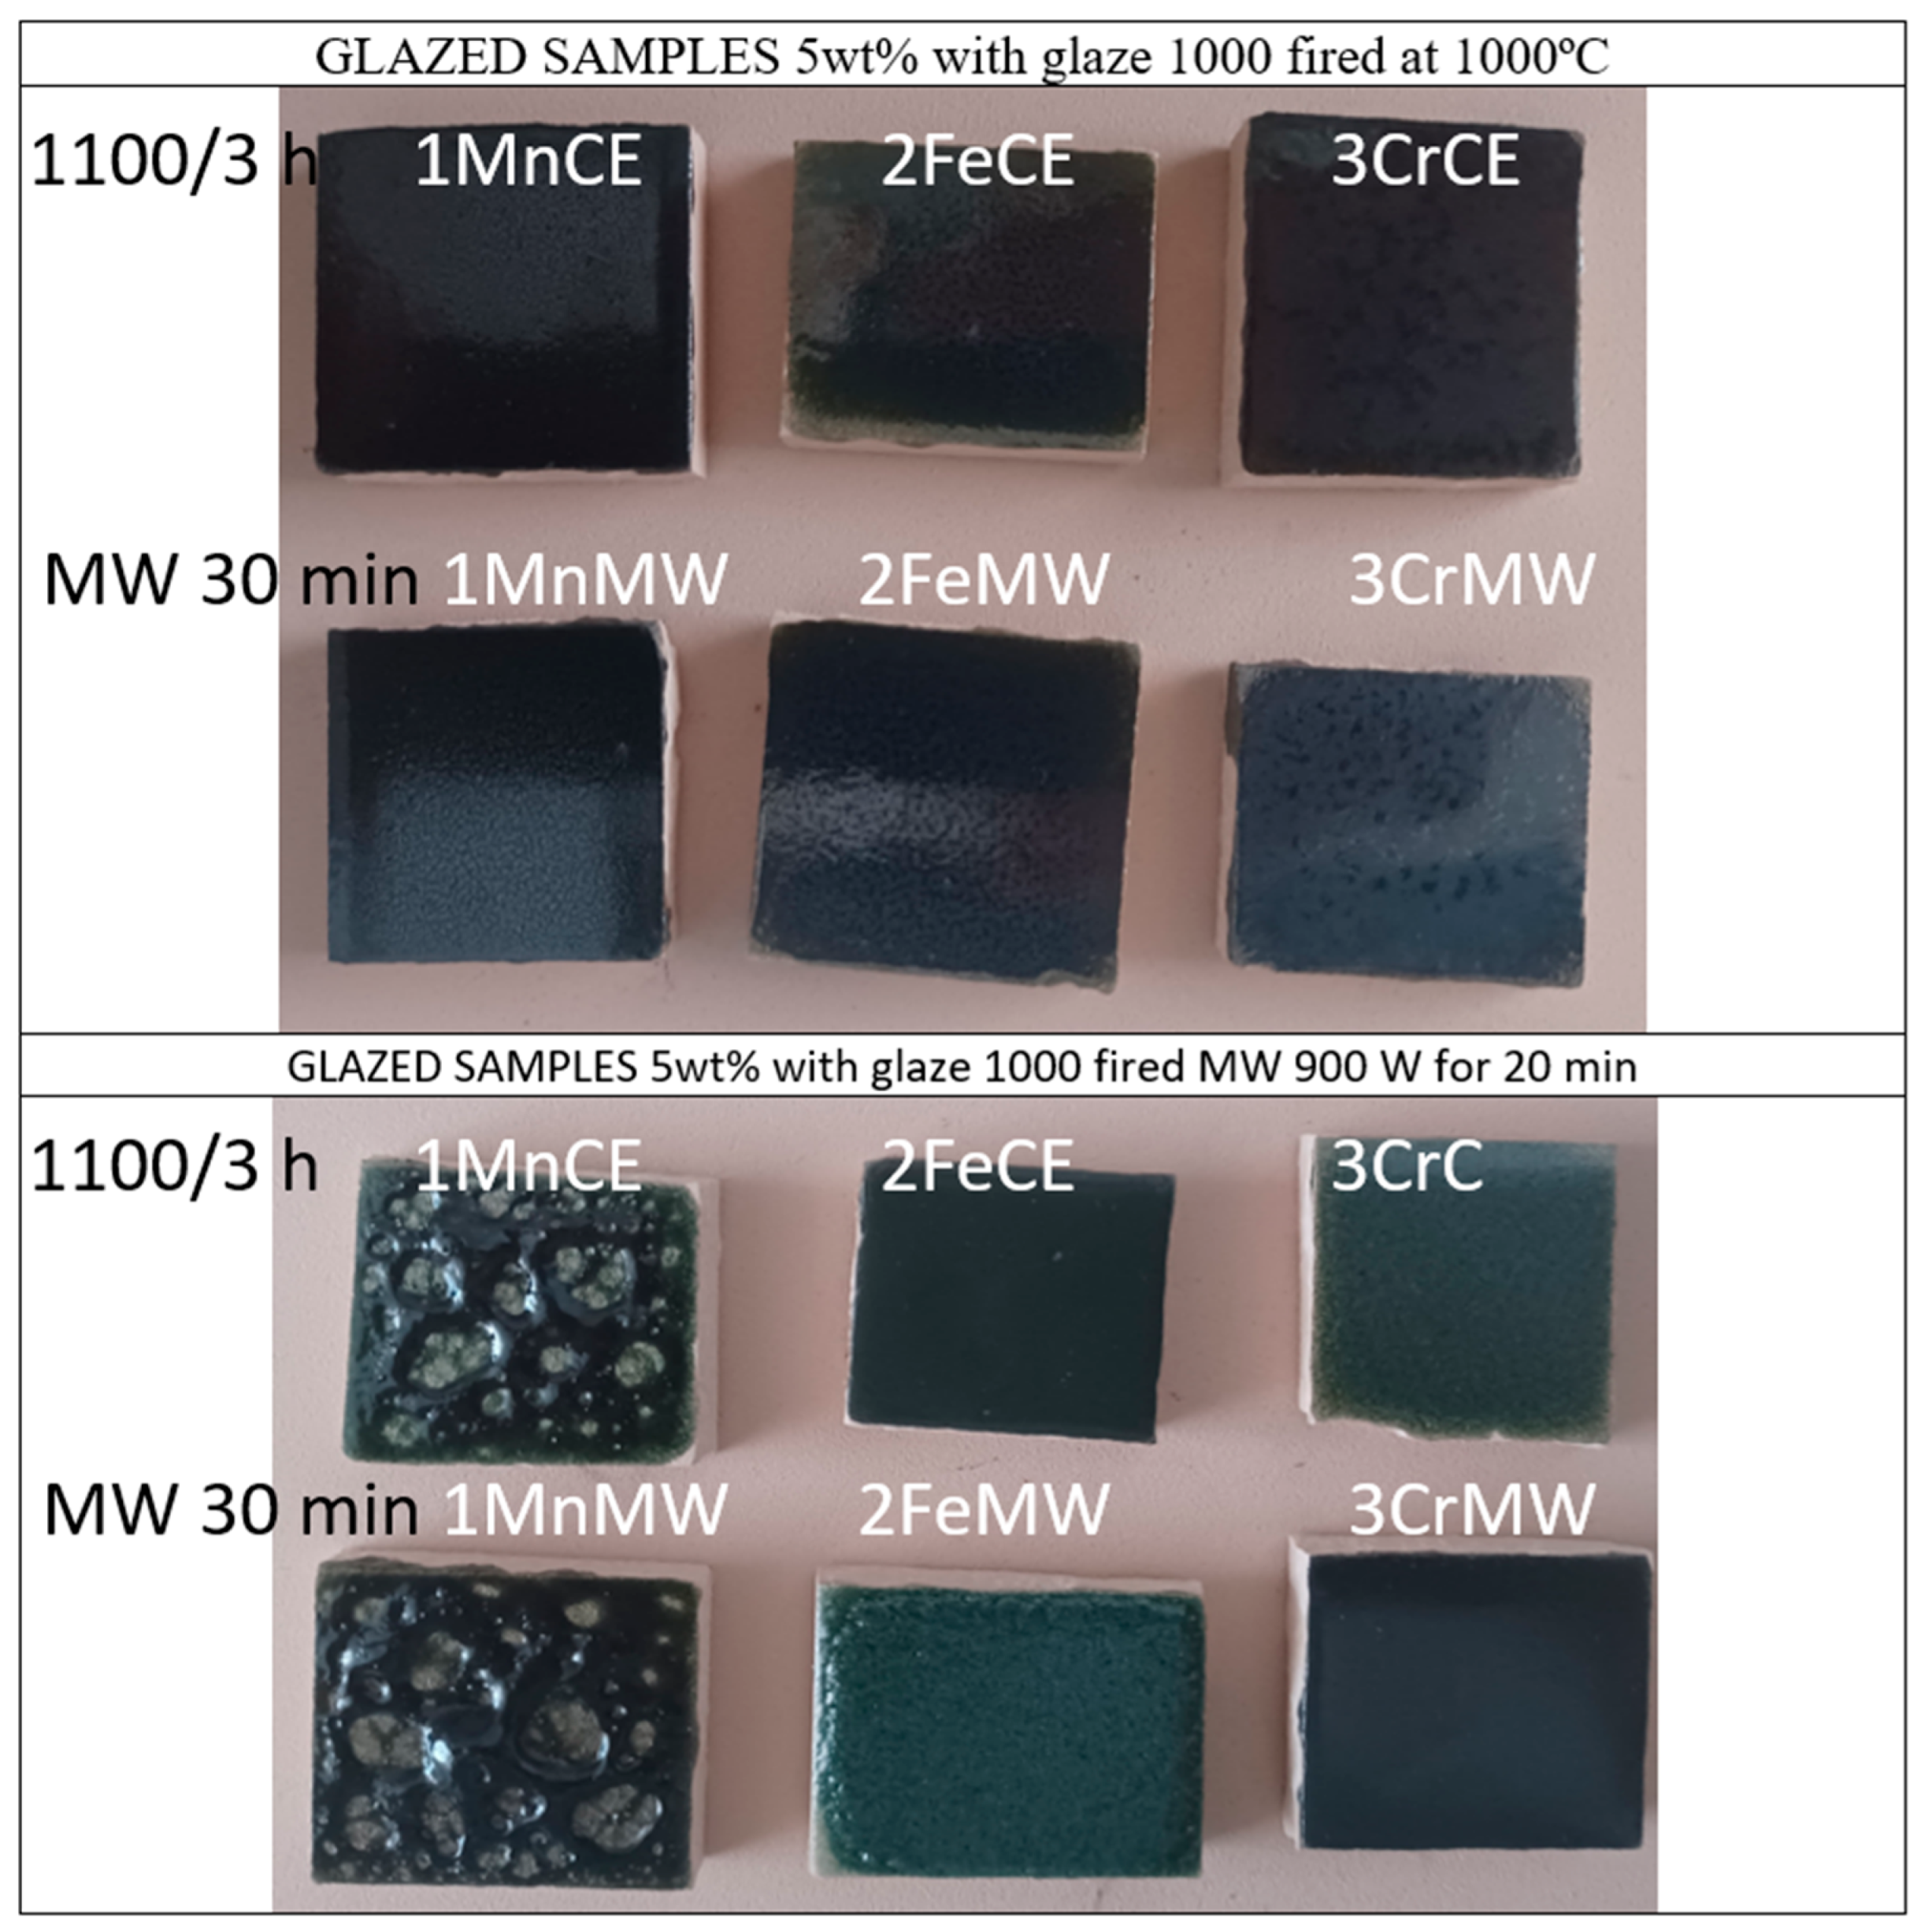
Figure 6 and Table 2 show the characteristics of 5 wt% glazed powders in double firing frit with maturation point at 1000 °C, zinc-free, using an electric kiln for glazing.
All electrically fired glazes appear dark black. Manganese- and iron-containing glazes exhibit a bluish undertone (b* < 0), whereas mcconnellite shows a neutral to greenish hue (a* ≤ 0). Among glazes derived from electrically fired powders, RVis decreases in the sequence 1MnCE < 2CrCE < 3FeCE, reflecting the blackness trend 3CrCE > 2FeCE > 1MnCE and the corresponding decline in ΔE* (Table 1). Mcconnellite stands out with an intense black tone (RVis = 4.40, ΔE* = 4.6) and a higher measured bandgap than the original powder.
For glazes derived from microwave-fired powders, the RVis sequence follows 2FeMW > 1MnMW > 2CrMW, consistent with the decreasing trends of both ΔE* and bandgap. Mcconnellite is notable for its deep-black appearance (RVis = 1.41, ΔE* = 3.5), accompanied by a reduced bandgap relative to the corresponding powder. Overall, Mn- and Cr-containing glazes from microwave firing exhibit lower RVis values than their electrically fired counterparts, indicating a deeper black shade. In contrast, the Fe sample shows a higher RVis under microwave firing, which is attributed to the presence of CuO in the powder.
Figure 7 presents the XRD diffractograms of the samples, recorded under both backscattering and grazing-incidence conditions (2° incidence angle). X-ray diffraction (XRD) analyses were carried out using a Siemens D5000 diffractometer with Cu Kα radiation over the 2θ range of 10–70°, employing a step size of 0.02° 2θ and a counting time of 10 s per step, under operating conditions of 40 kV and 20 mA. These parameters enable the assessment of pigment particle behaviour dispersed within the amorphous silica glassy matrix, which contributes to the black coloration of the samples.
The X-ray diffraction intensity of crystalline phases detected in glazed samples depends on several factors, including the atomic number (elements with higher atomic numbers possess greater scattering power; in this case, Cr [Z = 24], Mn [Z = 25], and Fe [Z = 26] exhibit comparable scattering ability), the degree of crystallinity (higher crystallinity increases the number of atoms contributing to diffraction), crystal size (larger crystals yield stronger diffraction peaks), and the crystallographic orientation of the crystal relative to the incident X-ray beam [43]. Therefore, the detection of crystalline phases within glazes sharing a similar glass matrix, comparable atomic numbers, and equivalent beam orientation requires that particles exceed certain thresholds of concentration and size. Finely dispersed and/or low-concentration crystalline phases, particularly those affected by glass corrosion, may fall below the detection limit of the XRD technique.
For crednerite (CuMnO2), the grazing-incidence XRD of the glazed microwave-fired powder 1MnMW reveals peaks corresponding to the spinel phase CuMn2O4. In contrast, no peaks or crystallization halos are detected in the glazed 1MnCE powder. Backscattering XRD shows a double crystallization halo between 20° and 25° 2θ, attributed to the silica glass matrix. Crednerite is not observed after interaction with the molten glaze; thus, the highly stable spinel CuMn2O4 is identified as the crystalline phase responsible for the black coloration.
For delafossite (CuFeO2), grazing-incidence XRD shows no detectable response. Conventional backscattering XRD displays crystallization halos at ~20° and 25° 2θ, along with a diffraction peak at 39° 2θ, corresponding to the intense [114] reflection plane of tenorite (CuO). This indicates that delafossite decomposes during glazing, and the black coloration cannot be attributed to CuFeO2, but rather to the concentration of CuO. It is well established that Cu2+ ions dissolved in glazes derived from copper-based pigments can produce either a green or a blue coloration, depending on their coordination environment: octahedrally coordinated Cu2+ in the glassy matrix is associated with green hues, while square-planar coordinated Cu2+ surrounded by oxygen atoms in the glass network yields blue tones [44,45]. In the present case, however, the behaviour differs. The 1FeCE powder crystallizes predominantly as delafossite, with weak peaks of CuO phase, whereas the 1FeMW powder exhibits pronounced CuO diffraction peaks. According to the literature, delafossite is thermally unstable and decomposes into CuO at approximately 1070 °C [46]. These results therefore indicate that microwave irradiation accelerates the decomposition of delafossite into CuO. In the glazed samples, however, the low-incidence XRD patterns are nearly identical for both cases, showing the intense [114] reflection plane characteristic of tenorite (CuO) in each. Both glazed samples also exhibit a greenish hue, consistent with the partial dissolution of copper into the glaze. These results indicate that delafossite is unstable and decomposes into CuO within the glassy matrix, following a mechanism analogous to its thermal decomposition at elevated temperatures.
For the reference mcconnellite, XRD confirms the crystallization of CuCrO2 in both glazes prepared from electric- and microwave-fired powders, analyzed by conventional and grazing-incidence XRD. The resistance of mcconnellite to molten glass highlights the high stability and effectiveness of CuCrO2 as a black ceramic pigment.
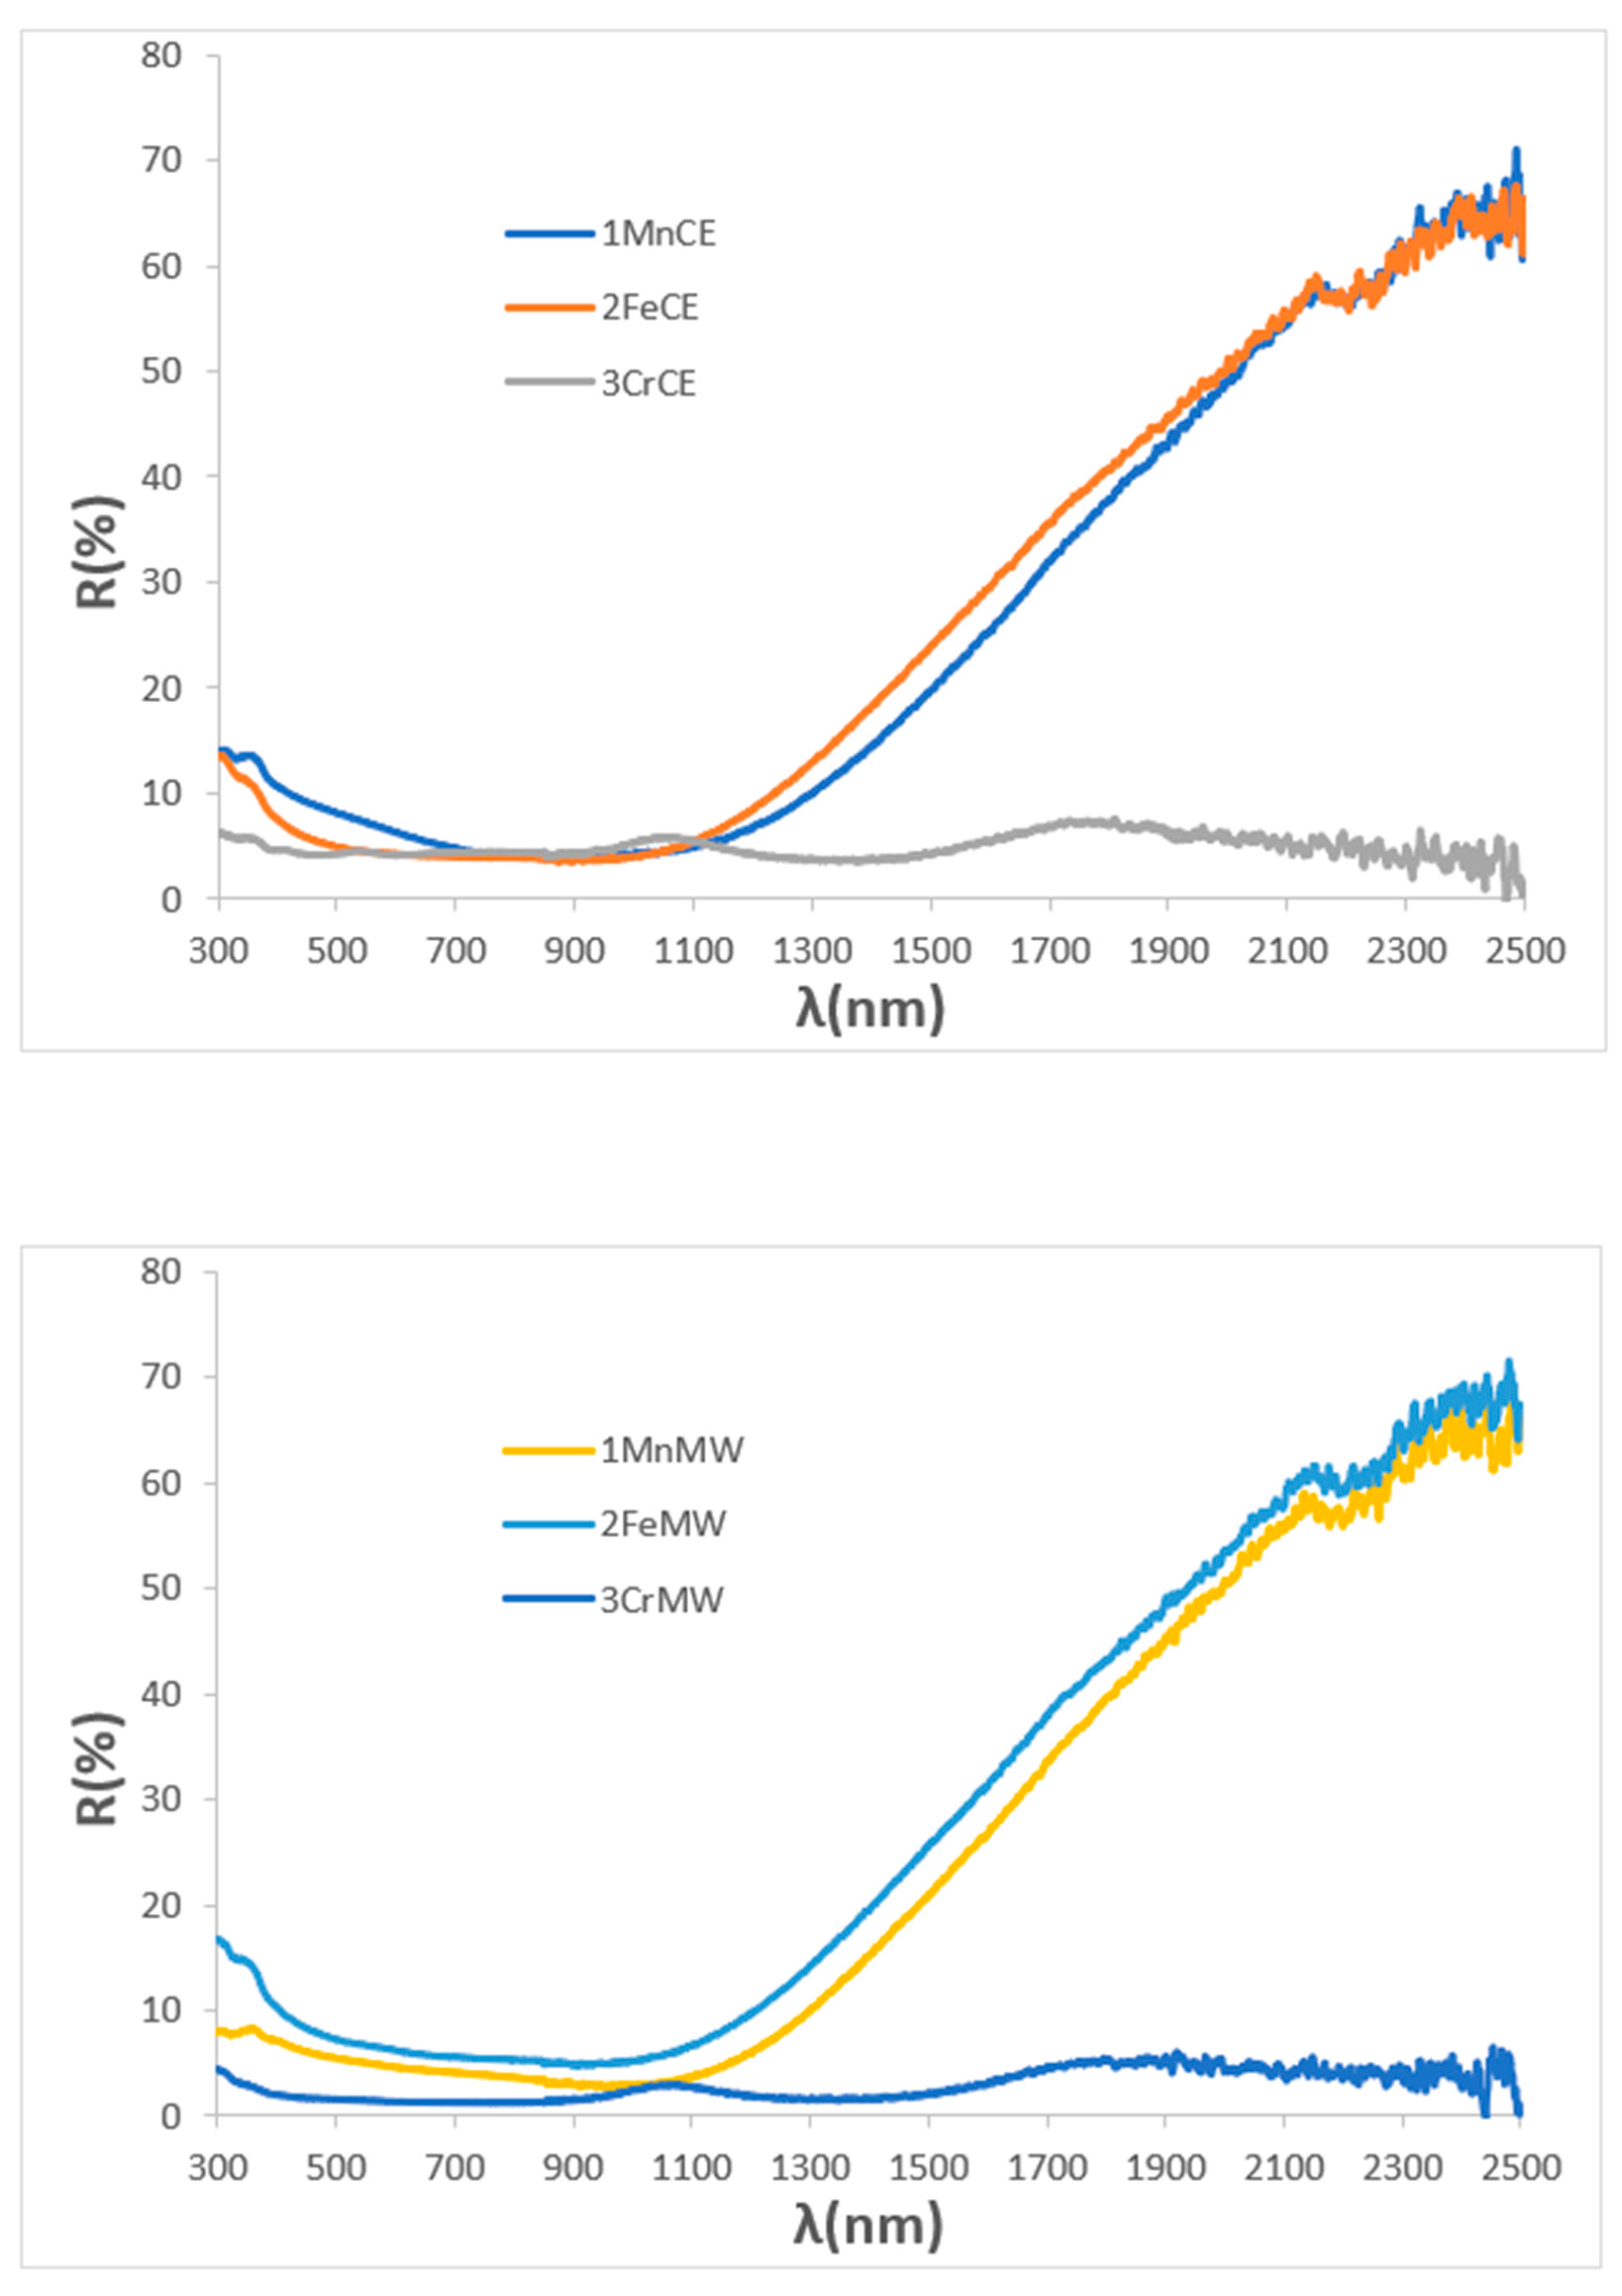
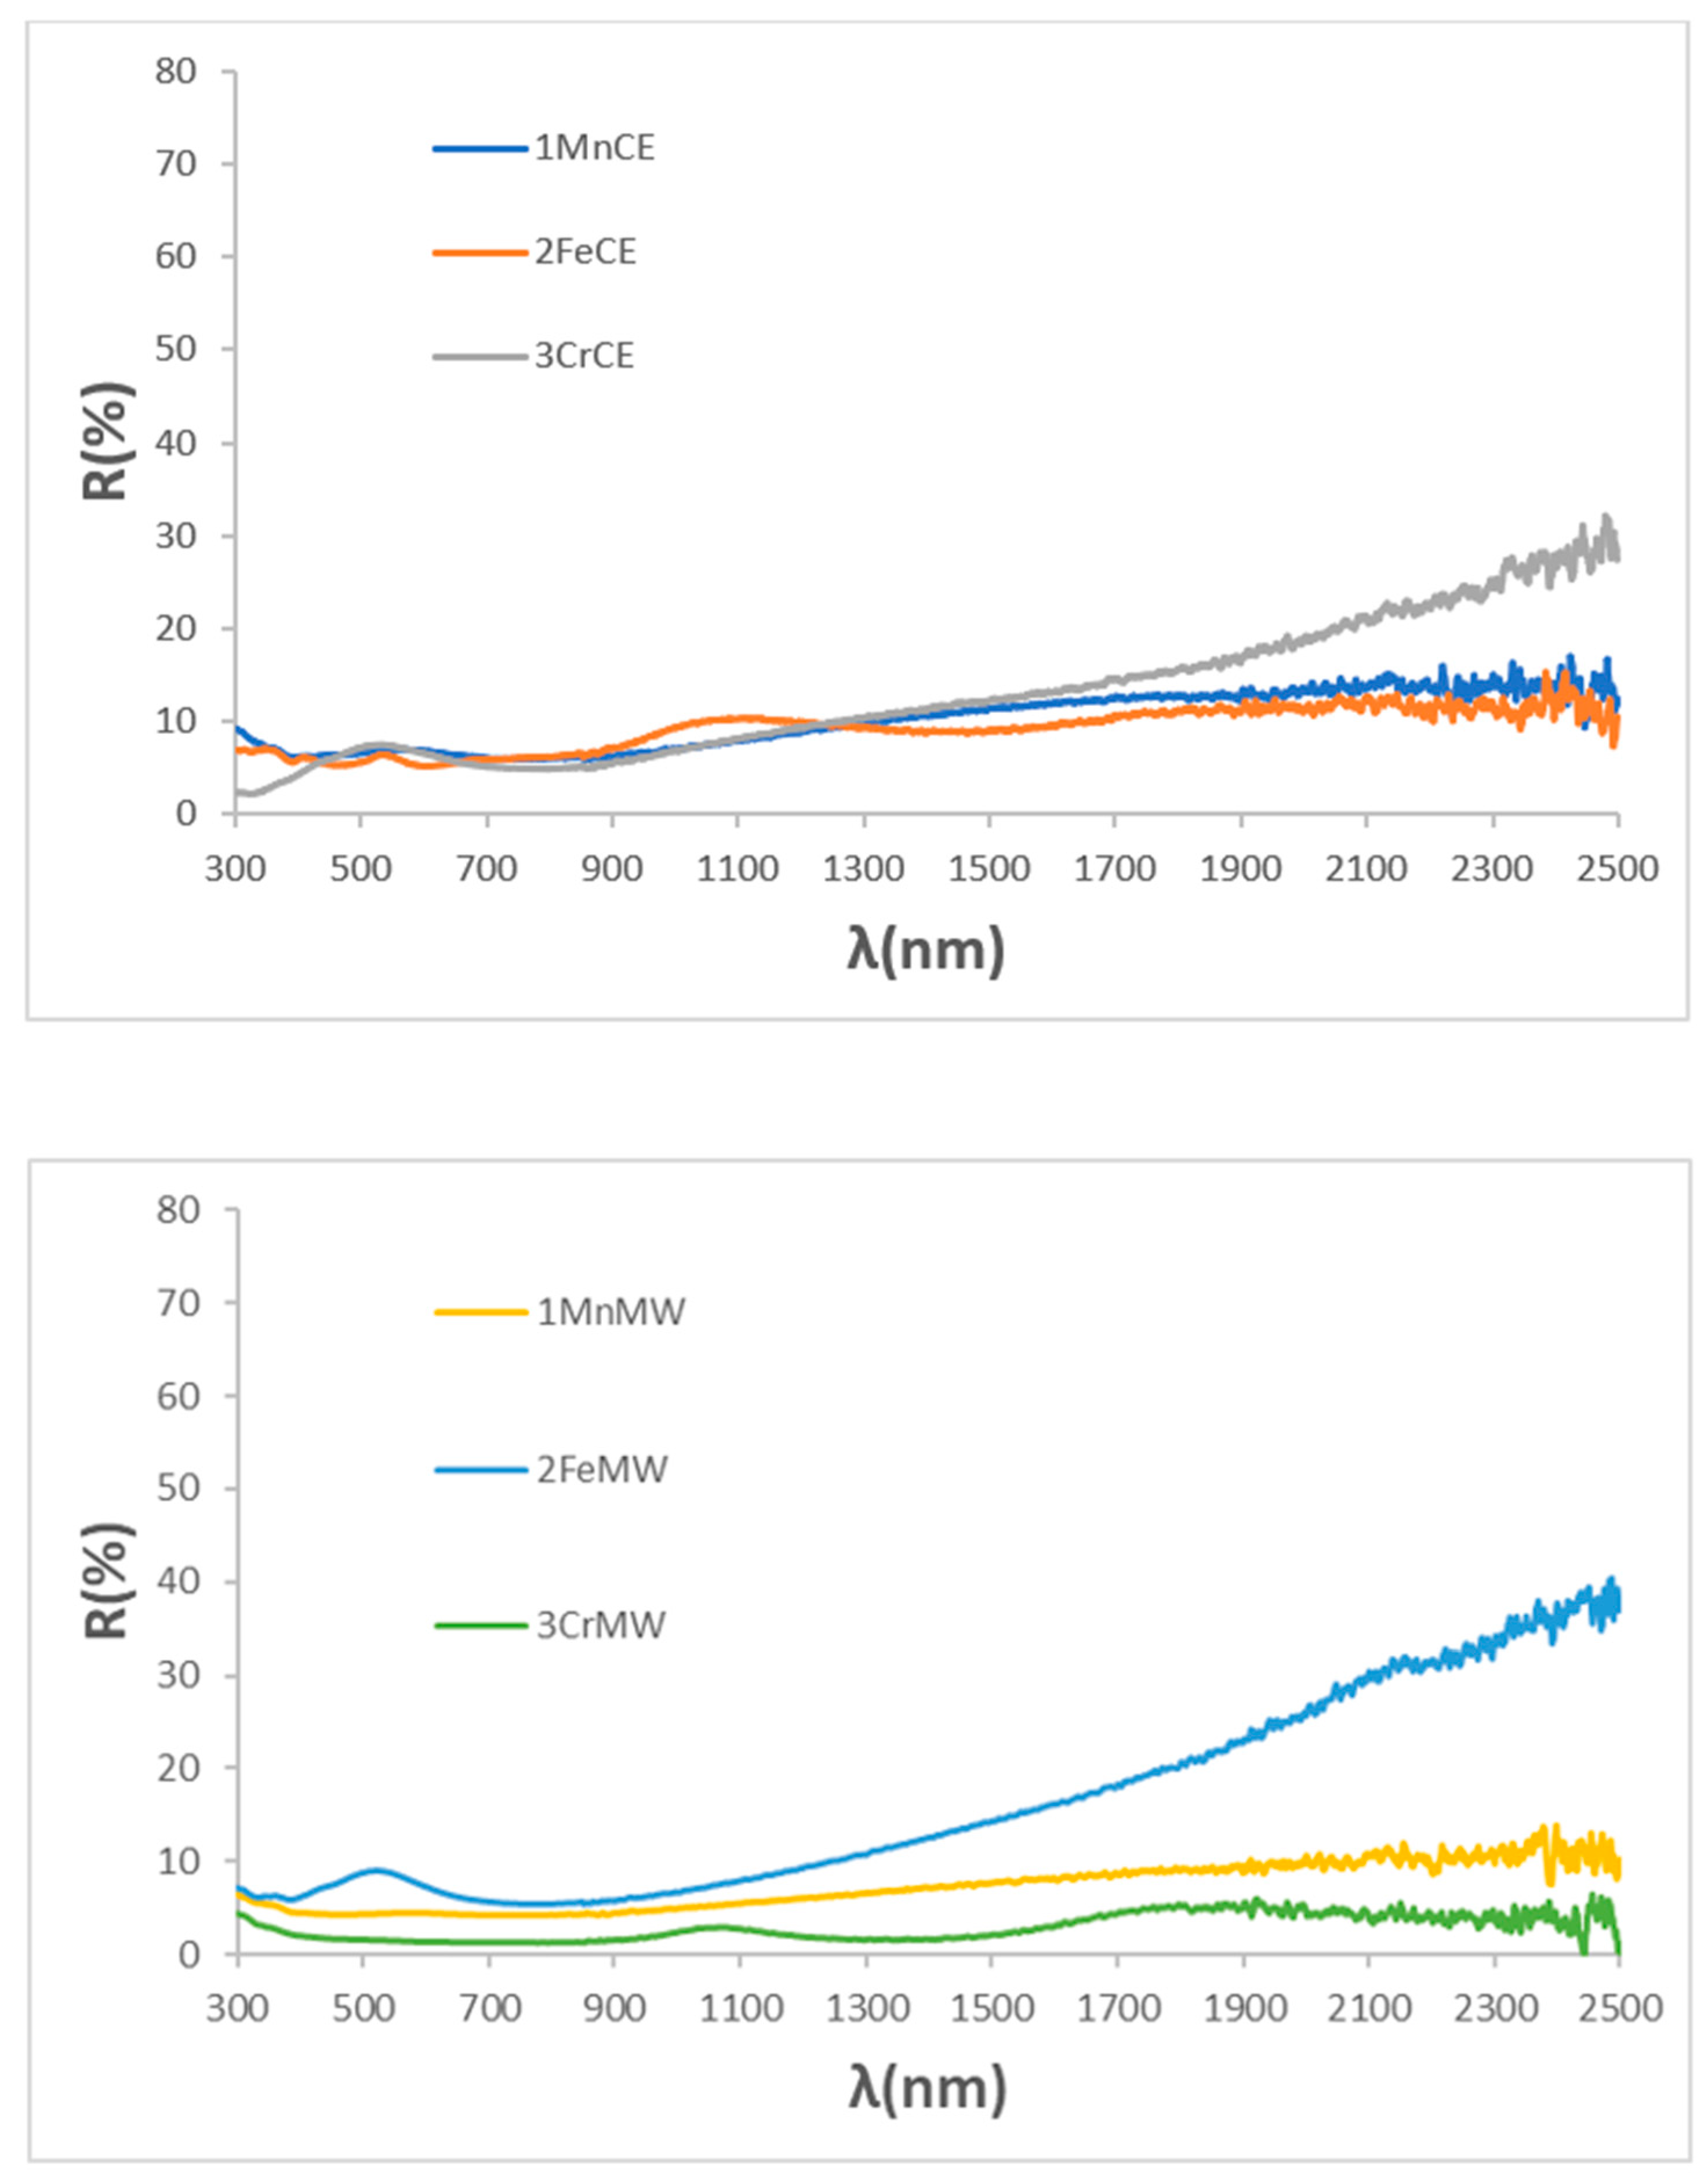
Figure 8 shows the UV–Vis–NIR reflectance spectra of samples glazed in an electric kiln. Consistent with the XRD results, only mcconnellite, which remains stable against attack by the molten glaze, exhibits a flat reflectance across the Vis–NIR range. In contrast, manganese- and iron-containing delafossites, which are unstable in the glaze medium and crystallize as spinel CuMn2O4 and CuO, respectively, show increased reflectance in the NIR region, a feature characteristic of potential solar-selective absorber surfaces [17].
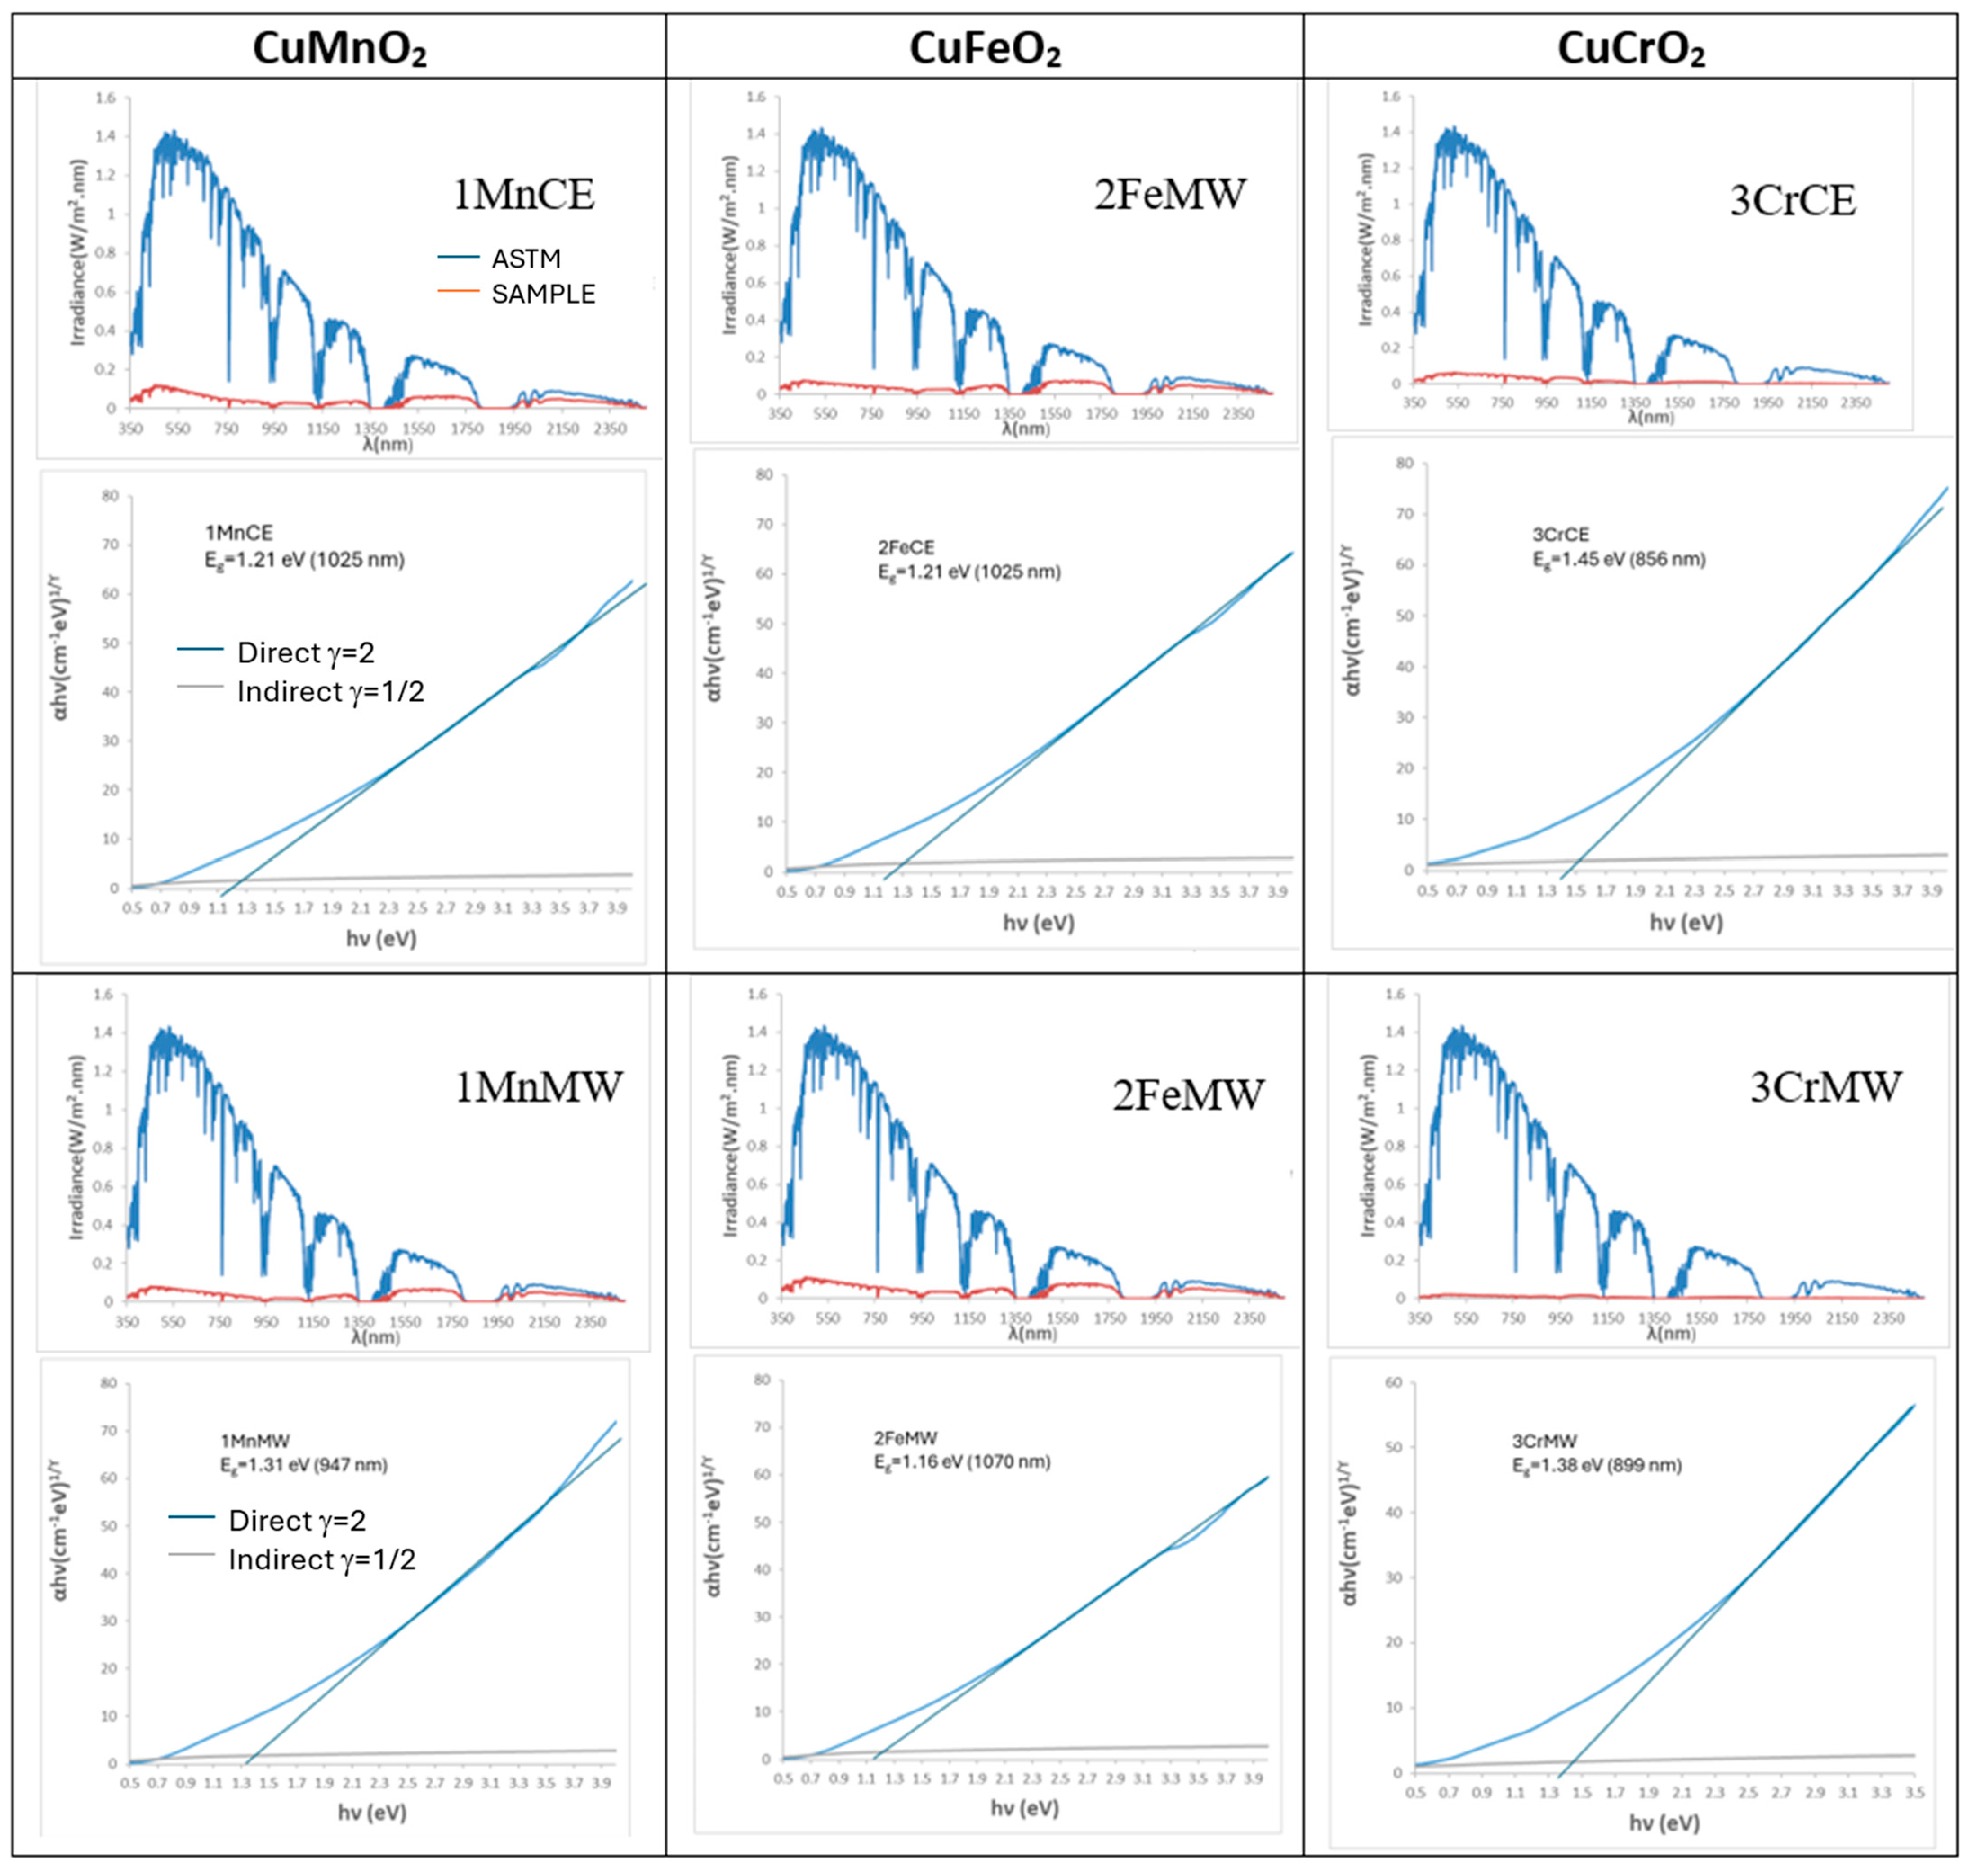
Figure 9 shows the solar spectra and Tauc plots of glazed samples prepared by electric firing. Bandgap values vary between samples from electrically and microwave-fired powders, reflecting the influence of different crystallization systems within the glass matrix. The spectra reveal strong solar absorption across the visible and near-infrared ranges, with sample 3CrMW exhibiting particularly high absorption, consistent with its deep-black colour (RVis = 1.41%), highlighting the effect of crystallization on optical performance.

3.3. Characterization of 5 wt% Glazed Samples in Double Firing Frit with Maturation Point at 1000 °C, Zinc-Free, Using Microwaves Firing for Glazing

Figure 6 and Table 2 summarize the characteristics of 5 wt% glazed powders in a double firing frit with a maturation point of 1000 °C, prepared using a microwave kiln.
All microwave-fired glazes exhibit a dark black appearance with pinhole defects, with the most pronounced in the manganese sample and also present in 2FeMW and 3CrCE, alongside a greenish undertone (a* ≤ 0). These features are attributed to the behaviour of Cu2+ ions within the glass: octahedrally coordinated Cu2+ produces a green hue, while square-planar coordination can yield blue coloration [44]. In the manganese and iron samples, the presence of Cu2+ compounds (CuMn2O4 and CuO) and the aggressive interaction with the molten glass promote the partial exsolution and reduction of Cu2+ to Cu+, releasing oxygen and resulting in the formation of the observed pinholes Equation (3) [44,45]:
2CuO(glaze/green shade) → Cu2O(glaze, red shade)+ ½ O2
Crystalline phase stability dictates Cu2+ behaviour and optical properties: stable phases, as in mcconnellite, limit Cu2+ reduction and maintain blackness, whereas decomposed phases, such as crednerite and delafossite, promote Cu2+ reduction, resulting in greenish undertones and pinholes.
In microwave-glazed samples from electrically fired powders, RVis decreases in the order 1MnCE < 2CrCE < 3FeCE, corresponding to a blackness trend of 1MnCE > 2CrCE > 3FeCE, with higher ΔE* values linked to the greenish hue (b*) (Table 1).
For microwave-glazed samples, RVis follows the sequence 2FeMW > 1MnMW > 2CrMW, consistent with decreasing ΔE* and bandgap values. Mcconnellite exhibits an intense black appearance (RVis = 2.63, ΔE* = 4.3) and a reduced bandgap relative to the corresponding powder. Compared to electrically fired counterparts, microwave-glazed Mn and Cr samples show lower RVis, indicating a deeper black shade, whereas Fe displays higher RVis. UV–Vis–NIR spectra (Figure 10) reveal generally flat responses for microwave-glazed powders, with the Fe sample showing notable NIR reflectance. These findings suggest that microwave glazing promotes enhanced Cu exsolution from pigment particles while preserving their chemical stability better than electric kiln glazing.
Figure 11 shows the solar spectra and Tauc plots of microwave-glazed samples. Bandgap values vary between powders fired electrically and by microwave, reflecting differences in crystallization within the glass matrix. The spectra indicate strong solar absorption across the visible and near-infrared ranges, with sample 3CrMW exhibiting particularly high absorption, consistent with its deep-black colour (RVis = 2.63), slightly higher than its electric kiln counterpart (RVis = 1.41).

3.4. Effect of Temperature and Microwaves Power in Blackness of Mcconnellite

Table 5 summarizes the properties of mcconnellite (CuCrO2) powders fired in an electric kiln at 1000 and 1100 °C for three hours and in a microwave kiln at 800 and 900 W for 30 min.
Mcconnellite is the only phase detected at both 1000 and 1100 °C, as shown in Figure 2 and reference [17]. However, the blackness of the powders increases (RVis decreases from 13.8 to 6.10), in agreement with the decrease in the green shade (b*), the bandgap, and the colour deviation ΔE* relative to Carbon Black.
Mcconnellite is the only crystalline phase detected at a microwave power of 800 W [17]. When the power is increased from 800 W to 900 W, the blackness of the powders increases (RVis decreases from 9.9 to 6.98). The weak diffraction peaks of spinel CuCr2O4 observed in this sample (Figure 2) indicate the presence of a “composite effect,” which alters the reflection, absorption, and scattering of light, thereby producing distinct colour responses and enhanced blackness.
Glazing in a 1000 °C double firing frit increases blackness for electric furnace powders (RVis 5.30 to 4.40), whereas microwave-fired powders show nearly constant or slightly higher RVis (1.40 to 1.41), likely reflecting the persistence of the spinel phase and the loss of composite scattering effects when particles are embedded in the glassy matrix.

3.5. Characterization of Mcconellite Doped with Iron and Manganese

To assess firing temperature, glaze compatibility, and the effects of Fe and Mn doping, three samples were prepared: mcconnellite (CuCrO2, reference), Fe-doped (Cu0.8Fe0.2)CrO2, and Fe–Mn co-doped (Cu0.6Mn0.2Fe0.2)CrO2. All were fired in an electric kiln at 1200 °C for three hours.
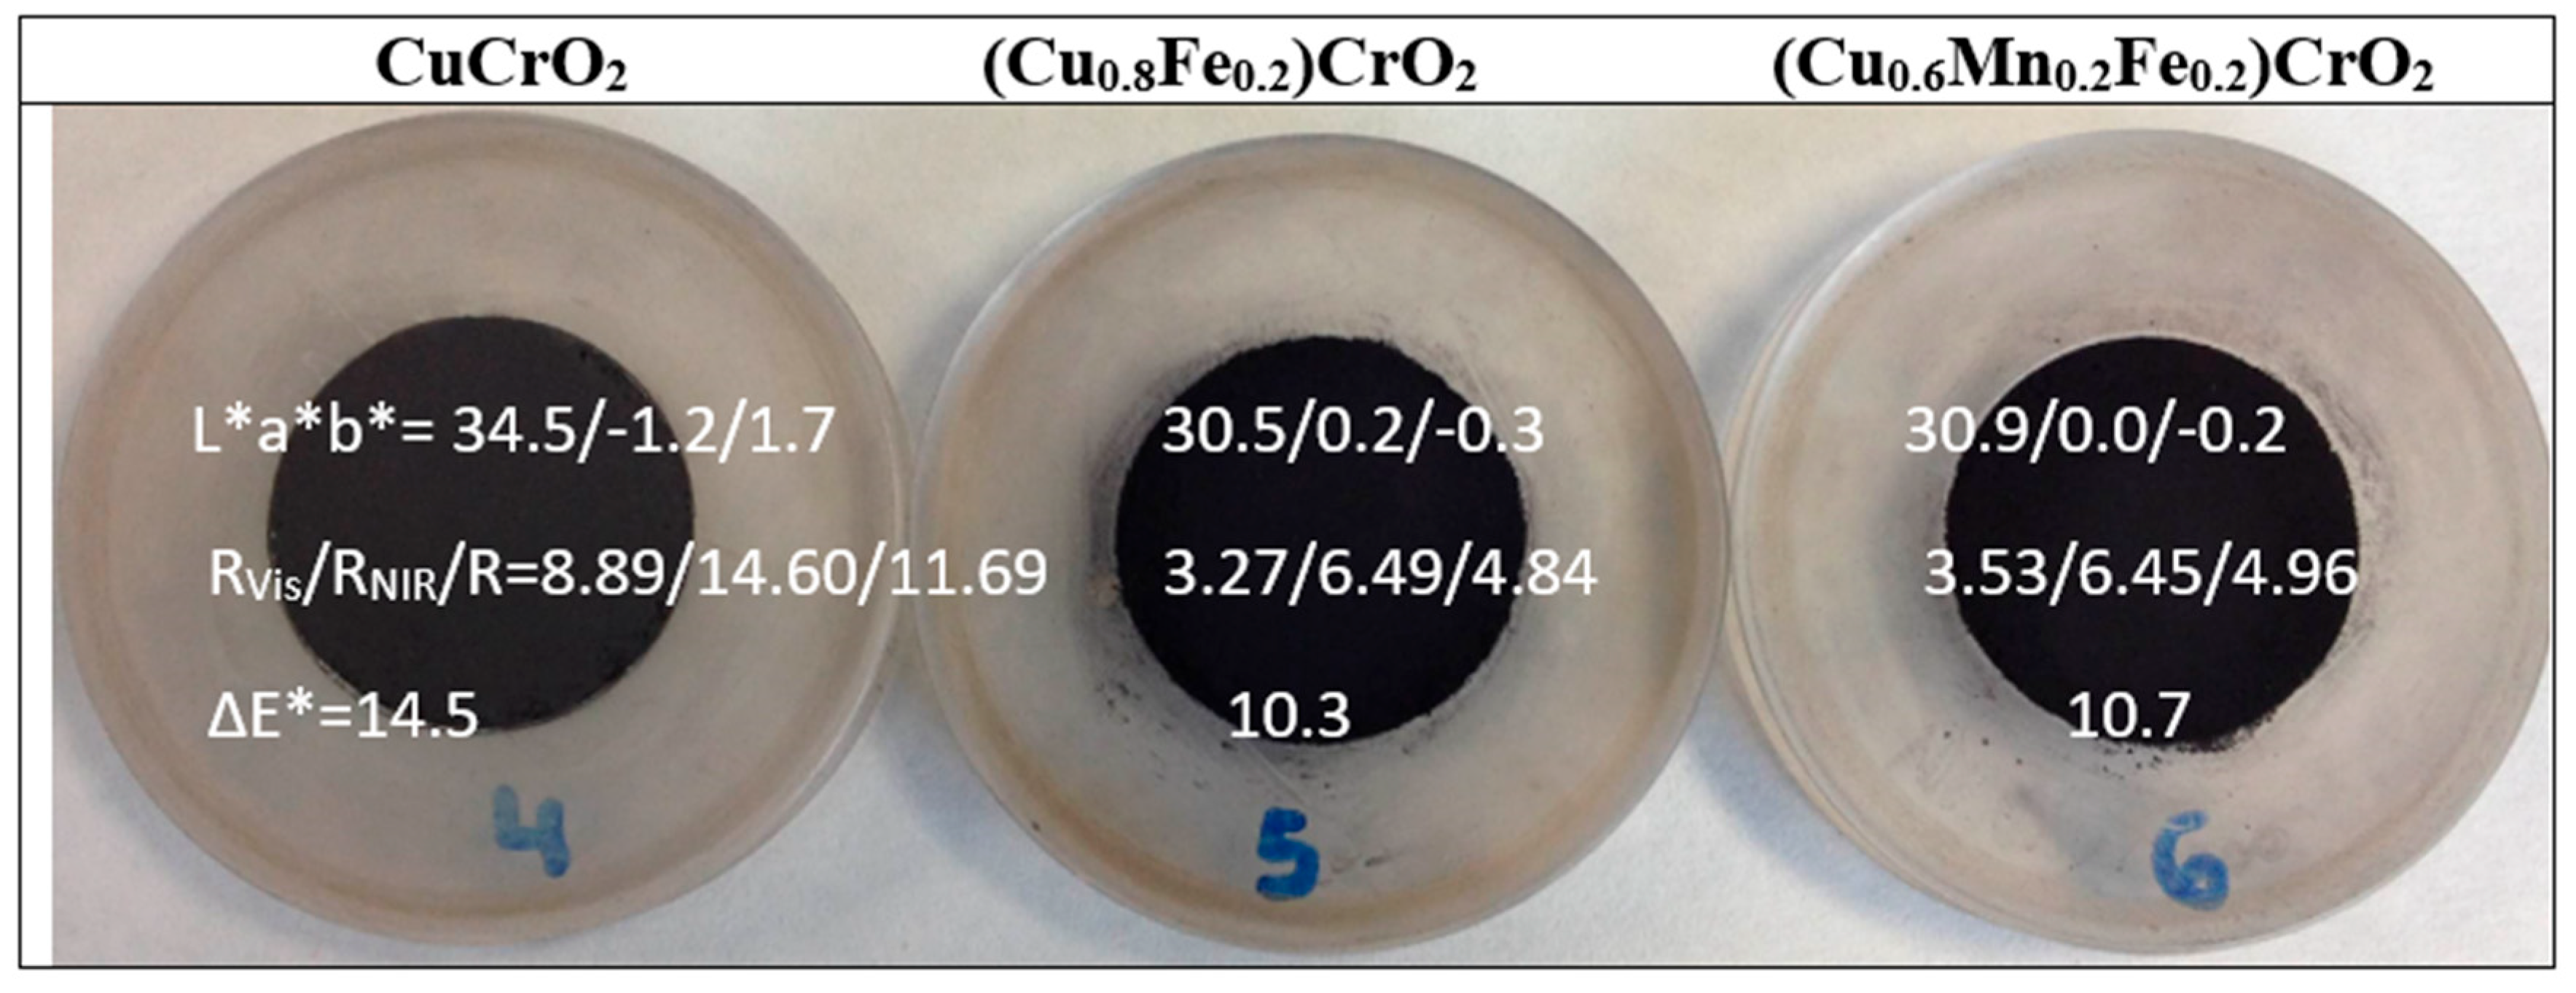
As shown in Figure 12, the fired powders appear black. Mcconnellite exhibits a slight greenish undertone (b* = −1.2), while the doped samples are nearly neutral. The undoped sample shows higher visible reflectance (RVis = 8.89%) than the doped powders (RVis ≈ 3%), corresponding to a deeper black colour.
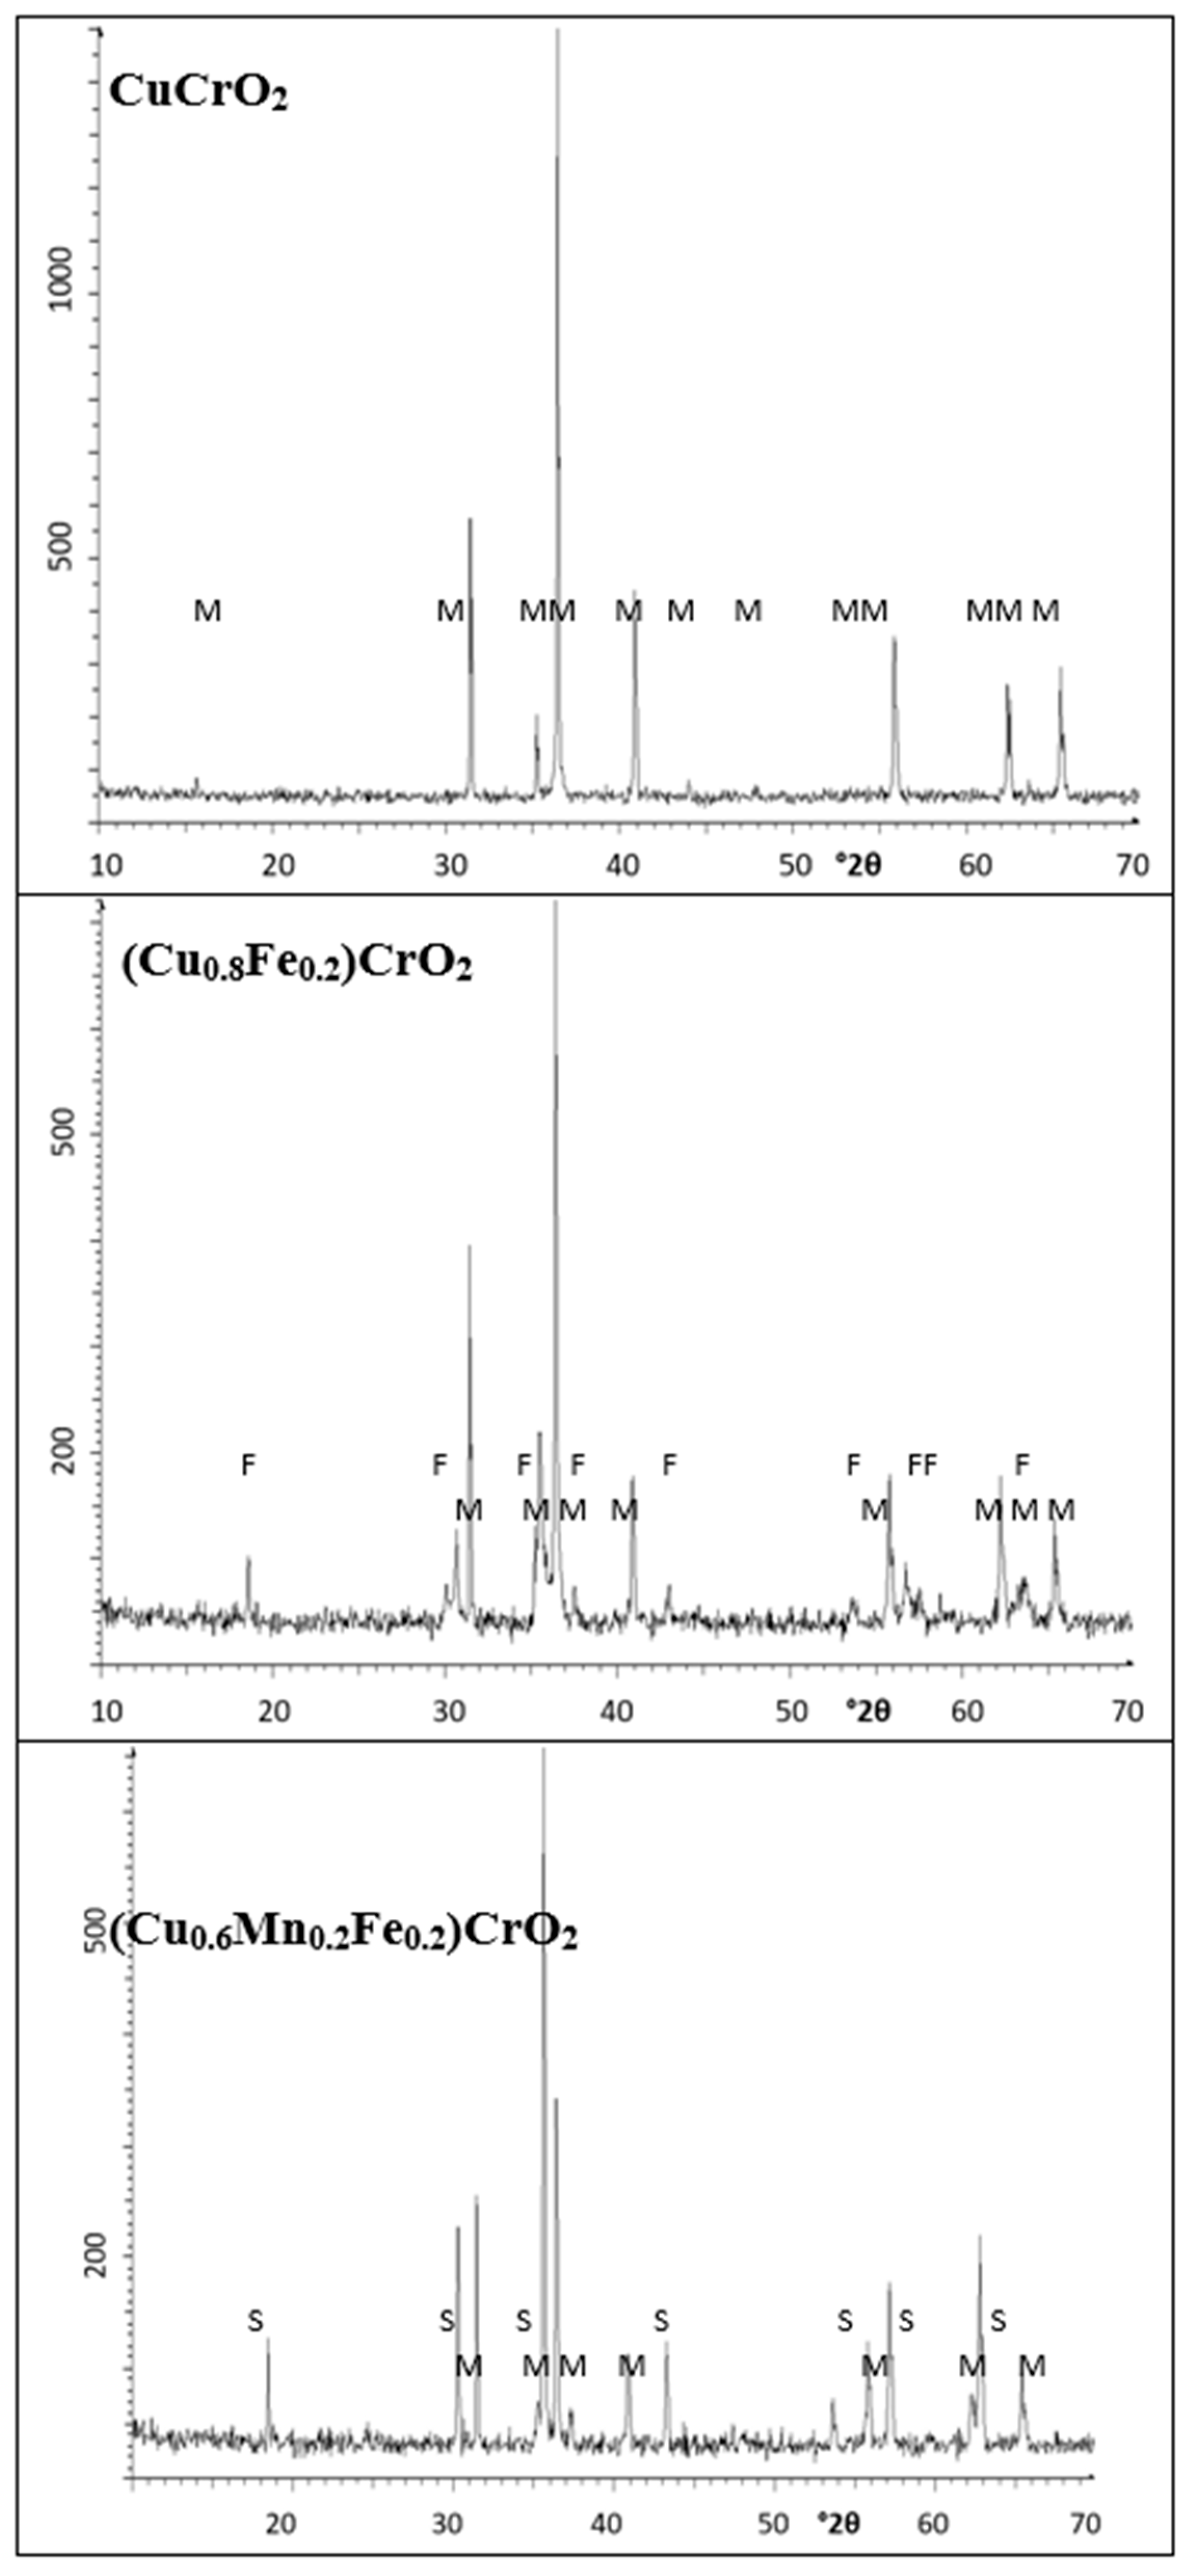
Figure 13 shows the XRD patterns of the synthesized powders. The mcconnellite sample contains only the CuCrO2 phase. In the Fe-doped sample (Cu0.8Fe0.2)CrO2, mcconnellite remains predominant, with additional medium-intensity peaks corresponding to spinel Cu(Cr,Fe)2O4. In the Fe–Mn co-doped sample, the spinel Cu(Cr,Fe,Mn)2O4 phase dominates, accompanied by residual mcconnellite reflections. Spinels, known black pigments [14,15], contribute to increased light backscattering (composite effect), resulting in enhanced colour strength. Accordingly, the doped powders exhibit lower RVis values than pure mcconnellite.
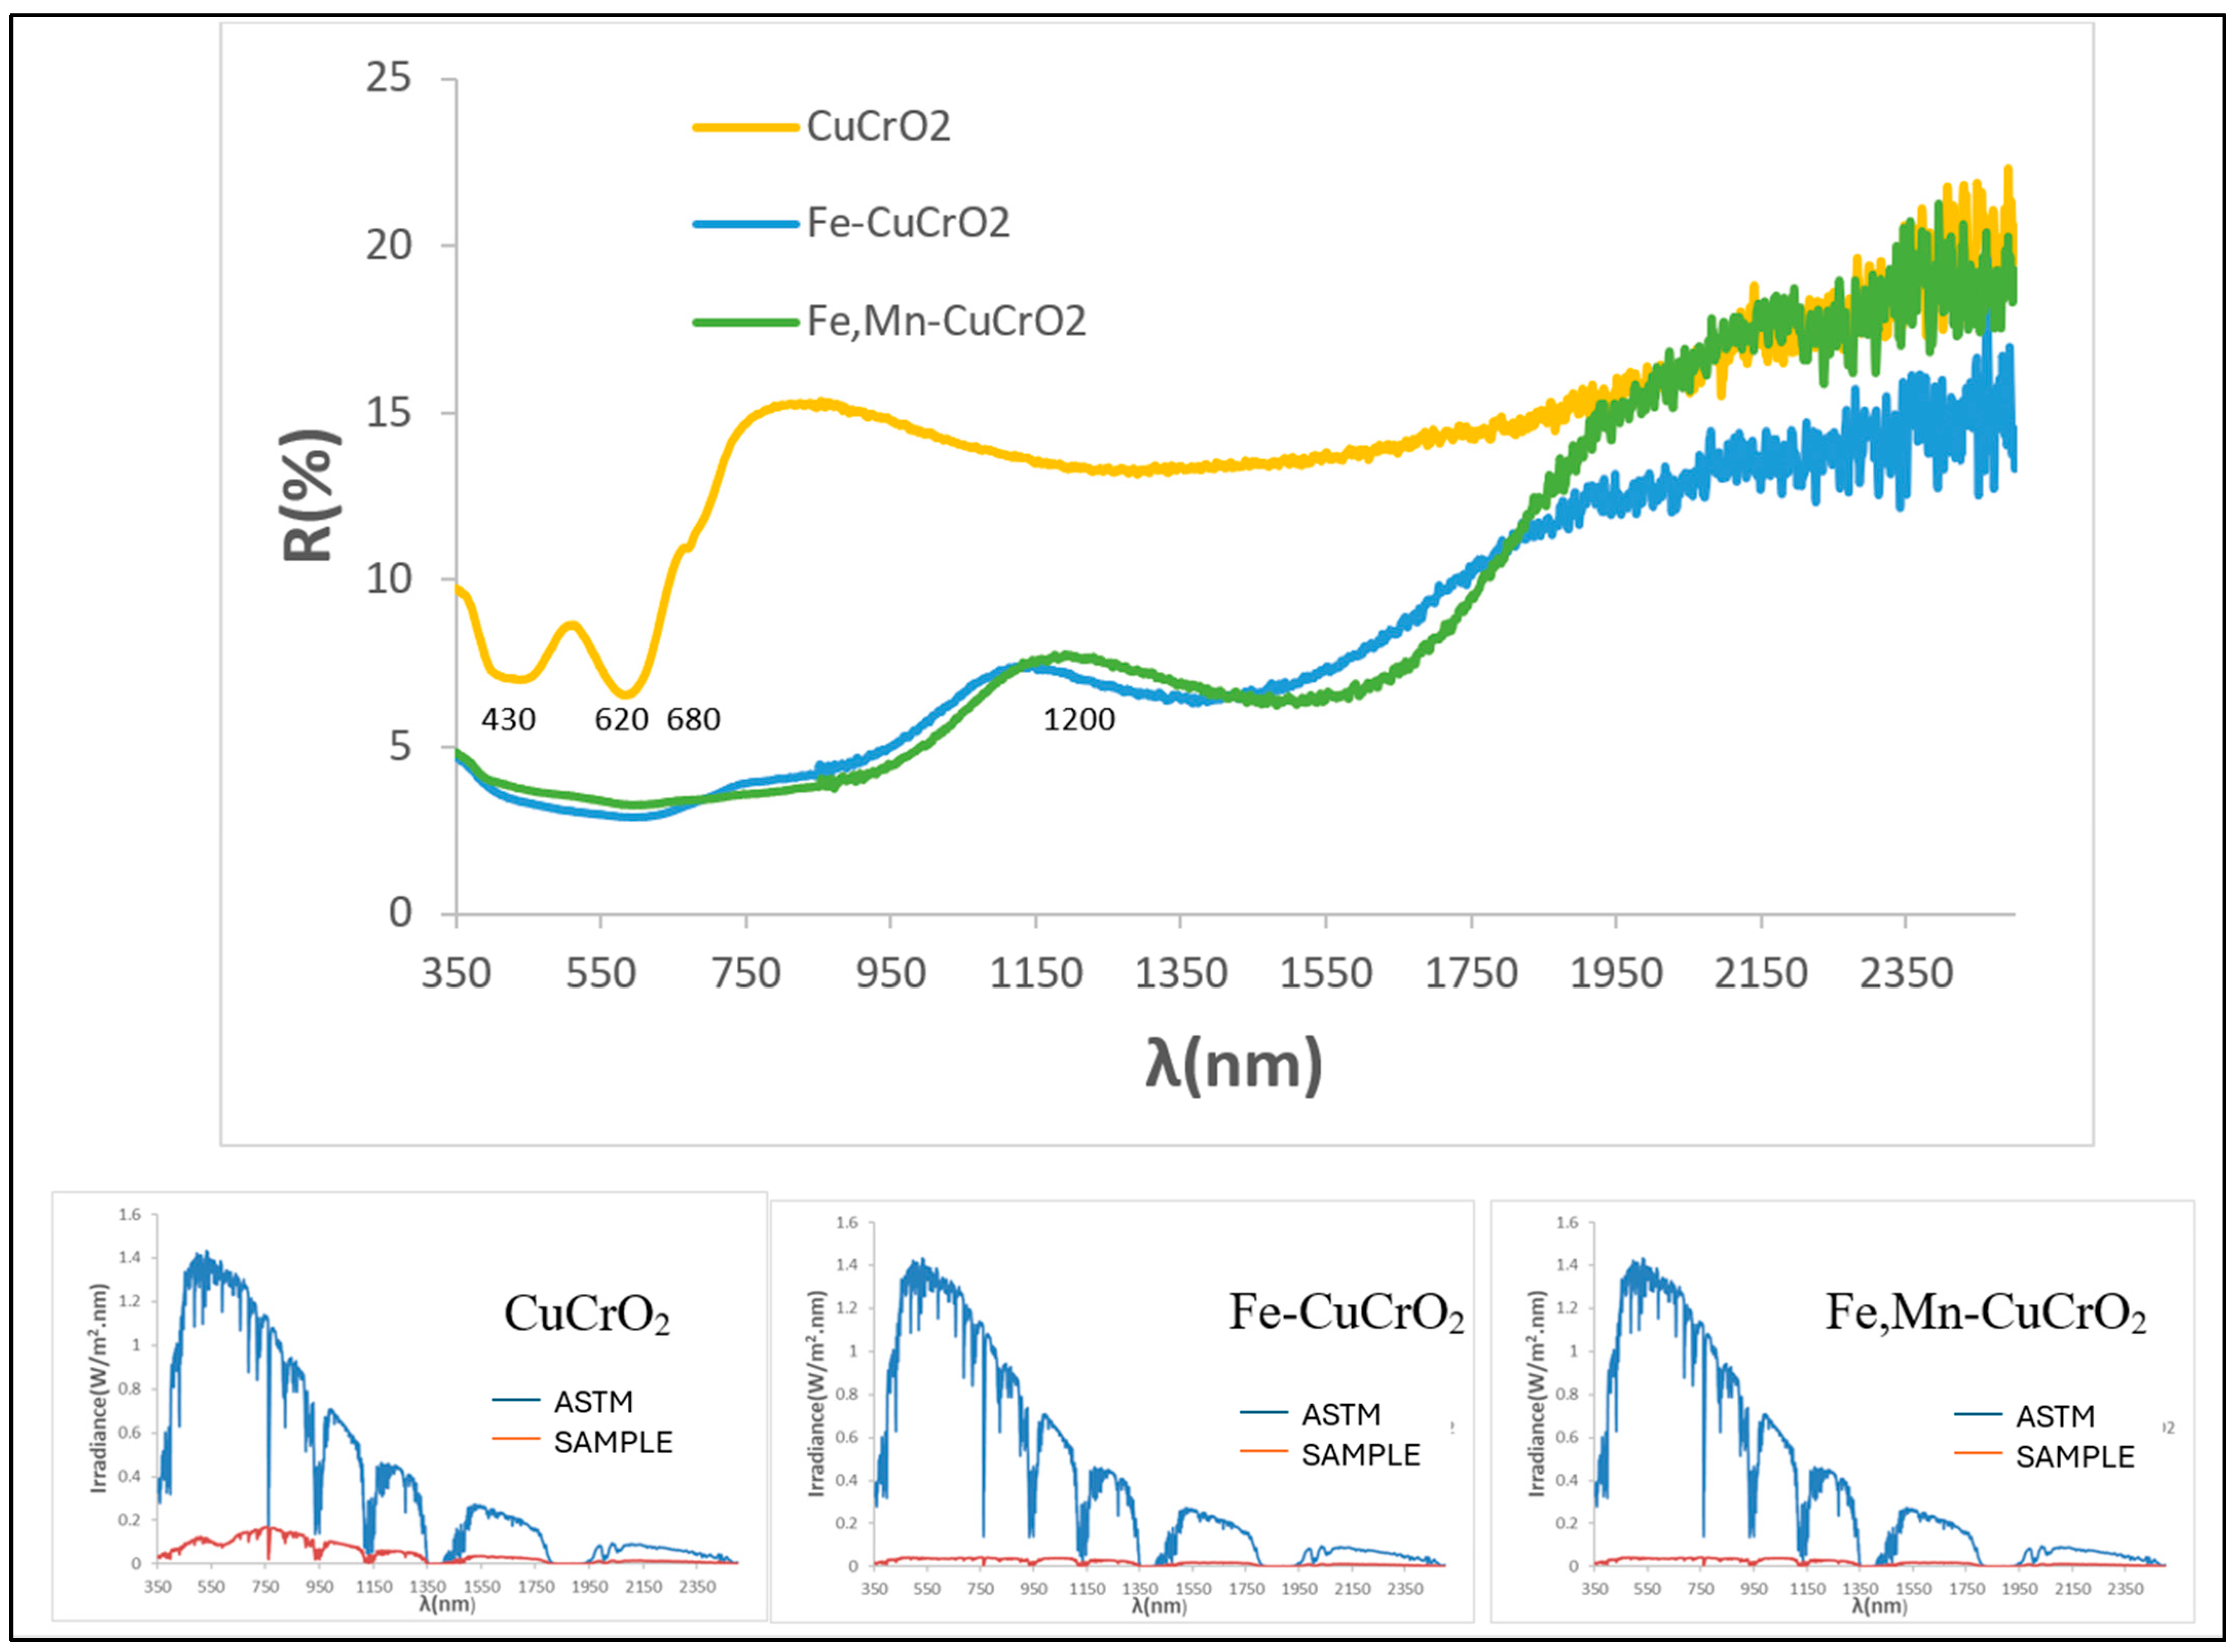
Figure 14 presents the UV–Vis–NIR diffuse reflectance and the corresponding solar absorption spectra of powders. The mcconnellite shows higher reflectivity, consistent with its lower blackness. Characteristic absorption minima at 430, 620, and 1200 nm (Cr3+, octahedral coordination) and at 680 nm (Cu+) are clearly visible. In the doped samples, overlapping bands from Mn3+ and Fe3+ hinder individual band assignment. The solar absorption spectra confirm higher overall absorbance for the doped compositions across the solar range.
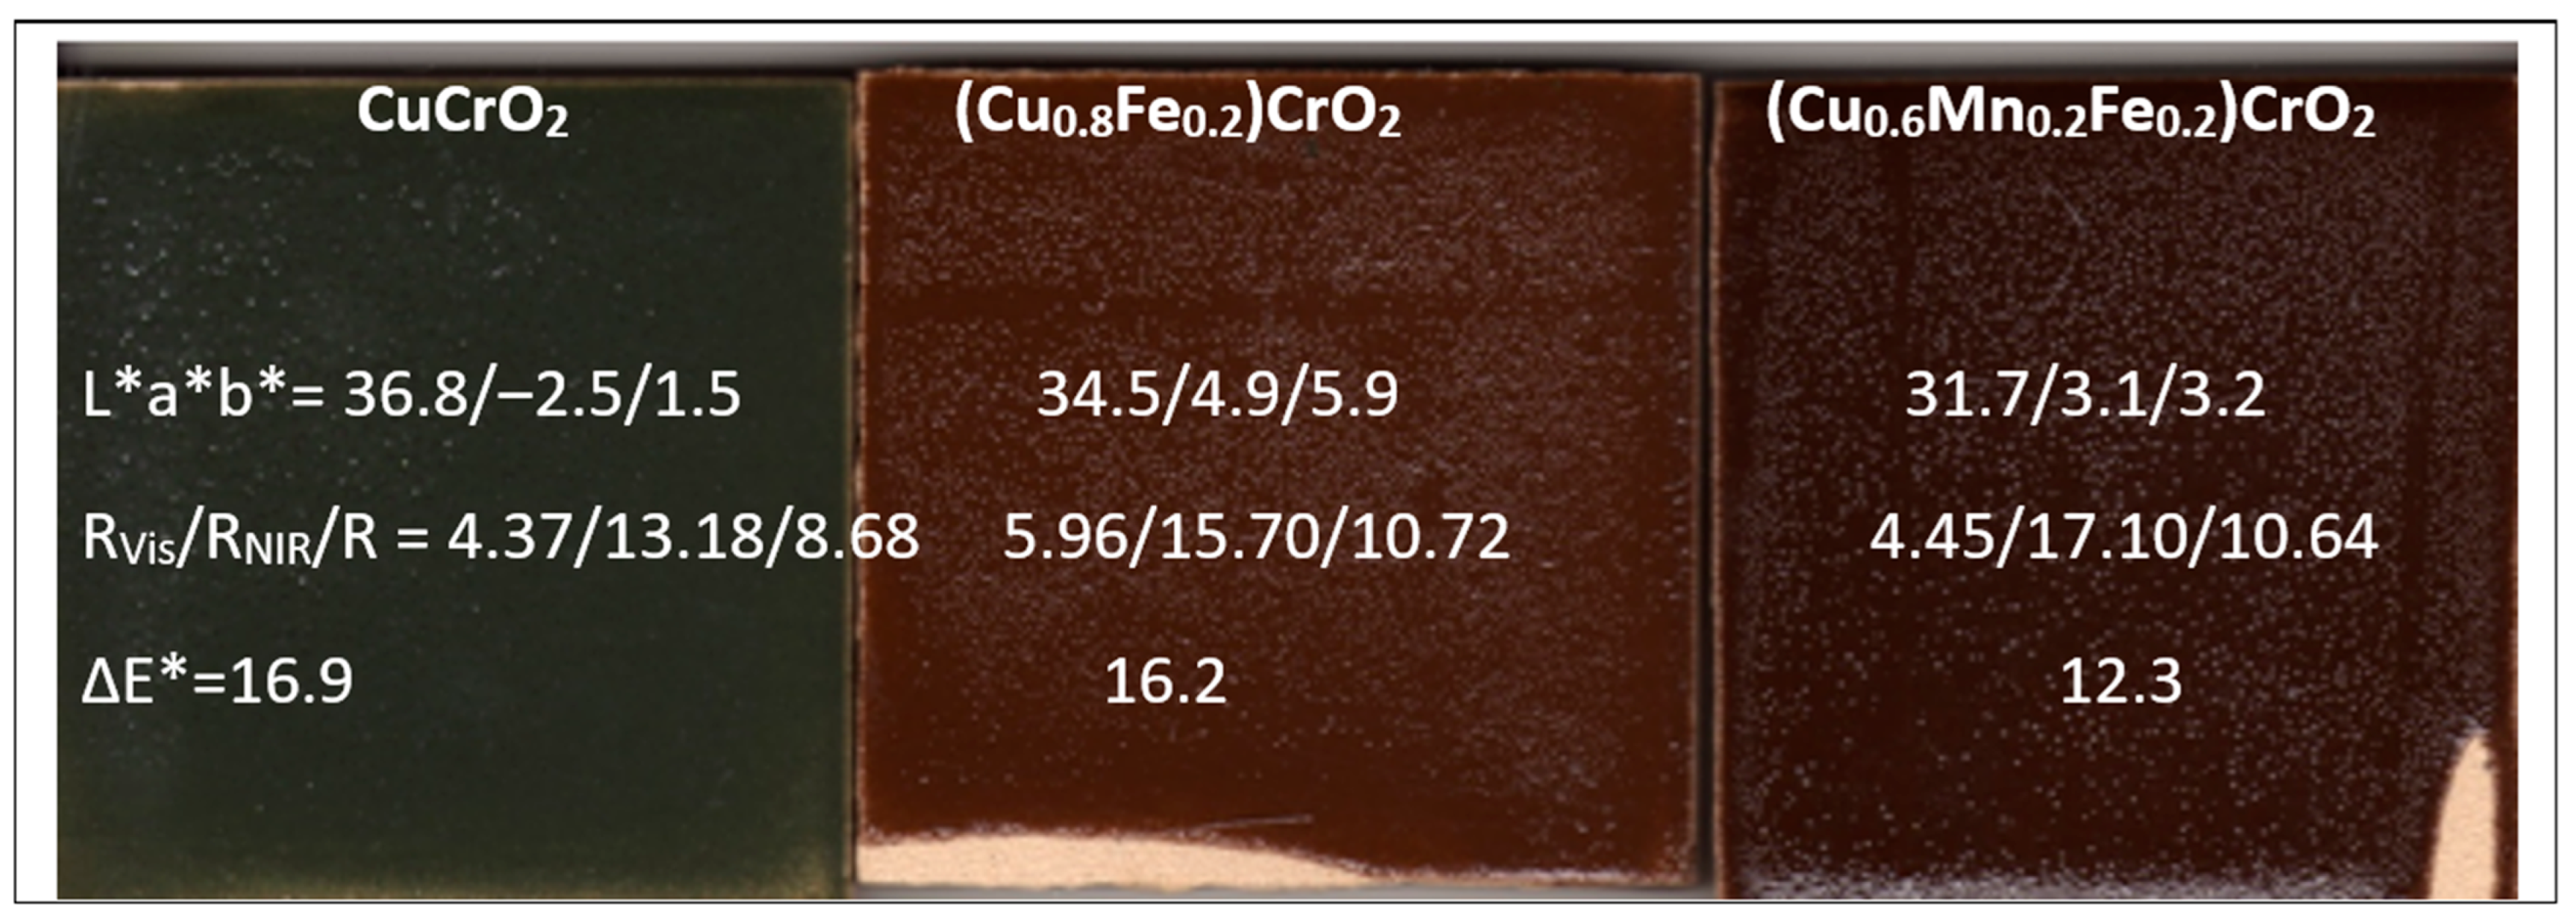
Figure 15 shows images of 5 wt% glazed samples in a porcelain glaze (maturation point 1190 °C; composition in wt%: SiO2 67, K2O 3, CaO 12.5, MgO 1.5, ZnO 6, Al2O3 10; average grain size of 7–30 μm, supplied by Torrecid S.A. l’Alcora, Spain), including their colour and reflectance characteristics. The mcconnellite sample, having lost the composite effect observed in the powder form due to particle dispersion within the glassy matrix, now exhibits the deepest black shade with a slight greenish undertone (RVis = 4.37, b* = −2.5). In contrast, the doped samples display a visibly brown hue, with a* values of 4.9 and 3.1 for the Fe-doped and Fe–Mn co-doped compositions, respectively. When the pigments are glazed, the attack of this aggressive glassy matrix can dissolve and decompose the pigment particles, leading to the crystallization of highly stable spinels such as zinc spinels (ZnO should therefore be avoided in glazes to preserve pigment integrity) [44,45]. The high-temperature porcelain glaze supplied by Torrecid S.A. contains approximately 6 wt% ZnO; consequently, multicomponent brown spinels with a general composition of (Zn,Fe,Mn,Cu)(Fe,Mn,Cr)2O4 may form (see brown spinels in the CPMA classification [26]). These phases are difficult to analyze in glassy matrices containing dispersed particles.
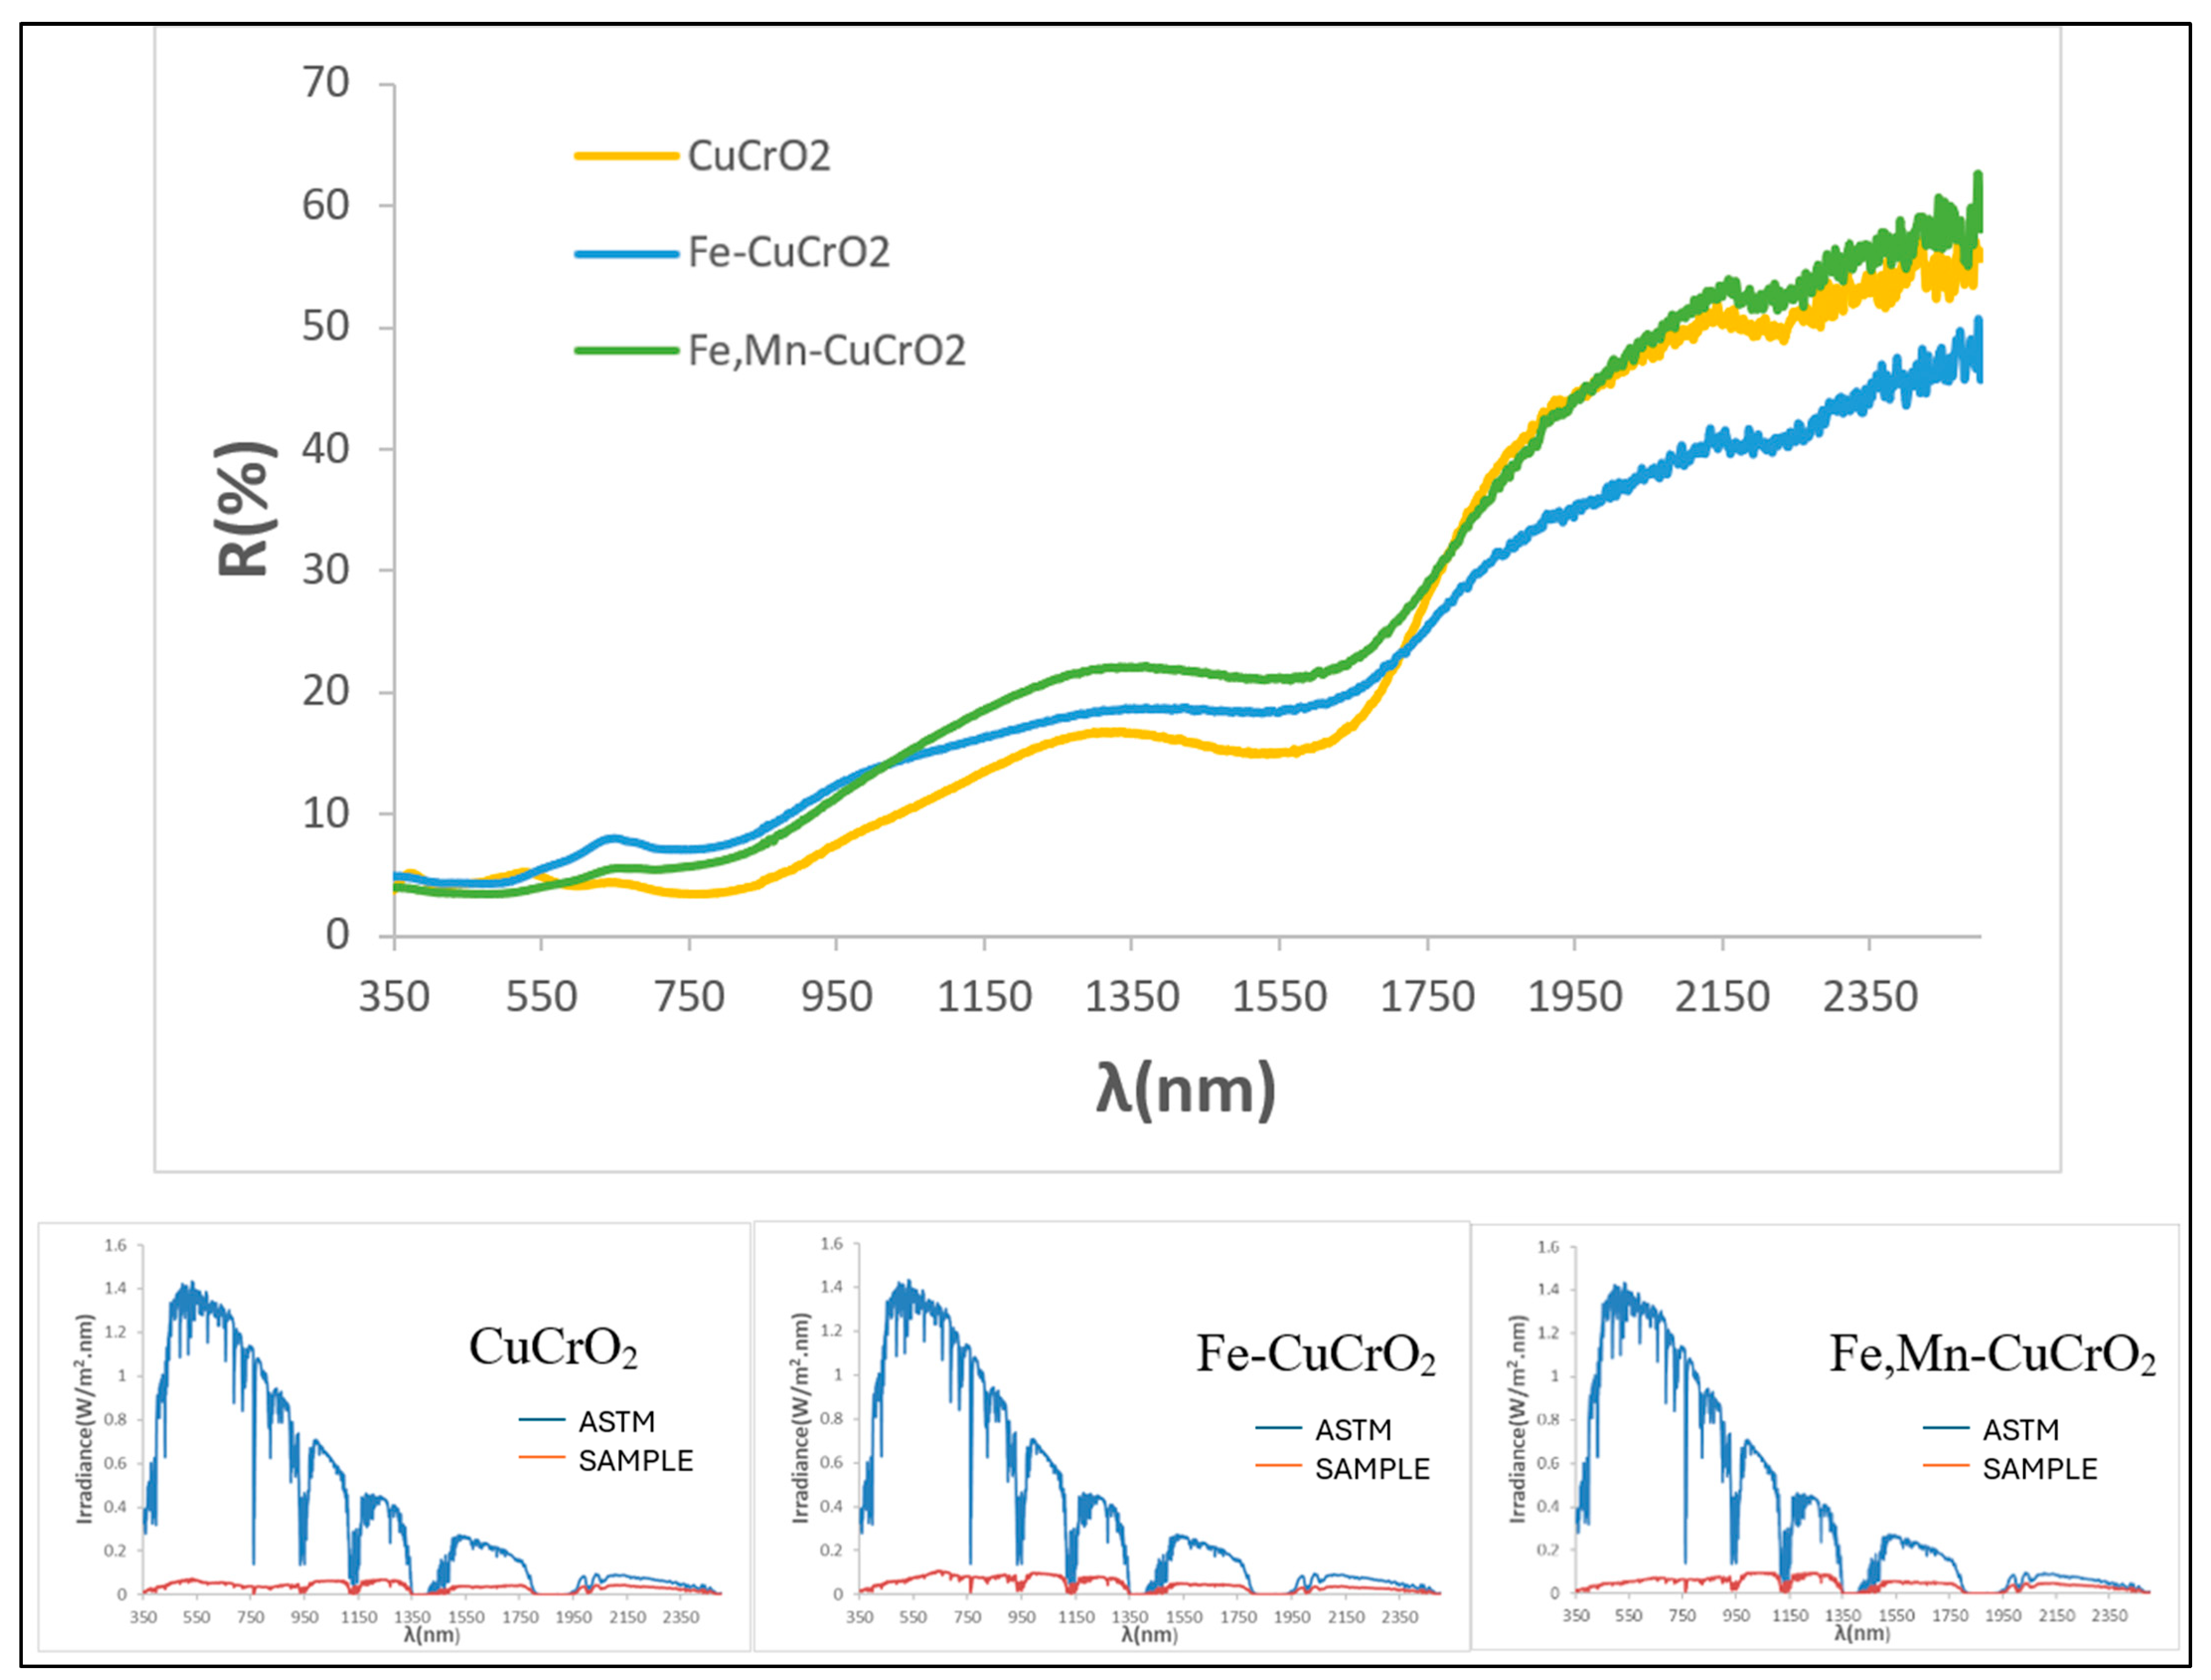
Figure 16 shows the UV–Vis–NIR diffuse reflectance spectra of 5 wt% pigmented glazes on porcelain (fired at 1190 °C) and their corresponding solar absorption spectra. The three samples exhibit similar spectral profiles; however, the mcconnellite-glazed sample shows slightly lower reflectance in the yellow–red wavelength region (550–700 nm), resulting in its visually black appearance, in contrast to the brown hues of the doped glazes. In all cases, reflectance in the NIR region increases, indicating that these glazed surfaces are promising candidates for selective solar absorber applications. Among them, mcconnellite demonstrates the highest absorption in the visible range [47].

4. Conclusions

Cuprate delafossite phases, such as CuMnO2 (crednerite) or CuFeO2, as well as iron- and manganese-doped mcconnellite composites, were analyzed as candidates for producing intense black ceramic pigments using conventional solid-state synthesis, employing both electric kiln and fast dielectric (microwave) firing, and compared with mcconnellite (CuCrO2) used as a reference.
In the case of crednerite, the electrically fired powder exhibits a composite of spinel and crednerite, whereas the microwave-fired powder consists almost exclusively of spinel, resulting in slightly lower blackness. When glazed in an electric kiln, spinel CuMn2O4 is detected in the microwave-glazed sample, while no diffraction peaks or crystallization halos are observed for the electrically fired sample. No evidence of crednerite preservation after interaction with the molten glaze is found. Therefore, the highly stable spinel CuMn2O4 is identified as the crystalline phase responsible for the black coloration in this system. Glazed samples prepared in a microwave kiln show identical behaviour.
For delafossite, both the electrically and microwave-fired powders contain a delafossite–tenorite (CuFeO2–CuO) composite, with weak tenorite peaks in the electrically fired sample. The so-called “composite effect” accounts for the slightly higher blackness of the tenorite-rich microwave-fired powder (RVis = 6.45% versus 6.87% for the electrically fired sample). After glazing in an electric kiln, conventional XRD patterns display broad crystallization halos together with a diffraction peak at 39° 2θ, corresponding to the intense [114] plane reflection of tenorite, indicating the decomposition of delafossite within the molten glass. Similar behaviour is observed for the samples glazed using a microwave kiln.
For mcconnellite, a single-phase material is obtained in the electrically fired powder, whereas the microwave-fired sample shows residual oxide peaks. The higher blackness of mcconnellite explains the slightly lower RVis value for the electrically fired sample (RVis = 6.10% versus 6.98% for the microwave-fired sample). Upon glazing in an electric kiln, both grazing-incidence and conventional XRD analyses confirm the crystallization of CuCrO2 in all cases. The persistence of mcconnellite in the molten glass demonstrates its high thermal stability and excellent performance as a black ceramic pigment. Comparable results are obtained for samples glazed in a microwave kiln.
Using a microwave kiln, the blackness of the samples improves compared to electric firing. Among the powders, crednerite stands out with RVis = 4.85%, corresponding to 95.15% absorption of visible light. In contrast, for the glazed samples, although an improvement in blackness was observed in all cases (except for the mcconnellite sample) when using the microwave kiln, the optimal process remains glazing in the electric kiln. This is because glazing with the microwave kiln leads to numerous pinhole defects, likely associated with copper reduction promoted by microwave processing.
For samples glazed in an electric kiln, crednerite exhibited an RVis value of 5.10 (94.9% absorption), whereas mcconnellite showed the highest blackness, with RVis = 1.41 (98.59% absorption). Among the samples glazed in a microwave kiln, crednerite reached RVis = 4.27 (95.73% absorption), and mcconnellite achieved RVis = 2.63 (97.37% absorption), which was slightly inferior to the corresponding glazed in the electric furnace.
An increase in the electric firing temperature from 1000 to 1100 °C resulted in an enhancement of mcconnellite blackness. In contrast, increasing the microwave power from 800 W to 900 W produced very similar values (RVis ≈ 1.40%).
The thermal stability of mcconnellite’s blackness was confirmed at 1200 °C, together with its compatibility with porcelain glazes with high maturation temperature (1190 °C). The partial substitution of copper by iron and manganese further improved colour performance. The undoped mcconnellite powder maintained an intense black colour at 1200 °C (RVis = 8.89%), although this value was higher than those recorded for the doped composites (RVis = 3.27 and 3.23 for the Fe-doped and Fe–Mn-doped samples, respectively). The pigment also exhibited good resistance to high-maturation porcelain glazes (1190 °C), with RVis = 4.37, which was slightly inferior to the doped counterparts (RVis = 5.96 and 4.45 for the Fe- and Fe–Mn-doped samples, respectively), which displayed a brownish coloration attributed to the loss of the composite effect.
Among the delafossites investigated, only mcconnellite subjected to microwave-assisted firing (RVis = 1.40%, corresponding to 98.60% visible light absorption) emerges as a promising candidate for an ultra-black ceramic pigment (RVis < 1%), following further optimization under ZnO-free glaze conditions and a firing temperature of approximately 1000 °C. Considering the blackness in powder form, microwave-fired crednerite (RVis = 4.85; 95.15% absorption) and the Fe- and Fe–Mn-doped mcconnellite composites (RVis = 3.27 and 3.23%, respectively) appear as potential candidates for deep-black pigment applications (RVis < 3%), benefiting from the composite effect between the delafossite and chromium spinel phases. In addition, microwave-fired crednerite demonstrated promising deep-black behaviour in glazed samples (RVis = 4.27; 95.73% absorption).

Author Contributions

Conceptualization, G.M., G.M.-A. and M.L.; methodology, G.M. and C.D.; software, G.M.-A.; validation, G.M., C.D. and V.E.; formal analysis, G.M.-A.; investigation, C.D. and V.E.; resources, G.M.; data curation, C.D.; writing—original draft preparation, C.D., G.M. and G.M.-A.; writing—review and editing, G.M. and C.D.; visualization, V.E.; supervision, G.M. and M.L.; project administration, G.M. and M.L.; funding acquisition, G.M. and M.L. All authors have read and agreed to the published version of the manuscript.

Funding

This research was funded by Jaume I University (UJI) by UJI-B2021-73 and MEFD Spain by PID2024-158224NB-I00 funded by MCIN/AEI//10.13039/501100011033 and ERDF/EU.

Data Availability Statement

The original contributions presented in this study are included in the article. Further inquiries can be directed to the corresponding author.

Acknowledgments

The authors acknowledge Jaume I University (UJI) its financial support (UJI-B2021-73), the MEFD Spain and the technical support of the Servei Central d’Instrumentació Científica (SCIC) (UJI).

Conflicts of Interest

The authors declare no conflicts of interest.

Abbreviations

SSASelective solar absorber
IRInfrared
XRDX-ray Diffraction
SEMScanning electron microscopy with energy-dispersive spectroscopy
ICDDInternational Centre for Diffraction Data
UV-Vis-NIRUltraviolet-visible-near-infrared

References

  1. Friedel, C. Sur une combinaison naturelle des oxydes de fer et de cuivre, et sur la reproduction de l’atacamite. Comptes Rendus De L’académie Des Ciences i 1873, 77, 211–214. [Google Scholar]
  2. Shannon, R.D.; Rogers, D.B.; Prewitt, C.T. Chemistry of noble metal oxides. I. Syntheses and properties of ABO2 delafossite compounds. Inorg. Chem. 1971, 10, 713–718. [Google Scholar] [CrossRef]
  3. Tanaka, M.; Hasegawa, M.; Higuchi, T. Origin of the metallic conductivity in PdCoO2 with delafossite structure. Physica B 1998, 245, 157–163. [Google Scholar] [CrossRef]
  4. Marquardt, M.A.; Ashmore, N.A.; Cann, D.P. Crystal chemistry and electrical properties of the delafossite structure. Thin Solid Film. 2006, 496, 146–156. [Google Scholar] [CrossRef]
  5. Kawazoe, H.; Yasukawa, M.; Hyodo, H.; Kurita, M.; Yanagi, H.; Hosono, H. P-type electrical conduction in transparent thin films of CuAlO2. Nature 1997, 389, 939–942. [Google Scholar] [CrossRef]
  6. Daoua, R.; Frésarda, R.; Eyerta, V.; Héberta, S.; Maignana, A. Unconventional aspects of electronic transport in delafossite oxides. Sci. Technol. Adv. Mater. 2017, 18, 919–938. [Google Scholar] [CrossRef]
  7. Pabst, A. Crystal structure and density of delafossite. Am. Mineral. 1938, 23, 175–176. [Google Scholar]
  8. Kohler, B.U.; Jansen, M. Synthesis and crystal structure of 2H-CuAlO2. Z. Krist. 1983, 165, 313–314. [Google Scholar] [CrossRef]
  9. Poienar, M.; Banica, R.; Sfirloaga, P.; Ianasi, C.; Mihali, C.V.; Vlazan, P. Microwave-assisted hydrothermal synthesis and catalytic activity study of crednerite-type CuMnO2 materials. Ceram. Int. 2018, 44, 6157–6161. [Google Scholar] [CrossRef]
  10. Jackson, J.J.; Puretzky, A.A.; More, K.L.; Rouleau, C.M.; Eres, G.; Geohegan, D.B. Pulsed growth of vertically aligned nanotube arrays with variable density. ACS Nano 2010, 4, 7573–7581. [Google Scholar] [CrossRef] [PubMed]
  11. Monrós, G. Black Inorganic Pigments: From Black to Ultra-Black Behaviour, A Microstructural Approach. J. Miner. Mater. Sci. 2025, 6, 1119. [Google Scholar] [CrossRef]
  12. Marques, V.; Krings, W.; Reis, J.; Gorb, S.; Guillermo-Ferreira, R. Ultrablack color in velvet ant cuticle. Beilstein J. Nanotechnol. 2024, 15, 1554–1565. [Google Scholar] [CrossRef] [PubMed]
  13. Brenner, M.; Hearing, V.J. The protective role of melanin against UV damage in human skin. Photochem. Photobiol. 2008, 84, 539–549. [Google Scholar] [CrossRef] [PubMed]
  14. Calbo, J.; Sorlí, S.; Llusar, M.; Tena, M.A.; Monrós, G. Minimisation of toxicity in nickel ferrite black pigment. Br. Ceram. Trans. 2004, 103, 3–9. [Google Scholar] [CrossRef]
  15. Calbo, J.; Mestre, A.; García, A.; Tena, M.A.; Llusar, M.; Monrós, G. Multicomponent black coloured spinels from alkoxides. J. Sol-Gel Sci. Technol. 2003, 26, 191–194. [Google Scholar] [CrossRef]
  16. Monrós, G.; Delgado, C.; Monrós-Andreu, G.; Badenes, J.; Llusar, M. Black Coloured Glazes with Tetragonal CuCr2O4 Ceramic Pigment as Selective Solar Absorbers for Integral Ceramic Solar Collectors. J. Sol. Energy Res. Updates 2024, 11, 78–92. [Google Scholar] [CrossRef]
  17. Monrós, G.; Badenes, J.; Delgado, C.; Monrós-Andreu, G.; Llusar, M. New Mcconnellite Ceramic Pigment as a Selective Solar Absorber: Effects of Microwave Firing and Rare Earth Doping. Materials 2025, 18, 1520. [Google Scholar] [CrossRef]
  18. Feng, G.; Liu, T.; Mu, J.; Jiang, F.; Guo, J.; Chiao, L.; Wu, Q.; Zhang, X.; Liu, J.; Liang, J. Effect of mineralizer on the synthesis of (Ni, Mn) co-doping CuFe5O8 pigment and its glazing performance. Open Ceram. 2025, 23, 100822. [Google Scholar] [CrossRef]
  19. Monrós, G.; Cerro, S.; Badenes, J.A.; Llusar, M. Black Cool Pigments for Urban Heat Island (UHI) Control: From Cr-Hematite to Mn-Melilite. J. Sol. Energy Res. Updates 2021, 8, 27–44. [Google Scholar] [CrossRef]
  20. Calbo, J.; Gargori, C.; Sorlí, S.; Badenes, J.; Tena, M.A.; Monrós, G. Síntesis de pigmentos cerámicos mediante radiación microondas. Bol. Soc. Esp. Ceram. Vidr. 2007, 46, 14–20. [Google Scholar] [CrossRef]
  21. Blosi, M.; Dondi, M.; Albonetti, S.; Baldi, G.; Barzanti, A.; Zanelli, C. Microwave-assisted synthesis of Pr–ZrSiO4, V–ZrSiO4 and Cr–YAlO3 ceramic pigments. J. Eur. Cer. Soc. 2009, 29, 2951–2957. [Google Scholar] [CrossRef]
  22. Bhattacharya, M.; Basak, T. A review on the susceptor assisted microwave processing of materials. Energy 2016, 97, 306–338. [Google Scholar] [CrossRef]
  23. CIE Comission International de l’Eclairage. Recommendations on Uniform Color Spaces, Colour Difference Equations, Psychometrics Colour Terms; Bureau Central de la CIE: Paris, France, 1978. [Google Scholar]
  24. Tauc, J.; Grigorovici, R.; Vancu, A. Optical Properties and Electronic Structure of Amorphous Germanium. Phys. Status Solidi 1966, 15, 627–637. [Google Scholar] [CrossRef]
  25. ASTM G173-03; Standard Tables for Reference Solar Spectral Irradiance at Air Mass 1.5: Direct Normal and Hemispherical for a 37 Degree Tilted Surface. American Society for Testing and Materials (ASTM) International: Conshohocken, PA, USA, 2020.
  26. CPMA. Classification and Chemical Description of the Complex Inorganic Color Pigments, 4th ed.; Alexandria Dry Color Manufaturers Association: Alexandria, VA, USA, 2010. [Google Scholar]
  27. Monrós, G. Pigment, Ceramic, in Encyclopedia of Color Science and Technology; Luo, R., Ed.; Springer: Berlin/Heidelberg, Germany, 2014; ISBN 978-1-4419-8070-0/978-3-642-27851-8. Available online: https://link.springer.com/rwe/10.1007/978-1-4419-8071-7_181 (accessed on 1 October 2025).
  28. ASTM D3265-21; Standard Test Method for Carbon Black—Tint Strength. American Society for Testing and Materials (ASTM) International: West Conshohocken, PA, USA, 2021.
  29. ISO 5435:2017(E); Rubber Compounding Ingredients, Carbon Black, Determination of Tinting Strength. International Organization for Standardization (ISO): Geneva, Switzerland, 2017.
  30. Ferch, H.; Seibold, K. Zur Bedeutung und Existenz von Primärteilchen bei hochdispersen Stoffen. Farbe Lack 1984, 90, 88–98. [Google Scholar]
  31. Ross, C.; Nwaubani, S. Increasing Pigment Black Jetness with Color Pigment Blending, DCL Corporation. Available online: https://www.pigments.com/wp-content/uploads/RETEC-2020-Increasing-Pigment-Black-Jetness-with-Color-Pigment-Blending.pdf (accessed on 1 July 2025).
  32. Driessens, F.C.M.; Rieck, G.D. Phase Equilibria in the System Cu-Mn-O. Z. Anorg. Und Allg. Chem. 1967, 351, 48–62. [Google Scholar] [CrossRef]
  33. Trari, M.; Topferb, J.; Dordorc, P.; Grenierc, J.C.; Pouchardc, M.; Doumercc, J.P. Preparation and physical properties of the solid solutions Cu1+xMn1-xO2 (0<x<0.2). J. Solid State Chem. 2005, 178, 2751–2758. [Google Scholar] [CrossRef]
  34. Huang, X.; Ni, C.; Zhao, G.; Irvine, J.T.S. Oxygen storage capacity and thermal stability of the CuMnO2–CeO2 composite system. J. Mater. Chem. A 2015, 24, 1–7. [Google Scholar] [CrossRef]
  35. Bessekhouad, Y.; Gabes, Y.; Bouguelia, A.; Trari, M. The physical and photo electrochemical characterization of the crednerite CuMnO2. J. Mater. Sci. 2007, 42, 6469–6476. [Google Scholar] [CrossRef]
  36. Solsona, B.; Hutchings, G.J.; Garcia, T.; Taylor, S.H. Improvement of the catalytic performance of CuMnOx catalysts for CO oxidation by the addition of Au. New J. Chem. 2004, 28, 708–711. [Google Scholar] [CrossRef]
  37. Shannon, R.D. Revised effective ionic radii and systematic studies of interatomic distances in halides and chalcogenides. Acta Cryst. 1976, A32, 751–767. [Google Scholar] [CrossRef]
  38. Huanga, Y.; Wangan, S.; Tsaib, A.; Kameoka, S. Reduction behaviors and catalytic properties for methanol steam reforming of Cu based spinel compounds CuX2O4 (X=Fe, Mn, Al, La). Ceram. Int. 2014, 40, 4541–4551. [Google Scholar] [CrossRef]
  39. Qiu, X.; Liu, M.; Sunada, K.; Miyauchi, M.; Hashimoto, K. A facile one-step hydrothermal synthesis of rhombohedral CuFeO2 crystals with antivirus property. Chem. Commun. 2012, 48, 7365–7367. [Google Scholar] [CrossRef]
  40. Matasov, A.; Bush, A.; Kozlov, V.; Stash, A. 3R-CuCrO2 delafosite: Crystal growth, crystal structure, dielectric and DC conductivity properties. Discov. Mater. 2024, 4, 73. [Google Scholar] [CrossRef]
  41. Sanam, P.K.J.; Shah, M.; Pradyumnan, P.P. Structure induced modification on thermoelectric and optical properties by Mg doping in CuCrO2 nanocrystals. Solid State Commun. 2022, 353, 114855. [Google Scholar] [CrossRef]
  42. Dondi, M.; Zanelli, C.; Ardit, M.; Cruciani, G.; Mantovani, L.; Tribaudino, M.; Andreozzi, G.B. Ni-free, black ceramic pigments based on Co—Cr—Fe—Mn spinels: A reappraisal of crystal structure, colour and technological behaviour. Ceram. Int. 2013, 39, 9533–9547. [Google Scholar] [CrossRef]
  43. Prasanna, T.R.S. Angle dependence of the integrated intensity in thin film X-ray diffraction. arXiv 2017, arXiv:1612.01805v2. [Google Scholar] [CrossRef]
  44. Verger, L.; Olivier, D.; Rousse, G.; Cotte, M.; Cormier, M.L. The Stability of Gahnite Doped with Chromium Pigments in Glazes from the French Manufacture of Sèvres. J. Am. Ceram. Soc. 2016, 100, 86–95. [Google Scholar] [CrossRef]
  45. Monrós, G.; Badenes, J.A.; Llusar, M.I. Ecofriendly High NIR Reflectance Ceramic Pigments Based on Rare Earths Compared with Classical Chromophores Prepared by DPC Method. Ceramics 2022, 5, 614–641. [Google Scholar] [CrossRef]
  46. Schorne-Pinto, J.; Cassayre, L.; Presmanes, L.; Barnabé, A. Insights on the Stability and Cationic Nonstoichiometry of CuFeO2 Delafossite. Inorg. Chem. 2019, 58, 6431–6444. [Google Scholar] [CrossRef]
  47. Li, Y.; Lin, C.; Huang, J.; Chi, C.; Huang, B. Spectrally Selective Absorbers/Emitters for Solar Steam Generation and Radiative Cooling-Enabled Atmospheric Water Harvesting. Glob. Chall. 2021, 5, 2000058. [Google Scholar] [CrossRef]
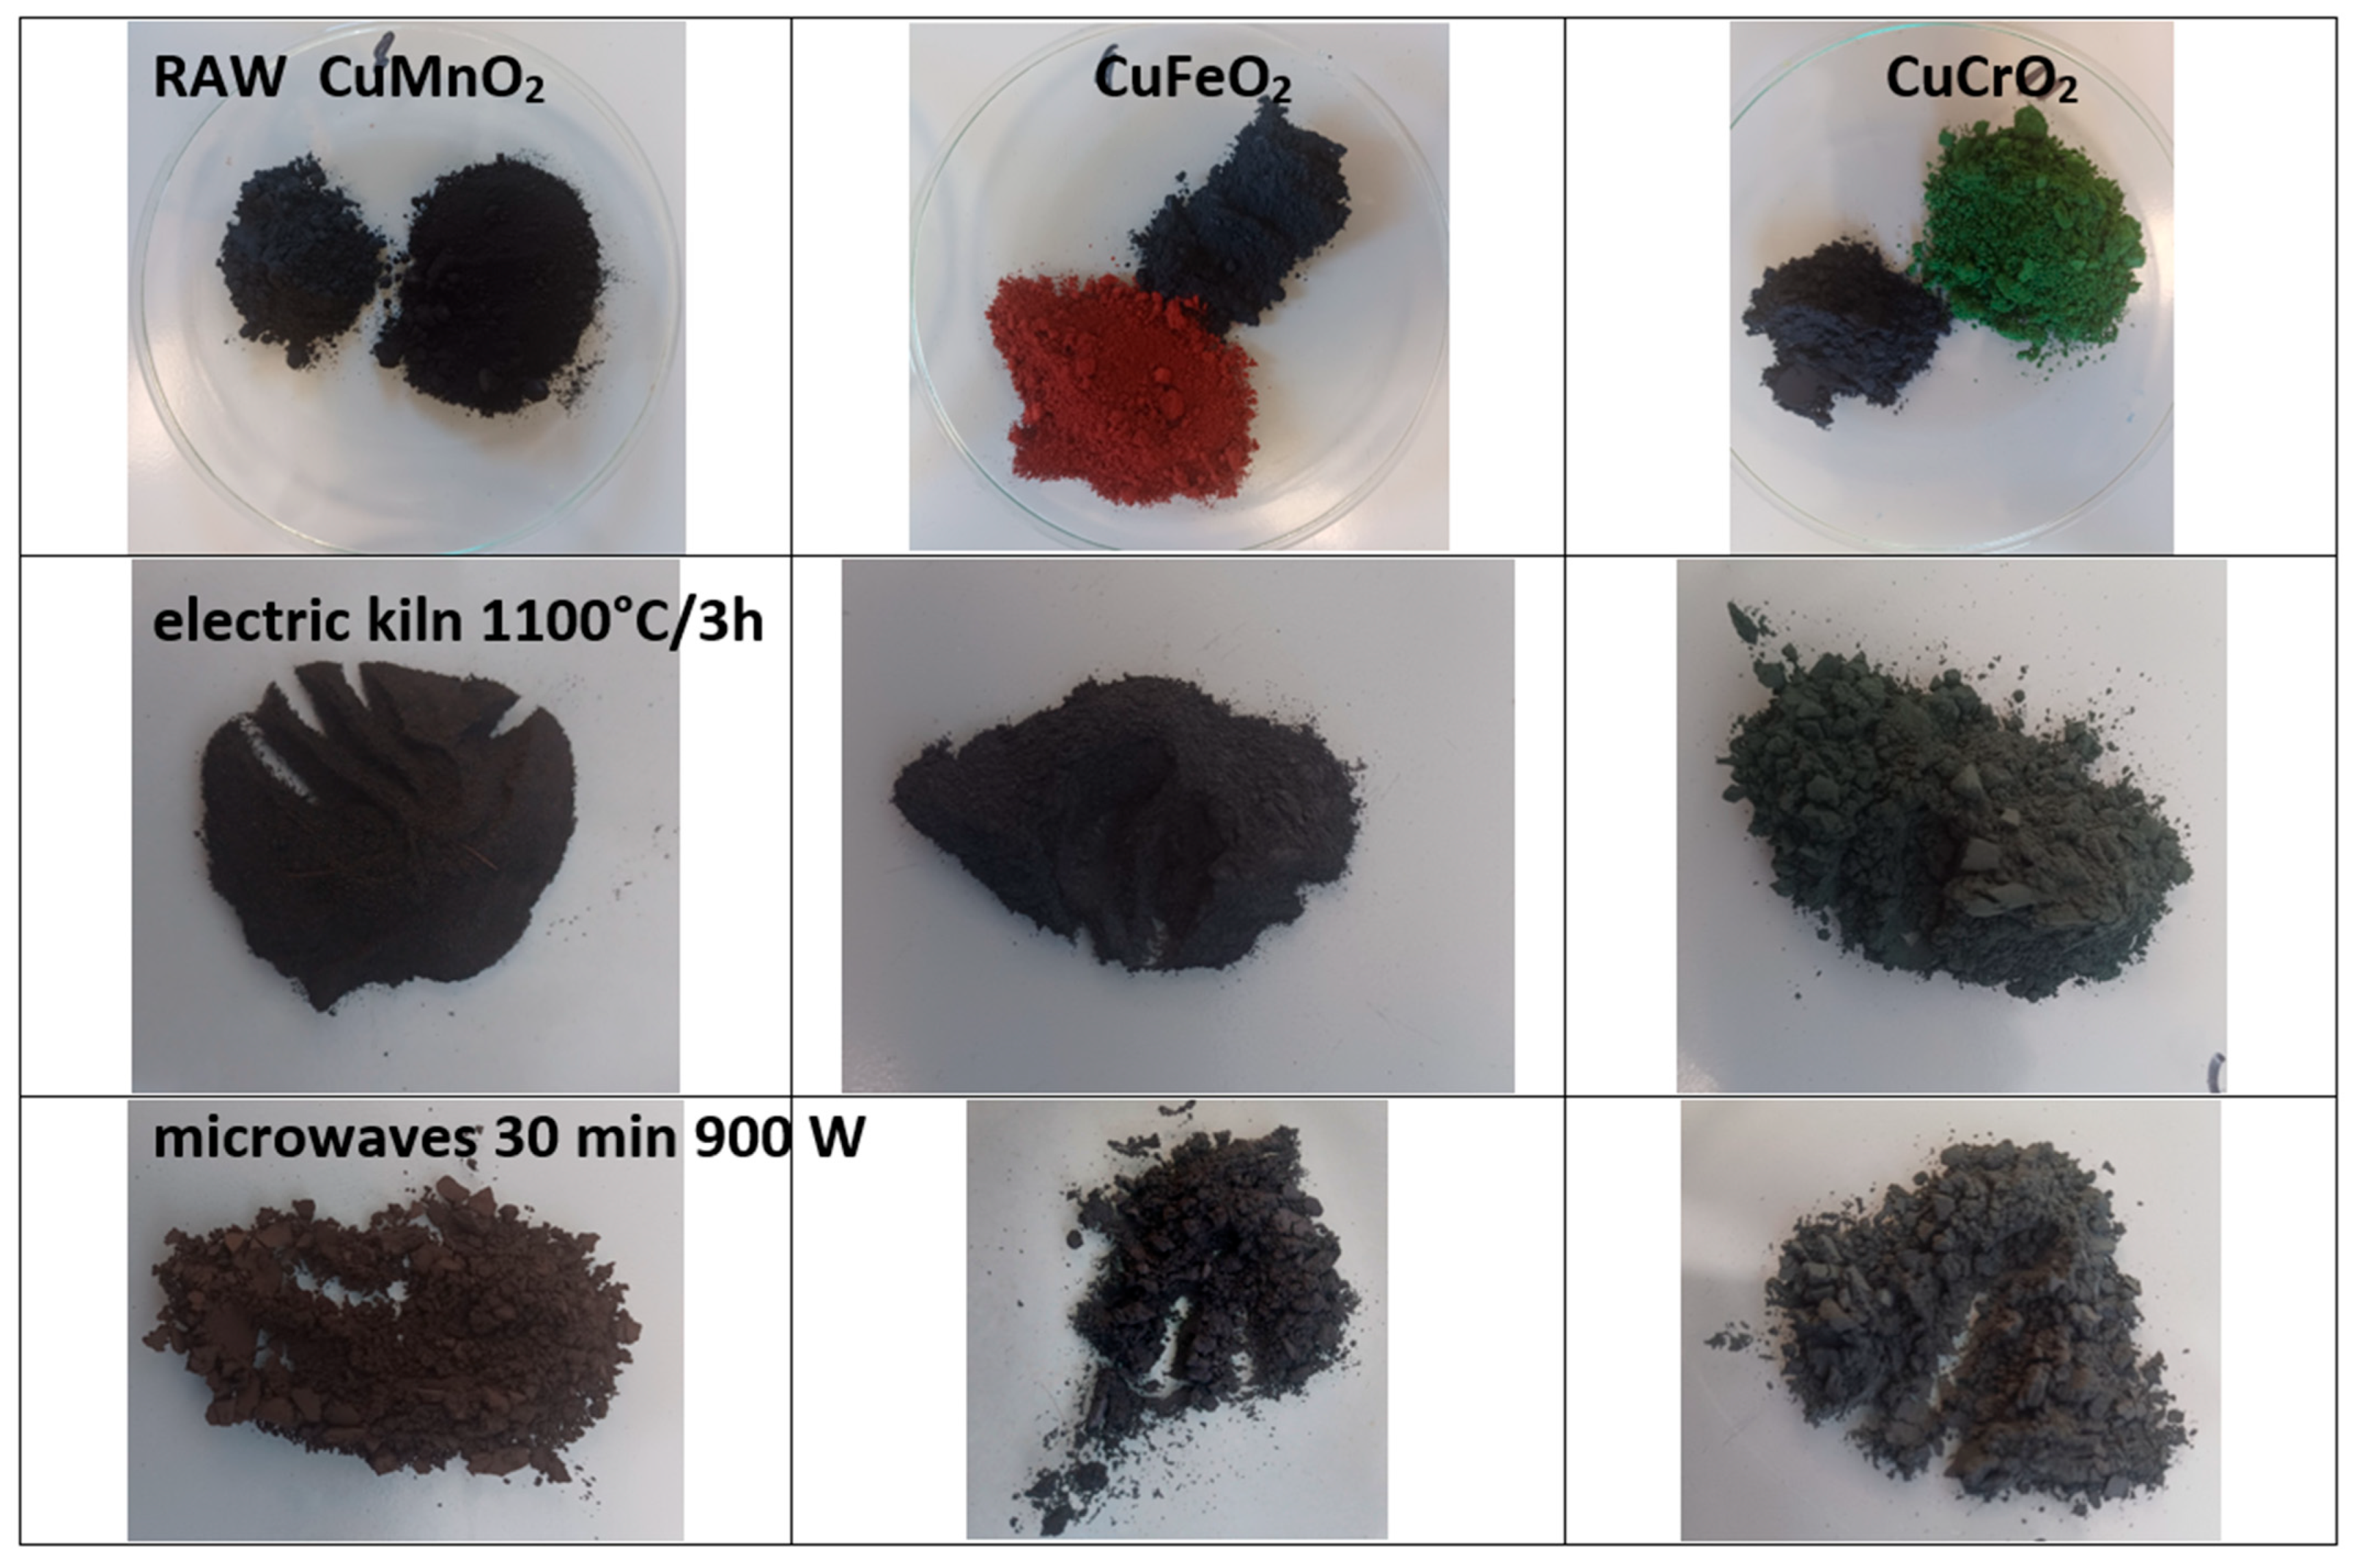
Figure 1. Powders before mixture and fired in electric kiln and with microwaves at 900 W for 30 min).
Materials 18 04910 g001
Figure 2. XRD of powders. Crystalline phases: S (CuMn2O4), C (CuMnO2 crednerite), D (CuFeO2 delafossite), M (CuCrO2 mcconnellite), U (CuO), B (Mn2O3), and T (CuCr2O4). (the abscissa of each diffractogram is °2θ (2 degrees theta) and the ordinate is “counts”).
Materials 18 04910 g002
Figure 3. UV–Vis–NIR reflectance spectra of powders.
Materials 18 04910 g003
Figure 4. Tauc’s plot and solar spectra of powders.
Materials 18 04910 g004
Figure 5. (a) Optical images of powders ×100; (b) Optical images of powders ×500; (c) SEM micrographs of powders (the segment below the value in microns is the corresponding length).
Materials 18 04910 g005
Figure 6. Images of 5 wt% glazed samples in ZnO-free frit of 1000 °C.
Materials 18 04910 g006
Figure 7. XRD low-incidence angle (2°) and conventional backscattering of 5 wt% glazed samples in frit fired with electric kiln. Crystalline phases: S (CuMn2O4), M (CuCrO2 McConnellite), U (CuO tenorite). (the abscissa of each diffractogram is °2θ (2 degrees theta) and the ordinate is “counts”).
Materials 18 04910 g007
Figure 8. UV–Vis–NIR reflectance spectra of samples glazed using electric kiln.
Materials 18 04910 g008
Figure 9. Tauc plots and solar spectra of glazed samples using electric kiln.
Materials 18 04910 g009
Figure 10. UV–Vis–NIR reflectance spectra of glazed samples using microwaves kiln.
Materials 18 04910 g010
Figure 11. Tauc plots and solar spectra of glazed samples using microwaves kiln.
Materials 18 04910 g011
Figure 12. Powders fired at 1200 °C for 3 h of CuCrO2, Fe-doped (Cu0.8Fe0.2)CrO2, and Fe- and Mn-doped (Cu0.6Mn0.2Fe0.2)CrO2.
Materials 18 04910 g012
Figure 13. XRD of powders CuCrO2, Fe-doped (Cu0.8Fe0.2)CrO2, and Fe- and Mn-doped (Cu0.6Mn0.2Fe0.2)CrO2. Crystalline phases: M (mcconnellite CuCrO2), F (spinel Cu(Cr,Fe)2O4), S (spinel Cu(Cr,Fe,Mn)2O4).
Materials 18 04910 g013
Figure 14. UV–Vis–NIR diffuse reflectance spectra of powders CuCrO2, Fe-doped (Cu0.8Fe0.2)CrO2 and Fe- and Mn-doped (Cu0.6Mn0.2Fe0.2)CrO2 and its respective solar spectra absorption.
Materials 18 04910 g014
Figure 15. Images of 5 wt% glazed samples in glaze for porcelain (1190 °C) and alkyd paint (weight ratio paint/pigment/water = 7:2:5) of CuCrO2, Fe-doped (Cu0.8Fe0.2)CrO2, and Fe- and Mn-doped (Cu0.6Mn0.2Fe0.2)CrO2 and its respective solar spectra absorption.
Materials 18 04910 g015
Figure 16. UV–Vis–NIR diffuse reflectance spectra of 5 wt% glazed samples in glaze for porcelain (1190 °C) CuCrO2, Fe-doped (Cu0.8Fe0.2)CrO2, and Fe- and Mn-doped (Cu0.6Mn0.2Fe0.2)CrO2 and its respective solar spectra absorption.
Materials 18 04910 g016
Table 1. Comparison of black ceramic pigments published in the recent literature.
PowderGlaze
ReferenceL*a*b*RVis/RNIR/R
(%)
L*a*b*
wt%(T°C)
RVis/RNIR/R
(%)
Vantablack[10]0.2/0.9/−10.035/-/-----
Carbon Black[11]20.2/0.1/0.13/3/3----
Ferrochromite
(Co,Ni)(Fe,Cr)2O4
[13,14]41.0/1.0/1.03.5/-/-33.0/1.0/0.05
5(1080)
4.5/-/-
CuCr2O4[16]40.5/0.1/−0.14.2/3.4/3.826.3/−0.3/−0.5
0.5(800)
3.8/4.5/4.1
CuCrO2[17]36.5/−4.8/−0.89.9/11.2/10.511.3/−0.6/−3.05
5(1000)
1.4/1.9/1.6
Mn,Ni-CuFe5O8[18]21.36/1.1/−0.24 16.95/−0.18/−0.12
Fe1.2Cr0.8O3[19]42.3/−0.3/0.64/23/1434.1/2.6/−3.75
5(1000)
4/17/10
YMnO3[19]27.7/−1.2/−3.53/39/1931.9/1.6/1.15
5(1000)
7/31/18
Sr4CuMn2O9 [19]43.9/7.2/6.37/51/2957.9/2.8/0.25
5(1000)
25/41/33
Sr2(Mg0.5Mn0.5)Ge2O7[19]31.8/−0.1/−8.35/32/1749.6/12.8/13.75
5(1000)
25/68/44
Table 2. Characterization of black samples: fired at 1100 °C for 3 h in an electric kiln (CE), fired at 900 W for 30 min in a microwaves kiln (MW). ΔE* is referred to as Carbon Black (L*a*b* = 20.2/0.1/0.1).
SAMPLEL*a*b*RVis/RNIR/R (%)Eg (eV)ΔE*
POWDER
1MnCE27.32/1.18/0.405.47/6.06/5.731.317.2
2FeCE31.14/−0.29/−2.476.87/7.10/6.981.4211.2
3CrCE28.66/−4.17/1.176.10/8.26/7.031.409.5
1MnMW25.23/3.25/5.184.85/6.36/5.511.317.8
2FeMW29.18/0.56/−1.706.45/13.40/9.521.479.2
3CrMW31.05/−2.39/−0.156.98/7.73/7.311.4011.1
GLAZED ELECTRIC KILN
5 wt% with glaze 1000
1MnCE32.49/−1.93/−6.737.23/13.11/9.881.2114.2
2FeCE25.53/0.60/−5.935.02/13.99/9.011.218.1
3CrCE24.70/−0.77/0.324.40/4.81/4.581.454.6
1MnMW26.80/−0.63/−4.905.10/12.51/8.411.318.3
2FeMW31.25/−0.12/−6.047.14/15.40/10.821.1612.6
3CrMW23.52/−0.02/−0.981.41/2.14/1.771.383.5
GLAZED MICROWAVES
5 wt% with glaze 1000
1MnCE31.10/−0.77/1.776.37/8.50/7.321.5011.1
2FeCE28.60/−2.63/1.255.70/8.79/7.061.418.9
3CrCE31.94/−4.67/3.885.95/9.42/7.501.8013.2
1MnMW24.64/0.02/0.404.27/5.93/5.011.514.5
2FeMW34.30/−5.94/2.316.99/10.66/8.641.4815.4
3CrMW24.25/−1.41/−0.232.63/6.63/5.421.494.3
Table 3. XRD results. Crystalline phases: S (CuMn2O4), C (CuMnO2 Crednerite), D (CuFeO2 Delafossite), M (CuCrO2 mcconnellite), U (CuO), B (Mn2O3), and E (eskolaite Cr2O3), T (CuCr2O4). Intensity: vs (very strong), s (strong), m (medium), W (weak), and vw (very weak).
SAMPLECrystalline Phases
11MnCES (vs) C (m) U, B (vw)
2FeCED (vs) U, B (vw)
3CrCEM (s) E, U (vw)
1MnMWS (s) C (w) U, B (vw)
2FeMWD (vs) U (s)
3CrMWM (s) T (vw)
Table 4. Cell parameters of identified crystalline phases.
SampleIdentified Crystalline PhasesReferences
CuMnO2-CECuMn2O4 cubic
(ICDD 74–2422)
a = 8.308(1) Å
CuMnO2 monoclinic (ICDD 50-0860)
β = 104.08°
a = 5.677(1) Å
b = 2.801(2) Å
c = 6.063(2) Å
V = 93.5(3) Å3
[34]
CuMnO2 monoclinic (C2/m ICDD 50-0860)
β = 104.03(3)°
a = 5.592(3) Å
b = 2.883(1) Å
c= 5.892(3) Å
V = 92.1(1) Å3
[35]
β = 104.02(3)°
a = 5.596(2) Å
b = 2.880(1) Å
c = 5.899(2) Å
[38]
CuMn2O4 cubic Fd3m ICDD 74-2422
a = 8.308 Å
CuMnO2-MWCuMn2O4 cubic
ICDD 74–2422)
a= 8.308(1) Å
--
CuFeO2-CECuFeO2
(ICDD-75-2146)
a = b = 3.093(1) Å
c = 17.109(1) Å
V = 136.0(3) Å3
--[39]
(ICDD-75-2146)
a = b = 3.04 Å
c = 17.15 Å
V = 136.8668 Å3
CuFeO2-MWCuFeO2
(ICDD-75-2146)
a = b = 3.002(1) Å
c = 17.392(1) Å
V = 135.8(3) Å3
--
CuCrO2-CECuCrO2
(ICDD 39-0247)
a = b = 2.968(5) Å
c = 17.002(3) Å
V= 129.7(4) Å3
--[40,41]
ICDD 39-0247
a = 2.9480(2) Å
c = 17.033(2) Å
V = 127.9731 Å3
CuCrO2-MWCuCrO2
(ICDD 39-0247)
a = b = 2.967(4) Å
c = 17.021(2) Å
V = 129.9(5) Å3
--
Table 5. Comparison of mcconnellite obtained with literature results (reference [17]).
SAMPLEL*a*b*RVis/RNIR/R (%)Eg (eV)ΔE*
POWDER
Electric kiln
3CrCE 1000 °C/3 h42.6/−5.4/0.1 13.8/14.1/13.91.2623.1
3CrCE 1100 °C/3 h28.66/−4.17/1.176.10/8.26/7.031.409.5
Microwave Kiln
3CrMW 800 W 30 min36.5/−4.8/−0.8 9.9/11.2/10.51.3017
3CrMW 900 W 30 min31.05/−2.39/−0.156.98/7.73/7.311.4011.1
GLAZED ELECTRIC KILN
5 wt% with glaze 1000
Electric kiln
3CrCE 1000 °C/3 h26.9/−0.1/−2.3 5.3/5.0/5.21.07.2
3CrCE 1100 °C/3 h24.70/−0.77/0.324.40/4.81/4.581.454.6
Microwave Kiln
3CrMW 800 W 30 min11.3/−0.6/−3.0 1.4/1.9/1.60.939.5
3CrMW 900 W 30 min23.52/−0.02/−0.981.41/2.14/1.771.383.5
Disclaimer/Publisher’s Note: The statements, opinions and data contained in all publications are solely those of the individual author(s) and contributor(s) and not of MDPI and/or the editor(s). MDPI and/or the editor(s) disclaim responsibility for any injury to people or property resulting from any ideas, methods, instructions or products referred to in the content.