Abstract
This paper presents an adapted methodology for the prediction of fracture loads in additively manufactured (fused filament fabrication) polymers that exhibit non-linear behavior. The approach is based on the Average Strain Energy Density (ASED) criterion, which is typically limited to materials which develop fully linear-elastic behavior. Thus, in those cases where the material has a certain (non-negligible) amount of non-linear behavior, the ASED criterion needs to be corrected. To extend its applicability, this work proposes a thorough calibration of the ASED characteristic parameters: the critical value of the strain energy and the volume of the corresponding control volume. This enables the extrapolation of the linear-elastic formulation to non-linear situations. The approach is validated using acrylonitrile-styrene-acrylate (ASA) and 10 wt.% carbon-fiber reinforced ASA specimens. Single-edge-notched bending (SENB) specimens with three different raster orientations (0/90, 45/−45, and 30/−60) and four U-notch radii (0.0 mm—crack-like, 0.50 mm, 1.0 mm, and 2.0 mm) were printed and tested. The results demonstrate that the proposed calibration of the ASED criterion allows for accurate predictions of failure loads, providing a reliable tool for the structural integrity assessment of 3D-printed components.
1. Introduction
Additive manufacturing (AM) is a versatile fabrication technology capable of producing intricate geometries from diverse materials, including polymers, metals, ceramics, and composites [1]. This research focuses on fused filament fabrication (FFF), a prominent AM technique. FFF involves the extrusion of a molten filament through a heated nozzle, which is then deposited layer-by-layer onto a build platform to construct the final component [2].
Historically, FFF has been primarily utilized for rapid prototyping rather than for the production of load-bearing structural components. This is primarily due to the generally lower mechanical properties of 3D-printed components compared to those achieved via conventional methods, like injection molding [3]. Consequently, with the aim of improving the mechanical behavior of FFF-printed materials so that they can be used for structural applications, significant research efforts over the past years have aimed to clarify the correlation between FFF process parameters and the resulting mechanical performance of a wide range of thermoplastic polymers [4,5,6,7,8,9,10,11,12].
The complex geometries inherent to 3D-printed parts often contain stress risers, which can arise from manufacturing defects like poor surface finish and porosity, operational damage, or intrinsic design features such as grooves, holes, and corners. The response of the material to the presence of such stress raisers is a key factor the structural integrity of structural components. Assessing the corresponding structural integrity requires specific analytical approaches beyond conventional fracture mechanics (which addresses crack-like defects). It has been widely demonstrated (e.g., [13,14]) that non-sharp stress risers, generally referred to as notches, induce an apparent fracture toughness in the material that typically exceeds the intrinsic fracture toughness measured using cracked specimens. To effectively account for this notch effect, various methodologies have been developed, notably the Theory of Critical Distances [15] or the Average Strain Energy Density (ASED) criterion [14], on which this work is focused.
The ASED criterion has been extensively validated across a range of brittle and quasi-brittle materials under various loading conditions (e.g., [14,16,17,18,19]), including fatigue assessments [20,21,22,23,24]. This methodology has also been applied to analyze the fracture behavior of 3D-printed polymers [25,26,27,28,29,30]. However, to the best knowledge of the authors, it has not yet been applied specifically to 3D-printed acrylonitrile-styrene-acrylate, nor its carbon-fiber reinforced variant, both having moderate non-linear fracture behavior.
This study employs a relatively simple calibration technique to predict fracture loads using the ASED criterion, eliminating the need for complex, additional analyses. While this calibration approach has been successfully applied to conventional structural steel fracture mechanics specimens [19] and 3D-printed polymeric plates [27,31], this work analyzes its capacity to estimate fracture loads of single-edge-notched bend (SENB) specimens made of FFF-printed ASA and carbon-fiber reinforced ASA, extending the validation of the resulting analysis procedure. A total of 72 fracture specimens for each material were fabricated, with varying raster orientations and notch radii. Following experimental testing, the critical loads were measured and the ASED criterion was applied to estimate these values. This analysis was performed using both the standard linear-elastic ASED formulation and a specific calibration process that accounts for non-linear phenomena. The experimental and the theoretical values were then compared to evaluate the accuracy of the proposed methods.
The main objective, thus, has been to demonstrate that the calibrated ASED approach provides accurate predictions of fracture loads in 3D-printed polymers and 3D-printed polymer matrix composites with significant non-linear behavior, contributing to the future use of these types of materials in structural parts.
The paper is structured as follows: Section 2 details the materials, fabrication process, and experimental and numerical procedures; Section 3 presents the ASED predictions and their comparison with experimental data; and Section 4 summarizes the main findings and discusses the applicability of the ASED criterion for FFF-printed polymers.
2. Materials and Methods
Acrylonitrile-styrene-acrylate (ASA) is a high-performance thermoplastic widely used in FFF 3D printing, prized for its excellent mechanical properties and resistance to UV radiation and weathering [32,33,34,35]. It exhibits robust mechanical properties [36,37,38], including high impact strength [39], wear resistance [40], and durability [41]. Carbon-fiber reinforced ASA is an emerging material that significantly enhances the mechanical properties of the base polymer, such as tensile strength and stiffness [42,43,44]. The resistance of ASA to environmental degradation makes it particularly well-suited for outdoor components, in addition to its use in prototyping [44,45,46,47]. Thus, ASA is a very good alternative to the widely used acrylonitrile-butadiene-styrene (ABS). Although their compositions and mechanical properties are similar, ASA is more durable in harsh environments [35,48]. Additionally, since ASA is generally reported to have moderate mechanical properties, this research also includes carbon-fiber reinforced ASA (10 wt.%, ASA-CF10), with the aim of exploring how the introduction of carbon fibers affects the corresponding mechanical performance.
Specimens of ASA and ASA-CF10 were fabricated via FFF in a CreatBot F430 printer (Henan Suwei Electronic Technology Co., Ltd., Zhengzhou, China). The following parameters were used: layer height of 0.2 mm, line width of 0.42 mm, 100% infill density, printing temperature of 250 °C, bed temperature of 90 °C, and a printing speed of 40 mm/s. These parameters were selected based on the manufacturer’s recommendations.
A detailed description of the experimental program of ASA [49] and ASA-CF10 [50] was recently published by the authors. To sum up, a total of 162 tests were carried out, consisting of 9 tensile tests and 72 fracture (SENB) tests for each material. All specimens were fabricated using additive manufacturing in a flat print orientation. The fracture specimens incorporated four distinct notch radii, indicated as ρ in Figure 1: 0.0 mm (simulating crack-like defects, made by sawing with a razor blade), 0.5 mm, 1.0 mm, and 2.0 mm. Additionally, three different raster orientations (ROs) (0/90, 45/−45, and 30/−60) were investigated for the fracture specimens. Figure 1 provides a schematic of the specimen geometry and the distinct raster orientations employed.
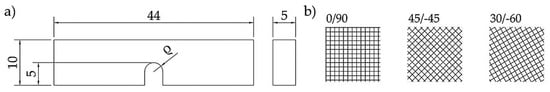
Figure 1.
(a) Schematic of fracture SENB specimens. Nominal dimensions (in mm), with ρ being 0.0 mm, 0.5 mm, 1.0 mm, and 2.0 mm; and (b) raster orientations.
In these studies, tensile tests followed ASTM D638 [51], while fracture tests on both cracked and notched specimens observed ASTM D6068 [52]. The key mechanical properties derived from these tests are presented in Table 1 [49,50]. As shown in Figure 2, the stress-strain curves reveal that the ASA-CF10 material behaves much closer to a linear-elastic material compared to pure ASA.

Table 1.
Mechanical properties for FFF-printed ASA and ASA-CF10. E: Young’s modulus; σy: yield stress; σu: ultimate tensile strength; εu: strain under maximum load; Kmat: fracture toughness.
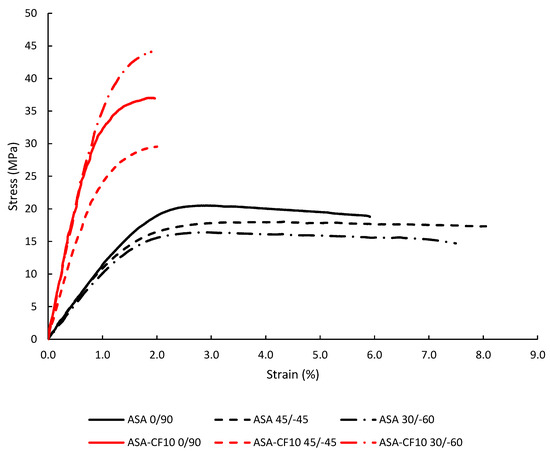
Figure 2.
Tensile curves obtained for ASA and ASA-CF10.
After determining the fundamental mechanical properties from the tensile and fracture tests, the failure loads on the U-notched specimens were predicted by applying the ASED criterion. The initial approach utilized the original formulation, which assumes a linear-elastic material behavior. This step established a baseline for the fracture load predictions and provided a direct point of comparison to the subsequent analysis, which incorporates the non-linear behavior of the material.
The ASED criterion, based on the “core region” concept introduced by Sih [53] and subsequently refined by Lazzarin and Zambardi [54,55], has found extensive application in the prediction of material fracture processes. The ASED approach posits that brittle fracture under tensile stress initiates when the mean elastic strain energy density (W) within a defined control area attains a critical value (WC). For an ideally brittle material, the critical strain energy density can be determined as described in [54]:
The ultimate tensile strength (σu) and Young’s modulus (E) are critical parameters in material characterization. WC results, using average values of σu, are gatherer in Table 2. The ASED method involves calculating the total area beneath the non-linear tensile stress–strain curve, rather than relying on a simplified linear approximation of Equation (1). This modified ASED approach will be adopted in the present study to account for the observed non-linear material behavior.
Table 2.
Critical linear-elastic strain energy density values (WC).
The ASED criterion necessitates the calculation of the strain energy density averaged over a defined control volume circumscribing the notch tip. For two-dimensional (plane) analyses, this control volume is represented as a circle or a circular sector with a characteristic radius, RC. In instances where the notch opening angle (2α) is zero, characteristic of U-notches, RC can be quantitatively determined using the fracture toughness (Kmat) of the material, ultimate tensile strength, and Poisson’s ratio (ν) [56].
As supported by the findings of [15], when the fracture toughness reaches the limit imposed by Equation (4), plane strain conditions dominate. Meanwhile, when fracture toughness exceeds the limit defined by Equation (5), the plane stress conditions are reached.
where B represents the specimen thickness and σy denotes the yield strength. For blunt notches, the total strain energy is quantifiable within the crescent-shaped volume (Figure 3). Subsequently, the ASED can be formulated as a function of the maximum elastic notch stress (σmax) [57]. The total strain energy over a given area (Ω) is quantified by the ASED. It can be determined using Equation (6), as described in [14]:
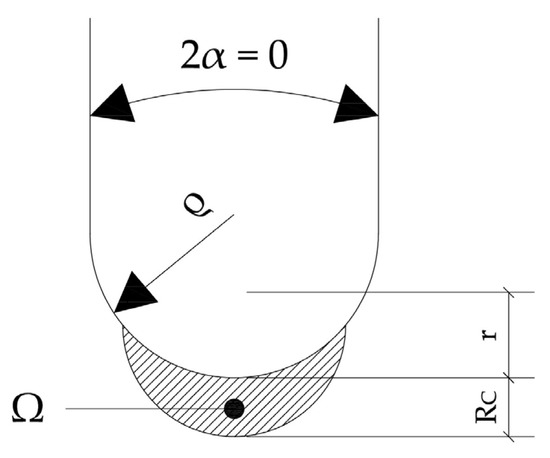
Figure 3.
Control area for U-notch under Mode I loading.
The parameter F(2α) is contingent upon the notch opening angle, with a value of 0.785 for U-notches (2α = 0). H depends on both the notch geometry (opening angle, 2α, and notch radius, ρ) and the material properties (critical radius, RC). σmax represents the maximum elastic stress at the notch tip. Table 3 provides a compilation of H function values for U-shaped notches [58] for a material with a Poisson’s ratio of 0.30 [49,50].
Table 3.
Values of the function H for U-shaped notches in a material with υ = 0.30 [58].
The fracture behavior, particularly the critical load, will be investigated using the ASED criterion, whose critical condition is established as follows:
The corresponding critical value, WC, is derived from the entire area under the material tensile curve, rather than from Equation (1). By combining Equations (6) and (7), the following relationship is established:
The derivation of the H-function necessitates the precise definition of the material critical radius. This parameter is determined by comparing and selecting between two distinct methodologies, represented by Equations (2) and (3). For the materials and specimens examined in this study, plane stress conditions are achieved. Therefore, Equation (3) is the appropriate relation for calculating RC.
During the analysis, the ratio of the critical radius to the notch radius (RC/ρ) exceeded unity. This necessitated the extrapolation of H values [16], tabulated in Table 3, utilizing the fitting function presented in Figure 4. This extrapolation was critical to ensure the accuracy and completeness of the analytical results.
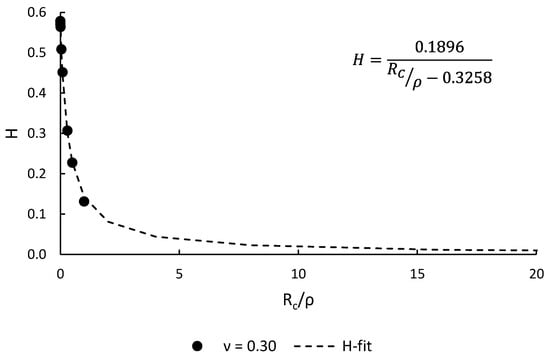
Figure 4.
Fitting equation used to derive H values for RC/ρ > 1.0 (data from [58]).
However, as demonstrated by previous studies [9,59], the materials under investigation exhibit noticeable non-linear tensile behavior across three distinct raster orientations. This observed non-linearity indicates that the assumption of a purely linear-elastic response, upon which the ASED criterion is typically founded, is not appropriate for an accurate characterization of this material. Despite this non-linearity, if its extent is limited, alternative approaches for applying the ASED criterion have been proposed [17], and validated for AM polymers [25,26,27,28,31].
The determination of the external load corresponding to the maximum stress at a notch tip can be achieved through numerical or analytical methods. Finite element simulations offer a robust numerical approach for this derivation. The stress field within the mid-plane of the fracture section (at the notch tip) was analyzed for all specimen geometries using a FE model developed in Ansys (2023 R1) [27]. A quarter-model approach, exploiting the symmetry inherent in fracture tests, was employed (Figure 5), assuming linear-elastic material behavior (material properties from Table 1). A refined mesh was implemented in the vicinity of the notch tip due to the high sensitivity of stress concentration to mesh size in this region. For every nominal notch radius, the mesh sizes were 61,435 nodes and 13,620 elements for ρ = 0.5 mm; 59,124 nodes and 13,090 elements for ρ = 1.0 mm; and 70,316 nodes and 15,670 elements for ρ = 2.0 mm.
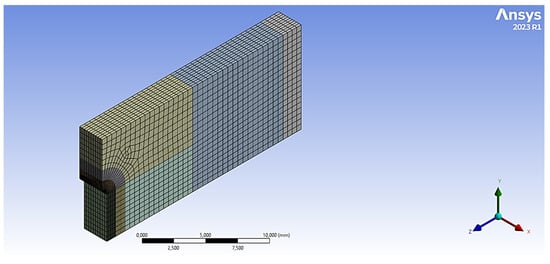
Figure 5.
FE model of the SENB specimen (ρ = 0.5 mm).
The maximum principal stress at the notch tip (σmax-FE) was calculated for an arbitrary external load (PFE = 10 N), as shown in Figure 6. Subsequently, the critical load was determined through proportionality, as defined by Equation (9). Taking into account the potential for the stress field to be highly sensitive to specimen geometry, particularly the notch radius, and acknowledging that actual geometrical parameters may deviate from nominal values, a unique simulation was conducted for each specimen type in pursuit of analysis efficiency. The σmax-ASED was calculated using Equation (8).
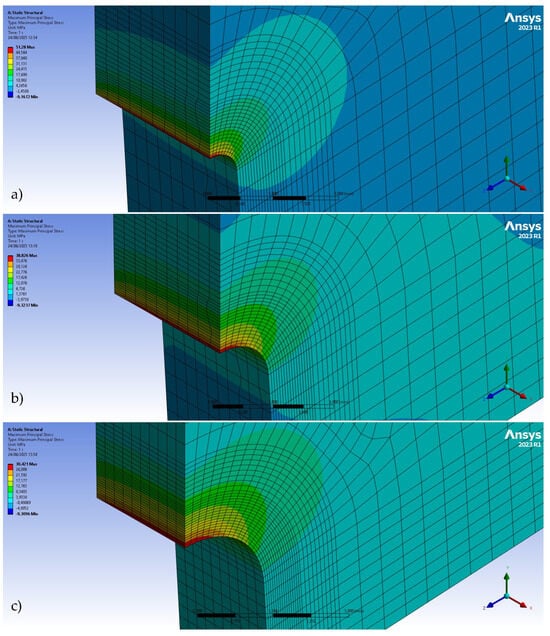
Figure 6.
FE model for U-notched specimens: (a) ρ = 0.5 mm; (b) ρ = 1.0 mm; and (c) ρ = 2.0 mm. Applied load PFE = 10 N.
The experimental fracture loads (Pmax) and predictions by ASED criterion (PASED) are gathered in Table A1 and Table A2 (Appendix A). As discussed in Section 3, the fracture load predictions for both ASA and ASA-CF10 are largely non-conservative, with few results becoming conservative.
When the material under investigation exhibits non-linear behavior, the standard ASED criterion, which assumes linear-elasticity, cannot be directly applied. To address this, the criterion requires a calibration of its characteristic parameters: the critical strain energy density (WC*) and the control radius (RC*) [19,27,31,60]. This process effectively creates an “equivalent” linear-elastic material, allowing the standard ASED formulation to be used. The calibration in this study is based on the fracture loads of conventional SENB specimens with varying U-notch radii. The fracture loads from two distinct conditions (crack-like and 2.0 mm notched specimens) were used to establish the following relationships, based on the corresponding maximum stresses (σmax1 and σmax2) at the notch tip:
By substituting different values of RC* into Equations (10) and (11), two distinct curves of WC* versus RC* are generated, as shown in Figure 7a and Figure 7b, for ASA 0/90 and ASA-CF10 0/90, respectively. The intersection point of these two curves provides the calibrated material parameters, WC* and RC*, which account for the non-linear behavior of the materials. The calibrated parameters are collected in Table 4.
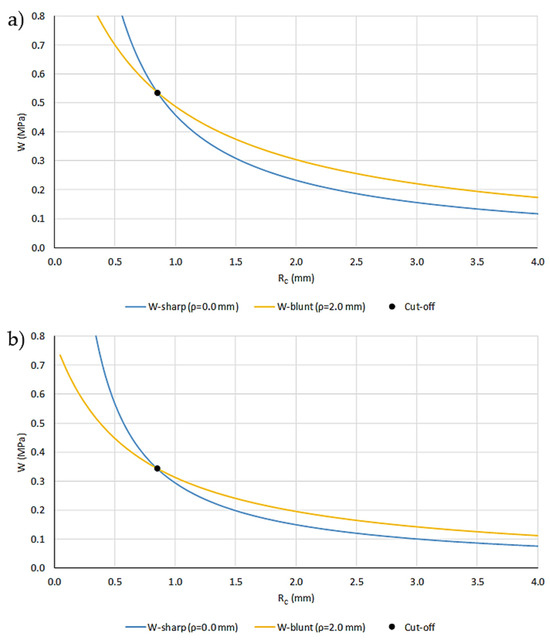
Figure 7.
Example of calibration of WC* and RC* parameters with SENB U-notched specimens: (a) ASA 0/90; and (b) ASA-CF10 0/90.
Table 4.
Calibrated ASED parameters: WC* and RC*.
Once the calibrated parameters have been successfully defined, the prediction of fracture loads (PASED*) for any other notch radius becomes straightforward. This is achieved by utilizing the standard linear-elastic ASED procedure in conjunction with the calibrated parameters. Based on the ASED failure criterion, the maximum (critical) stress at the notch tip (σmax-ASED*) can be directly determined from Equations (1), (6), (7) and (8), using WC* and RC* instead of standard linear-elastic parameters (WC and RC, in Table 2) calculated by the usual procedure. Finally, the critical load (PASED*) was determined through proportionality, as defined by Equation (12).
3. Results and Discussion
To establish a baseline for evaluating the suggested calibration technique, fracture load estimations (PASED) were first derived by directly employing the standard linear-elastic ASED criterion. A comparison between these initial predictions and the actual experimental fracture loads (Pmax) is presented in Figure 8 and Figure 9 (with the corresponding data being gathered in Table A1 and Table A2). The results show that the fracture load estimations for the pure ASA material are significantly higher than the experimental values. Specifically, a mean ratio of PASED/Pmax of 1.24 highlights the poor predictive accuracy of the traditional approach. This considerable discrepancy is attributed to the inherent mismatch between the linear-elastic assumption of the standard ASED criterion and the clear non-linear (plastic) behavior exhibited by the ASA in both tensile and fracture tests.
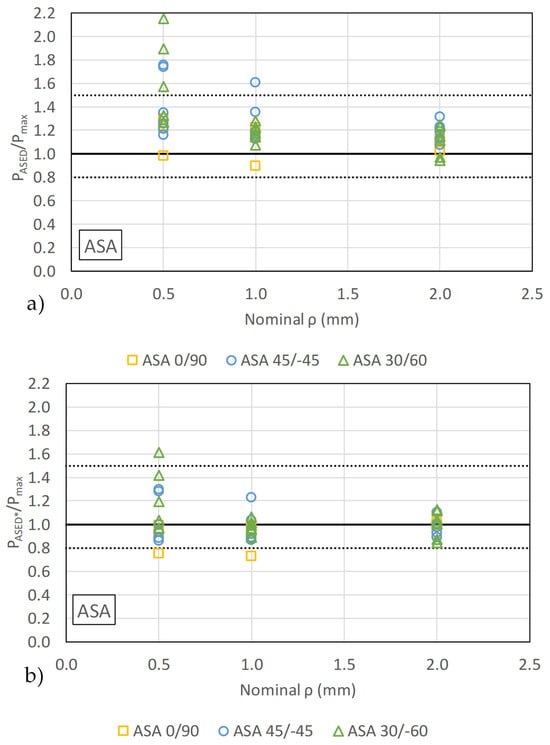
Figure 8.
Comparison between experimental results and predictions for ASA by (a) standard linear-elastic ASED criterion (PASED) and (b) calibrated ASED criterion (PASED*).
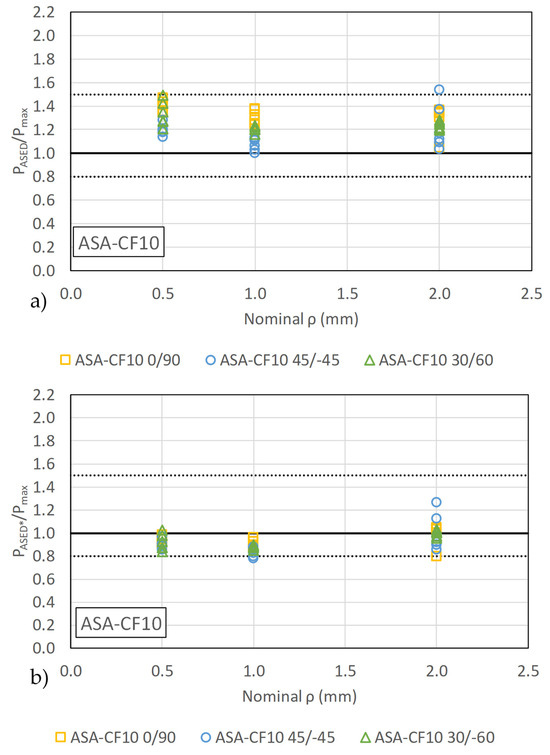
Figure 9.
Comparison between experimental results and predictions for ASA-CF10 by (a) standard linear-elastic ASED criterion (PASED) and (b) calibrated ASED criterion (PASED*).
The mean ratio PASED/Pmax for ASA-CF10 is 1.25 fall, but with lower scatter than ASA results, with less than a +50% margin compared to the experimental loads. This higher predictive accuracy is consistent with the mechanical response of the material, as the tensile test results shown in Figure 2 indicate a more limited degree of non-linearity compared to the pristine ASA.
The fracture predictions by standard ASED criterion (shown in Figure 8a for ASA, and in Figure 9a for ASA-CF10) are non-conservatives in general, with few results becoming conservative. PASED/Pmax ratios exhibit comparable values for different notch radii, except for ASA 45/−45 and 30/−60 with a notch radius of 0.5 mm, in which the precision is lower.
As described above, the linear-elastic ASED criterion provides limited accuracy when applied to the pristine ASA due to its significant non-linear behavior. To address this, we employed the calibrated ASED criterion technique detailed earlier (the resulting WC* and Rc* are presented in Table 4). The data clearly show that the calibrated critical mean strain energy density substantially deviates from the linear-elastic critical value proposed in the original ASED procedure. This deviation is particularly pronounced for the ASA material (WC is multiplied by a factor of 3), quantitatively underscoring the necessity of this calibration to account for its inherent plasticity.
The application of the calibrated ASED criterion resulted in a significant improvement in predictive accuracy, particularly for materials exhibiting non-linear behavior. As illustrated in Figure 8b and Figure 9b (data summarized in Table A1 and Table A2), the predictions for the notched ASA and ASE-CF10 specimens became more accurate. Overall, the mean PASED*/Pmax ratios are now 1.00 and 0.93 for ASA and ASA-CF10, respectively, demonstrating that the calibrated ASED criterion provides better estimations of the fracture loads. It also significantly reduces the overestimation of predicted loads.
4. Conclusions
This research successfully applied the Average Strain Energy Density criterion to estimate fracture loads in FFF-printed ASA and carbon-fiber reinforced ASA (ASA-CF10) U-notched SENB specimens. Specimens were fabricated using three raster orientations (0/90, 45/−45, and 30/−60) and combining different notch radii (0.0 mm—crack-like defects, 0.50 mm, 1.0 mm, and 2.0 mm).
The conventional linear-elastic ASED criterion proved non-conservative for both materials. The predictions of fracture loads (PASED) were considerably higher than the experimental results (Pmax), evidenced by PASED/Pmax ratios consistently above unit. The overestimation of critical loads can lead to unsafe structural analyses. The predictions for the ASA-CF10 specimens were better than those for the ASA, with a scatter of +50%. This outcome is attributed to the limited non-linearity of the composite material, which better adheres to the linear-elastic assumption.
To account for the non-linearity in ASA and ASA-CF10 materials, a calibration of the ASED parameters (WC* and RC*) was performed using experimental fracture loads from U-notched SENB specimens with ρ = 0.0 mm and ρ = 2.0 mm. This calibration noticeably improved the estimations for both ASA and ASA-CF10. The resulting average PASED*/Pmax ratios were 1.00 for ASA and 0.93 for ASA-CF10, demonstrating a high overall accuracy. Furthermore, the calibrated ASED criterion generally provides conservative predictions (i.e., PASED* < Pmax), providing a safe condition for structural assessment.
The results confirm that the ASED criterion is a powerful methodology for providing accurate predictions of critical loads for notched components made of FFF-printed ASA and ASA-CF10. Crucially, achieving high accuracy and safe conservatism for materials with non-fully linear behavior requires a prior calibration process to correctly account for the non-linear material response.
This research validates the use of the calibrated ASED approach to estimate the critical loads of ASA and ASA-CF10 components containing notches. The analysis should be extended to different matrices and reinforcements in order to achieve a more complete and reliable validation of the estimates provided by the calibrated ASED criterion in 3D-printed polymeric materials with non-linear behavior.
Author Contributions
Conceptualization, S.A., S.C. and J.A.Á.; methodology, S.C.; validation, S.A., S.C. and J.A.Á.; formal analysis, S.A., S.C. and J.A.Á.; investigation, S.A., S.C. and J.A.Á.; resources, S.C.; data curation, S.A.; writing—original draft preparation, S.A.; writing—review and editing, S.A., S.C. and J.A.Á.; supervision, S.C.; funding acquisition, S.C. All authors have read and agreed to the published version of the manuscript.
Funding
This publication is part of the project “Comportamiento en fractura y efecto entalla en compuestos de matriz termoplástica obtenidos por fabricación aditiva, PID2021-122324NB-I00” funded by MCIN/AEI/10.13039/501100011033/FEDER “Una manera de hacer Europa”.
Institutional Review Board Statement
Not applicable.
Informed Consent Statement
Not applicable.
Data Availability Statement
The original contributions presented in this study are included in the article. Further inquiries can be directed to the corresponding author.
Conflicts of Interest
The authors declare no conflicts of interest.
Abbreviations
The following abbreviations are used in this manuscript:
| ABS | Acrylonitrile-butadiene-styrene |
| AM | Additive manufacturing |
| ASA | Acrylonitrile-styrene-acrylate |
| ASA-CF10 | Carbon-fiber reinforced ASA (10 wt.%) |
| ASED | Average Strain Energy Density criterion |
| ASTM | American Society for Testing and Materials |
| FE | Finite element |
| FFF | Fused Filament Fabrication |
| RO | Raster orientation |
| SENB | Single-edge-notched bending |
| TCD | Theory of Critical Distances |
Appendix A
This appendix compiles the experimental fracture loads (Pmax), the fracture load predictions obtained using the standard linear-elastic ASED criterion (PASED), and those obtained using the calibrated ASED criterion (PASED*) for ASA (Table A1) and ASA-CF10 (Table A2).
Table A1.
Experimental and predicted critical loads for ASA SENB specimens.
Table A1.
Experimental and predicted critical loads for ASA SENB specimens.
| RO | Test nº | ρ (mm) | W (mm) | B (mm) | a0 (mm) | Pmax (N) | PASED (N) | PASED/Pmax | PASED* (N) | PASED*/Pmax |
|---|---|---|---|---|---|---|---|---|---|---|
| 0/90 | 1 | 0.00 | 9.86 | 5.18 | 4.75 | 101.6 | - | - | - | - |
| 2 | 0.00 | 9.72 | 5.16 | 4.80 | 67.4 | - | - | - | - | |
| 3 | 0.00 | 9.55 | 5.00 | 4.78 | 78.0 | - | - | - | - | |
| 4 | 0.00 | 9.64 | 5.01 | 4.90 | 52.5 | - | - | - | - | |
| 5 | 0.00 | 9.75 | 5.13 | 4.80 | 66.2 | - | - | - | - | |
| 6 | 0.00 | 9.74 | 4.99 | 4.18 | 69.8 | - | - | - | - | |
| 1 | 0.51 | 9.67 | 5.09 | 5.17 | 71.9 | 88.43 | 1.231 | 67.73 | 0.943 | |
| 2 | 0.52 | 9.57 | 5.07 | 5.16 | 70.7 | 87.60 | 1.239 | 67.19 | 0.950 | |
| 3 | 0.50 | 9.40 | 5.05 | 5.15 | 72.8 | 89.28 | 1.227 | 68.30 | 0.938 | |
| 4 | 0.49 | 9.73 | 5.10 | 4.99 | 91.7 | 90.16 | 0.983 | 68.88 | 0.751 | |
| 5 | 0.50 | 9.64 | 5.00 | 4.90 | 68.7 | 89.28 | 1.300 | 68.30 | 0.994 | |
| 6 | 0.59 | 9.51 | 5.25 | 4.14 | 67.4 | 82.42 | 1.222 | 63.78 | 0.946 | |
| 1 | 1.03 | 9.74 | 4.99 | 5.13 | 68.5 | 83.51 | 1.220 | 68.00 | 0.993 | |
| 2 | 1.00 | 9.71 | 5.01 | 5.06 | 72.1 | 84.68 | 1.175 | 68.72 | 0.953 | |
| 3 | 1.01 | 9.83 | 4.95 | 5.06 | 74.2 | 84.29 | 1.136 | 68.48 | 0.923 | |
| 4 | 1.02 | 9.75 | 5.04 | 5.19 | 93.4 | 83.90 | 0.898 | 68.23 | 0.731 | |
| 5 | 1.01 | 9.70 | 5.02 | 5.11 | 73.4 | 84.29 | 1.149 | 68.48 | 0.934 | |
| 6 | 1.01 | 9.60 | 5.02 | 5.18 | - | - | - | - | - | |
| 1 | 2.10 | 9.70 | 5.03 | 4.37 | 69.3 | 77.04 | 1.111 | 69.14 | 0.998 | |
| 2 | 2.11 | 9.63 | 5.05 | 4.37 | 69.0 | 76.88 | 1.114 | 69.05 | 1.000 | |
| 3 | 2.12 | 9.67 | 5.10 | 4.36 | 69.9 | 76.72 | 1.098 | 68.96 | 0.987 | |
| 4 | 2.10 | 9.72 | 5.06 | 4.30 | 69.3 | 77.04 | 1.111 | 69.14 | 0.998 | |
| 5 | 2.13 | 9.60 | 5.01 | 4.34 | 75.1 | 76.56 | 1.020 | 68.87 | 0.917 | |
| 6 | 2.10 | 9.69 | 5.12 | 4.35 | 67.9 | 77.04 | 1.135 | 69.14 | 1.019 | |
| 45/−45 | 1 | 0.00 | 9.74 | 5.00 | 4.94 | 68.5 | - | - | - | - |
| 2 | 0.00 | 9.80 | 5.06 | 4.40 | 88.9 | - | - | - | - | |
| 3 | 0.00 | 9.84 | 5.14 | 5.07 | 87.8 | - | - | - | - | |
| 4 | 0.00 | 9.52 | 5.05 | 4.97 | 82.5 | - | - | - | - | |
| 5 | 0.00 | 9.58 | 5.10 | 5.02 | 82.0 | - | - | - | - | |
| 6 | 0.00 | 9.68 | 5.16 | 5.25 | 89.1 | - | - | - | - | |
| 1 | 0.60 | 9.14 | 5.39 | 4.77 | 54.3 | 95.38 | 1.755 | 70.51 | 1.297 | |
| 2 | 0.50 | 9.59 | 5.12 | 4.90 | 86.1 | 104.26 | 1.210 | 76.42 | 0.887 | |
| 3 | 0.70 | 9.67 | 5.01 | 4.77 | 76.4 | 88.48 | 1.158 | 65.96 | 0.863 | |
| 4 | 0.67 | 9.68 | 5.05 | 5.06 | 71.8 | 90.39 | 1.259 | 67.21 | 0.936 | |
| 5 | 0.60 | 9.36 | 5.20 | 5.10 | 70.5 | 95.38 | 1.351 | 70.51 | 0.999 | |
| 6 | 0.56 | 9.70 | 5.16 | 5.19 | 56.7 | 98.64 | 1.738 | 72.67 | 1.281 | |
| 1 | 1.13 | 9.57 | 5.04 | 4.58 | 78.0 | 92.80 | 1.189 | 71.55 | 0.917 | |
| 2 | 1.02 | 9.45 | 5.24 | 4.80 | 72.0 | 97.46 | 1.352 | 74.52 | 1.034 | |
| 3 | 1.10 | 9.52 | 5.23 | 4.71 | 82.9 | 94.00 | 1.133 | 72.31 | 0.872 | |
| 4 | 1.05 | 9.26 | 5.10 | 4.99 | 59.8 | 96.12 | 1.607 | 73.66 | 1.231 | |
| 5 | 1.10 | 9.64 | 5.14 | 5.08 | 83.6 | 94.00 | 1.124 | 72.31 | 0.865 | |
| 6 | 1.12 | 9.55 | 5.06 | 4.54 | 80.6 | 93.20 | 1.155 | 71.80 | 0.890 | |
| 1 | 2.14 | 9.71 | 5.02 | 5.28 | 81.5 | 87.83 | 1.076 | 72.43 | 0.888 | |
| 2 | 2.05 | 9.56 | 5.10 | 5.20 | 75.3 | 89.57 | 1.189 | 73.47 | 0.975 | |
| 3 | 2.02 | 9.54 | 5.12 | 5.40 | 73.3 | 90.18 | 1.229 | 73.84 | 1.006 | |
| 4 | 2.40 | 9.51 | 5.13 | 5.50 | 63.3 | 83.35 | 1.315 | 69.80 | 1.101 | |
| 5 | 2.20 | 9.50 | 5.12 | 4.52 | 77.0 | 86.72 | 1.126 | 71.78 | 0.932 | |
| 6 | 2.07 | 9.57 | 5.06 | 5.21 | 73.3 | 89.18 | 1.216 | 73.23 | 0.999 | |
| 30/−60 | 1 | 0.00 | 9.76 | 5.14 | 4.66 | 79.8 | - | - | - | - |
| 2 | 0.00 | 9.67 | 5.18 | 4.99 | 97.5 | - | - | - | - | |
| 3 | 0.00 | 9.73 | 5.13 | 5.02 | 66.6 | - | - | - | - | |
| 4 | 0.00 | 9.64 | 5.21 | 5.16 | 85.5 | - | - | - | - | |
| 5 | 0.00 | 9.67 | 5.11 | 4.86 | 71.9 | - | - | - | - | |
| 6 | 0.00 | 9.85 | 5.14 | 5.17 | 87.8 | - | - | - | - | |
| 1 | 0.40 | 9.64 | 5.13 | 4.58 | 86.0 | 109.02 | 1.267 | 83.65 | 0.972 | |
| 2 | 0.21 | 9.51 | 5.11 | 4.85 | 79.2 | 149.91 | 1.893 | 112.38 | 1.419 | |
| 3 | 0.22 | 9.47 | 5.15 | 4.85 | 68.2 | 146.49 | 2.149 | 109.95 | 1.613 | |
| 4 | 0.31 | 9.59 | 5.24 | 5.14 | 78.7 | 123.62 | 1.571 | 93.83 | 1.192 | |
| 5 | 0.40 | 9.70 | 5.14 | 5.24 | 86.0 | 109.02 | 1.268 | 83.65 | 0.973 | |
| 6 | 0.50 | 9.59 | 5.18 | 5.25 | 73.5 | 97.69 | 1.328 | 75.84 | 1.031 | |
| 1 | 1.13 | 9.66 | 5.23 | 4.55 | 67.9 | 86.85 | 1.279 | 72.05 | 1.061 | |
| 2 | 1.10 | 9.41 | 5.22 | 4.76 | 71.7 | 87.98 | 1.226 | 72.77 | 1.014 | |
| 3 | 1.00 | 9.45 | 5.23 | 4.69 | 75.7 | 92.10 | 1.216 | 75.44 | 0.996 | |
| 4 | 1.15 | 9.38 | 5.17 | 4.98 | 75.2 | 86.13 | 1.145 | 71.59 | 0.952 | |
| 5 | 1.12 | 9.60 | 5.23 | 5.38 | 81.2 | 87.22 | 1.074 | 72.29 | 0.890 | |
| 6 | 1.05 | 9.57 | 5.22 | 4.59 | 76.5 | 89.97 | 1.175 | 74.05 | 0.967 | |
| 1 | 2.12 | 9.66 | 5.06 | 4.29 | 66.2 | 82.41 | 1.244 | 74.38 | 1.123 | |
| 2 | 2.13 | 9.63 | 5.13 | 4.68 | 84.8 | 82.23 | 0.970 | 74.27 | 0.876 | |
| 3 | 2.11 | 9.60 | 5.08 | 4.43 | 74.2 | 82.59 | 1.112 | 74.49 | 1.003 | |
| 4 | 2.10 | 9.75 | 5.24 | 4.21 | 88.0 | 82.77 | 0.940 | 74.59 | 0.848 | |
| 5 | 2.05 | 9.67 | 5.25 | 4.37 | 72.8 | 83.70 | 1.149 | 75.14 | 1.031 | |
| 6 | 2.12 | 9.56 | 5.07 | 4.70 | 66.6 | 82.41 | 1.236 | 74.38 | 1.115 |
Table A2.
Experimental and predicted critical loads for ASA-CF10 SENB specimens.
Table A2.
Experimental and predicted critical loads for ASA-CF10 SENB specimens.
| RO | Test nº | ρ (mm) | W (mm) | B (mm) | a0 (mm) | Pmax (N) | PASED (N) | PASED/Pmax | PASED* (N) | PASED*/Pmax |
|---|---|---|---|---|---|---|---|---|---|---|
| 0/90 | 1 | 0.00 | 10.04 | 4.94 | 5.37 | 104.9 | - | - | - | - |
| 2 | 0.00 | 10.11 | 4.97 | 5.77 | 86.1 | - | - | - | - | |
| 3 | 0.00 | 10.02 | 4.93 | 5.15 | 108.9 | - | - | - | - | |
| 4 | 0.00 | 10.15 | 5.00 | 5.62 | 101.7 | - | - | - | - | |
| 5 | 0.00 | 10.12 | 4.93 | 5.00 | 127.0 | - | - | - | - | |
| 6 | 0.00 | 10.14 | 4.95 | 4.63 | - | - | - | - | - | |
| 1 | 0.65 | 10.03 | 4.97 | 5.43 | 100.9 | 142.79 | 1.415 | 95.79 | 0.949 | |
| 2 | 0.65 | 10.10 | 5.05 | 5.55 | 99.6 | 142.78 | 1.433 | 95.78 | 0.961 | |
| 3 | 0.64 | 10.10 | 4.90 | 5.50 | 97.9 | 143.84 | 1.469 | 96.38 | 0.984 | |
| 4 | 0.65 | 10.11 | 4.97 | 5.50 | 101.6 | 142.78 | 1.405 | 95.78 | 0.943 | |
| 5 | 0.65 | 10.03 | 4.98 | 5.43 | 105.6 | 142.78 | 1.352 | 95.78 | 0.907 | |
| 6 | 0.66 | 10.20 | 4.98 | 5.64 | 105.5 | 141.75 | 1.344 | 95.20 | 0.903 | |
| 1 | 1.08 | 10.26 | 4.95 | 5.14 | 116.2 | 148.51 | 1.278 | 104.42 | 0.898 | |
| 2 | 1.09 | 10.12 | 4.98 | 5.32 | 119.4 | 147.88 | 1.239 | 104.08 | 0.872 | |
| 3 | 1.07 | 10.19 | 4.95 | 5.26 | 108.7 | 149.15 | 1.372 | 104.76 | 0.964 | |
| 4 | 1.07 | 10.24 | 4.99 | 5.30 | 112.7 | 149.15 | 1.324 | 104.76 | 0.930 | |
| 5 | 1.00 | 10.09 | 5.00 | 5.17 | 111.6 | 153.91 | 1.379 | 107.33 | 0.962 | |
| 6 | 1.06 | 10.24 | 4.92 | 5.43 | 120.2 | 149.80 | 1.246 | 105.11 | 0.874 | |
| 1 | 2.08 | 10.05 | 4.99 | 5.62 | 135.3 | 141.19 | 1.044 | 108.27 | 0.800 | |
| 2 | 2.14 | 10.25 | 4.98 | 5.75 | 103.4 | 139.47 | 1.349 | 107.42 | 1.039 | |
| 3 | 2.14 | 10.05 | 4.91 | 5.63 | 104.2 | 139.47 | 1.338 | 107.42 | 1.031 | |
| 4 | 2.14 | 10.03 | 4.94 | 5.59 | 102.0 | 139.47 | 1.368 | 107.42 | 1.053 | |
| 5 | 2.12 | 10.08 | 4.97 | 5.68 | 103.6 | 140.03 | 1.352 | 107.70 | 1.039 | |
| 6 | 2.10 | 10.20 | 4.97 | 5.72 | 107.8 | 140.61 | 1.304 | 107.98 | 1.002 | |
| 45/−45 | 1 | 0.00 | 10.19 | 4.96 | 5.55 | 97.45 | - | - | - | - |
| 2 | 0.00 | 10.31 | 4.9 | 5.44 | 110.12 | - | - | - | - | |
| 3 | 0.00 | 9.99 | 4.78 | 5.12 | 120.51 | - | - | - | - | |
| 4 | 0.00 | 10.12 | 4.94 | 5.16 | 114.78 | - | - | - | - | |
| 5 | 0.00 | 10.24 | 4.83 | 5.33 | 121.88 | - | - | - | - | |
| 6 | 0.00 | 10.24 | 4.87 | 4.80 | 150.37 | - | - | - | - | |
| 1 | 0.66 | 9.97 | 4.83 | 5.48 | 99.95 | 127.86 | 1.279 | 96.75 | 0.968 | |
| 2 | 0.66 | 10.19 | 4.92 | 5.60 | 108.37 | 127.86 | 1.180 | 96.75 | 0.893 | |
| 3 | 0.65 | 10.15 | 4.95 | 5.51 | 113.48 | 128.80 | 1.135 | 97.39 | 0.858 | |
| 4 | 0.64 | 10.32 | 4.9 | 5.72 | 108.05 | 129.76 | 1.201 | 98.05 | 0.907 | |
| 5 | 0.67 | 10.03 | 4.84 | 5.56 | 108.07 | 126.94 | 1.175 | 96.12 | 0.889 | |
| 6 | 0.64 | 10.06 | 4.87 | 5.47 | 108.15 | 129.76 | 1.200 | 98.05 | 0.907 | |
| 1 | 1.11 | 10.24 | 5.03 | 5.21 | 128.33 | 131.90 | 1.028 | 102.91 | 0.802 | |
| 2 | 1.15 | 10.21 | 4.96 | 5.37 | 129.45 | 129.73 | 1.002 | 101.47 | 0.784 | |
| 3 | 1.12 | 9.97 | 4.82 | 5.03 | 118.33 | 131.34 | 1.110 | 102.54 | 0.867 | |
| 4 | 1.12 | 10.22 | 5.03 | 5.41 | 116.22 | 131.34 | 1.130 | 102.54 | 0.882 | |
| 5 | 1.13 | 10.07 | 4.88 | 5.23 | 117.03 | 130.80 | 1.118 | 102.18 | 0.873 | |
| 6 | 1.13 | 10.23 | 4.93 | 5.42 | 123.25 | 130.80 | 1.061 | 102.18 | 0.829 | |
| 1 | 2.06 | 10.14 | 4.9 | 5.71 | 113.27 | 126.83 | 1.120 | 104.54 | 0.923 | |
| 2 | 2.07 | 10.15 | 4.91 | 5.66 | 116.17 | 126.56 | 1.089 | 104.37 | 0.898 | |
| 3 | 2.09 | 10.04 | 4.85 | 5.50 | 121.61 | 126.02 | 1.036 | 104.03 | 0.855 | |
| 4 | 2.07 | 9.99 | 4.68 | 5.81 | 92.42 | 126.56 | 1.369 | 104.37 | 1.129 | |
| 5 | 2.09 | 10.17 | 3.57 | 5.73 | 81.98 | 126.02 | 1.537 | 104.03 | 1.269 | |
| 6 | 2.08 | 10.24 | 4.77 | 5.77 | 107.59 | 126.29 | 1.174 | 104.20 | 0.968 | |
| 30/−60 | 1 | 0.00 | 10.11 | 4.91 | 5.32 | 119.75 | - | - | - | - |
| 2 | 0.00 | 10.22 | 4.87 | 5.69 | 107.36 | - | - | - | - | |
| 3 | 0.00 | 10.23 | 4.87 | 5.24 | 128.85 | - | - | - | - | |
| 4 | 0.00 | 10.01 | 4.9 | 4.94 | 135.00 | - | - | - | - | |
| 5 | 0.00 | 9.97 | 4.87 | 5.72 | 83.67 | - | - | - | - | |
| 6 | 0.00 | 10.13 | 4.89 | 5.11 | 112.86 | - | - | - | - | |
| 1 | 0.70 | 10.09 | 4.94 | 5.29 | 114.4 | 137.94 | 1.206 | 95.74 | 0.837 | |
| 2 | 0.64 | 10.17 | 4.89 | 5.40 | 106.5 | 143.92 | 1.351 | 99.06 | 0.930 | |
| 3 | 0.66 | 10.30 | 4.90 | 5.59 | 111.7 | 141.83 | 1.270 | 97.90 | 0.877 | |
| 4 | 0.64 | 9.99 | 4.86 | 5.39 | 96.3 | 143.71 | 1.493 | 99.06 | 1.029 | |
| 5 | 0.65 | 10.23 | 4.92 | 5.55 | 112.3 | 142.86 | 1.272 | 98.48 | 0.877 | |
| 6 | 0.66 | 9.99 | 4.89 | 5.20 | 99.6 | 141.54 | 1.421 | 97.90 | 0.983 | |
| 1 | 1.10 | 10.04 | 4.97 | 5.16 | 120.92 | 147.60 | 1.221 | 107.72 | 0.891 | |
| 2 | 1.10 | 10.19 | 4.90 | 5.40 | 122.94 | 147.60 | 1.201 | 107.72 | 0.876 | |
| 3 | 1.07 | 10.24 | 4.88 | 5.57 | 121.02 | 149.49 | 1.235 | 108.71 | 0.898 | |
| 4 | 1.11 | 10.14 | 4.91 | 5.11 | 122.12 | 146.99 | 1.204 | 107.40 | 0.879 | |
| 5 | 1.15 | 10.07 | 4.88 | 5.09 | 120.72 | 144.63 | 1.198 | 106.16 | 0.879 | |
| 6 | 1.13 | 10.16 | 4.91 | 5.41 | 125.41 | 145.80 | 1.163 | 106.77 | 0.851 | |
| 1 | 2.07 | 10.30 | 4.91 | 5.81 | 119.34 | 142.31 | 1.193 | 114.21 | 0.957 | |
| 2 | 2.12 | 10.05 | 4.90 | 5.59 | 109.84 | 140.87 | 1.283 | 113.52 | 1.034 | |
| 3 | 2.08 | 10.20 | 4.92 | 5.70 | 116.76 | 142.02 | 1.216 | 114.07 | 0.977 | |
| 4 | 2.09 | 10.13 | 4.92 | 5.62 | 112.43 | 141.73 | 1.261 | 113.93 | 1.013 | |
| 5 | 2.09 | 10.18 | 4.91 | 5.68 | 113.68 | 141.73 | 1.247 | 113.93 | 1.002 | |
| 6 | 2.10 | 10.35 | 4.92 | 5.85 | 117.07 | 141.44 | 1.208 | 113.79 | 0.972 |
References
- Ramos, A.; Angel, V.G.; Siqueiros, M.; Sahagun, T.; Gonzalez, L.; Ballesteros, R. Reviewing Additive Manufacturing Techniques: Material Trends and Weight Optimization Possibilities Through Innovative Printing Patterns. Materials 2025, 18, 1377. [Google Scholar] [CrossRef]
- Mwema, F.M.; Akinlabi, E.T. Basics of Fused Deposition Modelling (FDM); Springer: Cham, Switzerland, 2020; pp. 1–15. [Google Scholar]
- Rahim, T.N.A.T.; Abdullah, A.M.; Md Akil, H. Recent Developments in Fused Deposition Modeling-Based 3D Printing of Polymers and Their Composites. Polym. Rev. 2019, 59, 589–624. [Google Scholar] [CrossRef]
- Bamiduro, O.; Owolabi, G.; Haile, M.A.; Riddick, J.C. The Influence of Load Direction, Microstructure, Raster Orientation on the Quasi-Static Response of Fused Deposition Modeling ABS. Rapid Prototyp. J. 2019, 25, 462–472. [Google Scholar] [CrossRef]
- Wang, P.; Zou, B.; Ding, S.; Li, L.; Huang, C. Effects of FDM-3D Printing Parameters on Mechanical Properties and Microstructure of CF/PEEK and GF/PEEK. Chin. J. Aeronaut. 2021, 34, 236–246. [Google Scholar] [CrossRef]
- Kumar, S.R.; Sridhar, S.; Venkatraman, R.; Venkatesan, M. Polymer Additive Manufacturing of ASA Structure: Influence of Printing Parameters on Mechanical Properties. Mater. Today Proc. 2021, 39, 1316–1319. [Google Scholar] [CrossRef]
- Lokesh, N.; Praveena, B.A.; Sudheer Reddy, J.; Vasu, V.K.; Vijaykumar, S. Evaluation on Effect of Printing Process Parameter through Taguchi Approach on Mechanical Properties of 3D Printed PLA Specimens Using FDM at Constant Printing Temperature. Mater. Today Proc. 2022, 52, 1288–1293. [Google Scholar] [CrossRef]
- Rodríguez-Reyna, S.L.; Mata, C.; Díaz-Aguilera, J.H.; Acevedo-Parra, H.R.; Tapia, F. Mechanical Properties Optimization for PLA, ABS and Nylon + CF Manufactured by 3D FDM Printing. Mater. Today Commun. 2022, 33, 104774. [Google Scholar] [CrossRef]
- El Magri, A.; Ouassil, S.; Vaudreuil, S. Effects of Printing Parameters on the Tensile Behavior of 3D-printed Acrylonitrile Styrene Acrylate (ASA) Material in Z Direction. Polym. Eng. Sci. 2022, 62, 848–860. [Google Scholar] [CrossRef]
- Patro, P.K.; Kandregula, S.; Khan, M.S.; Das, S. Investigation of Mechanical Properties of 3D Printed Sandwich Structures Using PLA and ABS. Mater. Today Proc. 2023; in press. [Google Scholar] [CrossRef]
- Prajapati, S.; Sharma, J.K.; Kumar, S.; Pandey, S.; Pandey, M.K. A Review on Comparison of Physical and Mechanical Properties of PLA, ABS, TPU, and PETG Manufactured Engineering Components by Using Fused Deposition Modelling. Mater. Today Proc. 2024. [Google Scholar] [CrossRef]
- Kumaresan, R.; Kadirgama, K.; Samykano, M.; Harun, W.S.W.; Thirugnanasambandam, A.; Kanny, K. In-Depth Study and Optimization of Process Parameters to Enhance Tensile and Compressive Strengths of PETG in FDM Technology. J. Mater. Res. Technol. 2025, 37, 397–416. [Google Scholar] [CrossRef]
- Taylor, D. Predicting the Fracture Strength of Ceramic Materials Using the Theory of Critical Distances. Eng. Fract. Mech. 2004, 71, 2407–2416. [Google Scholar] [CrossRef]
- Berto, F.; Lazzarin, P. Recent Developments in Brittle and Quasi-Brittle Failure Assessment of Engineering Materials by Means of Local Approaches. Mater. Sci. Eng. R Rep. 2014, 75, 1–48. [Google Scholar] [CrossRef]
- Taylor, D. The Theory of Critical Distances; Elsevier: Amsterdam, The Netherlands, 2007; ISBN 9780080444789. [Google Scholar]
- Justo, J.; Castro, J.; Cicero, S. Energy-Based Approach for Fracture Assessment of Several Rocks Containing U-Shaped Notches through the Application of the SED Criterion. Int. J. Rock Mech. Min. Sci. 2018, 110, 306–315. [Google Scholar] [CrossRef]
- Ibáñez-Gutiérrez, F.T.; Cicero, S.; Madrazo, V.; Berto, F. Fracture Loads Prediction on Notched Short Glass Fibre Reinforced Polyamide 6 Using the Strain Energy Density. Phys. Mesomech. 2018, 21, 165–172. [Google Scholar] [CrossRef]
- Cicero, S.; Berto, F.; Ibáñez-Gutiérrez, F.T.; Procopio, I.; Madrazo, V. SED Criterion Estimations of Fracture Loads in Structural Steels Operating at Lower Shelf Temperatures and Containing U-Notches. Theor. Appl. Fract. Mech. 2017, 90, 234–243. [Google Scholar] [CrossRef]
- Sánchez, M.; Cicero, S.; Arrieta, S.; Torabi, A.R. Fracture Load Prediction of Non-Linear Structural Steels through Calibration of the ASED Criterion. Metals 2023, 13, 1211. [Google Scholar] [CrossRef]
- Berto, F.; Lazzarin, P. The Volume-Based Strain Energy Density Approach Applied to Static and Fatigue Strength Assessments of Notched and Welded Structures. Procedia Eng. 2009, 1, 155–158. [Google Scholar] [CrossRef]
- Ferro, P.; Borsato, T.; Berto, F.; Carollo, C. Fatigue Strength Assessment of Heavy Section Ductile Irons through the Average Strain Density Energy Criterion. Mater. Des. Process. Commun. 2021, 3, e197. [Google Scholar] [CrossRef]
- Horvath, M.; Oberreiter, M.; Stoschka, M. Energy-Based Fatigue Assessment of Defect-Afflicted Cast Steel Components by Means of a Linear-Elastic Approach. Appl. Sci. 2023, 13, 3768. [Google Scholar] [CrossRef]
- Moussaoui, M.; Bendriss, A.; Tahiri, A.; Kellai, A.; Zergod, S.; Djeloud, H.; Hachi, B.K. Numerical and Experimental Analysis of the Notch Effect on Fatigue Behavior of Polymethylmethacrylate Metal Based on Strain Energy Density Method and the Extended Finite Element Method. Mater. Sci. 2023, 41, 401–413. [Google Scholar] [CrossRef]
- Klusák, J.; Kozáková, K. Fatigue Life Predictions of Notched Samples Based on Average Strain Energy Density. Procedia Struct. Integr. 2025, 68, 660–665. [Google Scholar] [CrossRef]
- Seibert, P.; Susmel, L.; Berto, F.; Kästner, M.; Razavi, N. Applicability of Strain Energy Density Criterion for Fracture Prediction of Notched PLA Specimens Produced via Fused Deposition Modeling. Eng. Fract. Mech. 2021, 258, 108103. [Google Scholar] [CrossRef]
- Sánchez, M.; Cicero, S.; Arrieta, S.; Martínez, V. Fracture Load Predictions in Additively Manufactured ABS U-Notched Specimens Using Average Strain Energy Density Criteria. Materials 2022, 15, 2372. [Google Scholar] [CrossRef] [PubMed]
- Sánchez, M.; Arrieta, S.; Cicero, S. Fracture Load Estimations for U-Notched and V-Notched 3D Printed PLA and Graphene-Reinforced PLA Plates Using the ASED Criterion. Frat. Integrità Strutt. 2023, 17, 322–338. [Google Scholar] [CrossRef]
- Morettini, G.; Razavi, S.M.J.; Staffa, A.; Palmieri, M.; Berto, F.; Cianetti, F.; Braccesi, C. On the Combined Use of Averaged Strain Energy Density Criteria (ASED) and Equivalent Material Concept (ECC) for the Fracture Load Prediction of Additively Manufactured PLA v-Notched Specimens. Procedia Struct. Integr. 2023, 47, 296–309. [Google Scholar] [CrossRef]
- Vălean, E.; Foti, P.; Berto, F.; Marșavina, L. Static and Fatigue Behavior of 3D Printed Smooth and Notched PLA and Short Carbon Fibers Reinforced PLA. Theor. Appl. Fract. Mech. 2024, 131, 104417. [Google Scholar] [CrossRef]
- Avanzini, A.; Tomasoni, M.; Xu, Z.; Berto, F.; Razavi, N. Fracture Assessment of Polyamide 12 (PA12) Specimens Fabricated via Multi Jet FusionTM in the Presence of Geometrical Discontinuities. Eng. Fract. Mech. 2024, 303, 110118. [Google Scholar] [CrossRef]
- Arrieta, S.; Cicero, S.; Sánchez, M.; Castanon-Jano, L. Estimation of Fracture Loads in 3D Printed PLA Notched Specimens Using the ASED Criterion. Procedia Struct. Integr. 2023, 47, 13–21. [Google Scholar] [CrossRef]
- Guessasma, S.; Belhabib, S.; Nouri, H. Microstructure, Thermal and Mechanical Behavior of 3D Printed Acrylonitrile Styrene Acrylate. Macromol. Mater. Eng. 2019, 304, 1800793. [Google Scholar] [CrossRef]
- Yap, Y.L.; Toh, W.; Koneru, R.; Chua, Z.Y.; Lin, K.; Yeoh, K.M.; Lim, C.M.; Lee, J.S.; Plemping, N.A.; Lin, R.; et al. Finite Element Analysis of 3D-Printed Acrylonitrile Styrene Acrylate (ASA) with Ultrasonic Material Characterization. Int. J. Comput. Mater. Sci. Eng. 2019, 8, 1950002. [Google Scholar] [CrossRef]
- Afshar, A.; Wood, R. Development of Weather-Resistant 3D Printed Structures by Multi-Material Additive Manufacturing. J. Compos. Sci. 2020, 4, 94. [Google Scholar] [CrossRef]
- Sedlak, J.; Joska, Z.; Jansky, J.; Zouhar, J.; Kolomy, S.; Slany, M.; Svasta, A.; Jirousek, J. Analysis of the Mechanical Properties of 3D-Printed Plastic Samples Subjected to Selected Degradation Effects. Materials 2023, 16, 3268. [Google Scholar] [CrossRef] [PubMed]
- Billah, K.M.M.; Sarker, M.R.; Gonzalez, M.B.; Ramirez, J.A.; Hamidi, Y.K. Impact of Processing Parameters in Mechanical Properties of the Additively Manufactured Acrylonitrile Styrene Acrylate. In Advanced Manufacturing, Proceedings of the 2022 ASME International Mechanical Engineering Congress and Exposition (IMECE), Columbus, OH, USA, 30 October–3 November 2022; American Society of Mechanical Engineers: New York, NY, USA, 2022; Volume 2A. [Google Scholar]
- Rakshit, R.; Kalvettukaran, P.; Acharyya, S.K.; Panja, S.C.; Misra, D. Development of High Specific Strength Acrylonitrile Styrene Acrylate (ASA) Structure Using Fused Filament Fabrication. Prog. Addit. Manuf. 2023, 8, 1543–1553. [Google Scholar] [CrossRef]
- Appalsamy, T.; Hamilton, S.L.; Kgaphola, M.J. Tensile Test Analysis of 3D Printed Specimens with Varying Print Orientation and Infill Density. J. Compos. Sci. 2024, 8, 121. [Google Scholar] [CrossRef]
- Cahyadi, W. Mechanical Properties of 3D Printed Acryonitrile Styrene Acrylate; South Dakota State University: Brookings, SD, USA, 2019. [Google Scholar]
- Sharma, A.; Chhabra, D.; Sahdev, R.; Kaushik, A.; Punia, U. Investigation of Wear Rate of FDM Printed TPU, ASA and Multi-Material Parts Using Heuristic GANN Tool. Mater. Today Proc. 2022, 63, 559–565. [Google Scholar] [CrossRef]
- Gawali, S.K.; Jain, P.K. Effect of Natural Aging on Mechanical Properties of 3D-Printed Acrylonitrile Styrene Acrylate for Outdoor Applications. J. Mater. Eng. Perform. 2024, 34, 16430–16442. [Google Scholar] [CrossRef]
- Ning, F.; Cong, W.; Qiu, J.; Wei, J.; Wang, S. Additive Manufacturing of Carbon Fiber Reinforced Thermoplastic Composites Using Fused Deposition Modeling. Compos. Part B Eng. 2015, 80, 369–378. [Google Scholar] [CrossRef]
- Song, J.; Liu, X.; Zhang, Y.; Huang, B.; Yang, W. Carbon-fiber-reinforced Acrylonitrile–Styrene–Acrylate Composites: Mechanical and Rheological Properties and Electrical Resistivity. J. Appl. Polym. Sci. 2016, 133, 43252. [Google Scholar] [CrossRef]
- Sánchez, D.M.; de la Mata, M.; Delgado, F.J.; Casal, V.; Molina, S.I. Development of Carbon Fiber Acrylonitrile Styrene Acrylate Composite for Large Format Additive Manufacturing. Mater. Des. 2020, 191, 108577. [Google Scholar] [CrossRef]
- Khosravani, M.R.; Zolfagharian, A.; Jennings, M.; Reinicke, T. Structural Performance of 3D-Printed Composites under Various Loads and Environmental Conditions. Polym. Test. 2020, 91, 106770. [Google Scholar] [CrossRef]
- Tripathy, C.R.; Sharma, R.K.; Rattan, V.K. An Investigation on Mechanical Strength of Fused Filament Fabricated and Injection Molded ASA Parts. J. Micromanuf. 2025, 8, 44–59. [Google Scholar] [CrossRef]
- MohamedZain, A.O.; Chua, H.; Yap, K.; Uthayasurian, P.; Jiehan, T. Novel Drone Design Using an Optimization Software with 3D Model, Simulation, and Fabrication in Drone Systems Research. Drones 2022, 6, 97. [Google Scholar] [CrossRef]
- Kaptan, A. Investigation of the Effect of Exposure to Liquid Chemicals on the Strength Performance of 3D-Printed Parts from Different Filament Types. Polymers 2025, 17, 1637. [Google Scholar] [CrossRef]
- Cicero, S.; Devito, F.; Sánchez, M.; Arrieta, S.; Arroyo, B. Notch Effect in Acrylonitrile Styrene Acrylate (ASA) Single-Edge-Notch Bending Specimens Manufactured by Fused Filament Fabrication. Materials 2024, 17, 5207. [Google Scholar] [CrossRef]
- Cicero, S.; Arrieta, S.; Devito, F.; Arroyo, B.; Lavecchia, F. Fracture Behavior of Additively Manufactured Carbon Fiber Reinforced Acrylonitrile-Styrene-Acrylate Containing Cracks and Notches. J. Compos. Sci. 2025, 9, 185. [Google Scholar] [CrossRef]
- ASTM D638-14; Standard Test Method for Tensile Properties of Plastics. ASTM International: West Conshohocken, PA, USA, 2014.
- ASTM D6068; Standard Test Method for Determining J-R Curves of Plastic Materials. ASTM International: West Conshohocken, PA, USA, 2018.
- Sih, G.C. Strain-Energy-Density Factor Applied to Mixed Mode Crack Problems. Int. J. Fract. 1974, 10, 305–321. [Google Scholar] [CrossRef]
- Lazzarin, P.; Zambardi, R. A Finite-Volume-Energy Based Approach to Predict the Static and Fatigue Behavior of Components with Sharp V-Shaped Notches. Int. J. Fract. 2001, 112, 275–298. [Google Scholar] [CrossRef]
- Lazzarin, P.; Berto, F. Some Expressions for the Strain Energy in a Finite Volume Surrounding the Root of Blunt V-Notches. Int. J. Fract. 2005, 135, 161–185. [Google Scholar] [CrossRef]
- Yosibash, Z.; Bussiba, A.; Gilad, I. Failure Criteria for Brittle Elastic Materials. Int. J. Fract. 2004, 125, 307–333. [Google Scholar] [CrossRef]
- Seweryn, A. Brittle Fracture Criterion for Structures with Sharp Notches. Eng. Fract. Mech. 1994, 47, 673–681. [Google Scholar] [CrossRef]
- Berto, F.; Lazzarin, P. A Review of the Volume-Based Strain Energy Density Approach Applied to V-Notches and Welded Structures. Theor. Appl. Fract. Mech. 2009, 52, 183–194. [Google Scholar] [CrossRef]
- Vázquez Martínez, J.M.; Piñero Vega, D.; Salguero, J.; Batista, M. Evaluation of the Printing Strategies Design on the Mechanical and Tribological Response of Acrylonitrile Styrene Acrylate (ASA) Additive Manufacturing Parts. Rapid Prototyp. J. 2022, 28, 479–489. [Google Scholar] [CrossRef]
- Seibert, P.; Taylor, D.; Berto, F.; Mohammad Javad Razavi, S.; Razavi, N. Energy TCD—Robust and Simple Failure Prediction Unifying the TCD and ASED Criterion. Eng. Fract. Mech. 2022, 271, 108652. [Google Scholar] [CrossRef]


Disclaimer/Publisher’s Note: The statements, opinions and data contained in all publications are solely those of the individual author(s) and contributor(s) and not of MDPI and/or the editor(s). MDPI and/or the editor(s) disclaim responsibility for any injury to people or property resulting from any ideas, methods, instructions or products referred to in the content. |
© 2025 by the authors. Licensee MDPI, Basel, Switzerland. This article is an open access article distributed under the terms and conditions of the Creative Commons Attribution (CC BY) license (https://creativecommons.org/licenses/by/4.0/).