Article

Analysis of Thermally Induced Residual Stress in Resistance Welded PC/CF Composite to Aluminum

1
Faculty of Mechanical Engineering, Military University of Technology, 01-480 Warsaw, Poland
2
Lukasiewicz Research Network–Institute of Aviation, 02-256 Warsaw, Poland
3
Air Force Institute of Technology, 01-494 Warsaw, Poland
*
Author to whom correspondence should be addressed.
Materials 2025, 18(21), 4962; https://doi.org/10.3390/ma18214962
Submission received: 19 August 2025 / Revised: 16 September 2025 / Accepted: 28 September 2025 / Published: 30 October 2025
(This article belongs to the Section Advanced Composites)

Abstract

Thermoplastic composites are growing in popularity in the aerospace and automotive industries; they enable weldable and recyclable structures. Resistance welded hybrid thermoplastic and metal joints are attractive for rapid assembly, but the thermal mismatch between metals and polymers introduces residual stresses, which can drive edge debonding and compromise durability. This study presents fabricated single-lap PC/CF–Al7075 coupons with measured mid-span bow resulting from welding, evaluated bond quality by step-heating thermography, and an evaluated framework for residual stress prediction using Ansys complemented by a bimetal analytical check. Three thermal cycles were examined with different temperature gradients (200, 220, 240 °C): the measured bow was 16.5 mm and remained constant, whereas analytical calculation increased with ΔT similarly to the FEM prediction. The current FEM under predicted the bow (Mean Absolute Percentage Error is 21%), showing stress contours that decay with distance from the bond and revealing pronounced peaks in both σxx and σzz components at weld edges, consistent with shear-lag theory. FEM returned edge-peaked peel rising from 43 to −64 MPa and σxx was up to 12% more compressive than analytical calculation; an effective CF/PC CTE of 1.5 × 10⁻⁶ K−1 reconciled curvature with test better than catalogue values. The temperature insensitive bow is attributed to polycarbonate flow/viscoelastic relaxation above Tg and hot relaxation in aluminum, with effects not represented in the elastic models. Edge peel and shear govern initiation risk.

1. Introduction

In recent years, thermoplastic composites, most importantly the carbon fibre-reinforced systems, have grown significantly in popularity in industries such as aerospace and automotive because they combine the benefits that traditional carbon fibre composites carry and improve on them by adding short manufacturing cycles, weldability, repairability, and recyclability [1], while offering similar structural performance as well as increased damping and the potential for decreased manufacturing energy requirements, this novel thermoplastic material is a promising replacement for thermoset epoxy materials, leading to a reduction in overall production costs in industries focused on efficiency and sustainability [2,3,4,5]. Amorphous polymers such as polycarbonate exhibit strong temperature-dependent stiffness around the glass transition, which enables thermal joining but also makes the thermal cycle a driver of post process deformations and residual stress [6]. Effective application requires advanced joining techniques that will ensure structural integrity and confidence in fatigue resistance. The combination of a polymer matrix and reinforcing fibres results in high-performance materials [7].
Recognizing the benefits and accelerating adoption of thermoplastic composites, this study addresses a research question: can carbon fibre-reinforced polycarbonate (PC/CF) be reliably welded to aluminum to form strong bonds and can the process be repeatable enough for structural service and repair? Prior to testing the joint strength and durability, this paper focuses on the risk of the dominant manufacturing side effect, the residual stresses arising from the weld thermal cycle, and subsequent cooling, driven by coefficient of thermal expansion (CTE) mismatch and temperature-dependent stiffness.
Recent studies on CFRP to metal welds quantified residual stress magnitudes, while simulations reproduced the thermos mechanical fields that drive interface failure. Collectively, these studies motivate a validated thermal structural workflow for predicting post-weld deformation and interfacial stress in thermoplastic metal joints [8,9]. We create a representative PC/CF to aluminum singe-lap joint and execute a validated two stage finite element workflow to anticipate and quantify post-weld deformation and the magnitude, spatial distribution, and edge-concentrated peel and shear that signal incipient debonding. The objective here is not to estimate the joint strength but to provide evidence on the feasibility of welding thermoplastic to metal and on the process parameters that govern residual stresses like temperature profile, pressure, and time, as shown by Sacchetti et al., controlling the cooling rate can significantly improve composite fatigue strength by up to 2.5 times [10]. establishing a technical baseline for subsequent strength, durability, and repair use cases.
Prior work on joining thermoplastic composites to metals, resistance, and induction variants has established process parameters and post-weld assessments [11,12,13,14], yet validated residual stress predictions in thermoplastic–metal single-lap welds remain sparse, particularly for PC/CF to Al [15]. Existing studies emphasize process feasibility and joint morphology [16]; fewer provide a quantitative link between measured thermal histories, temperature-dependent property cards, and post-cooling residual stresses benchmarked against deformation and NDT [8,17]. This motivates the present focus on residual stress quantification and validation ahead of strength and durability. Similar durability study is well documented in metallic stir friction welds [18]. It reports that accelerated crack propagation under tensile residual stress, including residual stress in an analysis, changes the expected strength of the joint, which can be seen in [19].
There is limited data on validated residual stress prediction for carbon fibre polycarbonate bonded with aluminum. Much of the literature emphasizes process feasibility and joint morphology, whereas fewer studies quantitatively link measured or modelled thermal histories, temperature-dependent property cards, and post-cooling residual stresses benchmarked against deformation or NDT. Accordingly, we model the weld thermal field with temperature-dependent material cards [20,21,22] and propagate that history to a structural analysis to estimate deformation and residual stresses, then compare predictions with the deformed specimen and weld-quality measurements (thermography); the thermal results are implemented to a structural analysis to estimate the deformation and resulting stress. This is compared with the actual welded and deformed specimen. Polycarbonate was chosen due to its relatively low transition temperature which should minimize the post-weld residual stress. Polycarbonate is selected for its relatively low glass transition temperature, which can reduce post-weld residual stress risk for a given thermal input.
Two plates were joined using a single-lap joint (Figure 1). The simplicity of this joint makes it versatile and widely used in the aerospace industry (Figure 1) [23].

2. The Experiment

2.1. Materials and Specimens

Two panels were joined in a single-lap configuration, a carbon fibre-reinforced polycarbonate laminate (PC/CF) and an aluminum alloy (7075) plate. A 0.2 mm polycarbonate film was used as a welding interlayer. Nominal dimensions of the specimens are summarized in Table 1; material property data and temperature dependencies used later in the FE model are described in Section 5.

2.2. Surface Preparation

To ensure better joint strength, the surface of the aluminum plate is prepared beforehand (Figure 2). Baker A.A. describes that when controlled micro roughness and a chemically active oxide are used to enhance wetting, promote micromechanical interlocking, and improve durability, the mechanical interlocking of the aluminum with molten polycarbonate introduces an additional shear force component (Figure 3) that increases the shear strength of the joint [25]. Furthermore, the intricate structure of the surface improves durability and moisture resistance, as the complex shape of the joint prolongs the path for water penetration. However, over blasting the aluminum surface traps contaminants and moisture and degrades durability [25]. A corroboration of the surface roughness and adhesion strength relationship is presented in [12], where it is reported that etching of stainless-steel increased surface roughness and raised lap shear strength by up to 32%, with excessive etch time reducing strength due to wire degradation. The review further notes that anodizing aluminum forms a microporous, micro rough oxide that promotes mechanical interlocking with amorphous thermoplastics, improving adhesion relative to smooth metal surfaces. Within [26], a great comparison of surface roughness to adhesion strength is presented, and a value of Ra = 10.18 [µm] can be observed. On the composite side, the bond relies on the thermoplastic nature of polycarbonate. This process, often described as welding, involves heating the polycarbonate to its flow temperature. At this stage, inter-chain bonds become weak, and the polymer flows freely [27], allowing the polycarbonate within the composite and the film to mix thoroughly and penetrate the roughness of the aluminum. As the temperature cools below the glass transition point, the thermoplastic hardens, forming a durable bond. For this experiment the aluminum plate surface was prepared using grit blasting following the guidance presented in [25], and the roughness was judged visually and by feel.

2.3. Resistance Welding Carbon Fibre Reinforced Polycarbonate with Aluminum

2.3.1. Introduction to Resistance Welding of Thermoplastic Composites

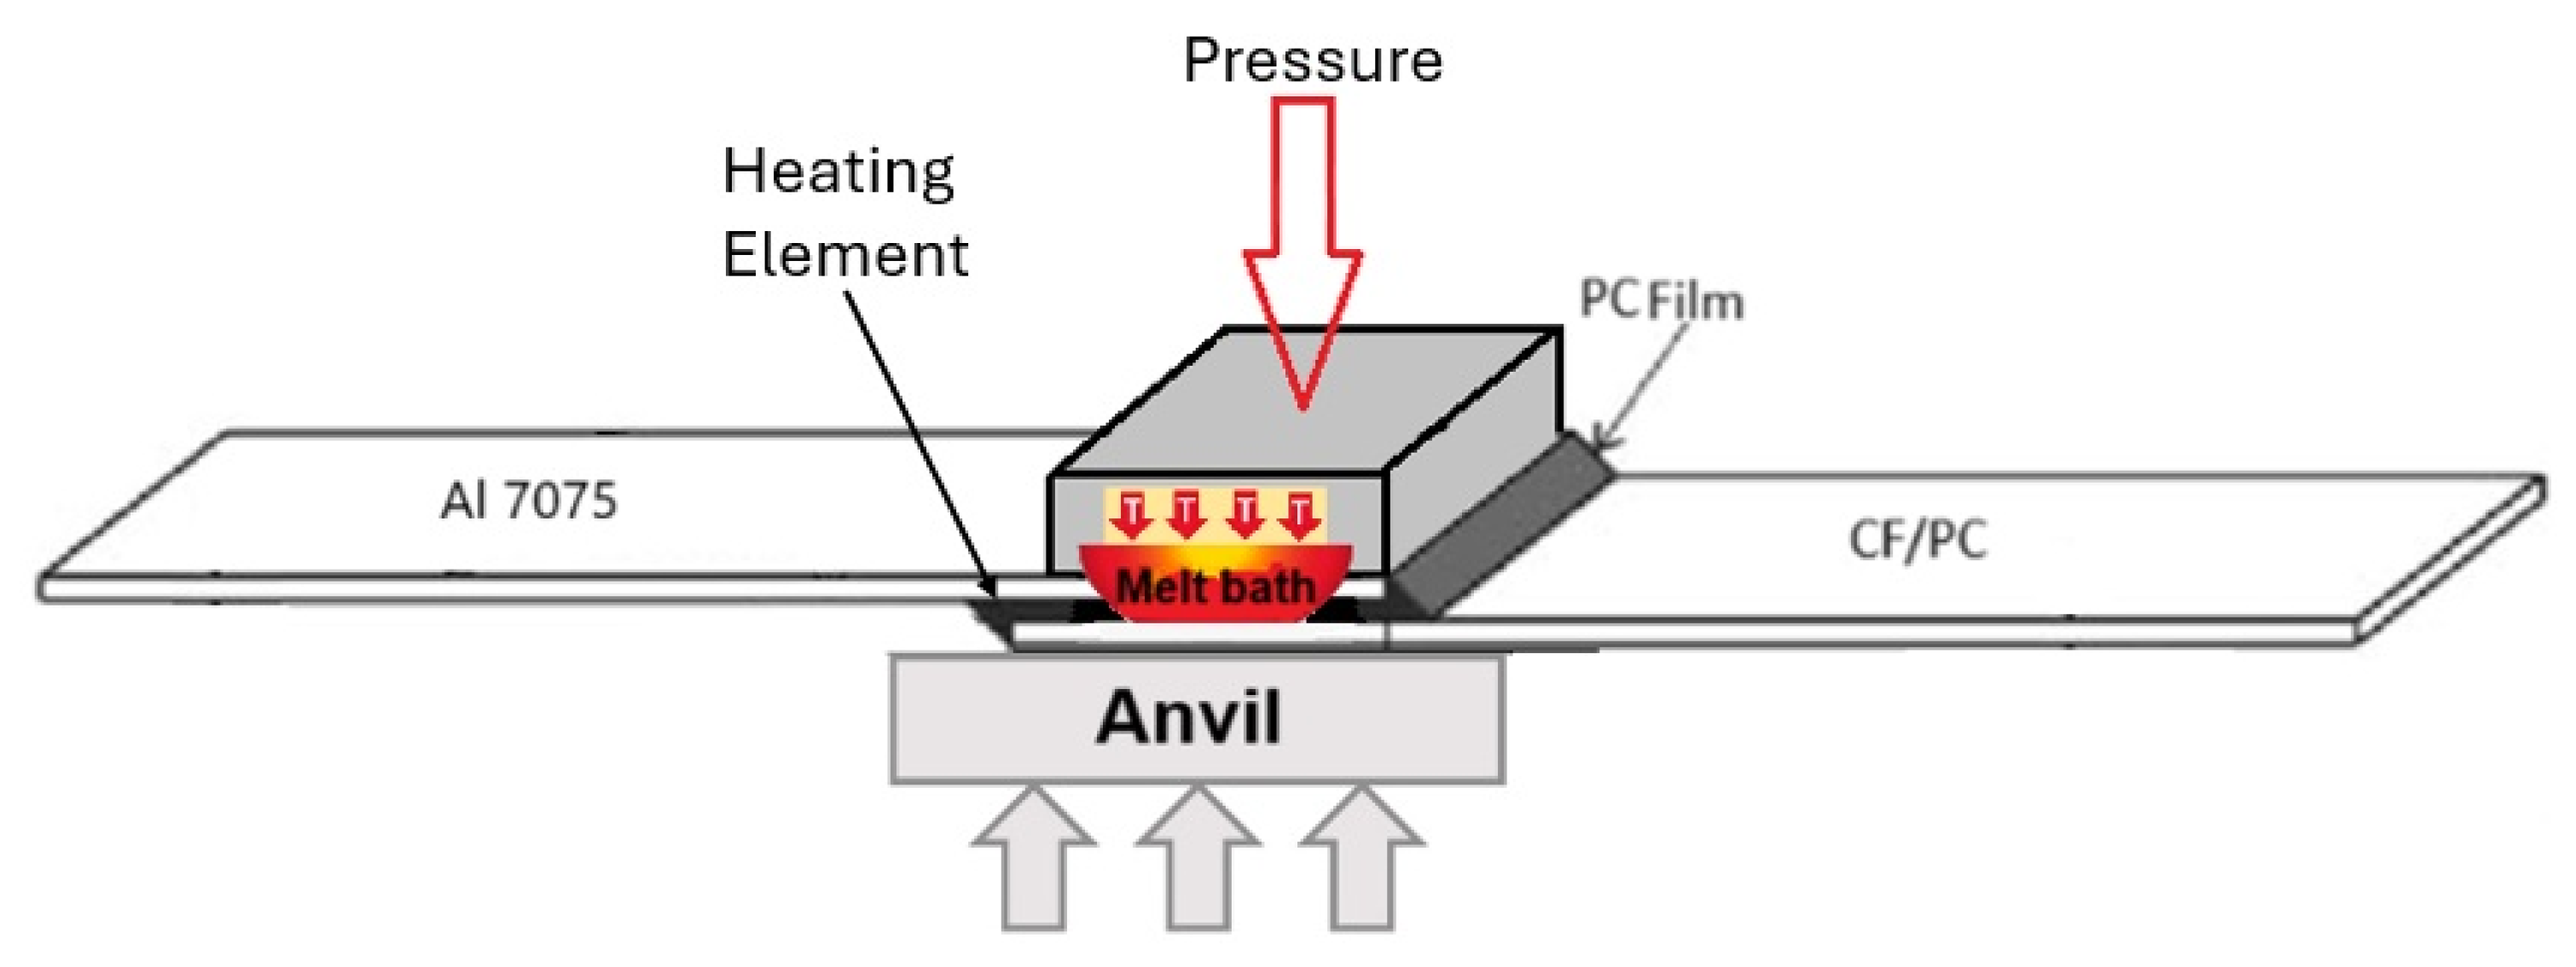
Resistance welding generates localized heat through electrical resistance to melt the material at the interface of a joint. This process follows the principles of Joule heating Q = I2Rt, as current passes through a resistive element placed between the adherends. This heating element can be a metallic mesh, carbon fibres, or a nanocomposite, each chosen based on its specific resistive properties [12]. A metal mesh tends to deliver uniform heating and a wider processing window and was chosen for this experiment. The joint comprises two components, a carbon fibre-reinforced polycarbonate (PC/CF) and aerospace grade aluminum (AL7075). A polycarbonate film is placed between these two components to facilitate the weld. The goal is to generate enough heat to melt the bonding layers and hold this state long enough to allow the PC film to integrate with the PC matrix and penetrate the aluminum surface roughness. Any excess material should be extruded. But the time should be short enough not to heat the whole laminate, and only the bonding layers, otherwise the composite internal structure will degrade. Reducing time by raising the power will result in burning the top layers and oxidizing the fibres [28,29]. For a proper diffusion, pressure application is necessary [30] (Figure 4). The pneumatic actuators apply three bars pressure to the components being joined; maintaining constant pressure is very important and might be challenging due to the thermal expansion of the heated materials, and thus, a feedback-controlled system is recommended. For the best results, the pressure value must eliminate the elastic deformation of the fibre and cause the excess of the polymer film to leak outside the bond. Excessive pressure will lead to a complete film extrusion and additional partial matrix leakage, ending in a dry bond [28,30]. The right combination of thermal energy, time, and pressure ensures quick and effective welding, with the applied pressure allowing for the extrusion of excess molten film and better bonding [12,28].
The workstation (Figure 5) is composed of the following:
  • A worktable serving as an anvil where the bonding process is performed.
  • Copper electrical connectors to supply power to the welding machine.
  • An aluminum clamp, onto which the press applies force.
  • A steel mesh to ensure uniform heating.
  • Glass fabric coated with polyimide film, serving as an insulator.
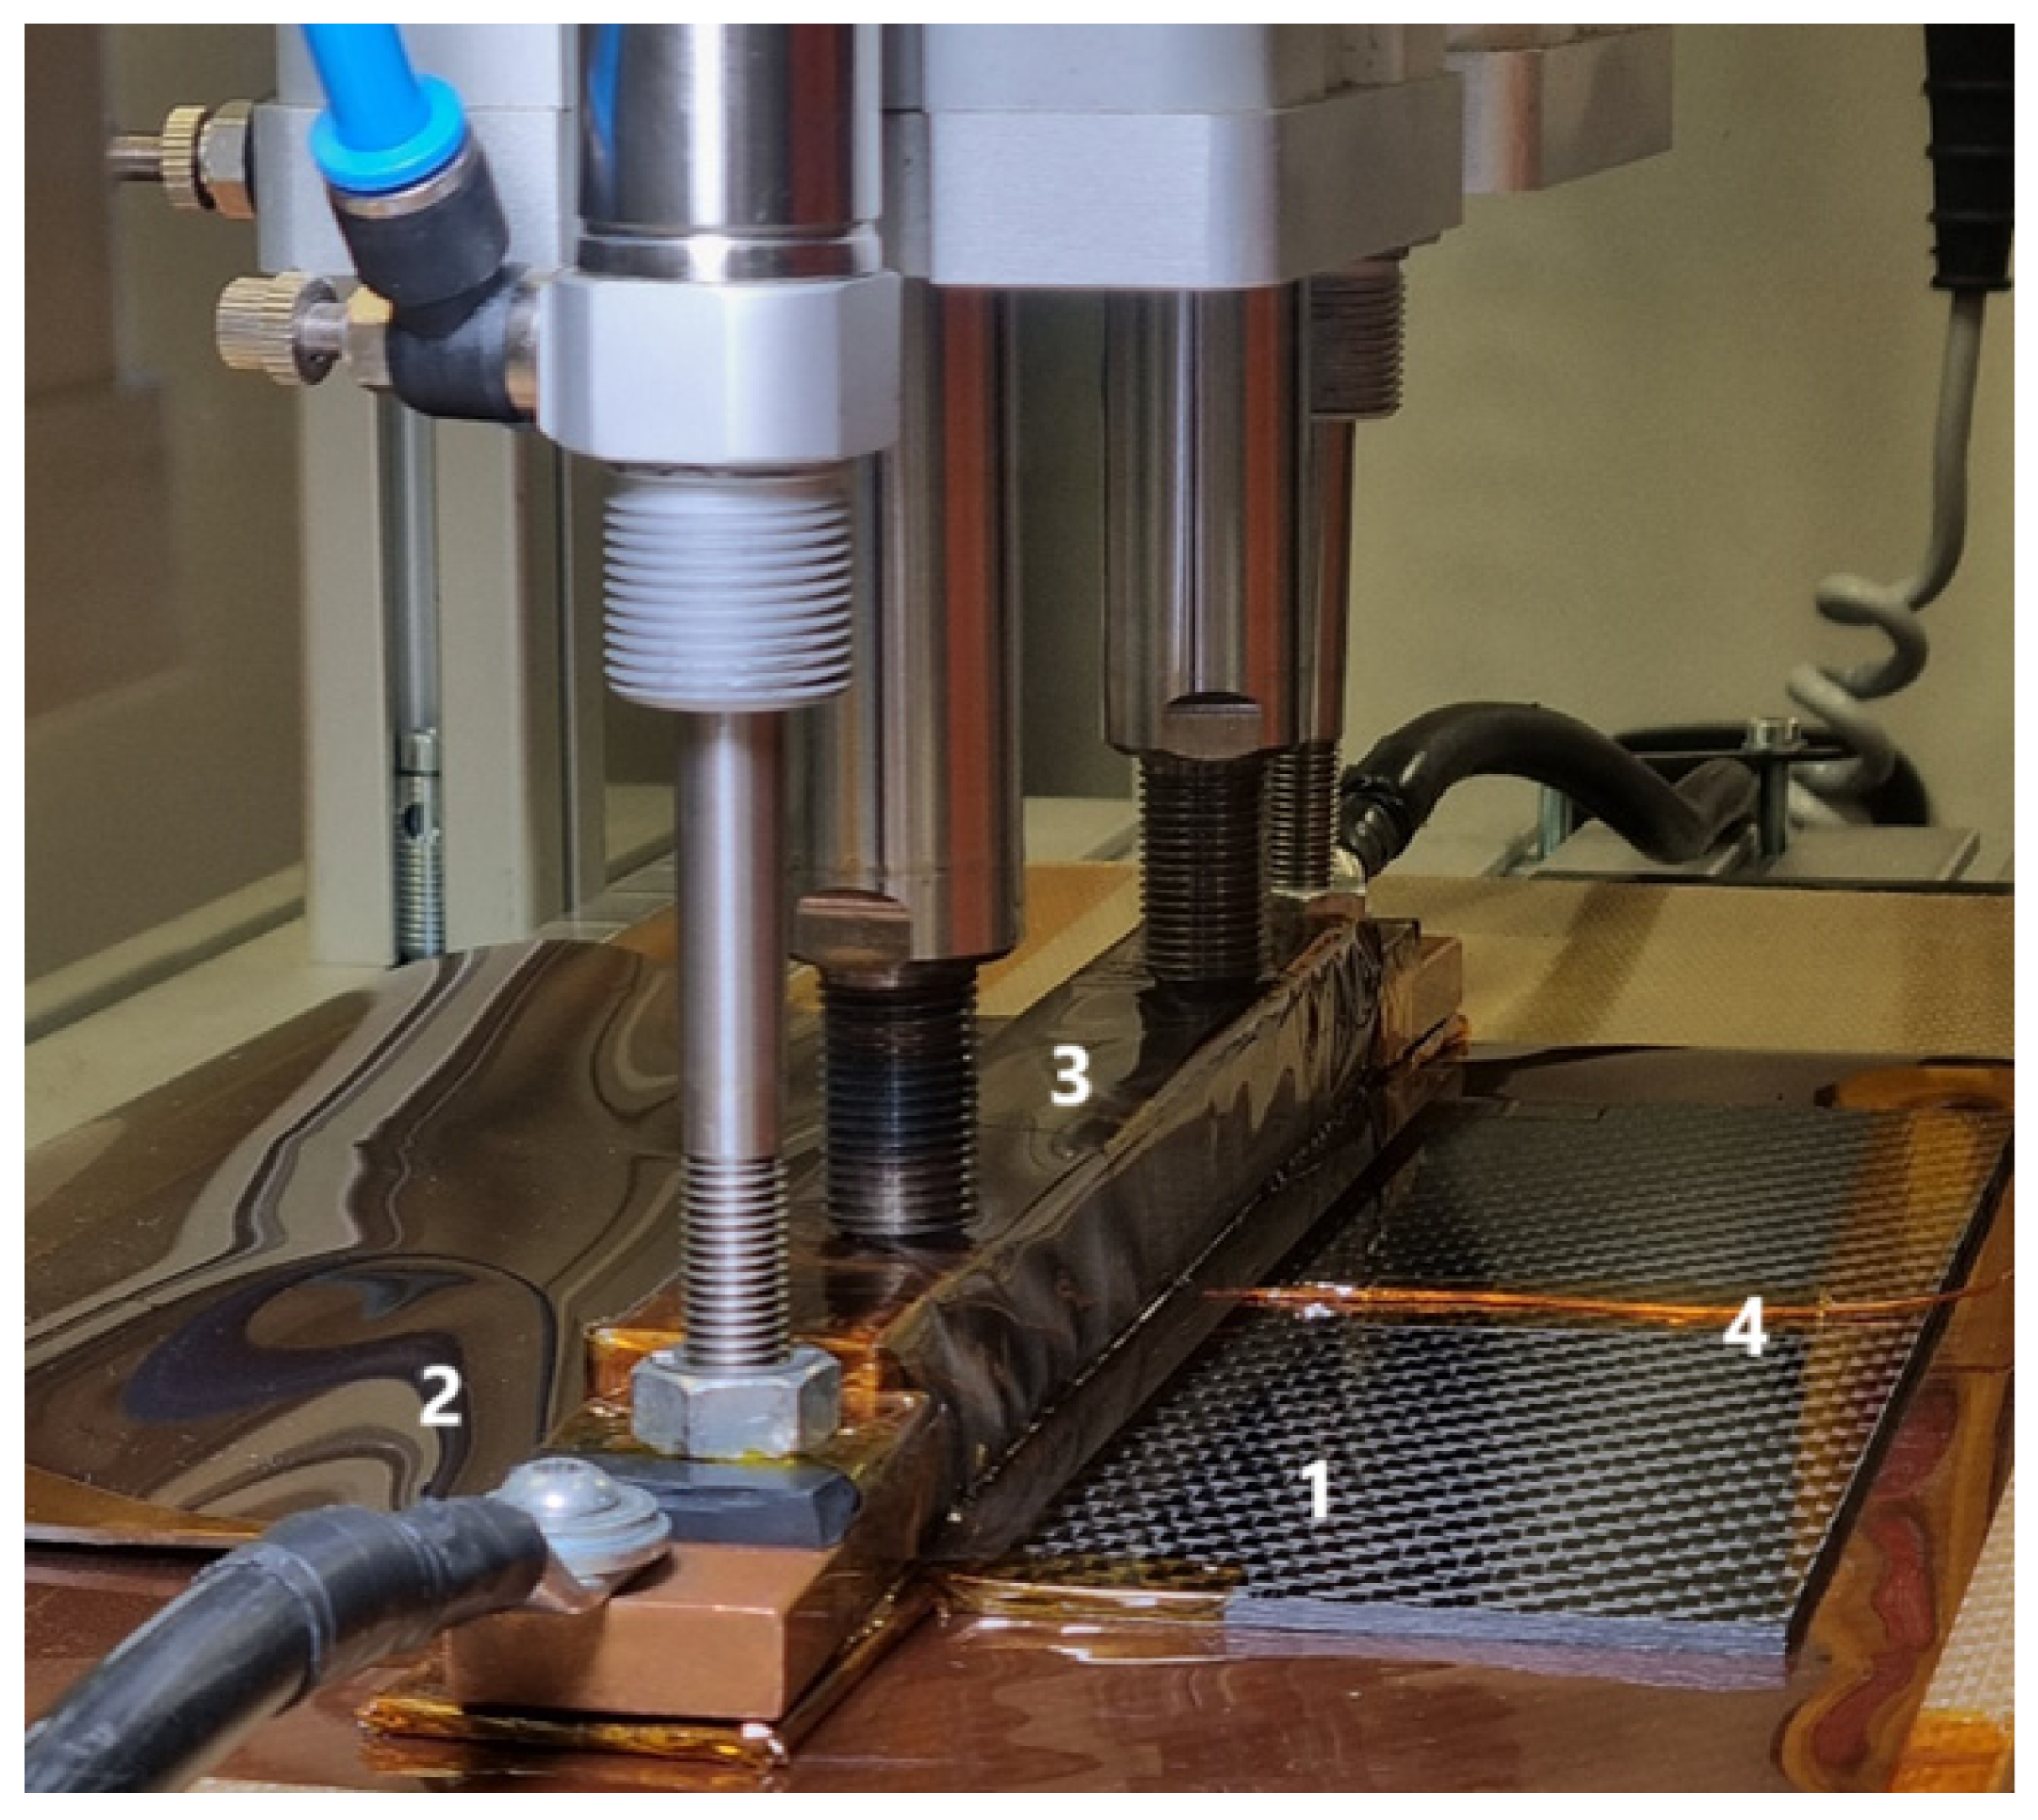
Figure 5. Welding station. 1. PC/CF composite plate, 2. aluminum plate, 3. pneumatic actuator, 4. thermocouple.
Materials 18 04962 g005
For welding PC composites with aluminum, precise control of parameters such as temperature, heating time, and pressure is crucial. The process consists of several steps:
  • Surface Preparation: Aluminum requires proper preparation to ensure good adhesion with molten polycarbonate. This includes mechanical grinding and cleaning of the surface to remove oxides and contaminants [7].
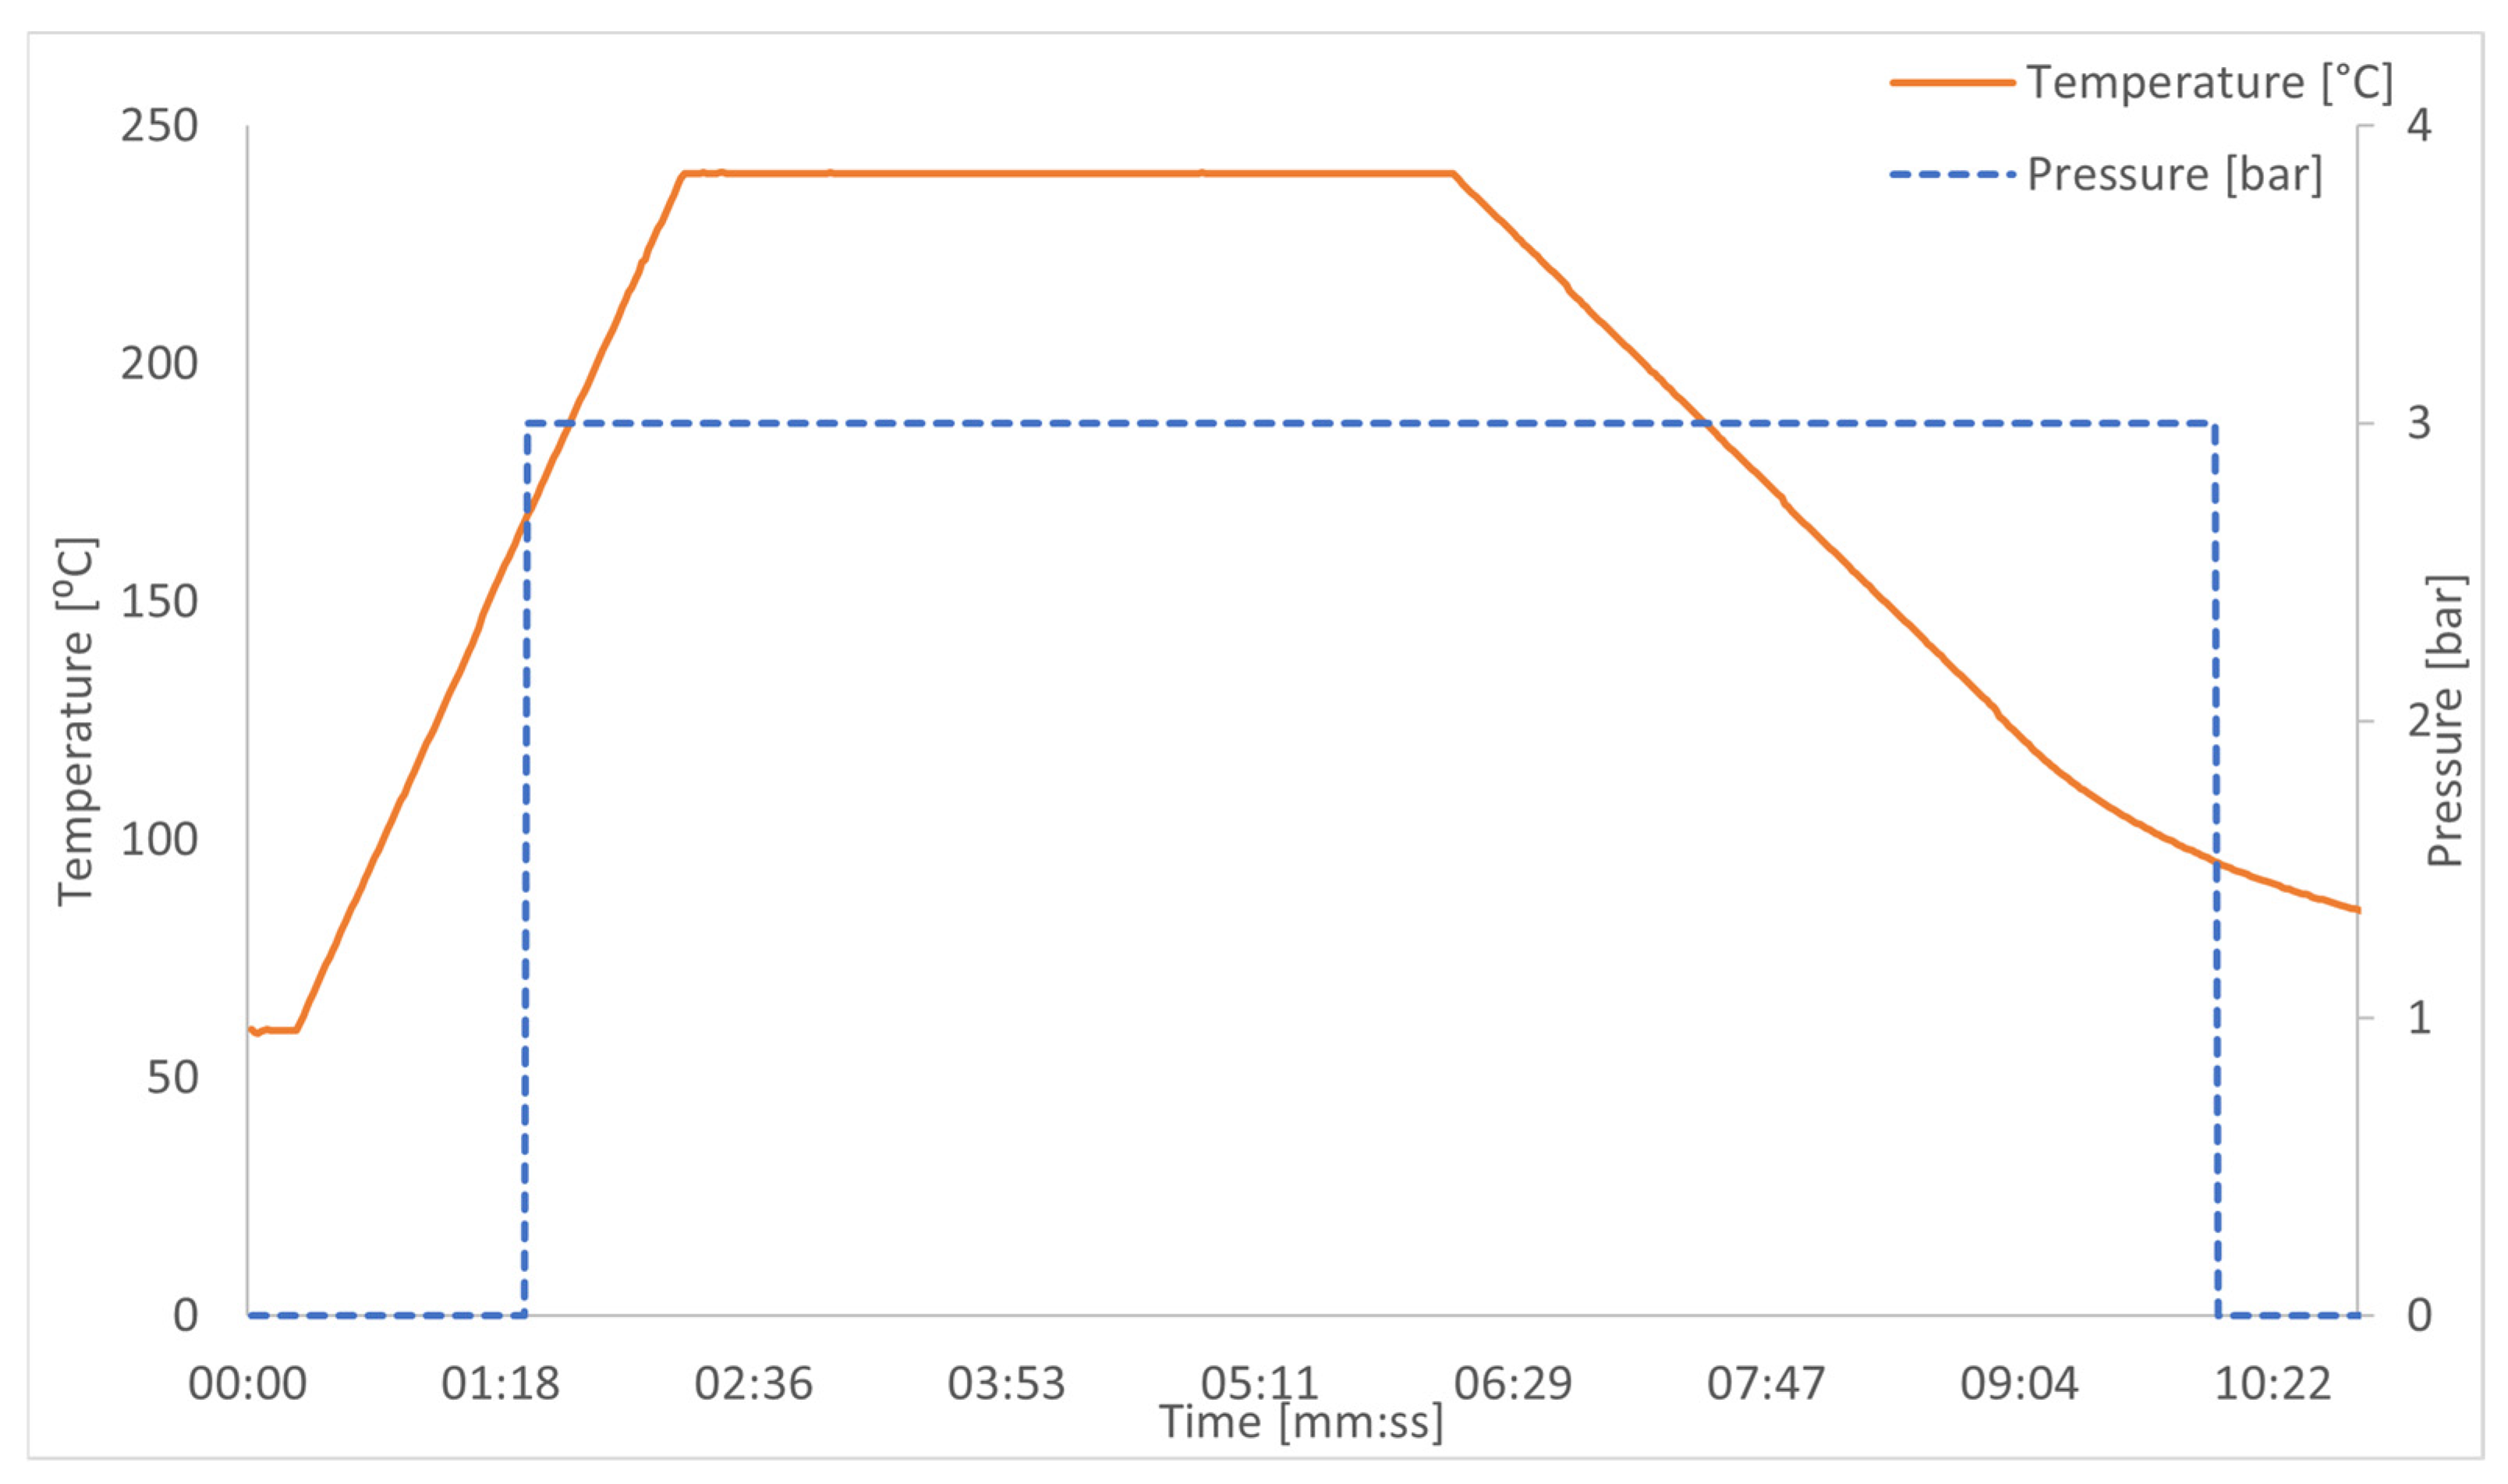
  • Setting Welding Parameters: For PC-aluminum joints, it is recommended to set the temperature in the range of 220–260 °C. Exceeding this temperature may lead to polycarbonate degradation, reducing joint strength. Optimal heating time is usually 120–200 s, depending on material thickness and applied pressure, which should be approximately 0.2–0.5 MPa (Figure 6) [7].
  • Welding: During heating, electric current flows through the resistive heating element, quickly heating the surfaces of polycarbonate and aluminum. The high temperature causes the polycarbonate to melt, bonding with the aluminum surface and forming a durable connection [7].

2.3.2. The Welding Process

During the welding process, temperature and pressure control are crucial. Examples of optimal parameters for welding PC with aluminum include the following (Figure 7):
  • Welding Temperature: 220–260 °C
  • Heating Time: 120–200 s
  • Pressure: 0.2–0.5 MPa
Figure 7. Welded plates.
Materials 18 04962 g007

2.3.3. Welded Parts

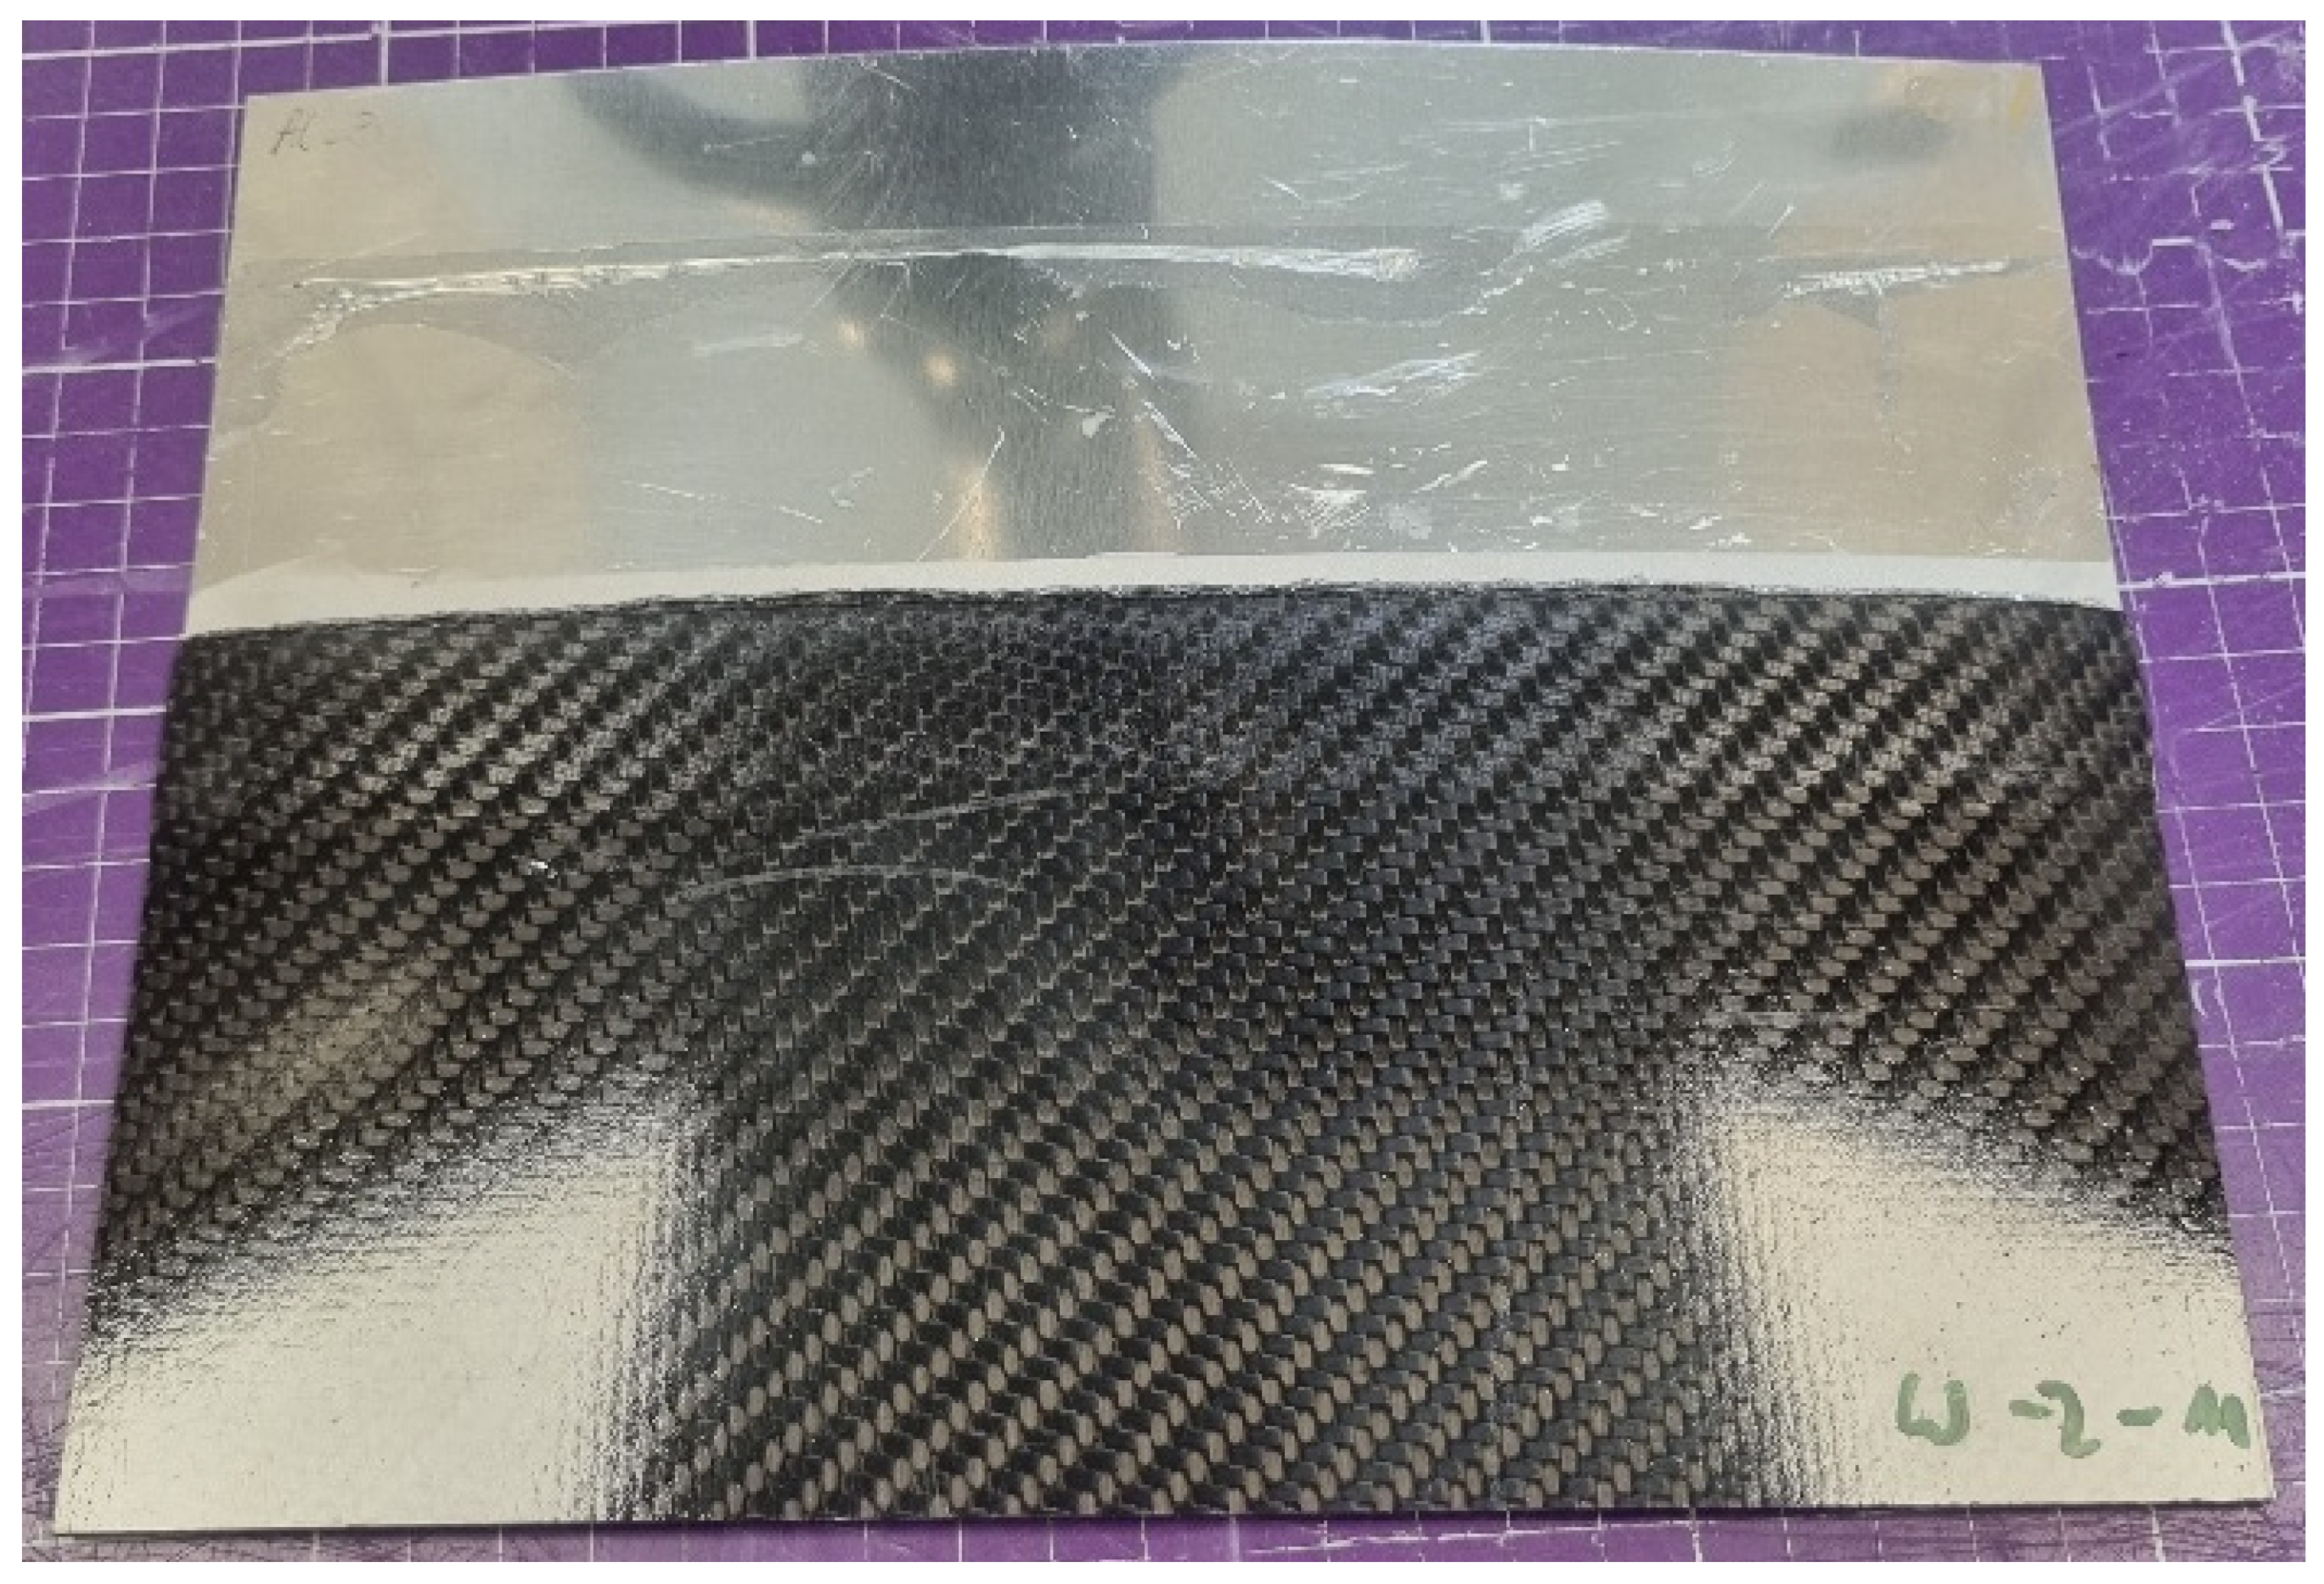
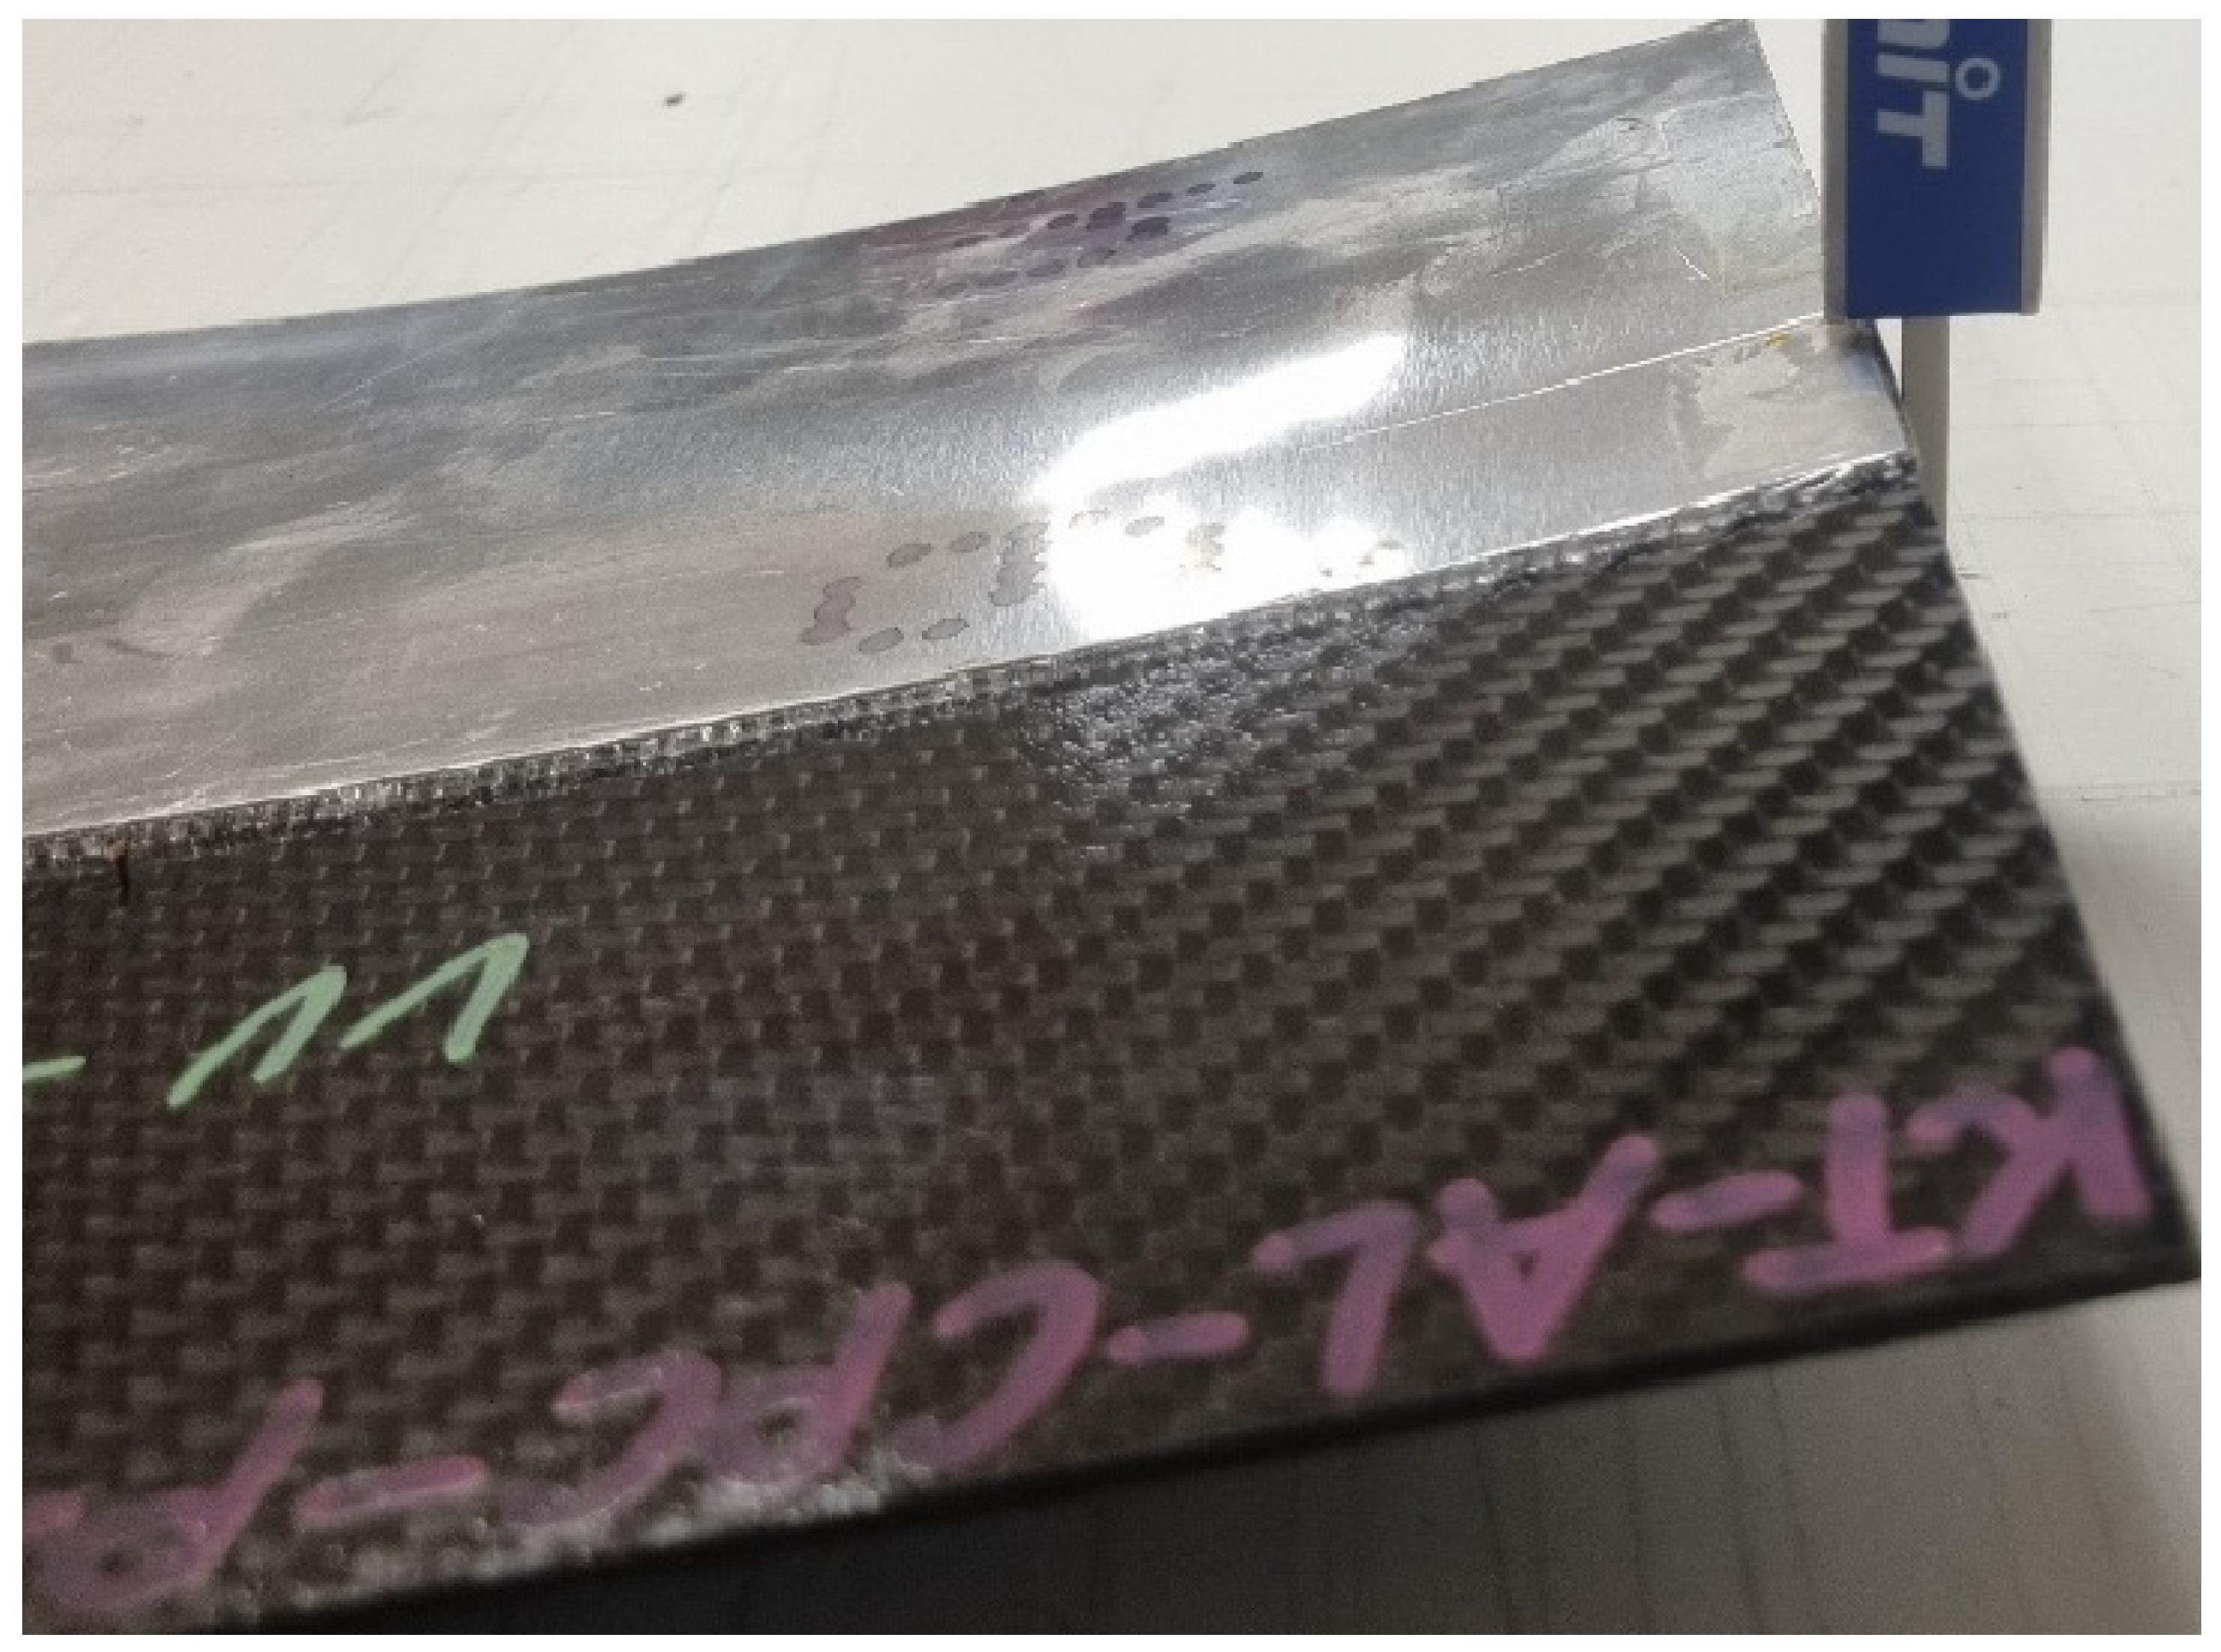
In the Lukasiewicz Research Network, Institute of Aviation, plates are joined following internally established processes. The temperature in the initial phase is raised to the flow temperature, at which point the welding process occurs. After the appropriate time, the energy supply is cut off, and the entire workstation is left to cool. Upon cooling, the effect of residual stress becomes apparent (Figure 7 and Figure 8).
Four sample joints were created. Their joint thicknesses, which varied due to the amount of extruded material, was measured. Mid-span sagitta δ over a 240 mm chord at room temperature was measured with a digital calliper (0.01 mm resolution, ±0.02 mm accuracy). Samples were supported on equal-height parallels with a straightedge defining the chord; 10 repeated measurements were taken per specimen without repositioning. The uncertainty remained within U = 0.03–0.07 mm less than 0.5% of δ and far below the specimen scatter. These values will assist in determining the stress that caused it. The joint was subjected to nondestructive testing, and the entire assembly will be cut into smaller samples for subsequent static tensile testing. Across all samples, the mean deformation ranged from 16.5 to 17.0 mm, with low scatter. The maximum coefficient of variation was 3.4%, indicating acceptable repeatability for welded joint deformation.

3. Nondestructive Testing Using Thermography

Thermography is one of the most versatile nondestructive testing methods, and the active infrared thermography was used to test the joint region for any voids or incomplete bond. Step heating was chosen because it balances depth reach and simplicity. A comparison of pulse and lock-in thermography is presented in [31,32].

3.1. Thermography Testing Using the C-CheckIR

3.1.1. The Description of the Equipment

Thermography testing was performed using the C-CheckIR mobile (AT—Automation Technology GmbH, Bad Oldesloe, Germany) inspection system developed by ECTS. This system is equipped with a thermal imaging camera and heat sources, enabling testing both in laboratory and field conditions. The setup can detect defects in composite materials, such as delamination and voids, without contacting the tested object.

3.1.2. Testing Procedure

Step heating was applied with 1.5 s excitation and 20 s observation per scan. The field of view covered the entire overlap with a 10 mm margin. Stand-off and focus were held constant for all scans. Each specimen was scanned three times without repositioning to quantify repeatability. A bare aluminum patch and the black tape reference were captured in each sequence to check emissivity and reflections. All scans were performed with the CFRP side up.

3.2. Sample Preparation

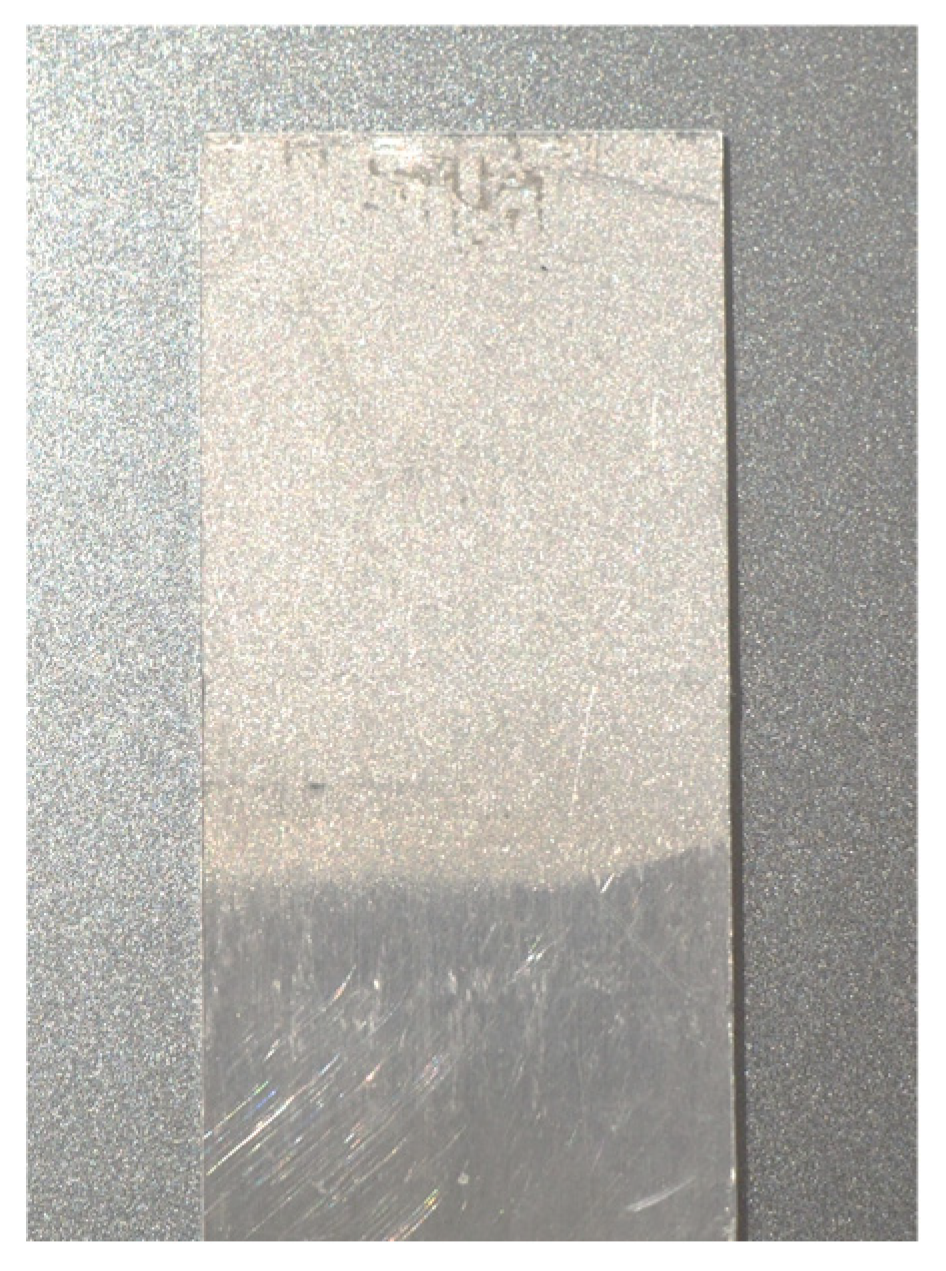
Welded plates were cut into smaller specimens and prepared for testing (Figure 9). Each sample was cleaned to minimize the impact of contaminants on the results.

3.3. Results

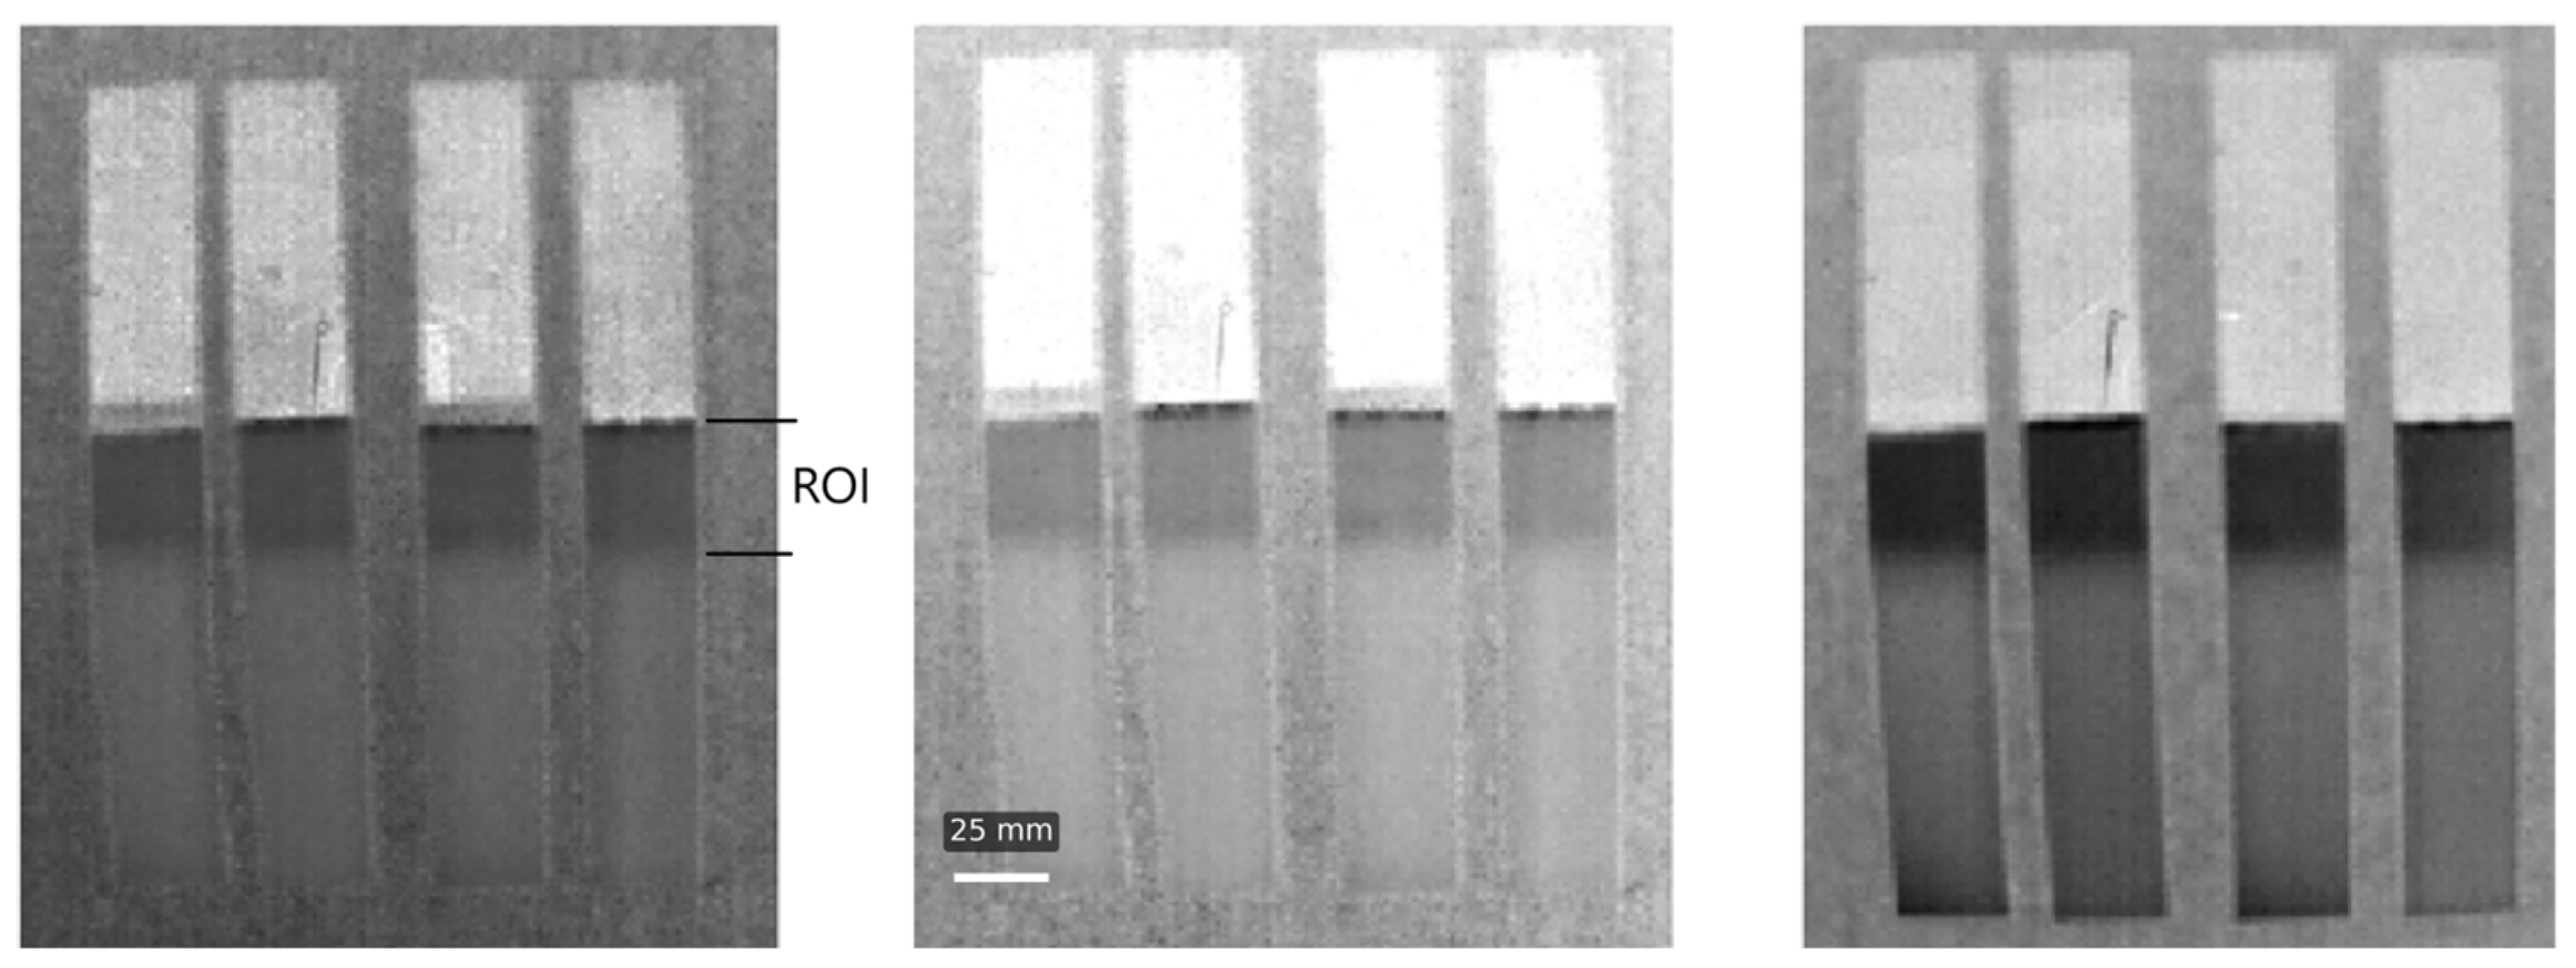
For each specimen, three scans were made, a weld scan was accepted when no voids lager than 1 mm were detected, normalized contrast (Cnorm) remained under 6 in the overlap region, and no visible discontinuities at the edge area were observed.
Thermographic testing is a great method for finding any voids or other material discontinuities inside specimens. Like any other method this one also comes with its own limitations, namely, the camera resolutions. These are usually too small to detect micropores, which might appear in large numbers, but each individual has a fraction of a millimetre in diameter. If such defects exist, they reduce the effective cross-sectional area of the bond and influence the structural performance of the joint [33]. High precision NDT methods were not within the scope of this work. The joint quality assessment is presented by the method described above and illustrated in (Figure 10).
In the figures above the alloy plate, carbon fibre plate and the lap joint in the middle with its darkest colour can be distinguished. What we are looking for during the thermograph test are any lighter spots within the joint, these would present any discontinuities or air bubbles trapped inside. Such voids raise the driving factors behind the crack initiation, and after initiations helps the propagation by connecting the path between neighbouring pores [34]. A homogeneous dark tone of the lap indicates that full contact has been achieved and both plates are welded correctly.

4. Analytical Considerations of the Residual Stress in a Joint

Before conducting finite element simulations, it is good practice to perform simplified hand calculations. This practice should deliver rough estimates of what should appear in the numerical analysis.

4.1. Normal Stress

For a welded single-lap PC/CF–Al overlap, the cooled part behaves as a bi-material strip. When this strip is uniformly heated along its entire length, it will bend or deform into an arc of a circle with a radius of curvature, the value of which, is dependent on the geometry and material components making up the strip. This behaviour is the result of a thermal expansion coefficient mismatch. And the subsequent deflection curvature can be estimated using classic Timoshenko, here a Roark’s Formula for Stress and Strain which tabulates engineering forms for thermal curvature and thermal-flexure stress [35] was considered. With these formulas and using the input data presented in Table 2 we can predict the sign and magnitude of curvature κ, the mid-span bow δ, and the membrane stress.
The curvature can be calculated using
κ = 6 α b α a T t a + t b t b 2 4 + 6 r + 4 r 2 + E a E b r 3 + E b E a r 1 , r = t a t b
δ = κ L 2 8
Shear stress is expressed by
σ x x , i ( z ) = E i ( ε 0 + κ z α i T )

4.2. Results and Conclusions

When Z axis begins at the bond interface and is defined towards the PC/CF laminate (Figure 11), the curvatures negative value informs us that the aluminum layer shrinks more upon cooling, bending the strip towards the aluminum face. The negative σ x x indicates that the system is in a compressive state after cooling. Full results are presented in Table 3.
The bow δ value for the ΔT = 240 °C is very close to the measured values of the welds; however, these measured values remained unaffected by temperature (Table 3).
Why do the calculated and measured deflection not match? Resistance welding concentrates heat very locally at the bonding interface, under the addition of three bars of pressure. The effective temperature gradient remains mostly in the welded area, meaning the cooling dependent deformation is strongest at the joint area [30,38]. Around the Tg, polycarbonate experiences full stress relaxation and recovery, which means the thermal mismatch above this point does not contribute to the deformation [39].

5. Numerical Model

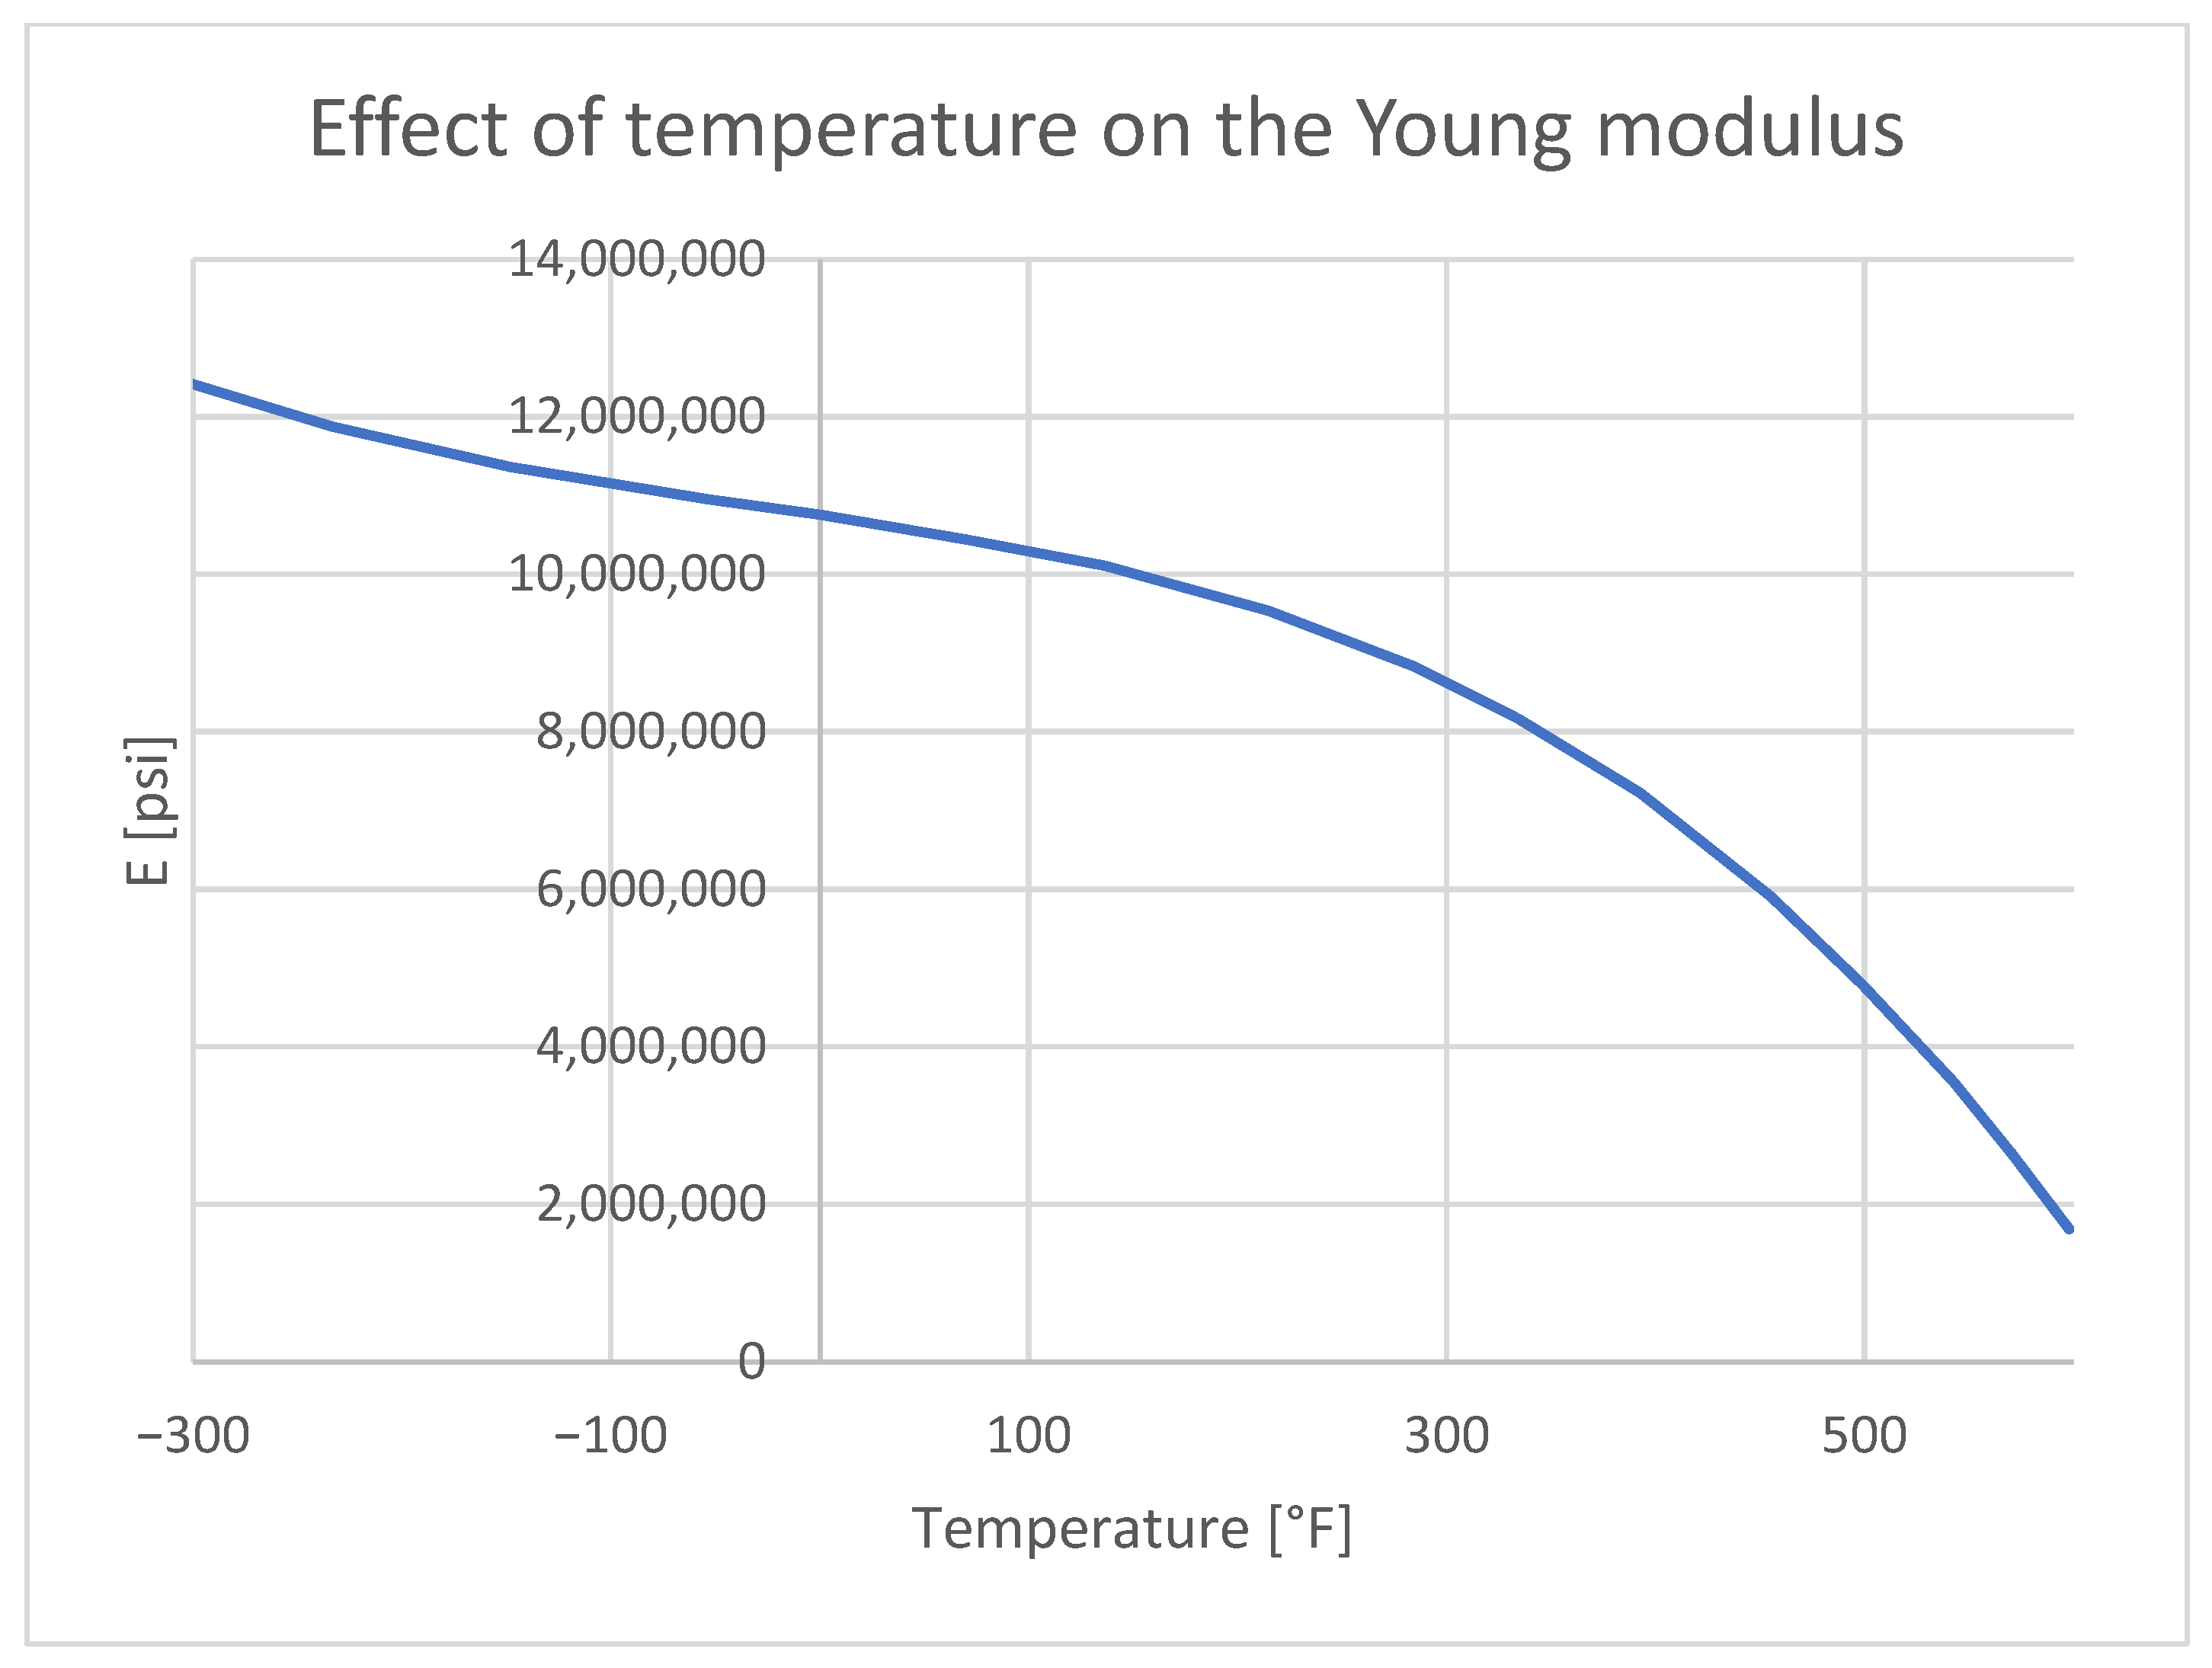
To obtain reliable stress results in thermal analysis, it is essential to introduce detailed material property cards. Materials with non-linear characteristics, with temperature-dependent values, are crucial for achieving accurate results. Below are the characteristics of the input thermal conductivity (Figure 12) and Young’s modulus (Figure 13).
The following graph illustrates how effectively heat moves through a given material when there is a temperature difference between its two sides. The higher the thermal conductivity, the better the material’s ability to transfer heat. This relationship is described by the Fourier’s Equation (4) [40].
q = λ d T d x
Figure 12. The effect of temperature on the conductivity of aluminum 7075 [41].
Materials 18 04962 g012
Figure 13. The effect of temperature on the Young modulus on aluminum 7075 [41].
Materials 18 04962 g013
Specific Heat C (Equation (5)) describes the amount of heat required to raise the temperature of a unit mass of a given material by 1 degree Celsius (or 1 Kelvin). It is a measure of a substance’s capacity to store thermal energy.
C = Q m T
The thermal expansion of aluminum (Figure 14) and its variation with temperature play a direct role in the formation of thermal stress, which subsequently lead to residual stress after bonding. The specific heat impacts the materials temperature change in time, introducing the temperature dependent graph allows a more accurate temperature distribution (Figure 15).
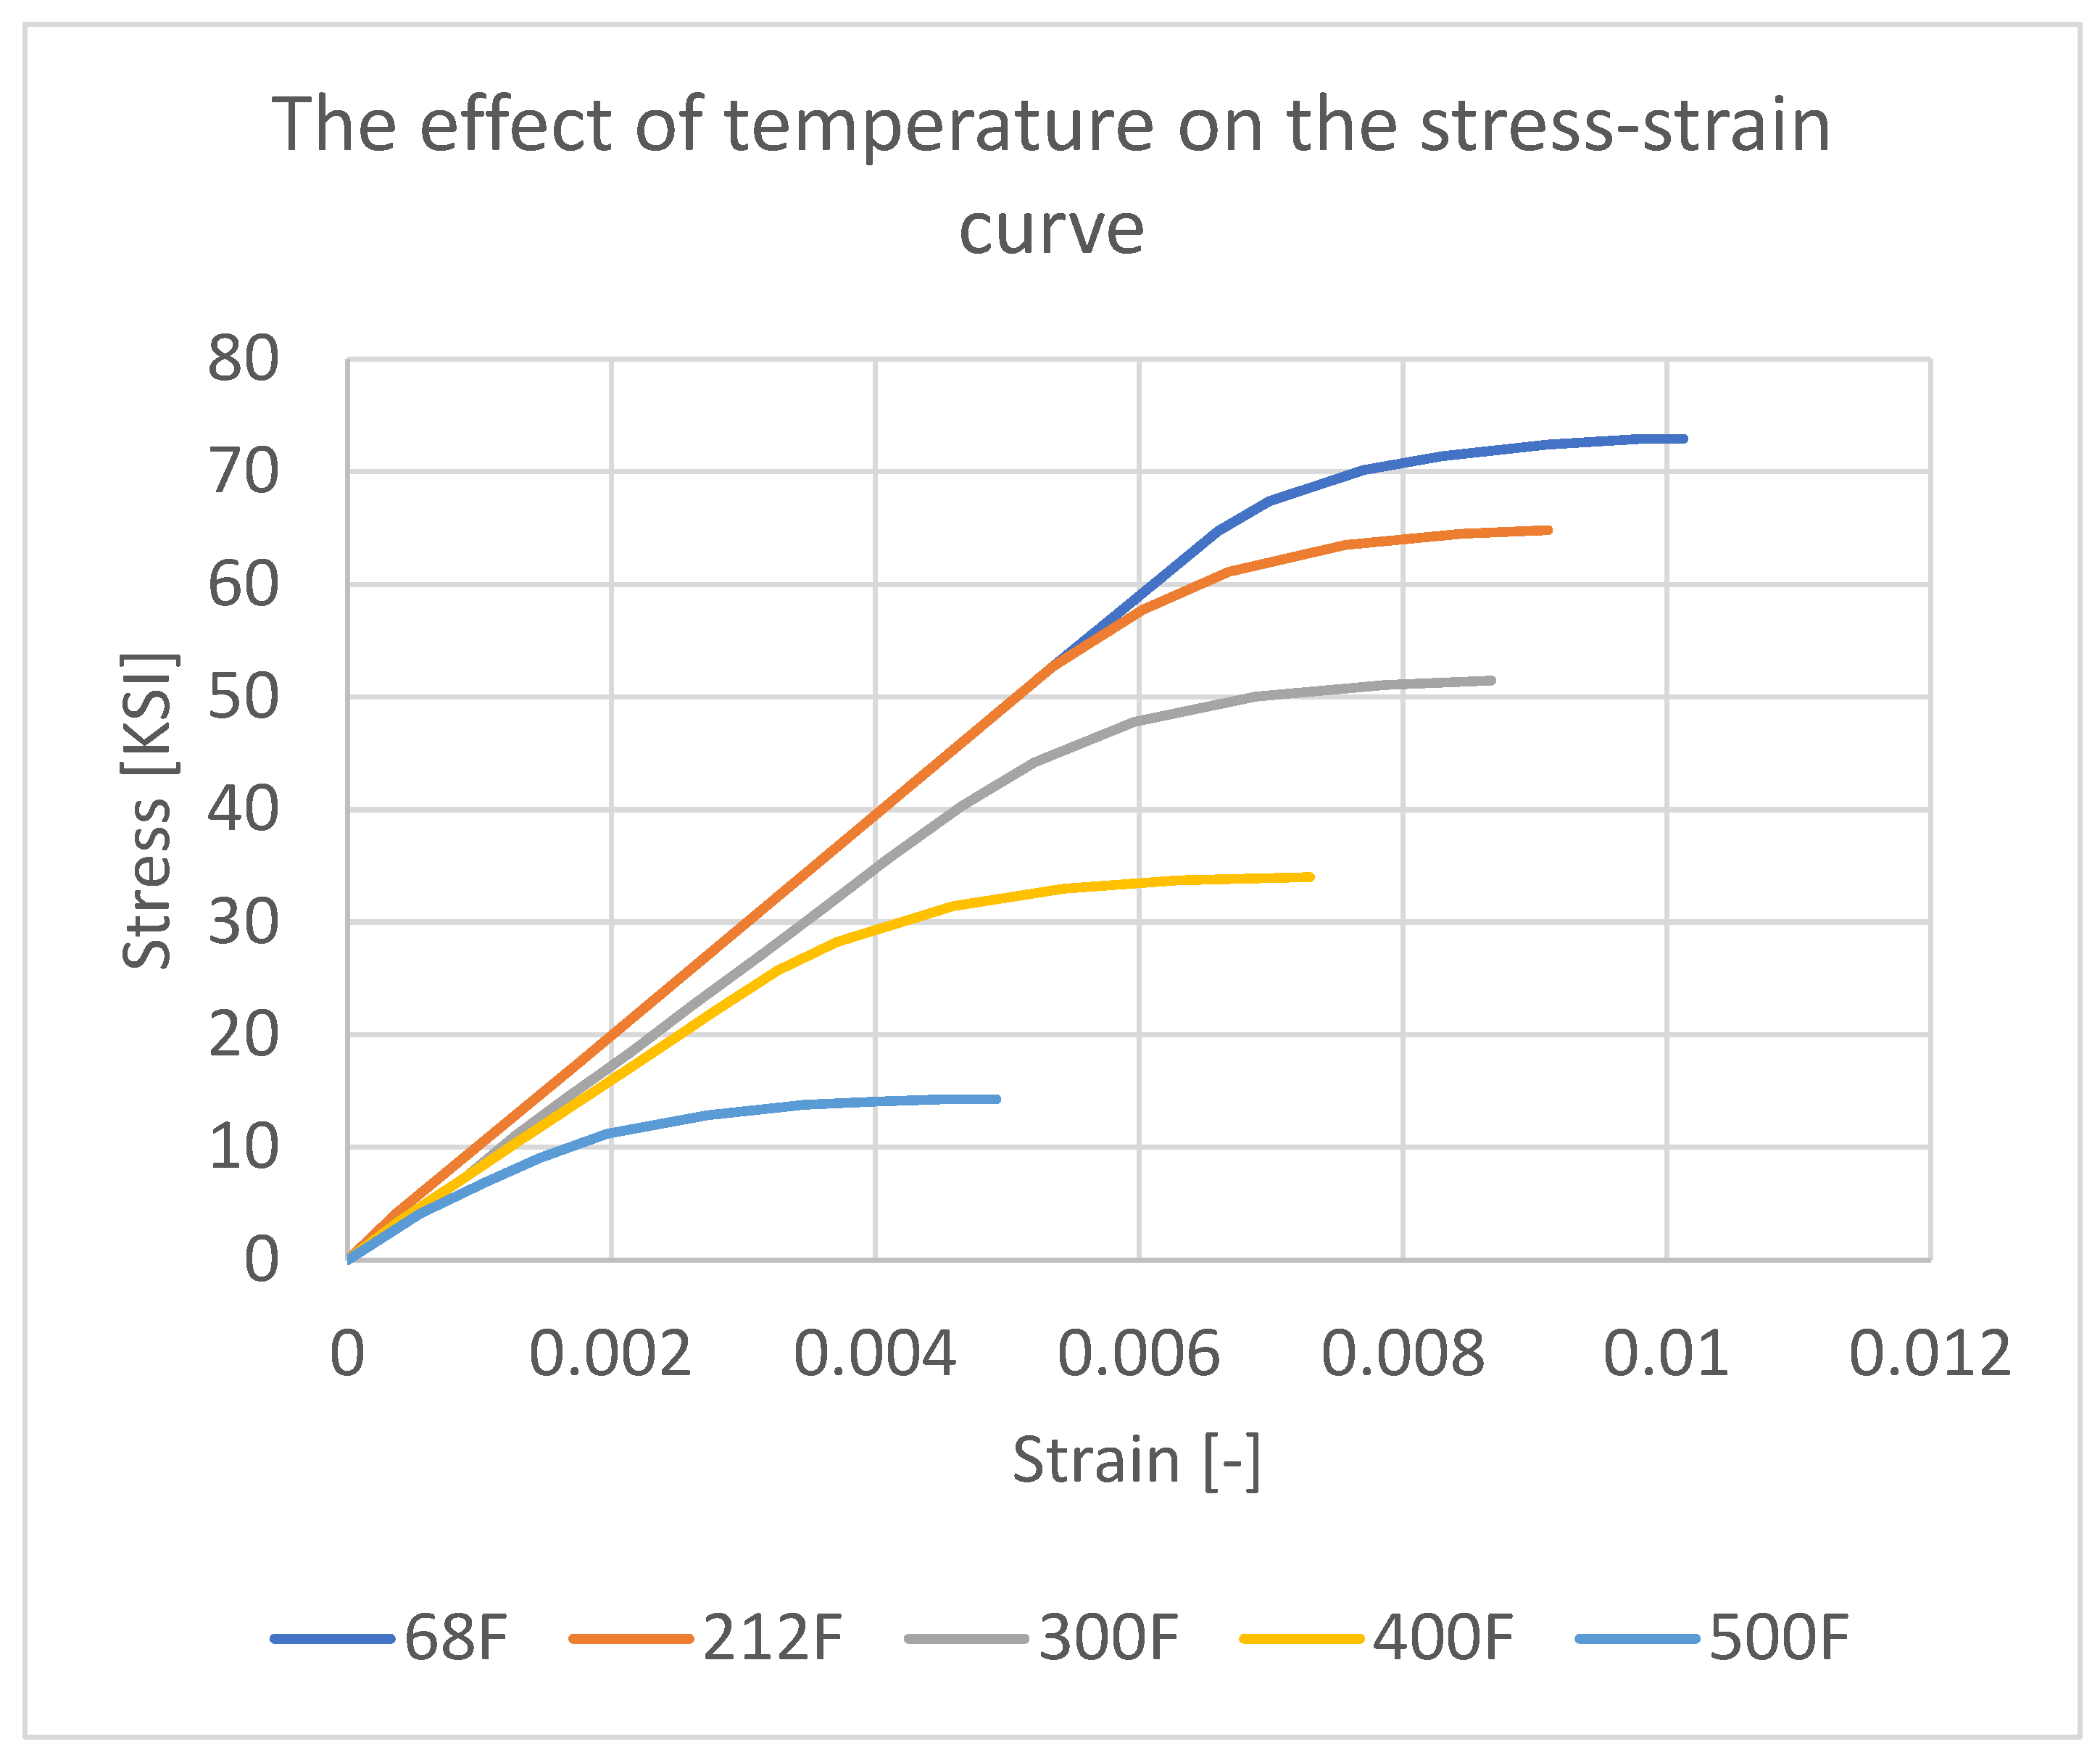
At elevated temperatures, aluminum enters the plastic range (Figure 16) under lower stress levels. The implemented material property cards account for the possibility of permanent deformation of aluminum.
Consistent with ISO 11359-2 [42], CTE in polymers is defined for the solid state, and above Tg the material experiences complete stress relaxation and enters a softening/viscoelastic flow rather than a typical thermal expansion expressed by a coefficient. Vendors likewise specify CF/PC with a single room temperature CTE (e.g., 5 × 10⁻⁶ [°C−1] for TECATEC PC CW50—the laminate used here), so we model CF/PC with a constant effective CTE calibrated at room temperature for the welded laminate [42]. Figure 17 shows the correlation between temperature and carbon fibre-reinforced polymer matrix, which helps with understanding how the CTE reacts to temperature; the chaotic line, however, is hardly usable for simulation purposes. At first the material properties in the simulations were correlated with the datasheet provided by the distributor (Table 4); however, as indicated in Section 4.1., for these properties, especially, the most important one, the CTE did not correlate with the measured deflections. Hence, the implemented PC/CF properties were adjusted with the findings in [36,37].
The bonding material used is polycarbonate, an amorphous thermoplastic with excellent mechanical properties (Table 5), especially its impact resistance [27]. The key aspect of the study was leveraging the thermoplastic properties of polycarbonate by placing a 0.2 mm thick film (Figure 18 and Figure 19) between an aluminum plate and a PC/CF composite plate, followed by heating the joint area to the polycarbonate’s flow temperature of around 260 °C. As the polycarbonate film and the polycarbonate matrix in the laminate melt, they mix and penetrate the roughness of the mechanically prepared aluminum joint surface, forming a durable bond.
The challenge of this process is the difference in thermal expansion between the two materials. During heating to the flow temperature of polycarbonate, the materials expand and bond together. However, upon cooling to room temperature, the materials attempt to return to their original shapes, which is hindered by the weld, resulting in the formation of residual stress. This residual stress is the focus of this study.
The weld parameters, its behaviour under stress, and deformation due to temperature are influenced by the characteristics described below. These were defined in the Mechanical APDL environment.
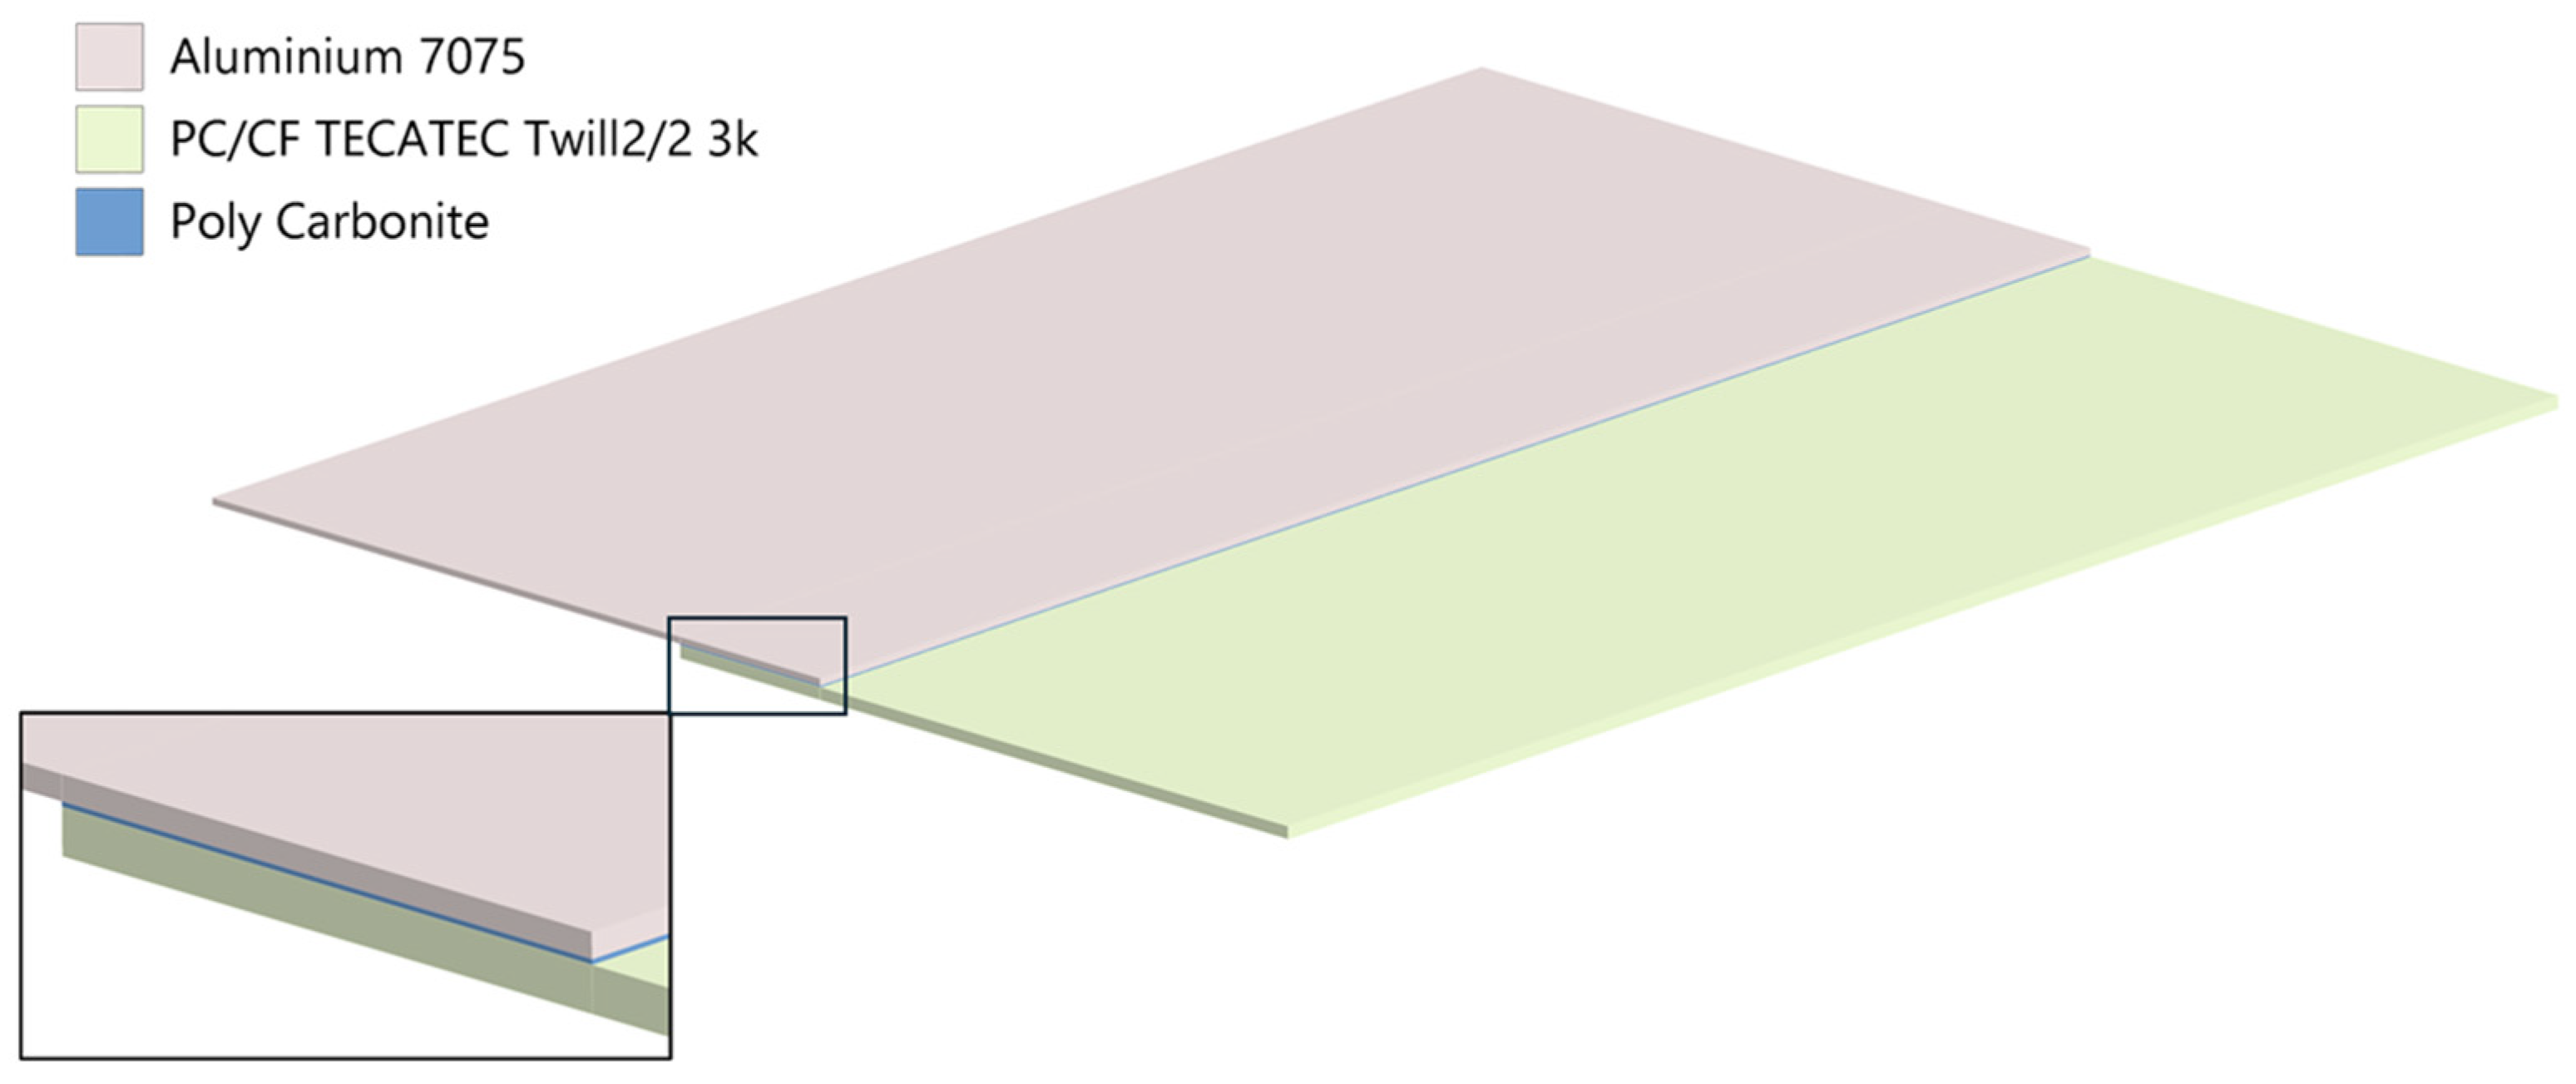
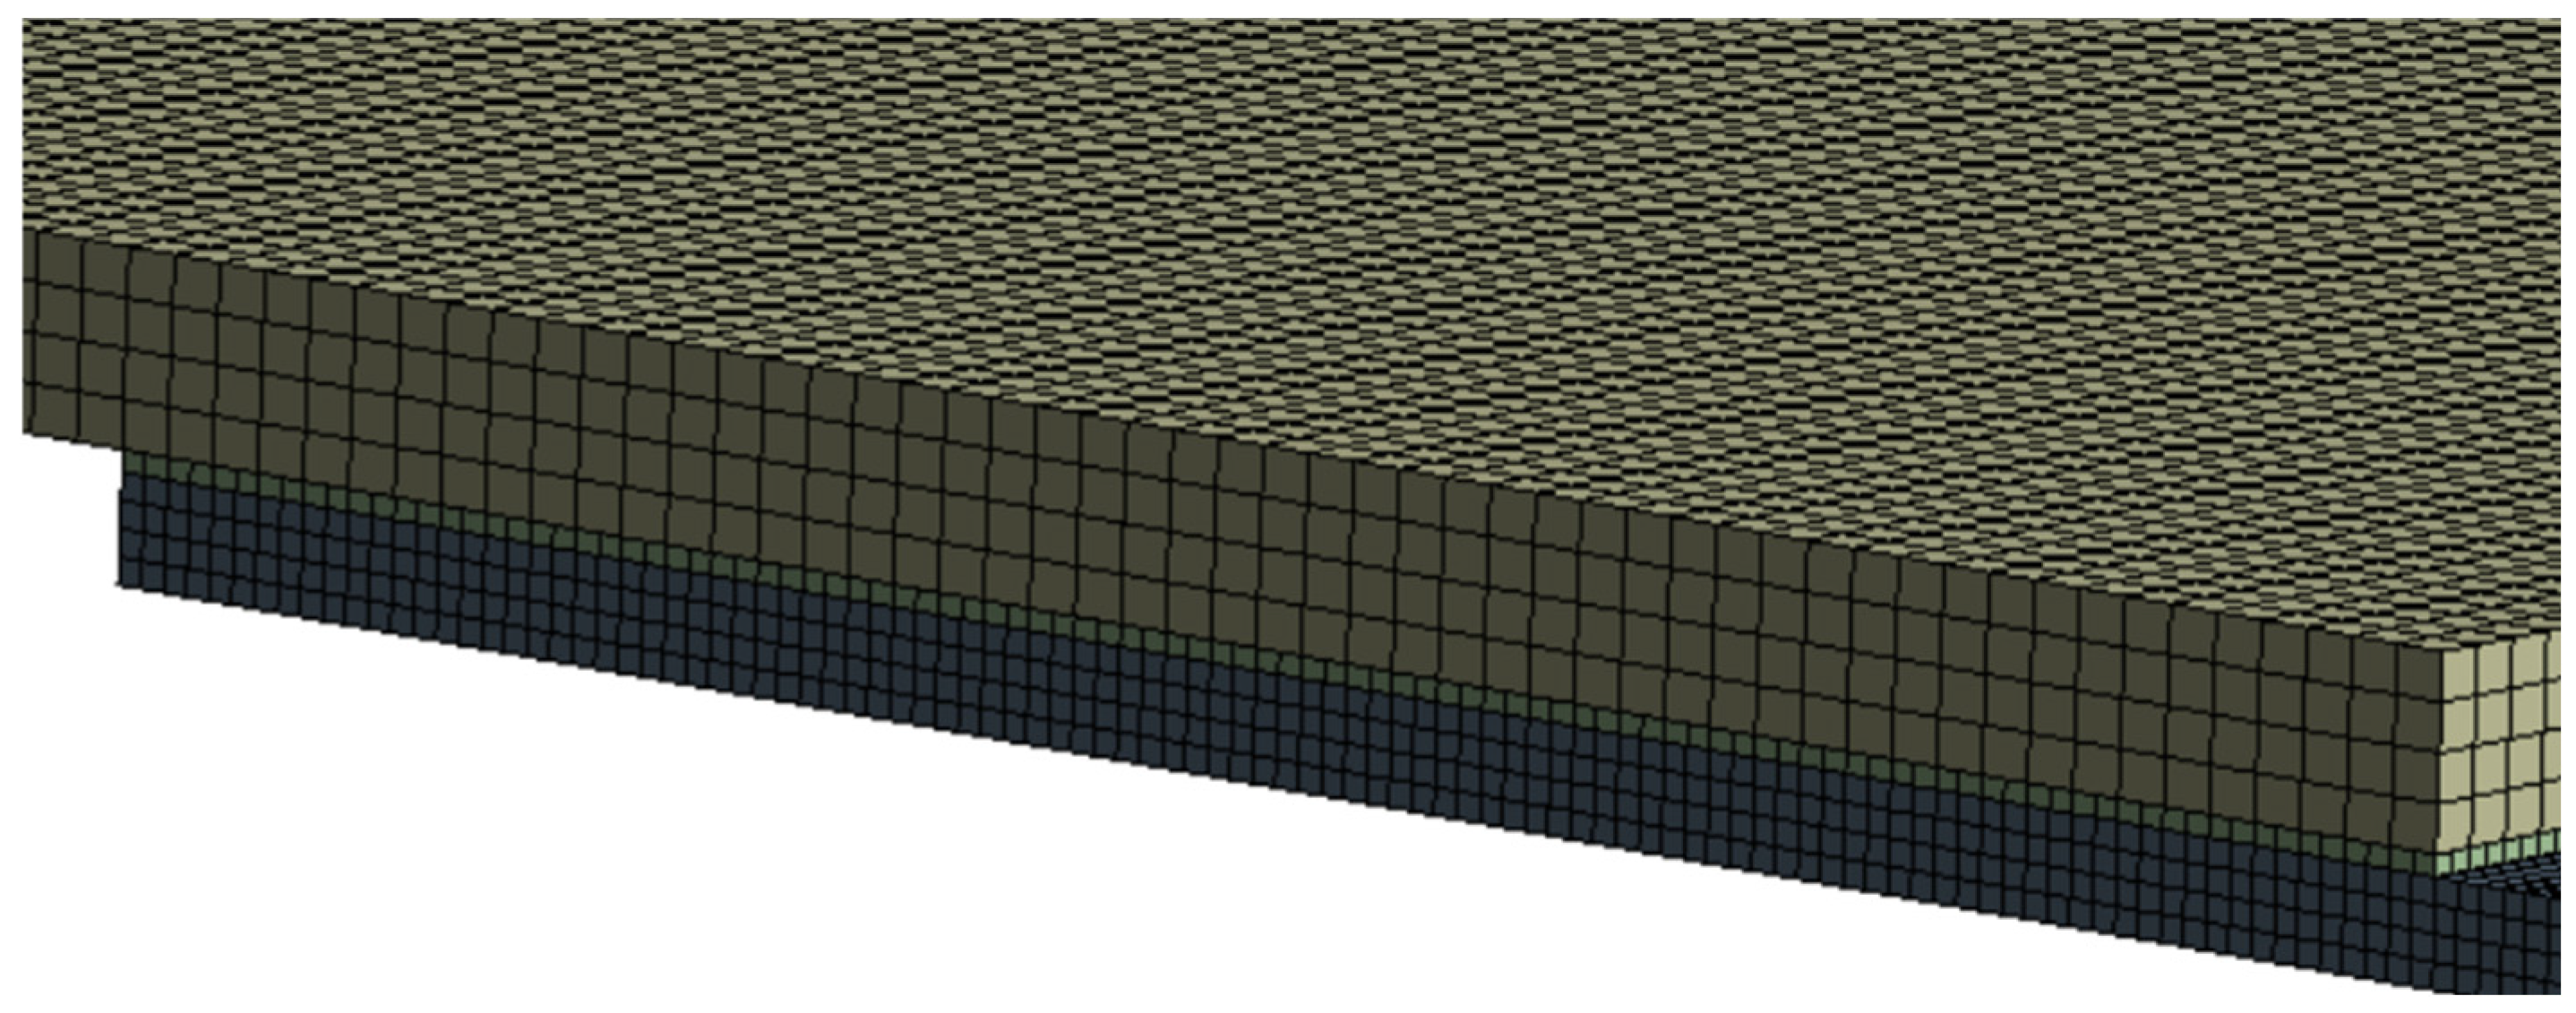
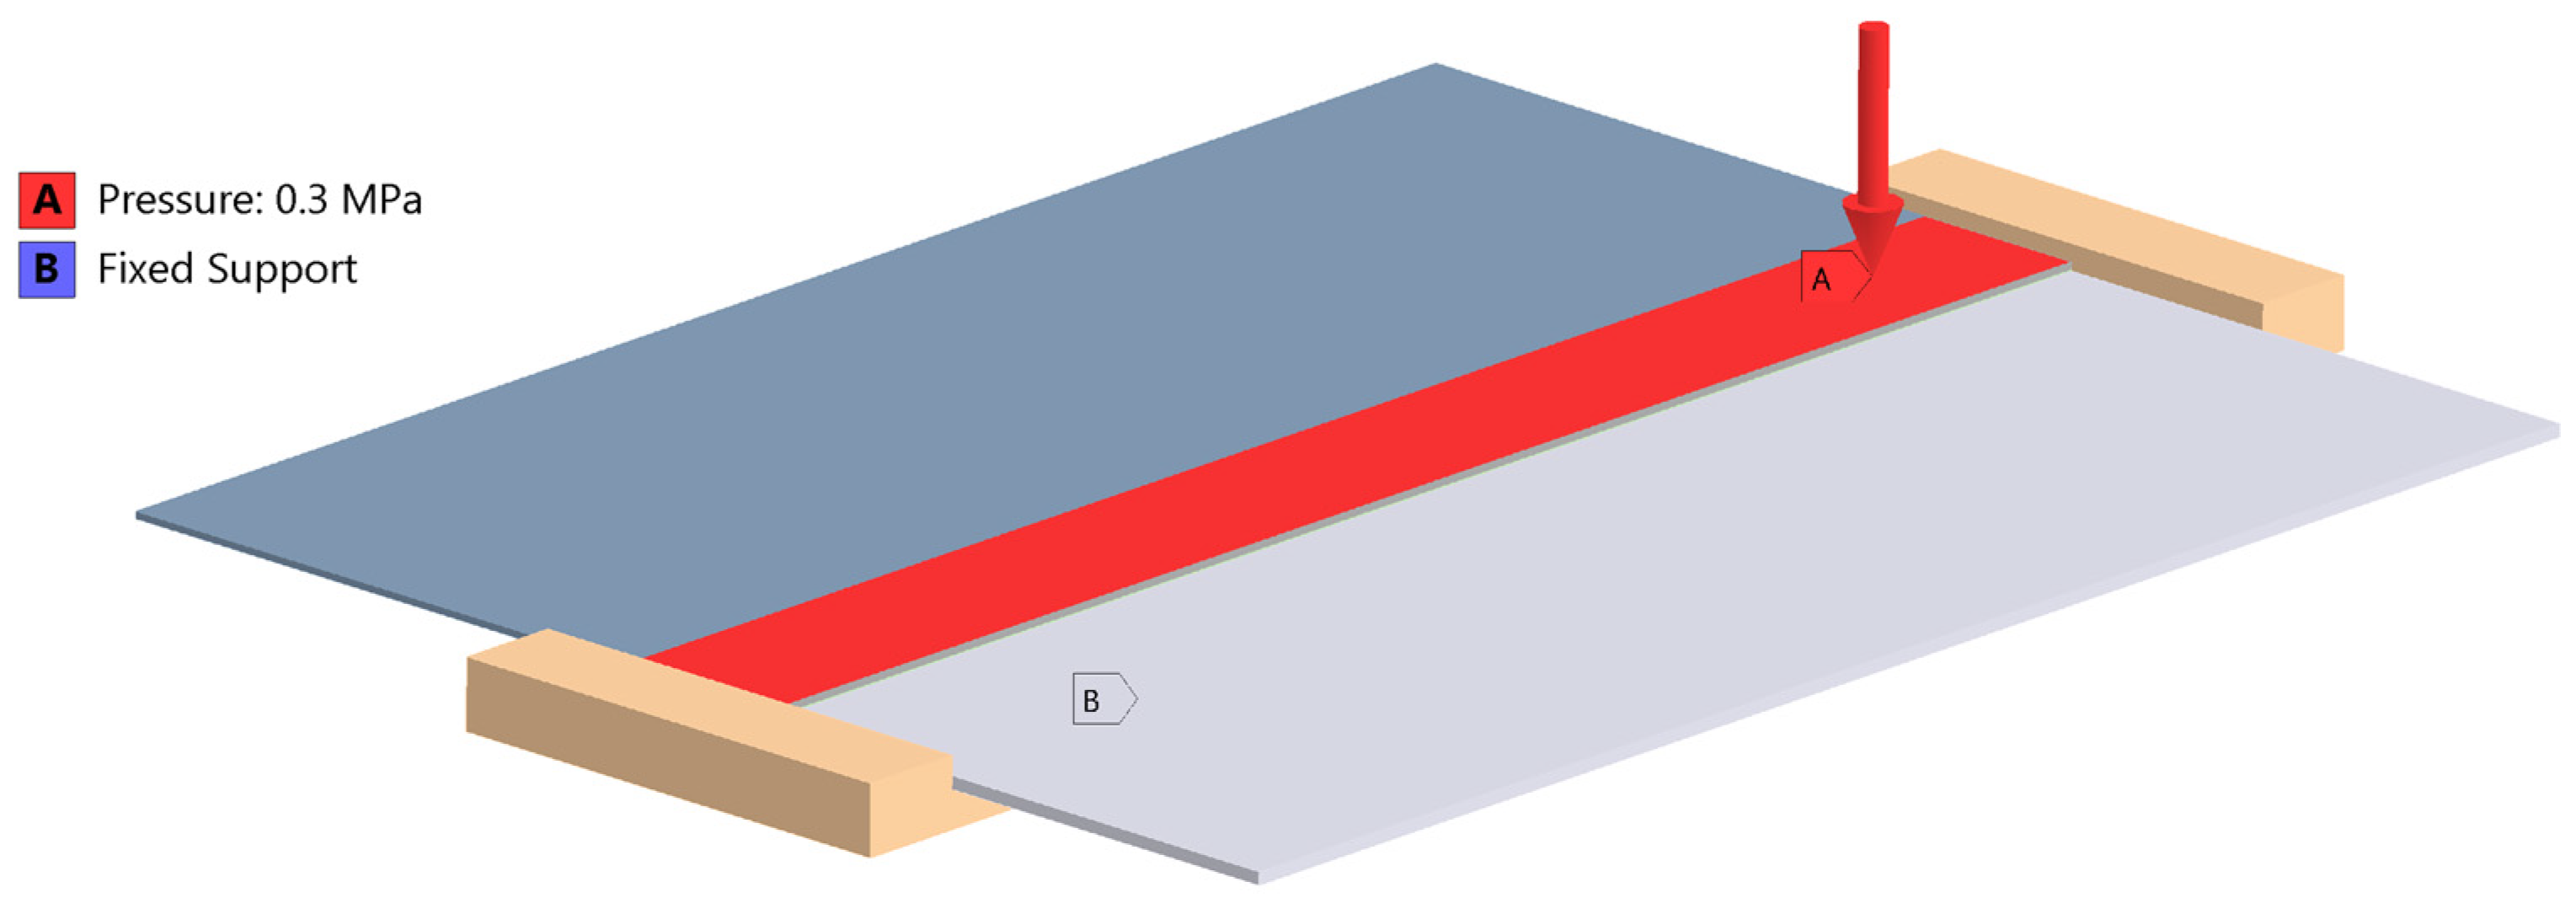
An Ansys 2024R2 CAD model of the sample, followed by a FEM model (Figure 18, Figure 19 and Figure 20) were created. The boundary conditions present on the sample are the applied temperature, pressure and the frictional support (Figure 20).
Pressure and an elevated coefficient of friction (0.3) were additional factors used to stabilize the model [8,44].

5.1. Thermal Distribution

The first step in determining thermal stress and the resulting residual stress is a thermal analysis, which allows for identifying the temperature distribution within the heated components. Detailed material data implemented in the Ansys environment allowed for obtaining an accurate temperature distribution (Figure 21).

5.2. Deformation

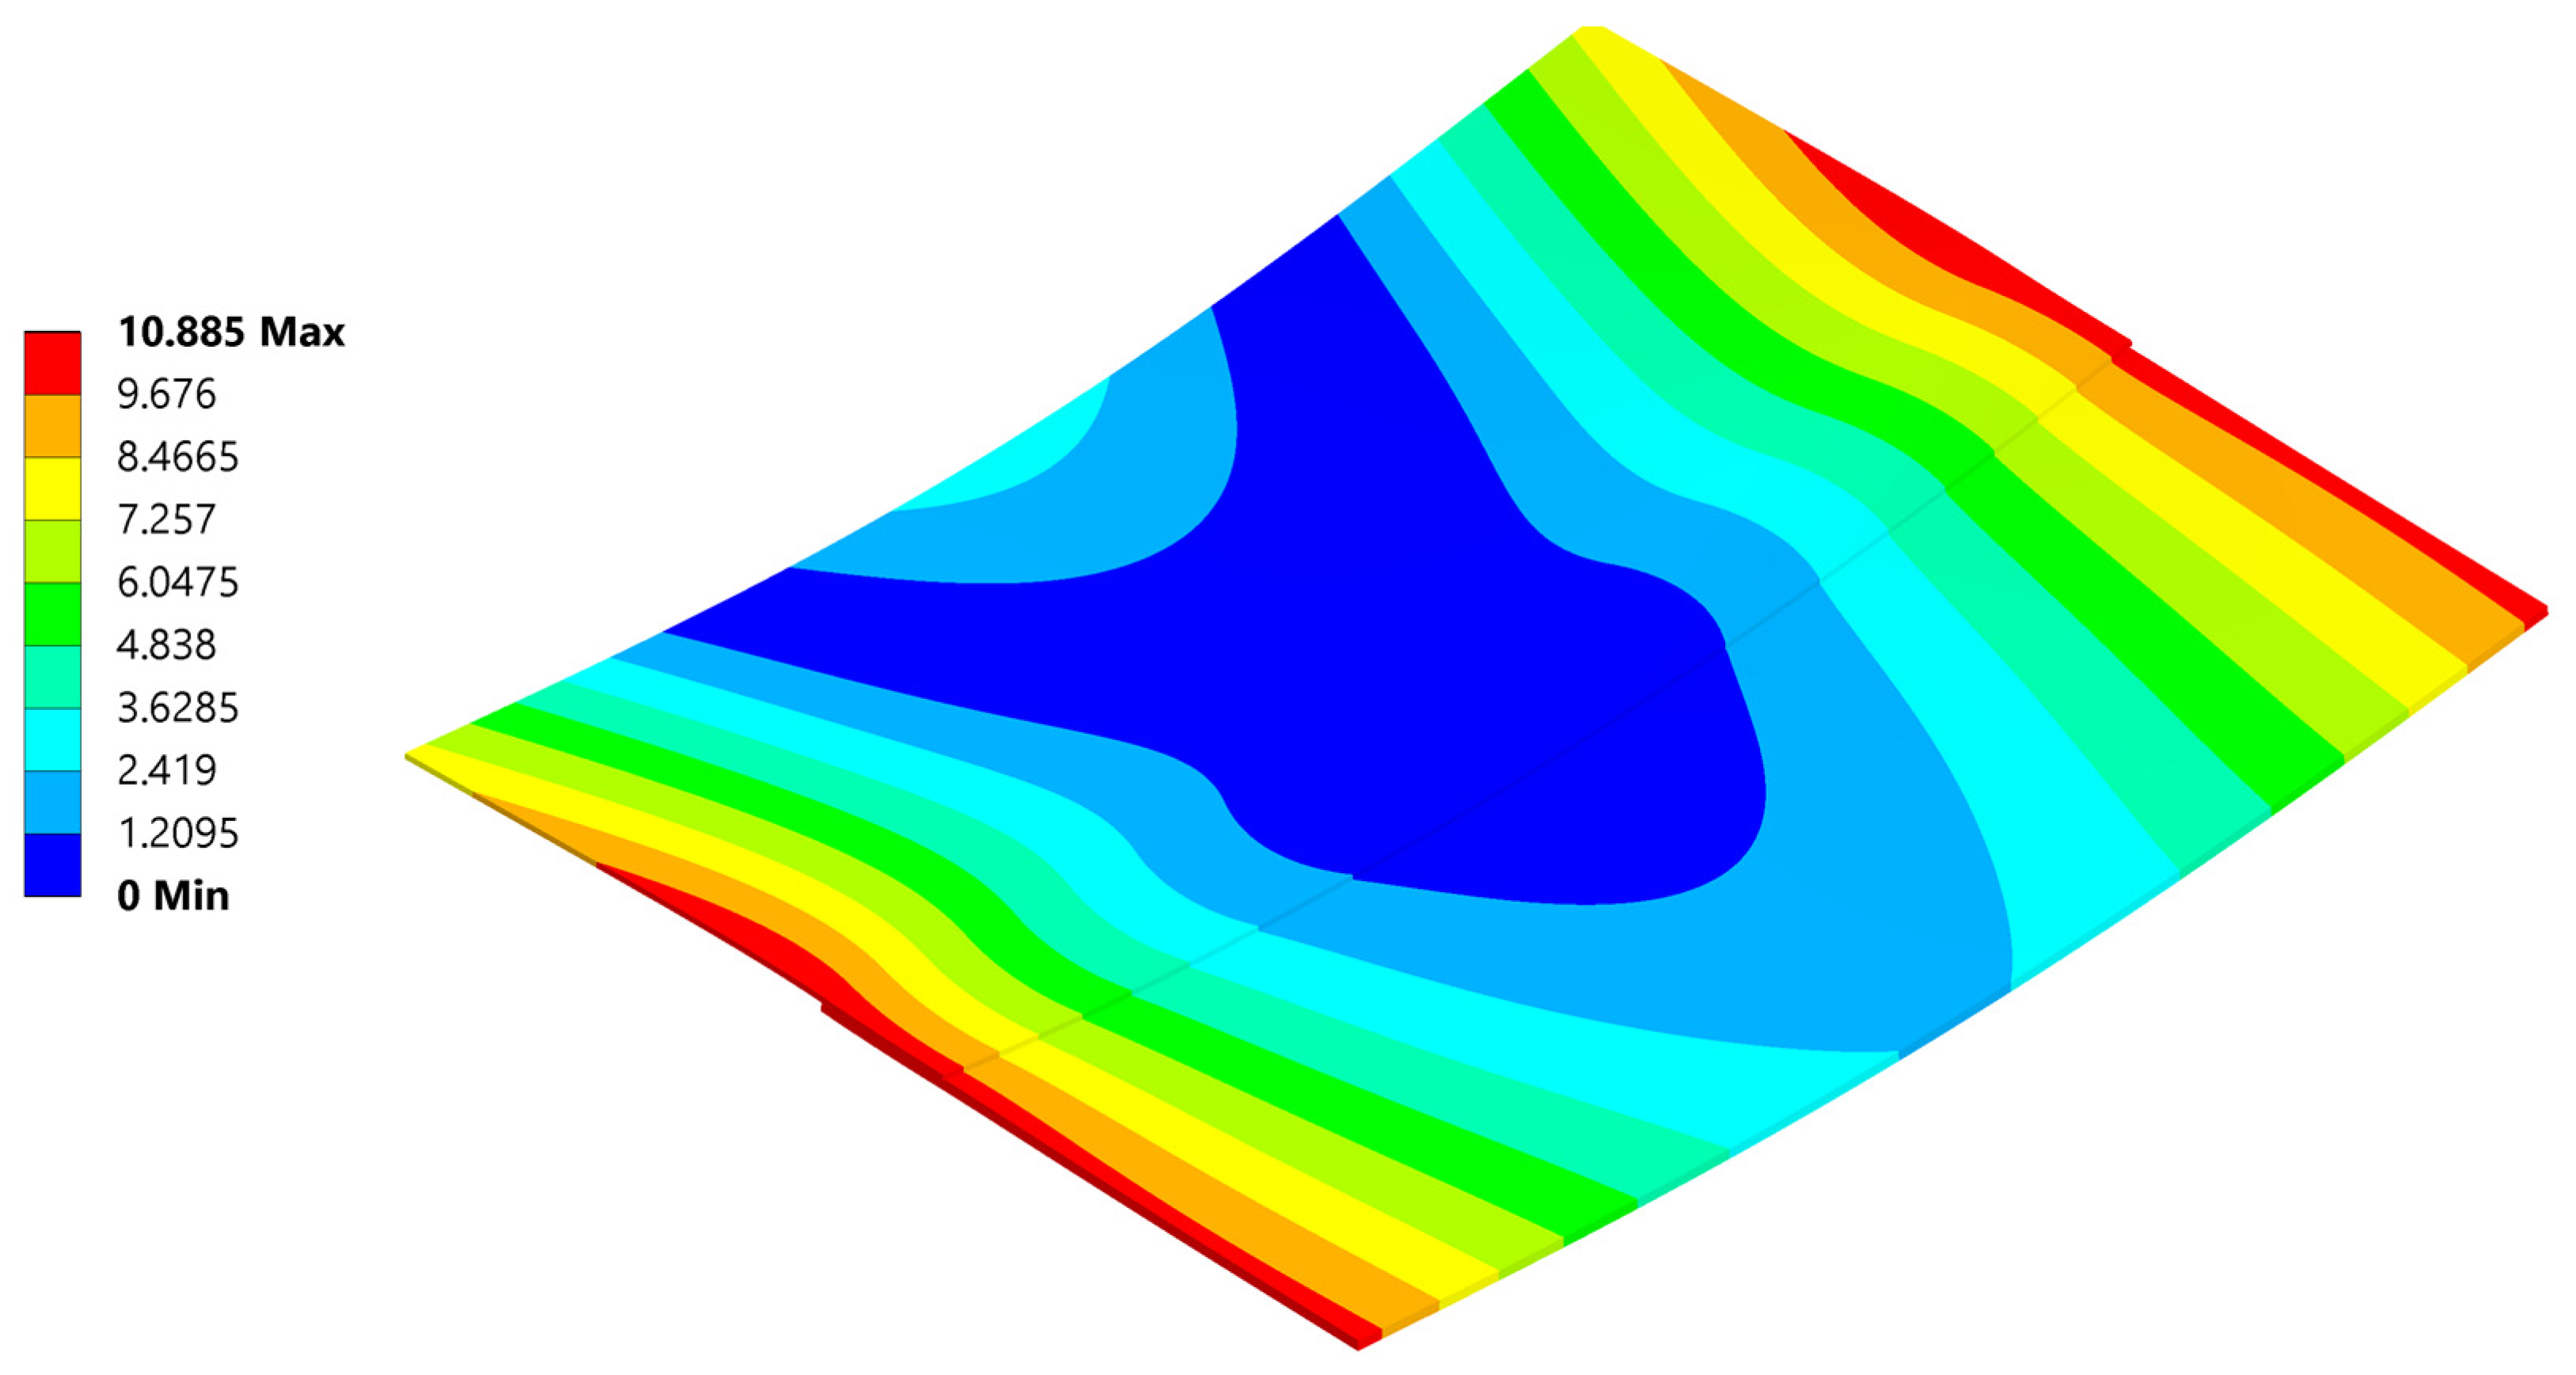
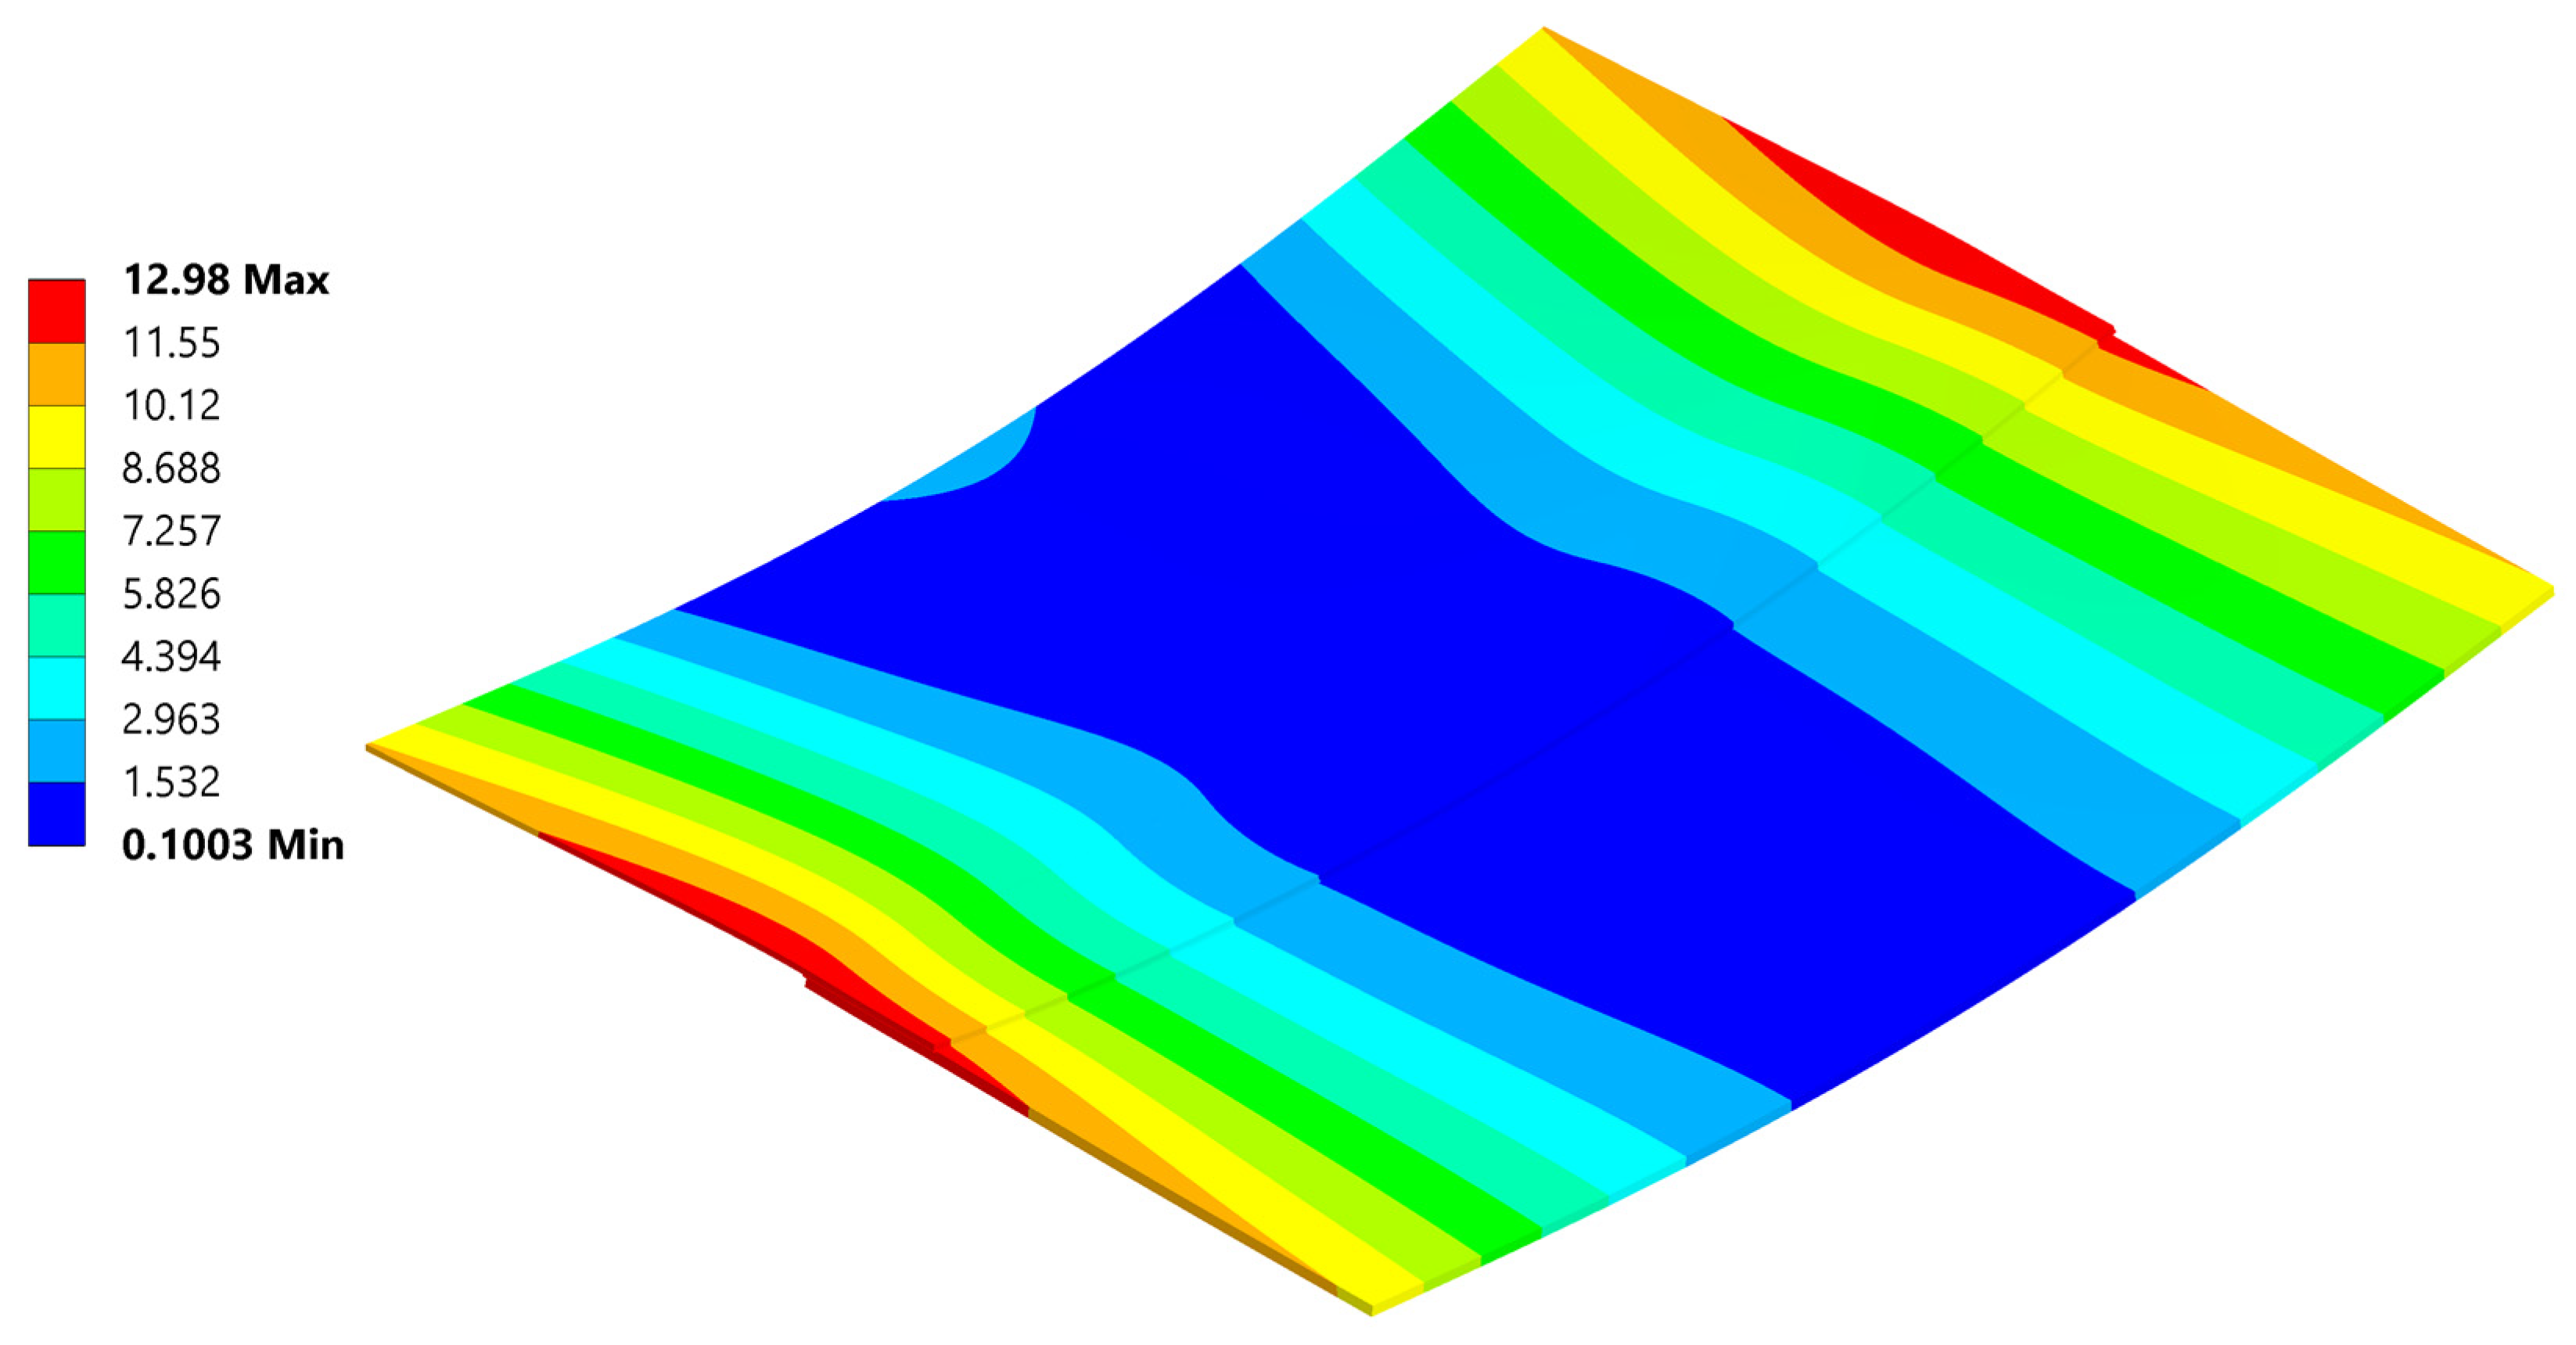
The most noticeable effect of residual stress present in welded parts after cooling is the resulting deformation (Figure 22). To reliably represent stress, efforts were made to achieve deformations as close as possible to those observed during the experiment. An analysis involving non-linear materials, non-linear contacts, and geometric non-linearity is overly sensitive to any changes.
The analysis produced a reliable deformation profile, with the magnitude of deformation being smaller than that observed in the experiment. This discrepancy is a result of the composite material card simplifications compared to reality, as well as uncertainties in the defined composite material’s response to temperature. Furthermore, even with the geometrical non-linearity allowed in the setting and large deformations permitted, the deformation results usually are observed to be smaller than those in real life.

5.3. Stress

This chapter will provide the stress results and discussion for the (20 °C–260 °C–20 °C) cycle only. Residual stress remaining after welding is crucial for the residual strength of the joint, which will be evaluated during static SLS tests. Understanding the residual stress within the joint, combined with the results of SLS tests, will provide insight into the total strength of the joint.
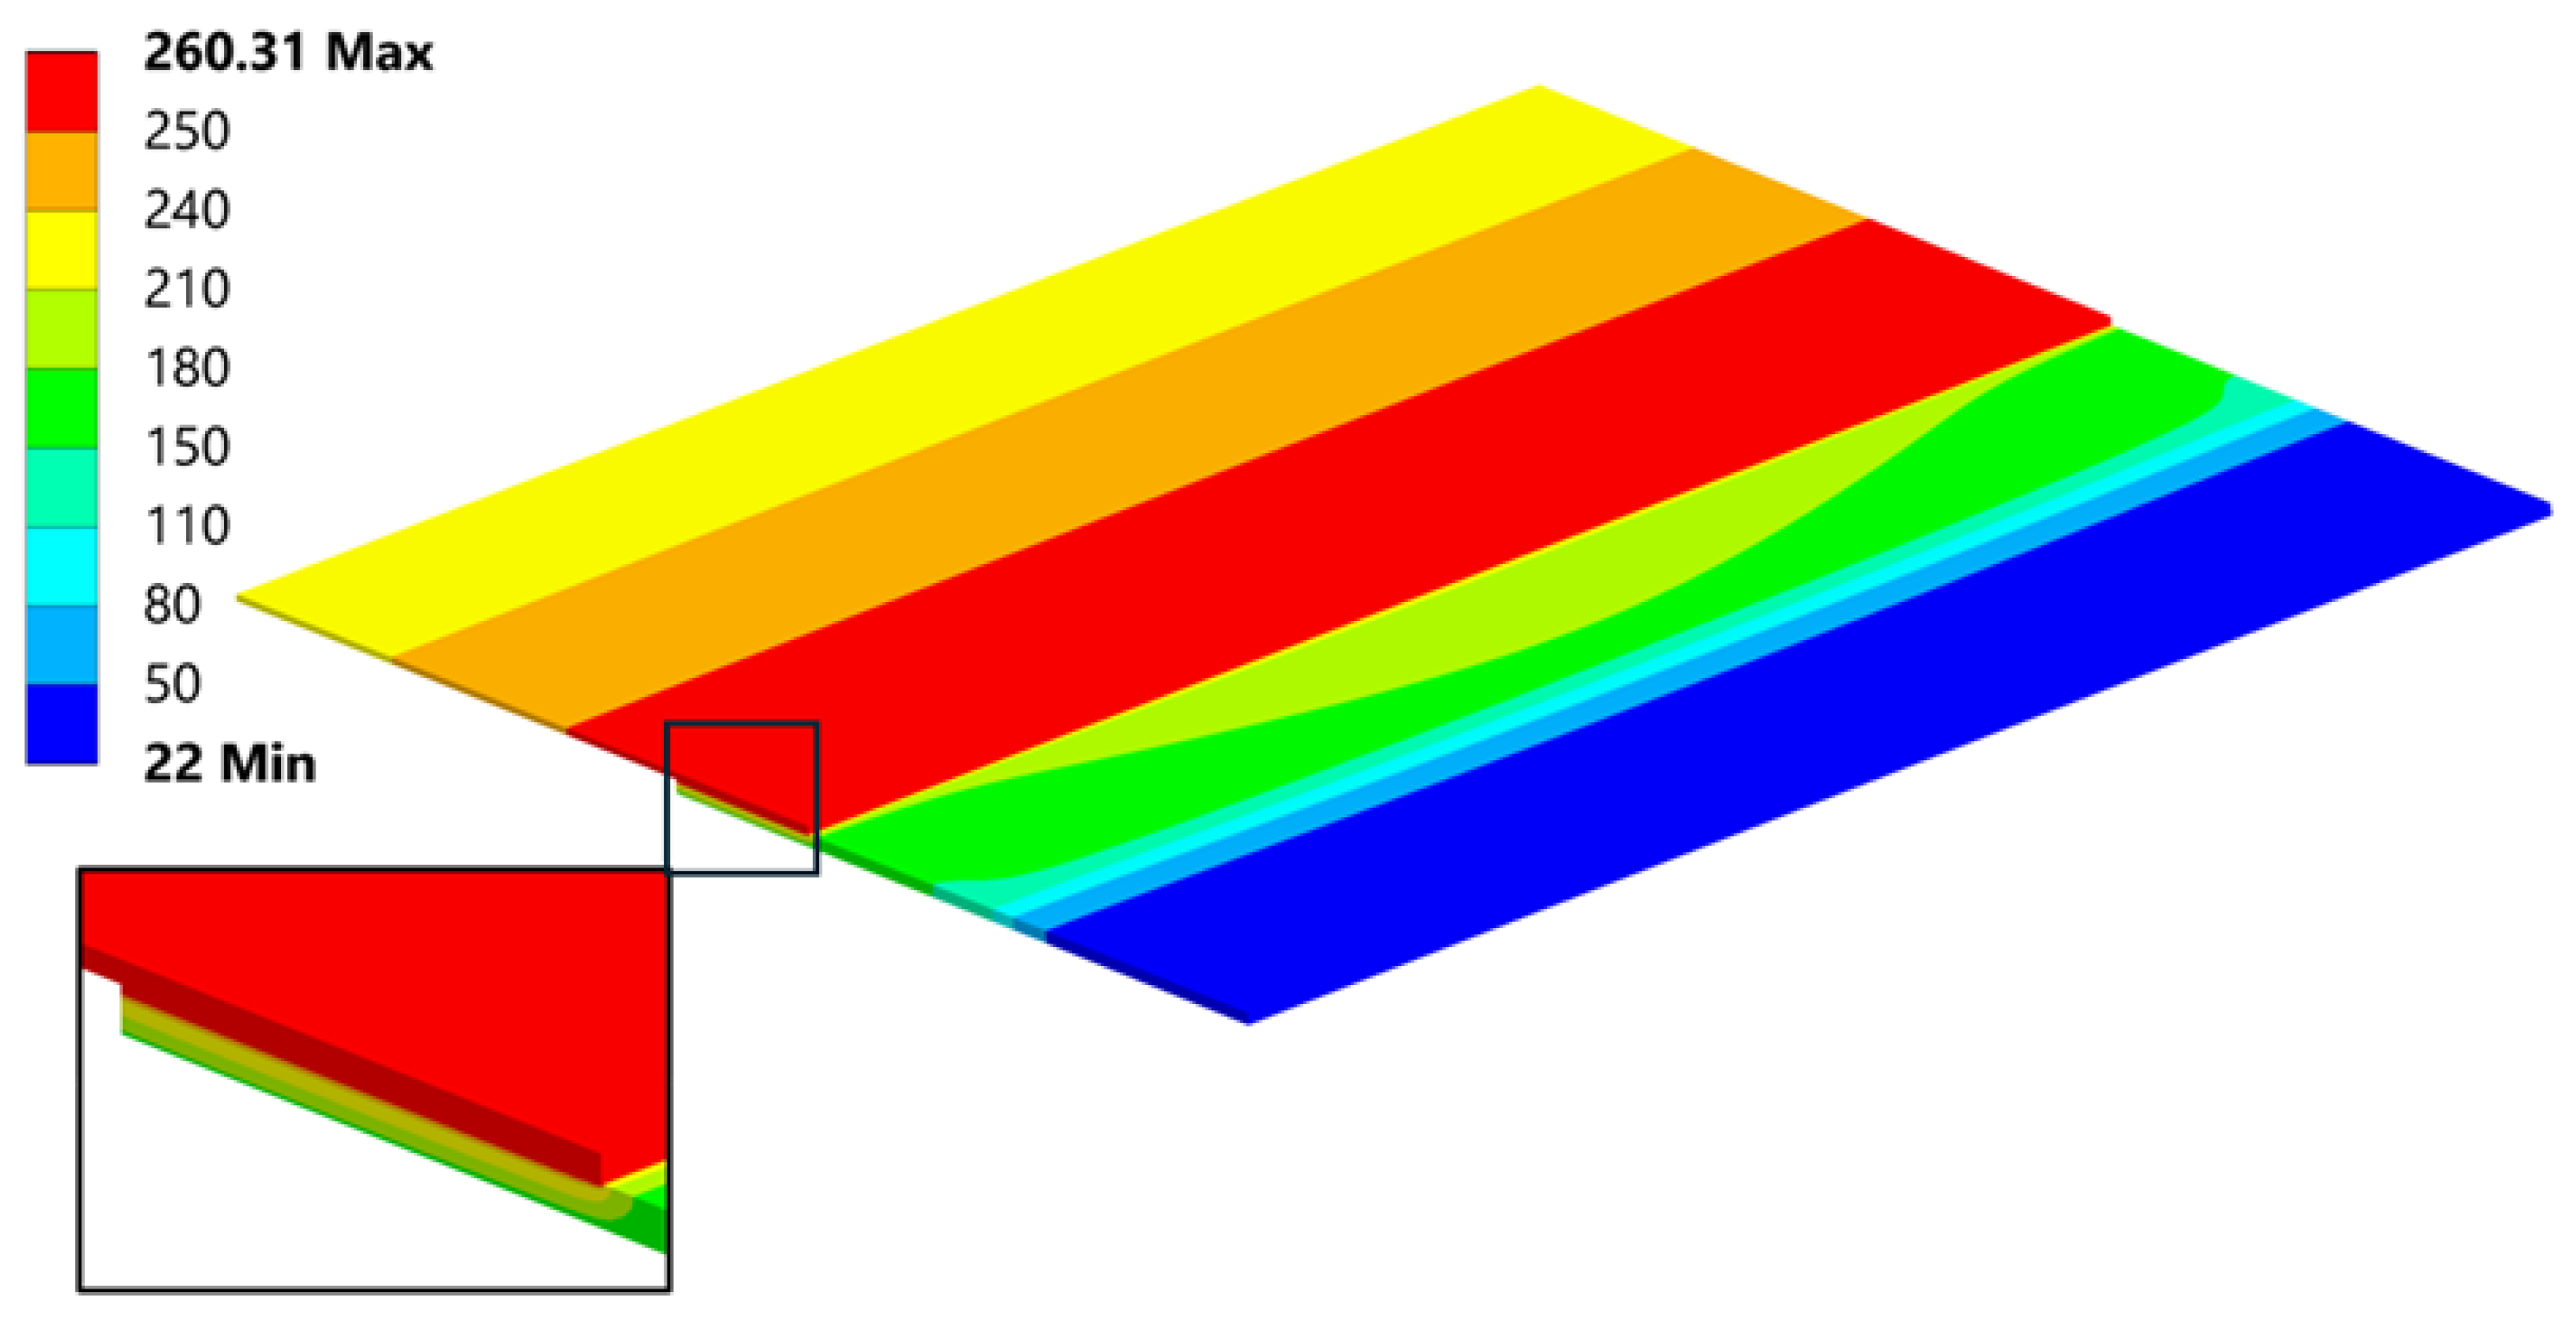
A general and overall stress contour of the von Mises results, seen in (Figure 23), presents information on the highest values and gives a rather simple description on what can be expected regarding the loading that the joint is carrying after welding. Far ends of the connection are bearing most of the forces involved quite similarly as seen in the empirical studies found in [45]. The von Mises stress results provide a general description and are used primarily for an introductory assessment. They do not provide a deep understanding of the direction or the Cauchy Stress Tensors, which are crucial for proper evaluation of the residual strength.
The cross section (Figure 23) provides insight into the differences in residual stress within the individual layers of the joint. Typically, during bending, a neutral line—where stress changes its direction—can be identified. In this case, due to the presence of three different materials bonded together at their maximum expansion temperature, and as they cool, they begin to compress. The carbon fibre plate reaches its room-temperature elongation (due to its lower thermal expansion coefficient), while the aluminum plate continues to shrink, transferring the compressive force into a bending moment. This composition creates particular ambiguity in the position of the neutral axis.
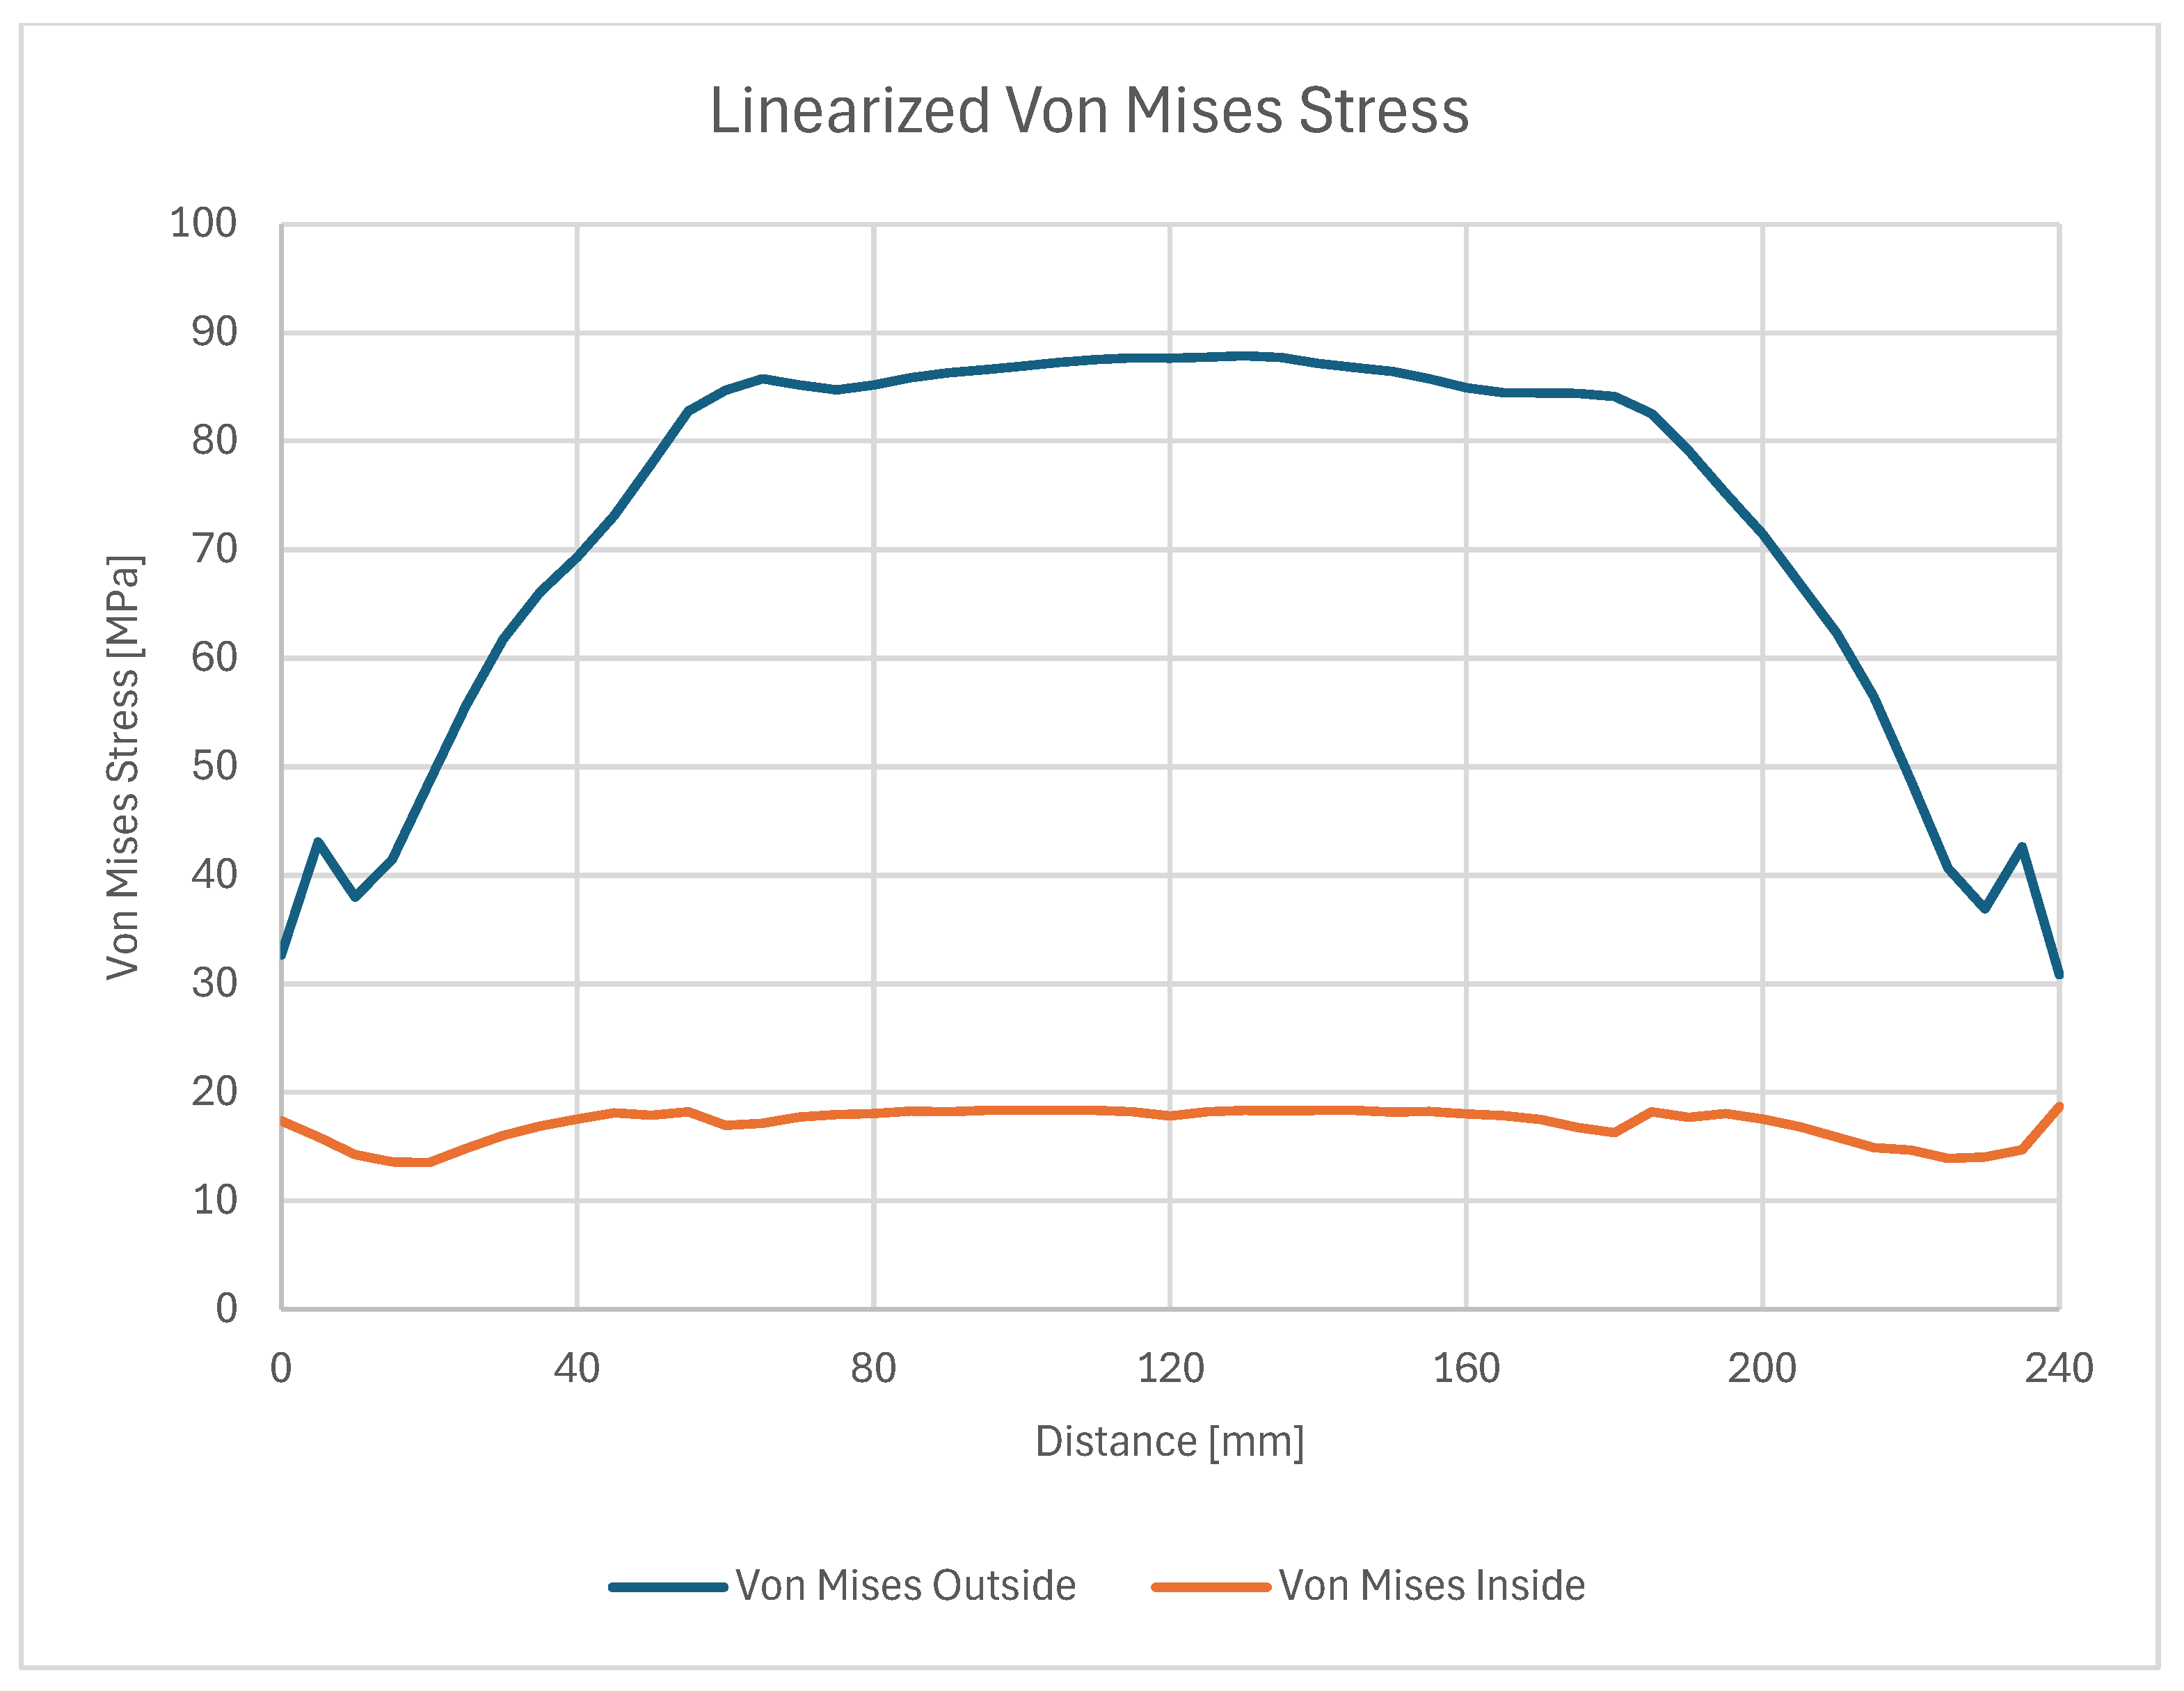
On these paths, stress results are shown in (Figure 24) which gives a closer insight into the stress distribution in the joint itself and comparison with the stress on the outside plate, which correlates with [45]. The plotted stress path results are presented in (Figure 25).
Later, these samples will be subjected to various tests, such as uniaxial tension and the three-point bending test, which will provide the answers to the shear and normal residual strength of the weld. Because of that, the understanding of the residual stress components will be very useful.
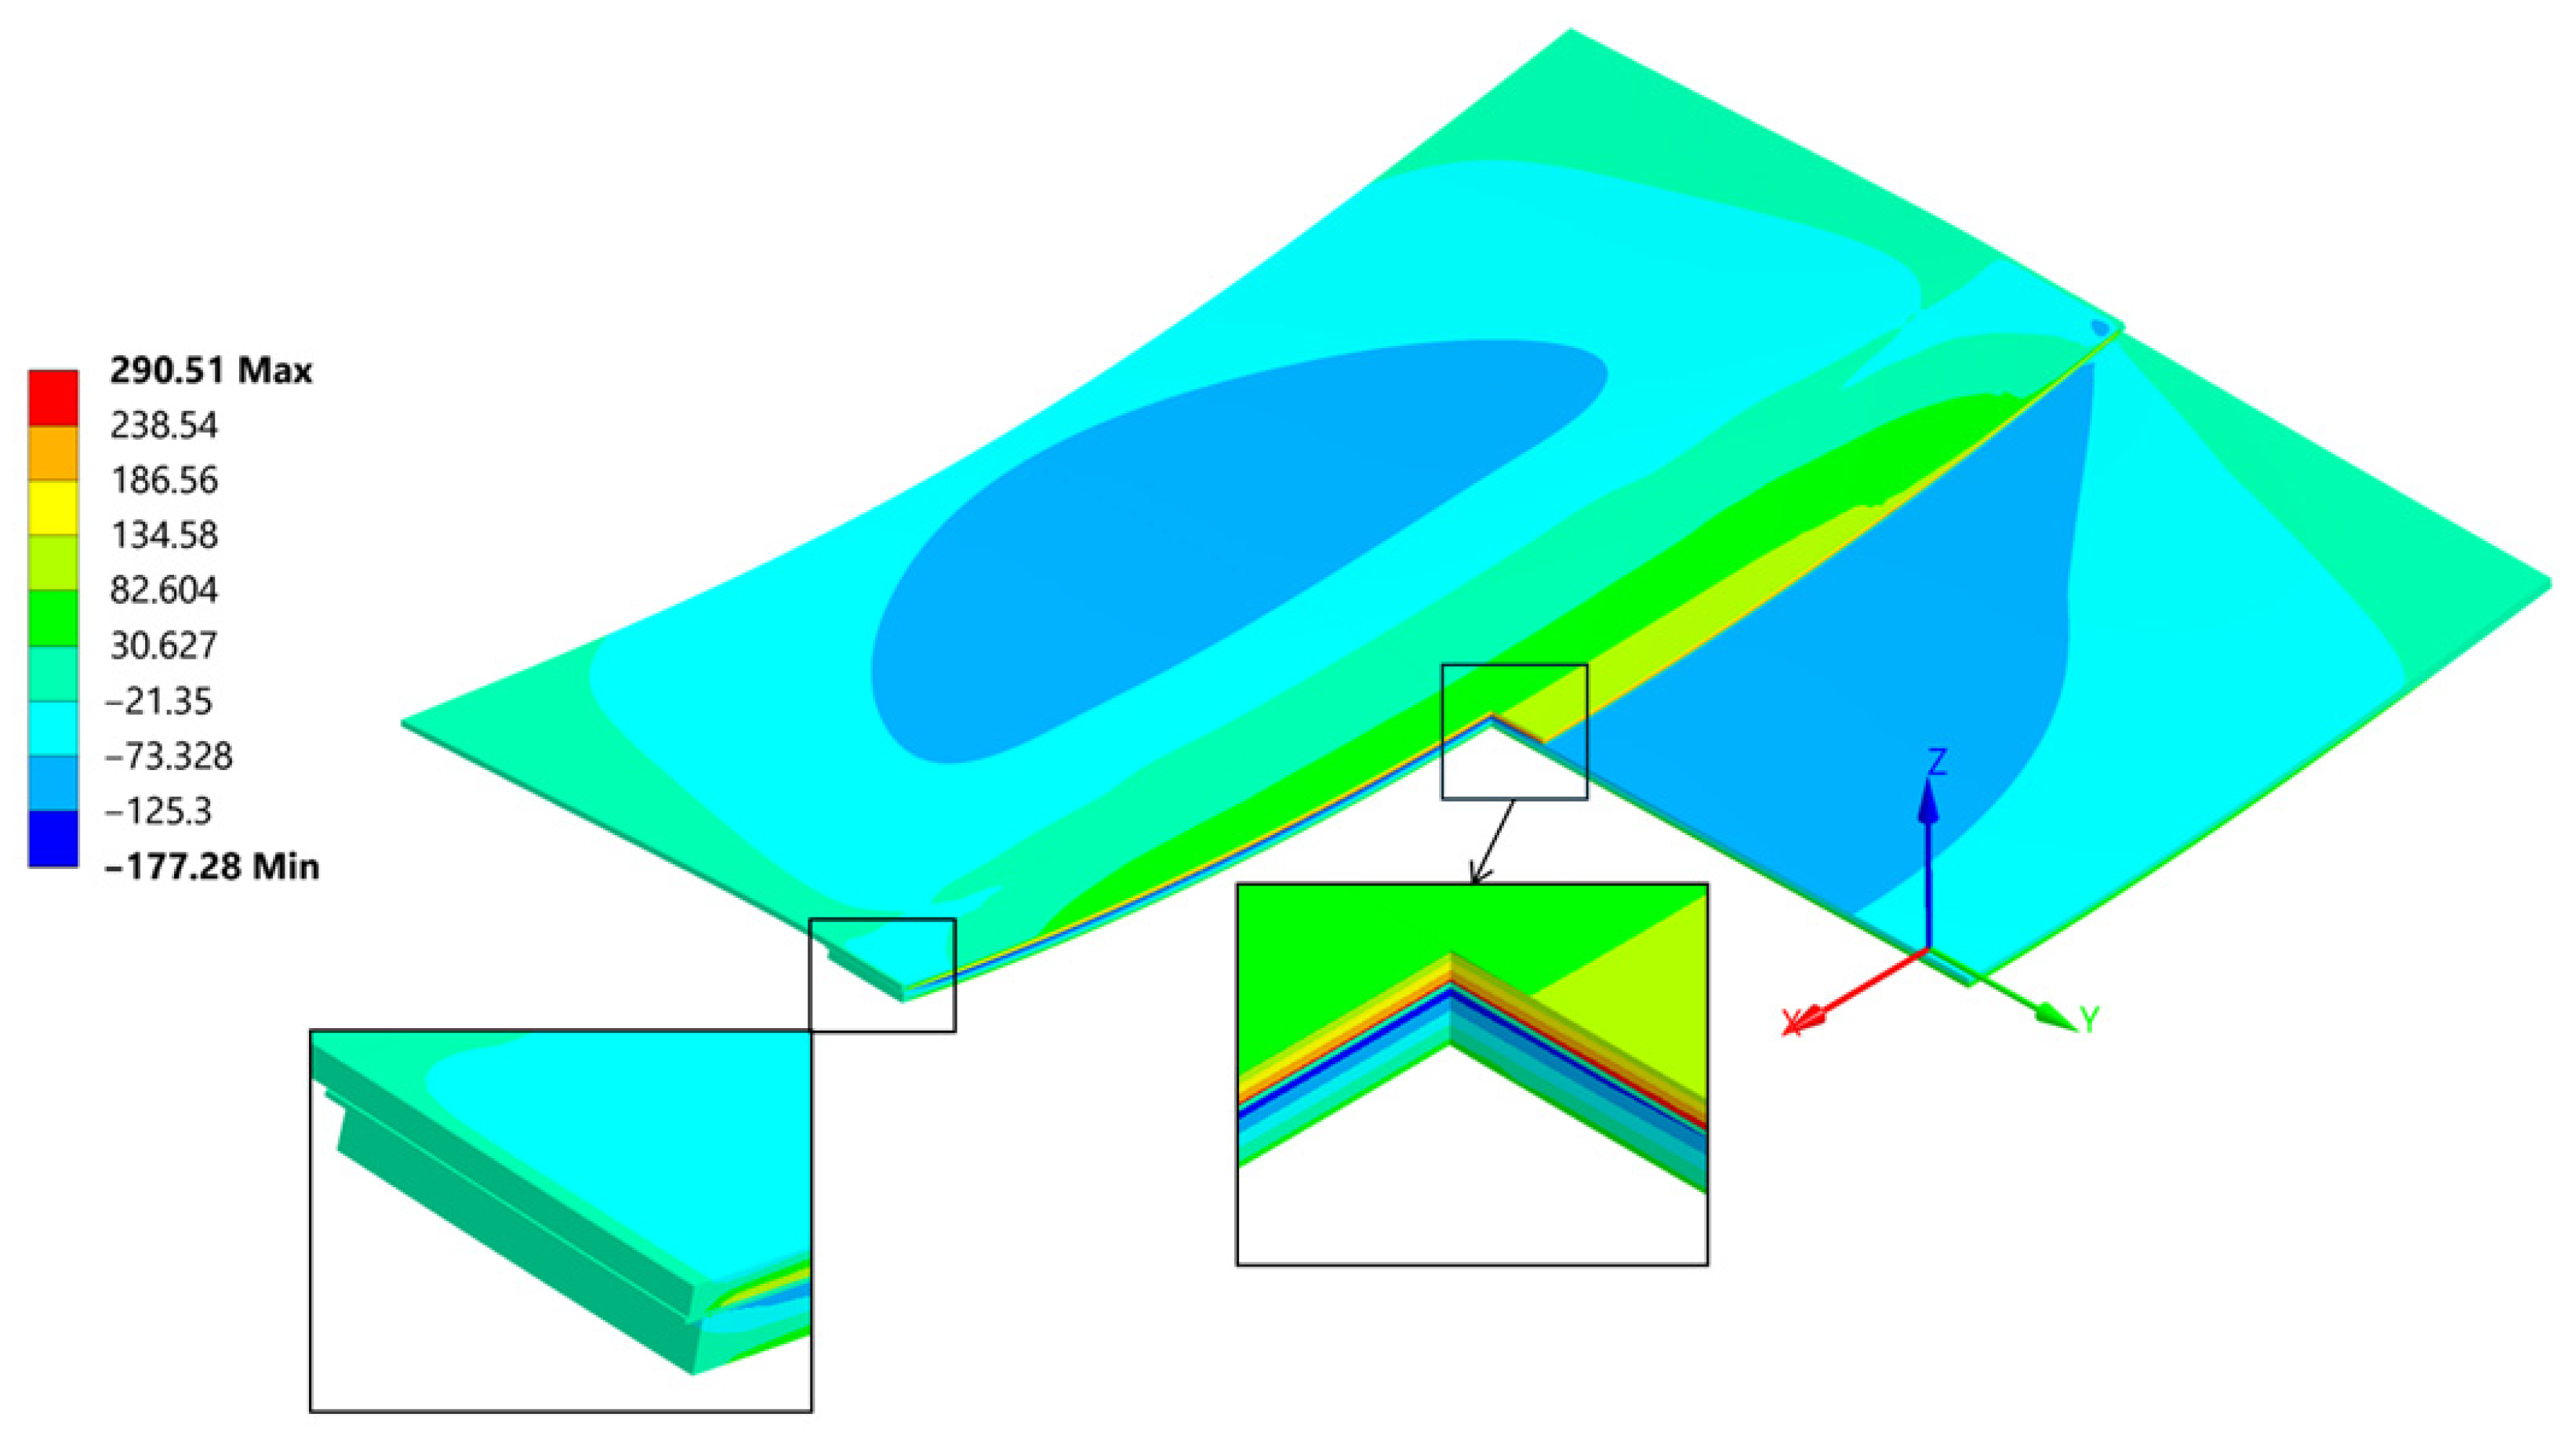
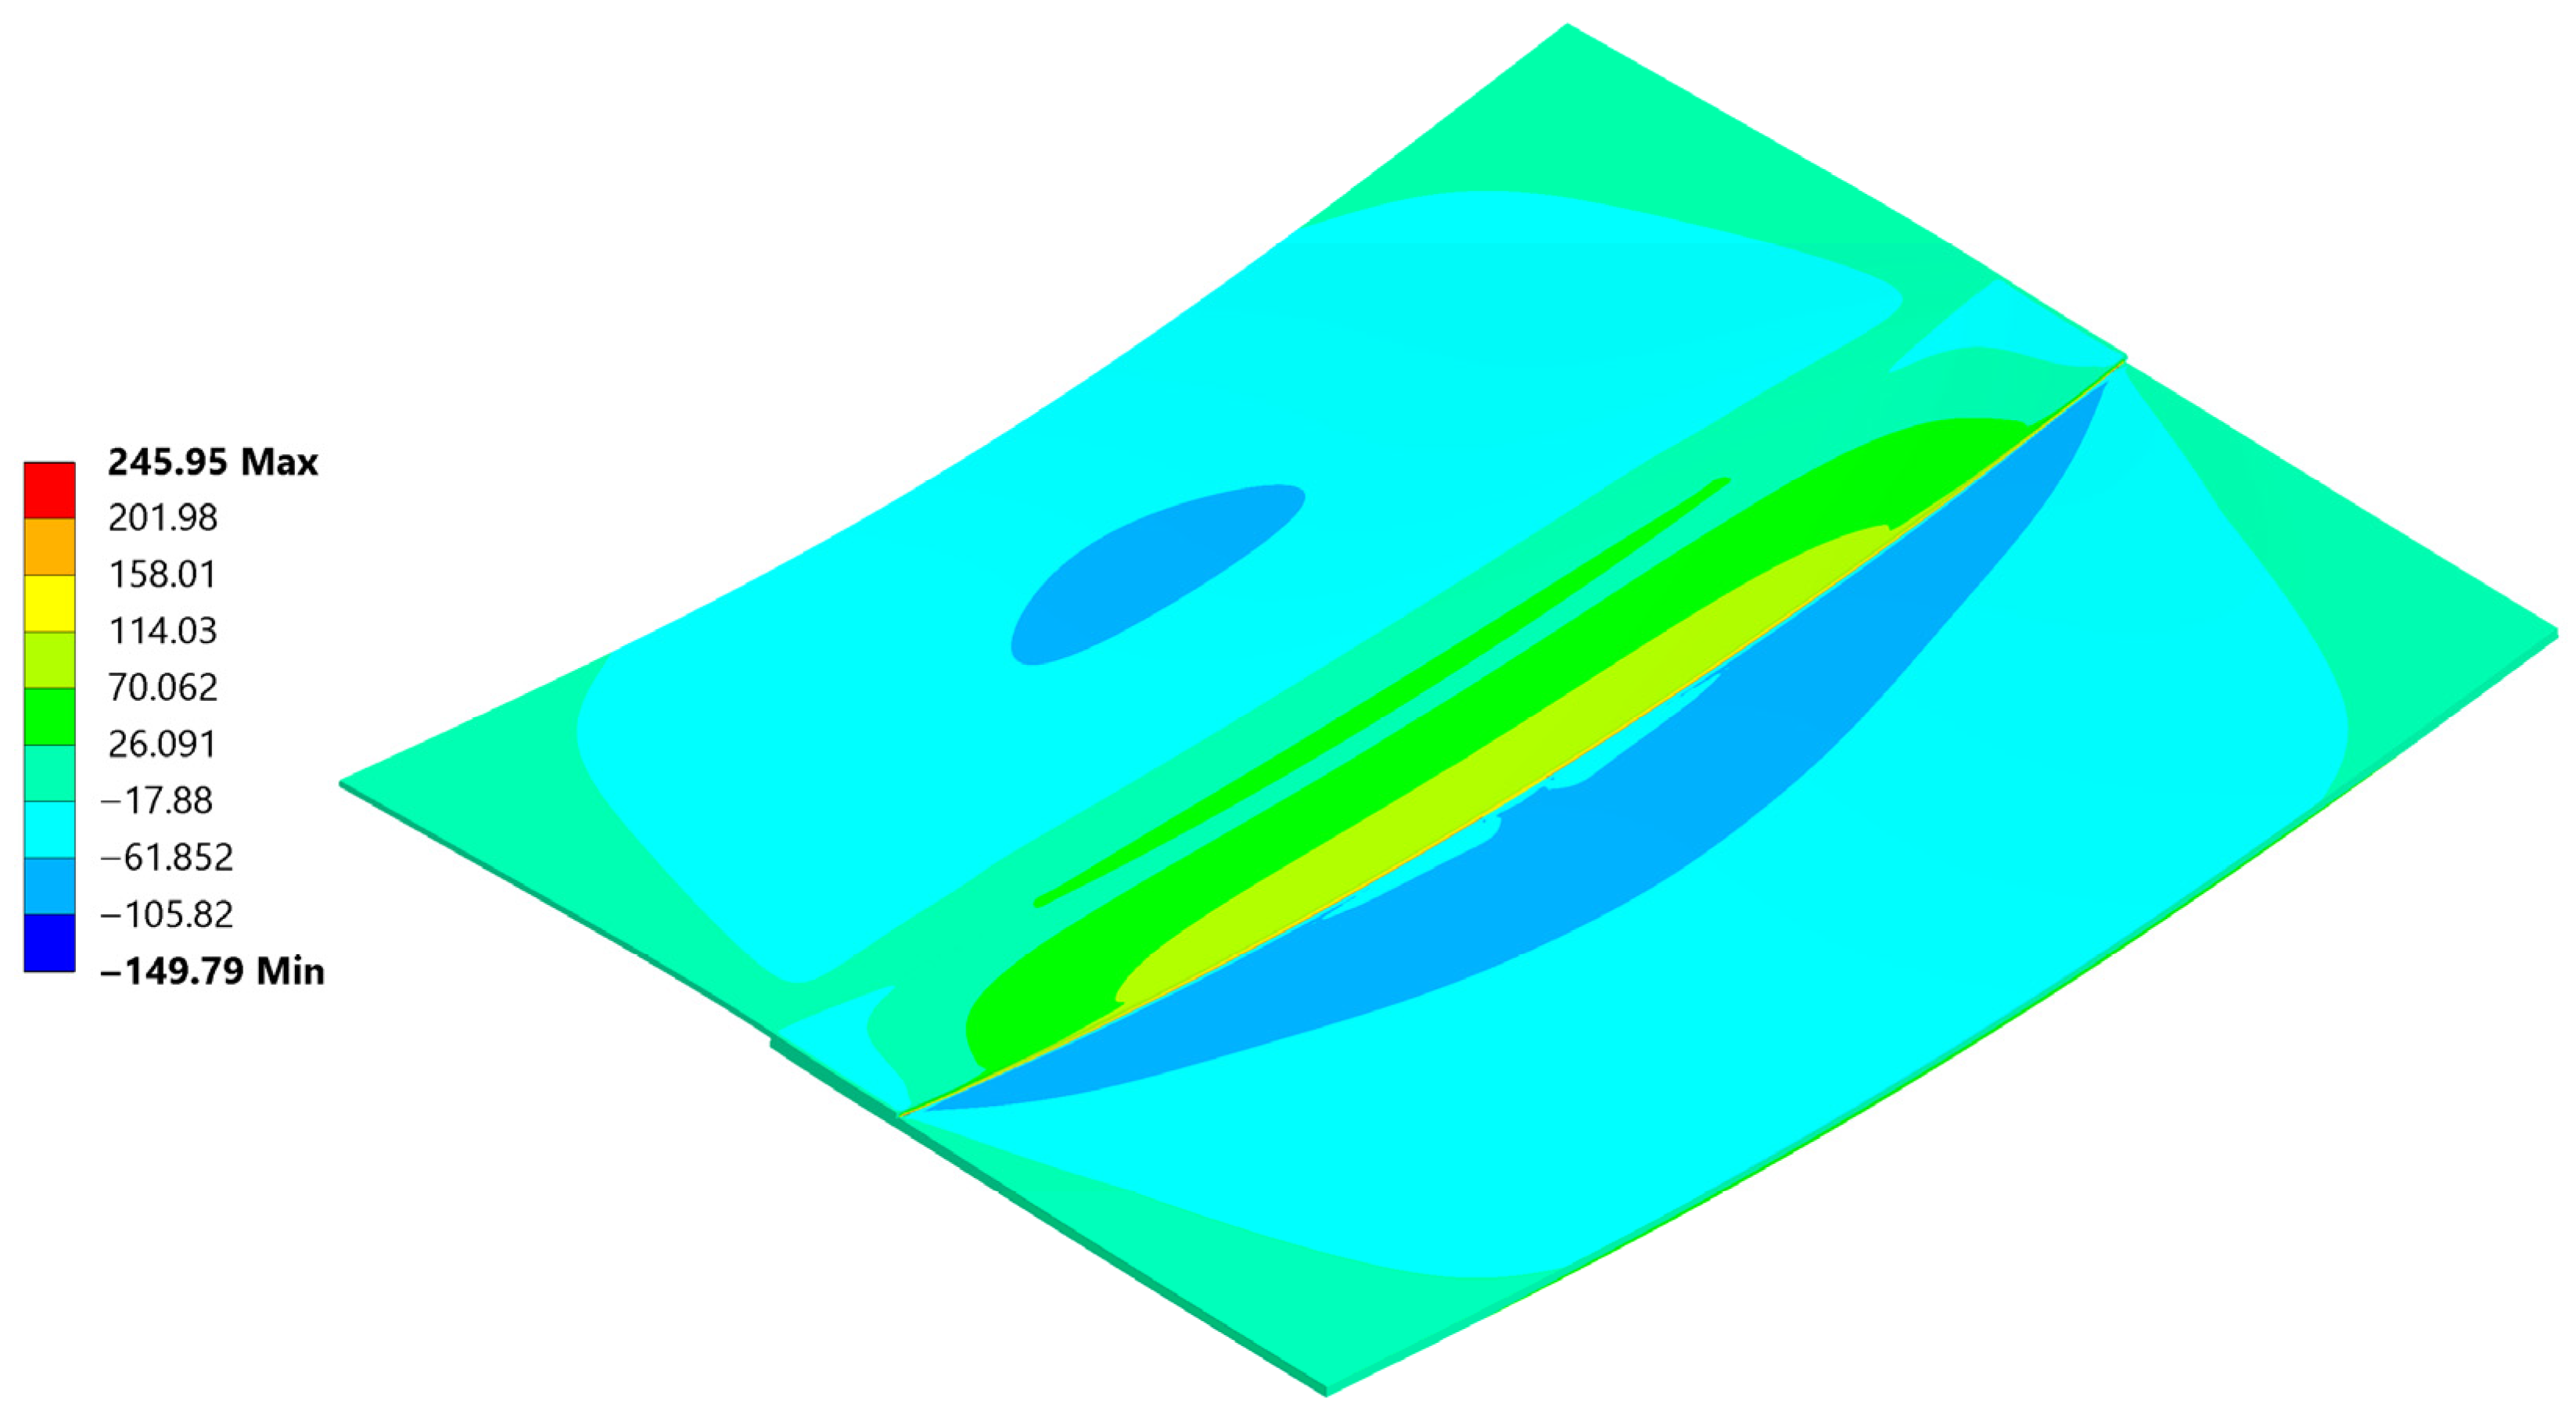
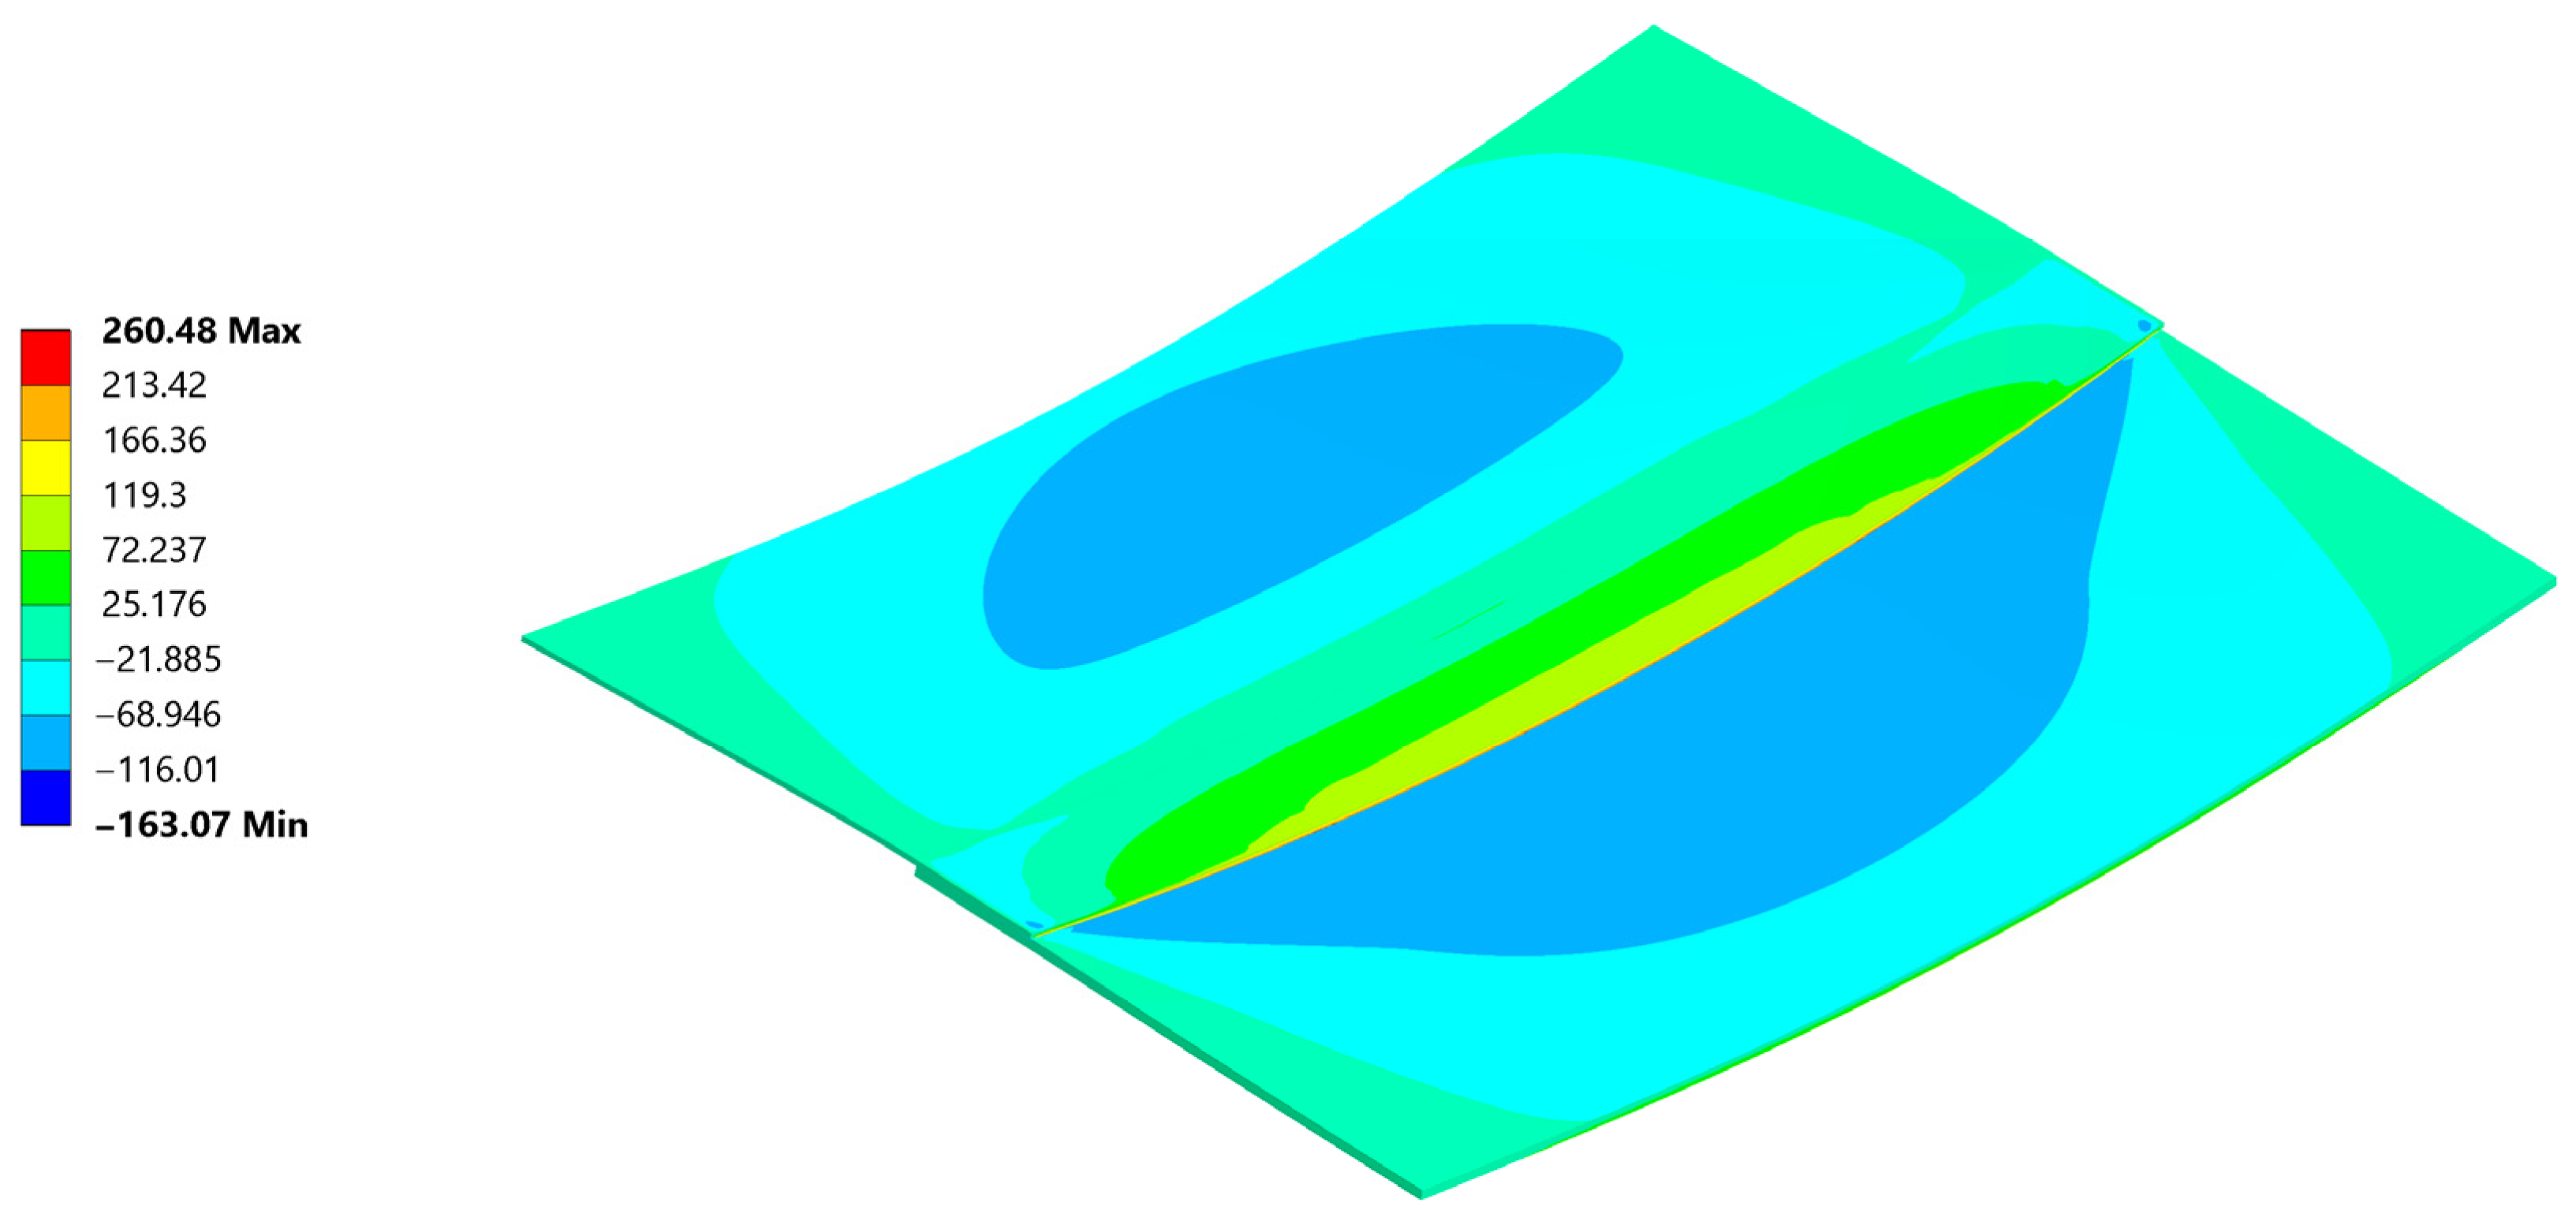
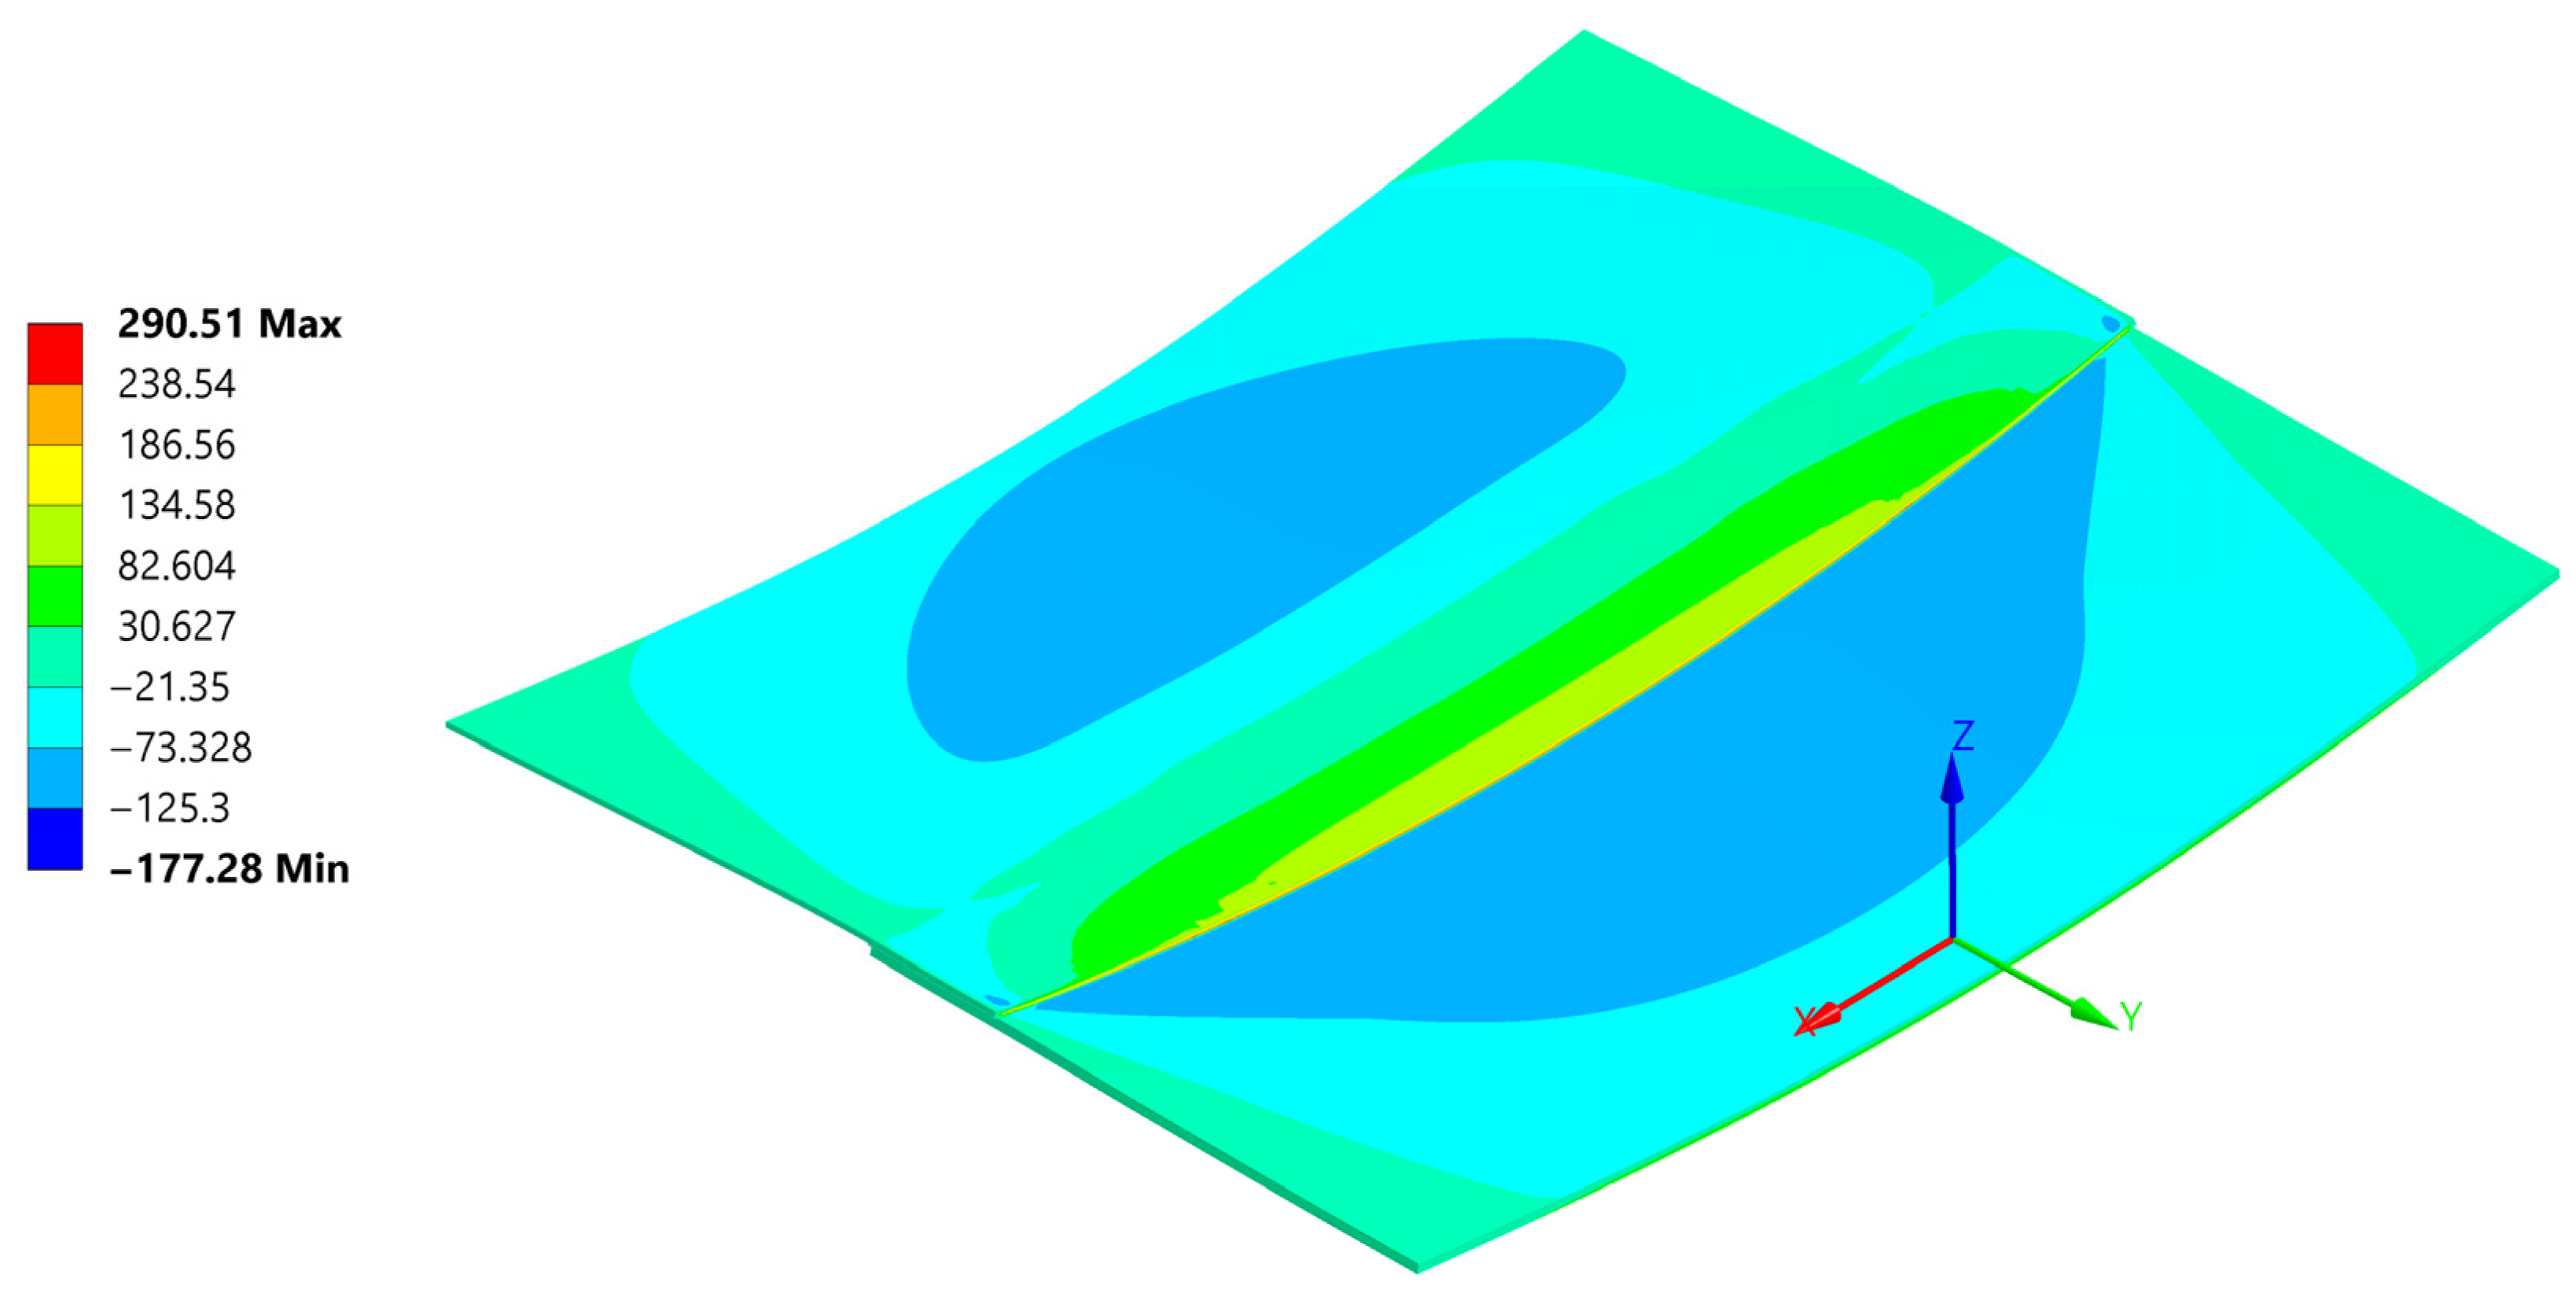
Normal stress σxx reached a peak value of 290 MPa in tension and −177 MPa in compression (Figure 26). The compression occurs at the edge of the plate, where its highest values always appear when flexure is allowed [46].
The normal compressive stress σxx values calculated by hand at the edges in Section 4.2. averaged at around −191.8 MPa and were calculated considering the carbon plate Young’s modulus. As presented in (Figure 26), where only the bonded inside surfaces are highlighted. The normal peeling stress σzz derived only through FEM is presented in Figure 27.
These are considerably lower than the analytical assumptions. Such discrepancies arise because analytical calculations inherently use a highly simplified approach, determining the maximum possible extreme value, resulting in a very conservative estimate.
In contrast, FEM analyses provide results that are much closer to reality but remain as simulations that yield approximate values dependent on the adopted assumptions. In the case of composite analyses, it is generally estimated that the results are subject to an error margin of up to 20%.
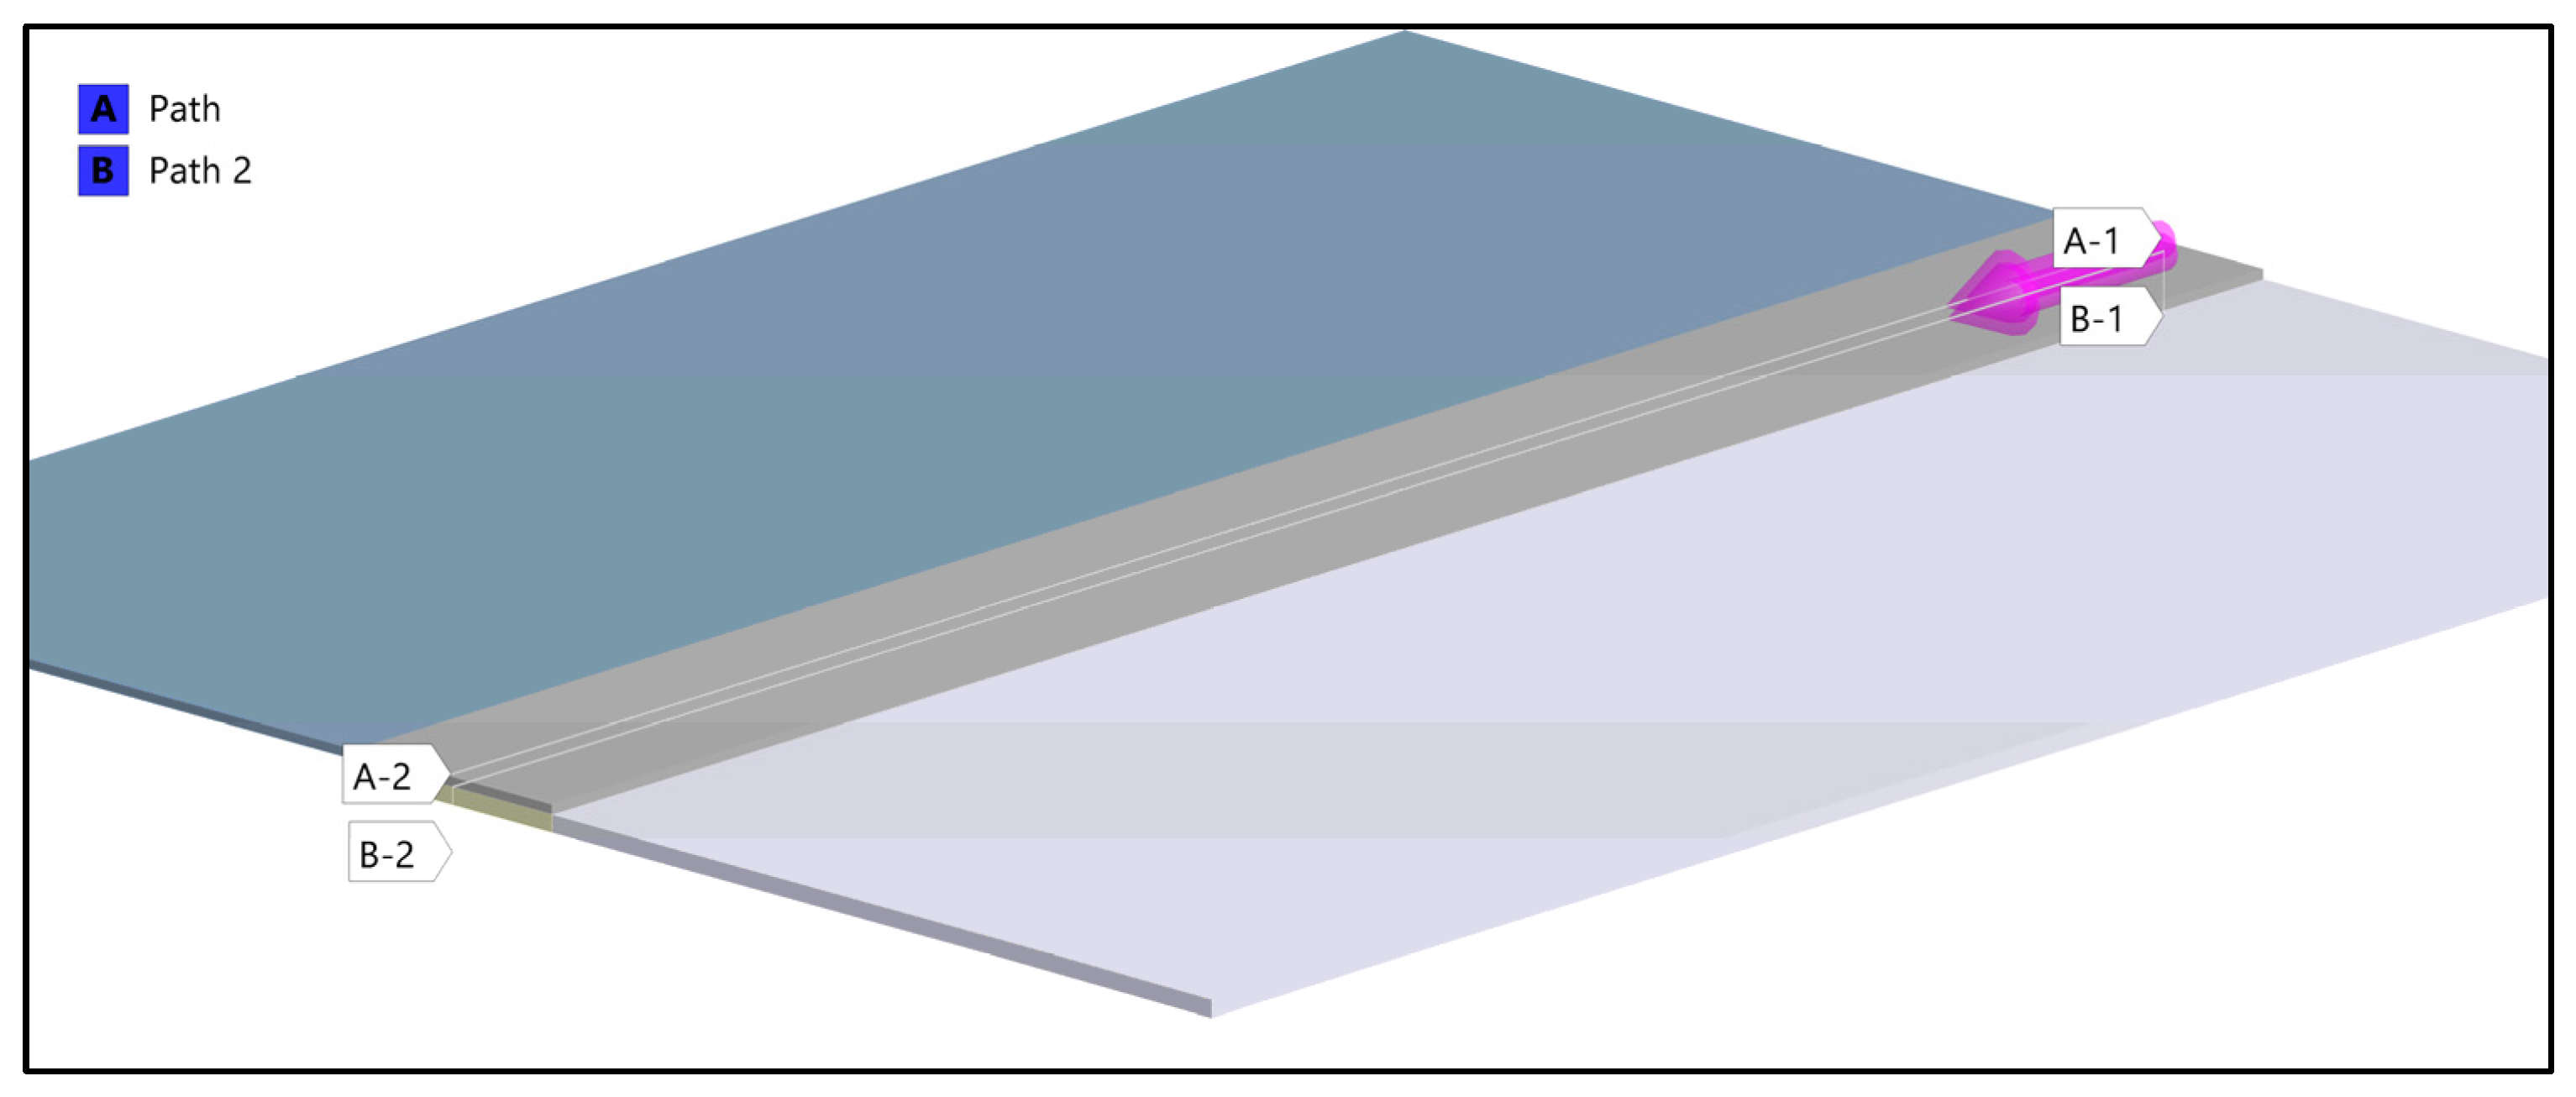
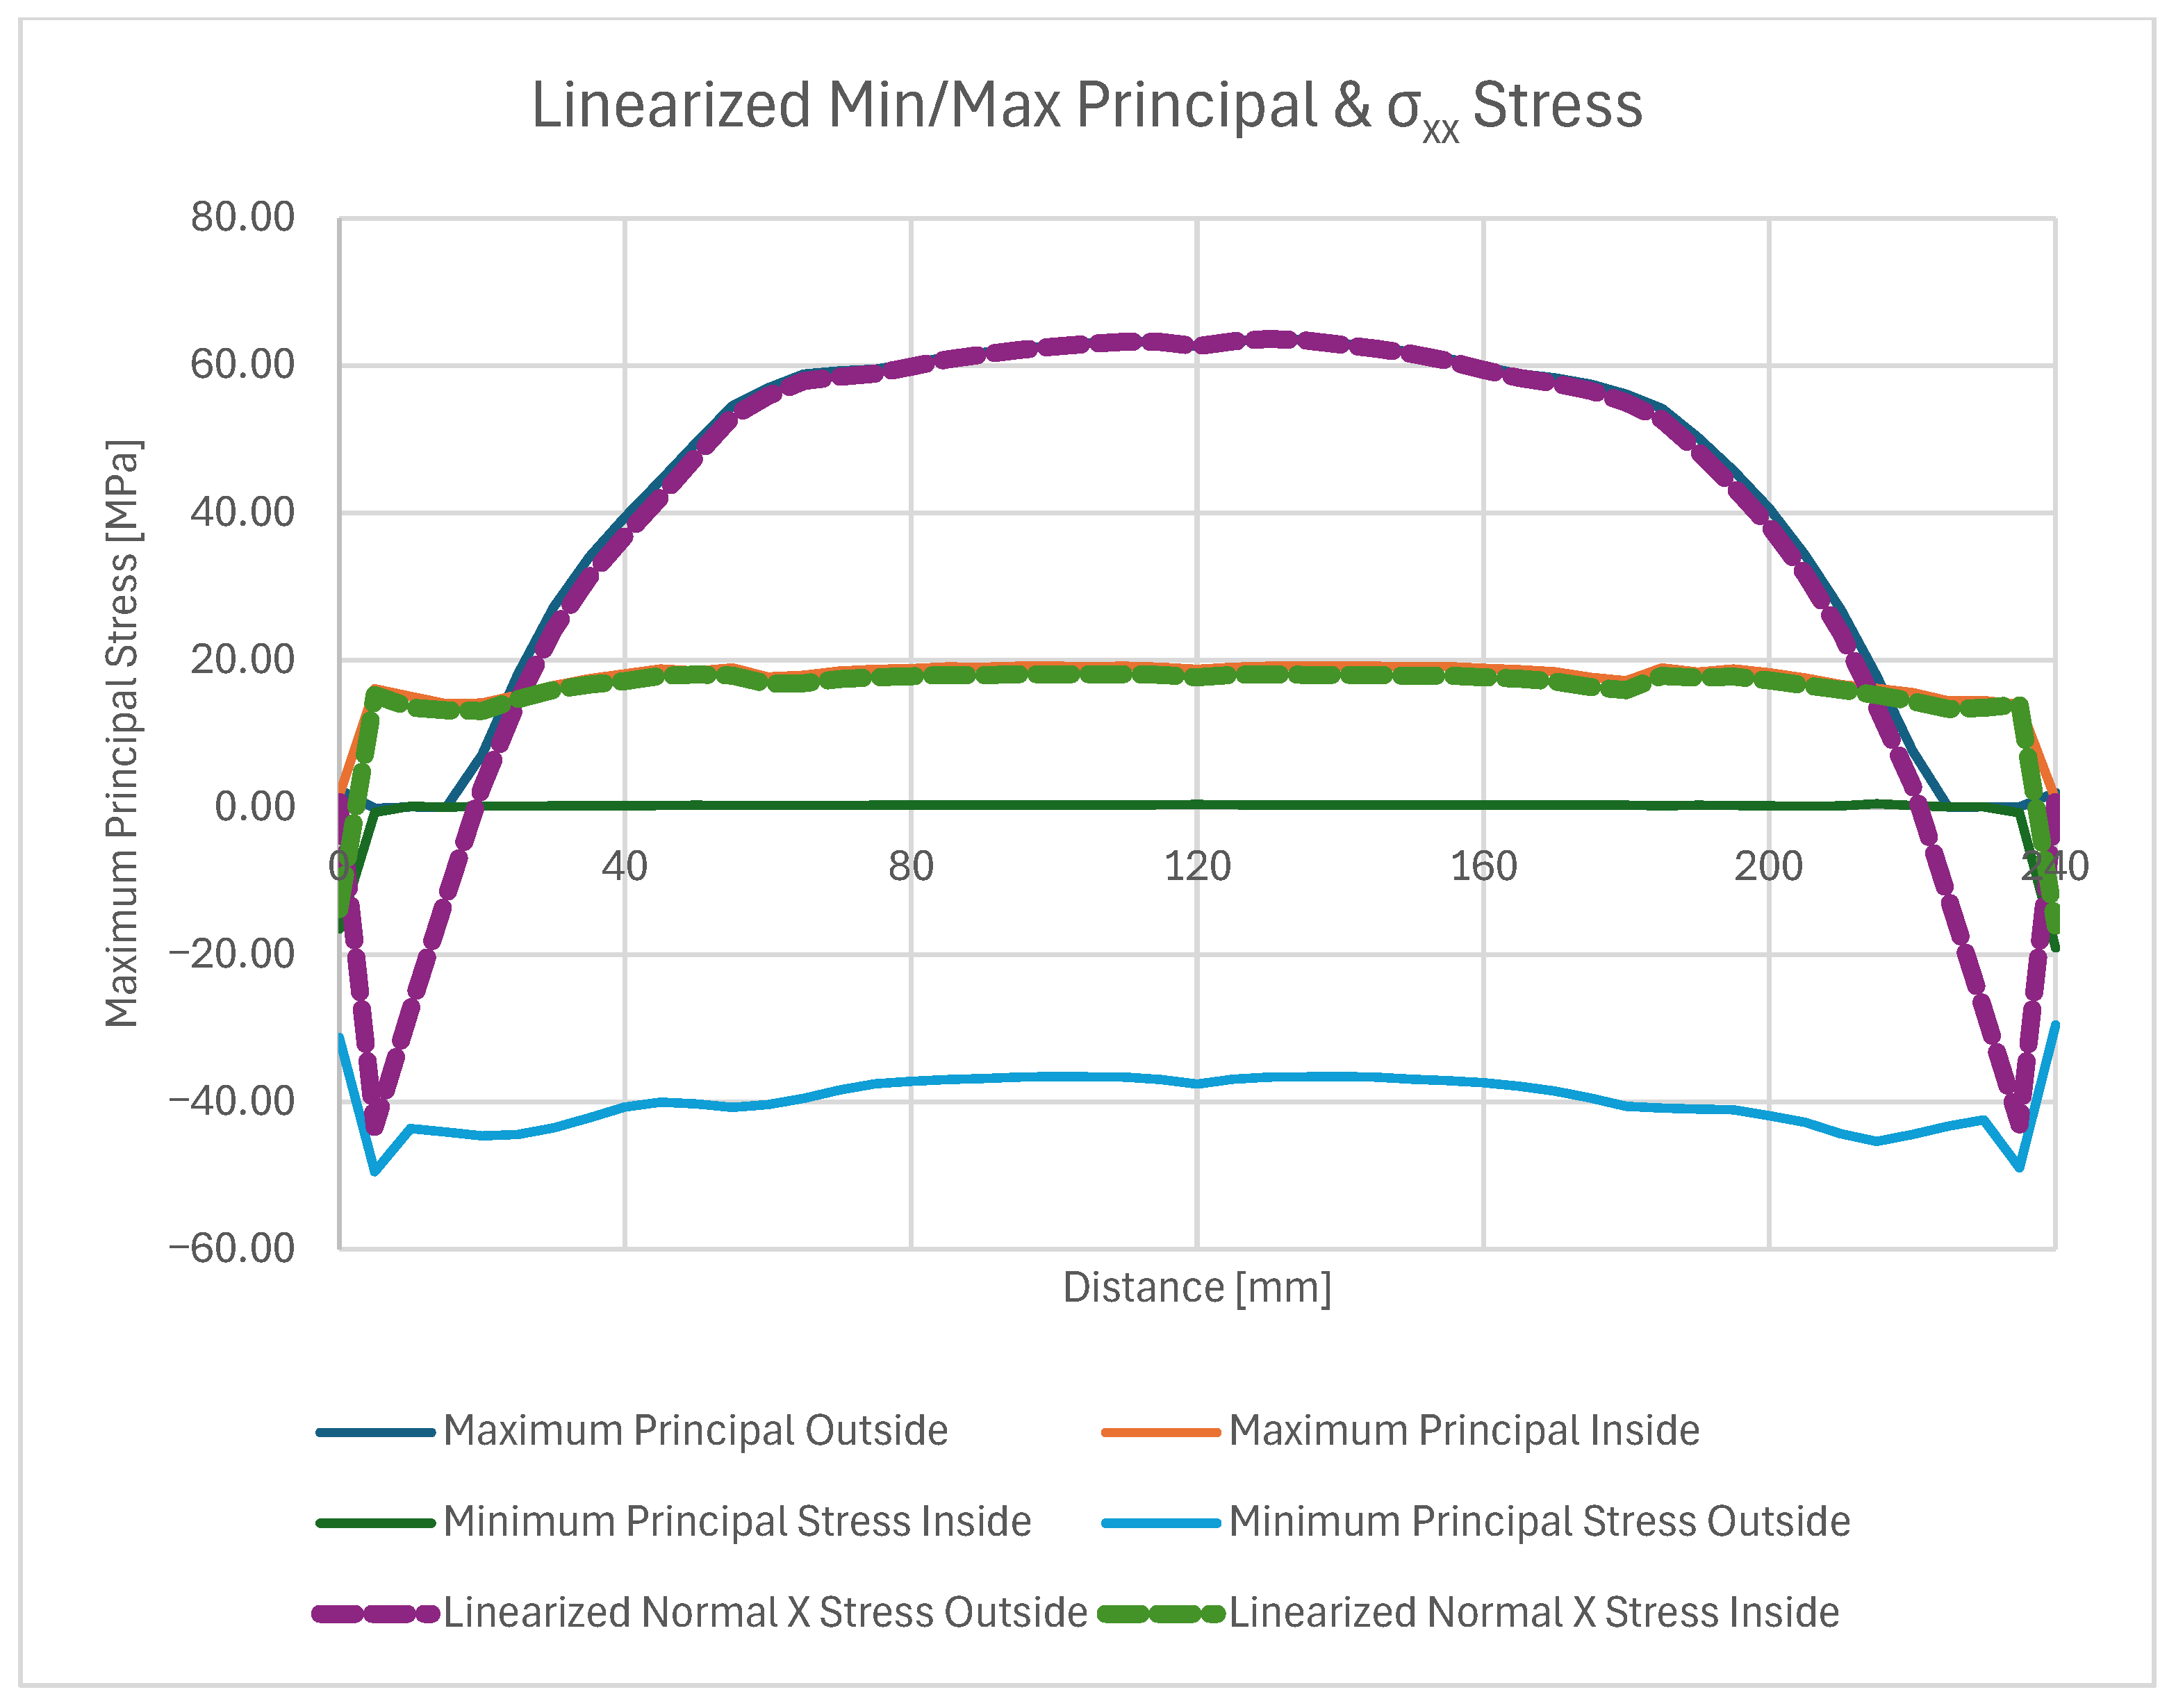
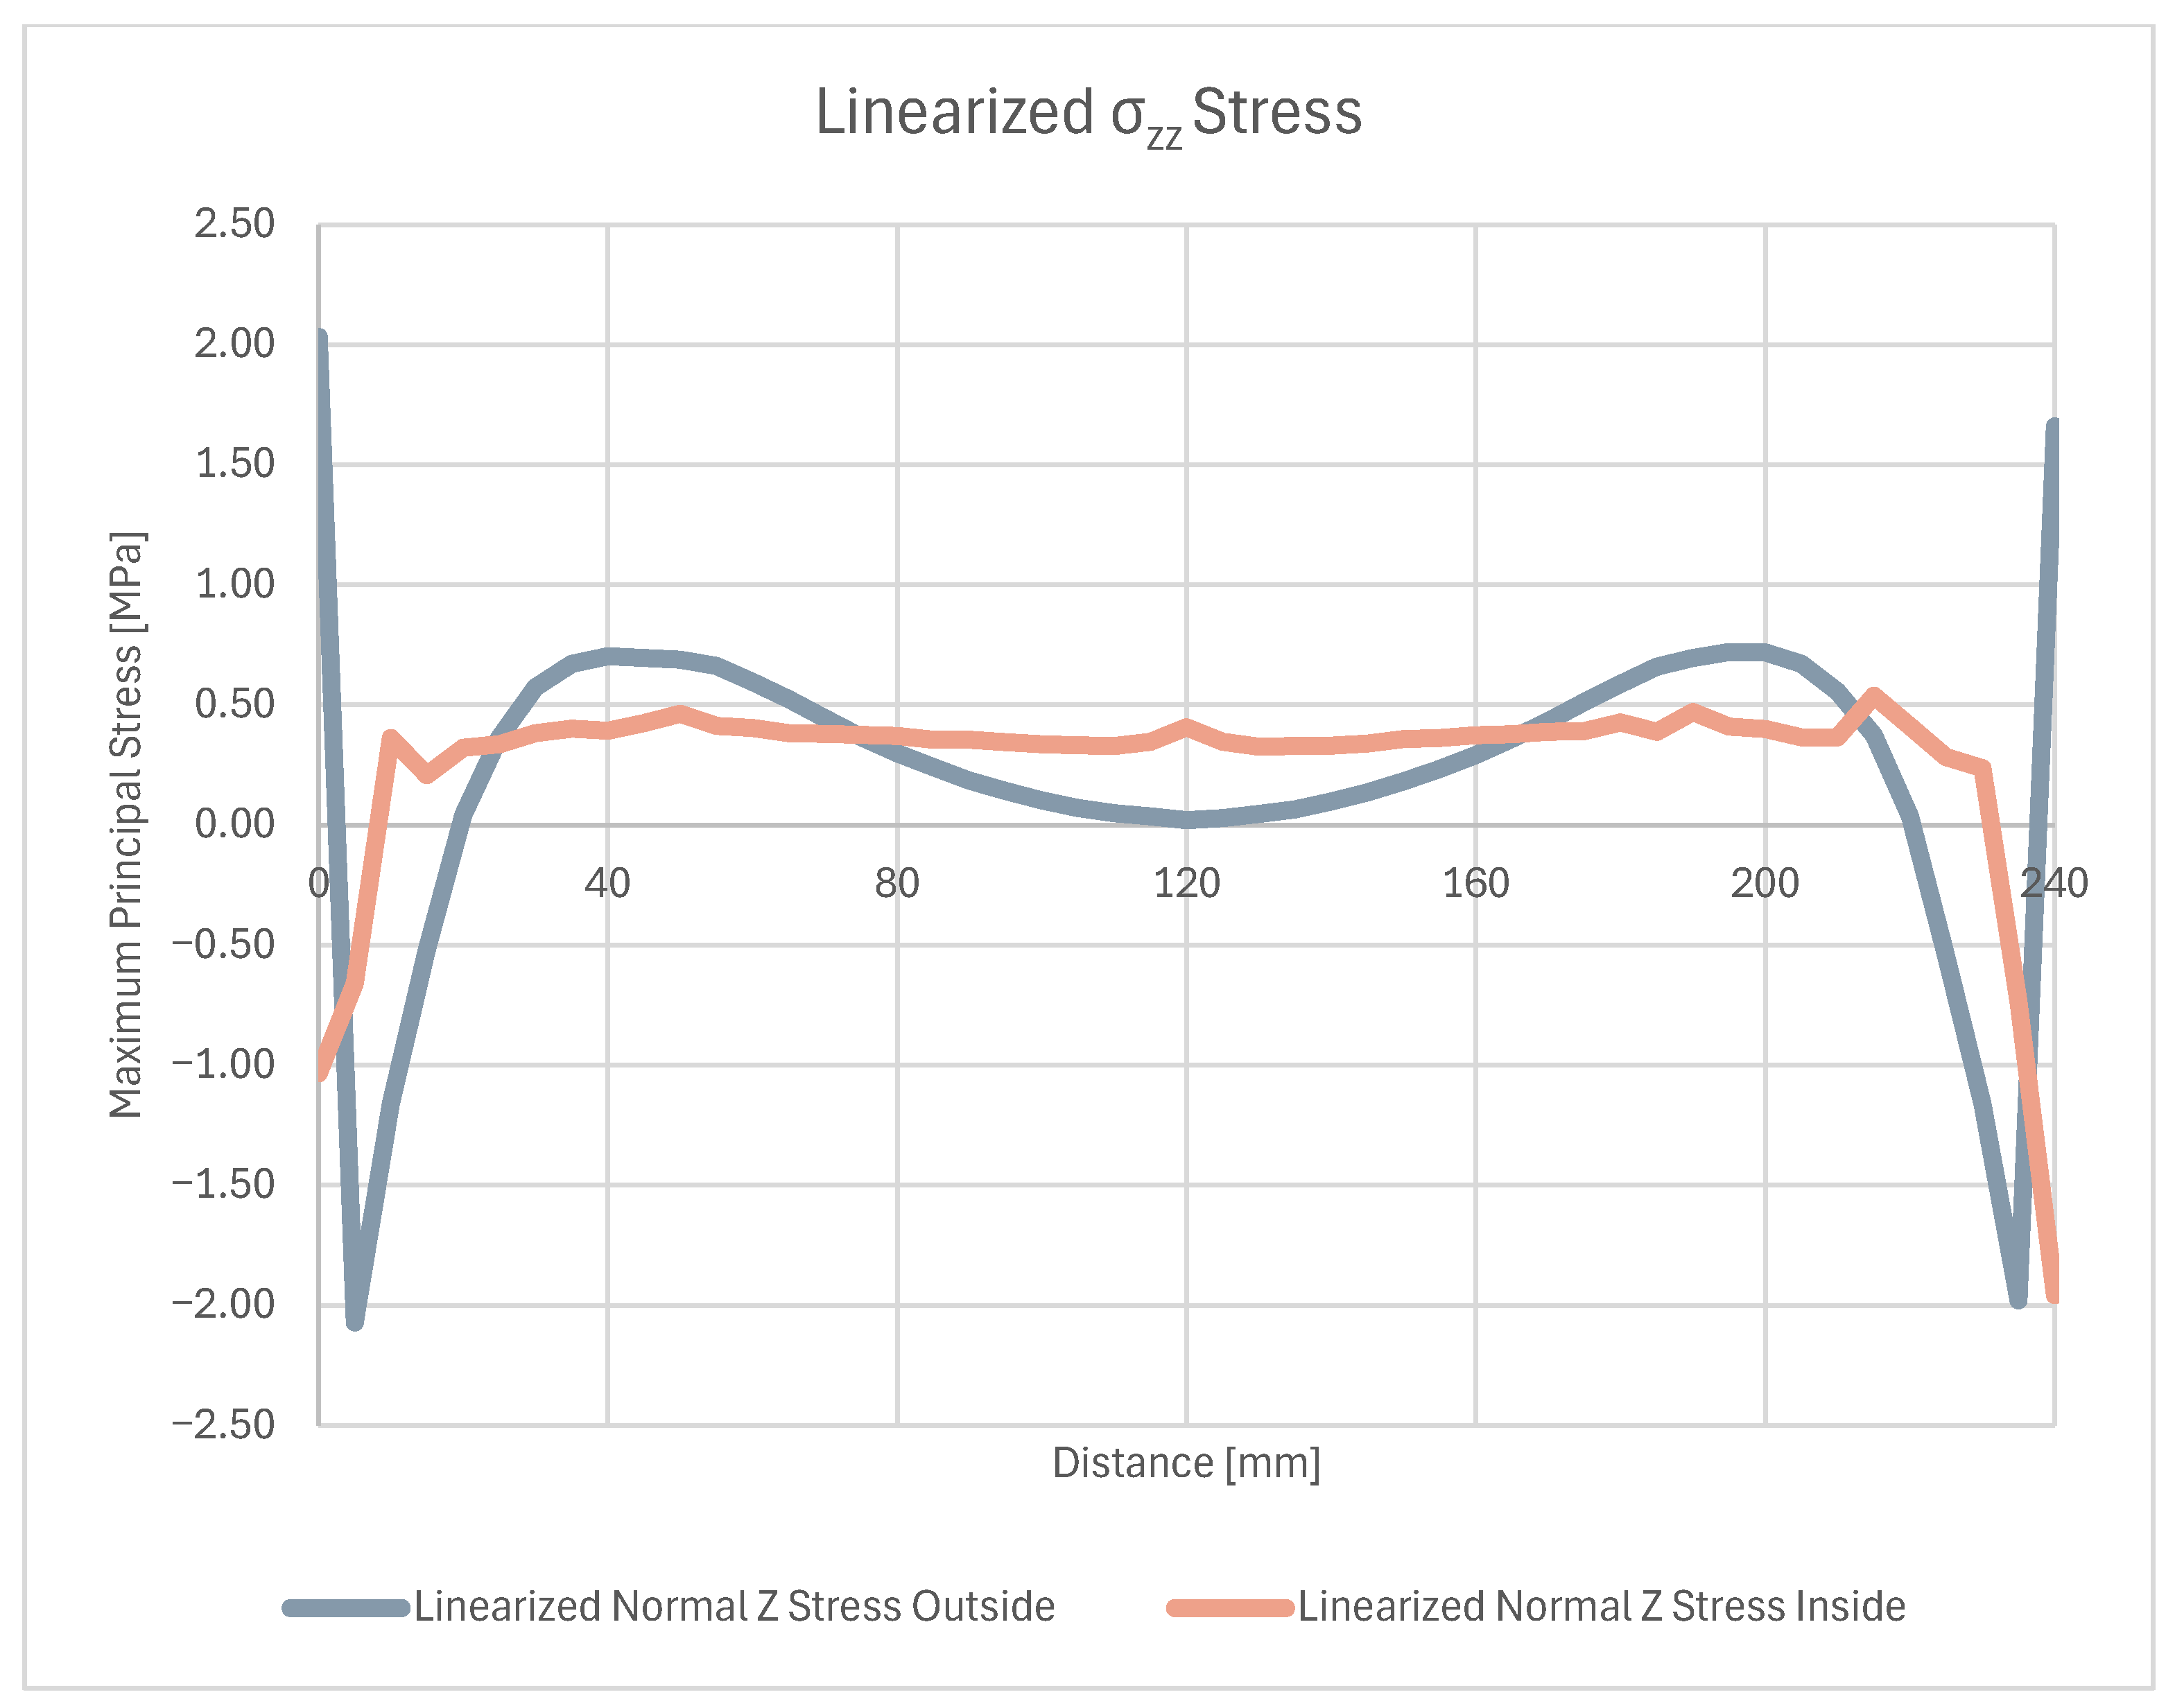
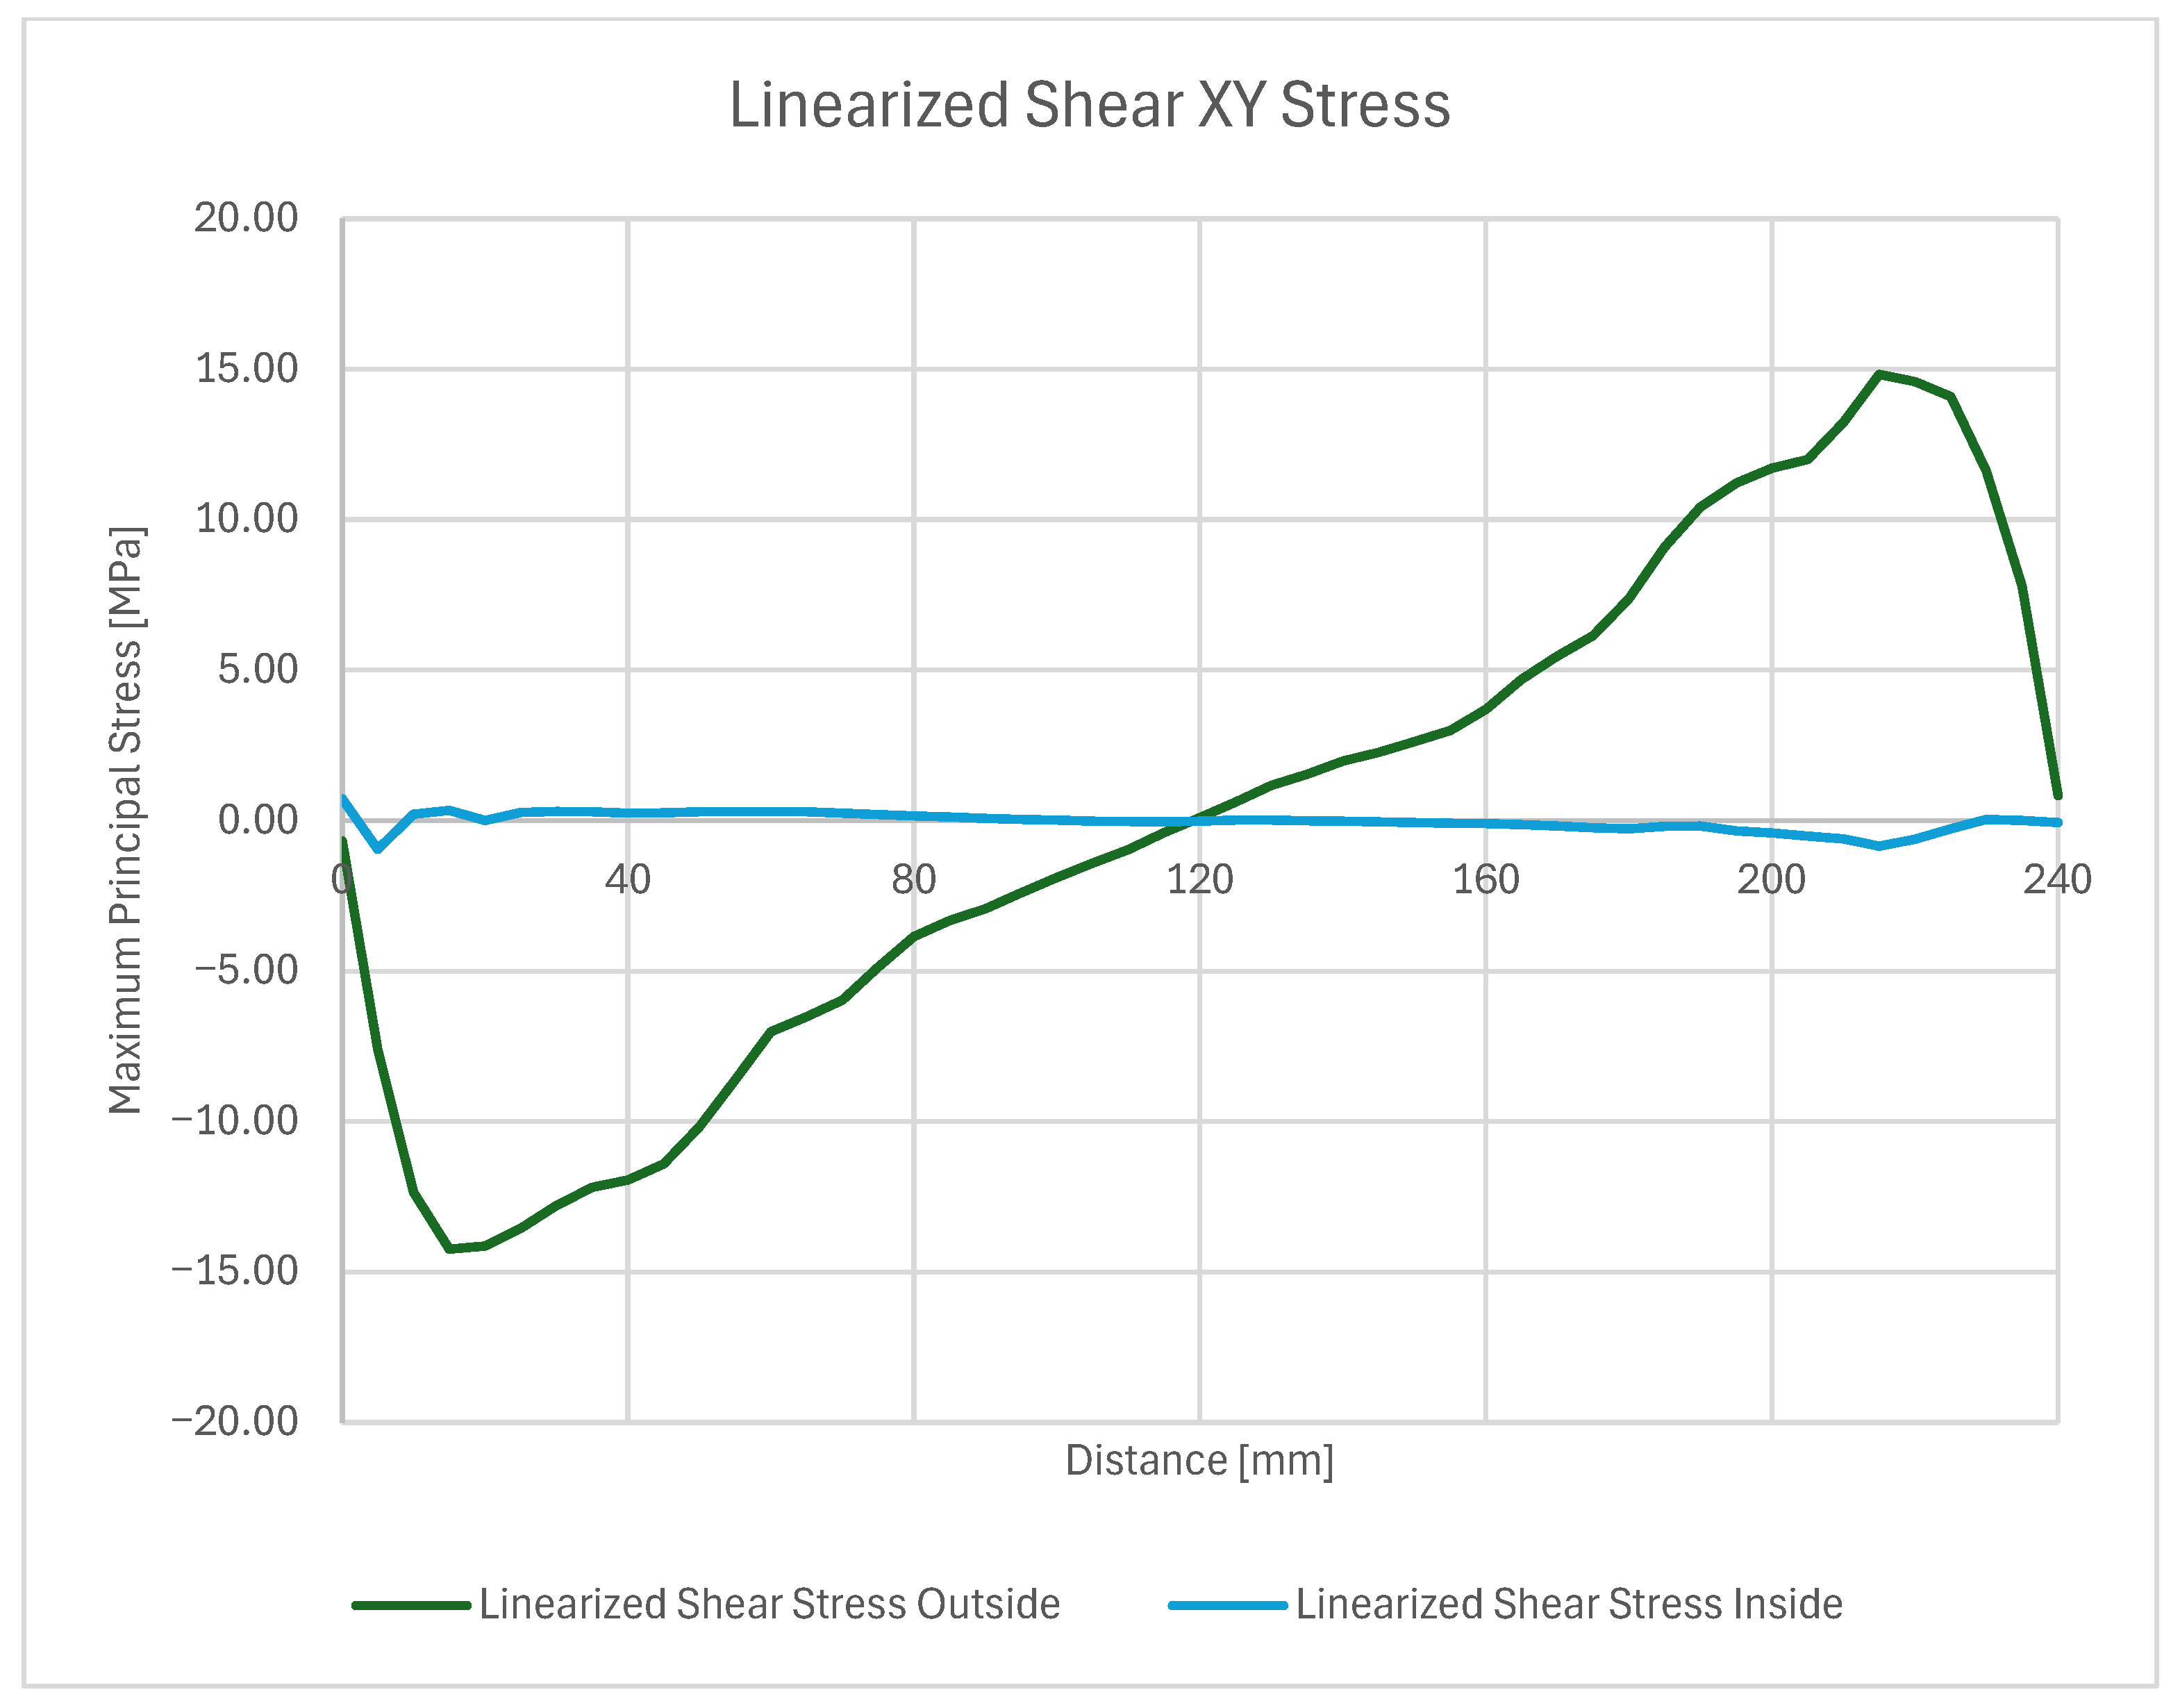
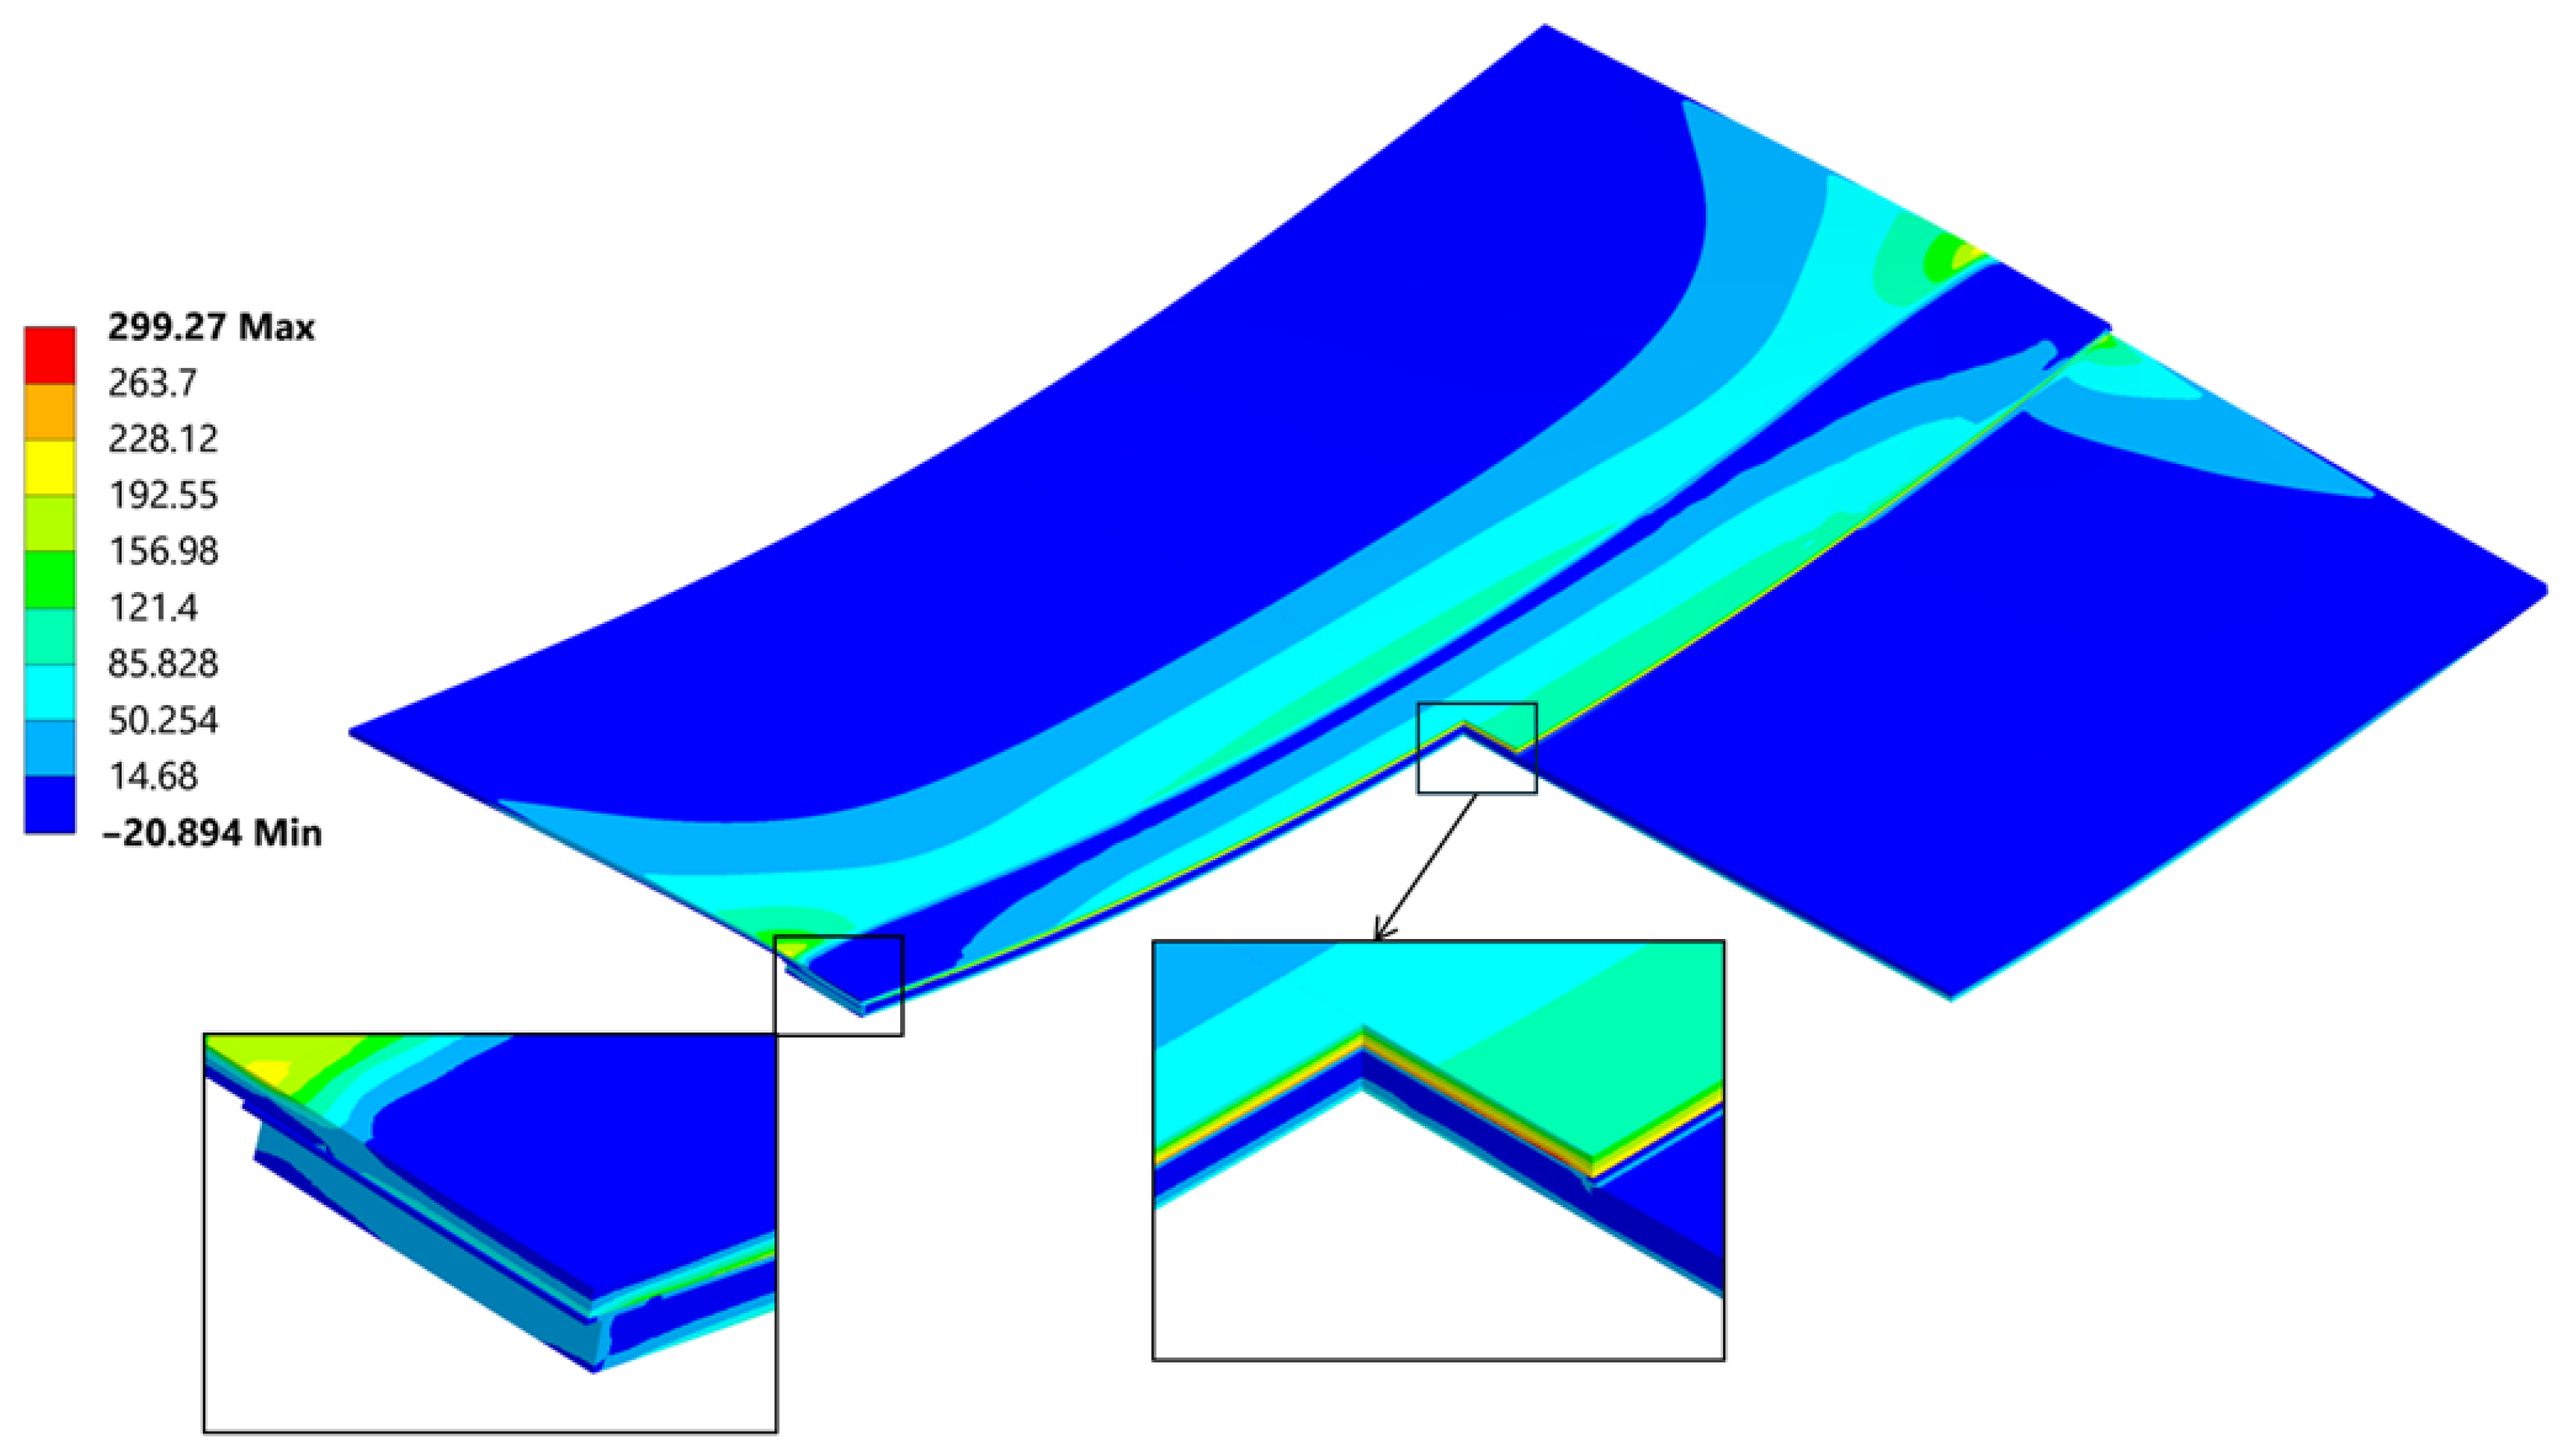
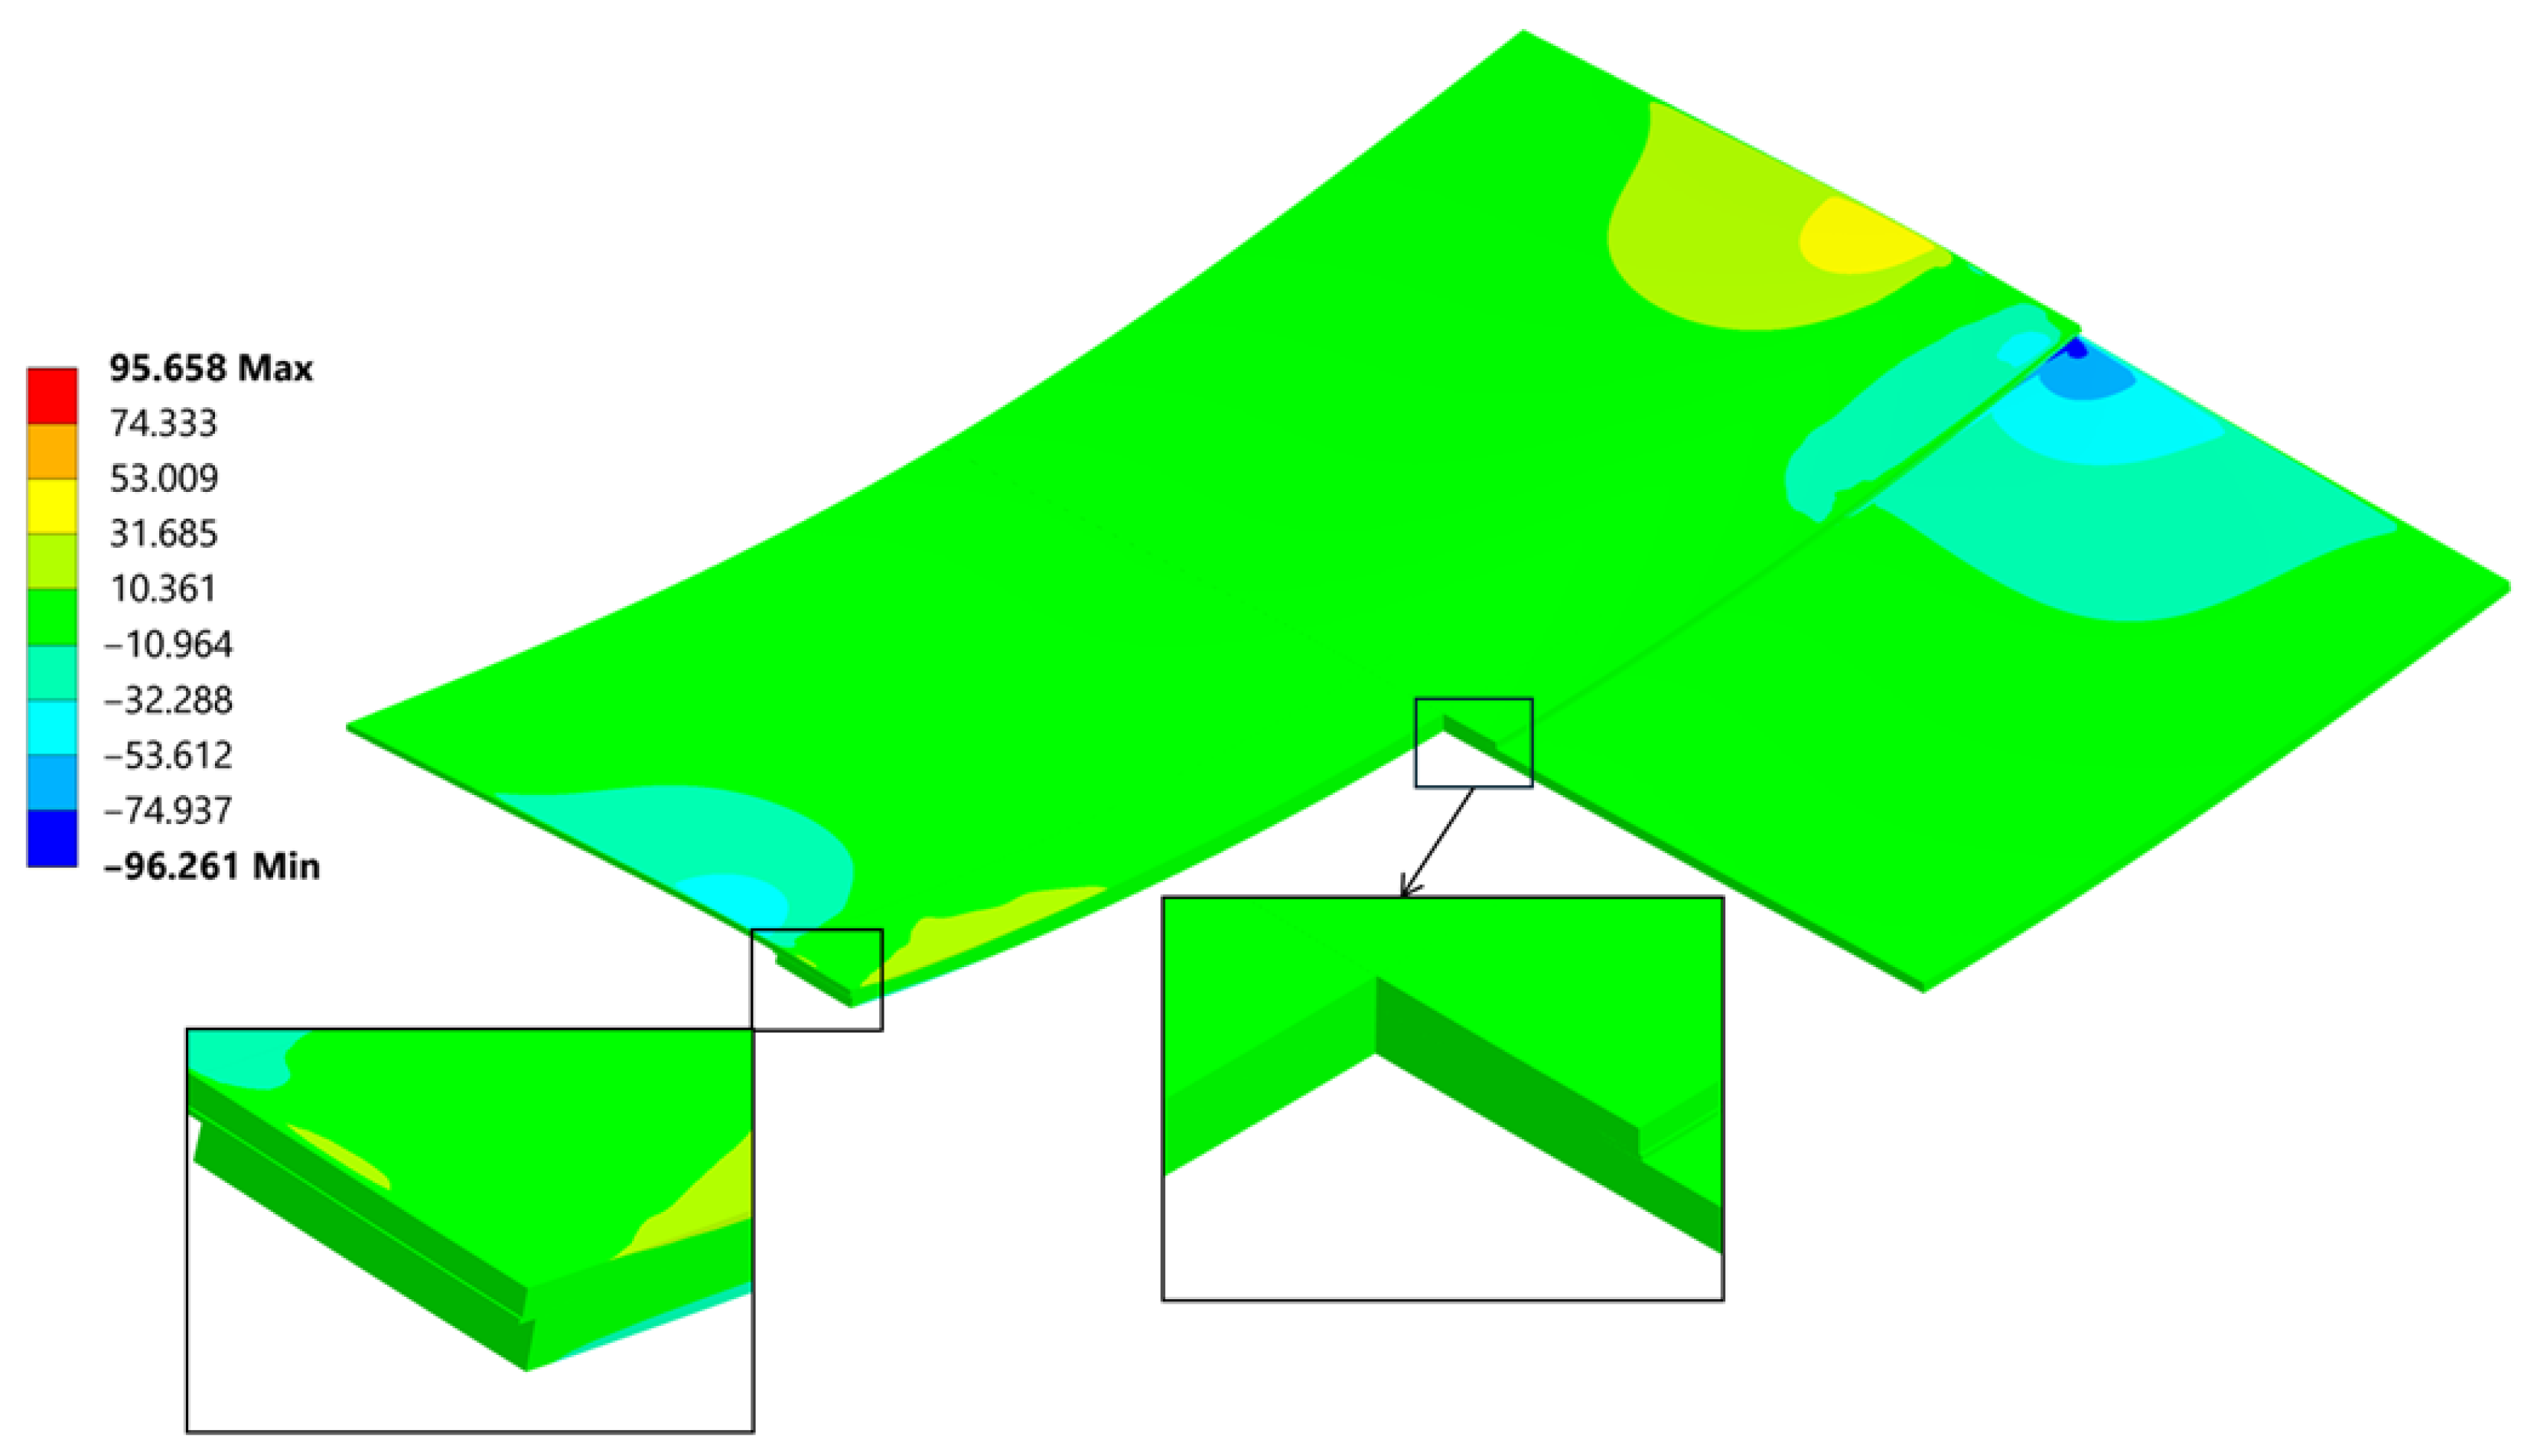
Two stress paths were created and considered. One (A) is on the inner side of the bond, at the weld face, the other (B) is on the outer face of the composite. A thorough comparison of the stress along these paths is provided (Figure 28, Figure 29 and Figure 30) followed by full principal and shear stress plots (Figure 31, Figure 32 and Figure 33).
Similarly, in the case of shear stress, the obtained result deviates by approximately 8% from the analytical assumptions. The shear stress in the analytical calculation was estimated with the bending constrained. This simplification led to higher results.
Figure 34, Figure 35, Figure 36, Figure 37, Figure 38 and Figure 39 showcase the stress and deformation differences for three cycle cases that were tested during welding.
Regarding the highest values of the shear stress at the edge, it must also be noted that the said peak abruptly drops when reaching the inwards of the weld, and when reaching the other edge, rises again, in a different direction; hence, the negative value. A similar phenomenon as with the normal stress is the “peeling” of the bond from the edge, and when the debonding begins, the stress value will translate with it.
The highest stress is present in the most far-reaching faces from the weld, which is somewhat in the middle. The plates that are being bended create a neutral axis [47] where stress is the lowest.

5.4. Deformation and σxx Stress Comparison Throughout Different Thermal Cycles

Below a direct comparison of deflection and σxx stress is presented for different thermal cycles. Results were obtained using Ansys 23R2 software.

6. Summary

The empirical data, hand calculations and finite element results are summarized in Table 6.

6.1. Conclusions

We developed and validated a computational workflow to quantify residual stresses in resistance-welded PC/CF–Al7075 single-lap joints, benchmarking a transient thermal to structural FEM against a Roark and Timoshenko bi-material analytical calculations and direct measurements.
The measured mid-span bow δ was 16.5–16.8 mm and remained constant throughout different temperature gradients (200–240 °C). The hand calculation resulted in a very similar mid-span bow δ at the ΔT = 240 °C with Mean Absolute Percentage Error (MAPE ≈ 11%), while the current FEM under predicted δ (MAPE = 30.25%) but captured a detailed stress distribution: edge-peaked peel σzz inside the bond increasing from −64 to 46 MPa with ΔT, and σxx in aluminum that show up to 12% more compressive stress than the analytical average.
Peel σzz and interface shear τxz peak at lap ends, consistent with Goland–Reissner (secondary bending edge peel) and Volkersen (end shear). These edge concentrations are the correct initiation sites for debonding in welded laps [48,49].
Residual stress implication on the durability is consistent with [18,50] where tensile residual stress increases the crack propagation rate and reduce the fatigue strength. In fracture terms, residual fields alter the effective driving force (energy release rate G): and accelerates, fatigue crack growth [51,52]. Because our joint shows edge-peaked σzzxz, the interface is pre-loaded in mixed Mode I/II at the free edges, elevating initiation risk under cycling—matching durability reports for lap joints [49].
Both analytical calculation and FEM show how bow δ is affected by ΔT, while the test does not. There are two reasons why this might be happening:
-
PC flow/viscoelastic relaxation above Tg: Mismatch strains relax before lock-in, so the residual curvature is less temperature-sensitive, and the behaviour is not represented in the elastic hand calculation or current FEM.
-
Al7075 hot softening/relaxation during dwell/early cooling reduces the recoverable bending moment, further flattening δ(ΔT) [53].
Analytical calculations report higher σxx stress than the FEM, this is because the prior is a section-averaged membrane stress; it cannot resolve edge concentrations. The 3-D FEM resolves secondary bending and shear-lag at the overlap ends; therefore, local σxx near the edges exceed the analytical averages—even when global δ is smaller [54,55].
For durability decisions, the edge peel and shear stress are governing. For the initiation analysis a mixed mode fracture mechanics such as VCCT must be performed to assess the fracture or, in this case, the debonding mode and calculating the release energy; these will be complementing static tests which will provide the necessary data.

6.2. Further Work

Future welds will be run with strain gauge instrumentation and with precise deformation measurements recorded with fibre optics welded in the overlap area. These will precisely measure the residual stress. Step-heating thermography will be complemented with higher-resolution ultrasonic inspection tests. The static tests, lap shear and three-point bending, will be executed to define the residual strength. Low-cycle fatigue tests will be performed with digital image correlation to identify initiation and debonding propagation trends, linking residual fields and edge stress concentrations to measured life.

Author Contributions

Formal analysis, M.P.; Investigation, M.P., K.S., R.S. and P.S.; Writing—original draft, M.P.; Writing—review & editing, P.K. and A.L.; Supervision, P.K.; Project administration, P.K.; data curation, K.S., R.S. and P.S.; performing the tests, K.S., R.S. and P.S.; result collection, K.S., R.S. and P.S. All authors have read and agreed to the published version of the manuscript.

Funding

This research was carried out within the statutory activities of the Łukasiewicz Research Network–Institute of Aviation (ILOT). This research received no external funding.

Institutional Review Board Statement

Not applicable.

Informed Consent Statement

Not applicable.

Data Availability Statement

The original contributions presented in this study are included in the article. Further inquiries can be directed to the corresponding author.

Conflicts of Interest

The authors declare no conflict of interest.

References

  1. Valente, M.; Rossitti, I.; Sambucci, M. Different Production Processes for Thermoplastic Composite Materials: Sustainability versus Mechanical Properties and Processes Parameter. Polymers 2023, 15, 242. [Google Scholar] [CrossRef]
  2. Biron, M. Thermoplastics and Thermoplastic Composites, 3rd ed.; Plastics design library (PDL)—PDL Handbook Series; William Andrew Applied Science Publishers/Elsevier: Oxford, UK, 2018; ISBN 978-0-08-102501-7. [Google Scholar]
  3. Krueger, R.; Bergan, A. Advances in Thermoplastic Composites over Three Decades—A Literature Review; NASA Technical Memorandum; NASA/TM–20240005376; NASA: Washington, DC, USA, 2024. Available online: https://ntrs.nasa.gov/citations/20240005376 (accessed on 27 September 2025).
  4. Sastri, V.R. Plastics in Medical Devices: Properties, Requirements, and Applications, 1st ed.; PDL Handbook Series; Elsevier/William Andrew: Amsterdam, The Netherlands; Boston, MA, USA, 2010; ISBN 978-0-8155-2027-6. [Google Scholar]
  5. Murray, R.E.; Beach, R.; Barnes, D.; Snowberg, D.; Berry, D.; Rooney, S.; Jenks, M.; Gage, B.; Boro, T.; Wallen, S.; et al. Structural Validation of a Thermoplastic Composite Wind Turbine Blade with Comparison to a Thermoset Composite Blade. Renew. Energy 2021, 164, 1100–1107. [Google Scholar] [CrossRef]
  6. Kuleyin, H.; Gümrük, R. The Effect of Poly (Methyl Methacrylate) Content on Chemical, Thermomechanical, Mechanical, and Fatigue Life Characteristics of Ternary PC/ABS/PMMA Blends. Polymers 2025, 17, 1905. [Google Scholar] [CrossRef] [PubMed]
  7. Bondyra, A.; Łusiak, T. Analysis of Strenght Properties of Carbon Fibre-Reinforced Composites. Trans. Aerosp. Res. 2023, 2023, 45–66. [Google Scholar] [CrossRef]
  8. Nagel, L.; Herwig, A.; Schmidt, C.; Horst, P. Numerical Investigation of Residual Stresses in Welded Thermoplastic CFRP Structures. J. Compos. Sci. 2021, 5, 45. [Google Scholar] [CrossRef]
  9. Wu, T.; Ma, Y.; Xia, H.; Geng, P.; Niendorf, T.; Ma, N. Measurement and Simulation of Residual Stresses in Laser Welded CFRP/Steel Lap Joints. Compos. Struct. 2022, 292, 115687. [Google Scholar] [CrossRef]
  10. Sacchetti, F.; Grouve, W.J.B.; Warnet, L.L.; Villegas, I.F. Effect of Cooling Rate on the Interlaminar Fracture Toughness of Unidirectional Carbon/PPS Laminates. Eng. Fract. Mech. 2018, 203, 126–136. [Google Scholar] [CrossRef]
  11. Long, W.; Zhou, X.; Du, B.; Cheng, X.; Su, G.; Chen, L. Enhancing the Lap Shear Performance of Resistance-Welded GF/PP Thermoplastic Composite by Modifying Metal Heating Elements with Silane Coupling Agent. Materials 2024, 17, 4944. [Google Scholar] [CrossRef]
  12. Stankiewicz, K.; Lipkowski, A.; Kowalczyk, P.; Giżyński, M.; Waśniewski, B. Resistance Welding of Thermoplastic Composites, Including Welding to Thermosets and Metals: A Review. Materials 2024, 17, 4797. [Google Scholar] [CrossRef]
  13. Lionetto, F.; Pappadà, S.; Buccoliero, G.; Maffezzoli, A. Finite Element Modeling of Continuous Induction Welding of Thermoplastic Matrix Composites. Mater. Des. 2017, 120, 212–221. [Google Scholar] [CrossRef]
  14. Gouin O’Shaughnessey, P.; Dubé, M.; Fernandez Villegas, I. Modeling and Experimental Investigation of Induction Welding of Thermoplastic Composites and Comparison with Other Welding Processes. J. Compos. Mater. 2016, 50, 2895–2910. [Google Scholar] [CrossRef]
  15. Jiao, J.; Xu, J.; Jing, C.; Sheng, L.; Ru, H.; Xia, H. Laser Welding Process and Strength Enhancement of Carbon Fiber Reinforced Thermoplastic Composites and Metals Dissimilar Joint: A Review. Chin. J. Aeronaut. 2023, 36, 13–31. [Google Scholar] [CrossRef]
  16. Wang, Q.; Jia, Z.; Zhang, B.; Gao, D.; Ma, Y.; Liu, J. Influence of Processing Parameters on Joint Shear Performance in Laser Direct Joining of CFRTP and Aluminum Alloy. Mater. Des. 2021, 209, 109996. [Google Scholar] [CrossRef]
  17. Wu, T.; Tinkloh, S.R.; Tröster, T.; Zinn, W.; Niendorf, T. Determination and Validation of Residual Stresses in CFRP/Metal Hybrid Components Using the Incremental Hole Drilling Method. J. Compos. Sci. 2020, 4, 143. [Google Scholar] [CrossRef]
  18. Guo, Y.; Li, P. Effect of Residual Stress and Microstructure on the Fatigue Crack Growth Behavior of Aluminum Friction Stir Welded Joints. Materials 2024, 17, 385. [Google Scholar] [CrossRef]
  19. Wang, L.; Ni, Z.; Xiao, Y.; Li, Y.; Liu, X.; Chen, Y.; Cui, S.; Zhang, D.; Mi, C.; He, Q. Numerical Strength Analysis of Laser-Welded Differential Housing and Gear Considering Residual Stress. Materials 2023, 16, 4721. [Google Scholar] [CrossRef]
  20. DOT/FAA/AR-MMPDS-01; Metallic Materials Properties Development and Standardization (MMPDS). U.S. Department of Transportation, Federal Aviation Administration: Washington, DC, USA, 2003.
  21. Tanaka, K.; Takemoto, K.; Suzue, M.; Katayama, T. Effects of the Molecular Weight of Polycarbonate on the Mechanical Properties of Carbon Fiber Reinforced Polycarbonate. In Proceedings of the International Conference, Tallinn, Estonia, 28 November–1 December 2017; pp. 327–335. [Google Scholar]
  22. Zhang, S.; Wang, B. Mechanical Properties and Fracture Microstructure of Polycarbonate under High Strain Rate Tension. Materials 2023, 16, 3386. [Google Scholar] [CrossRef]
  23. Dobrzański, P.; Oleksiak, W. Design and Analysis Methods for Composite Bonded Joints. Trans. Aerosp. Res. 2021, 2021, 45–63. [Google Scholar] [CrossRef]
  24. ECSS-E-HB-32-21; A Space Engineering Adhesive Boding Handbook. ESA Requirements and Standards Division: Noordwijk, The Netherlands, 2011.
  25. Baker, A.; Rose, F.; Jones, R. Advances in the Bonded Composite Repair of Metallic Aircraft Structure; Elsevier: Amsterdam, The Netherlands, 2003; Volume 1. [Google Scholar]
  26. Bonpain, B.; Stommel, M. Influence of Surface Roughness on the Shear Strength of Direct Injection Molded Plastic-Aluminum Hybrid-Parts. Int. J. Adhes. Adhes. 2018, 82, 290–298. [Google Scholar] [CrossRef]
  27. Waśniewski, B. Duroplasty oraz termoplasty wysokotemperaturowe w prepregach jako osłony kompozytów węglowych do wytwarzania struktur lotniczych. PIL 2016, 243, 28–39. [Google Scholar] [CrossRef]
  28. Dobrzański, P. Bonding of High Temperature Thermoplastic Carbon Composites with Resistance Welding Technique. Trans. Aerosp. Res. 2018, 2018, 1–13. [Google Scholar] [CrossRef]
  29. Hou, M.; Ye, L.; Mai, Y.-W. An Experimental Study of Resistance Welding of Carbon Fibre Fabric Reinforced Polyetherimide (CF Fabric/PEI) Composite Material. Appl. Compos. Mater. 1999, 6, 35–49. [Google Scholar] [CrossRef]
  30. Stavrov, D.; Bersee, H. Resistance Welding of Thermoplastic Composites-an Overview. Compos. Part A Appl. Sci. Manuf. 2005, 36, 39–54. [Google Scholar] [CrossRef]
  31. Hyla, B.; Sobczak, M.; Synaszko, P.; Roemer, J. Laser Spot Thermography and Pulse Thermography—Comparison of Performance for Non-Destructive Testing of Composite Structures. Int. J. Multiphys. 2023, 17, 91. [Google Scholar] [CrossRef]
  32. Kamińska, P.; Ziemkiewcz, J.; Synaszko, P.; Dragan, K. Comparison of Pulse Thermography (PT) and Step Heating (SH) Thermography in Non-Destructive Testing of Unidirectional GFRP Composites. Fatigue Aircr. Struct. 2019, 2019, 87–102. [Google Scholar] [CrossRef]
  33. Okolie, O.; Latto, J.; Faisal, N.; Jamieson, H.; Mukherji, A.; Njuguna, J. Manufacturing Defects in Thermoplastic Composite Pipes and Their Effect on the In-Situ Performance of Thermoplastic Composite Pipes in Oil and Gas Applications. Appl. Compos. Mater. 2023, 30, 231–306. [Google Scholar] [CrossRef]
  34. Tammas-Williams, S.; Withers, P.J.; Todd, I.; Prangnell, P.B. The Influence of Porosity on Fatigue Crack Initiation in Additively Manufactured Titanium Components. Sci. Rep. 2017, 7, 7308. [Google Scholar] [CrossRef]
  35. Young, W.C.; Budynas, R.G.; Roark, R.J. Roark’s Formulas for Stress and Strain, 7th ed.; McGraw-Hill International Edition, General Engineering Series; Reprint; McGraw-Hill: New York, NY, USA, 2011; ISBN 978-0-07-072542-3. [Google Scholar]
  36. Pradere, C.; Sauder, C. Transverse and Longitudinal Coefficient of Thermal Expansion of Carbon Fibers at High Temperatures (300–2500K). Carbon 2008, 46, 1874–1884. [Google Scholar] [CrossRef]
  37. Abdullah, F.; Okuyama, K.; Fajardo, I.; Urakami, N. In Situ Measurement of Carbon Fibre/Polyether Ether Ketone Thermal Expansion in Low Earth Orbit. Aerospace 2020, 7, 35. [Google Scholar] [CrossRef]
  38. Geng, Z.; Yu, S.; Wang, S.; Tian, Z.; Gao, Z.; Wang, K.; Li, Y. Advances in Resistance Welding of Fiber-Reinforced Thermoplastics. Materials 2024, 17, 4693. [Google Scholar] [CrossRef]
  39. Lan, S.; Lee, H.-J.; Lee, S.-H.; Ni, J.; Lai, X.; Lee, H.-W.; Song, J.-H.; Lee, M.G. Experimental and Numerical Study on the Viscoelastic Property of Polycarbonate near Glass Transition Temperature for Micro Thermal Imprint Process. Mater. Des. 2009, 30, 3879–3884. [Google Scholar] [CrossRef]
  40. Principles of Heat and Mass Transfer, 7th ed.; Incropera, F.P., DeWitt, D.P., Bergman, T.L., Lavine, A.S., Eds.; International Student Version; Wiley: Hoboken, NJ, USA, 2013; ISBN 978-0-470-50197-9. [Google Scholar]
  41. NASA. Materials Data Handbook: Aluminum Alloy 7075, 2nd ed.; Contract Number NAS8-25644; Western Applied Research & Development, Inc.: San Carlos, CA, USA, 1972.
  42. ISO-11359-2-2021; Plastics—Thermomechanical Analysis (TMA)—Part 2: Determination of Coefficient of Linear Thermal Expansion and Glass Transition Temperature. International Organization for Standardization: Geneva, Switzerland, 2021.
  43. Dong, C.; Li, K.; Jiang, Y.; Arola, D.; Zhang, D. Evaluation of Thermal Expansion Coefficient of Carbon Fiber Reinforced Composites Using Electronic Speckle Interferometry. Opt. Express 2018, 26, 531. [Google Scholar] [CrossRef]
  44. Tsivouraki, N.; Tserpes, K.; Sioutis, I. Modelling of Fatigue Delamination Growth and Prediction of Residual Tensile Strength of Thermoplastic Coupons. Materials 2024, 17, 362. [Google Scholar] [CrossRef] [PubMed]
  45. Ma, C.; Tian, Y.; Gong, Y.; Zhang, J.; Qi, H.; Wang, C. Study of the Effect of Curing Residual Stress on the Bonding Strength of the Single Lap Joint Using a High-Temperature Phosphate Adhesive. Materials 2018, 11, 1198. [Google Scholar] [CrossRef] [PubMed]
  46. Chen, W.T.; Nelson, C.W. Thermal Stressin Bonded Joints. IBM J. Res. Dev. 1979, 23, 179–188. [Google Scholar] [CrossRef]
  47. Timošenko, S.P.; Woinowsky-Krieger, S. Theory of Plates and Shells, 2nd ed.; McGraw-Hill Classic Textbook Reissue; [Nachdr.]; McGraw-Hill: New York, NY, USA, 1996; ISBN 978-0-07-064779-4. [Google Scholar]
  48. Reeder, J.R. 3D Mixed-Mode Delamination Fracture Criteria—An Experimentalist’s Perspective. In Damage in Composites; Springer: Berlin/Heidelberg, Germany, 2006. [Google Scholar]
  49. Rodríguez, R.Q.; Sollero, P.; Rodrigues, M.B.; de Albuquerque, É.L. Stress analysis and failure criteria of adhesive bonded single lap joints. In Proceedings of the 21st International Congress of Mechanical Engineering, Natal, RN, Brazil, 24–28 October 2011. [Google Scholar]
  50. Zheng, X.; Li, D.; Liao, W.; Zhang, H. Residual Stress and Fatigue Strength Analysis of Stiffener Welds of Steel-Plate Composite Girder Bridge Considering Welding Sequence. Buildings 2024, 14, 1801. [Google Scholar] [CrossRef]
  51. El Shrief, E.; El-Megharbel, A.; El Domiaty, A.; Abd El-Hafez, H. Residual Stress Effects on Fatigue Crack Propagation in Butt–Welded Joints for 304 Stainless Steel Sheets. Manuf. Rev. 2021, 8, 19. [Google Scholar] [CrossRef]
  52. Malekinejad, H.; Carbas, R.J.C.; Akhavan-Safar, A.; Marques, E.A.S.; Castro Sousa, F.; Da Silva, L.F.M. Enhancing Fatigue Life and Strength of Adhesively Bonded Composite Joints: A Comprehensive Review. Materials 2023, 16, 6468. [Google Scholar] [CrossRef]
  53. Öchsner, A.; da Silva, L.F.M. Modeling of Adhesively Bonded Joints; Springer: Berlin/Heidelberg, Germany; London, UK, 2008; ISBN 978-3-540-79056-3. [Google Scholar]
  54. Withers, P.J.; Bhadeshia, H.K.D.H. Residual Stress. Part 1—Measurement Techniques. Mater. Sci. Technol. 2001, 17, 355–365. [Google Scholar] [CrossRef]
  55. Neto, D.M.; Borges, M.F.; Sérgio, E.R.; Antunes, F.V. Effect of Residual Stresses on Fatigue Crack Growth: A Numerical Study Based on Cumulative Plastic Strain at the Crack Tip. Materials 2022, 15, 2156. [Google Scholar] [CrossRef]
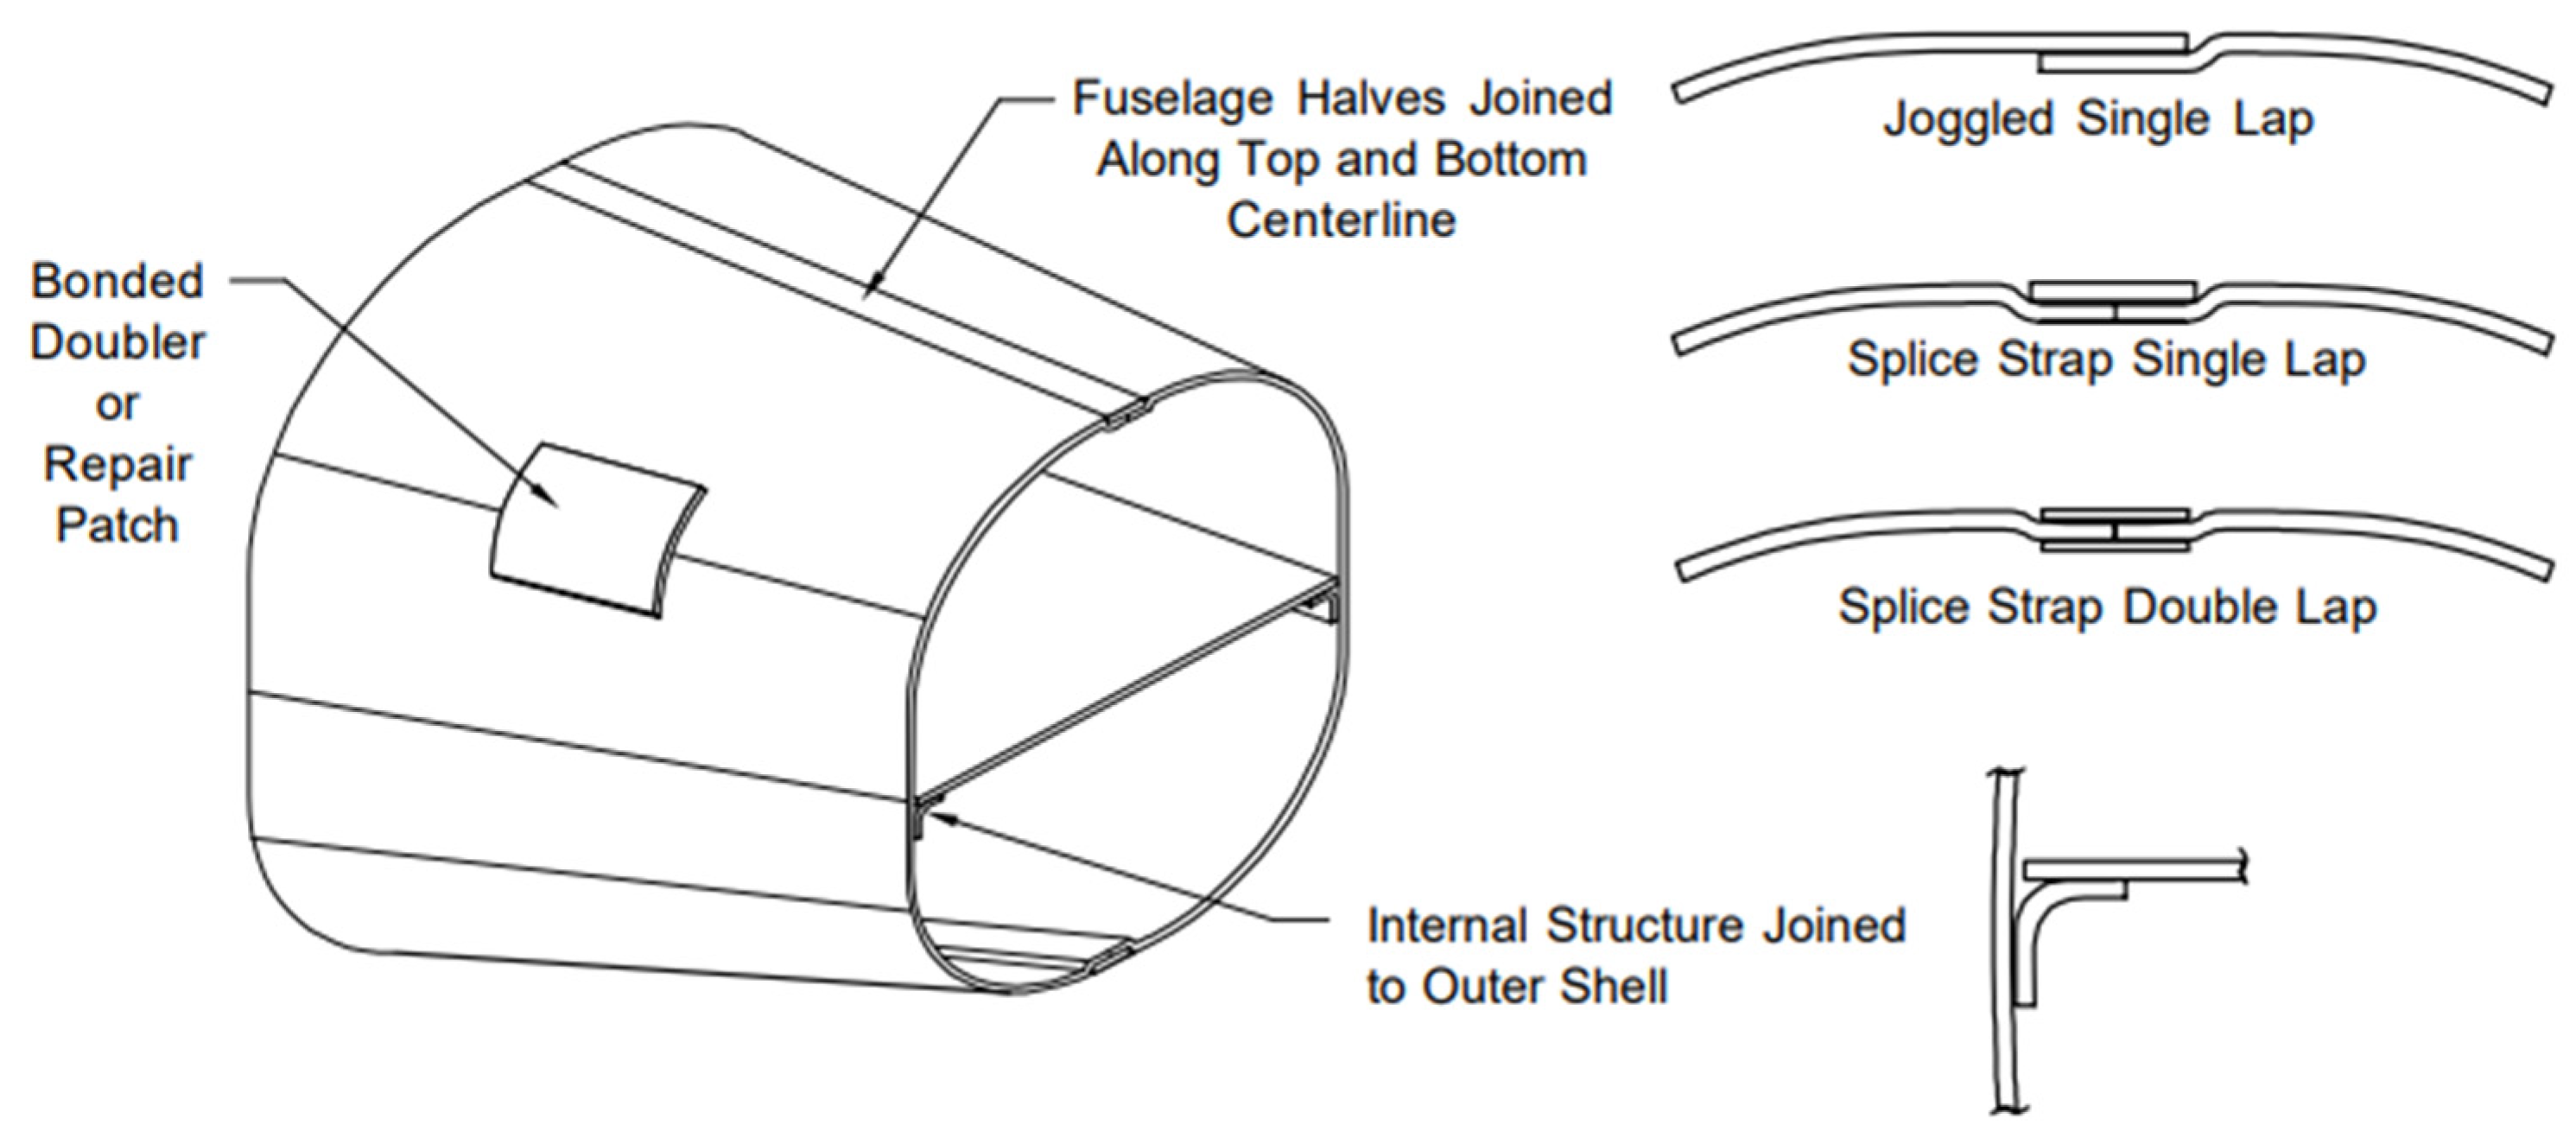
Figure 1. Typical examples of SLJ usage [24].
Materials 18 04962 g001
Figure 2. Aluminum plate surface preparation.
Materials 18 04962 g002
Figure 3. The influence of the surface roughness on the tangential stress.
Materials 18 04962 g003
Figure 4. Illustration of the welding process.
Materials 18 04962 g004
Figure 6. Welding process: temperature [°C], pressure [bar], time [s].
Materials 18 04962 g006
Figure 8. Deformation of the plates due to the residual stress.
Materials 18 04962 g008
Figure 9. Thermographic testing samples.
Materials 18 04962 g009
Figure 10. Thermographic pictures of the samples.
Materials 18 04962 g010
Figure 11. Bi-material strip, pre- and post-welding.
Materials 18 04962 g011
Figure 14. The effect of temperature on the coefficient of thermal expansion in aluminum 7075 [41].
Materials 18 04962 g014
Figure 15. The effect of temperature on the Specific Heat (C) on aluminum 7075 [41].
Materials 18 04962 g015
Figure 16. The effect of temperature on the stress–strain relation of the aluminum 7075 [41].
Materials 18 04962 g016
Figure 17. Stress–strain plot polycarbonate (PC) (left) [22]. The effect of temperature on the coefficient of thermal expansion of CFRP laminate (right) [43].
Materials 18 04962 g017
Figure 18. The CAD model.
Materials 18 04962 g018
Figure 19. FEM mesh closeup.
Materials 18 04962 g019
Figure 20. Pressure and temperature application in Ansys Mechanical 2023®.
Materials 18 04962 g020
Figure 21. Temperature distribution at peak temperature [°C].
Materials 18 04962 g021
Figure 22. Deformation after cooling.
Materials 18 04962 g022
Figure 23. Cross section throughout the joint and a mesh including magnification of von Mises stress [MPa].
Materials 18 04962 g023
Figure 24. A stress path has been created on the inner (the bonding) and outer face of the aluminum plate.
Materials 18 04962 g024
Figure 25. Linearized path stress (von Mises [MPa]).
Materials 18 04962 g025
Figure 26. Normal Stress, σxx direction in the sample and the weld cut-out magnification.
Materials 18 04962 g026
Figure 27. Normal stress σzz distribution inside the weld and at the weld edge.
Materials 18 04962 g027
Figure 28. Linearized first and third principal stress.
Materials 18 04962 g028
Figure 29. Linearized normal Z direction stress.
Materials 18 04962 g029
Figure 30. Linearized shear and normal stress plot.
Materials 18 04962 g030
Figure 31. Maximum principal stress.
Materials 18 04962 g031
Figure 32. Minimum principal stress.
Materials 18 04962 g032
Figure 33. Shear stress result at the end of the 20 °C–260 °C–20 °C cycle.
Materials 18 04962 g033
Figure 34. Plate deformation at the end of the 20 °C–220 °C–20 °C cycle.
Materials 18 04962 g034
Figure 35. Normal σxx stress results at the end of the 20 °C–220 °C–20 °C cycle.
Materials 18 04962 g035
Figure 36. Deformation at the end of the 20 °C–240 °C–20 °C cycle.
Materials 18 04962 g036
Figure 37. Normal σxx stress results at the end of the 20 °C–240 °C–20 °C cycle.
Materials 18 04962 g037
Figure 38. Deformation at the end of the 20 °C–260 °C–20 °C cycle.
Materials 18 04962 g038
Figure 39. Normal σxx stress results at the end of the 20 °C–260 °C–20 °C cycle.
Materials 18 04962 g039
Table 1. Sample parameters.
SampleT1 [°C]T2 [°C]t [mm] ThicknessΔ [mm]
Displacement
L [mm] LengthB [mm] Width
AL-CPC-01202602.8416.7124030
AL-CPC-02202403.0216.9724030
AL-CPC-03202202.8516.7824030
Table 2. Input data.
Parameter *PC/CF (Layer a)Al 7075 (Layer b)
Thickness t [mm]1.81.0
E [GPa]4872
υ [-]0.30.3
CTE α [1/K]1.5 × 10−6 **23 × 10−6
* The reported parameters in the table above are at room temperature. ** The PC/CF supplier states that the CTE = 5 × 10⁻⁶, this value however did not correlate with the results. Published CFRP measurements place the fibre direction CTE in the 1–2 × 10⁻⁶ [°C−1] range, and thermoplastic CFRP laminates (e.g., CF/PEEK) exhibit 3 × 10⁻⁶ [°C−1] near room temperature; our welded, fibre-rich CF/PC overlap, therefore, uses an effective in-plane CTE of 1.5 × 10⁻⁶ [°C−1], which is consistent with the fibre dominated literature and results in a similar deflection value as the measured samples [36,37].
Table 3. Shear stress in the joint.
ΔT [K]Curvature κ [1/m]Bow δ Calculated [mm]Bow δ Measured [mm]Error [%] σ x x [MPa]
200−1.87213.4816.779−19.66−159.9
220−2.05914.8316.542−10.35−175.8
240−2.24616.1716.71−3.23−191.8
Table 4. CFPC datasheet (ensingerplastics.com; accessed on 19 September 2024).
ParameterValueUnit
Fibre typecarbon HT 3 k-
Fibre architecturetwill 2/2-
Fibre areal weight200g/m2
Tensile strength440MPa
Modulus of elasticity (tensile test)48,000MPa
Flexural strength615MPa
Modulus of elasticity (flexural test)48,000MPa
Compression strength215MPa
Glass transition temperature143°C
Service temperature (short term)140°C
Service temperature (long term)120°C
Thermal expansion (CLTE)510−6 K−1
Drying temperature120°C
Drying time3h
Table 5. Polycarbonate parameters.
PropertyValue
Young Modulus [GPa]2.5
Poisson’s Coefficient0.34
Coefficient of thermal expansion0.65 × 10−4
Heat Conductivity [m−1K−1]0.2
Specific Heat [kJ kg−1K−1]1.2
Table 6. Summary.
Table 6. Summary.
ParameterΔT = 200 °CΔT = 220 °CΔT = 240 °C
δ test [mm]16.7816.5416.71
δ analytical [mm]13.4814.8316.17
δ error analytical [%]−19.67−10.34−3.23
δ FEM [mm]10.8812.0512.98
δ error FEM [%]−34.88−30.5−21.21
σxx analytical [MPa]−159.9−175.8−191.8
Linearized σxx FEM [MPa]43.2155.663.63
Δσxx FEM vs. analytical [%]1.087.3610.28
Linearized σzz FEM (edge) [MPa]−1.75−1.93−2.07
Disclaimer/Publisher’s Note: The statements, opinions and data contained in all publications are solely those of the individual author(s) and contributor(s) and not of MDPI and/or the editor(s). MDPI and/or the editor(s) disclaim responsibility for any injury to people or property resulting from any ideas, methods, instructions or products referred to in the content.