Article

Experimental and DEM Study on the Mechanical Behaviors of Sand–Fines Mixtures with Different Fines Contents and Particle Size Ratios

1
Department of Civil Engineering, University of Science and Technology Beijing, Beijing 100083, China
2
Second Engineering of CCCC Third Highway Engineering Co., Ltd., Tianjin 301800, China
3
School of Civil and Architectural Engineering, Liaoning University of Technology, Jinzhou 121001, China
*
Author to whom correspondence should be addressed.
Materials 2025, 18(21), 4929; https://doi.org/10.3390/ma18214929
Submission received: 19 September 2025 / Revised: 16 October 2025 / Accepted: 27 October 2025 / Published: 28 October 2025

Abstract

To clarify the regulatory laws of the fines content (FC) and particle size ratio (SR) on the mechanical properties of sand–fines mixtures and reveal the underlying microscopic mechanical mechanisms, this study takes sand–fines mixtures composed of natural river sand and silt as the research object. It systematically investigates the macro-mechanical behaviors and micro-interaction mechanisms of the mixtures by combining laboratory triaxial tests and discrete element method (DEM) simulations. First, through conducting triaxial drained shear tests on mixtures with three particle size ratios (SR = 9.1, 18.7, and 39.7) under seven fines contents (FC = 0%, 10%, 20%, 30%, 50%, 70%, and 100%), it is found that both the peak friction angle (φps) and critical-state friction angle (φcs) of sand–fines mixtures show a “first increase, then decrease” trend with the increase in FC. The peak inflection points of their variation curves are the threshold fines content related to SR; meanwhile, a fines content below this threshold has an inhibitory effect on dilatancy, while that above this threshold exerts a promotive effect on dilatancy. Subsequently, by exploring the microscopic contact behaviors of sand–fines mixtures, it is observed that, under the fines content corresponding to the highest peak strength, the strong contact network and weak contact network inside the material form an optimal coordination between efficient load-bearing and stable support. This coordination enables the macro-strength of the mixture to reach the peak at this fines content. In addition, by modifying the weight coefficient of fabric anisotropy, a unique linear relationship between the fabric anisotropy of strong contacts and the stress ratio can be established, confirming that the strong contact network plays a core mechanical role in mixtures with different FC values.

1. Introduction

Binary mixtures, typically including gravel–sand mixtures and sand–silt mixtures [1], are widely used in roadbed fill, the seepage-proof body of dikes and dams, tailings dam accumulations, and the foundations of marine engineering structures (e.g., wharf core filling, and wind power foundation cushion) [2,3,4]. Their strength indicators (such as the peak friction angle and critical-state friction angle) and deformation characteristics (such as the dilatancy effect) directly determine the short-term anti-sliding stability and long-term deformation performance of engineering structures. As key material parameters for regulating binary mixtures, the fines content (FC) [5,6,7] and particle size ratio (SR) [8,9] significantly affect the strength and deformation characteristics of the mixtures.
At the current stage, scholars have conducted systematic studies on the strength indicators (peak strength friction angle φps and critical-state friction angle φcs) of binary mixed materials through laboratory triaxial tests. In the research on peak strength (φps), there are clear disagreements among scholars regarding the influence trend of the fines content (FC). Some scholars [3,10,11,12] argue that φps shows a “first increase, then decrease” trend with the increase in FC: Salgado [10] conducted drained triaxial tests on Ottawa sand (rounded quartz sand) and found that, when the FC increased from 0% to 20%, fine particles filled the pores of coarse particles and enhanced the interlocking effect, leading to an increase in φps from 30.1° to 33.0°; when the FC exceeded 20%, excess fine particles damaged the force-transferring skeleton of coarse particles, and φps began to decrease. Carraro [3] also confirmed in their study on quartz sand–non-plastic silt mixtures that, within the range of SR = 2~6, the peak value of φps always appeared at FC = 20%~30%, and, after the peak, φps decreased monotonically with the further increase in FC. Other scholars [13,14,15], however, hold that φps presents a “monotonically decreasing” trend with the FC: Li [14] carried out tests on South China Sea coral sand (easily crushable) and showed that, when the FC increased from 0% to 50%, fine particles aggravated the crushing of coral sand particles, resulting in a continuous decrease in φps from 39.96° to 26.60° without an “increasing stage”; Xiao [13,15] also found in their research on angular crushed glass sand that, when both sand and silt were angular, φps decreased by 3.2° as the FC increased from 0% to 15%, showing a consistent weakening trend.
Regarding the research on critical strength (φcs), there is also a certain degree of controversy at present, which centers on whether the FC is related to φcs. Some scholars [16,17,18,19] argue that φcs is basically unrelated to the FC. Others [20,21], however, maintain that φcs is closely related to the FC: in the coral sand tests by Li [20], as the FC increased from 0% to 50%, φcs decreased from 32.9° to 25.6°; Xiao [21] found that, when the FC increased from 0% to 15%, φcs also increased by 10%. The main reason for the aforementioned contradictions lies in the shape discrepancy between coarse and fines particles [19,21,22]: specifically, when the shape discrepancy between coarse and fine particles is small, the addition of fine particles with a similar shape does not alter the interlocking skeleton of the coarse particle structure itself, so φcs does not change with the FC; when the shape discrepancy between coarse and fine particles is large, the incorporation of fine particles significantly alters the interlocking structure of the mixture—when subrounded angular fine particles are added to rounded coarse particles, the fine particles enhance the mechanical interlocking between coarse particles, thereby significantly increasing φcs; on the contrary, when fine particles are added to angular coral sand, the fine particles mainly play a lubricating role, which, in turn, leads to a decrease in φcs.
Meanwhile, it can be observed that the existing studies mostly focus on the influence of the FC on the strength of mixtures, while studies on the changes in mixture strength characteristics caused by variations in the SR remain scarce. As another core index regulating the strength of binary mixtures, the SR does not act independently on strength evolution; instead, it exhibits a significant coupling effect with the FC [11,19,23,24,25]. Essentially, by altering the size, distribution, and connectivity of coarse particle pores, the SR directly determines the “effective filling threshold” of fine particles: when the SR is low, a small FC is sufficient to fill the pores and optimize skeleton interlocking; when the SR is high, more fine particles are required to fill the skeleton. This coupling relationship implies that, if the FC is studied in isolation from the SR, it is easy to misjudge the “shift in strength trends caused by SR differences” as the inherent action law of the FC itself, thereby further exacerbating the contradictions in the macroscopic conclusions. Therefore, it is essential to systematically conduct mechanical tests on binary mixtures to investigate the joint influence of the FC and SR.
Most of the aforementioned studies summarize the strength and deformation characteristics of sand–fines mixtures based on the macroscopic phenomena observed in laboratory tests. However, macroscopic tests are essentially “black-box observations”—they can only capture macroscopic responses such as stress–strain and volume change, but fail to reveal the micro-interaction mechanisms underlying strength evolution. This has become a bottleneck in explaining the contradictions in the macroscopic conclusions and quantifying the coupling effect between the FC and SR. The discrete element method (DEM) [26] precisely compensates for this limitation. As a supplementary tool to macroscopic tests, it enables the intuitive observation of the evolution of particle contact types [27,28], force chain transmission [29,30], and fabric anisotropy [31] during shearing, thereby explaining the micro-nature of macroscopic phenomena. In recent years, some scholars have conducted research on sand–fines mixtures using the DEM: Zhu [19] quantified the proportion and force-bearing characteristics of coarse–coarse (cc), coarse–fine (cf), and fine–fine (ff) contacts under different FC and SR conditions through 3D-DEM simulations, and clarified the correlation between the “unimodal trend of φₚ with FC” and the evolution of the contact network; Liu and Yan [32] proposed a strong contact identification method based on subnetwork division, and verified the dominant role of the strong contact system in the strength of sand–fines mixtures via the DEM; Cao [33] analyzed the coupling effect of the intermediate principal stress and FC on the microscopic force chains of binary mixtures using the DEM.
While numerous scholars have explored the mechanical properties of sand–fines mixtures via laboratory tests or DEM simulations, the existing studies still have notable limitations. On one hand, most works focus on single-factor analysis—either investigating the effect of the FC alone or the SR in isolation—without considering the combined and synergistic influence of the FC and SR on the macro–micro mechanical response of the mixtures. This narrow focus fails to capture the holistic regulatory mechanism of these two key factors, leaving a gap in our understanding of their coupled effects. On the other hand, studies relying solely on the DEM to explore microscopic mechanisms often suffer from a disconnect between the simulation and experiment: the selection of DEM models and core parameters typically depends on empirical methods, rather than being calibrated and verified against macroscopic test data. This lack of experimental validation reduces the reliability of microscopic mechanism interpretations, as the simulated results may deviate from the actual mechanical behavior of the material. These unresolved limitations underscore the need for a more integrated approach to address the research gaps.
Based on this, this study investigates the mechanical properties of sand–fines mixtures from both the macroscopic experimental and microscopic simulation perspectives. First, laboratory triaxial tests are conducted to study the strength indicators (peak friction angle φps, and critical-state friction angle φcs) and deformation modes (dilatancy–contraction characteristics) of sand–fines mixtures under different fines contents (FC = 0.1, 0.2, 0.3, 0.5, and 0.7) and particle size ratios (SR = 9.1, 18.7, and 39.7). Then, from the micro-perspective, discrete element simulations are performed to observe the evolution of particle contact types (coarse–coarse, coarse–fine, and fine–fine) and the laws of force chain transmission, and to explore the mechanical mechanisms behind the mixture’s strength indicators. This systematic approach aims to clarify the regulatory laws of the fines content and particle size ratio on the mechanical properties of sand–fines mixtures, providing support for the optimization of sand–fines mixture proportions and the control of the anti-sliding stability in engineering practices.

2. Materials and Testing Program

2.1. Testing Materials

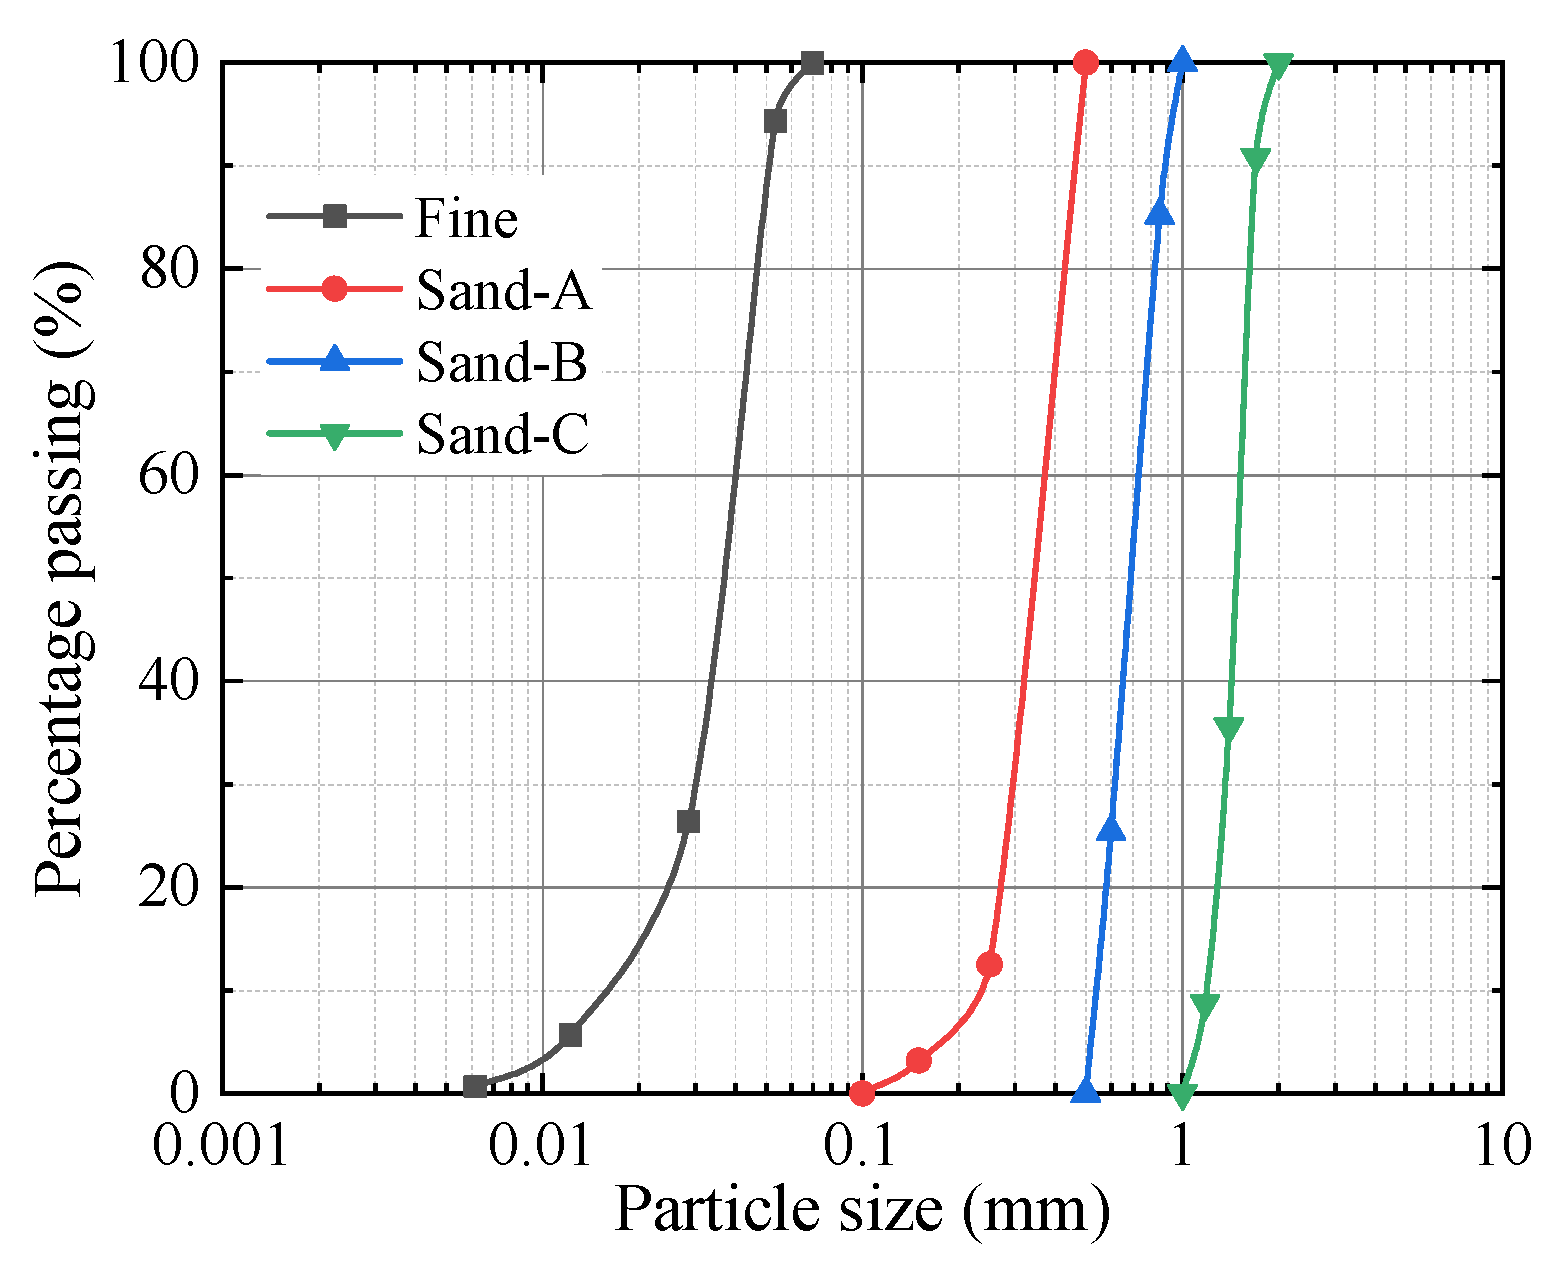
In this study, natural river sand was selected as the experimental material. Through sieving the river sand, three types of sandy soils with different particle sizes and one type of silty soil were obtained. The comparison of their particle sizes and particle size distributions is presented in Figure 1 and Figure 2, while the corresponding physical and mechanical parameters are listed in Table 1.
To investigate the effects of fines content and particle size ratio, the aforementioned silty soil was defined as “fine particles” and the three types of sandy soils as “coarse particles” in the experiment. Binary mixtures with three different particle size ratios were prepared by mixing the fine particles with any one type of coarse particles. For the binary mixtures with each particle size ratio, five gradients of fines content (i.e., 0.1, 0.2, 0.3, 0.5, and 0.7) were set, respectively. The physical and mechanical parameters of each mixture are shown in Table 2. Meanwhile, medium-dense sand and dense sand specimens with relative densities of 50% and 80%, respectively, were prepared to investigate the dilatancy characteristics of the sand–silt mixtures.

2.2. Testing Procedure

In this experiment, the Hollow Cylinder Torsion System manufactured by GDS Instruments (Hook, Hampshire, UK) was employed for testing. The axial displacement range of this system is significantly larger than that of conventional triaxial testing systems, which ensures that the sandy soil can be sheared to the critical state as much as possible. The specimens used in the experiment were cylindrical with a uniform specification of 50 mm in diameter and 100 mm in height, and were prepared by the Moist Tamping Method [34,35]. This method enables the uniform mixing of sand and silt, which can minimize the segregation between sand and silt particles and ensure the quality of the specimens. During specimen preparation, the dried sand and silt were weighed in proportion and thoroughly mixed with distilled water, accounting for 5% of the total mass. Subsequently, the mixture was compacted into 5 layers to the specified density. In the process of specimen preparation, an under-compaction rate of 3% was applied between adjacent layers to eliminate density differences caused by layer boundaries [36]. After compaction of each layer, the thickness of the layer was measured to ensure the overall height of the specimen (100 mm) met the design requirement, and the mass of each layer was verified to avoid segregation of sand and silt particles. After the specimen preparation was completed, saturation was achieved first by flushing with carbon dioxide gas and then with deaired water. Backpressure saturation was performed by applying confining pressure and backpressure in stages, during which the effective confining pressure was maintained constant at 20 kPa. After the backpressure reached 200 kPa, the confining pressure and backpressure were kept stable to help dissolve the residual gas in the water until the degree of saturation exceeded 0.98, at which point saturation was considered complete. Finally, isotropic consolidation was conducted by applying an effective confining pressure of 100 kPa, and the consolidation process was deemed complete when the volume of the specimen became stable and no longer changed. After consolidation, the specimens were sheared at a constant vertical displacement rate of 0.1 mm per minute until the axial strain reached 40%. All specimens were maintained under drained conditions during the shearing process. Furthermore, no particle breakage was observed throughout all the tests in this study, indicating that the test conditions did not affect the integrity of the sand and silt particles.

3. Testing Results

3.1. Stress–Strain and Volumetric Change Responses

Figure 3 presents the stress–strain relationships of sand–silt mixtures under different fines contents and particle size ratios. It can be seen from the figure that the shear stress of each specimen develops rapidly when the axial strain is small, until the deviatoric stress reaches the peak value. After the peak, the stress of the specimen decreases slightly and tends to a stable value, indicating that all binary mixtures exhibit strain-softening behavior under both medium-dense and dense conditions and reach the critical state.
Meanwhile, it can be observed that both the peak stress and softening degree of the binary mixtures are affected by the fines content and particle size ratio: when the FC is low, the peak strength increases with the increase in FC, and the stress-softening phenomenon becomes more obvious; when the FC increases to a certain value, the peak strength decreases with the further increase in fines content, and the stress-softening phenomenon is relatively weak. Additionally, at a low particle size ratio, the incorporation of a small number of fine particles leads to a sharp increase in peak strength and causes a more significant post-peak stress-softening behavior. However, for binary mixtures with a high particle size ratio, the change in fines content has a minor effect on their peak stress, and the softening phenomenon is not obvious simultaneously.
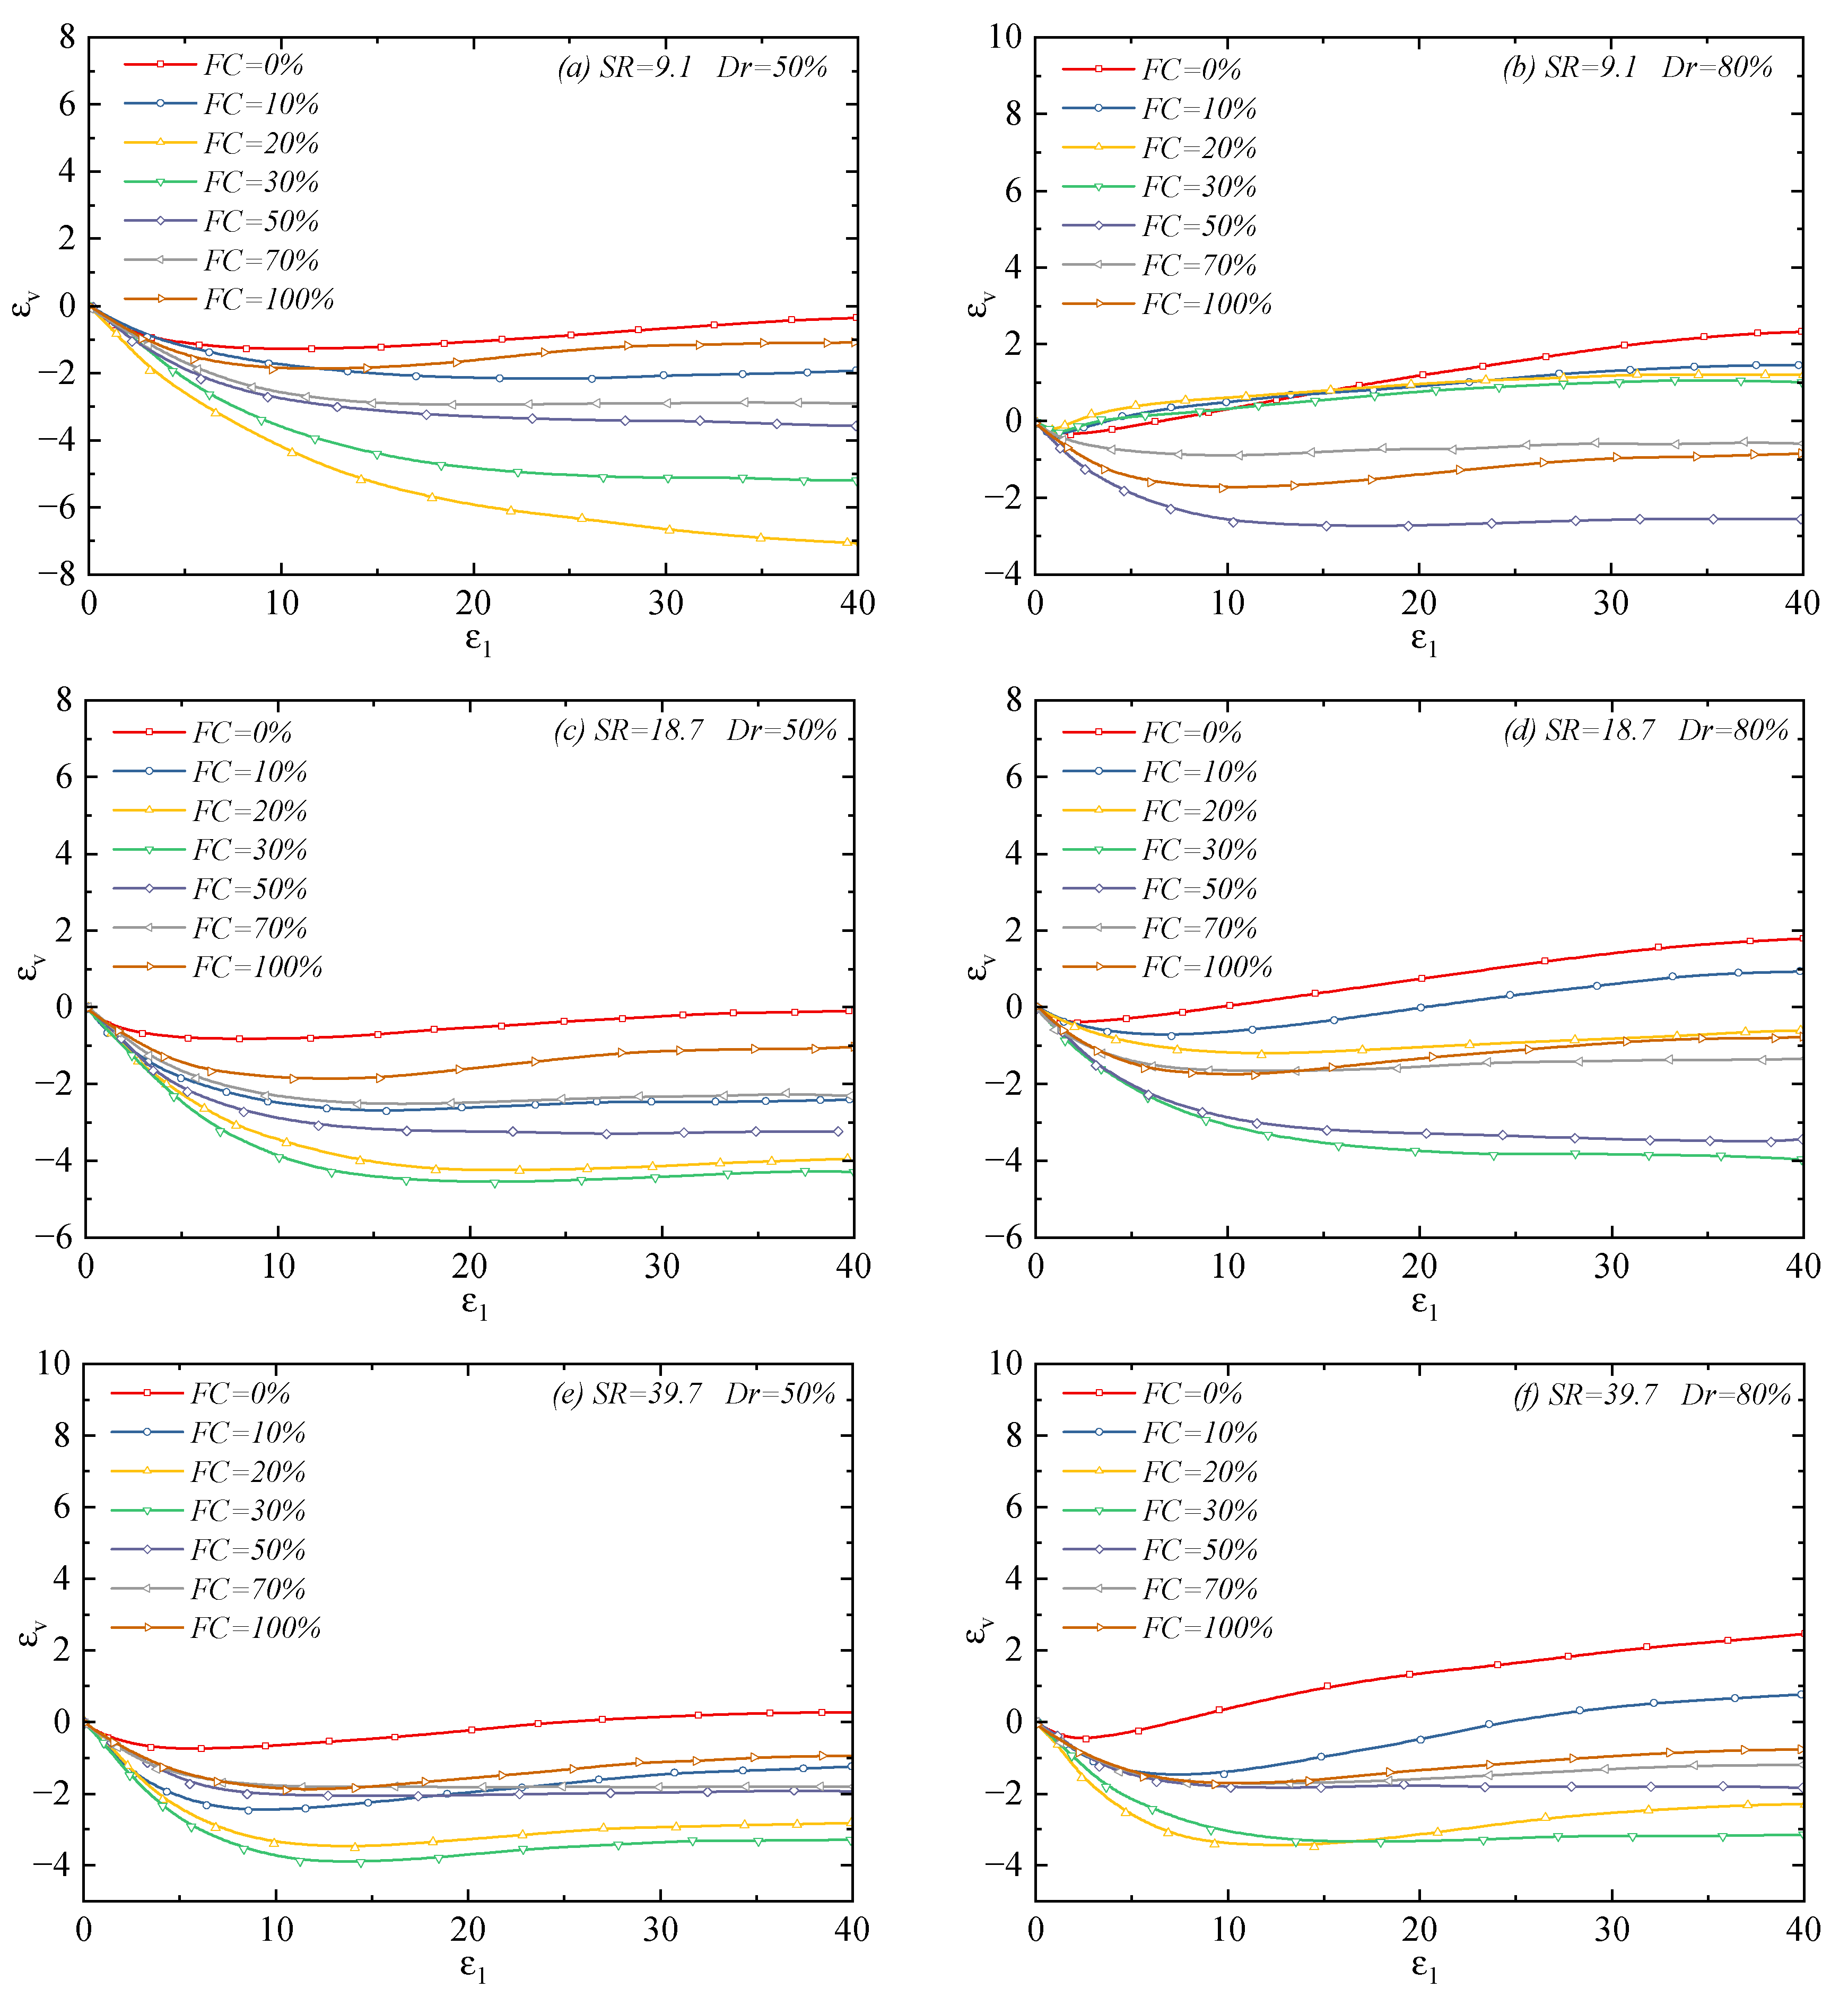
Figure 4 shows the volumetric strain evolution curves of the mixtures under a different FC and SR. It can be found that, similar to the effect on the peak strength, the FC also affects the volumetric strain evolution rule of the sand–silt mixtures. When the FC is low, with the increase in FC, the dilatancy of the mixture decreases, and the corresponding contraction becomes more obvious; when the FC exceeds a specific value, the dilatancy of the mixture becomes more obvious with the further increase in FC. This specific fines content is referred to as the threshold fines content (FCth) [4]. That is to say, when the FC is lower than the threshold fines content, the FC has an inhibitory effect on dilatancy; when the FC is higher than the threshold fines content, the FC has an enhancing effect on dilatancy. In this study, the method proposed by Rahaman [37] was used to calculate FCth with different particle size ratios:
F C t h = 0.4 1 1 + e 0.5 0.13 χ + 1 χ
Among them, χ = D 10 / d 50 , D 10 , and d 50 represent the effective particle size of coarse particles and the average particle size of fine particles, respectively. For the three sand–silt mixtures, the computed threshold fines contents are 22.0%, 30.7%, and 37.5%, respectively. This critical index is essentially consistent with the transitional fines content proposed by Cabalar [38], both representing the transition of the mixture from ‘coarse-grain skeleton-dominated’ to ‘fine-grain matrix-dominated. Therefore, for the mixture with SR = 18.7, when the FC is less than 30%, increasing the FC makes the mixture contraction more obvious; when the FC is more than 30%, increasing the FC causes more significant dilatancy, as shown in Figure 4.
Furthermore, experimental observations indicate that, compared with pure silt (FC = 100%), the dilatancy characteristics of the three types of pure coarse sands (FC = 0%) are significantly more prominent. This difference arises from the distinct disparities in the frictional properties and anti-sliding capacity between coarse and fine particles: the three types of coarse particles used in this study are all angular natural river sand with rough surfaces and irregular shapes. These particles tend to form interlocking structures between grains, which require overcoming greater interparticle resistance during shearing, making relative slippage difficult to occur. Therefore, they tend to release shear stress through volumetric expansion. In contrast, pure fine particles exhibit relatively weak interlocking effects, allowing easy relative slippage during shearing without requiring significant volumetric expansion to complete the stress transfer, manifesting as shear contraction or weak shear dilation characteristics.

3.2. Stress–Dilatancy Relationship

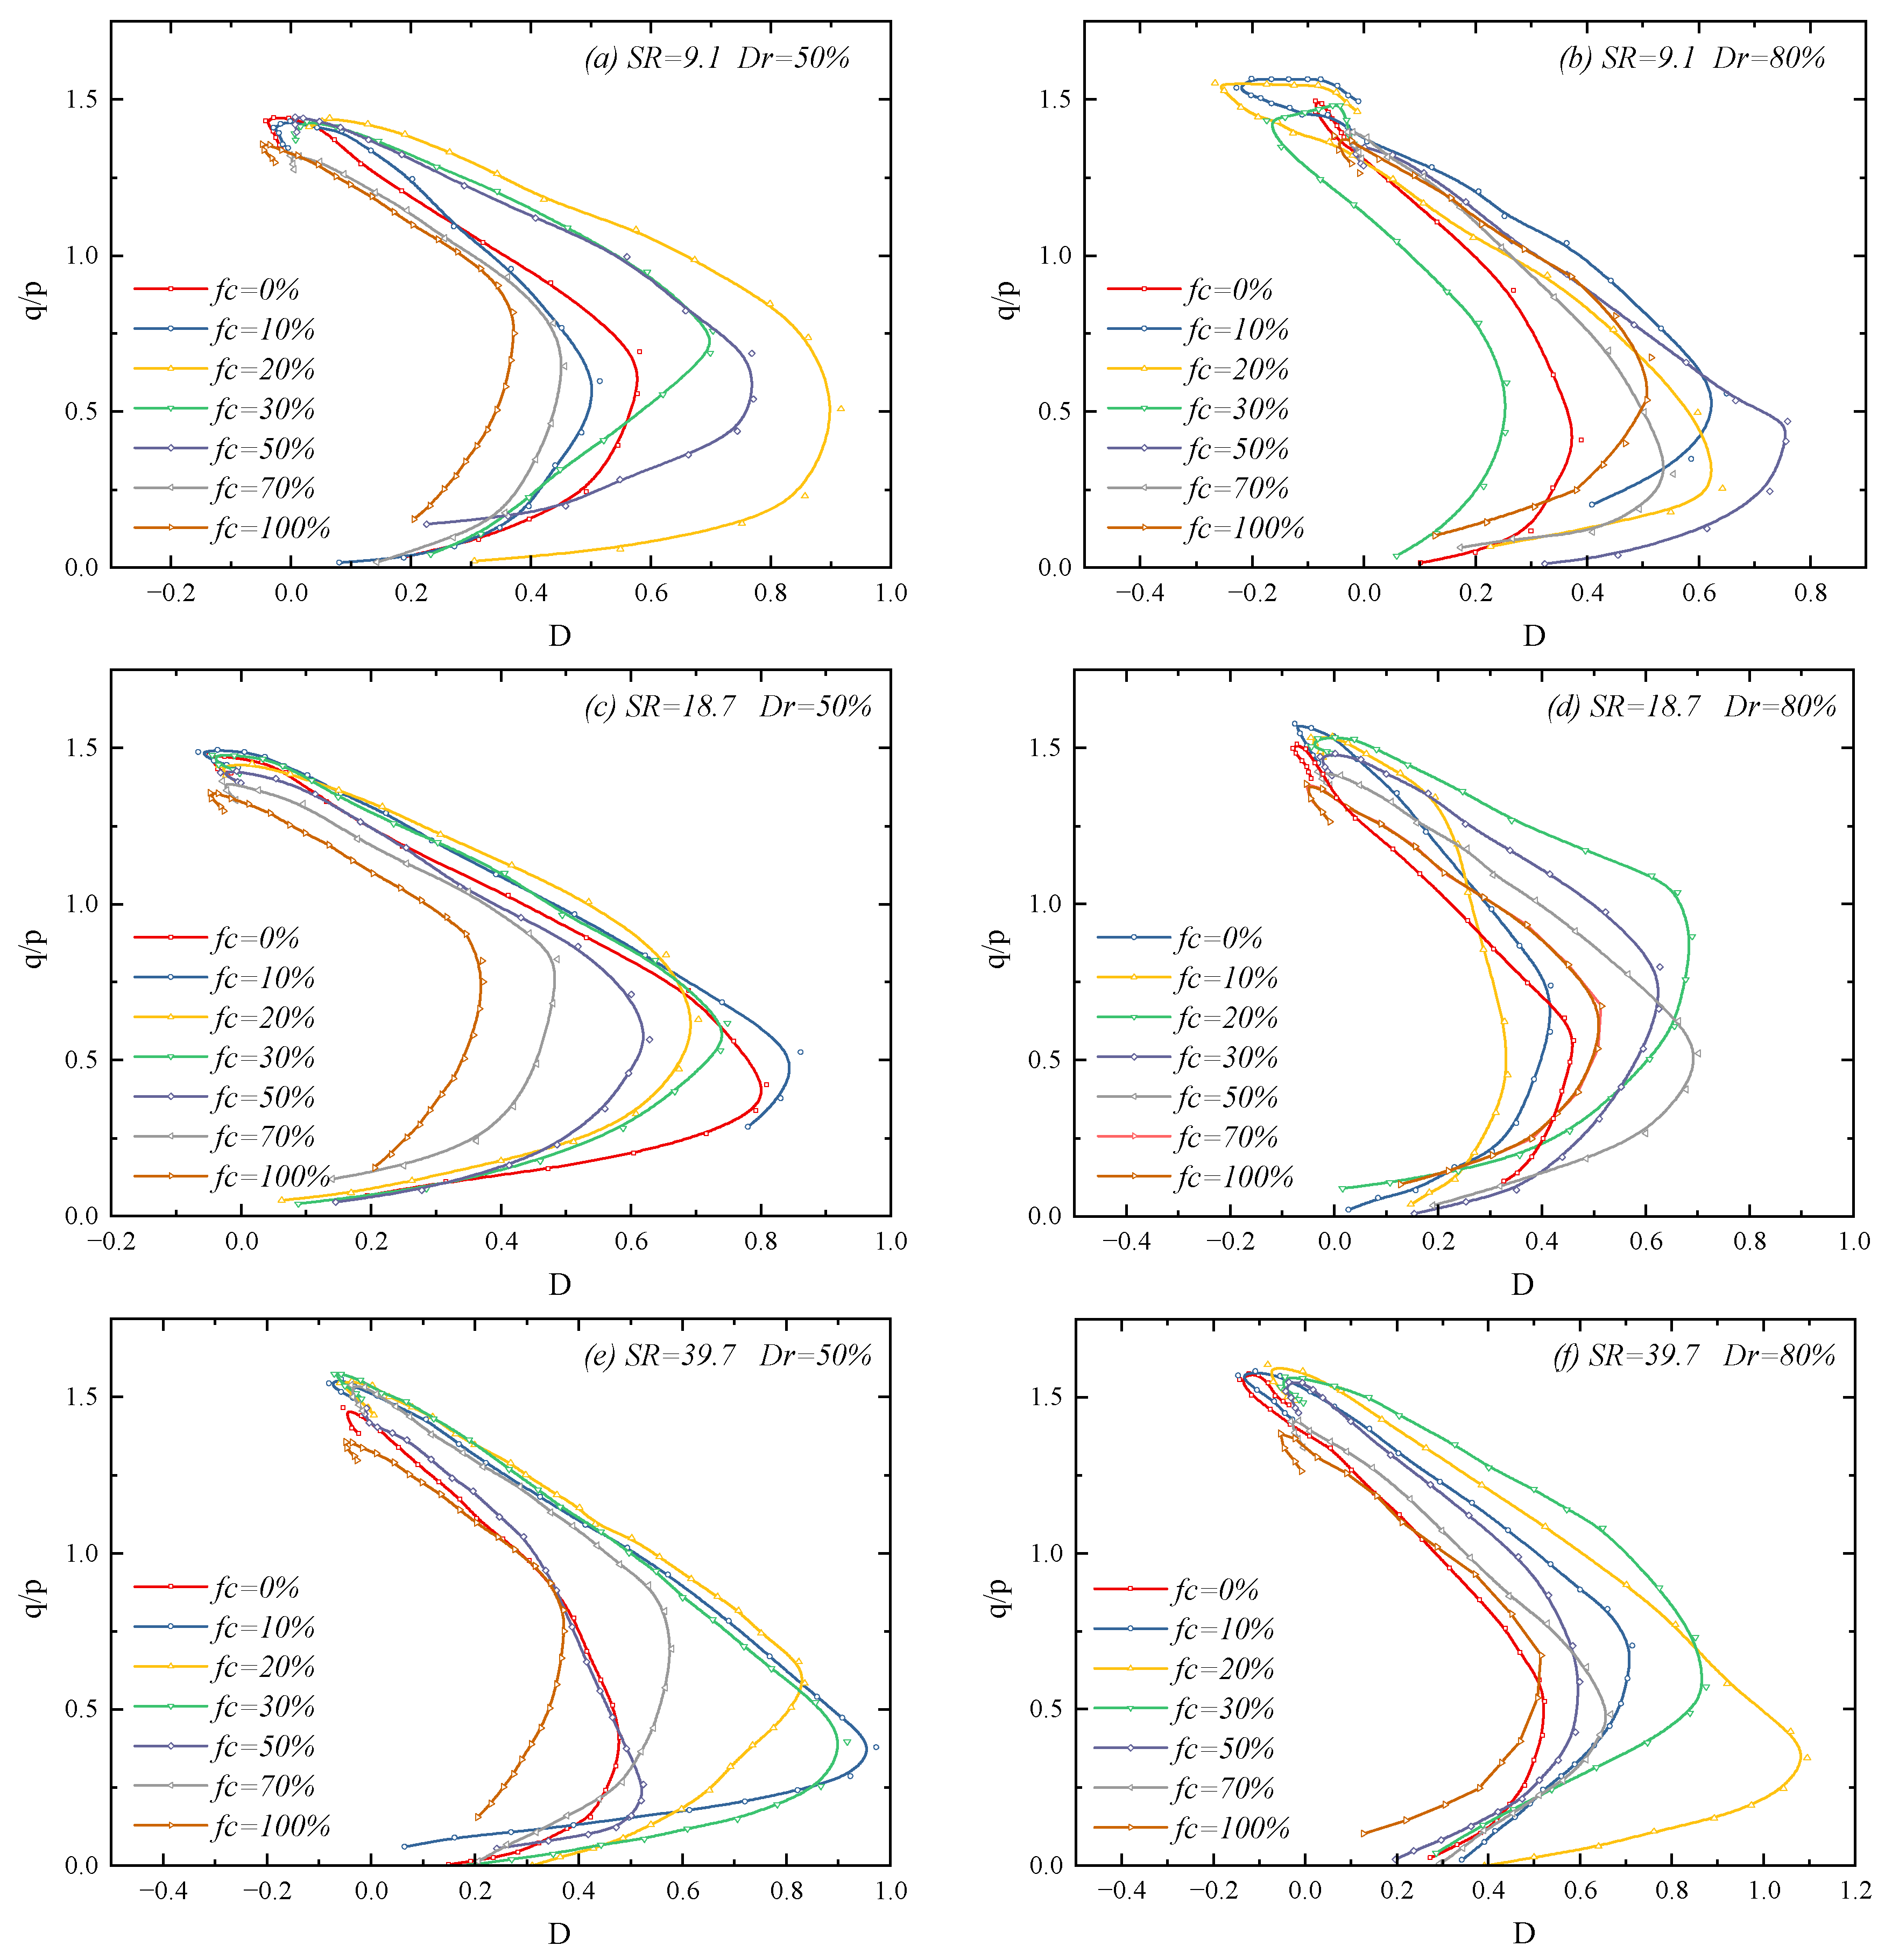
Figure 5 presents the stress–dilatancy relationship of mixtures under different fines content and particle size ratios. It can be observed that all mixtures exhibit contraction behavior (D > 0) at the initial stage of dilatancy development; subsequently, the contraction phenomenon gradually diminishes. When reaching the phase transformation point, the specimens begin to exhibit dilatancy characteristics. Additionally, it can be noted that, before the threshold fines content, an increase in FC leads to a more obvious contraction of the specimens before the phase transformation point; after the threshold fines content, an increase in FC content results in less contraction of the mixtures before the phase transformation point. This phenomenon indicates that the FC not only affects the magnitude of dilatancy of the mixtures after the phase transformation point (as shown in Figure 4) but also influences the contraction phenomenon of the mixtures before the phase transformation point.
In addition, it is observed that, after the specimens reach the peak dilatancy point, their stress–dilatancy curves change and exhibit a “hook” shape when approaching the critical state. Furthermore, the hooks of most specimens in Figure 5 curve downward, meaning that the stress degradation rate is greater than the dilatancy ratio degradation rate. However, it can be seen from Figure 5b that, when the particle size ratio is 9.1 and the relative density is 80%, the “hooks” curve upward for specimens with a fines content of 0–30%; in this case, the dilatancy ratio degradation rate is greater than the stress ratio degradation rate. The reason for this phenomenon is that the peak dilatancy ratio of specimens with upward-curving “hooks” is significantly higher than that of other specimens. When these specimens reach the peak state, inter-particle sliding becomes more obvious, leading to a rapid degradation of the dilatancy ratio.

3.3. Peak State Friction Angle

For granular materials, the peak friction angle φps is defined as follows [39]:
φ p s = ( σ 1 / σ 3 ) p s 1 ( σ 1 / σ 3 ) p s + 1
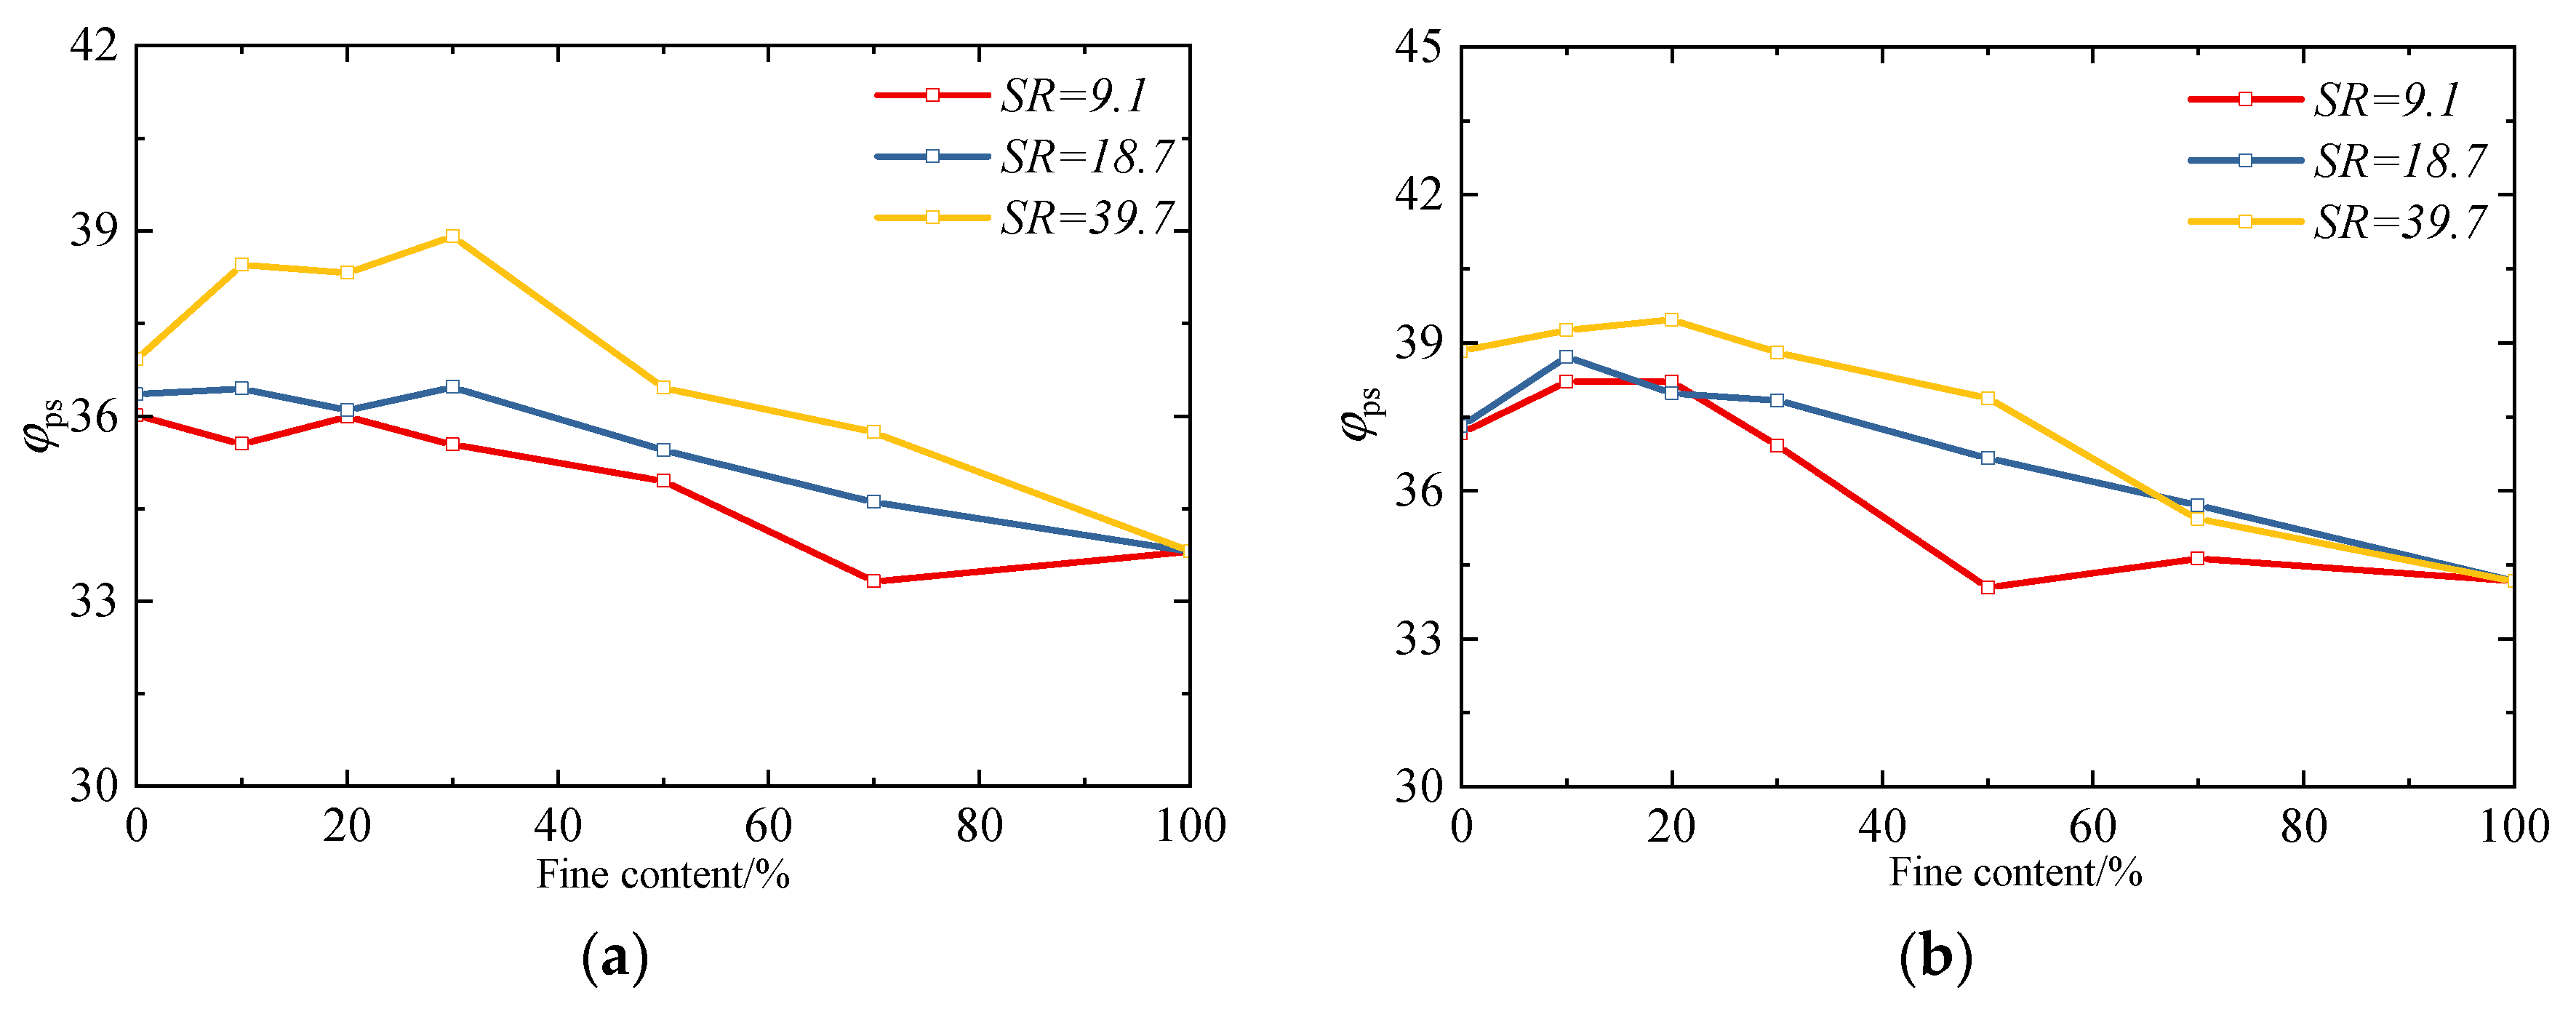
Among them, σ 1 , σ 3 represent the maximum principal stress and minimum principal stress (both in kilopascal, kPa), respectively. Figure 6 presents the variation trend of the peak friction angle of sand–silt mixtures with fines content. It can be observed that the specimens with a relative density of 80% exhibit a higher peak stress, indicating that sand–silt mixtures with a higher relative density possess a more robust “skeletal structure”. During shearing, a greater inter-particle interlocking resistance needs to be overcome. In contrast, sandy soils with a lower relative density have a loose particle arrangement; their skeletal structure is prone to deformation, and the peak stress required for relative sliding between particles is lower.
Meanwhile, it can be observed that, regardless of the particle size ratio, the sand–silt mixtures all exhibit a trend where the peak internal friction angle first increases and then decreases with the increase in fines content, which is consistent with the DEM simulation results by Zhu [19]. When the fines content is low, fine particles fill the pores between coarse particles, reducing the “contact point defects” among coarse particles and further forming a more complete force chain network. As a result, the shear stress can be more uniformly transmitted through the coarse particle skeleton during the shearing process, avoiding strength loss caused by local contact damage and thereby enhancing the friction angle corresponding to the peak stress.
In addition, it can be observed that the peak stress of mixtures with a high FC (e.g., FC = 50%, 70%, and 100%) is significantly lower than that of pure coarse particles. The reason for this phenomenon lies in the fact that, compared with the angular coarse particles used in this study, the fine particles have smoother surfaces and a stronger “lubricity” between particles, making relative sliding more likely to occur during the shearing process, which, in turn, leads to a substantial reduction in the overall shear resistance. When the fines content increases to 50% or above, the proportion of fine particles in the mixture increases significantly, and the particle contact type transitions from “coarse–coarse contact dominance” to “fine–fine contact and coarse–fine contact dominance”. The smooth surfaces of fine particles result in a lack of effective interlocking in such contacts, and the frictional resistance between particles is much lower than that between coarse particles. Ultimately, this leads to the peak stress of mixtures with a high fines content being significantly lower than that of pure coarse particles.

3.4. Critical-State Friction Angle

With continuous shearing, the volumetric strain and stress ratio remain constant, and the specimen reaches the critical state. The critical-state friction angle φcs of granular materials can be calculated by the following formula:
φ c s = ( σ 1 / σ 3 ) c s 1 ( σ 1 / σ 3 ) c s + 1
It can be observed from Figure 4 that the stress–strain curves of different specimens have all stabilized when the axial strain reaches 40%. Therefore, in this study, the state corresponding to an axial strain of 40% is taken as the critical stress state.
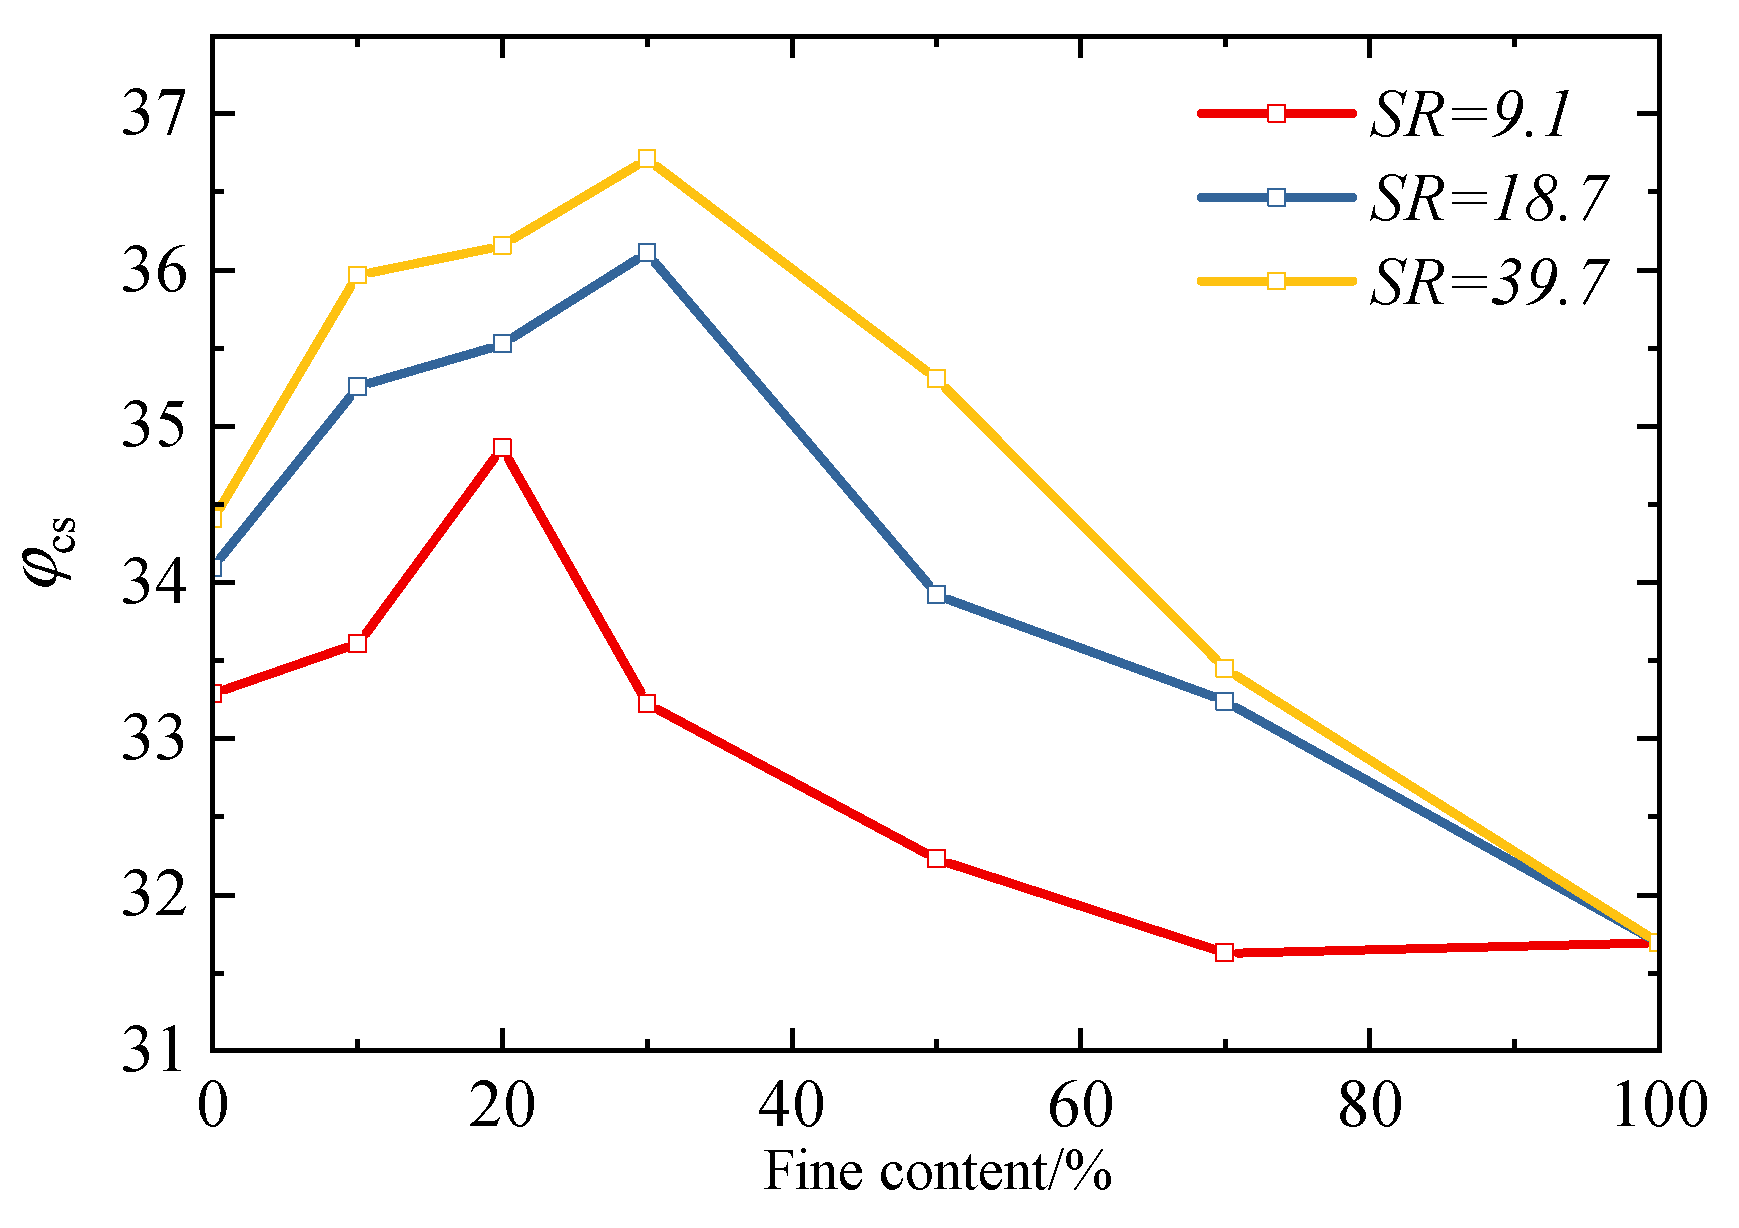
Figure 7 presents the evolution trend of the critical-state friction angle φcs for specimens with different fines content and particle size ratios. It can be observed that both the fines content and particle size ratio exert a significant influence on the φcs of the specimens. Overall, with the increase in fines content, φcs exhibits a trend of first increasing and then decreasing, which differs slightly from the results by Li [20] (φcs decreases gradually with the increase in fines content, showing a negative exponential relationship) and Yilmaz [4] (φcs remains basically constant at a low and high fines content). This discrepancy arises from the particle morphological characteristics of the test materials: the coarse particles used in this study are angular natural river sands, featuring rough surfaces and strong interlocking capabilities. The incorporation of fine particles does not merely “fill pores” or “destroy the skeleton”: when the FC is low, fine particles fill the contact defects between coarse particles, enhancing the interlocking effect among coarse particles and thus increasing φcs with the rise in FC; when the FC exceeds the threshold, excessive fine particles isolate the coarse particles, weakening the force transmission capacity of the coarse particle skeleton. Meanwhile, the interlocking effect of the FCs themselves is relatively weak, leading to a decrease in φcs as the FC increases. This “first increase, then decrease” trend is essentially the result of the dynamic competition between two effects in the angular particle system: “fine particle filling reinforcement” and “skeleton isolation weakening”. It further confirms that the skeleton-filling effect of fine particles is the key mechanism regulating the critical state of binary mixtures.
In addition, it can be observed that the variation laws of the critical-state friction angle for specimens with different particle size ratios also exhibit slight differences. For the specimens with SR = 9.1, the critical-state friction angle reaches its peak when the fines content is 20%, followed by a subsequent decrease. In contrast, for the specimens with particle size ratios of 18.7 and 39.7, their critical-state friction angles reach the peak when the fines content is 30%. This phenomenon is attributed to the fact that binary mixtures with different SRs correspond to distinct FCth values. Specifically, the FCth values for mixtures with SR = 9.1, 18.7, and 39.7 are 22.0%, 30.7%, and 37.5%, respectively. Therefore, for mixtures with SR = 9.1, when FC = 20% (close to its FCth of 22.0%), their critical state is nearly reaching the threshold; for mixtures with SR = 18.7 and 39.7, FC = 30% is close to their respective FCth (30.7% for SR = 18.7, and 37.5% for SR = 39.7), so their critical states also approach the threshold at this FC.
Meanwhile, it can be observed that the particle size ratio also affects the transitional fines content range of sand–silt mixtures. Yilmaz’s research [4] results indicate that the critical-state friction angle of sand–silt mixtures does not change with the FC when the FC is low or high; however, when the FC falls within a specific range, the critical-state friction angle of the mixture changes linearly with the FC. This range is referred to as the transitional fines content range. The transitional ranges of materials with different particle size ratios also differ. Affected by the particle shape and mineral composition, although the variation law of the critical-state friction angle in the test results of this study is slightly different from that of Yilmaz’s research [4], it can be seen from Figure 7 that, similar to Yilmaz’s findings, the larger the particle size ratio is, the wider the transitional range is. This is mainly reflected in the following aspect: at a relatively high fines content, the critical-state friction angles with a particle size ratio of 9.1 are relatively close when the FC is 70% and 100%, indicating that the influence of coarse particles on the mixture is already minimal at this point. At this point, its transitional fines content range is approximately from 30% to 60%. However, for mixtures with larger particle size ratios (e.g., 18.7 and 39.1), the critical-state friction angle of the mixture with a 70% fines content is still higher than that of the mixture with a 100% fines content, which suggests that the coarse particles still play a certain reinforcement role at this stage [40]. This indicates that materials with a larger particle size ratio have a wider transition range, which is approximately 30% to 70%.

4. DEM Modeling

To further gain an in-depth understanding of the influence of the fines content (FC) on the mechanical behaviors of sand–fines mixtures from the meso–micro perspective, this section employs the discrete element method (DEM) to conduct a simulation and analysis on the mechanical behaviors of the aforementioned binary mixtures.

4.1. Contact Model

This section aims to analyze the influence law of different fines contents (FCs) on the mechanical behaviors of the mixtures from a meso–micro perspective. Meanwhile, to balance the computational accuracy and efficiency, the particle size ratio (SR) in this section is set to 4, meaning the radius of coarse particles is 0.1 mm and that of fine particles is 0.025 mm. The linear contact model is adopted for inter-particle contacts, and numerous studies [41,42] have verified that this model can accurately reproduce the mechanical properties of granular materials. The normal contact stiffness is calculated using the formula kn = k0r, where k0 is the stiffness constant. The values of k0 are set to 1.0 × 10³ MPa for coarse particles and 4.0 × 10³ MPa for fine particles, with the specific parameters detailed in Table 3, consistent with the literature [32]. Similarly, to ensure that mixture specimens with different fines contents have the same relative density, a specimen preparation method that controls the particle friction coefficient is adopted [43,44]. During the isotropic consolidation process, the particle friction coefficient is set to 0, thereby obtaining the densest specimens (only this one density is simulated in this section due to space limitations). The consolidated specimens are shown in Figure 8.
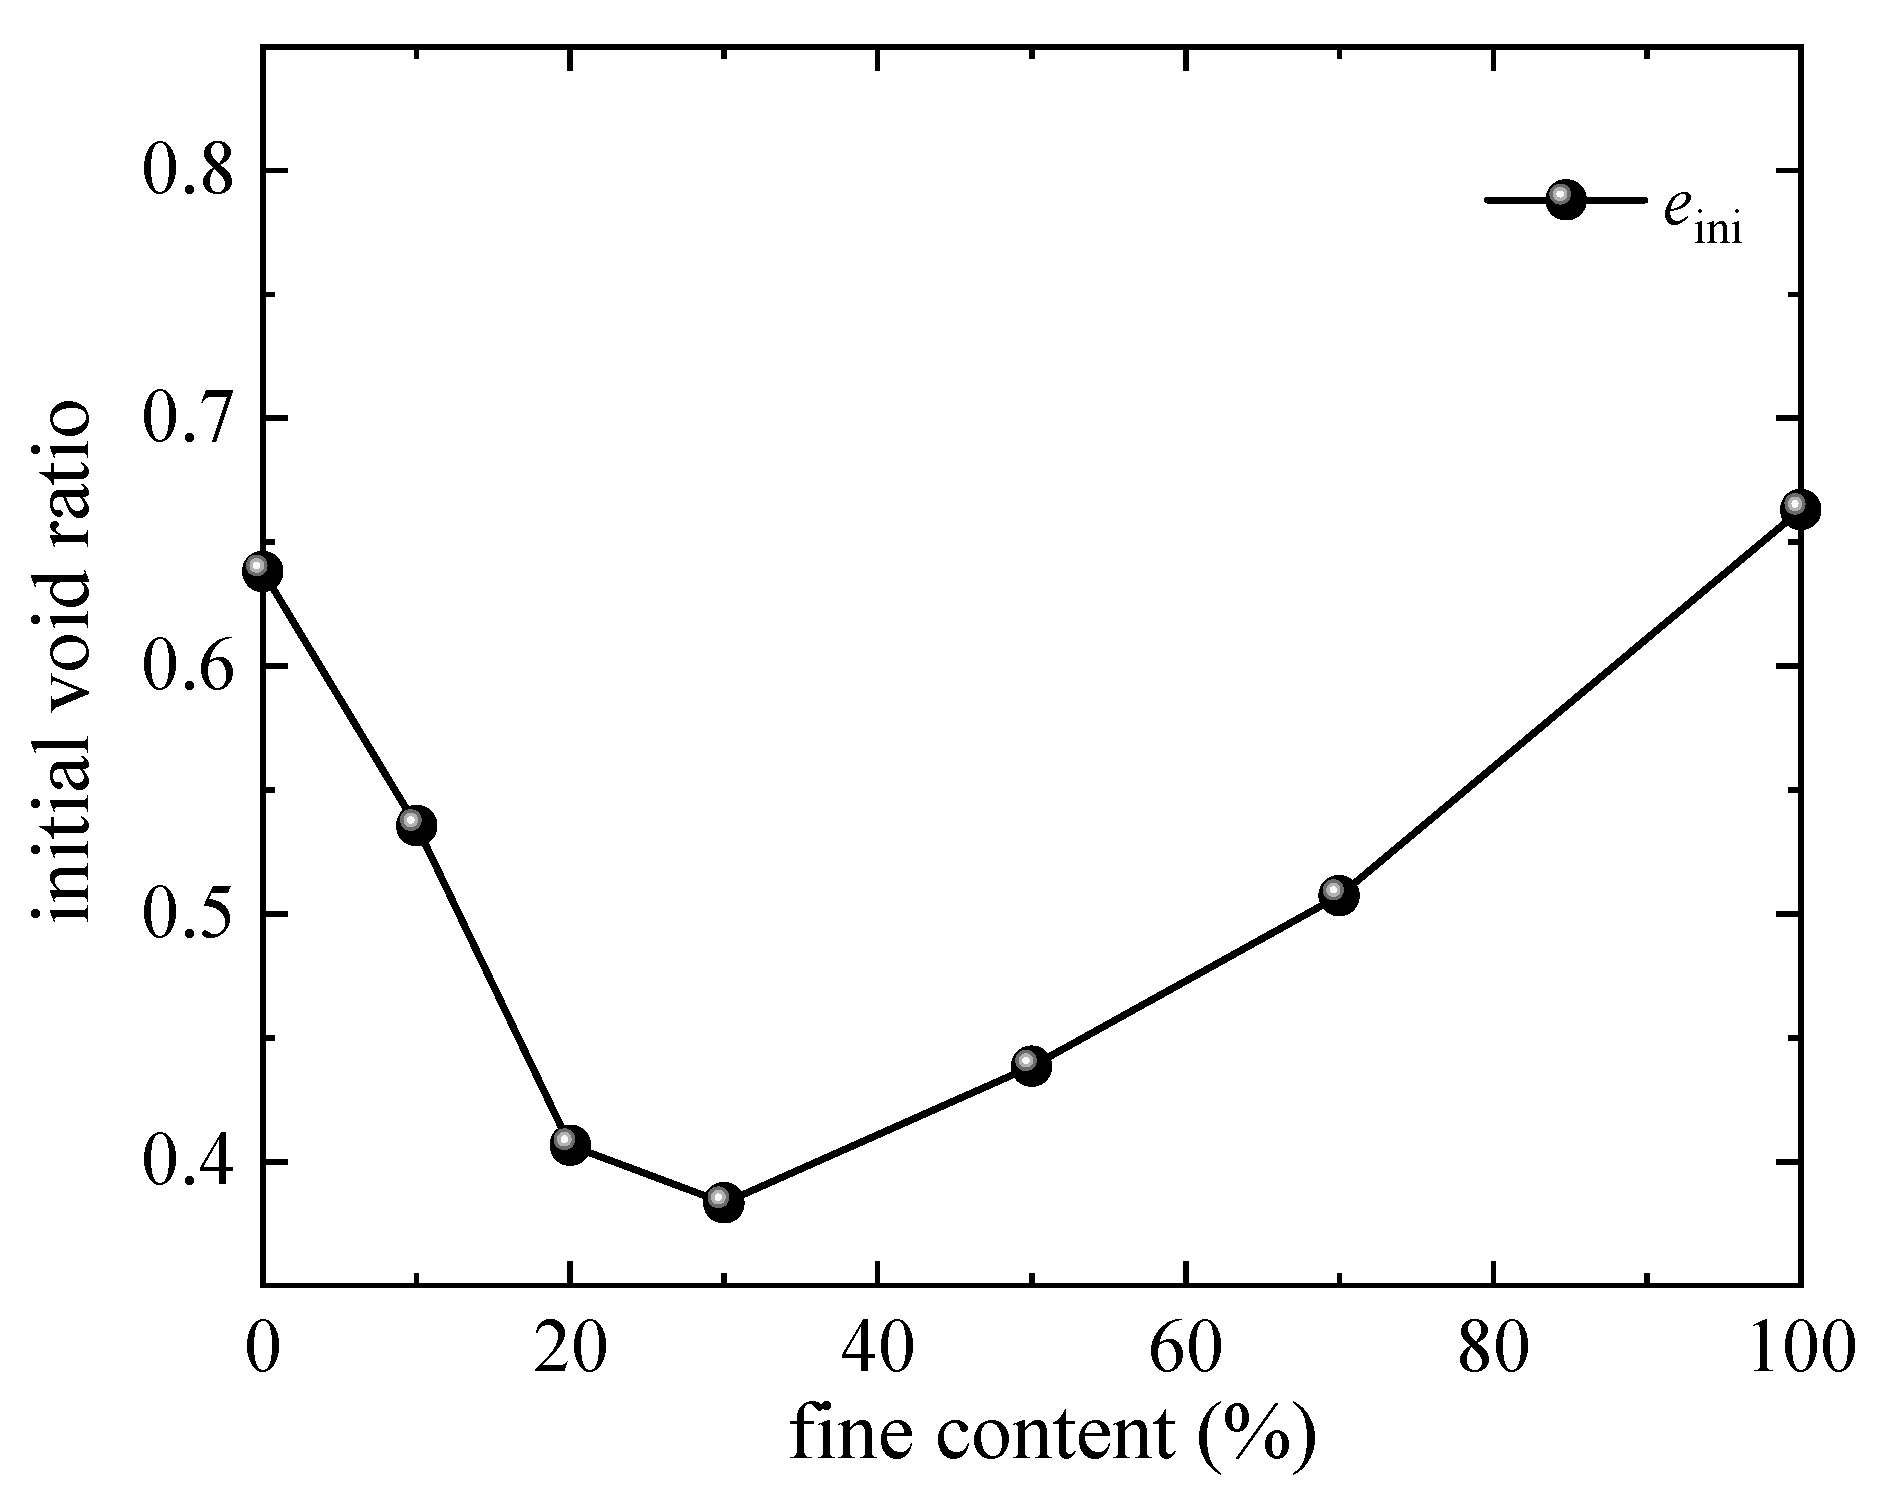
Figure 9 presents the curve of the initial void ratio of sand–silt mixtures varying with the FC. The initial void ratio exhibits a trend of first decreasing and then increasing with the FC: it reaches the minimum value when the FC increases to approximately 30%, and gradually rises as the FC further increases. This is consistent with both the experimental results [46,47] and existing simulation results, indicating the effectiveness of the established model.
Before shearing, the particle–particle friction coefficient is uniformly set to 0.5, while the wall–particle friction coefficient is kept at 0. The upper and lower walls move toward each other at a rate of 0.005 m/s for shear loading, and a servo-control mechanism is adopted to maintain a constant confining pressure. To ensure that the sand–silt mixture remains in a quasi-static state throughout the shearing process, the shear rate must satisfy the requirement [48] of the inertia parameter I = ε 1 d ρ / p < 2.5 × 10 3 , where I is jointly determined by the axial strain rate ε 1 , particle diameter d, and particle density ρ (see Table 3 for the values of d and ρ). The calculation results show that I < 2.5 × 10⁻³; thus, the specimen maintains a quasi-static equilibrium state during the entire shearing process. In addition, to ensure that the specimens reach the critical state, all specimens are sheared until the axial strain reaches 40%.

4.2. Analysis of Micro-Mechanical Responses

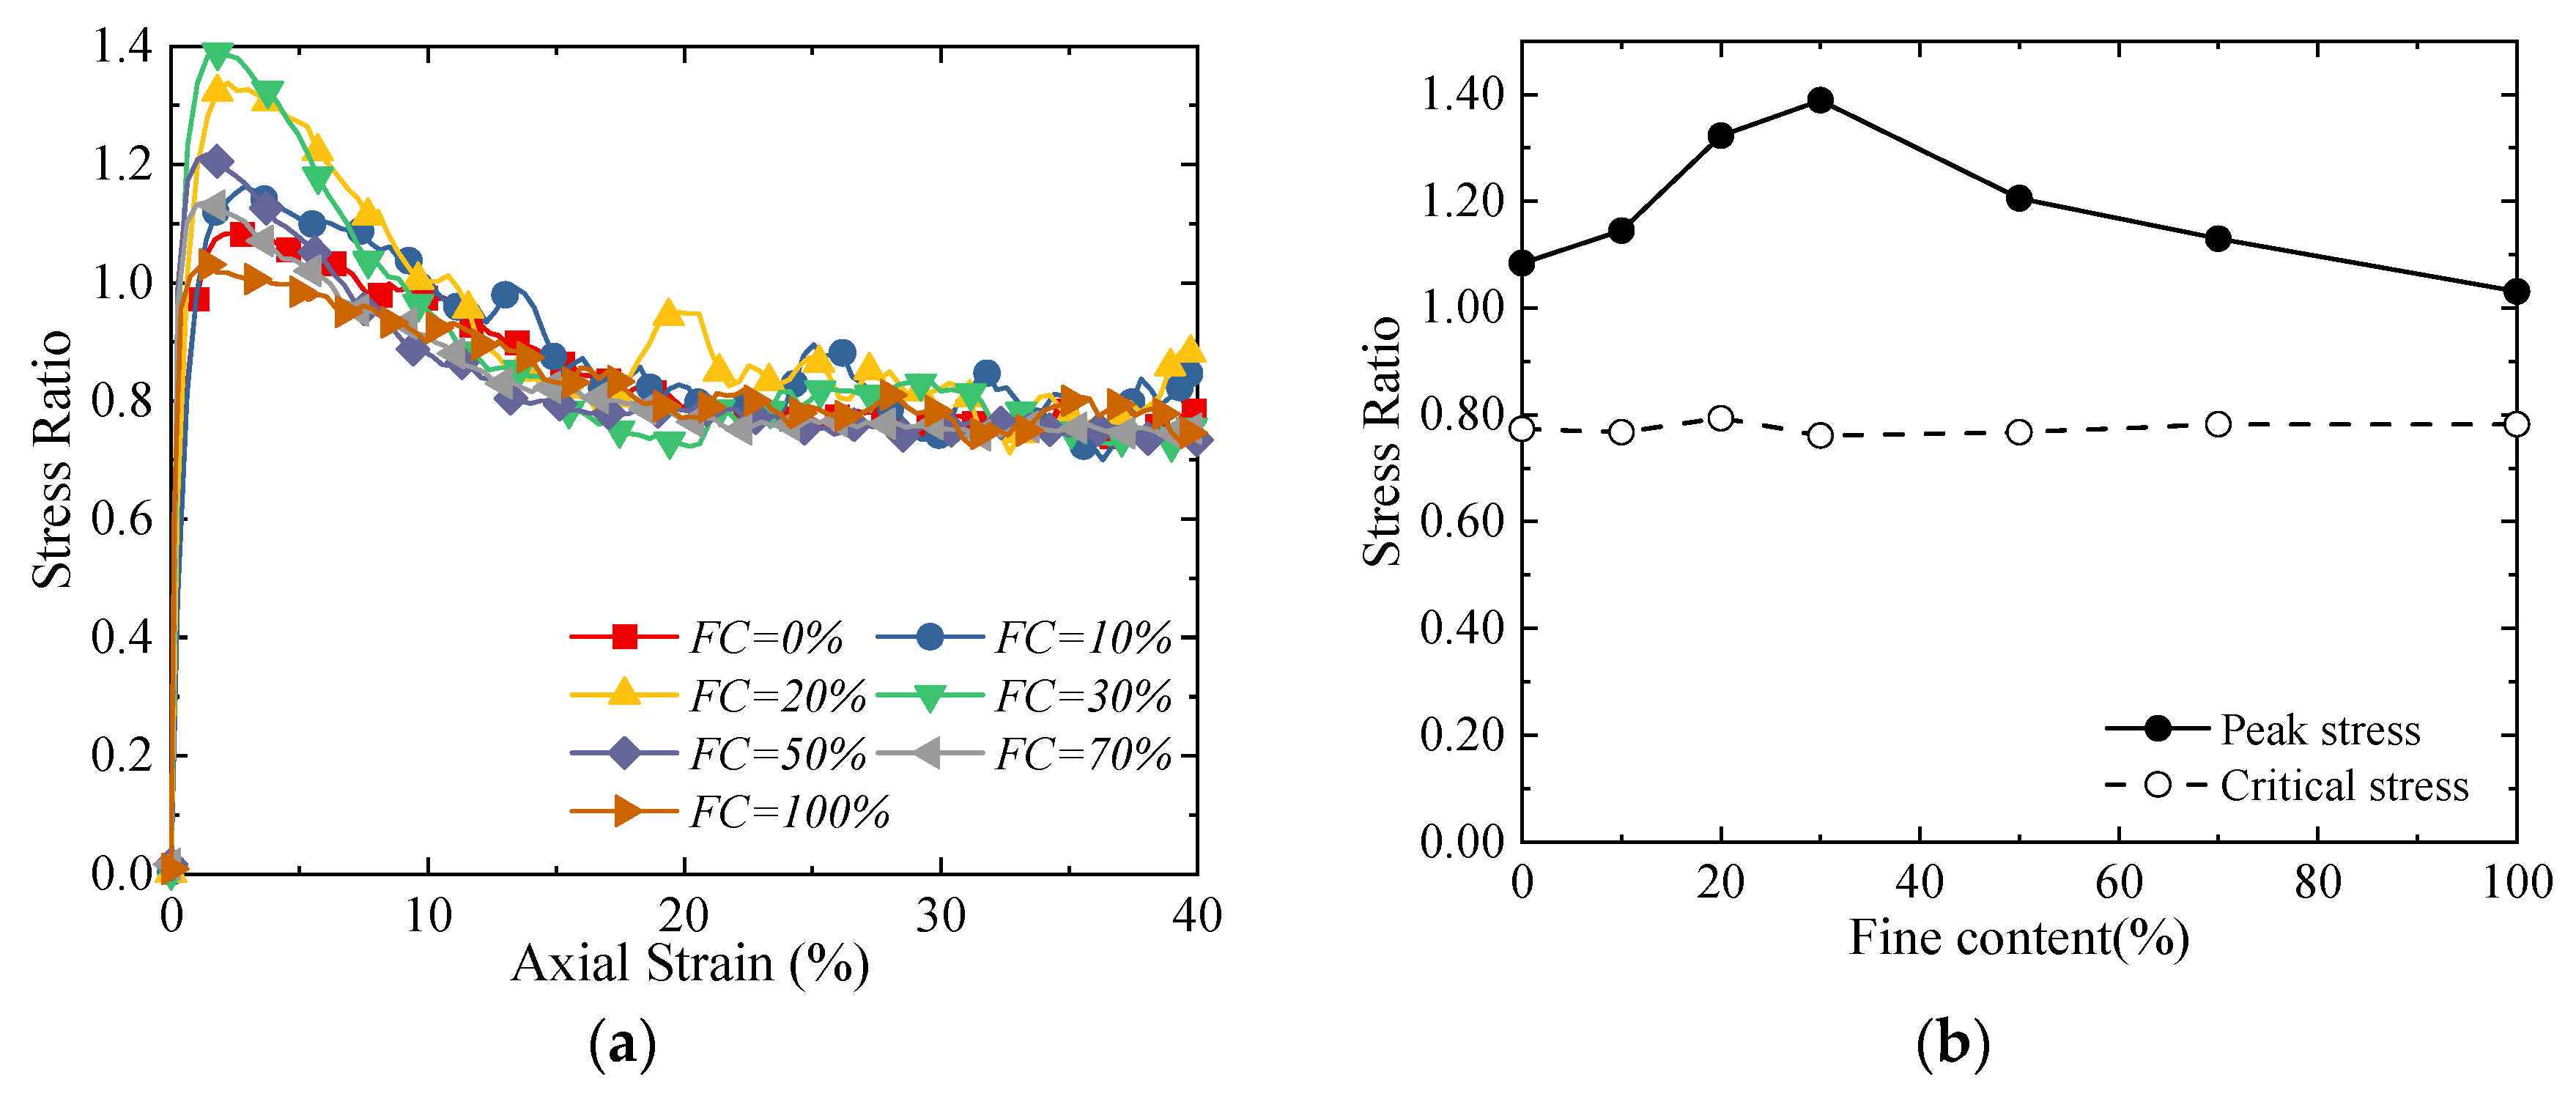
Figure 10 presents the diagram illustrating the influence of different FCs on the macro stress–strain relationship of binary mixtures. As can be seen from Figure 10a, with the increase in axial strain, the stress ratio of all specimens rises rapidly in the early stage of shearing, then gradually decreases after reaching the peak value and tends to stabilize—all specimens exhibit obvious strain-softening behaviors. The discrete element method (DEM) simulation results are highly consistent with Zhu’s calculation results [19] and are also close to the experimental results in the previous section. When the fines content increases from 0% to 30% (Figure 10b), the peak stress ratio increases gradually, indicating a gradual enhancement in the shear strength of the specimens; when the FC further increases from 30% to 100%, the peak stress ratio decreases gradually, which means the peak strength reduces progressively. In addition, it can be observed that the critical-state stress ratio is insensitive to changes in the fines content, which indicates that the specimens will eventually reach the same critical state regardless of the variations in the fines content. This phenomenon is inconsistent with the macro experimental results, and the reason lies in that both the coarse and fine particles used in the simulation are spherical, with no difference in shape between them. This further proves that the particle shape is a key variable affecting the critical state [49].
The coordination number refers to the number of contacts between a particle and its surrounding particles, while the average coordination number reflects the tightness of inter-particle contacts. As a fundamental parameter for characterizing the microstructural characteristics of sand–silt mixtures, it can be expressed as follows [50]:
C m = 2 N c N 1 N p N 0 N 1
where Nc and Np represent the total number of contacts and the total number of particles, respectively; and N0 and N1 denote the number of particles with no contacts and only one contact, respectively. Particles with no contacts or only one contact cannot effectively form a stable force transmission network with other particles. Therefore, they do not participate in bearing external loads or transmitting internal forces. To more accurately reflect the actual force-bearing state of sand–silt mixtures, these particles are excluded when calculating the coordination number.
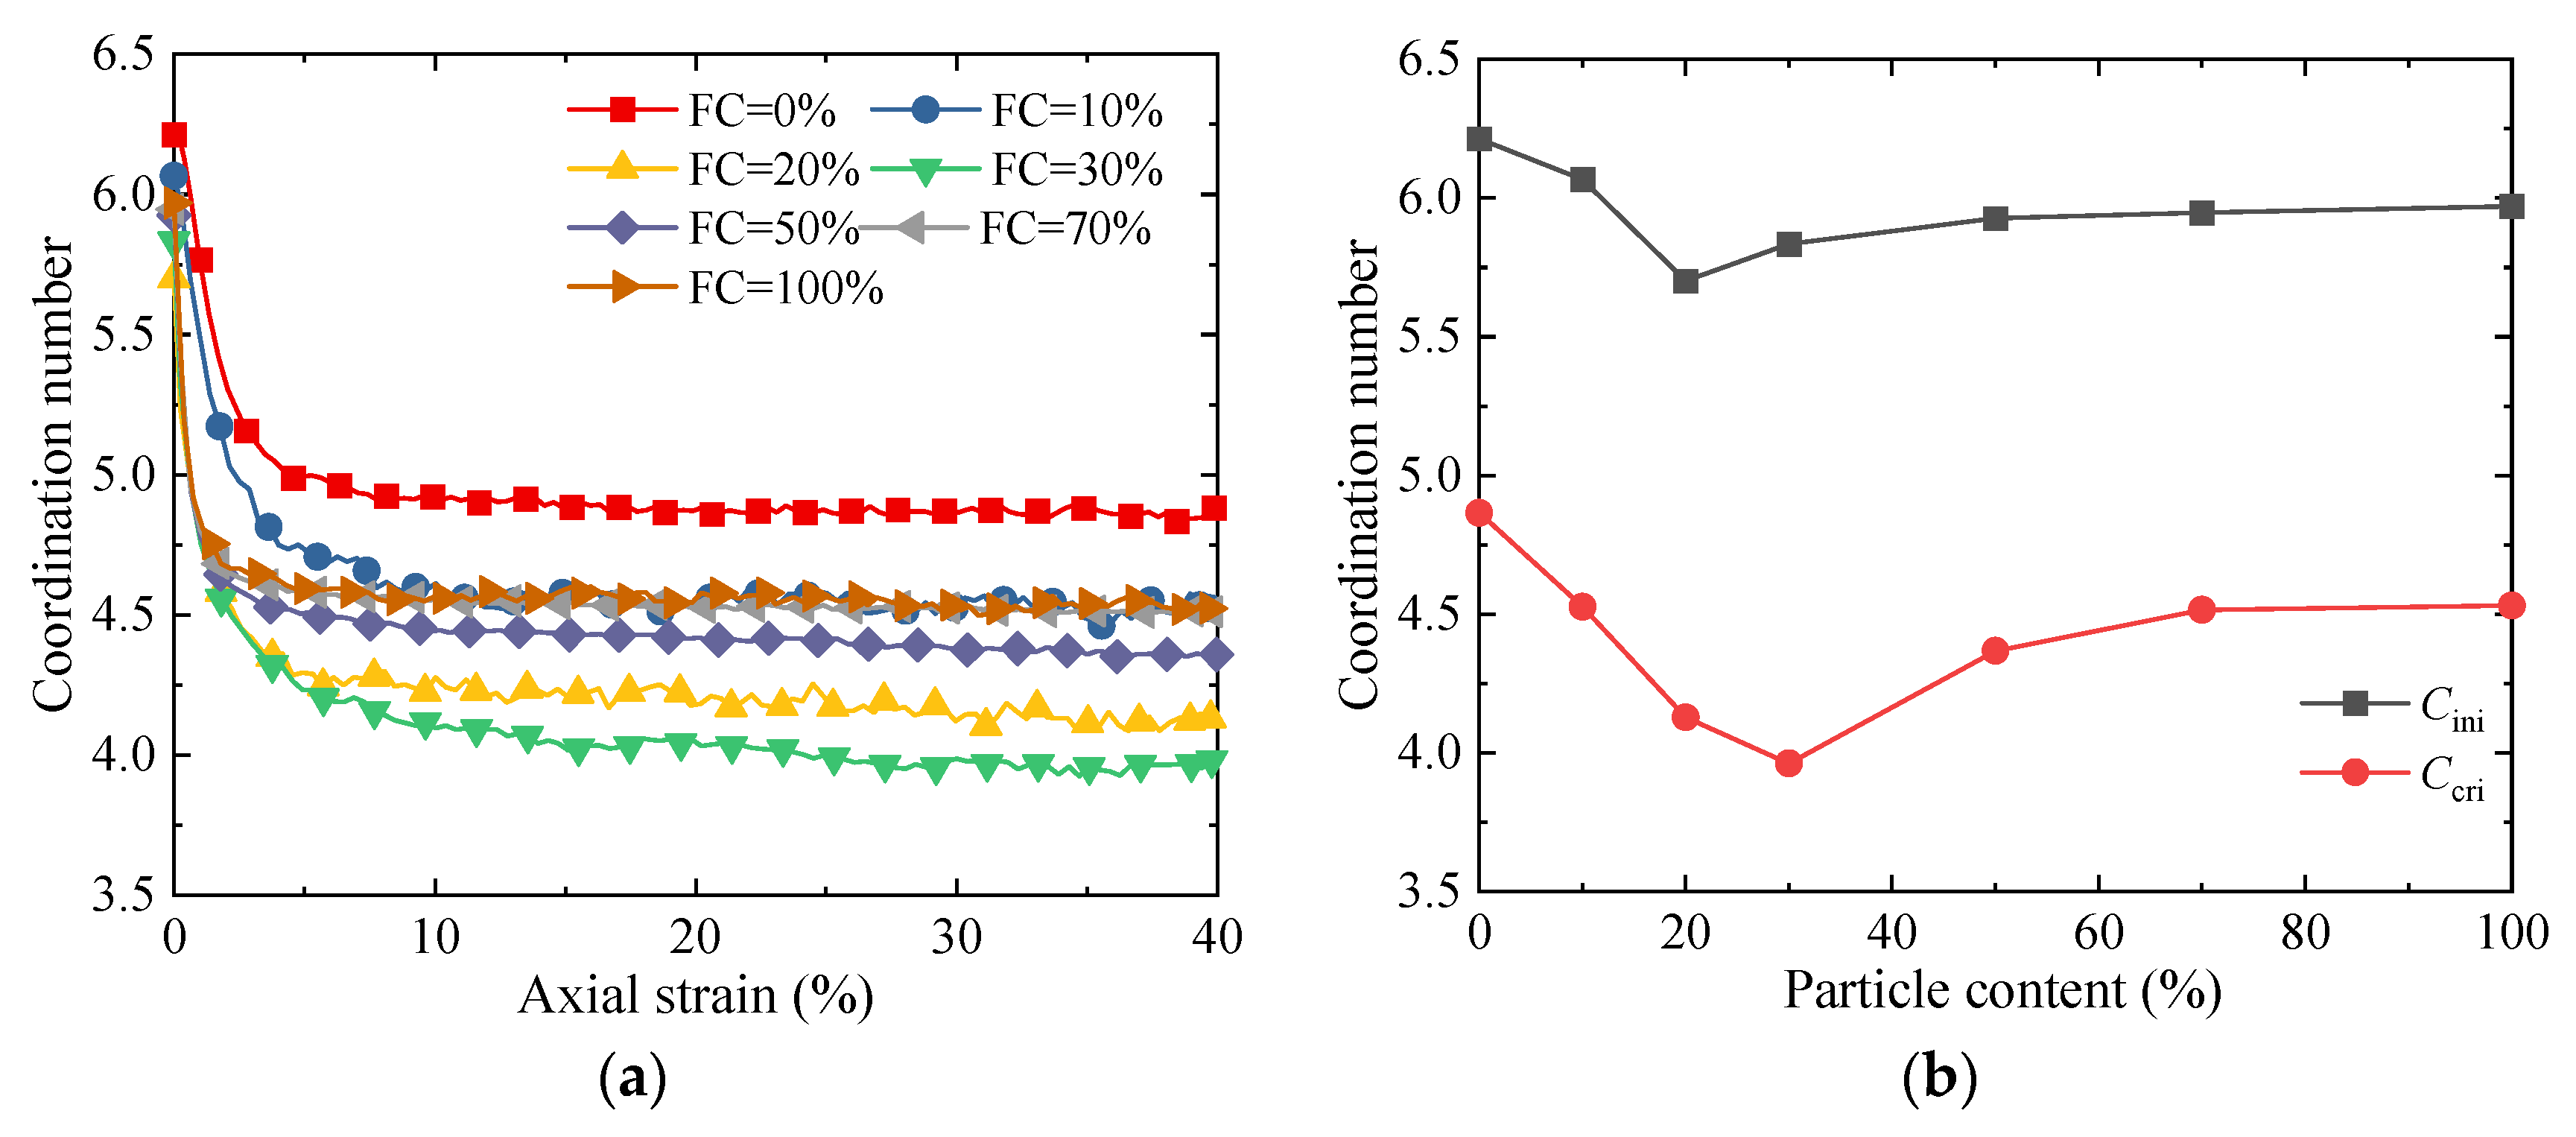
Figure 11 presents the evolution of the coordination number. The results show that, for specimens with all fines contents, the coordination number gradually decreases as shearing proceeds and tends to stabilize after reaching the critical state. When FC < 30%, the coordination number decreases as the fines content increases; however, when FC > 30%, the coordination number increases with the increase in fines content—this is contrary to the common understanding. Generally, the void ratio is negatively correlated with the coordination number—i.e., the larger the void ratio, the smaller the coordination number [9,51]. The reason for this “abnormal phenomenon” is as follows: under the condition of a low fines content (when FC < 30%), a large number of fine particles are located in the pores formed by coarse particles, resulting in fewer contacts between these fine particles and the surrounding particles. Therefore, under the condition of a low fines content, as the fines content increases, the skeleton formed by coarse particles becomes loose; meanwhile, the number of particles with no contacts or only one contact increases significantly. These two factors jointly lead to a decrease in the coordination number.
Inside the sand–silt mixture, particles form a highly inhomogeneous force transmission network through complex inter-particle contact interactions. During the shearing process, the contact states between the particles and the force transmission network continuously adjust and evolve to adapt to the changes in the external loads. The fines content plays a crucial regulatory role in this evolutionary process, and analyzing the evolution law of the contact force network is conducive to gaining a deeper understanding of the strength source of binary mixtures. Different from the conventional method of classifying strong and weak contact networks (which uses the overall average contact force as the threshold), this study adopts the average contact force of each of the three contact sub-networks [32] as the threshold to classify strong and weak contact networks. This approach is based on the consideration that there are significant differences in contact forces between coarse–coarse (CC), coarse–fine (CF), and fine–fine (FF) contacts, and aims to comprehensively evaluate the contribution of different types of contacts to the mechanical behaviors of binary mixtures.
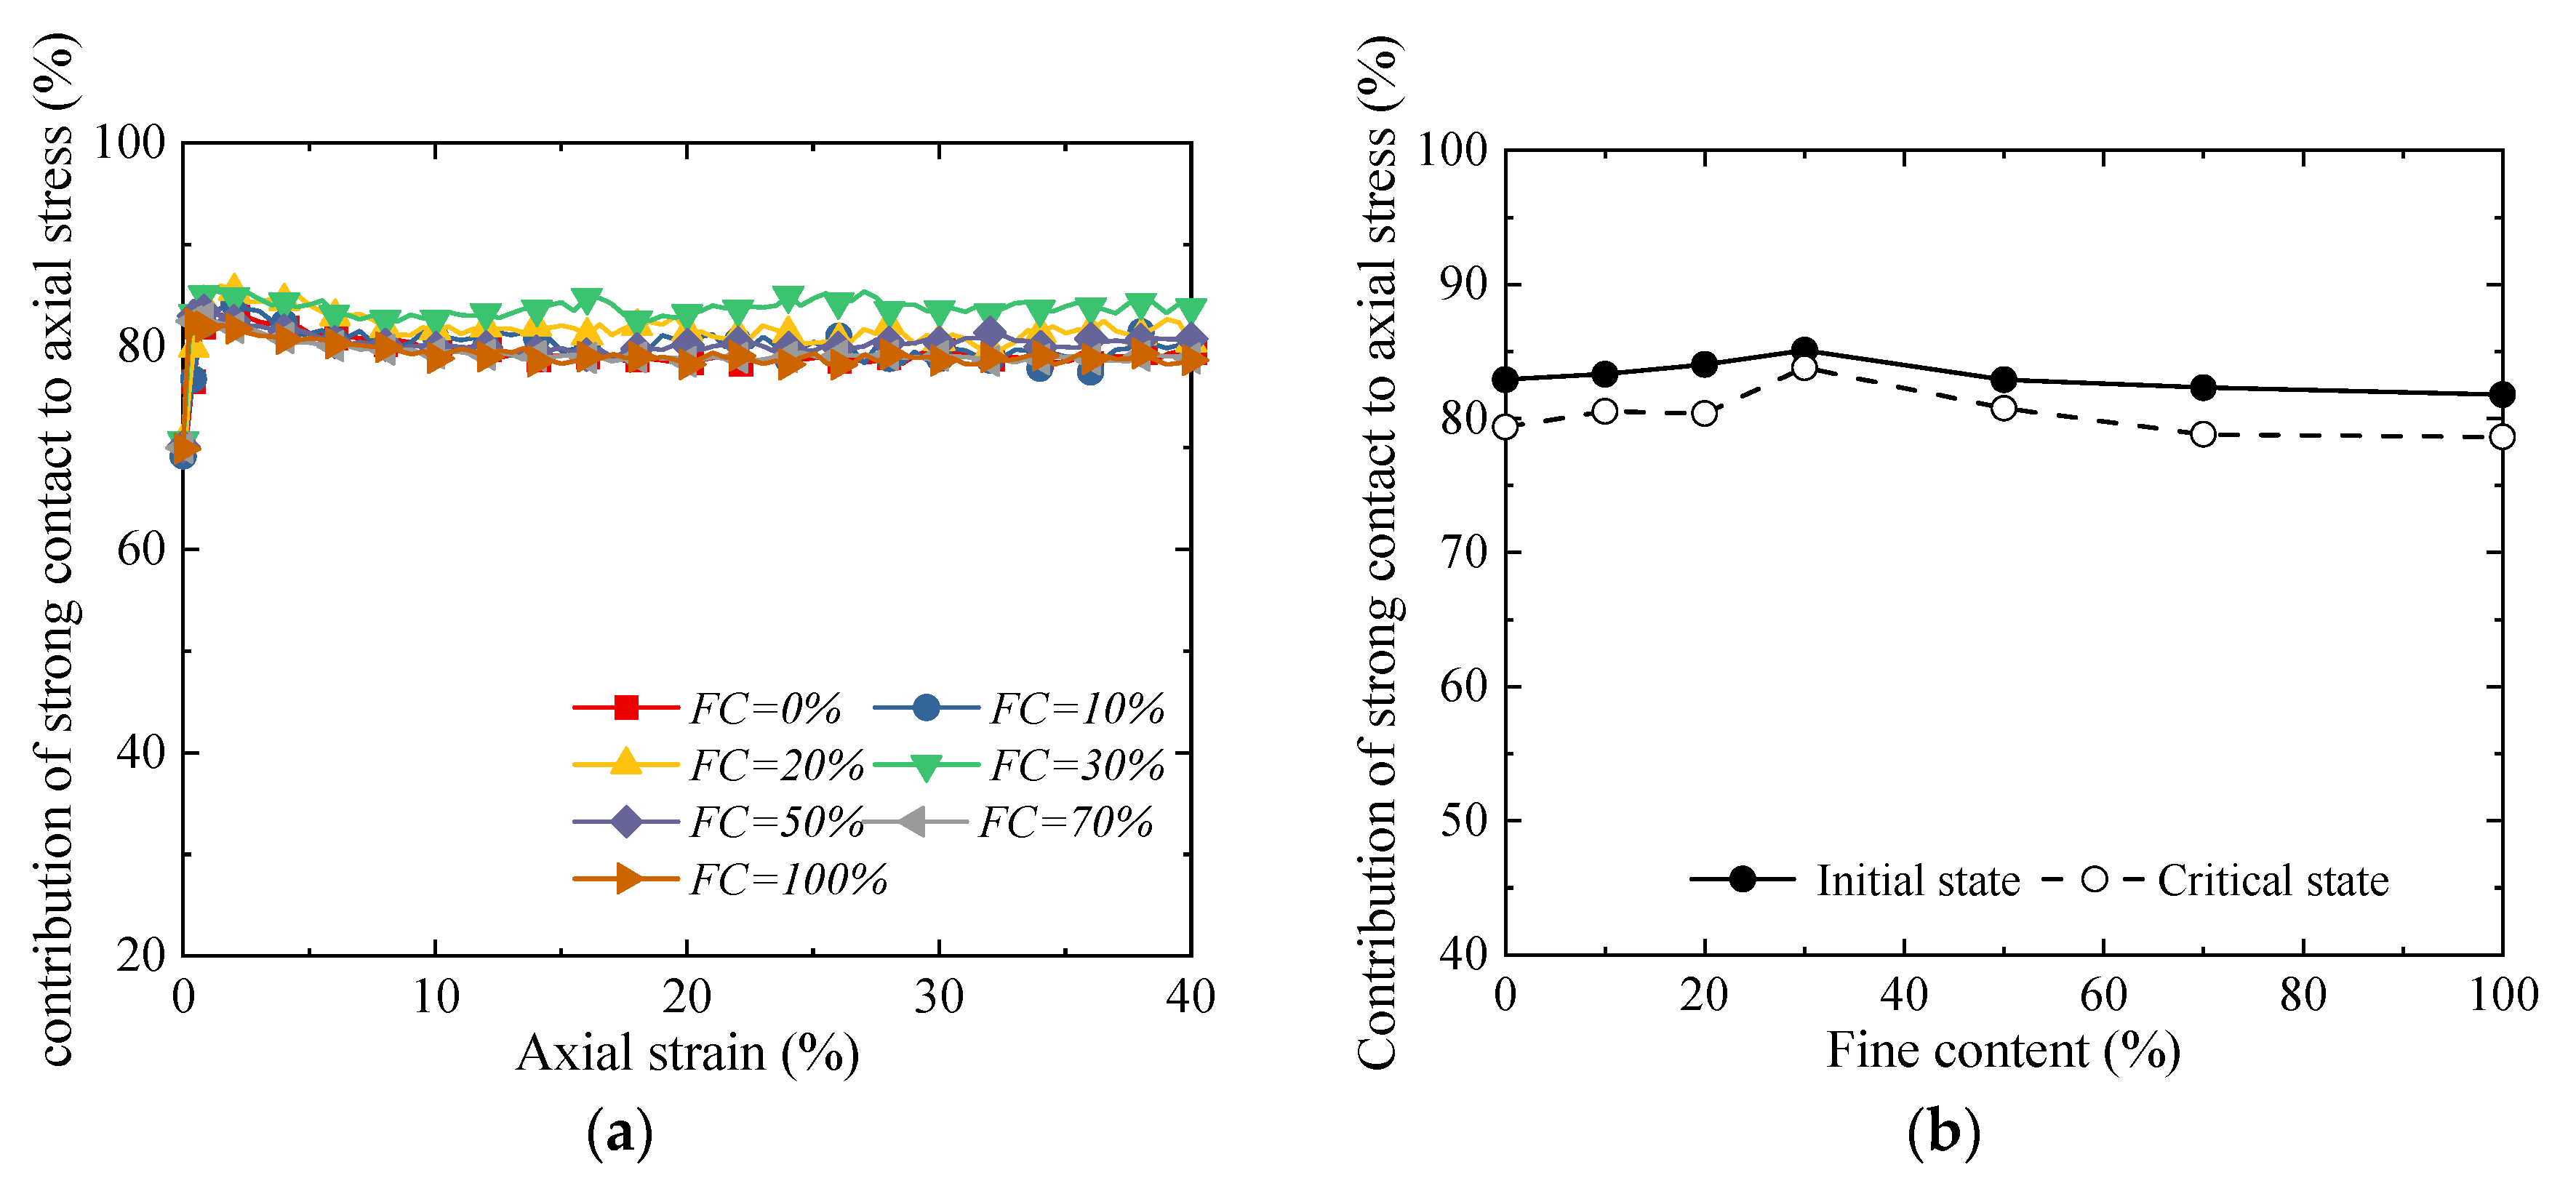
Figure 12 illustrates the variation law of the proportion of strong contacts with the fines content. Overall, the fines content exerts a significant regulatory effect on the structure of the particle contact network: as the fines content increases from 0% to approximately 30%, the proportion of strong contacts decreases continuously; when the fines content exceeds 30% and further increases to 100%, the proportion of strong contacts shows an upward trend (Figure 12). However, the law governing the contribution of strong contacts to the axial stress is exactly opposite to the variation in the proportion of strong contacts (Figure 13): at a fines content of around 30%, although the proportion of strong contacts is at its lowest level, their load-bearing contribution to the axial stress reaches the maximum. Meanwhile, the small number of strong contacts results in more weak contacts in the particle system. Although these weak contacts do not directly bear the main axial stress, they form a stable lateral support system, which effectively restrains the lateral deformation of the strong contact skeleton, thereby enhancing the overall shear strength and stability. Therefore, when the FC is 30%, a structure in which the “high-efficiency load-bearing” strong contact network and the “stable supporting” weak contact network cooperate with each other is formed inside the material—and this is the primary reason for its macro strength reaching the peak value.
Studies [52,53] have shown that the stress evolution of granular materials is closely related to the fabric tensor, and many scholars have established various fabric–stress relationships. Some scholars [54] argue that the strength evolution of granular materials exhibits a linear relationship with the anisotropy coefficient of the strong contact fabric. Using the aforementioned sub-network-based method for classifying strong contacts, the anisotropy coefficient of the strong contact fabric ( a c s ) can be expressed as follows:
a c s = m W s , m a c s , m , a c s , m = 3 2 a i j s , m a i j s , m , a i j s , m = 15 / 2 Φ i j s , m
where m denotes the three contact sub-networks, namely, coarse–coarse (CC), coarse–fine (CF), and fine–fine (FF); Φ i j s , m represents the deviatoric tensor of Φ i j s , m = 1 N s , m c = 1 N s , m n i s , m n j s , m , where the superscript s specifically indicates “strong contacts”; n j s , m stands for the branch vector of strong contacts within the “m”-type contact sub-network; N s , m refers to the number of strong contacts in the “m”-type contact sub-network; and W s , m denotes the weight coefficient corresponding to the “m”-type contact sub-network ( W s , m = N s , m / N s ).
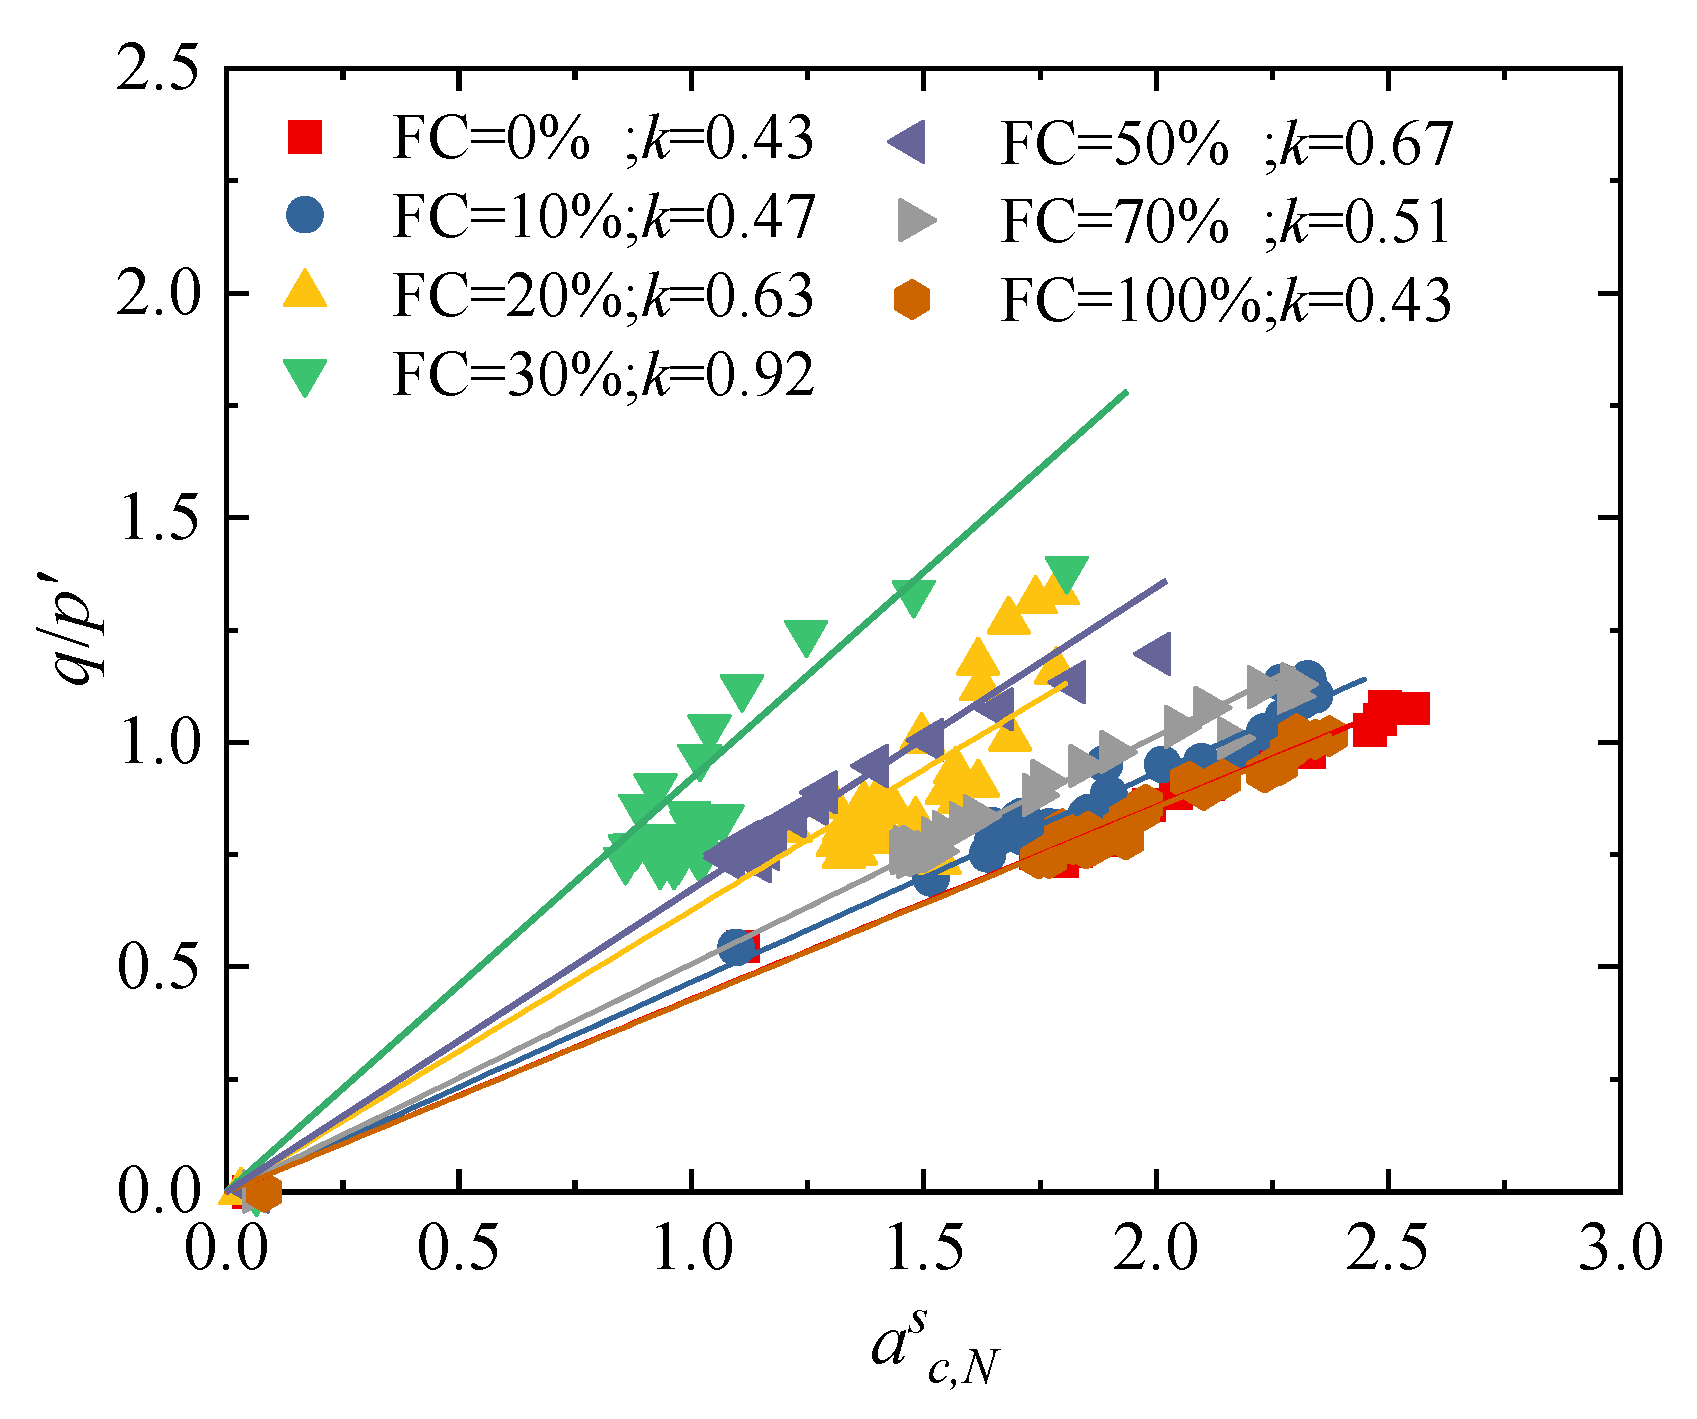
Figure 14 presents the relationship between the deviatoric stress ratio and the anisotropy coefficient of the strong contact fabric for specimens with a different fines content. It can be observed that there is a linear relationship between the anisotropy of the strong contact fabric and stress ratio; as the fines content increases, the slope of the strong contact fabric–stress relationship first increases and then decreases. When the fines content is 30%, the anisotropy of the strong contact fabric reaches its minimum, and this minimum anisotropy corresponds to the highest strength of the specimen. This phenomenon indicates that, under this fines content, the weak contacts enhance the stability of the strong contacts in the form of “caging” or lateral confinement, thereby suppressing the instability of force chains and the rolling of particles.
Equation (5) only considers the relationship between the contact normal fabric anisotropy and strength. However, existing studies [28,32] have shown that both the mean normal contact force anisotropy and branch vector anisotropy also contribute to the strength of granular materials. This contribution is particularly significant for heterogeneous materials such as binary mixtures. To further account for their effects, the weight coefficient in Equation (5) is modified as follows:
W s , m = N s , m f ¯ n s , m b ¯ s , m N s f ¯ n s b ¯ s / m N s , m f ¯ n s , m b ¯ s , m N s f ¯ n s b ¯ s
where f ¯ n s , m denotes the average value of the strong contact forces in the “m”-type sub-network, while f ¯ n s represents the average value of the overall strong contact forces of the specimen, both in newton (N); and b ¯ s , m stands for the average value of the branch vectors of the strong contacts in the “m”-type sub-network, and b ¯ s refers to the average value of the branch vectors of the overall strong contacts of the specimen.
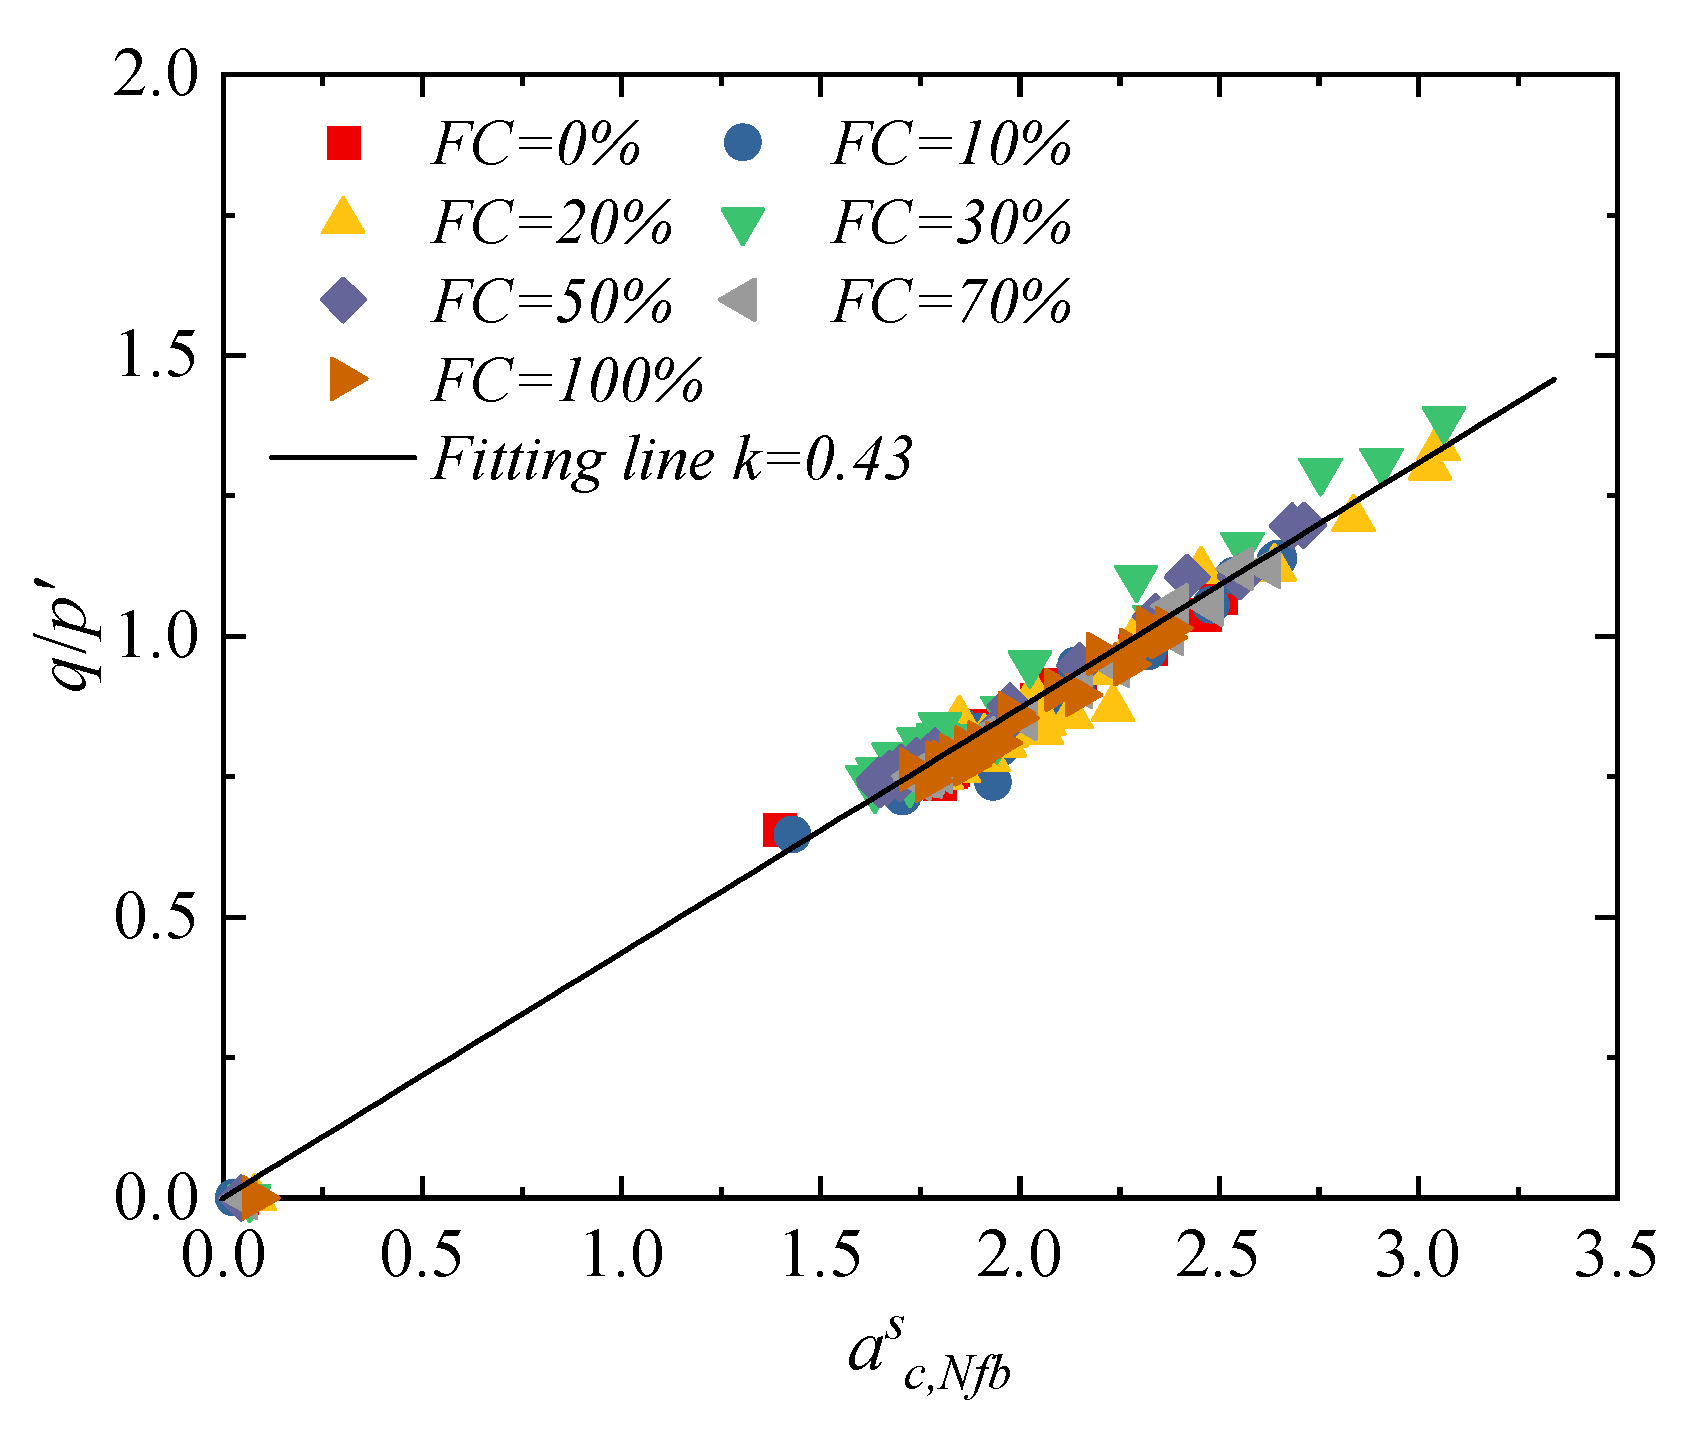
By substituting Equation (6) into Equation (5), the modified relationship between the anisotropy parameter of the strong contact fabric and the stress ratio can be obtained, as shown in Figure 15. The results indicate that, under different fines content conditions, there exists a unique and significant linear correlation between the anisotropy of the strong contact fabric and the stress ratio, with a Pearson correlation coefficient [55] as high as 0.95. When describing the macro-mechanical response of binary mixtures, it is crucial to consider both the contact force anisotropy and branch vector anisotropy for establishing a unified fabric–stress relationship. Although the fines content significantly affects the macro-mechanical properties of granular materials, at the microscale, the strong contact network plays a similar core role in sand–silt mixtures with different fines contents. This finding not only reveals the unified mechanical mechanism of strong contacts in sand–silt mixtures but also provides a more unified and accurate theoretical framework and evaluation criterion for further exploring the micro–meso essence of the instability and failure of sand–silt mixtures.

5. Conclusions

The study focuses on sand–silt mixtures. By combining laboratory triaxial tests with discrete element method (DEM) simulations, it systematically investigates the effects of the fines content (FC = 0%, 10%, 20%, 30%, 50%, 70%, and 100%) and size ratio (SR = 9.1, 18.7, and 39.7) on the macroscopic mechanical properties and microscopic interaction mechanisms of the mixtures, and clarifies the correlation laws between macro- and microscopic parameters. The main conclusions are as follows:
(1)
Both the peak friction angle (φps) and critical-state friction angle (φcs) of sand–silt mixtures exhibit a trend of “first increase, and then decrease” with an increasing fines content. The peak inflection point of their variation curves corresponds to the threshold fines content. When the FC is below the threshold, fines fill the pores of coarse particles and enhance inter-particle interlocking, thereby improving the strength; when the FC exceeds the threshold, excessive fines disrupt the force-transmitting skeleton of coarse particles, leading to strength attenuation. Moreover, the smaller the SR, the lower the threshold FC, and the narrower the transitional range of the FC on the strength. Specifically, the threshold FC of mixtures with SR = 9.1 is approximately 10% lower than that of mixtures with SR = 18.1 and 39.7, and its transitional range of the FC is also approximately 10% narrower than theirs.
(2)
The fines contents and size ratio jointly regulate the deformation mode of the mixtures: when the FC is below the threshold, the contraction behaviors of the mixtures becomes more significant with an increasing FC, while dilatancy is inhibited; when the FC is above the threshold, dilatancy gradually strengthens with an increasing FC. Additionally, mixtures with a smaller SR show more significant post-peak stress softening and greater dilatancy in the low FC range: Mixtures with SR = 9.1 exhibit more significant post-peak stress softening with a softening amplitude of 15–20% and greater dilatancy with a dilatancy ratio of 0.8–1.2; in contrast, mixtures with SR = 39.7 display weaker post-peak stress softening with a softening amplitude of only 5–8% and smaller dilatancy with a dilatancy ratio of 0.2–0.5.
(3)
The results from microscopic simulations indicate that, when the fines content is approximately 30%, although the proportion of strong contacts is the lowest, their contribution to the axial stress is the highest. Meanwhile, a large number of weak contacts form a stable lateral support, effectively constraining the deformation of the strong contact skeleton. At this point, the coordination between load-bearing and support within the material is achieved, resulting in the peak macroscopic strength.
(4)
By considering the influence of the contact number, average normal contact force, and average branch vector length on the weight coefficient of fabric anisotropy, a unique linear relationship between the fabric anisotropy of strong contacts and the stress ratio is established. This indicates that, at the microscopic scale, the strong contact network plays a similar core role in sand–silt mixtures with different fines contents, providing a unified theoretical framework and evaluation criterion for exploring the microscopic essence of instability and failure in sand–silt mixtures.
It should be noted that this study has certain limitations: although the macro-mechanical responses and micro-action mechanisms of sand–fines mixtures are explored through macro triaxial tests and DEM simulations, the influence of the particle shape is not considered in the DEM simulation process. Specifically, the current simulation adopts uniformly spherical particles, lacking exploration on the impact of the shape differences between coarse and fine particles (e.g., angular coarse particles vs. irregular fine particles) on the mechanical mechanisms of sand–fines mixtures.
In terms of future research directions, more DEM simulations of coarse and fine particles with different shapes can be carried out—for example, introducing angularity parameters for coarse particles and irregular shape models for fine particles—to more intuitively explore how the particle shape modulates the contact network evolution, force chain transmission, and, ultimately, the macro-mechanical properties of sand–fines mixtures. This will help further improve the comprehensiveness and practicality of the research on the mechanical behavior of sand–fines mixtures.

Author Contributions

Conceptualization, K.W., H.B., P.Y. and Z.Y.; methodology, K.W., H.B., D.L. and P.Y.; investigation, B.L. and Y.L.; data curation, H.B., D.L. and Z.Y.; writing—original draft, H.B., Z.Y. and P.Y.; writing—review and editing, K.W., D.L., P.Y. and Y.L.; supervision, K.W., B.L. and Y.L.; project administration, B.L. and Y.L.; funding acquisition, Y.L. All authors have read and agreed to the published version of the manuscript.

Funding

This work was supported by the financial support provided by the National Natural Science Foundation of China (No. 52278327).

Data Availability Statement

The original contributions presented in this study are included in the article. Further inquiries can be directed to the corresponding author.

Conflicts of Interest

Bing Lv was employed by the company “Second Engineering of CCCC Third Highway Engineering Co., Ltd.” The remaining authors declare that the research was conducted in the absence of any commercial or financial relationships that could be construed as a potential conflict of interest.

References

  1. Nikbakht, M.; Sarand, F.B.; Irani, A.E.; Bonab, M.H.; Azarafza, M.; Derakhshani, R. An Experimental Study for Swelling Effect on Repairing of Cracks in Fine-Grained Clayey Soils. Appl. Sci. 2022, 12, 8596. [Google Scholar] [CrossRef]
  2. Thevanayagam, S.; Shenthan, T.; Mohan, S.; Liang, J. Undrained Fragility of Clean Sands, Silty Sands, and Sandy Silts. J. Geotech. Geoenviron. Eng. 2002, 128, 849–859. [Google Scholar] [CrossRef]
  3. Carraro, J.A.H.; Prezzi, M.; Salgado, R. Shear Strength and Stiffness of Sands Containing Plastic or Nonplastic Fines. J. Geotech. Geoenviron. Eng. 2009, 135, 1167–1178. [Google Scholar] [CrossRef]
  4. Yilmaz, Y.; Deng, Y.B.; Chang, C.S.; Gokce, A. Strength-dilatancy and critical state behaviours of binary mixtures of graded sands influenced by particle size ratio and fines content. Géotechnique 2023, 73, 202–217. [Google Scholar] [CrossRef]
  5. Naeini, S.A.; Baziar, M.H. Effect of fines content on steady-state strength of mixed and layered samples of a sand. Soil Dyn. Earthq. Eng. 2004, 24, 181–187. [Google Scholar] [CrossRef]
  6. Zuo, L.; Baudet, B.A. Determination of the transitional fines content of sand-non plastic fines mixtures. Soils Found. 2015, 55, 213–219. [Google Scholar] [CrossRef]
  7. Yan, Z.; Liu, Y.; Zhao, D. Instability of binary mixtures subjected to constant shear drained stress path: Insight from macro and micro perspective. Int. J. Numer. Anal. Methods Geomech. 2024, 48, 3997–4013. [Google Scholar] [CrossRef]
  8. Harehdasht, S.A.; Karray, M.; Hussien, M.N.; Chekired, M. Influence of Particle Size and Gradation on the Stress-Dilatancy Behavior of Granular Materials during Drained Triaxial Compression. Int. J. Geomech. 2017, 17, 04017077. [Google Scholar] [CrossRef]
  9. Gong, J.; Nie, Z.H.; Zhu, Y.G.; Liang, Z.Y.; Wang, X. Exploring the effects of particle shape and content of fines on the shear behavior of sand-fines mixtures via the DEM. Comput. Geotech. 2019, 106, 161–176. [Google Scholar] [CrossRef]
  10. Salgado, R.; Bandini, P.; Karim, A. Shear strength and stiffness of silty sand. J. Geotech. Geoenviron. Eng. 2000, 126, 451–462. [Google Scholar] [CrossRef]
  11. Ueda, T.; Matsushima, T.; Yamada, Y. Effect of particle size ratio and volume fraction on shear strength of binary granular mixture. Granul. Matter 2011, 13, 731–742. [Google Scholar] [CrossRef]
  12. Zhou, W.; Xu, K.; Ma, G.; Yang, L.F.; Chang, X.L. Effects of particle size ratio on the macro- and microscopic behaviors of binary mixtures at the maximum packing efficiency state. Granul. Matter 2016, 18, 81. [Google Scholar] [CrossRef]
  13. Xiao, Y.; Liu, H.L.; Chen, Y.M.; Chu, J. Strength and Dilatancy of Silty Sand. J. Geotech. Geoenviron. Eng. 2014, 140, 06014007. [Google Scholar] [CrossRef]
  14. Li, X.; Zhou, W.H.; Liu, J.K.; Wang, C. Influence of non-plastic fines and density state on stress-dilatancy behavior of coral sand: An experimental investigation. Acta Geotech. 2024, 19, 5757–5779. [Google Scholar] [CrossRef]
  15. Xiao, Y.; Xiang, J.; Liu, H.; Ma, Q. Strength-dilatancy relation of sand containing non-plastic fines. Geotech. Lett. 2017, 7, 204–210. [Google Scholar] [CrossRef]
  16. Ni, Q.; Tan, T.S.; Dasari, G.R.; Hight, D.W. Contribution of fines to the compressive strength of mixed soils. Géotechnique 2004, 54, 561–569. [Google Scholar] [CrossRef]
  17. Bouckovalas, G.D.; Andrianopoulos, K.I.; Papadimitriou, A.G. A critical state interpretation for the cyclic liquefaction resistance of silty sands. Soil Dyn. Earthq. Eng. 2003, 23, 115–125. [Google Scholar] [CrossRef]
  18. Rahman, M.M.; Lo, S.C.R.; Dafalias, Y.F. Modelling the static liquefaction of sand with low-plasticity fines. Géotechnique 2014, 64, 881–894. [Google Scholar] [CrossRef]
  19. Zhu, Y.; Nie, Z.; Gong, J.; Zou, J.; Zhao, L.; Li, L. An analysis of the effects of the size ratio and fines content on the shear behaviors of binary mixtures using DEM. Comput. Geotech. 2020, 118, 103353. [Google Scholar] [CrossRef]
  20. Li, X.; Zhou, W.-H.; Liu, J. Stress-dilatancy behavior of marine coral sand incorporating non-plastic fines. Eng. Geol. 2024, 342, 107764. [Google Scholar] [CrossRef]
  21. Xiao, Y.; Yang, H.; Fang, Q.; Ling, Y.; Liu, H. Effect of Shape Discrepancies on Strength of Binary Soils. Transp. Geotech. 2025, 54, 101609. [Google Scholar] [CrossRef]
  22. Yang, J.; Wei, L.M. Collapse of loose sand with the addition of fines: The role of particle shape. Géotechnique 2012, 62, 1111–1125. [Google Scholar] [CrossRef]
  23. Zhao, Y.; Hu, Z.; Zheng, Y.; Wu, Q. Influences of particle size ratio and fines content on the suffusion characteristics of gap-graded soils. Granul. Matter 2024, 26, 52. [Google Scholar] [CrossRef]
  24. Yang, D.; Chu, X. The Effects of the Particle Size Ratio on the Behaviors of Binary Granular Materials. Cmes-Comput. Model. Eng. Sci. 2023, 136, 63–85. [Google Scholar] [CrossRef]
  25. Wiacek, J.; Parafiniuk, P.; Stasiak, M. Effect of particle size ratio and contribution of particle size fractions on micromechanics of uniaxially compressed binary sphere mixtures. Granul. Matter 2017, 19, 34. [Google Scholar] [CrossRef]
  26. Wiacek, J. Geometrical parameters of binary granular mixtures with size ratio and volume fraction: Experiments and DEM simulations. Granul. Matter 2016, 18, 42. [Google Scholar] [CrossRef]
  27. Liu, J.; Zhou, W.; Ma, G.; Yang, S.; Chang, X. Strong contacts, connectivity and fabric anisotropy in granular materials: A 3D perspective. Powder Technol. 2020, 366, 747–760. [Google Scholar] [CrossRef]
  28. Sufian, A.; Russell, A.R.; Whittle, A.J. Anisotropy of contact networks in granular media and its influence on mobilised internal friction. Géotechnique 2017, 67, 1067–1080. [Google Scholar] [CrossRef]
  29. Imseeh, W.H.; Druckrey, A.M.; Alshibli, K.A. 3D experimental quantification of fabric and fabric evolution of sheared granular materials using synchrotron micro-computed tomography. Granul. Matter 2018, 20, 24. [Google Scholar] [CrossRef]
  30. Lopez, R.D.F.; Silfwerbrand, J.; Jelagin, D.; Birgisson, B. Force transmission and soil fabric of binary granular mixturese. Géotechnique 2016, 66, 578–583. [Google Scholar] [CrossRef]
  31. Fonseca, J.; O’Sullivan, C.; Coop, M.R.; Lee, P.D. Quantifying the evolution of soil fabric during shearing using scalar parameters. Géotechnique 2013, 63, 818–829. [Google Scholar] [CrossRef]
  32. Liu, Y.; Yan, Z. Study on strong contact system by sub-network partitioning method for binary mixtures. Eur. J. Environ. Civ. Eng. 2024, 28, 1589–1613. [Google Scholar] [CrossRef]
  33. Cao, X.; Zhu, Y.; Gong, J. Effect of the intermediate principal stress on the mechanical responses of binary granular mixtures with different fines contents. Granul. Matter 2021, 23, 37. [Google Scholar] [CrossRef]
  34. Zhu, Z.; Zhang, F.; Dupla, J.-C.; Canou, J.; Foerster, E.; Peng, Q. Assessment of tamping-based specimen preparation methods on static liquefaction of loose silty sand. Soil Dyn. Earthq. Eng. 2021, 143, 106592. [Google Scholar] [CrossRef]
  35. Mousavi, M.; Disfani, M.M.; Black, J.R.; Mehdizadeh, A. Impact of sample preparation on erosion characteristics and subsequent mechanical behaviour of gap-graded soils: An imaging-based analysis. Can. Geotech. J. 2025, 62, 1–19. [Google Scholar] [CrossRef]
  36. Selig, E.; Ladd, R. Preparing Test Specimens Using Undercompaction. Geotech. Test. J. 1978, 1, 16–23. [Google Scholar] [CrossRef]
  37. Rahman, M.M.; Lo, S.R.; Baki, M.A.L. Equivalent granular state parameter and undrained behaviour of sand–fines mixtures. Acta Geotech. 2011, 6, 183–194. [Google Scholar] [CrossRef]
  38. Cabalar, A.F. The effects of fines on the behaviour of a sand mixture. Geotech. Geol. Eng. 2011, 29, 91–100. [Google Scholar] [CrossRef]
  39. Bolton, M.D. The strength and dilatancy of sands. Géotechnique 1986, 36, 65–78. [Google Scholar] [CrossRef]
  40. Kuerbis, R.; Negussey, D.; Vaid, Y.P. Effect of Gradation and Fines Content on the Undrained Response of Sand. Geotech. Spec. Publ. 1988, 330–345. [Google Scholar]
  41. Liu, Y.; Zhang, D.; Wu, S.; Yu, P. DEM Investigation on the Evolution of Fabric under True Triaxial Conditions in Granular Materials. Int. J. Geomech. 2020, 20, 04020110. [Google Scholar] [CrossRef]
  42. Liu, Y.; Liu, X.; Hu, W. Competition mechanism between dilation and interlocking in granular soils: DEM simulation and constitutive modeling. Acta Geotech. 2023, 18, 149–169. [Google Scholar] [CrossRef]
  43. Yang, Z.X.; Yang, J.; Wang, L.Z. On the influence of inter-particle friction and dilatancy in granular materials: A numerical analysis. Granul. Matter 2012, 14, 433–447. [Google Scholar] [CrossRef]
  44. Gu, X.; Huang, M.; Qian, J. DEM investigation on the evolution of microstructure in granular soils under shearing. Granul. Matter 2014, 16, 91–106. [Google Scholar] [CrossRef]
  45. Yan, Z.; Liu, Y. Investigation of the macro-and micro-mechanical behaviors of binary mixtures under proportional strain loading path via DEM simulation. Comput. Part. Mech. 2025, 1–19. [Google Scholar] [CrossRef]
  46. Chang, C.; Wang, J.; Ge, L. Maximum and minimum void ratios for sand-silt mixtures. Eng. Geol. 2016, 211, 7–18. [Google Scholar] [CrossRef]
  47. Chang, C.S.; Wang, J.-Y.; Ge, L. Modeling of minimum void ratio for sand–silt mixtures. Eng. Geol. 2015, 196, 293–304. [Google Scholar] [CrossRef]
  48. Lopera Pereza, J.; Kwok, C.; O’Sullivan, C.; Huang, X.; Hanley, K. Assessing the quasi-static conditions for shearing in granular media within the critical state soil mechanics framework. Soils Found. 2016, 56, 152–159. [Google Scholar] [CrossRef]
  49. Li, Y.; Huang, R.; Chan, L.S.; Chen, J. Effects of particle shape on shear strength of clay-gravel mixture. KSCE J. Civ. Eng. 2013, 17, 712–717. [Google Scholar] [CrossRef]
  50. Thornton, C.; Sun, G. Axisymmetric compression of 3D polydisperse systems of spheres. Powders Grains 1993, 93, 129–134. [Google Scholar]
  51. Cundall, P.A.; Strack, O.D.L. A discrete numerical model for granular assemblies. Géotechnique 1979, 29, 47–65. [Google Scholar] [CrossRef]
  52. Guo, N.; Zhao, J. The signature of shear-induced anisotropy in granular media. Comput. Geotech. 2013, 47, 1–15. [Google Scholar] [CrossRef]
  53. Oda, M. Fabric tensor for discontinuous geological materials. Soils Found. 1982, 22, 96–108. [Google Scholar] [CrossRef] [PubMed]
  54. Ouadfel, H.; Rothenburg, L. ‘Stress-force-fabric’ relationship for assemblies of ellipsoids. Mech. Mater. 2001, 33, 201–221. [Google Scholar] [CrossRef]
  55. Decky, M.; Papanova, Z.; Juhas, M.; Kudelcikova, M. Evaluation of the Effect of Average Annual Temperatures in Slovakia between 1971 and 2020 on Stresses in Rigid Pavements. Land 2022, 11, 764. [Google Scholar] [CrossRef]
Figure 1. Images of coarse and fine particles: (a) Fine; (b) Sand-A; (c) Sand-B; and (d) Sand-C.
Materials 18 04929 g001
Figure 2. Grain size distributions of binary mixtures.
Materials 18 04929 g002
Figure 3. Stress–strain relationship of sand–silt mixtures under different fines contents and particle size ratios: (a) S R = 9.1   D r = 50 % ; (b) S R = 9.1   D r = 80 % ; (c) S R = 18.7   D r = 50 % ; (d) S R = 18.7   D r = 80 % ; (e) S R = 39.7   D r = 50 % ; and (f) S R = 39.7   D r = 80 % .
Materials 18 04929 g003
Figure 4. Volumetric strain–axial strain relationship of sand–silt mixtures under different fines content and particle size ratios: (a) S R = 9.1   D r = 50 % ; (b) S R = 9.1   D r = 80 % ; (c) S R = 18.7   D r = 50 % ; (d) S R = 18.7   D r = 80 % ; (e) S R = 39.7   D r = 50 % ; and (f) S R = 39.7   D r = 80 % .
Materials 18 04929 g004
Figure 5. Stress–dilatancy relationship of sand–silt mixtures under different fines content and particle size ratios: (a) S R = 9.1   D r = 50 % ; (b) S R = 9.1   D r = 80 % ; (c) S R = 18.7   D r = 50 % ; (d) S R = 18.7   D r = 80 % ; (e) S R = 39.7   D r = 50 % ; and (f) S R = 39.7   D r = 80 % .
Materials 18 04929 g005
Figure 6. Effect of fines content and particle size ratios on the peak state friction angle: (a) Dr = 50%; and (b) Dr = 80%.
Materials 18 04929 g006
Figure 7. Effect of fines content and particle size ratios on the critical-state friction angle.
Materials 18 04929 g007
Figure 8. Typical numerical sample [45]: (a) FC = 0%; (b) FC = 10%; (c) FC = 20%; (d) FC = 30%; (e) FC = 50%; (f) FC = 70%; and (g) FC = 100%.
Materials 18 04929 g008
Figure 9. Relationship between initial void ratio and fines content.
Materials 18 04929 g009
Figure 10. Evolution of stress–strain relationship with respect to FC [32]: (a) stress–strain relationship from DEM simulation; and (b) peak and critical-state stress ratios.
Materials 18 04929 g010
Figure 11. The evolution of the mechanical coordination number with respect to FC [32]: (a) relationship between coordination number and axial strain; and (b) coordination number in initial state and critical state.
Materials 18 04929 g011
Figure 12. Evolution of proportion of strong contacts [32]: (a) relationship between strong contact ratio and axial strain; and (b) proportion of strong contacts in initial state and critical state.
Materials 18 04929 g012
Figure 13. Contribution of strong contacts to axial stress [32]: (a) relationship between axial stress contribution of strong contacts and axial strain; and (b) relationship between the contribution of strong contacts to axial stress and fines content.
Materials 18 04929 g013
Figure 14. Stress–strong contact fabric relationship of specimens with different fines content.
Materials 18 04929 g014
Figure 15. Stress-modified strong contact fabric relationship of specimens with different fines content.
Materials 18 04929 g015
Table 1. Specific weight of particle.
SoilsSand-ASand-BSand-CFine
Median particle diameter D50/mm0.3380.6931.460.037
Specific gravity GS/g·cm−32.6542.6422.6402.653
Table 2. Void ratios of binary mixtures.
SR *FC */%emaxemin D r /%e0SRFC/%emaxemin D r /%e0
9.101.2350.779501.00718.701.1520.746500.949
800.870800.827
101.1300.669500.899101.0130.603500.808
800.761800.685
201.0890.568500.829200.8530.498500.676
800.672800.569
301.0160.534500.775300.8810.458500.669
800.630800.542
500.9370.449500.693500.8480.468500.658
800.546800.544
701.0800.560500.820700.9080.546500.727
800.664800.618
39.701.1400.733500.93739.7101.0190.596500.808
800.815800.681
200.9300.442500.686300.8520.341500.597
800.540800.443
500.8260.377500.602700.8970.530500.713
800.467800.603
1001.1380.736500.9371001.1380.736800.817
* SR refers to the particle size ratio, where SR = D50/d50; FC refers to the fines content; emax = the maximum void ratio; emin = the minimum void ratio; Dr = the relative density (expressed as a percentage); and e0 = the initial void ratio.
Table 3. Micromechanical parameters.
ParameterValue
particle radius r/mm0.1, 0.025
particle density ρ/kg·m−32600
particle–particle friction coefficient μ0, 0.5
Wall–particle friction coefficient μwp0
stiffness constant k0/MPa1.0 × 103, 4.0 × 10³
Disclaimer/Publisher’s Note: The statements, opinions and data contained in all publications are solely those of the individual author(s) and contributor(s) and not of MDPI and/or the editor(s). MDPI and/or the editor(s) disclaim responsibility for any injury to people or property resulting from any ideas, methods, instructions or products referred to in the content.