Influence of S and Mn Initial Concentrations on the Graphite Branching in Gray Cast Iron as Quantified by 2D Image Analysis
Abstract
1. Introduction
2. Material and Methods
2.1. Preparation of Cast Iron Samples
2.2. Image Analysis
2.3. Eutectic Cell Counting
3. Results and Discussion
3.1. Sulfur and Manganese Concentrations
3.2. Classification of Graphite Morphology According to Standard A247-19 [26]
3.3. Measurement of Graphite Flake Sizes
3.4. Effect of Mn and S on the Size of Graphite Flakes
3.5. Effect of Mn and S on the Branching of Graphite Flakes
3.6. Eutectic Cells Counting
3.7. Summary of Main Effects of S and Mn on Branching, Flake’s Length, and Cell Count
4. Conclusions
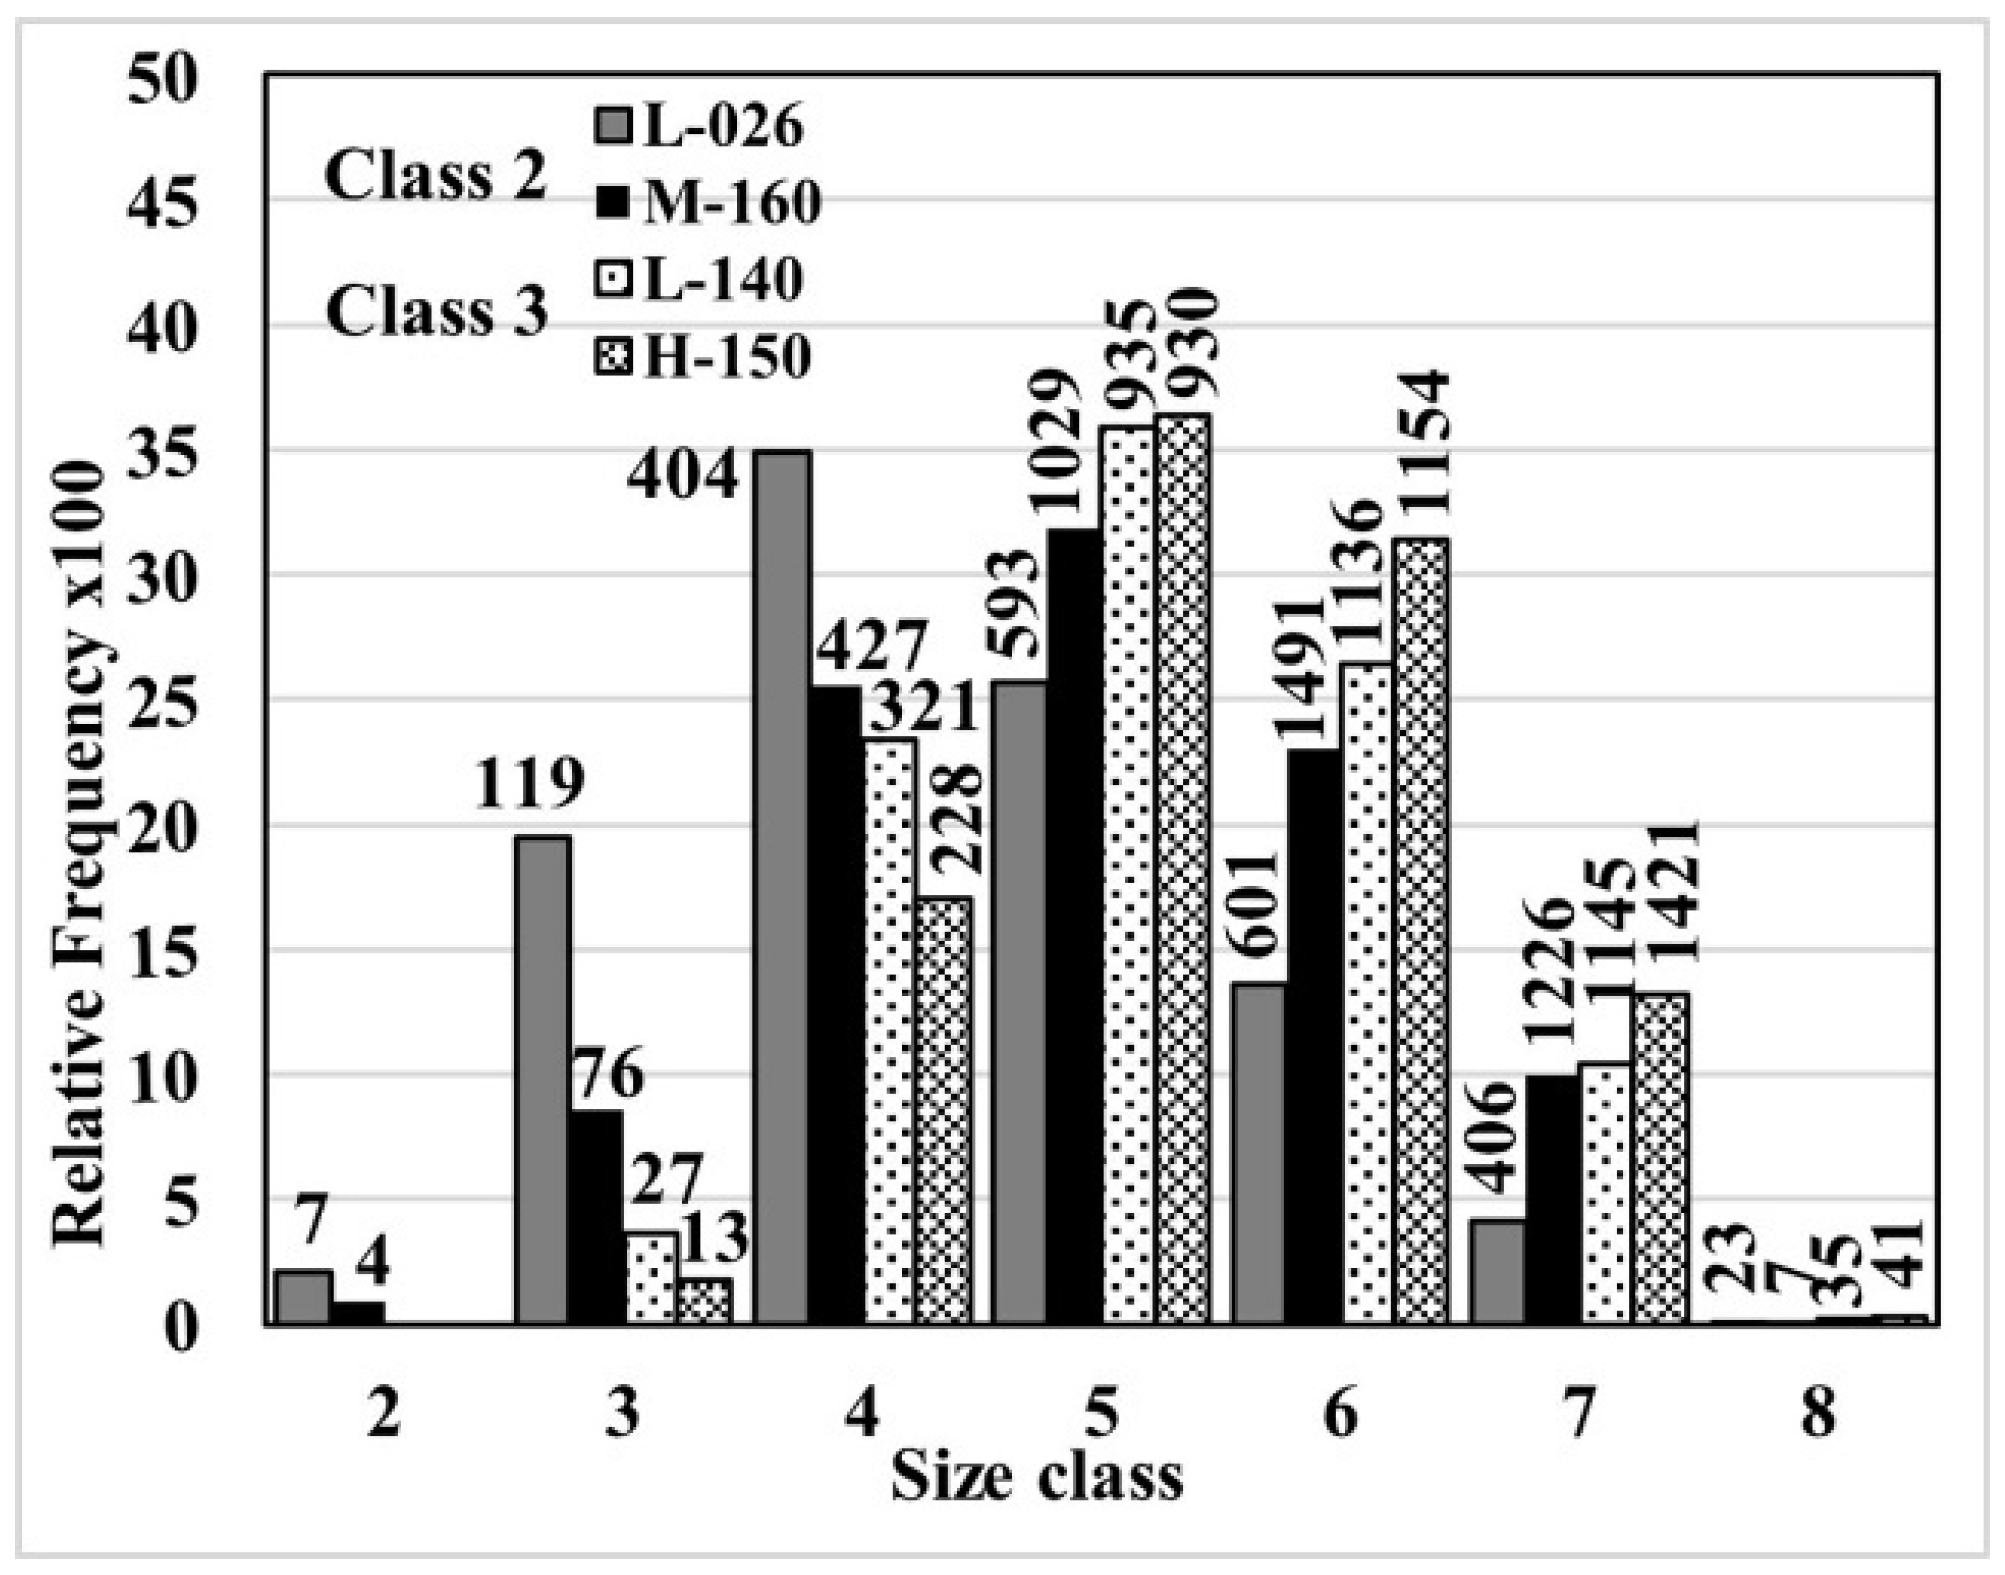
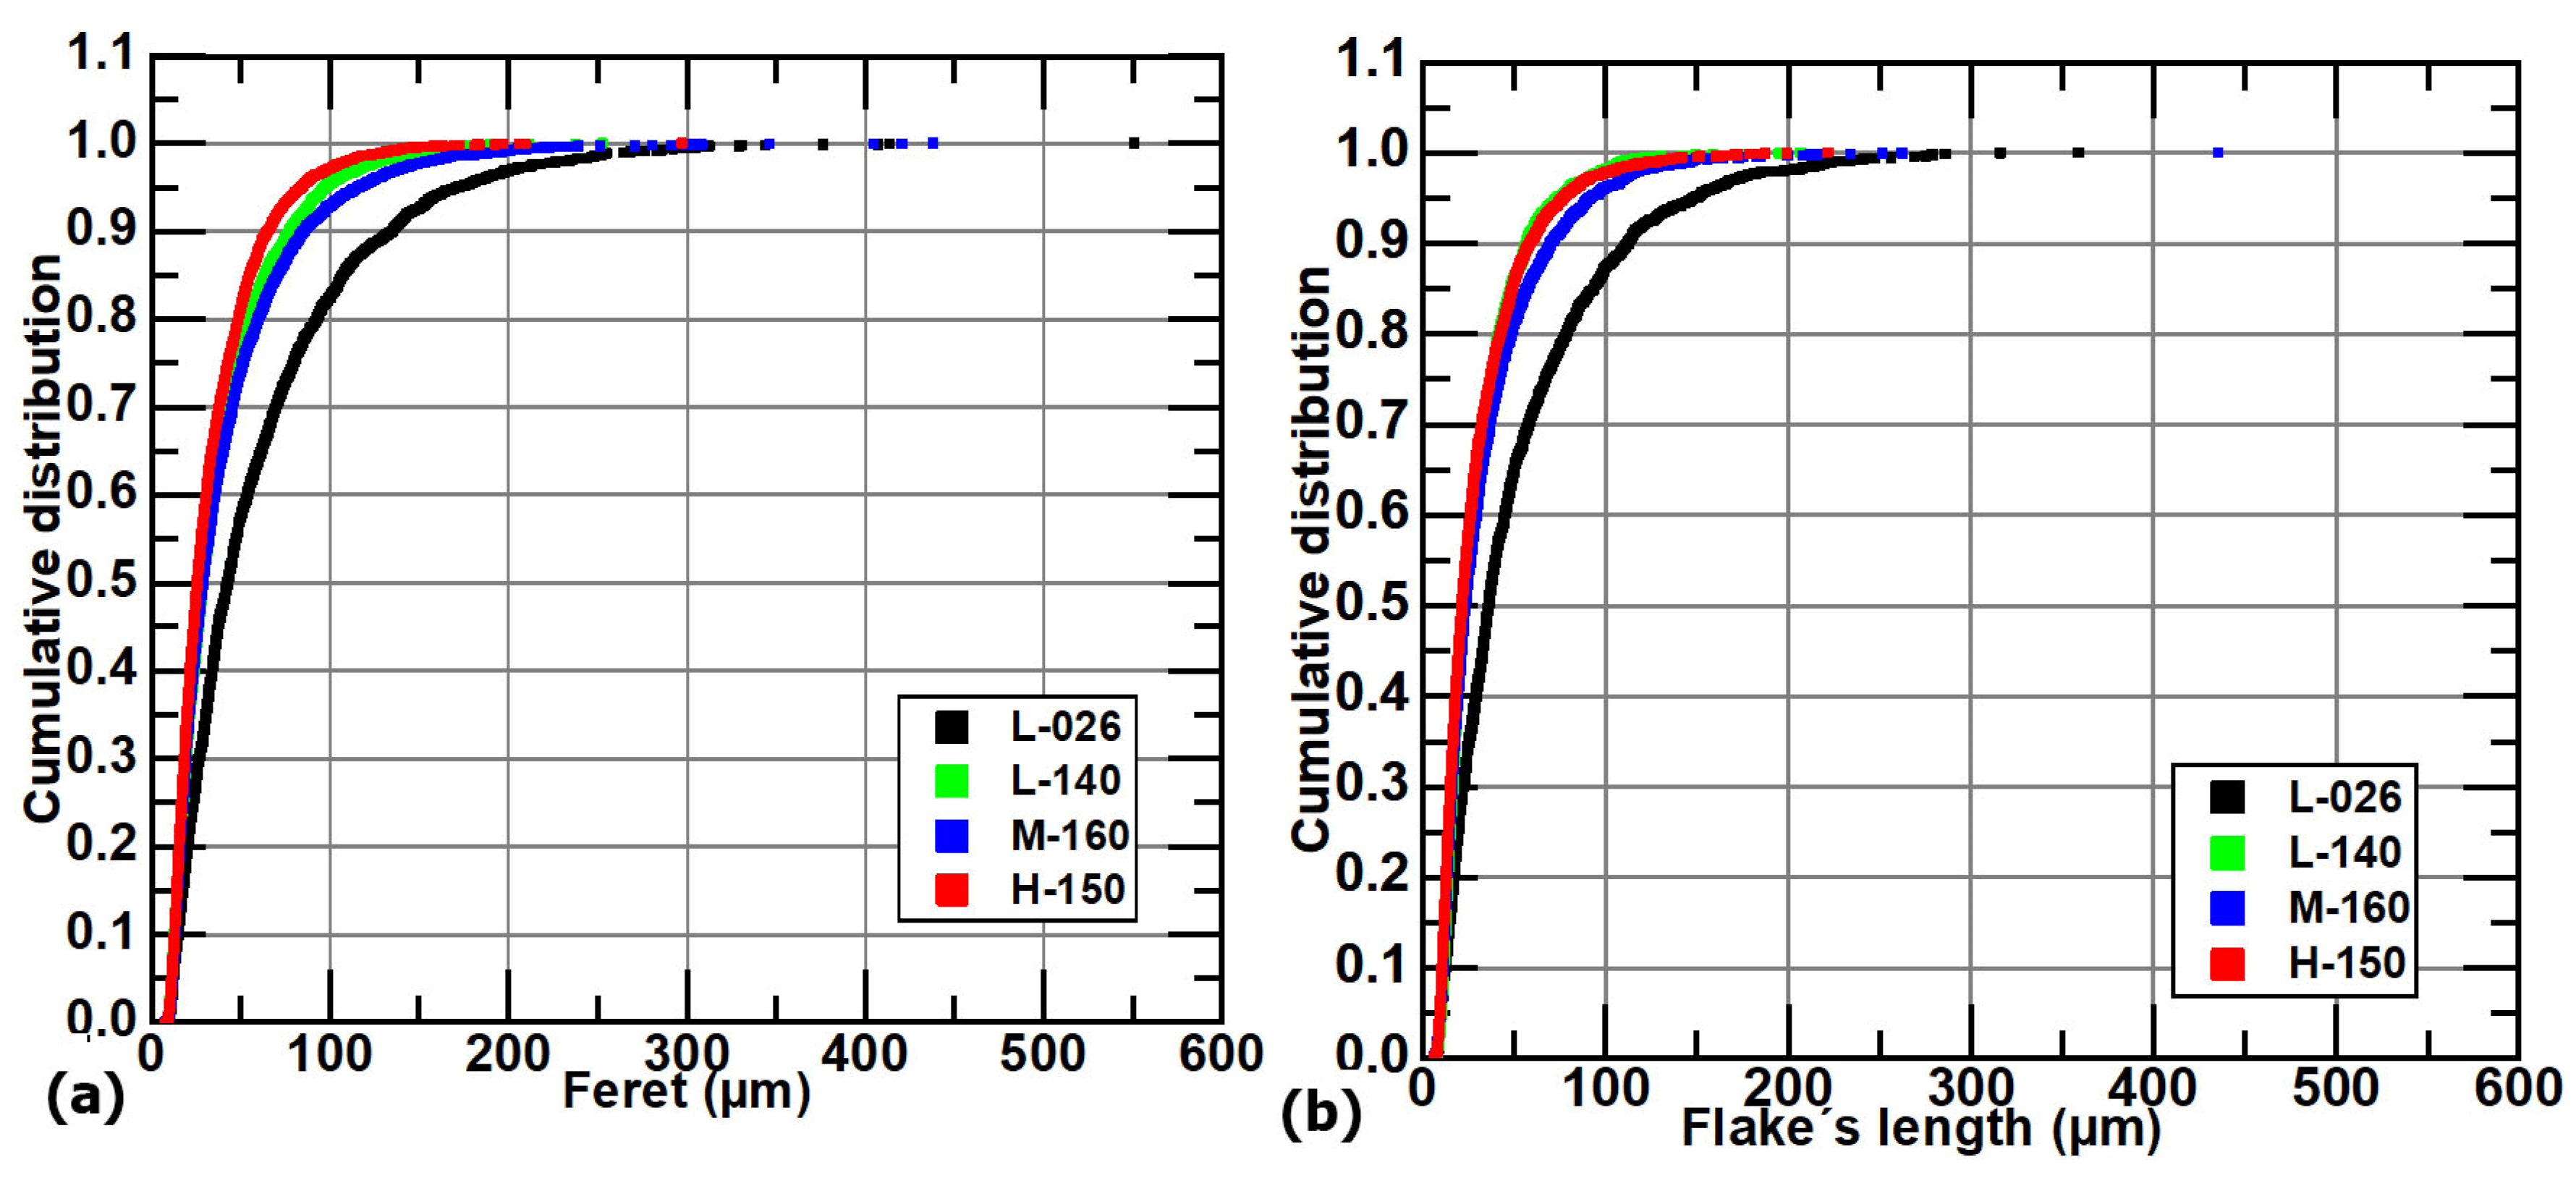
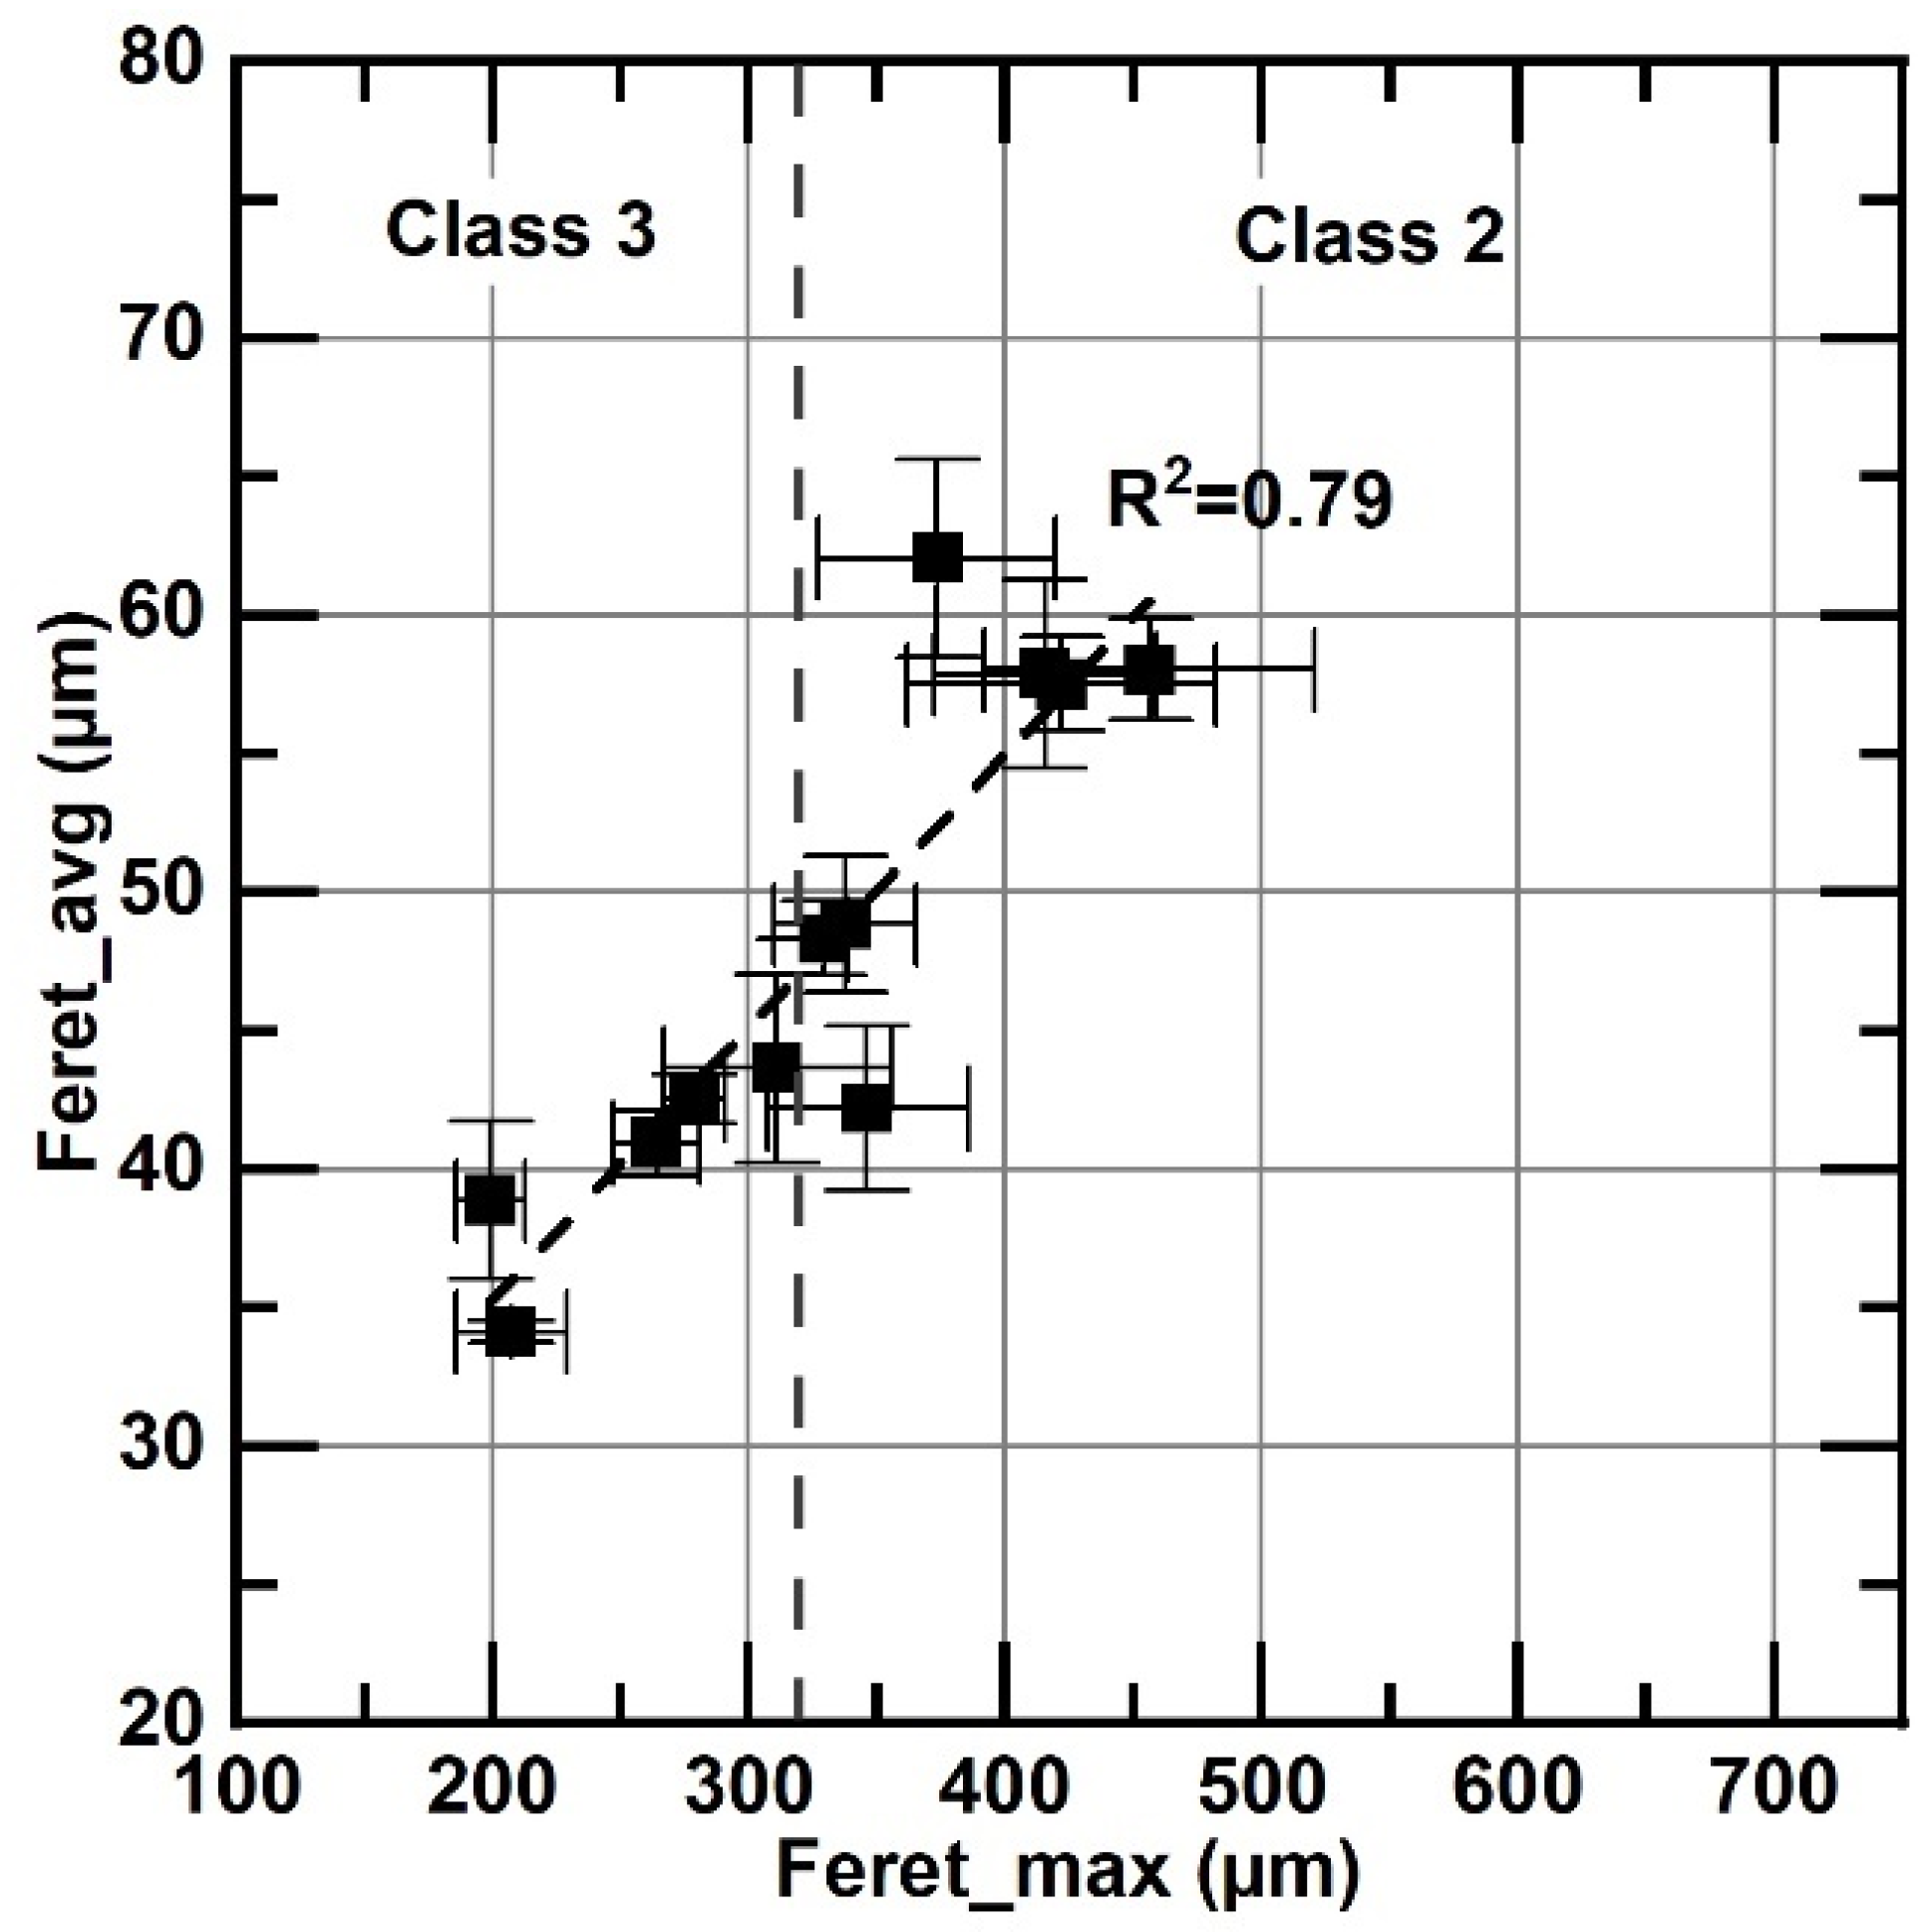
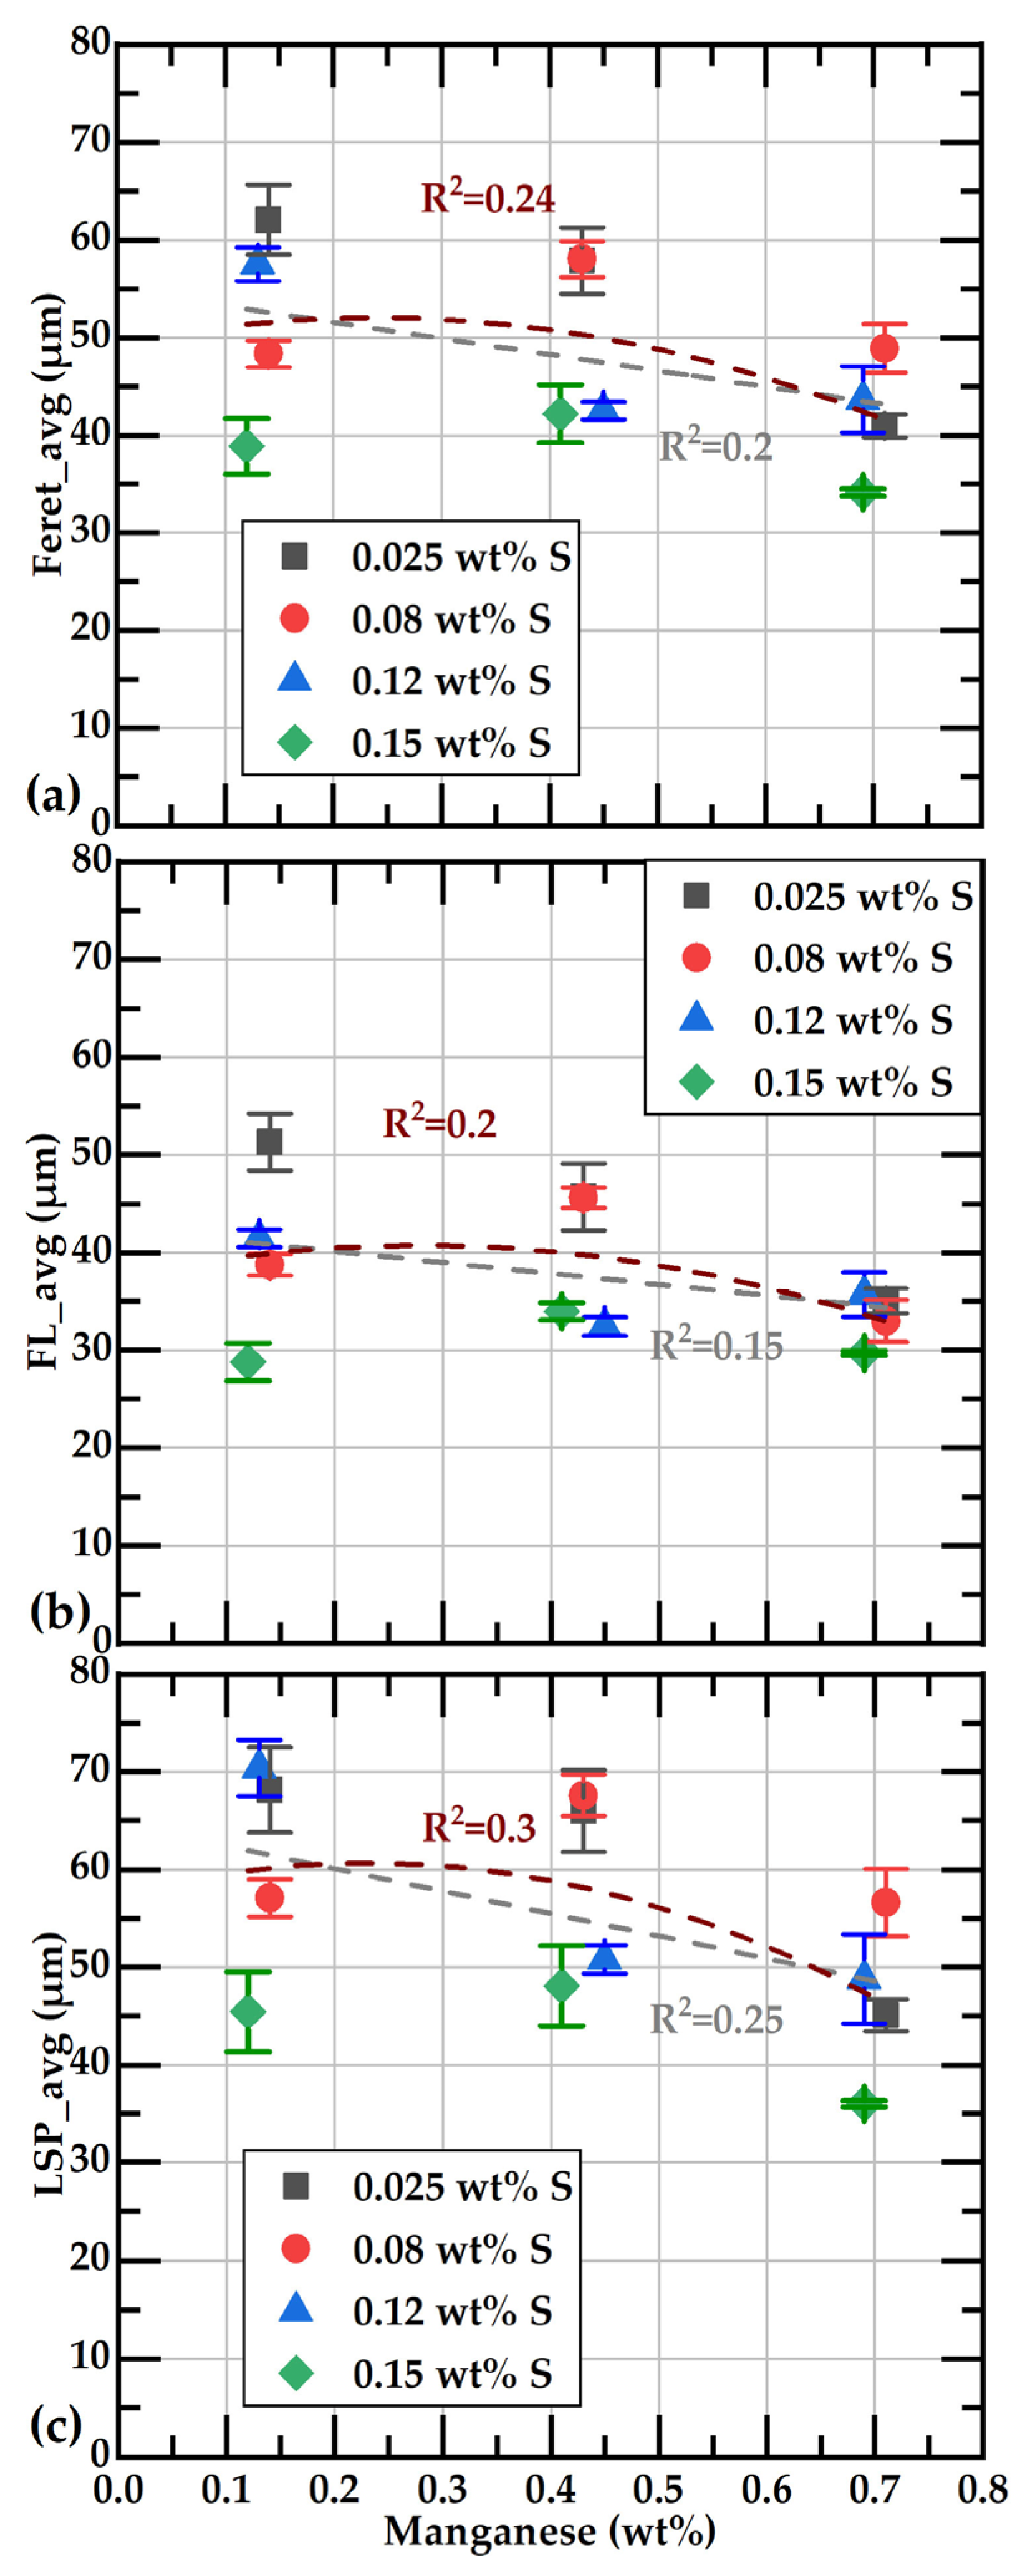
- It was found that the classification of flake size by class, based on Feret_max, according to ASTM A247-19 [30], implies a loss of important information about the effect of Mn and S on the length of graphite flakes. Samples of the same size class could have a noticeable difference in the flake’s length; for example, samples L-026 and M-160 show very different Feret_avg values, 62 and 42 μm, but both are class two. The frequency histograms and the cumulative distribution of Feret values show that average Feret values are better descriptors of the whole distribution of the flake’s size.
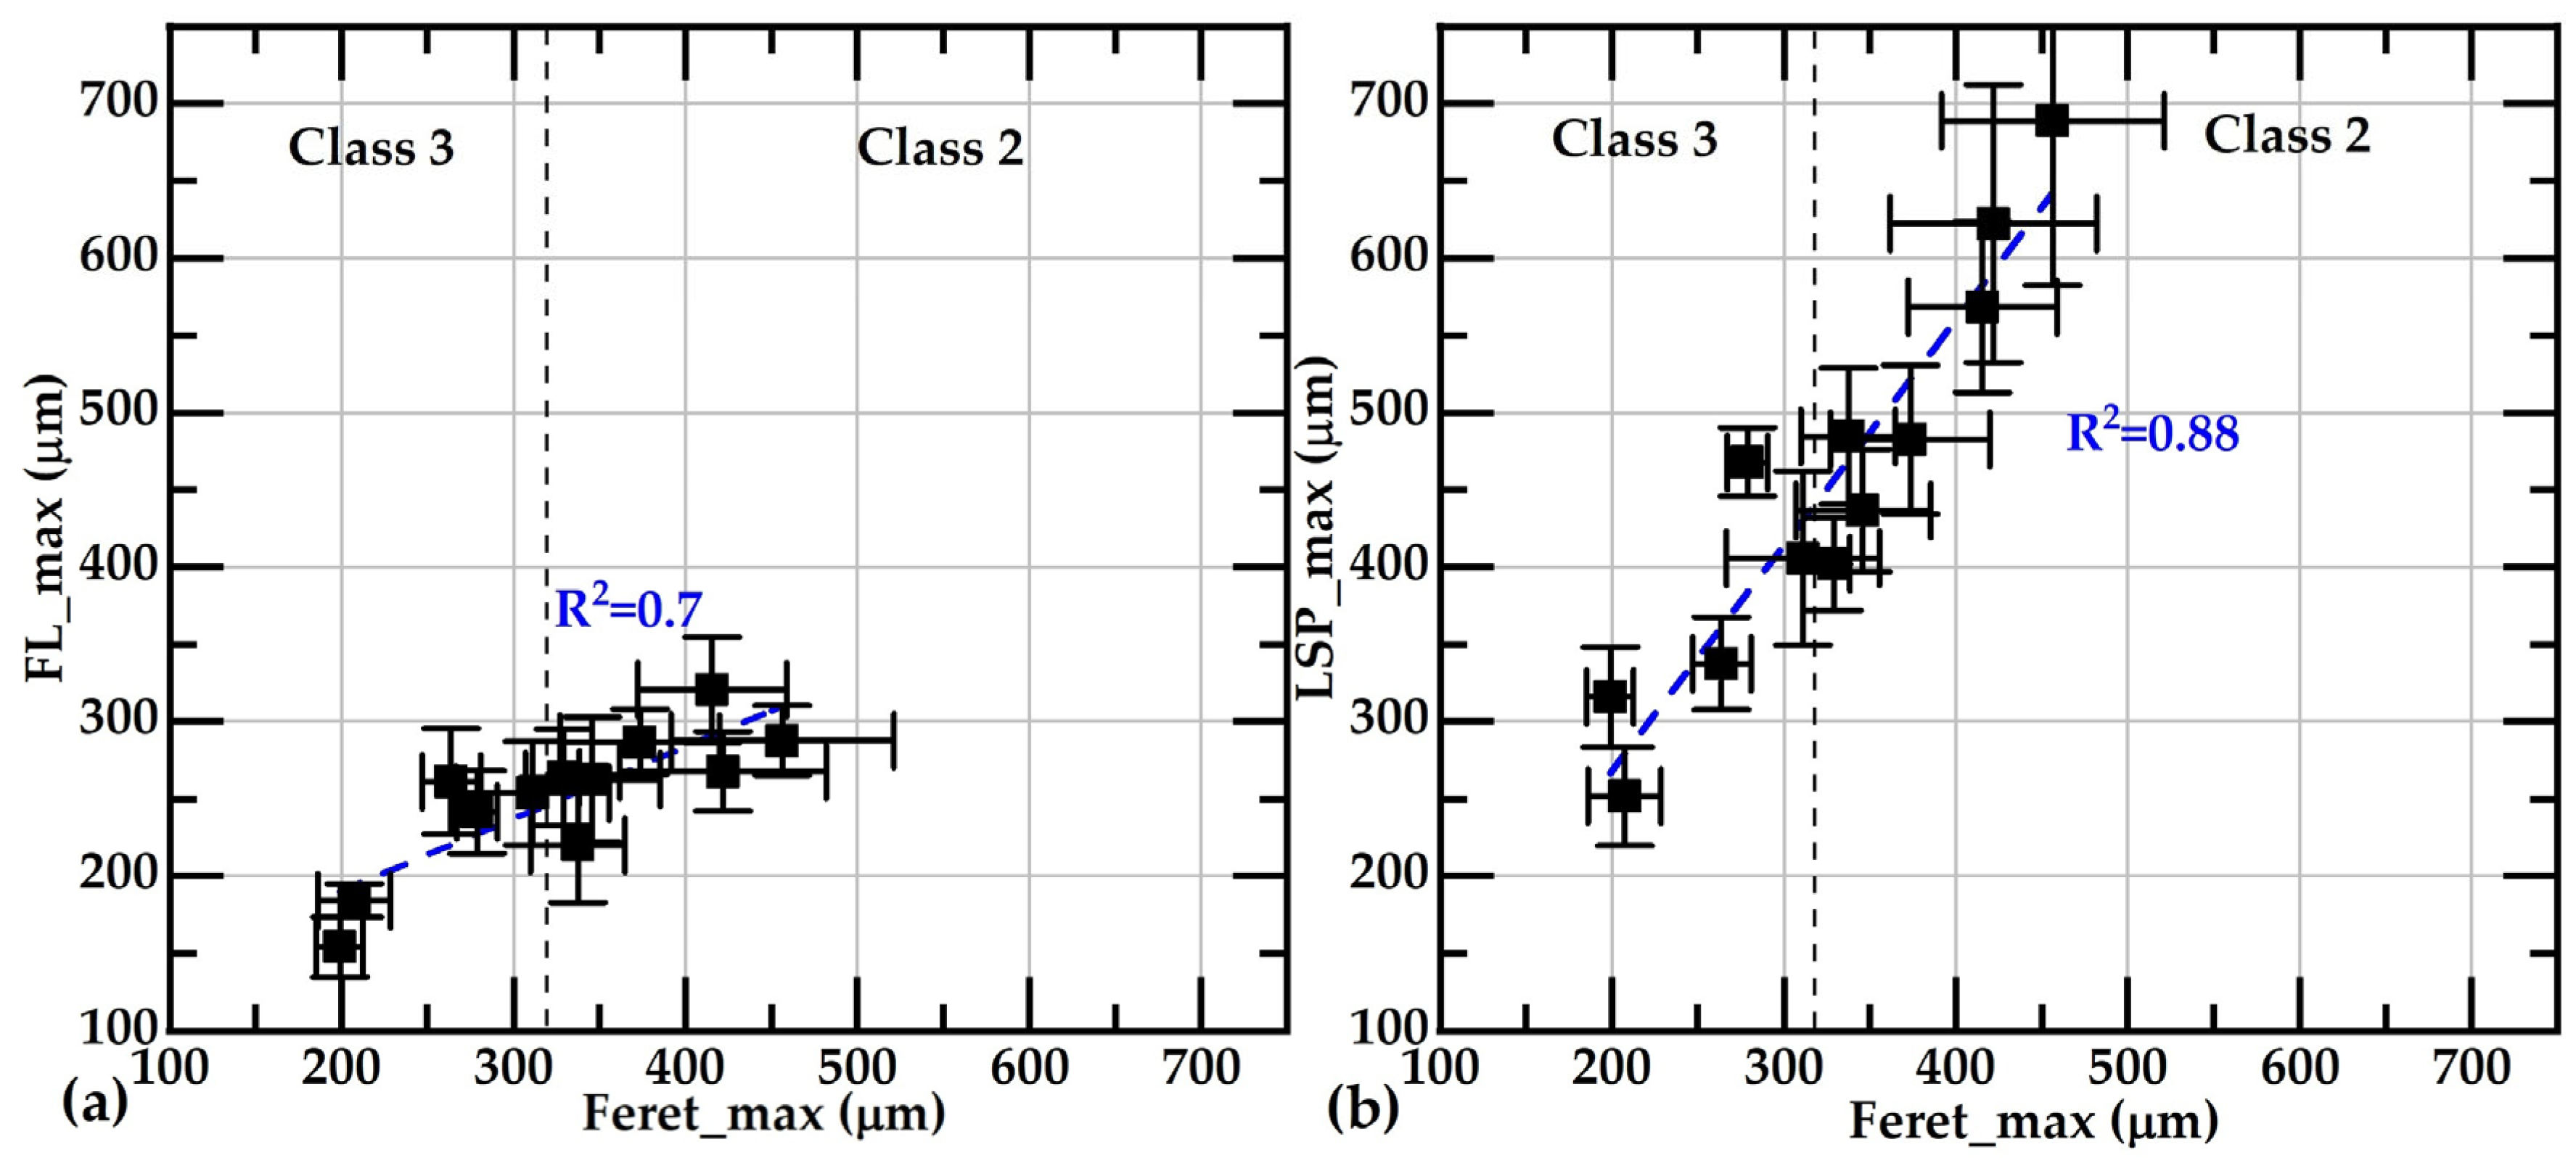
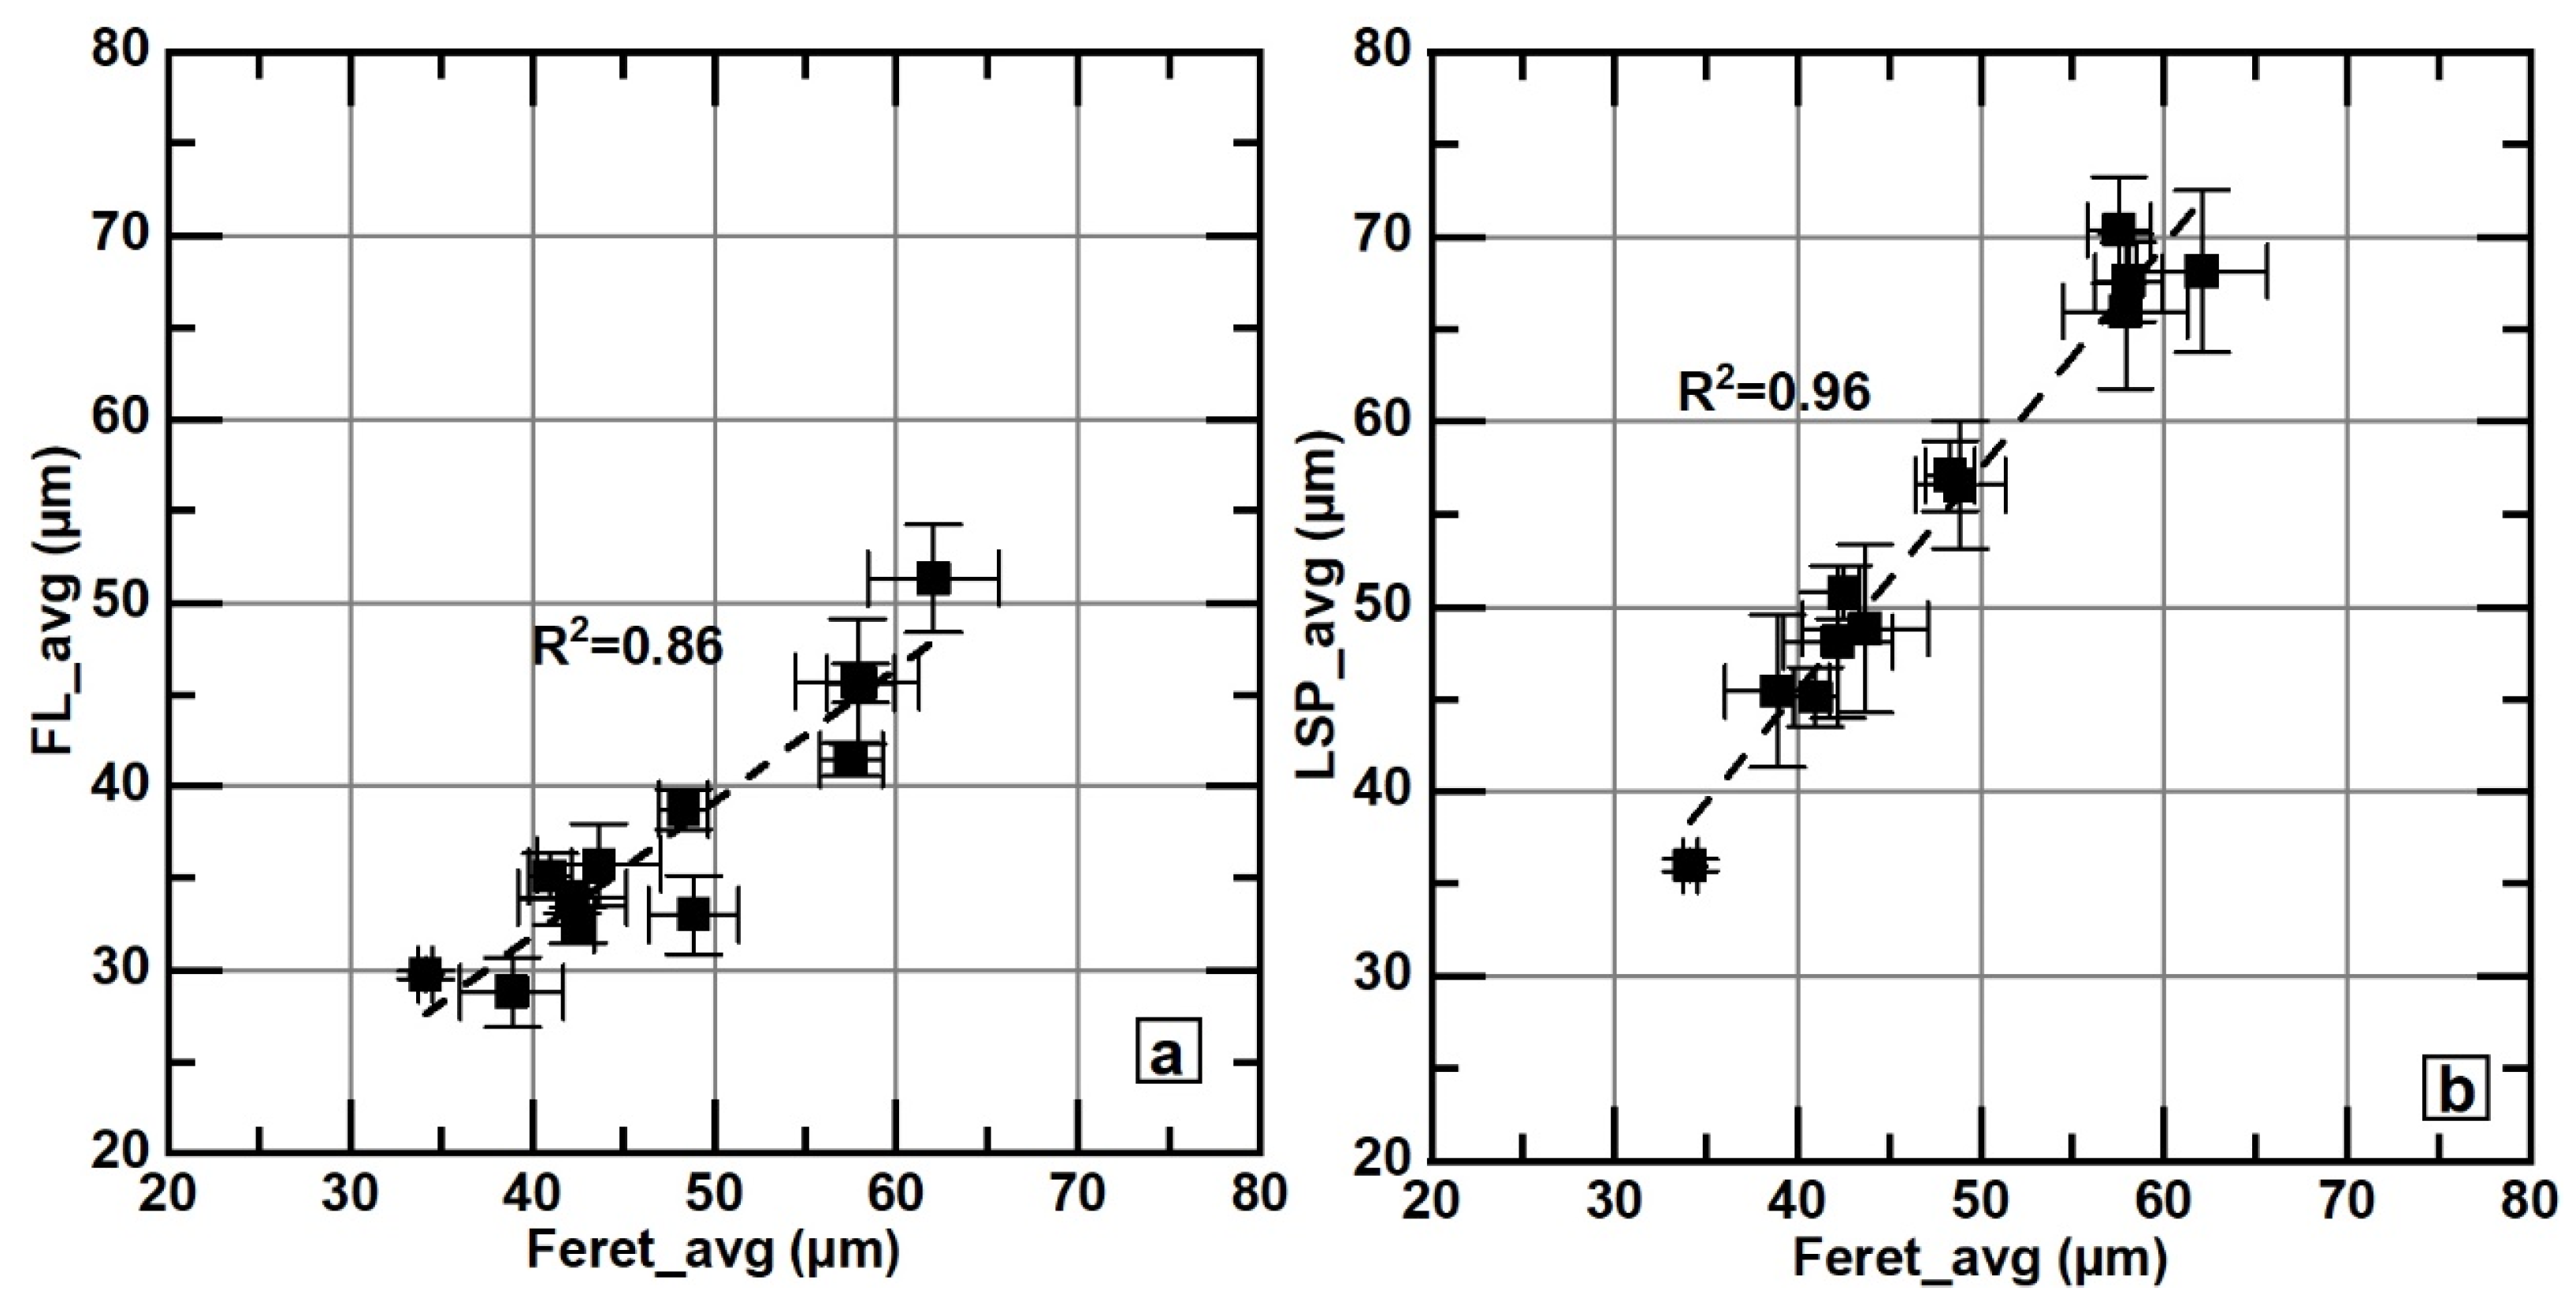
- These results also show that for flake size comparison between samples, all parameters tested here, Feret_avg, Feret_max, FL_max, FL_avg, LSP_avg and LSP_max, are equivalent.
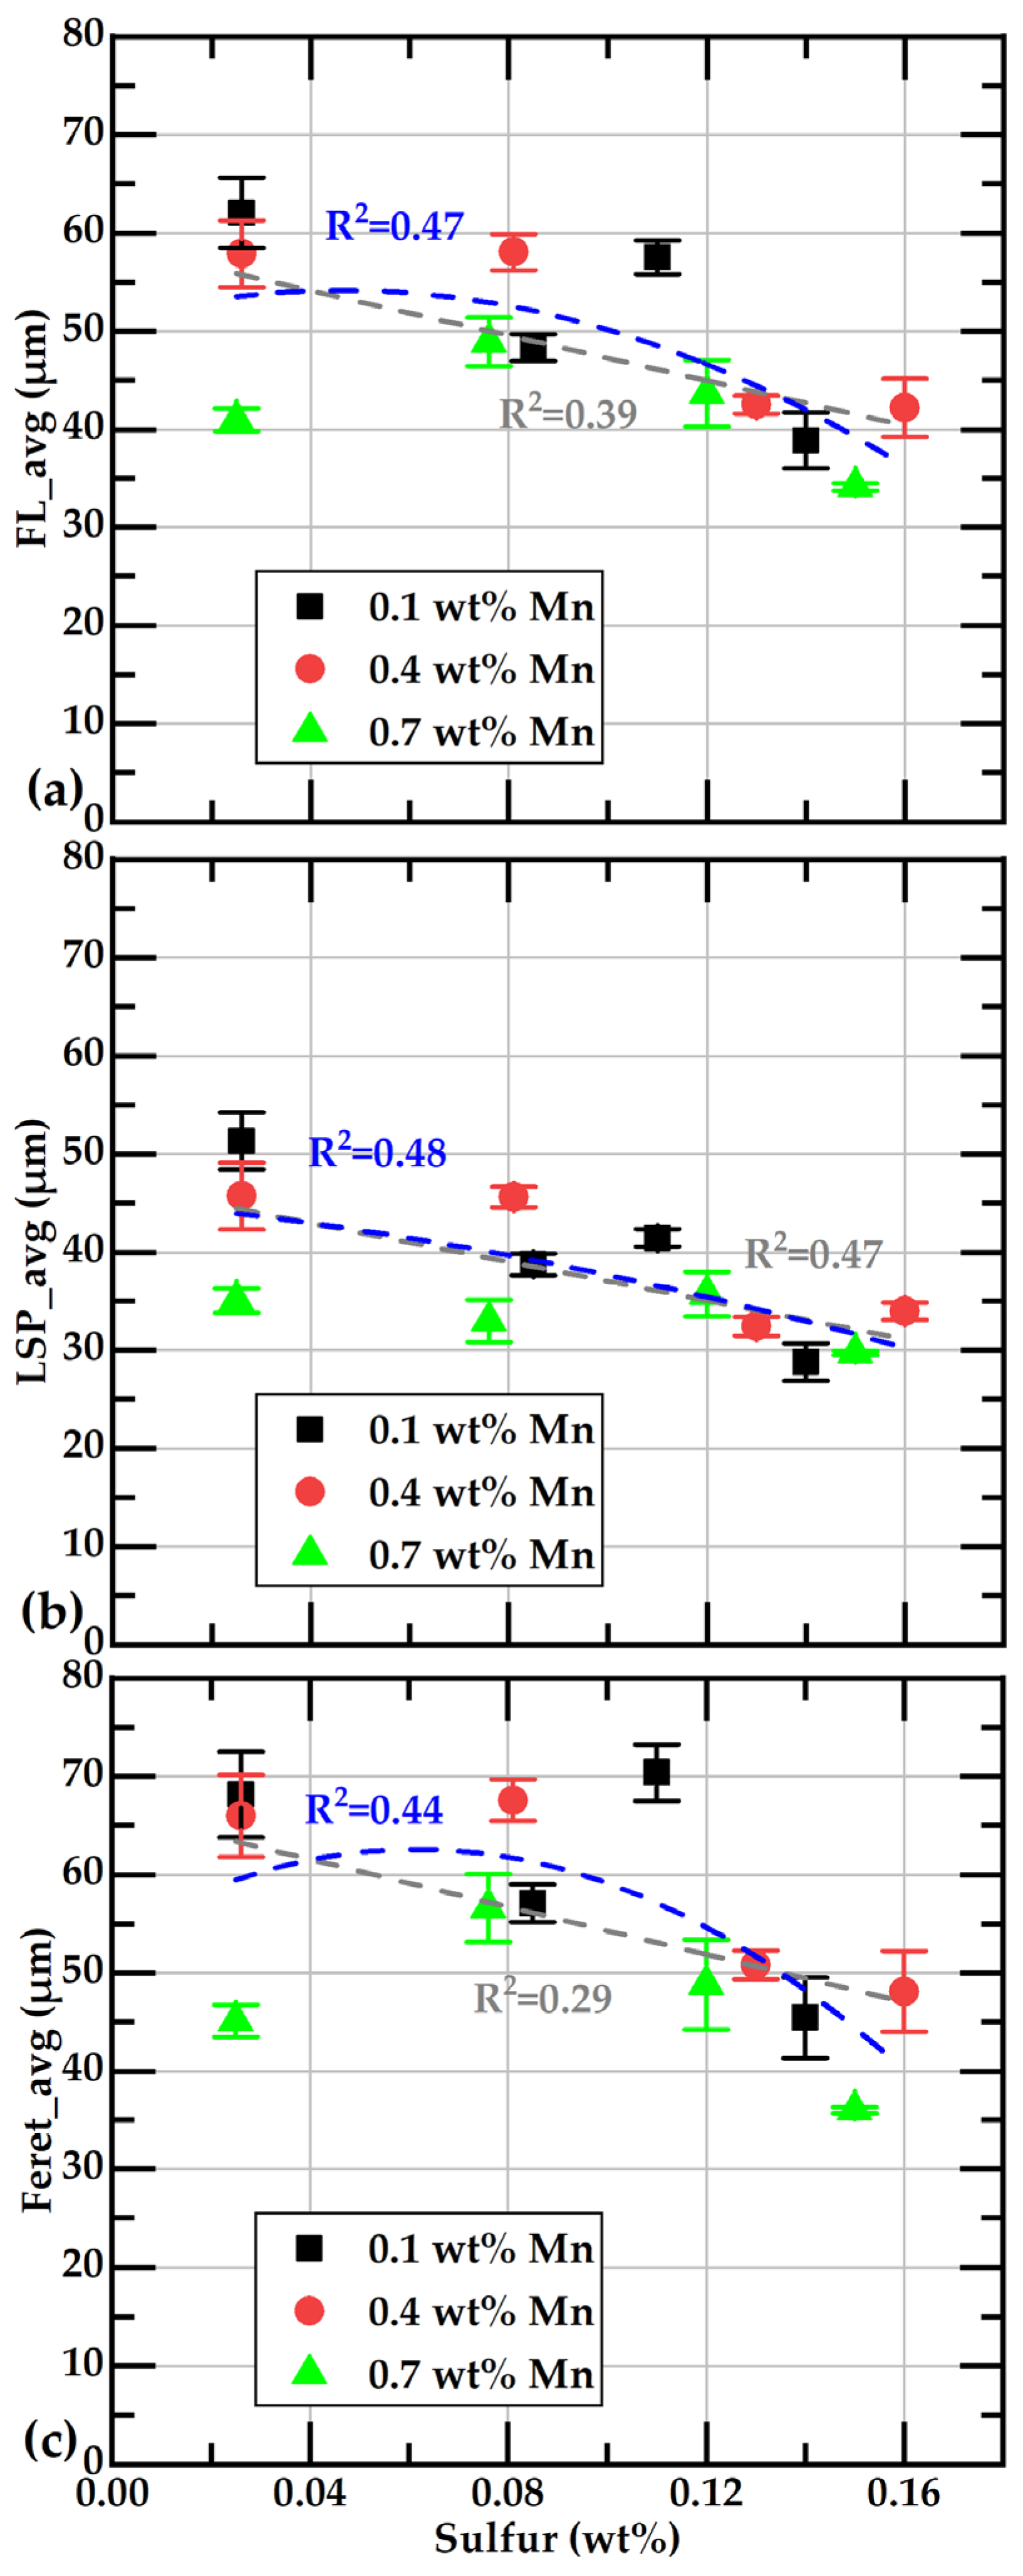
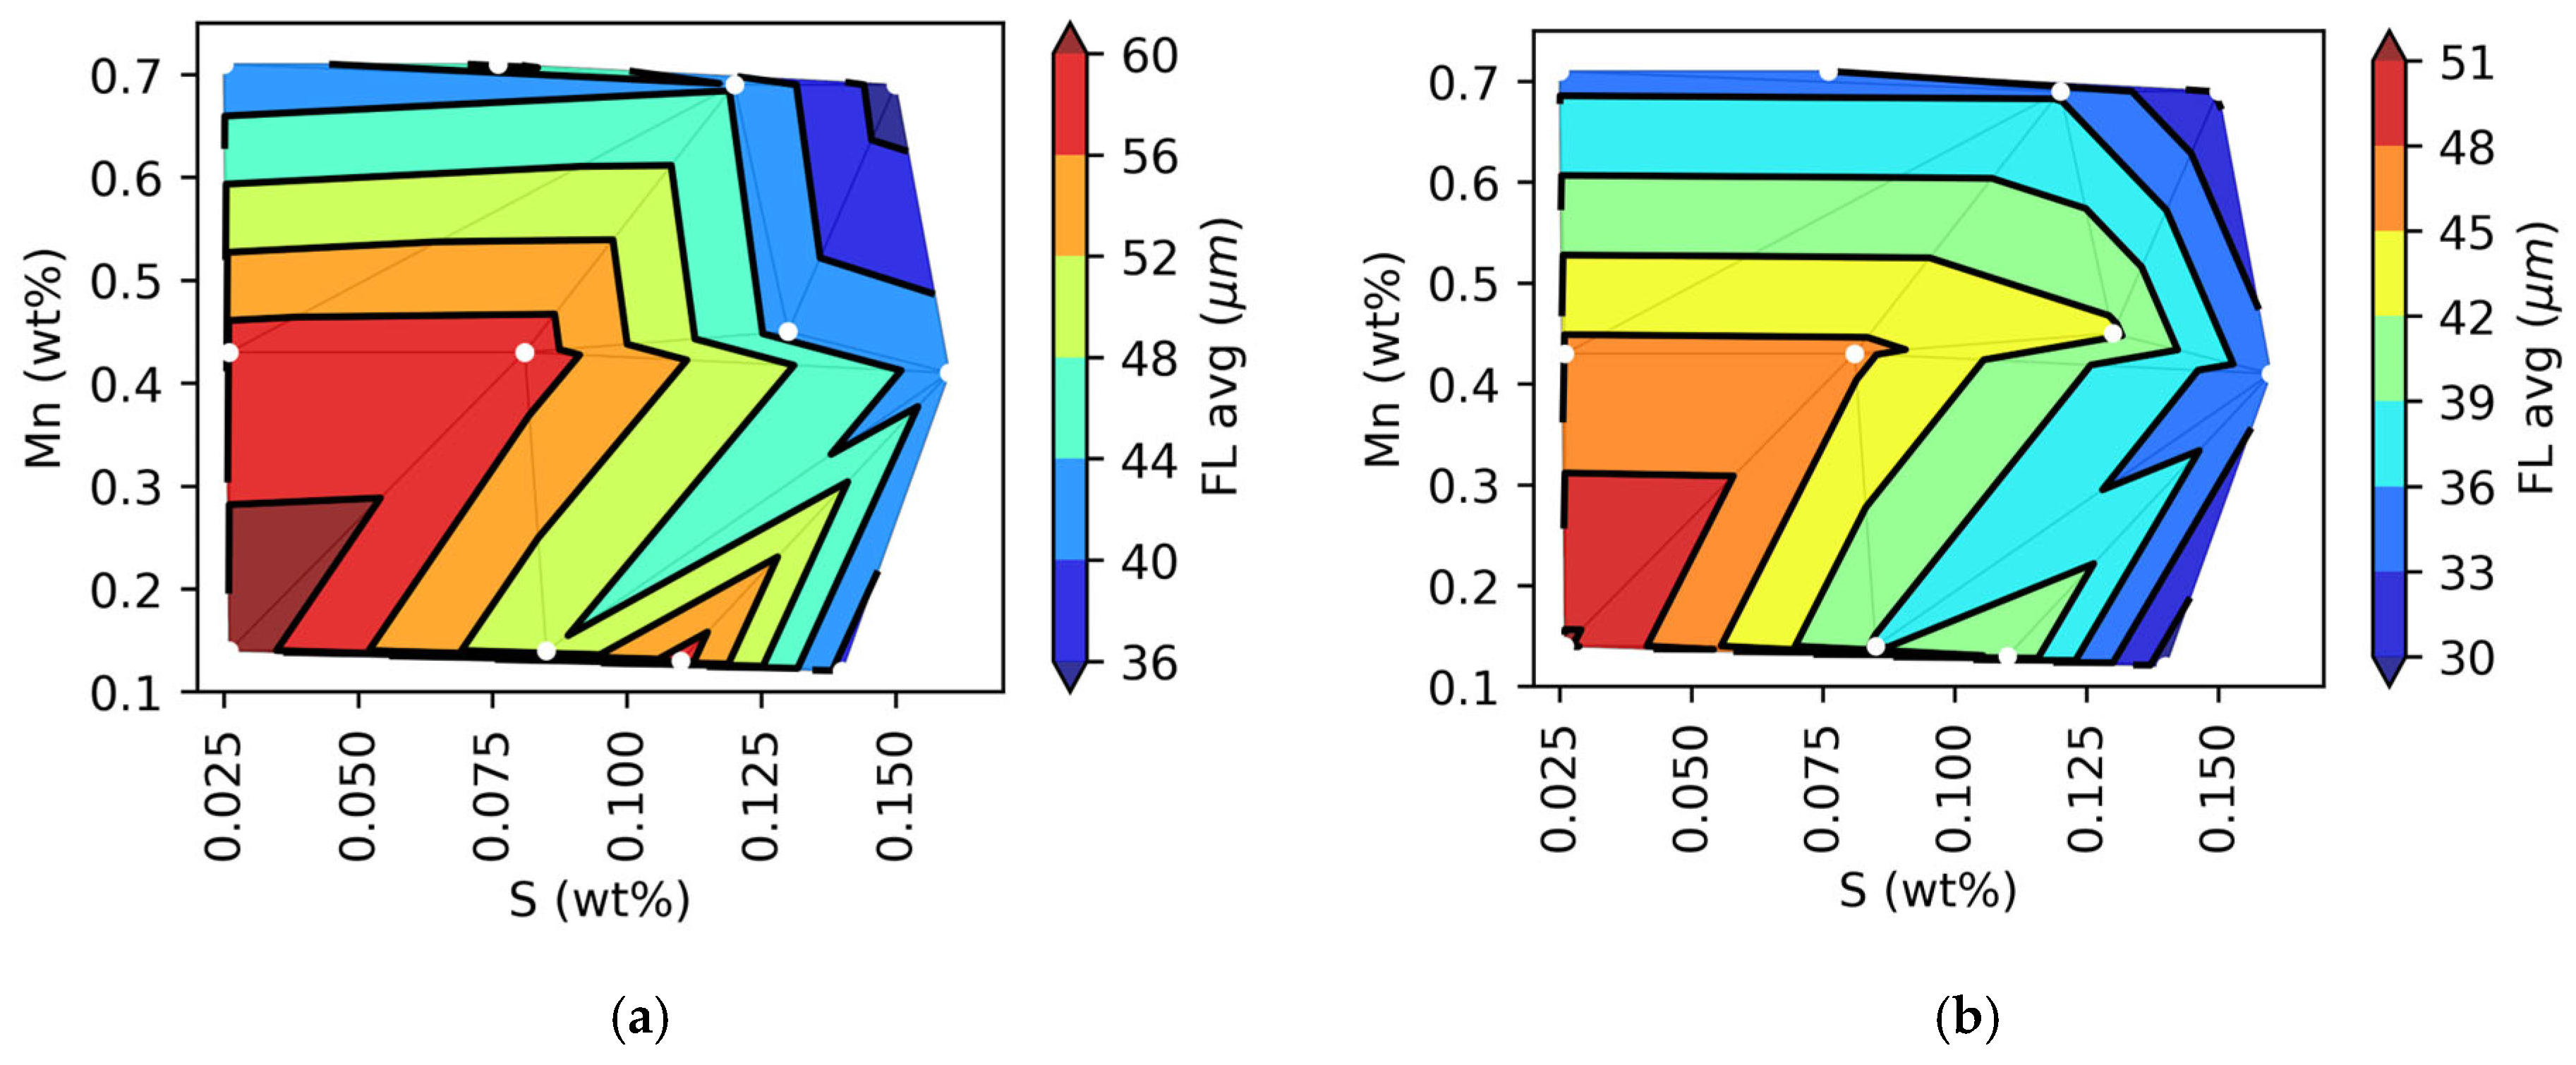
- The larger flake sizes were observed in the samples with the lower content in both S and Mn. The effect of Mn content on Feret_avg or FL_avg values is less significant in the samples with sulfur contents over 0.12 wt% than in samples under 0.12 wt%S. At the highest sulfur contents, the size of the graphite flakes is the smallest at all Mn concentrations.
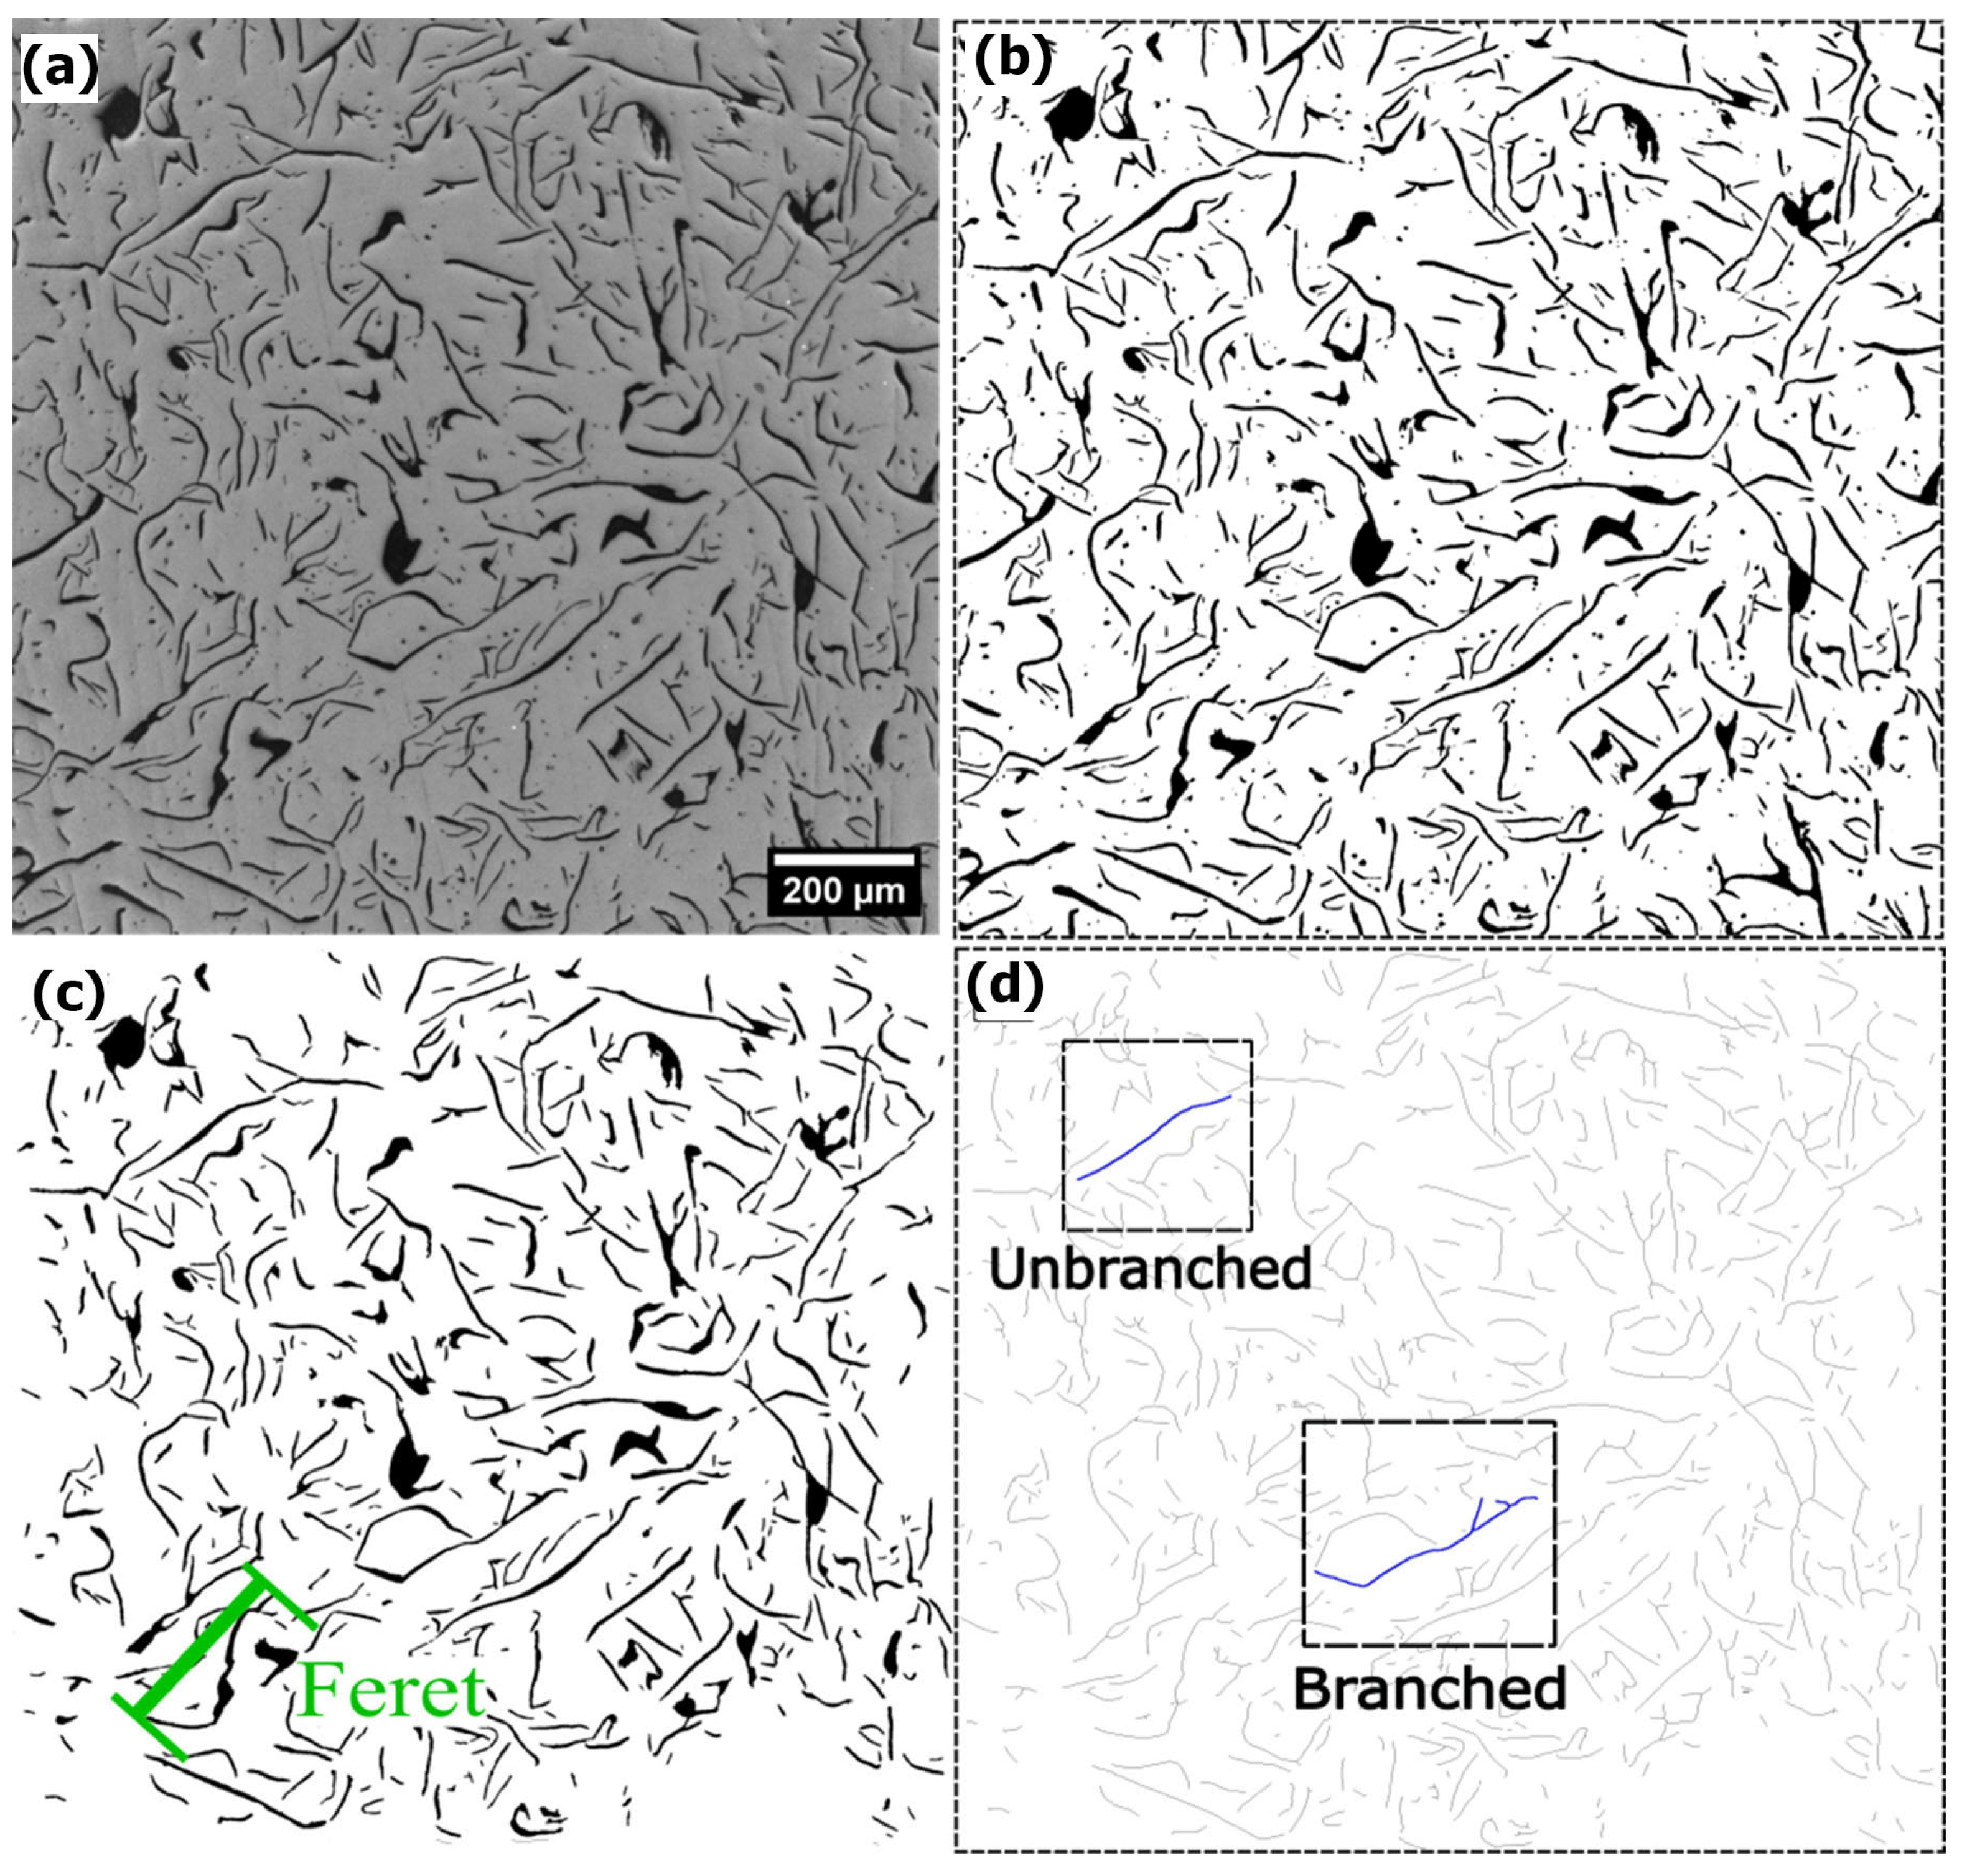
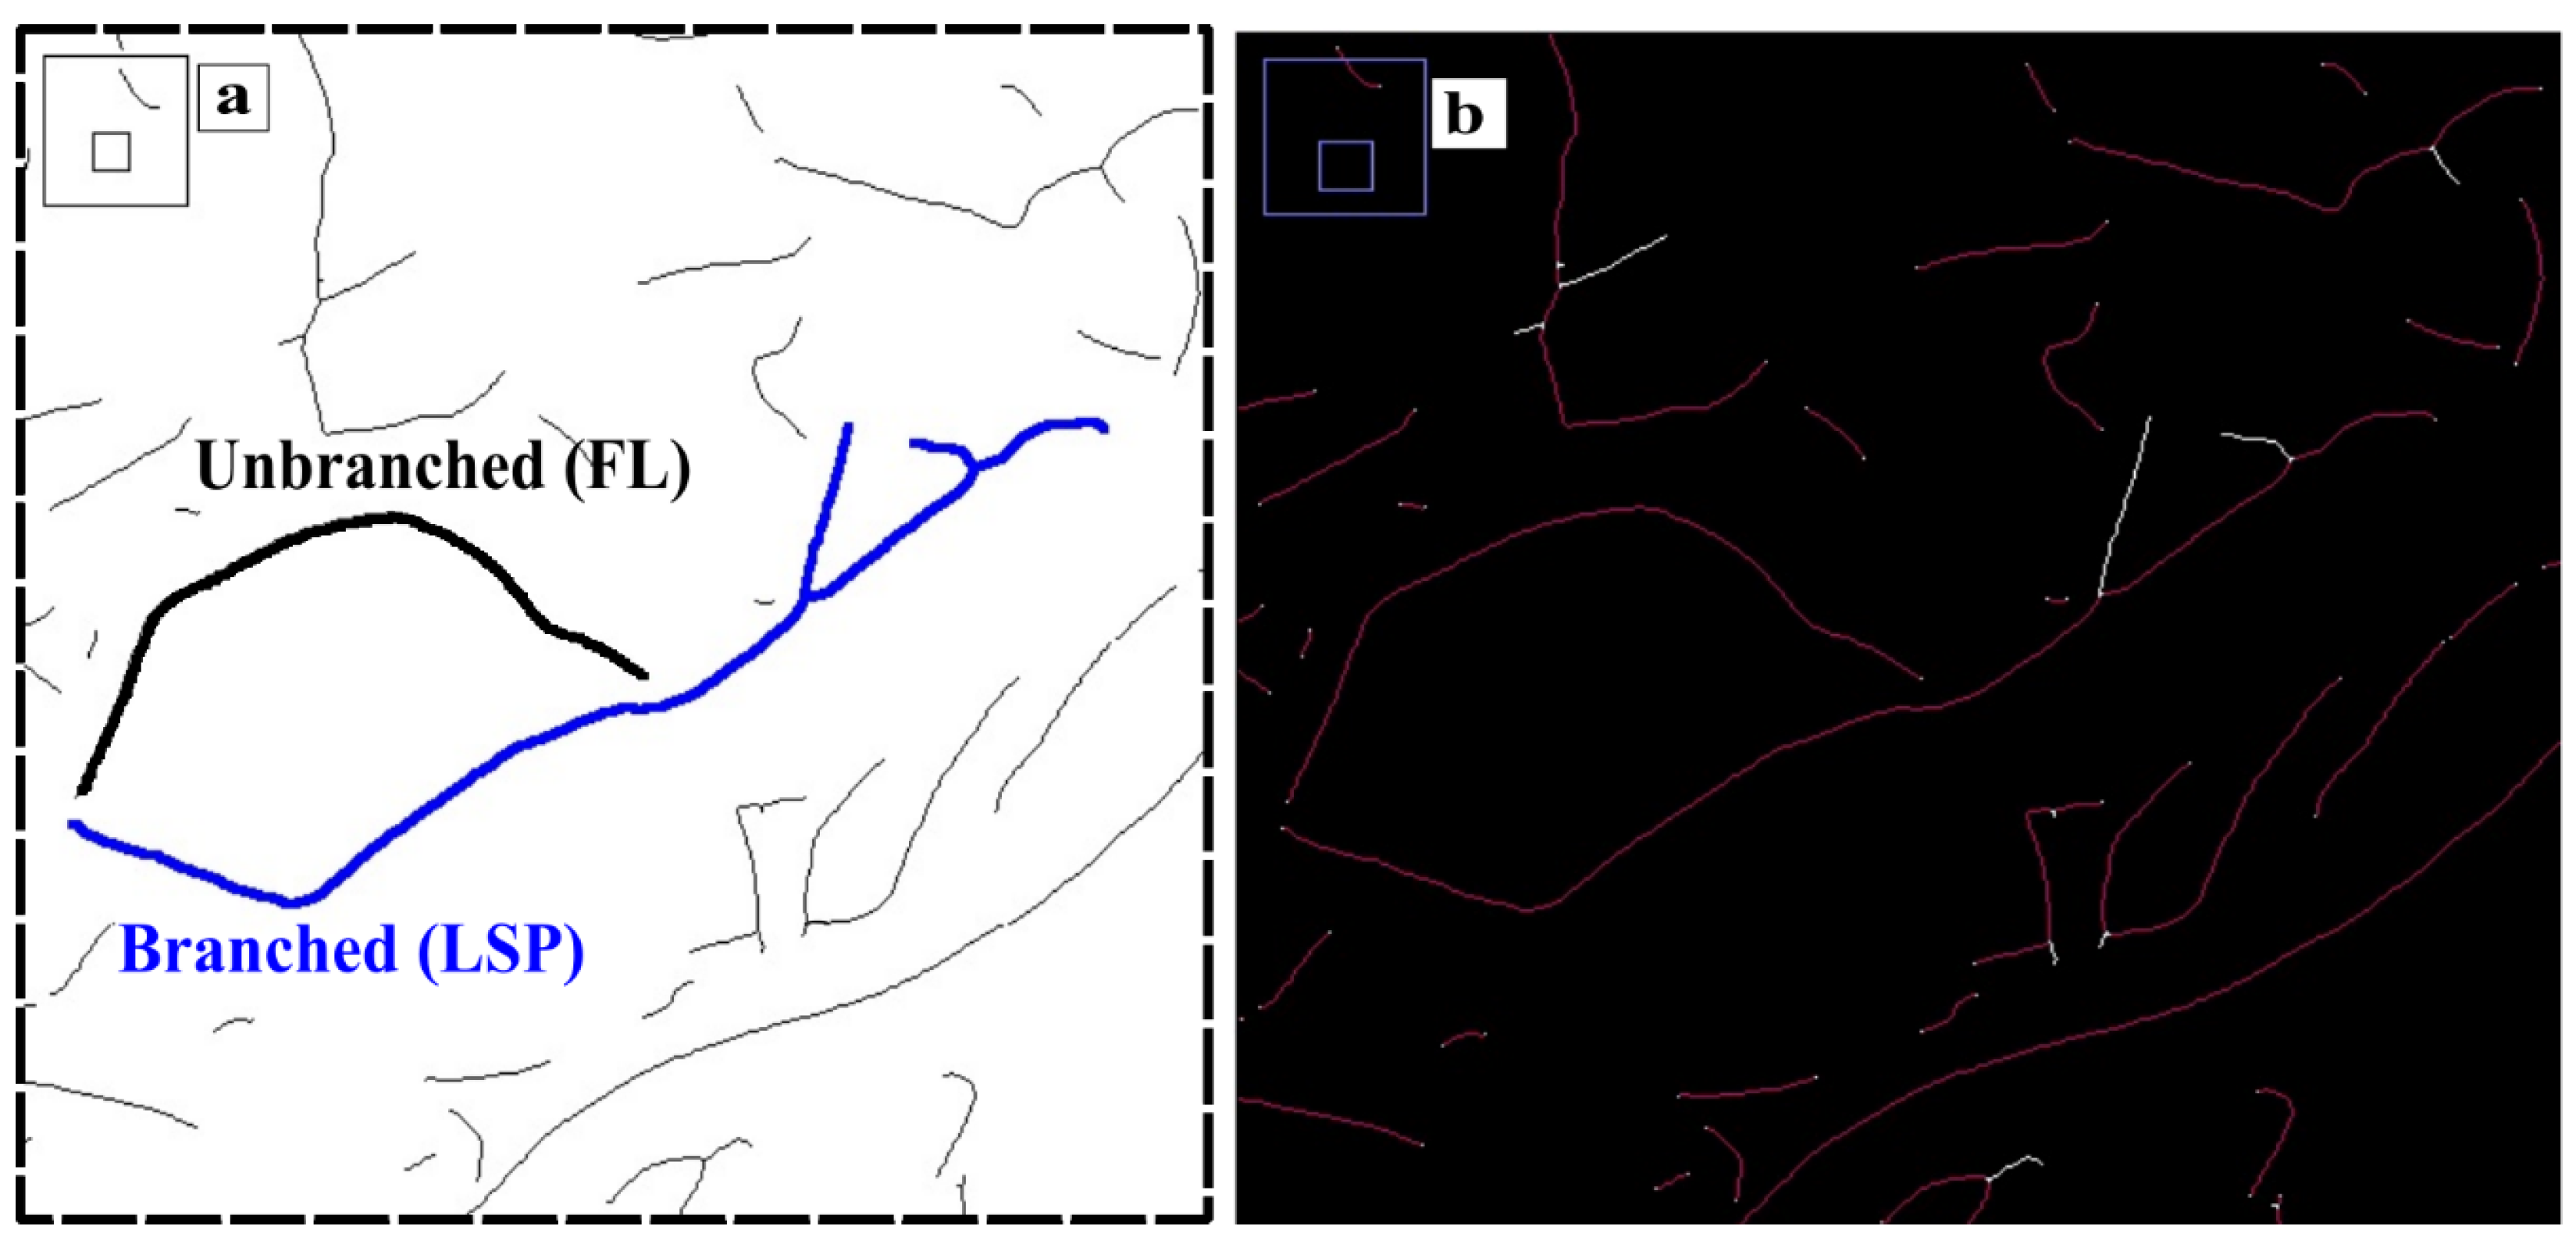
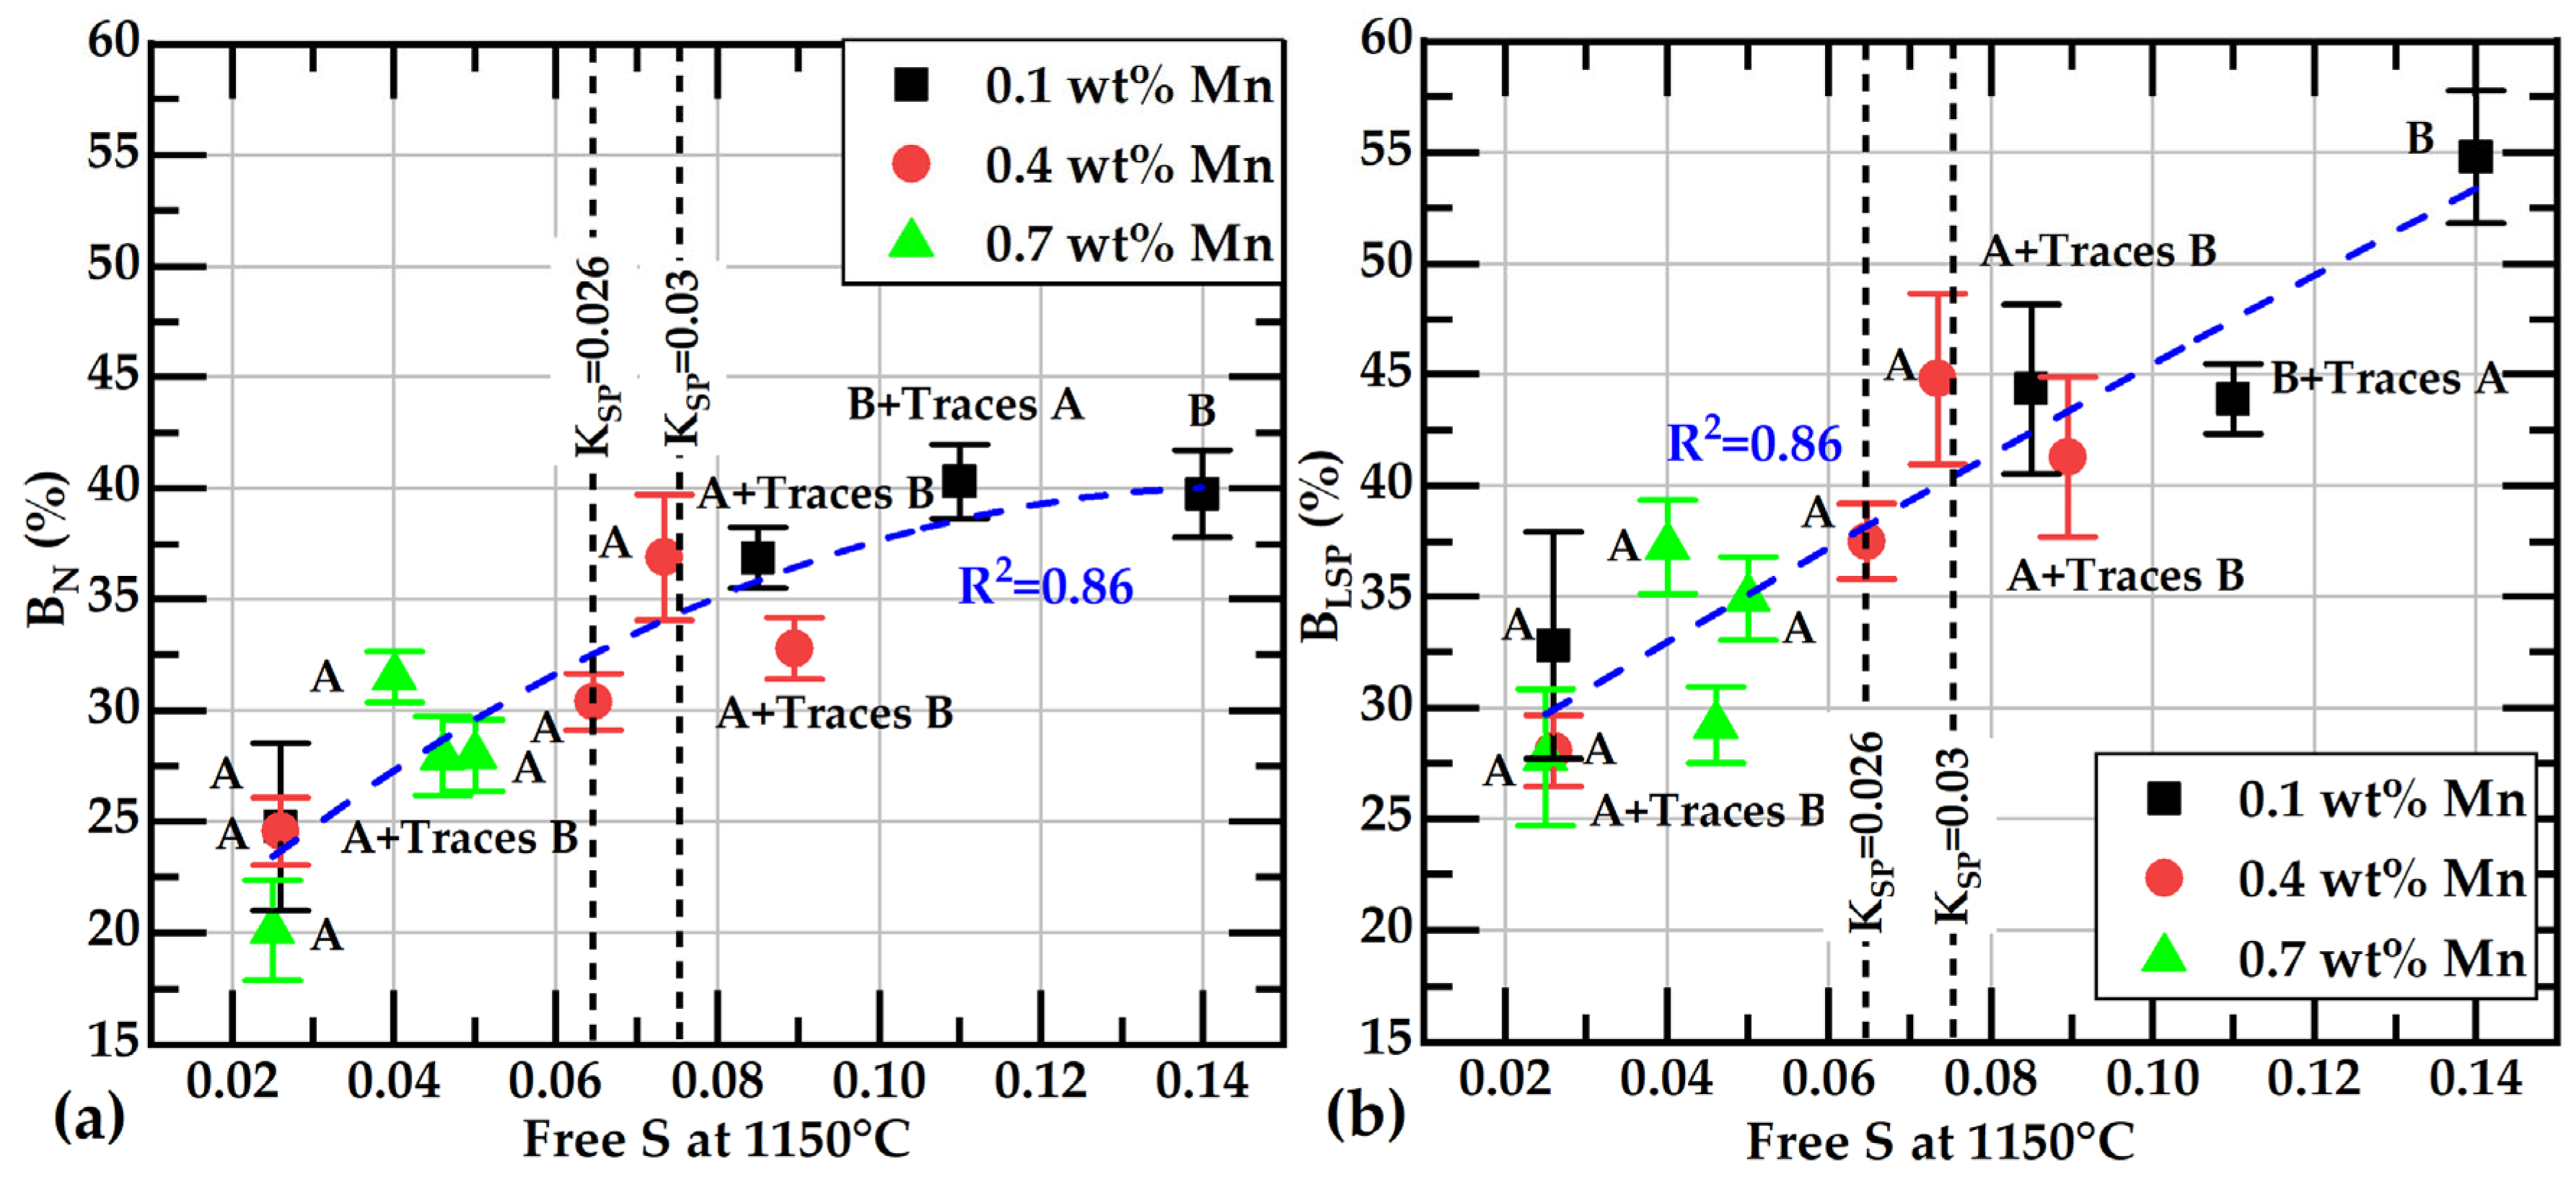
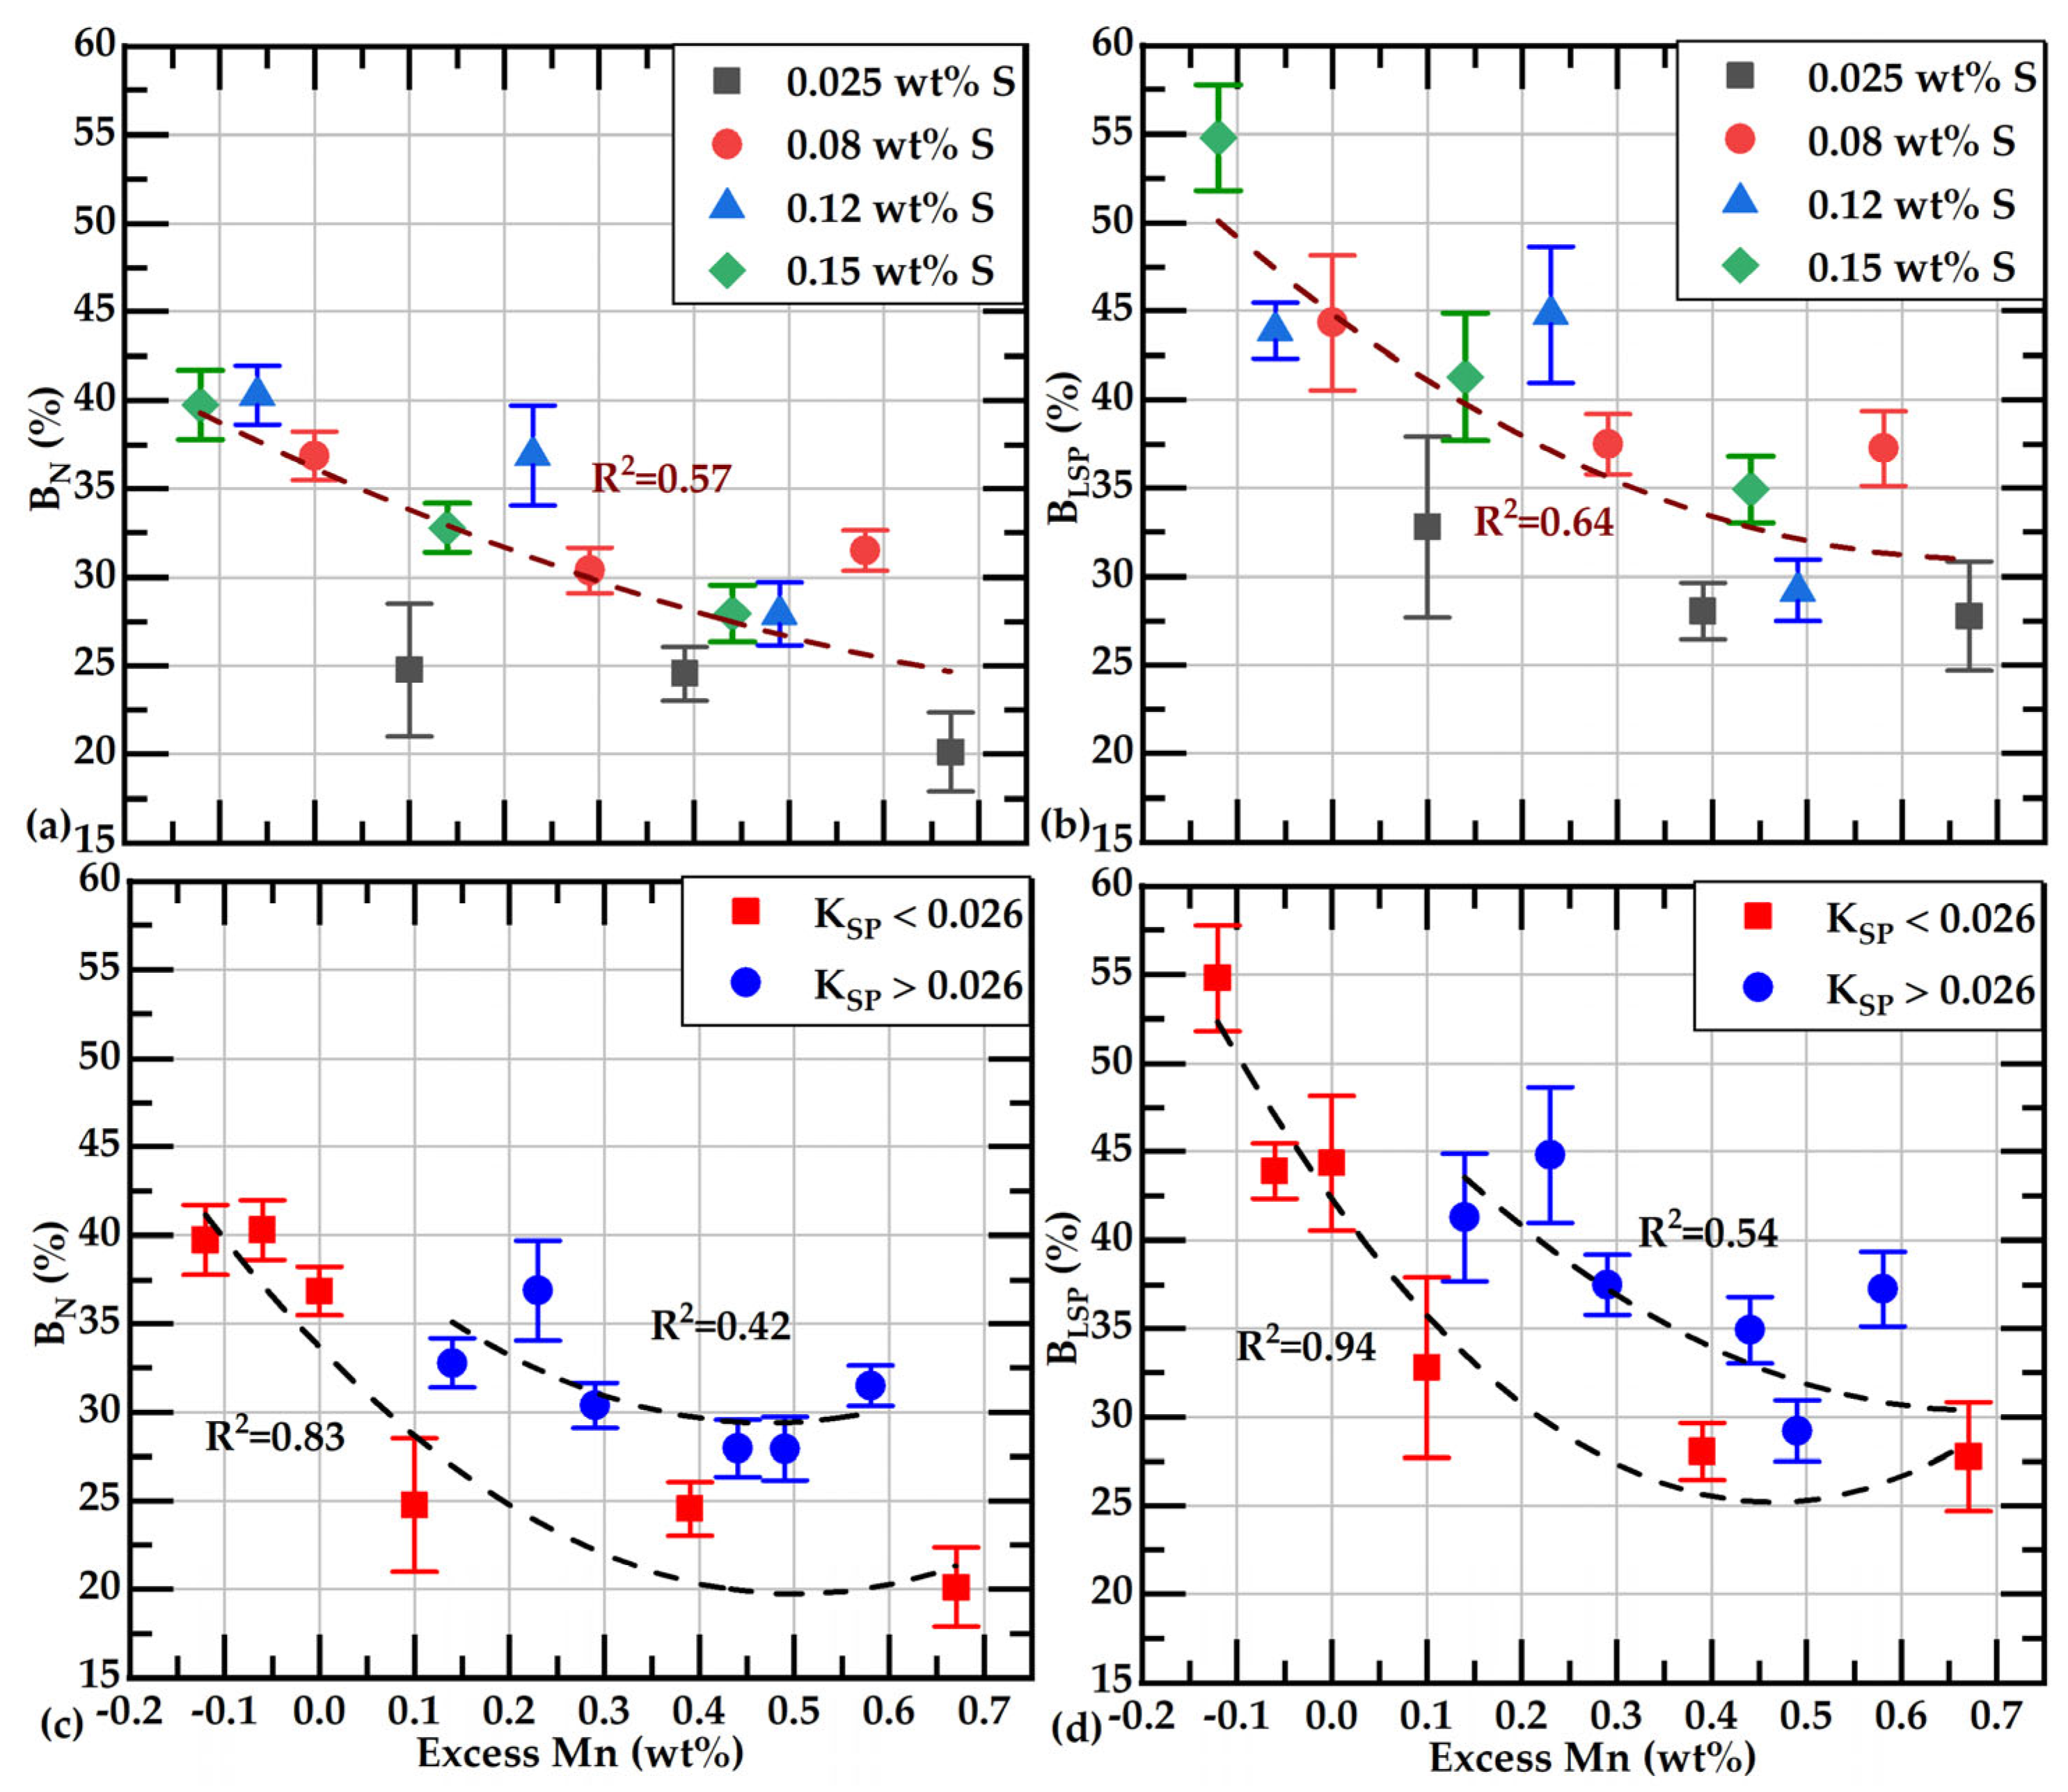
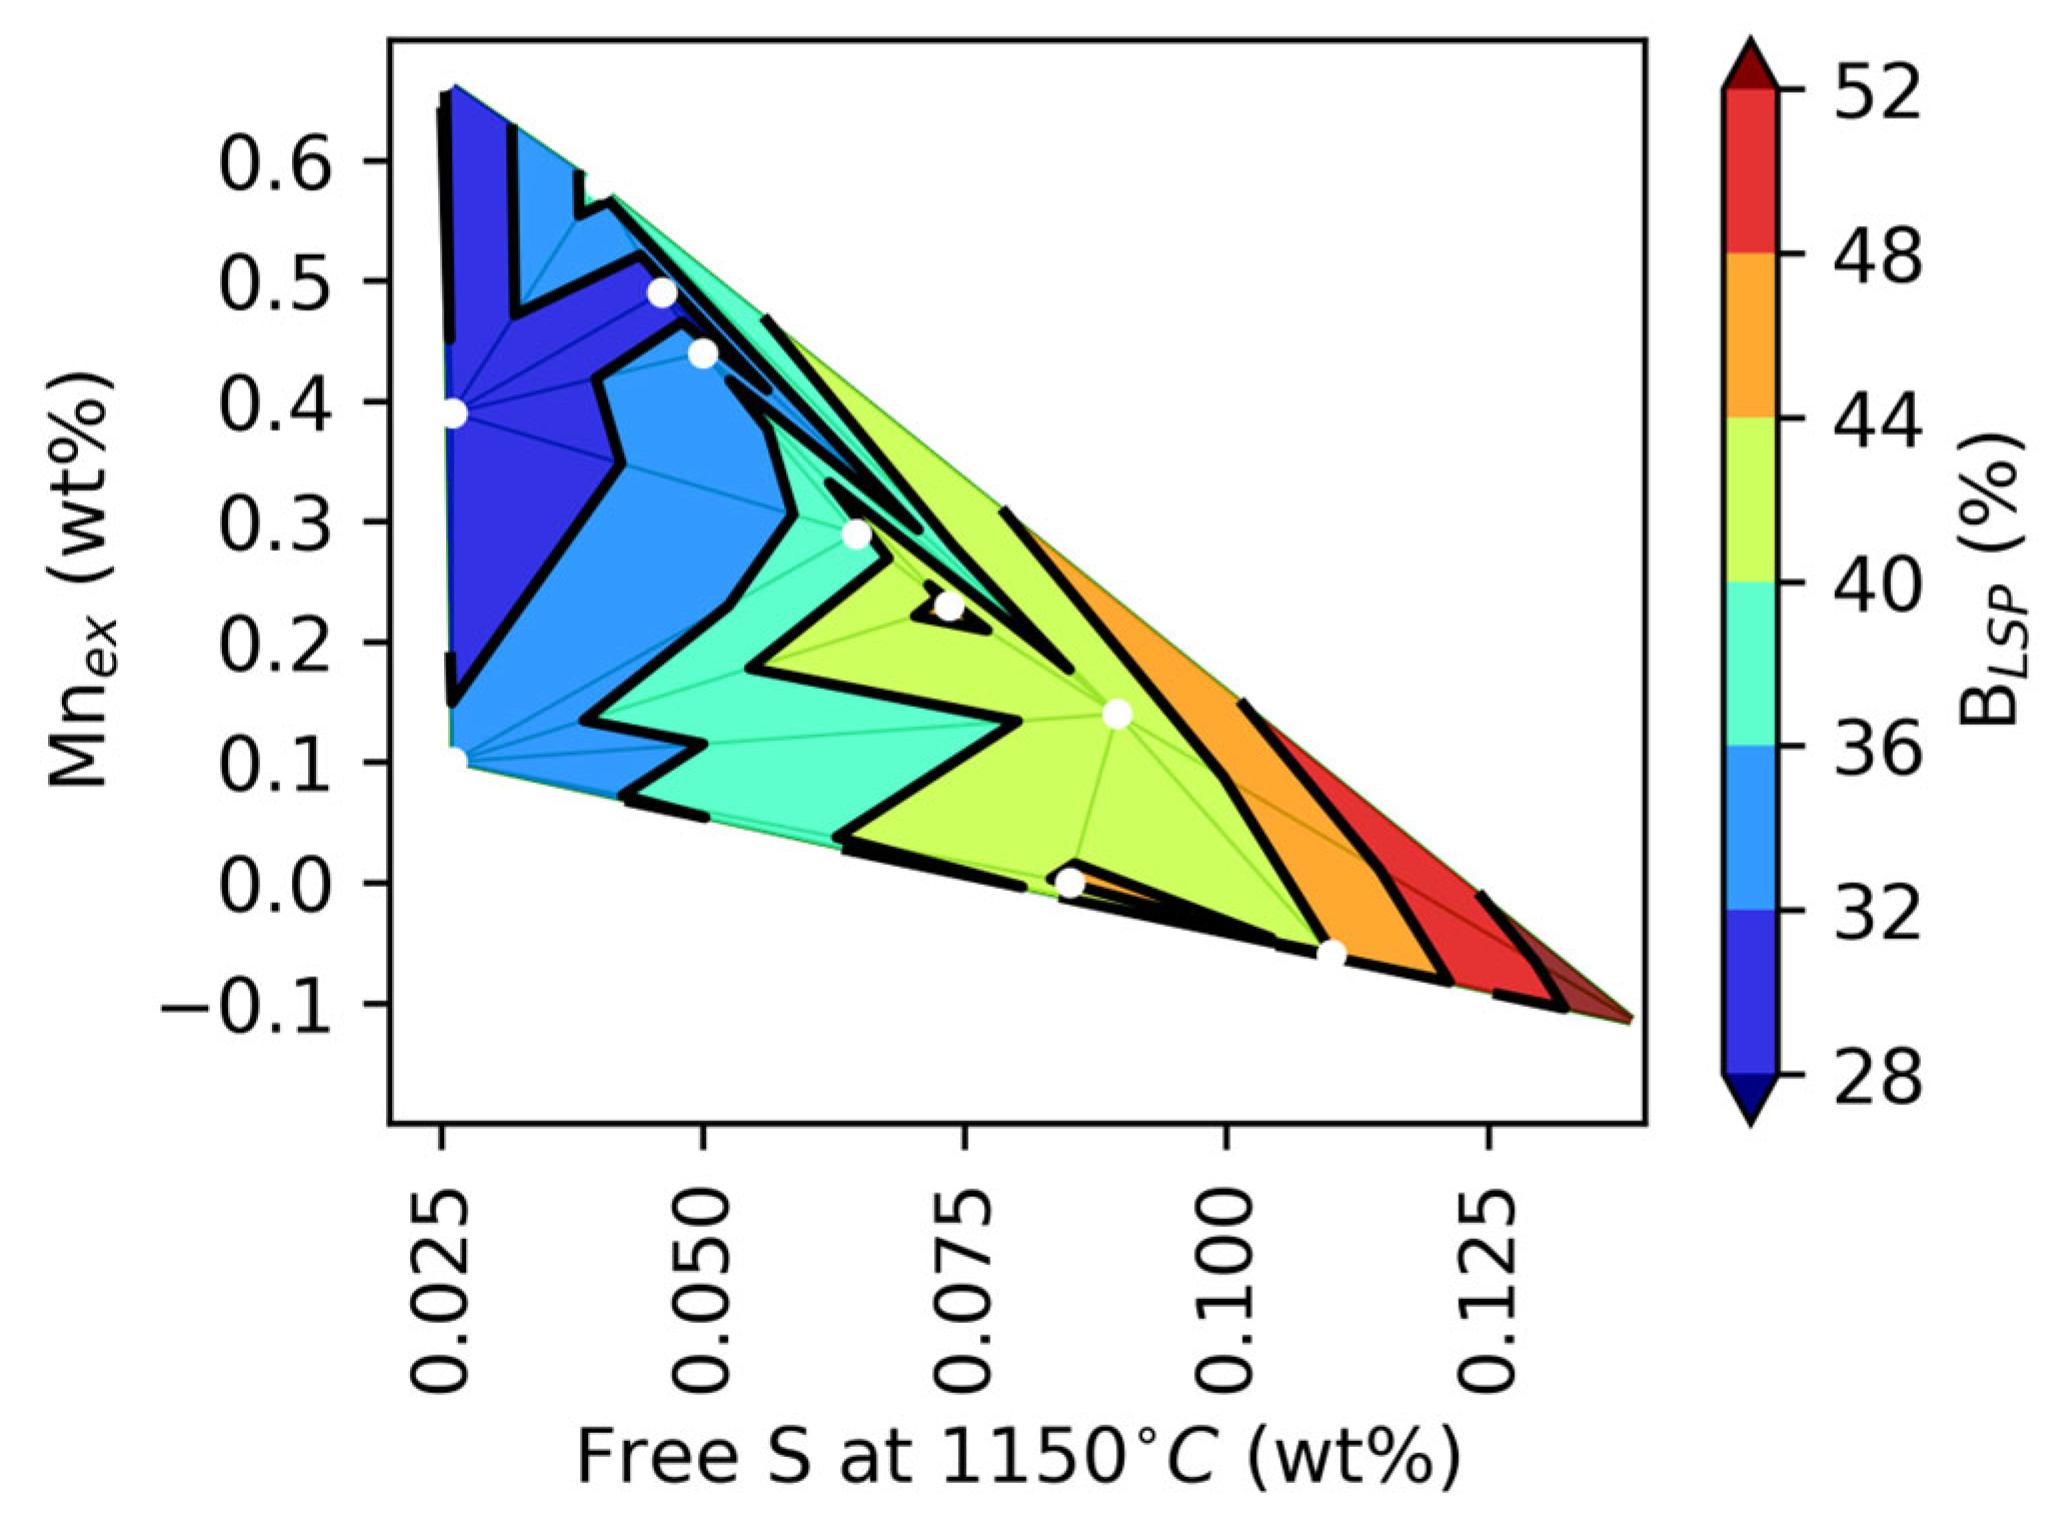
- A new approach is proposed to quantify the branching of graphite flakes of cast irons. With this technique, the percentage of branched flakes, i.e., flakes having one or more branches in the overall population of flakes, can be quantitatively obtained. The percentage of branched flakes was calculated in the basis of the number of flakes, %BN, or on a weighted basis, %BLSP, considering the length of the flakes. These parameters exhibit an excellent correlation with the free S of the liquid metal estimated at 1150 °C. The branching of flakes is diminished when the contents of free sulfur decrease.
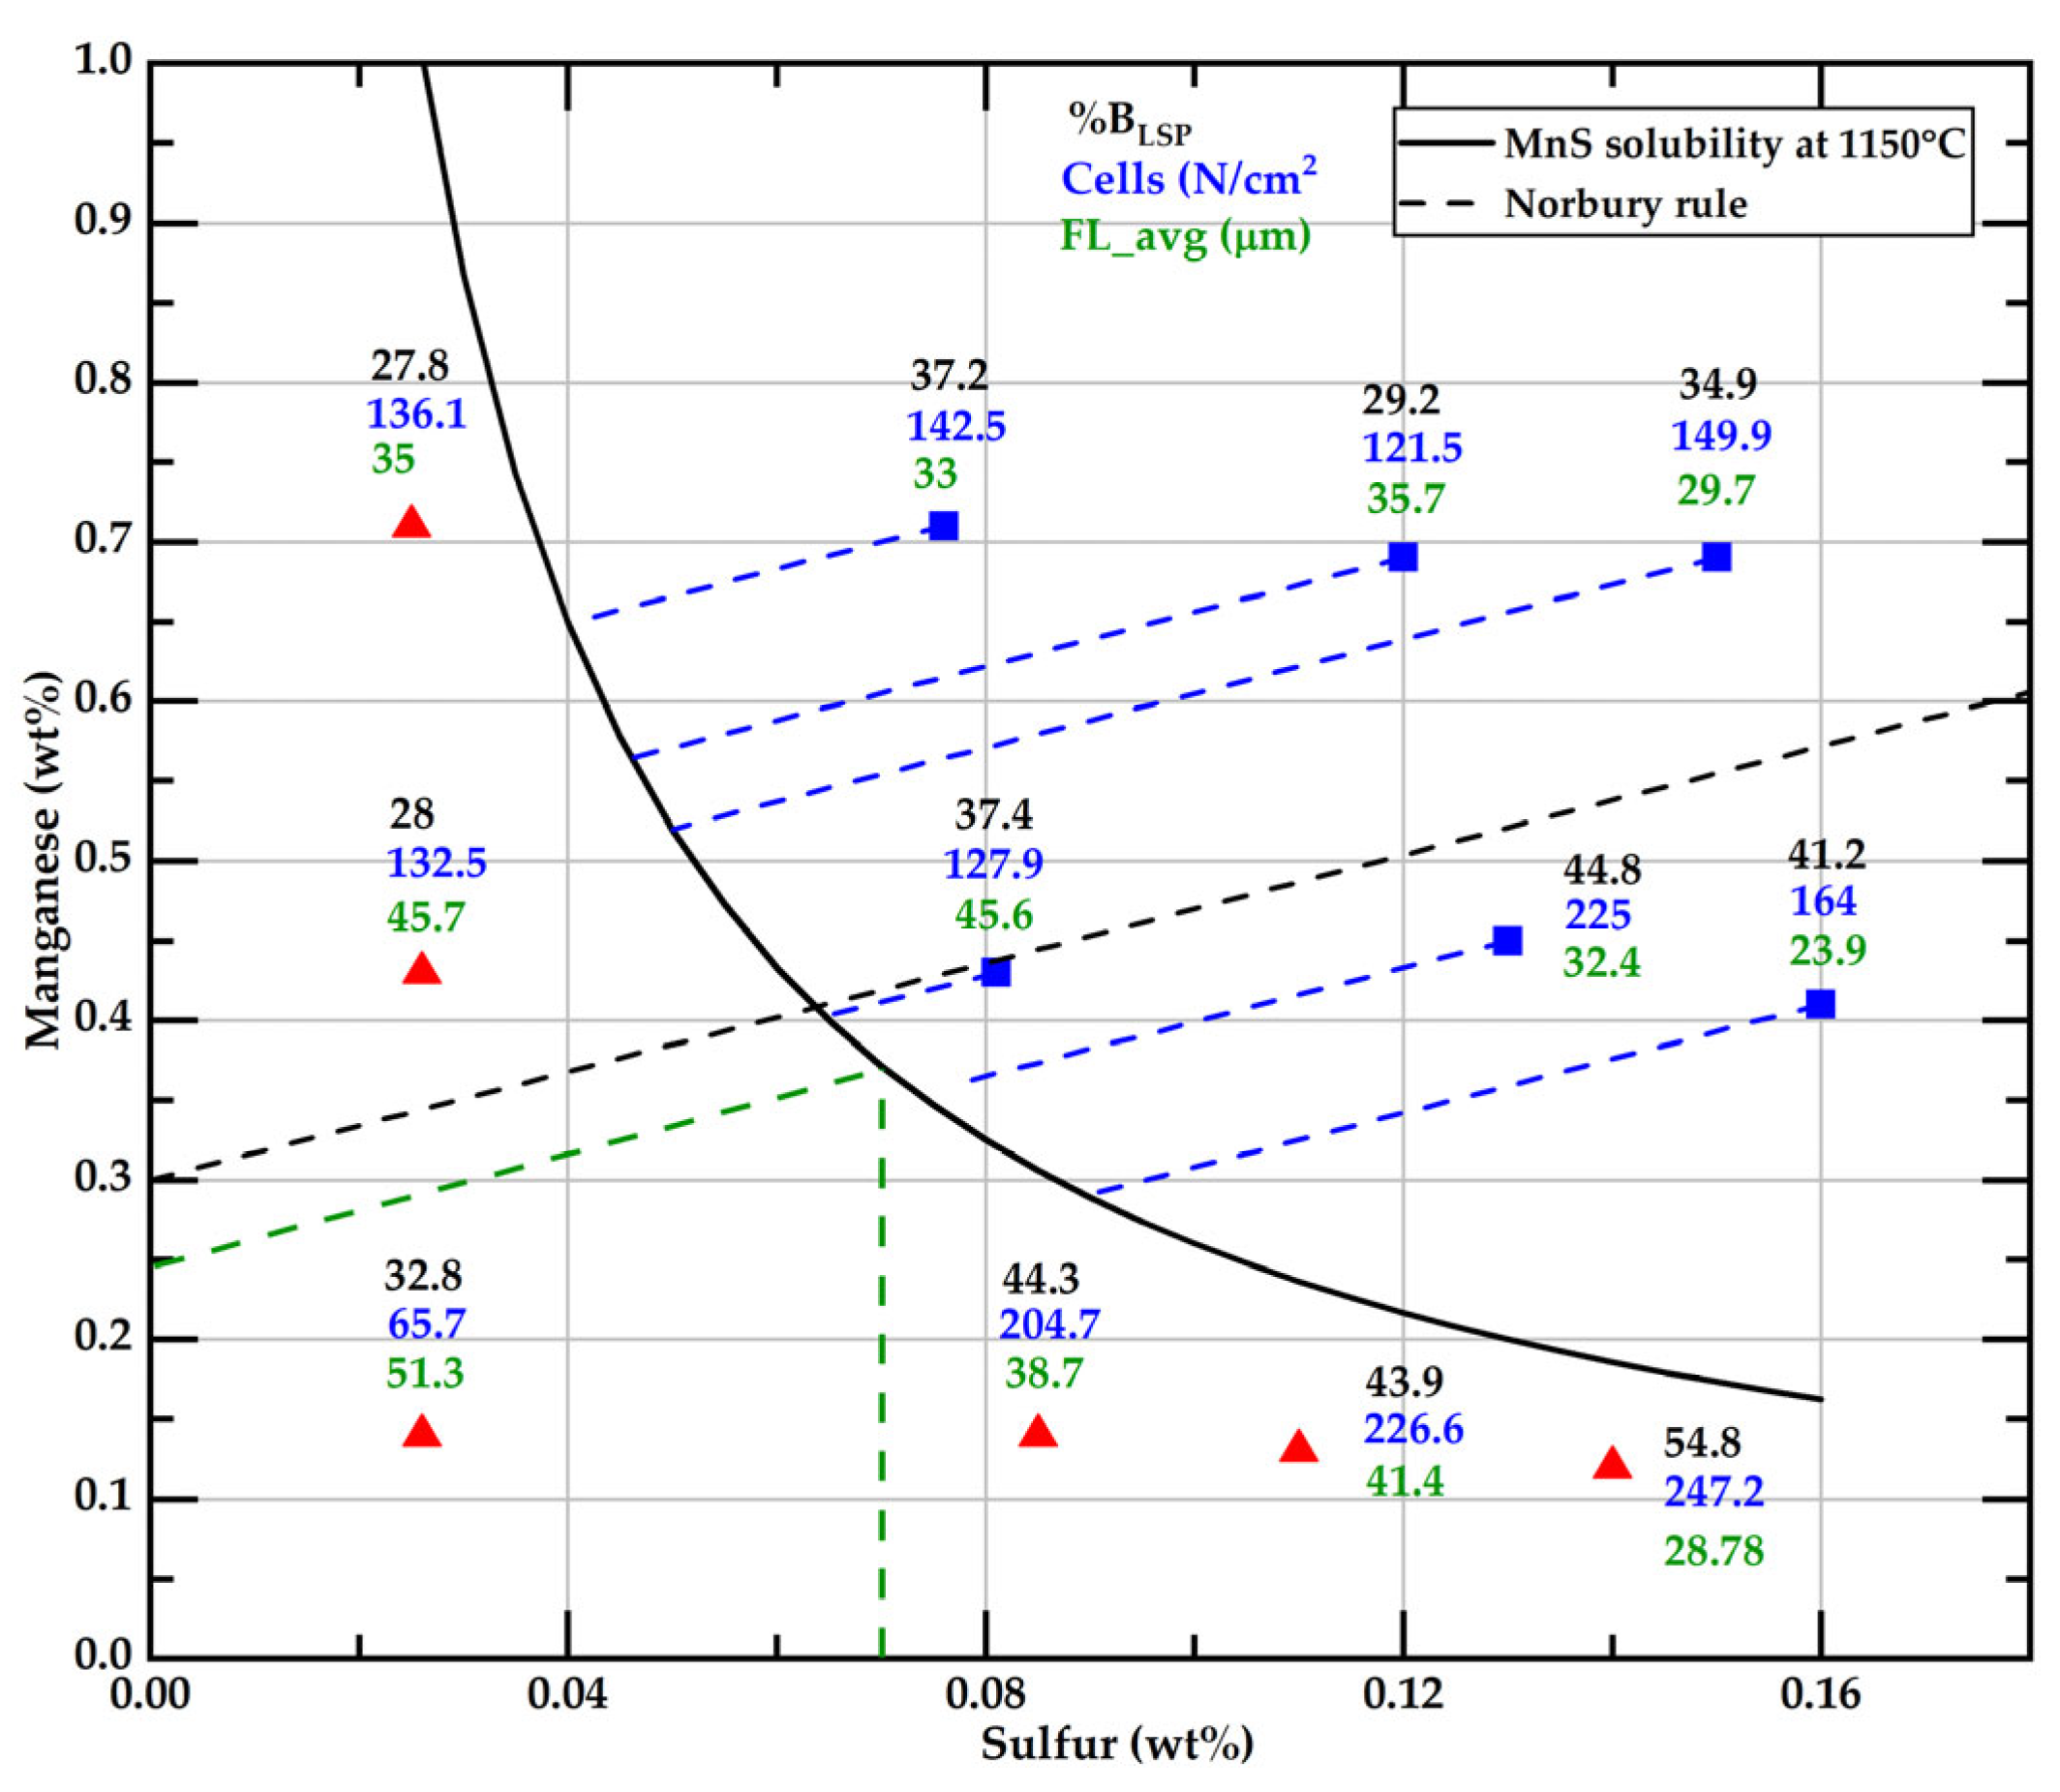
- However, the free S is not well correlated with the flakes’ size. Then, with a similar size, the graphite flakes could have different branching values. It was observed that the longest and lowest-branched graphite flakes were obtained from the casting with 0.026 wt%S. Free sulfur and sulfur content have the same value in those castings.
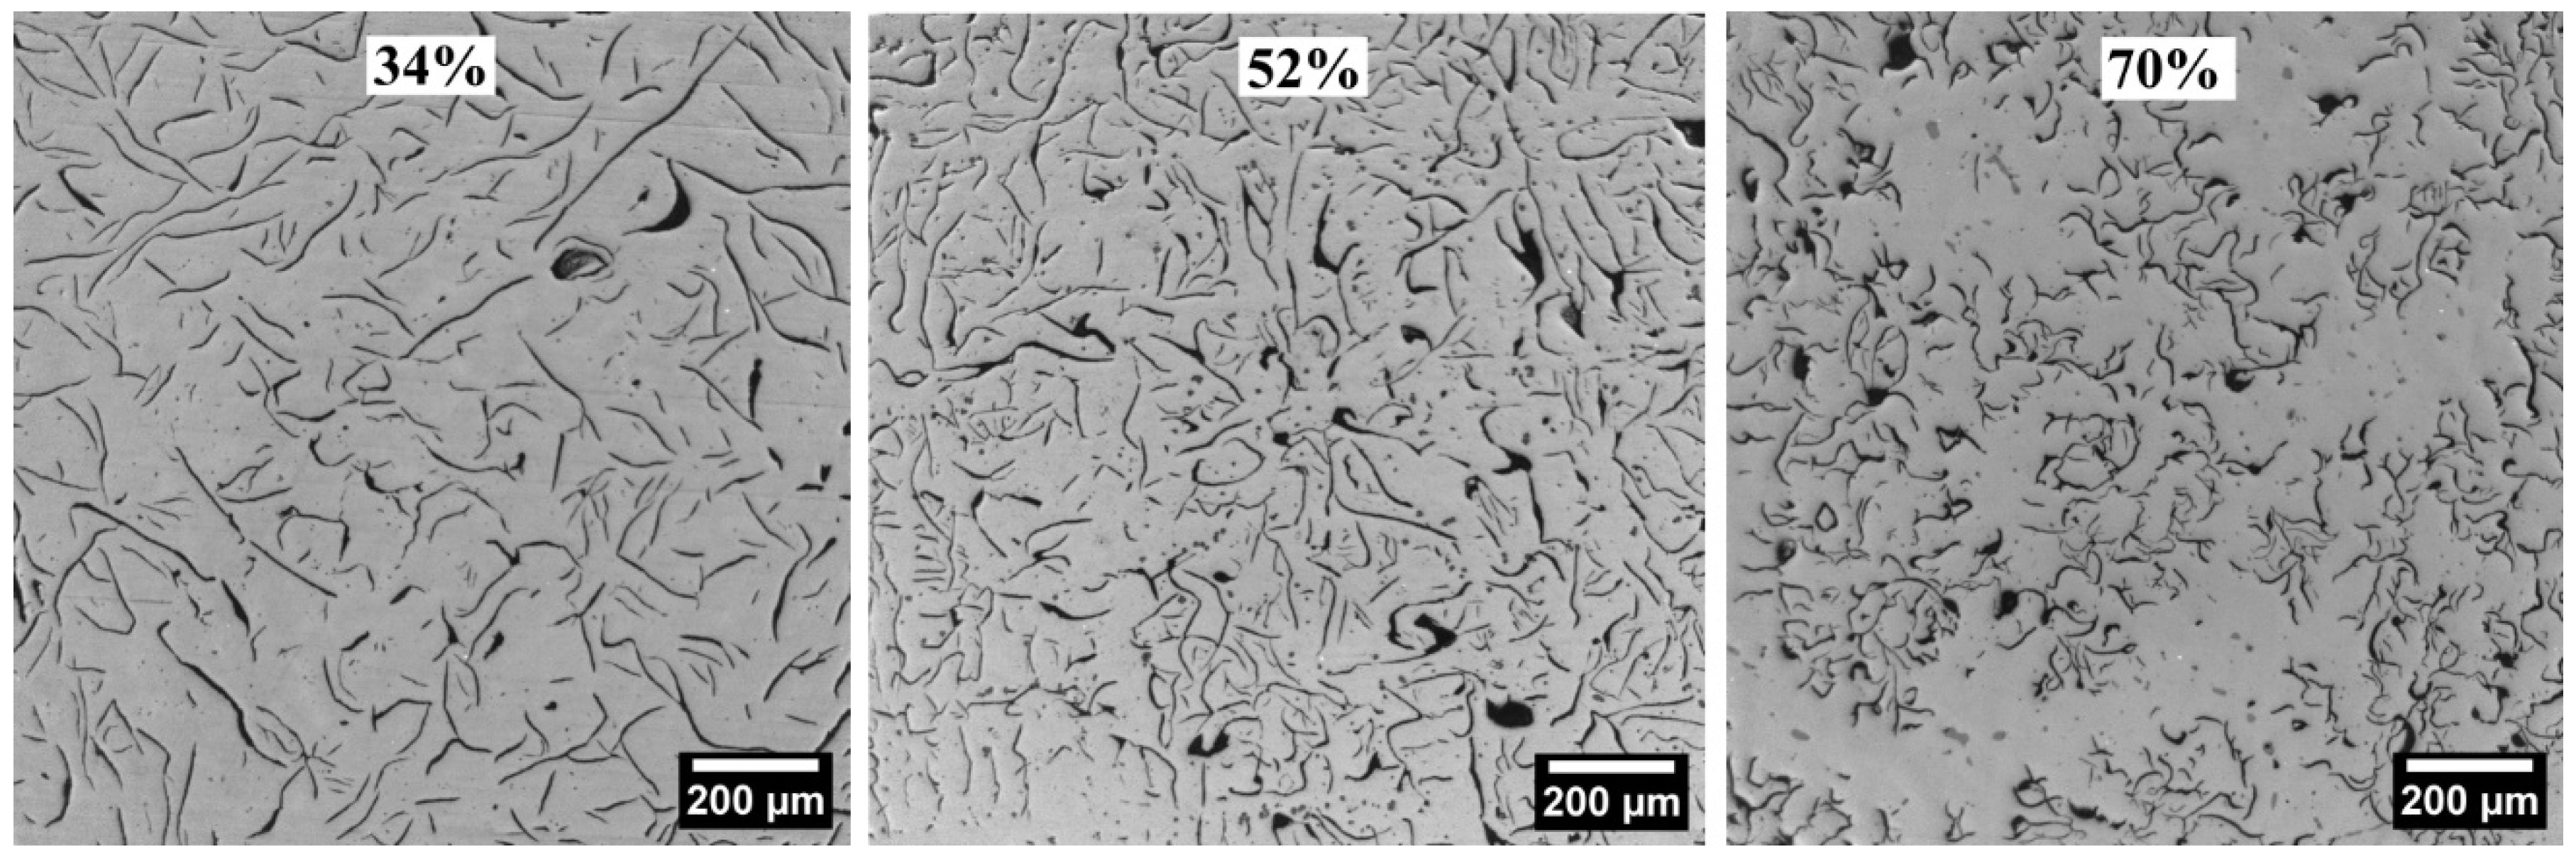
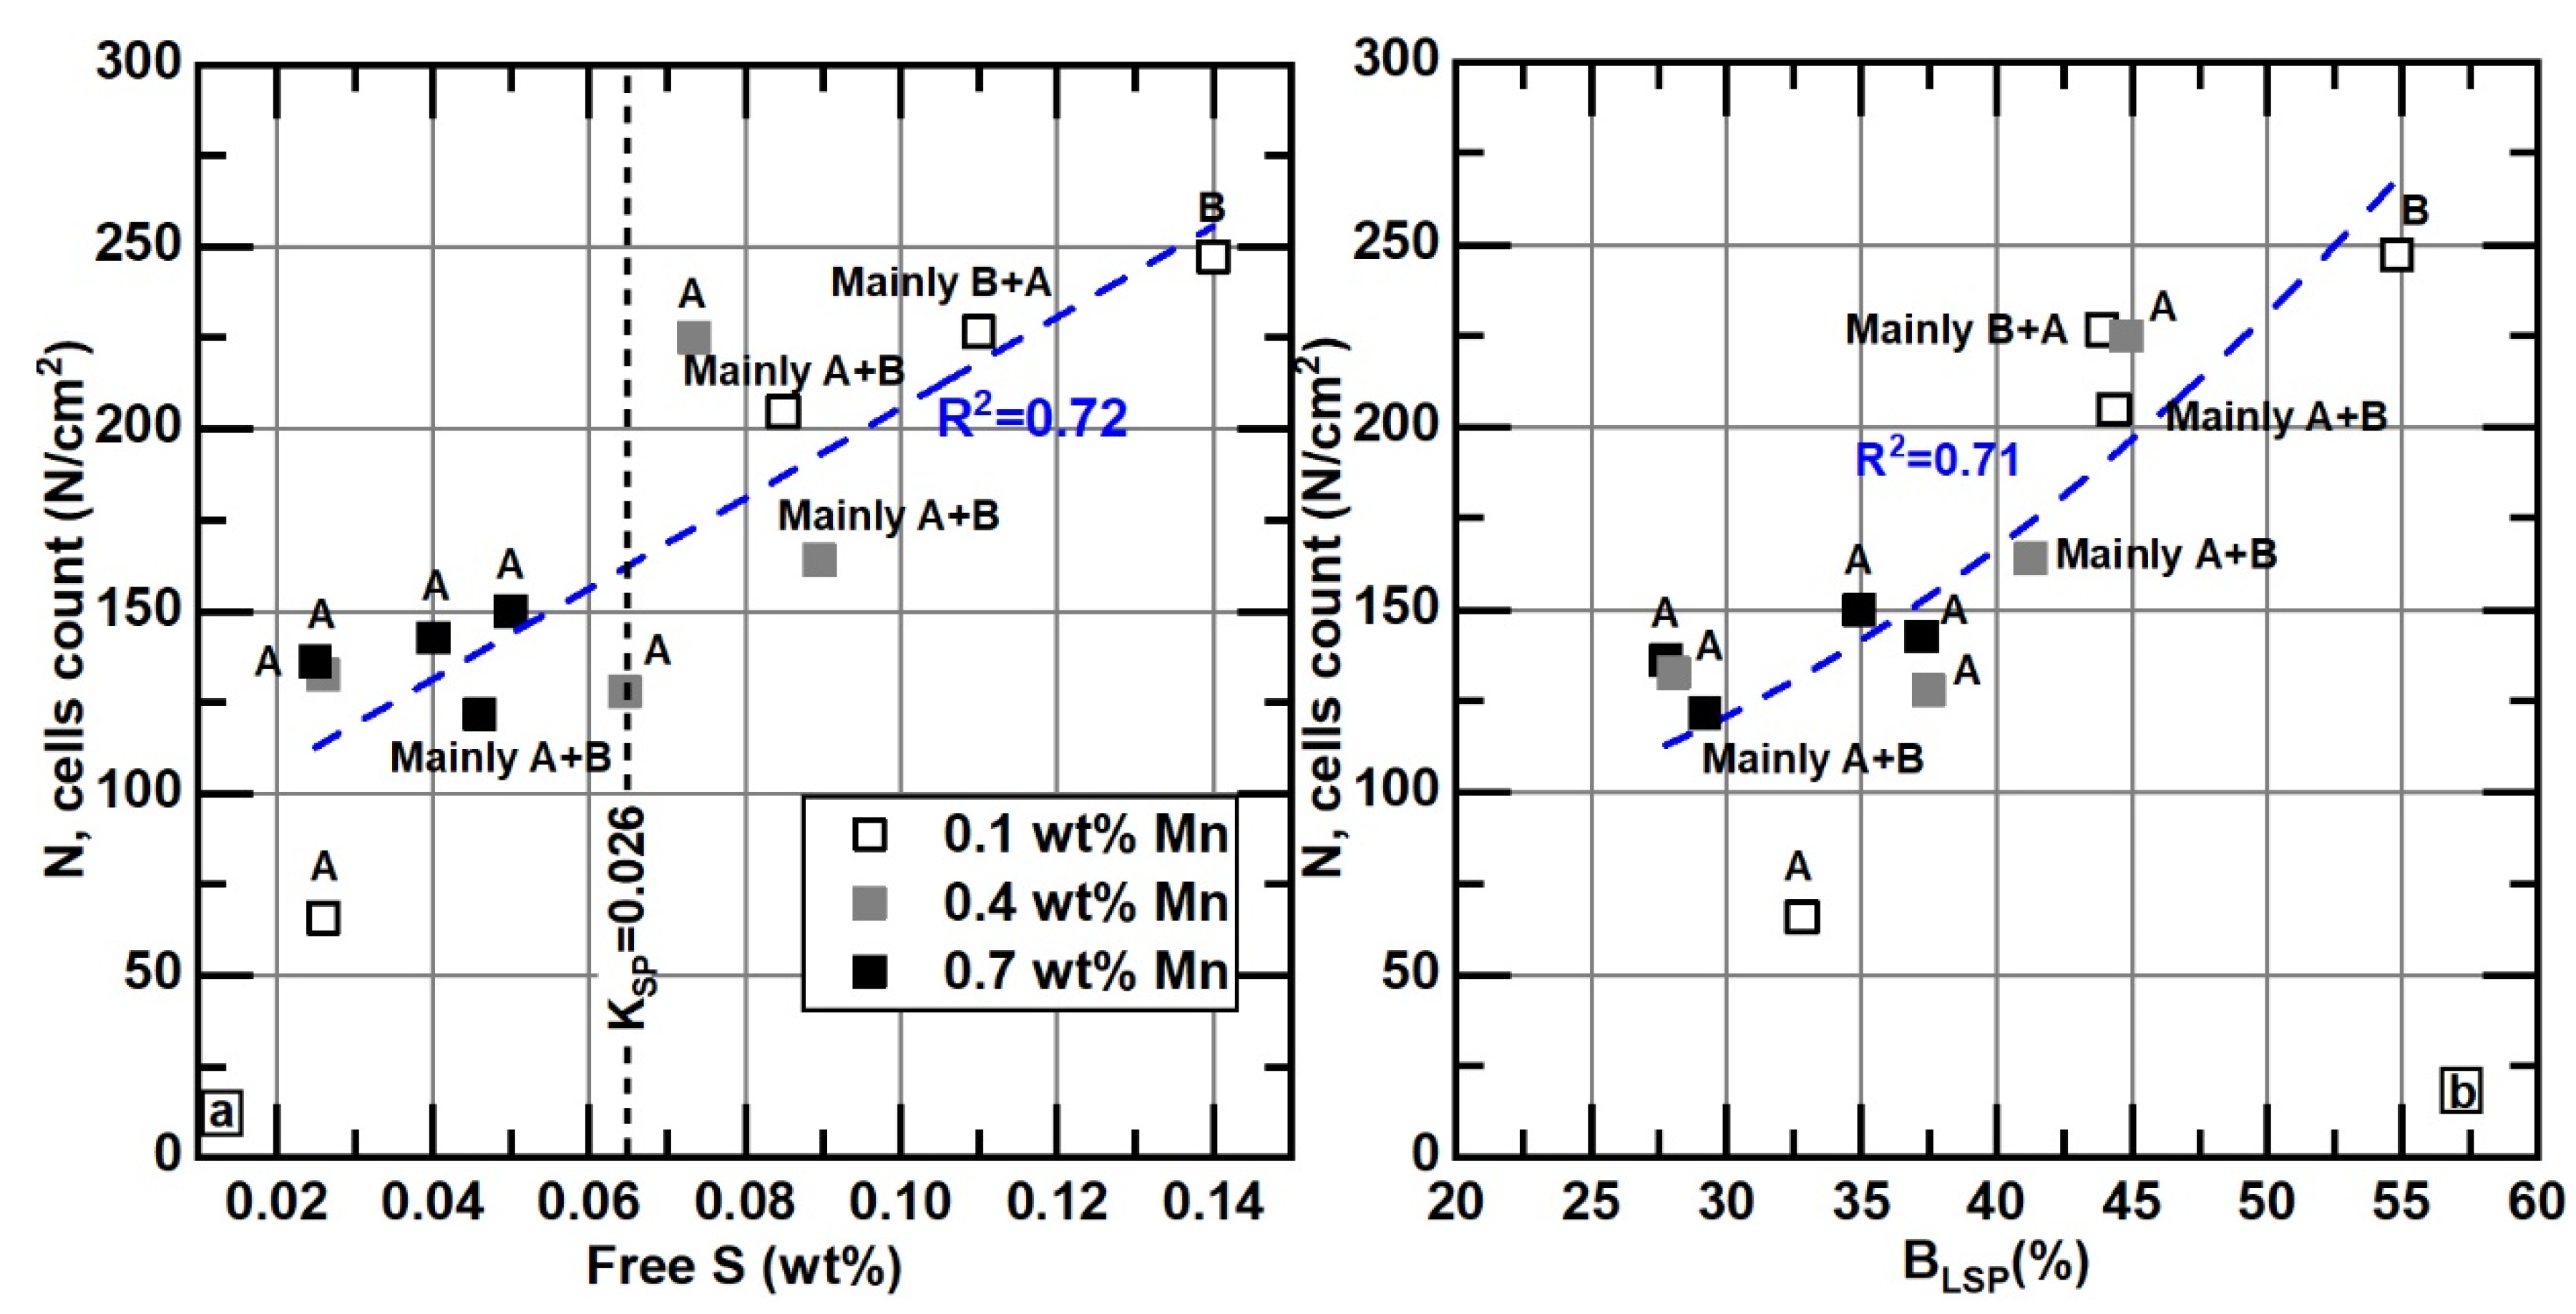
- In our samples, the branching parameter values, %BN or %BLSP, are associated with the type of graphite distribution, as determined by visual inspection. Type B graphite exhibits greater branching compared to Type A graphite. The broader applicability of this observation should be validated through additional research.
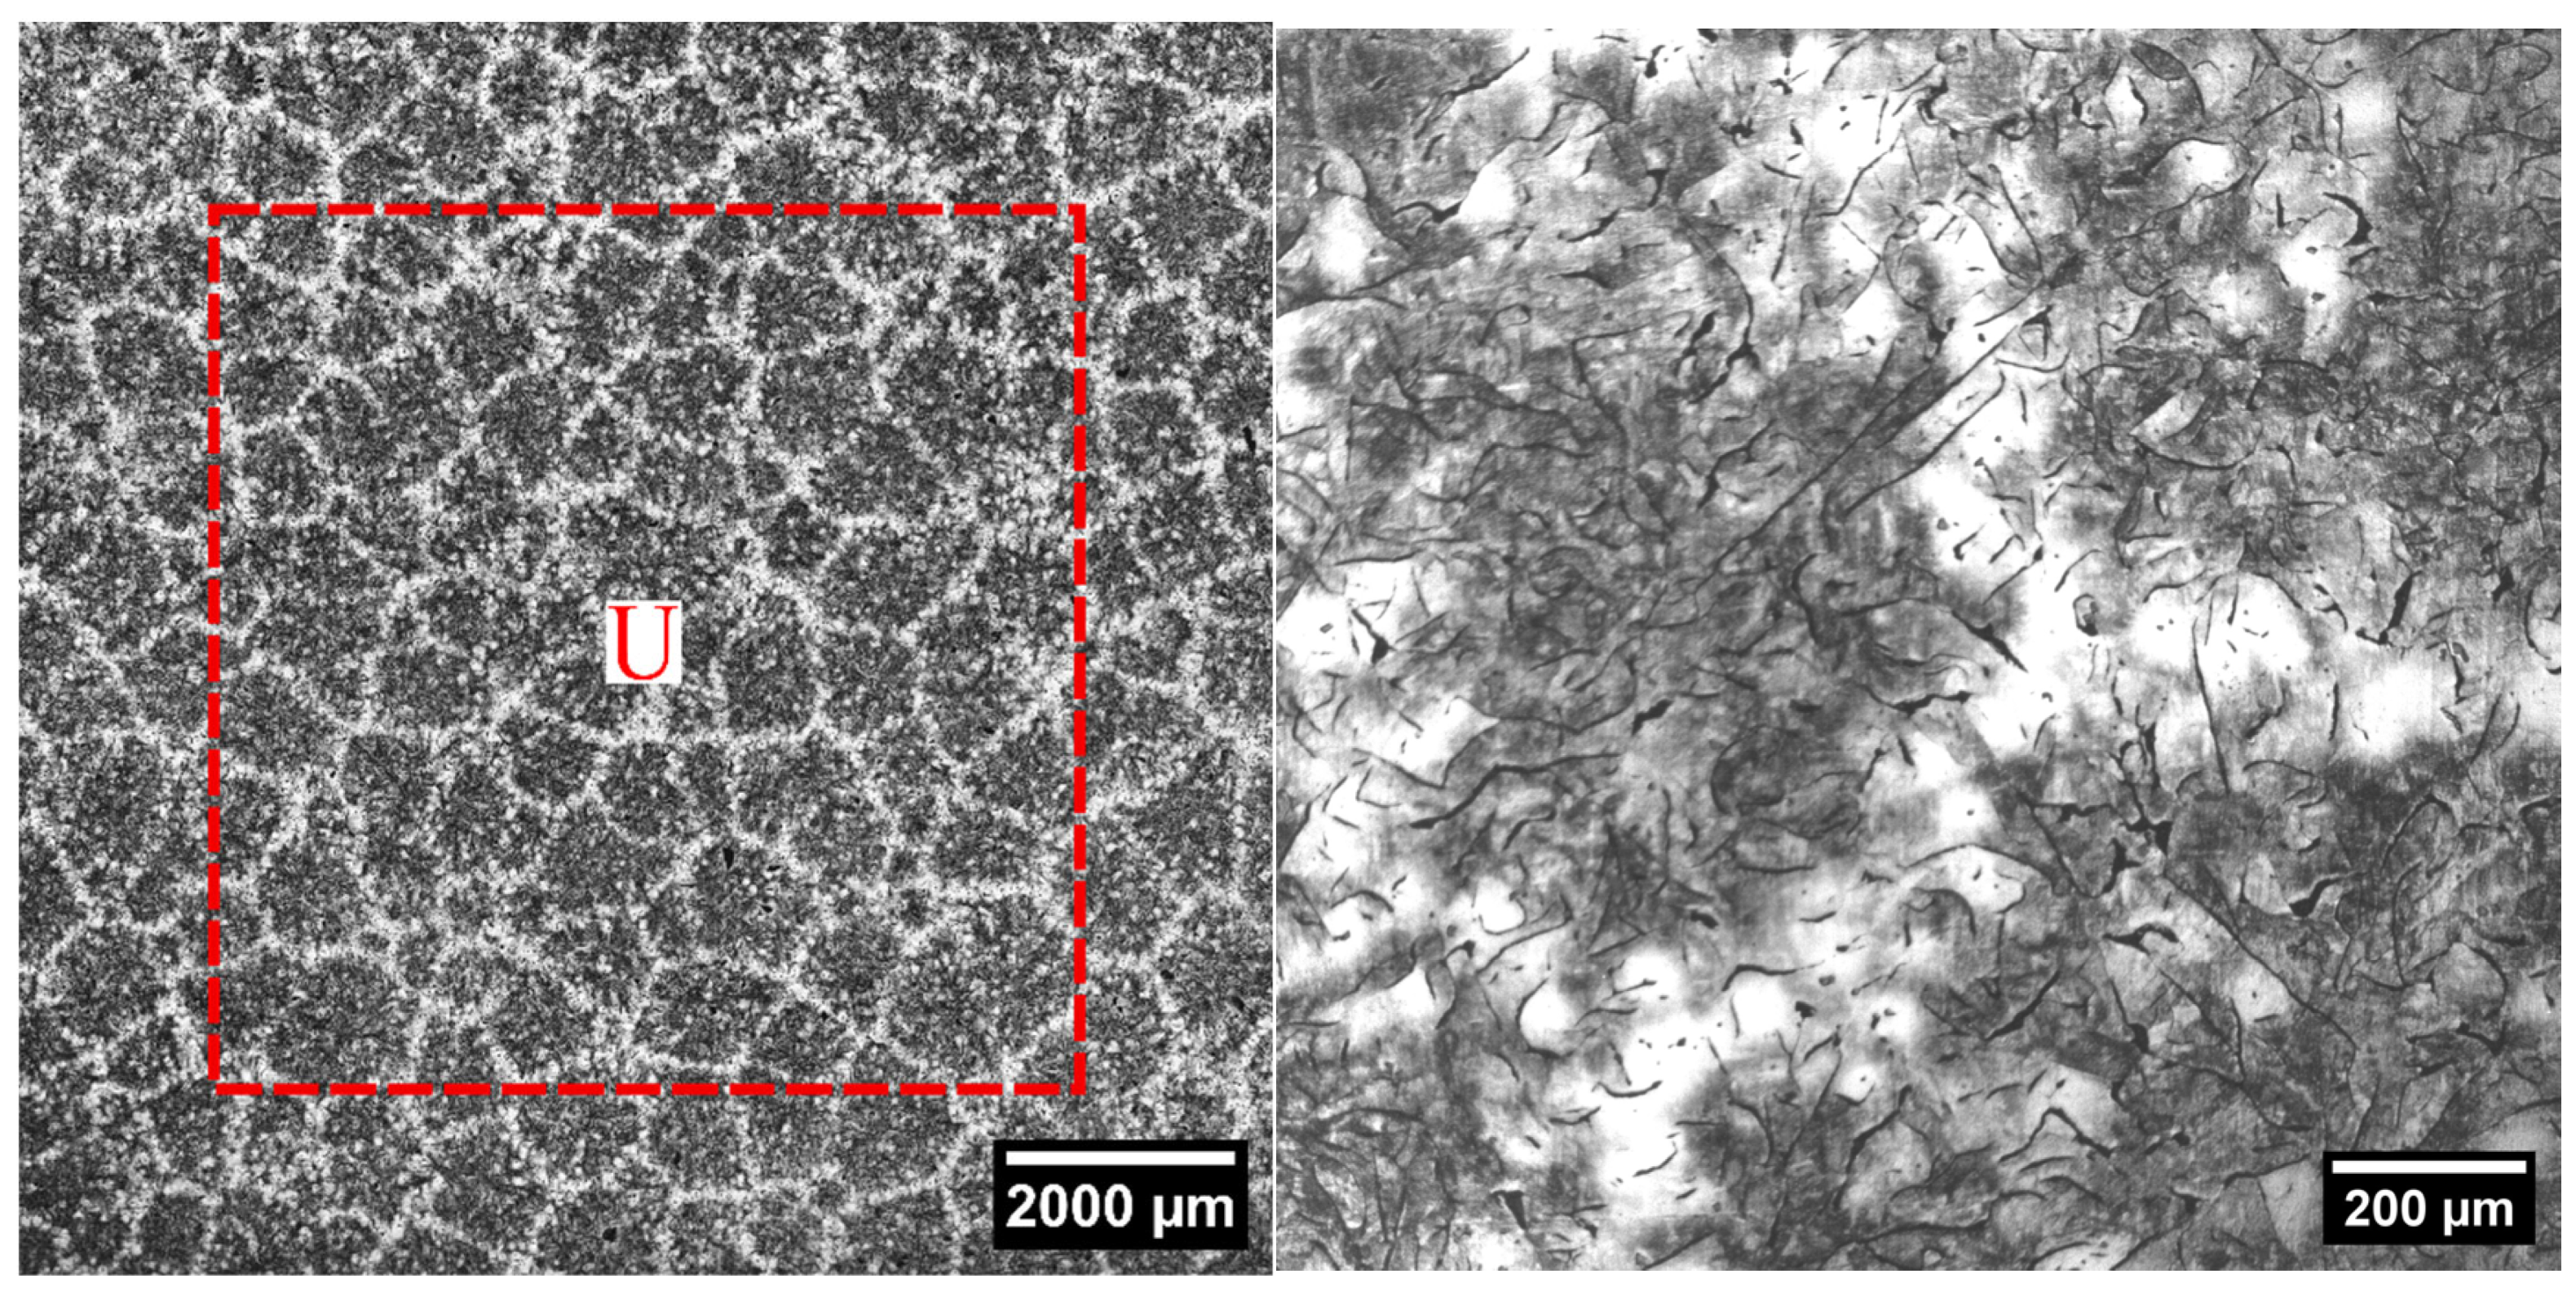
- It was observed that when free S increases, the number of eutectic cells, the branching of the graphite flakes, and the presence of Type B graphite increase.
Author Contributions
Funding
Data Availability Statement
Acknowledgments
Conflicts of Interest
Abbreviations
| CE | Carbon Equivalent |
| UTS | Ultimate Tensile Strength |
| %Mnex | Excess of manganese defined in Equation (1) |
| KSPE | Equilibrium solubility product of M and S in liquid iron at 1150 °C |
| KSP | Solubility product, (wt%Mn) (wt%S), corresponding to initial concentrations |
| Feret_max | Average of six maximum Feret values for sample, one value for micrograph |
| Feret_avg | Average value of the Feret of all the flakes measured. |
| FL | Length of an unbranched flake |
| FL_max | Average of six maximum FL values for sample, one value for micrograph |
| FL_avg | Average value of the FL of all the flakes measured |
| LSP | Longest Shortest Path in a flake |
| LSP_max | Average of six maximum LSP values for sample, one value for micrograph |
| LSP_avg | Average value of the LSP of all the flakes measured |
| Percentage of branched flakes based on the number of flakes | |
| Percentage of branched flakes weighted according to the value of flakes | |
| N | Eutectic cell count/cm2 |
Appendix A
Calculus of the Sulfur Concentration in Liquid Metal at 1150 °C, Free S
| Reaction | Ref. | ||
|---|---|---|---|
| 1 | −277,900 + 64 T | [56] | |
| 2 | −14,600 +9.6 T | [56] | |
| 3 | −4086.31 + 38.15 T | [57] | |
| 4 | 135,149.9 − 23.44 T | [57] | |
| 5 | −161,436.4 + 88.3 T |
| j | ||||||
|---|---|---|---|---|---|---|
| i | C | Si | P | Cu | S | Mn |
| S | 0.11 | 0.063 | 0.29 | −0.0084 | - | −0.026 |
| Mn | −0.07 | 0 | −0.0035 | 0 | −0.048 | - |
References
- A48/A48M; Standard Specification for Gray Iron Castings. ASTM International: West Conshohocken, PA, USA, 2022. [CrossRef]
- Craig, D.B.; Hornung, M.J.; McCluhan, T.K. Gray Iron. In Casting; ASM Metal Handbook; ASM International: Materials Park, OH, USA, 1998; Volume 15, pp. 629–646. ISBN 978-0-87170-007-7. [Google Scholar]
- Li, Q.; Zhang, Y.; Zhang, Y.; Liu, H.; Ren, H.; Zhong, Y.; Huang, X.; Huang, W. Influence of Sn and Nb Additions on the Microstructure and Wear Characteristics of a Gray Cast Iron. Appl. Phys. A 2020, 126, 282. [Google Scholar] [CrossRef]
- Lacaze, J.; Sertucha, J. Effect of Cu, Mn and Sn on Pearlite Growth Kinetics in as-Cast Ductile Irons. Int. J. Cast Met. Res. 2016, 29, 74–78. [Google Scholar] [CrossRef]
- Upadhyay, S.; Saxena, K.K. Effect of Cu and Mo Addition on Mechanical Properties and Microstructure of Grey Cast Iron: An Overview. Mater. Today: Proc. 2020, 26, 2462–2470. [Google Scholar] [CrossRef]
- Goodrich, G.M.; Oakwood, T.G.; Gundlach, R.B. Manganese, Sulfur and Manganese-Sulfur Ratio Effects in Gray Cast Iron. AFS Trans. 2003, 101, 783–812. [Google Scholar]
- Norbury, A.L. Manganese in Cast Iron; BCIRA Bureau Report: London, UK, 1929; Volume 53. [Google Scholar]
- Fuller, A.G. Effect of Manganese and Sulfur on Mechanical Properties and Structure of Flake Graphite Cast Irons. AFS Trans. 1986, 94, 863–872. [Google Scholar]
- Alderson, A. The Influence of Manganese and Sulfur on the Strtucture and Mechanical Properties of Grey Cast Iron. Br. Foundrym. 1983, 78, 335–341. [Google Scholar]
- Muhmond, H.M.; Fredriksson, H. Relationship between Inoculants and the Morphologies of MnS and Graphite in Gray Cast Iron. Metall. Mater. Trans. B 2013, 44, 283–298. [Google Scholar] [CrossRef][Green Version]
- Gundlach, R. Influence of Mn and S on the Properties of Cast Iron Part III—Testing and Analysis. Int. J. Met. 2015, 9, 69–82. [Google Scholar] [CrossRef]
- Gundlach, R. Influence of Mn and S on the Microstructure of Cast Iron. AFS Trans. 2018, 126, 139–150. [Google Scholar]
- Srivastava, R.; Singh, B.; Saxena, K.K. Influence of S and Mn on Mechanical Properties and Microstructure of Grey Cast Iron: An Overview. Mater. Today Proc. 2020, 26, 2770–2775. [Google Scholar] [CrossRef]
- Mampaey, F. The Manganese–Sulphur Ratio in Grey Iron. Fonderie Belg. 1981, 51, 11–25. [Google Scholar]
- Lacaze, J.; Connétable, D.; Castro-Román, M.J. Effects of Impurities on Graphite Shape during Solidification of Spheroidal Graphite Cast Ions. Materialia 2019, 8, 100471. [Google Scholar] [CrossRef]
- Mills, K. ASM Metals Handbook; ASM Digital Library: Materials Park, OH, USA, 1985; Volume 9. [Google Scholar]
- Nakae, H.; Shin, H. Effect of Graphite Morphology on Tensile Properties of Flake Graphite Cast Iron. Mater. Trans. 2001, 42, 1428–1434. [Google Scholar] [CrossRef]
- Chen, Y.; Xue, Z.; Song, S.; Cromarty, R.; Zhou, X. Evolution of Microstructure and High Temperature Tensile Strength of Gray Cast Iron HT250: The Role of Molybdenum. Mater. Sci. Eng. A 2023, 863, 144511. [Google Scholar] [CrossRef]
- Du, S.; Chen, C.; Chen, R.; Wang, Q.; Cui, X.; Song, Q. Influence of Casting Materials on the Microstructure and Mechanical Properties of Gray Cast Iron for Cylinder Liners. Inter Met. 2025, 19, 1650–1662. [Google Scholar] [CrossRef]
- Uchimoto, T.; Takagi, T.; Abe, T. Electromagnetic Nondestructive Evaluation of Graphite Structures in Flake Graphite Cast Iron. Mater. Trans. 2010, 51, 1114–1119. [Google Scholar] [CrossRef]
- Holmgren, D.; Svensson, I.L. Thermal Conductivity–Structure Relationships in Grey Cast Iron. Int. J. Cast Met. Res. 2005, 18, 321–330. [Google Scholar] [CrossRef]
- Wang, G.; Li, Y. Thermal Conductivity of Cast Iron -A Review. China Foundry 2020, 17, 85–95. [Google Scholar] [CrossRef]
- Hecht, R.L.; Dinwiddie, R.B.; Wang, H. The Effect of Graphite Flake Morphology on the Thermal Diffusivity of Gray Cast Irons Used for Automotive Brake Discs. J. Mater. Sci. 1999, 34, 4775–4781. [Google Scholar] [CrossRef]
- Tewary, U.; Paul, D.; Mehtani, H.K.; Bhagavath, S.; Alankar, A.; Mohapatra, G.; Sahay, S.S.; Panwar, A.S.; Karagadde, S.; Samajdar, I. The Origin of Graphite Morphology in Cast Iron. Acta Mater. 2022, 226, 117660. [Google Scholar] [CrossRef]
- Amini, S.; Abbaschian, R. Nucleation and Growth Kinetics of Graphene Layers from a Molten Phase. Carbon 2013, 51, 110–123. [Google Scholar] [CrossRef]
- ASTM A247-19; Standard Test Method for Evaluating the Microstructure of Graphite in Iron Castings. ASTM International: West Conshohocken, PA, USA, 2019. [CrossRef]
- ISO 945-1; Microstructure of Cast Irons—Part 1: Graphite Classification by Visual Analysis. ISO: Geneva, Switzerland, 2019.
- Cree, J.W.; Hoover, A.M.; Pelland, B.C.; Pearson, G.R.; Cruse, J.L.; Naik, N.A. Statistical Analysis of Effects of Boron and Titanium, Plus Plain Thermal Analysis (TA) Cup Type on Quantified Image Analysis Metallography, Ultrasonic Velocity and Mechanical Properties of Gray Iron. Inter Met. 2025. [Google Scholar] [CrossRef]
- Khuntrakool, C.; Janudom, S.; Muangjunburee, P.; Yodjan, A.; Mahathaninwong, N.; Chucheep, T. Control of Graphite Structure in High Phosphorus Grey Cast Iron Brake Shoes through Ferro-Silicon Inoculant. Inter Met. 2025, 19, 259–270. [Google Scholar] [CrossRef]
- ASTM A247-67; Standard Test Method for Evaluating the Microstructure of Graphite in Iron Castings. ASTM International: West Conshohocken, PA, USA, 1967.
- ISO 945-2; Microstructure of Cast Irons—Part 2: Graphite Classification by Image Analysis. ISO: Geneva, Switzerland, 2011.
- Chen, T.; Wang, C.; Yan, R.; Li, F.; Wang, J.; Wang, J. Study on Friction and Wear Behavior of Gray Cast Iron with Different Carbon Content at Different Temperatures. Mater. Res. Express 2024, 11, 046505. [Google Scholar] [CrossRef]
- Ji, L.; Du, X.; Sun, Y.; Zhu, T.; Feng, J. Effect of Solidification Rate on Microstructure and Mechanical Characteristic of Gray Cast Iron. Inter Met. 2024, 18, 734–743. [Google Scholar] [CrossRef]
- Li, Z.; Chen, R.; Wang, Q.; Chen, C.; Zhang, Y.; Song, Q. Effect of Nb Addition on Compact Microstructure and Mechanical Properties of Gray Cast Iron for Cylinder Liner. Inter Met. 2025, 19, 307–317. [Google Scholar] [CrossRef]
- Barlow, T.E.; Lorig, C.H. Gray Cast Iron Tensile Strength, Brinell Hardness and Composition Relationships. AFS Trans. 1946, 54, 545–552. [Google Scholar]
- Goodrich, G.M. Cast Iron Quality Control Committee 5J Report Cast Iron Microstructure Anomalies and Their Causes. AFS Trans. 1997, 105, 669–683. [Google Scholar]
- Gundlach, R.B. Influence of Mn and S on the Mechanical Properties of Gray Cast Iron: Part I—Historical Perspective. AFS Trans. 2014, 122, 287–304. [Google Scholar]
- Prakash, P.; Mytri, V.; Hiremath, P. Fuzzy Rule Based Classification and Quantification of Graphite Inclusions from Microstructure Images of Cast Iron. Microsc. Microanal. 2011, 17, 896–902. [Google Scholar] [CrossRef]
- Friess, J.; Sonntag, U.; Steller, I.; Bührig-Polaczek, A. From Individual Graphite Assignment to an Improved Digital Image Analysis of Ductile Iron. Inter Met. 2020, 14, 1090–1104. [Google Scholar] [CrossRef]
- Huang, W.; Su, Z.-Y.; Wang, C.-S.; Yeh, M.; Chou, J.-H. Graphite Classification of Gray Cast Iron in Metallographic via a Deep Learning Approach. J. Internet Technol. 2022, 23, 889–895. [Google Scholar] [CrossRef]
- Germain, L.; Sertucha, J.; Hazotte, A.; Lacaze, J. Classification of Graphite Particles in Metallographic Images of Cast Irons—Quantitative Image Analysis versus Deep Learning. Mater. Charact. 2024, 217, 114333. [Google Scholar] [CrossRef]
- Lin, C.; Chen, C.; Wang, W.; Pei, X.; Hu, W.; Su, S. Graphite Particle Segmentation Method for Spheroidal Graphite Cast Iron Based on Improved DeepLabv3+. Inter Met. 2024, 18, 2092–2106. [Google Scholar] [CrossRef]
- Waqas, M.; Sohail, M.; Anwer, S.; Kazmi, M.; Raza, B. Microstructural Characterization and Analysis of Gray Cast Iron Material Using Deep Learning-Based Object Detection and Localization Techniques. Int. J. Comp. Mat. Sci. Eng. 2025, 2540003. [Google Scholar] [CrossRef]
- Chuang, C.; Singh, D.; Kenesei, P.; Almer, J.; Hryn, J.; Huff, R. 3D Quantitative Analysis of Graphite Morphology in High Strength Cast Iron by High-Energy X-Ray Tomography. Scr. Mater. 2015, 106, 5–8. [Google Scholar] [CrossRef]
- Lemiasheuski, A.; Kranzmann, A.; Pfennig, A. Challenges and Possibilities of the Manual Metallographic Serial Sectioning Process Using the Example of a Quantitative Microstructural Analysis of Graphite in Cast Iron. Pract. Metallogr. 2024, 61, 746–768. [Google Scholar] [CrossRef]
- Domeij, B.; Hernando, J.C.; Diószegi, A. Size Distribution of Graphite Nodules in Hypereutectic Cast Irons of Varying Nodularity. Metall. Mater. Trans. B 2018, 49, 2487–2504. [Google Scholar] [CrossRef]
- UNE-EN 1563-2019; Fundición. Fundición de Grafito Esferoidal. C/Génova: Madrid, Spain, 2019.
- Griffin, R.D.; Scarber, P.; Janowski, G.M.; Bates, C.E. Quantitative Characterization of Graphite in Gray Iron. AFS Trans. 1996, 104, 977–983. [Google Scholar]
- Arganda-Carreras, I.; Fernández-González, R.; Muñoz-Barrutia, A.; Ortiz-De-Solorzano, C. 3D Reconstruction of Histological Sections: Application to Mammary Gland Tissue. Microsc. Res. Tech. 2010, 73, 1019–1029. [Google Scholar] [CrossRef]
- Lee, T.-C.; Kashyap, R.L.; Chu, C.-N. Building Skeleton Models via 3-D Medial Surface Axis Thinning Algorithms. CVGIP Graph. Models Image Process. 1994, 56, 462–478. [Google Scholar] [CrossRef]
- Polder, G.; Hovens, H.L.E.; Zweers, A.J. Measuring Shoot Length of Submerged Aquatic Plants Using Graph Analysis. In Proceedings of the ImageJ User and Developer Conference 2010, Luxembourg, 27–29 October 2010; pp. 172–177. [Google Scholar]
- Fras, E.; Górny, M.; Kapturkiewicz, W.; Lopez, H. Eutectic Cell and Nodule Count in Cast Irons. Int. J. Cast Met. Res. 2007, 20, 233–239. [Google Scholar] [CrossRef]
- Ryś, J. Stereology of Materials; Fotobit-Design: Cracow, Poland, 1995. [Google Scholar]
- Moumeni, E. Solidification of Cast Iron-A Study on the Effect of Microalloy Elements on Cast Iron. Ph.D. Thesis, Technical University of Denmark, Lyngby, Denmark, 2013. [Google Scholar]
- Moumeni, E.; Stefanescu, D.M.; Tiedje, N.S.; Larrañaga, P.; Hattel, J.H. Investigation on the Effect of Sulfur and Titanium on the Microstructure of Lamellar Graphite Iron. Metall. Mater. Trans. A 2013, 44, 5134–5146. [Google Scholar] [CrossRef]
- Fruehan, R.J. The Making, Shaping and Treating of Steel; Steelmaking and Refining Volume; The AISE Steel Foundation: Pittsburgh, PA, USA, 1998; Volume 662. [Google Scholar]
- Sigworth, G.K.; Elliott, J.F. The Thermodynamics of Liquid Dilute Iron Alloys. Met. Sci. 1974, 8, 298–310. [Google Scholar] [CrossRef]
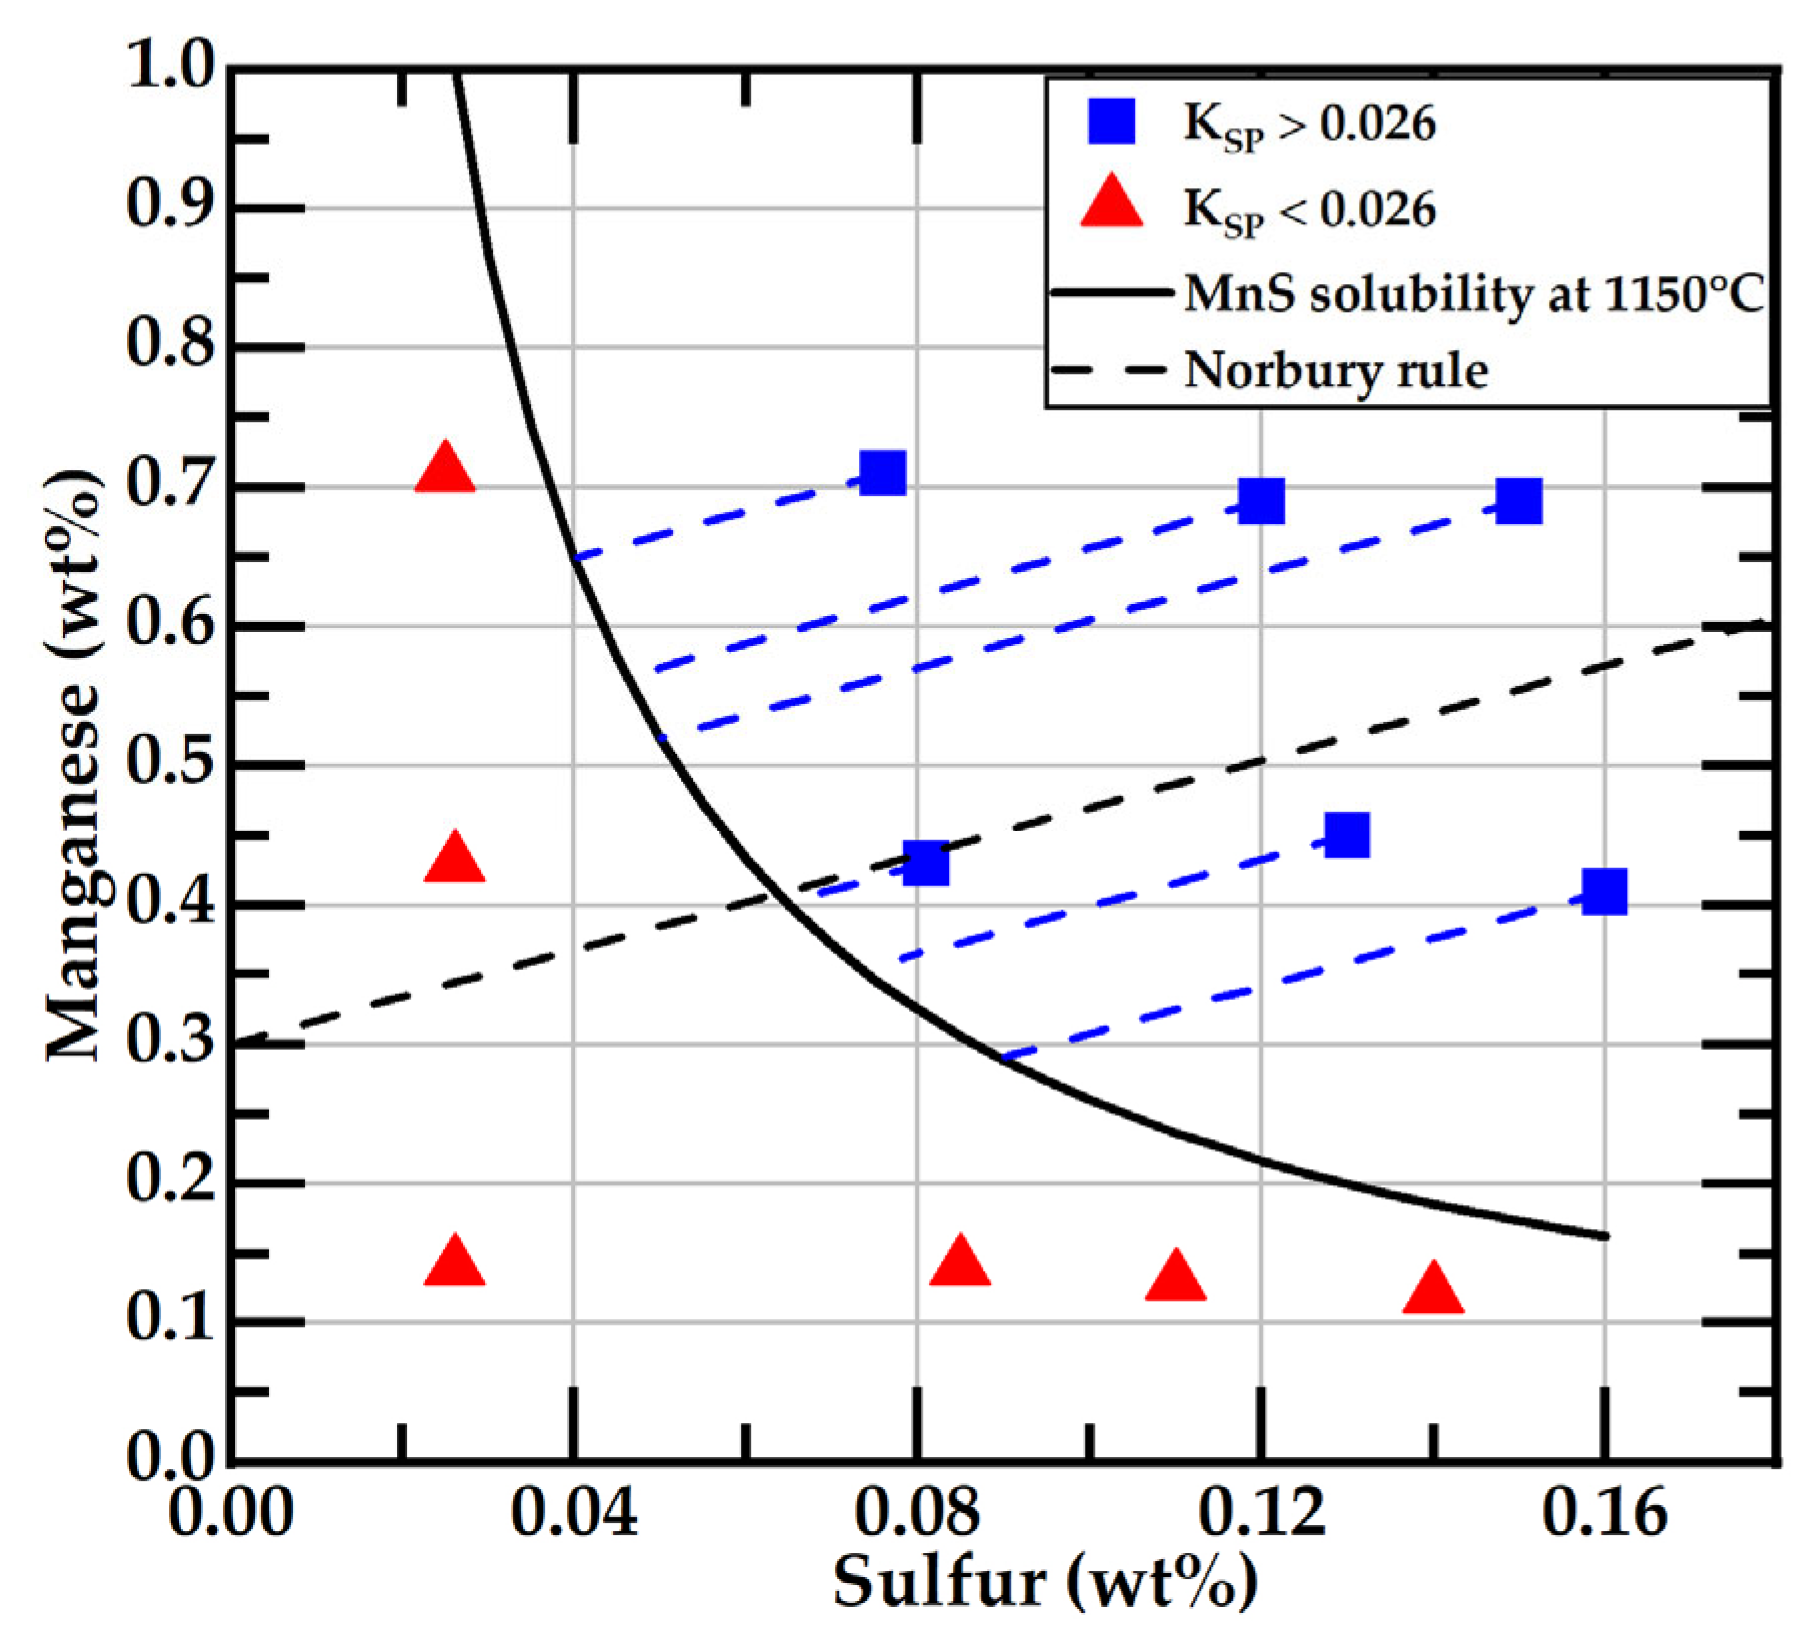
| Sample | wt% C | wt% Si | wt% CE | wt% S | wt% Mn | wt% Cu | wt% P | Excess Mn (wt% Mnex) | Ksp | Free S (wt%) |
|---|---|---|---|---|---|---|---|---|---|---|
| L-026 | 3.31 | 2.03 | 3.99 | 0.026 | 0.14 | 0.84 | 0.011 | 0.1 | 0.004 | 0.026 |
| L-085 | 3.3 | 2.05 | 3.99 | 0.085 | 0.14 | 0.83 | 0.013 | 0 | 0.012 | 0.085 |
| L-110 | 3.3 | 2.03 | 3.98 | 0.11 | 0.13 | 0.84 | 0.013 | −0.06 | 0.014 | 0.110 |
| L-140 | 3.32 | 2.01 | 4.00 | 0.14 | 0.12 | 0.85 | 0.015 | −0.12 | 0.017 | 0.140 |
| M-026 | 3.32 | 2.13 | 4.04 | 0.026 | 0.43 | 0.83 | 0.015 | 0.39 | 0.011 | 0.026 |
| M-081 | 3.35 | 2.11 | 4.06 | 0.081 | 0.43 | 0.84 | 0.014 | 0.29 | 0.035 | 0.065 |
| M-130 | 3.35 | 2.22 | 4.10 | 0.13 | 0.45 | 0.82 | 0.015 | 0.23 | 0.059 | 0.073 |
| M-160 | 3.38 | 2.11 | 4.0 | 0.16 | 0.41 | 0.85 | 0.016 | 0.14 | 0.066 | 0.090 |
| H-025 | 3.27 | 2.00 | 3.94 | 0.025 | 0.71 | 0.85 | 0.018 | 0.67 | 0.018 | 0.025 |
| H-076 | 3.28 | 2.04 | 3.97 | 0.076 | 0.71 | 0.85 | 0.020 | 0.58 | 0.054 | 0.040 |
| H-120 | 3.31 | 2.03 | 3.99 | 0.12 | 0.69 | 0.86 | 0.019 | 0.49 | 0.083 | 0.046 |
| H-150 | 3.30 | 1.99 | 3.97 | 0.15 | 0.69 | 0.85 | 0.022 | 0.44 | 0.104 | 0.050 |
| Sample | S (%wt) | Mn (%wt) | Mnex (%wt) | “Ksp” | Size Class | Graphite Type (Visual Analysis) | Feret_avg (µm) | Feret_max (µm) |
|---|---|---|---|---|---|---|---|---|
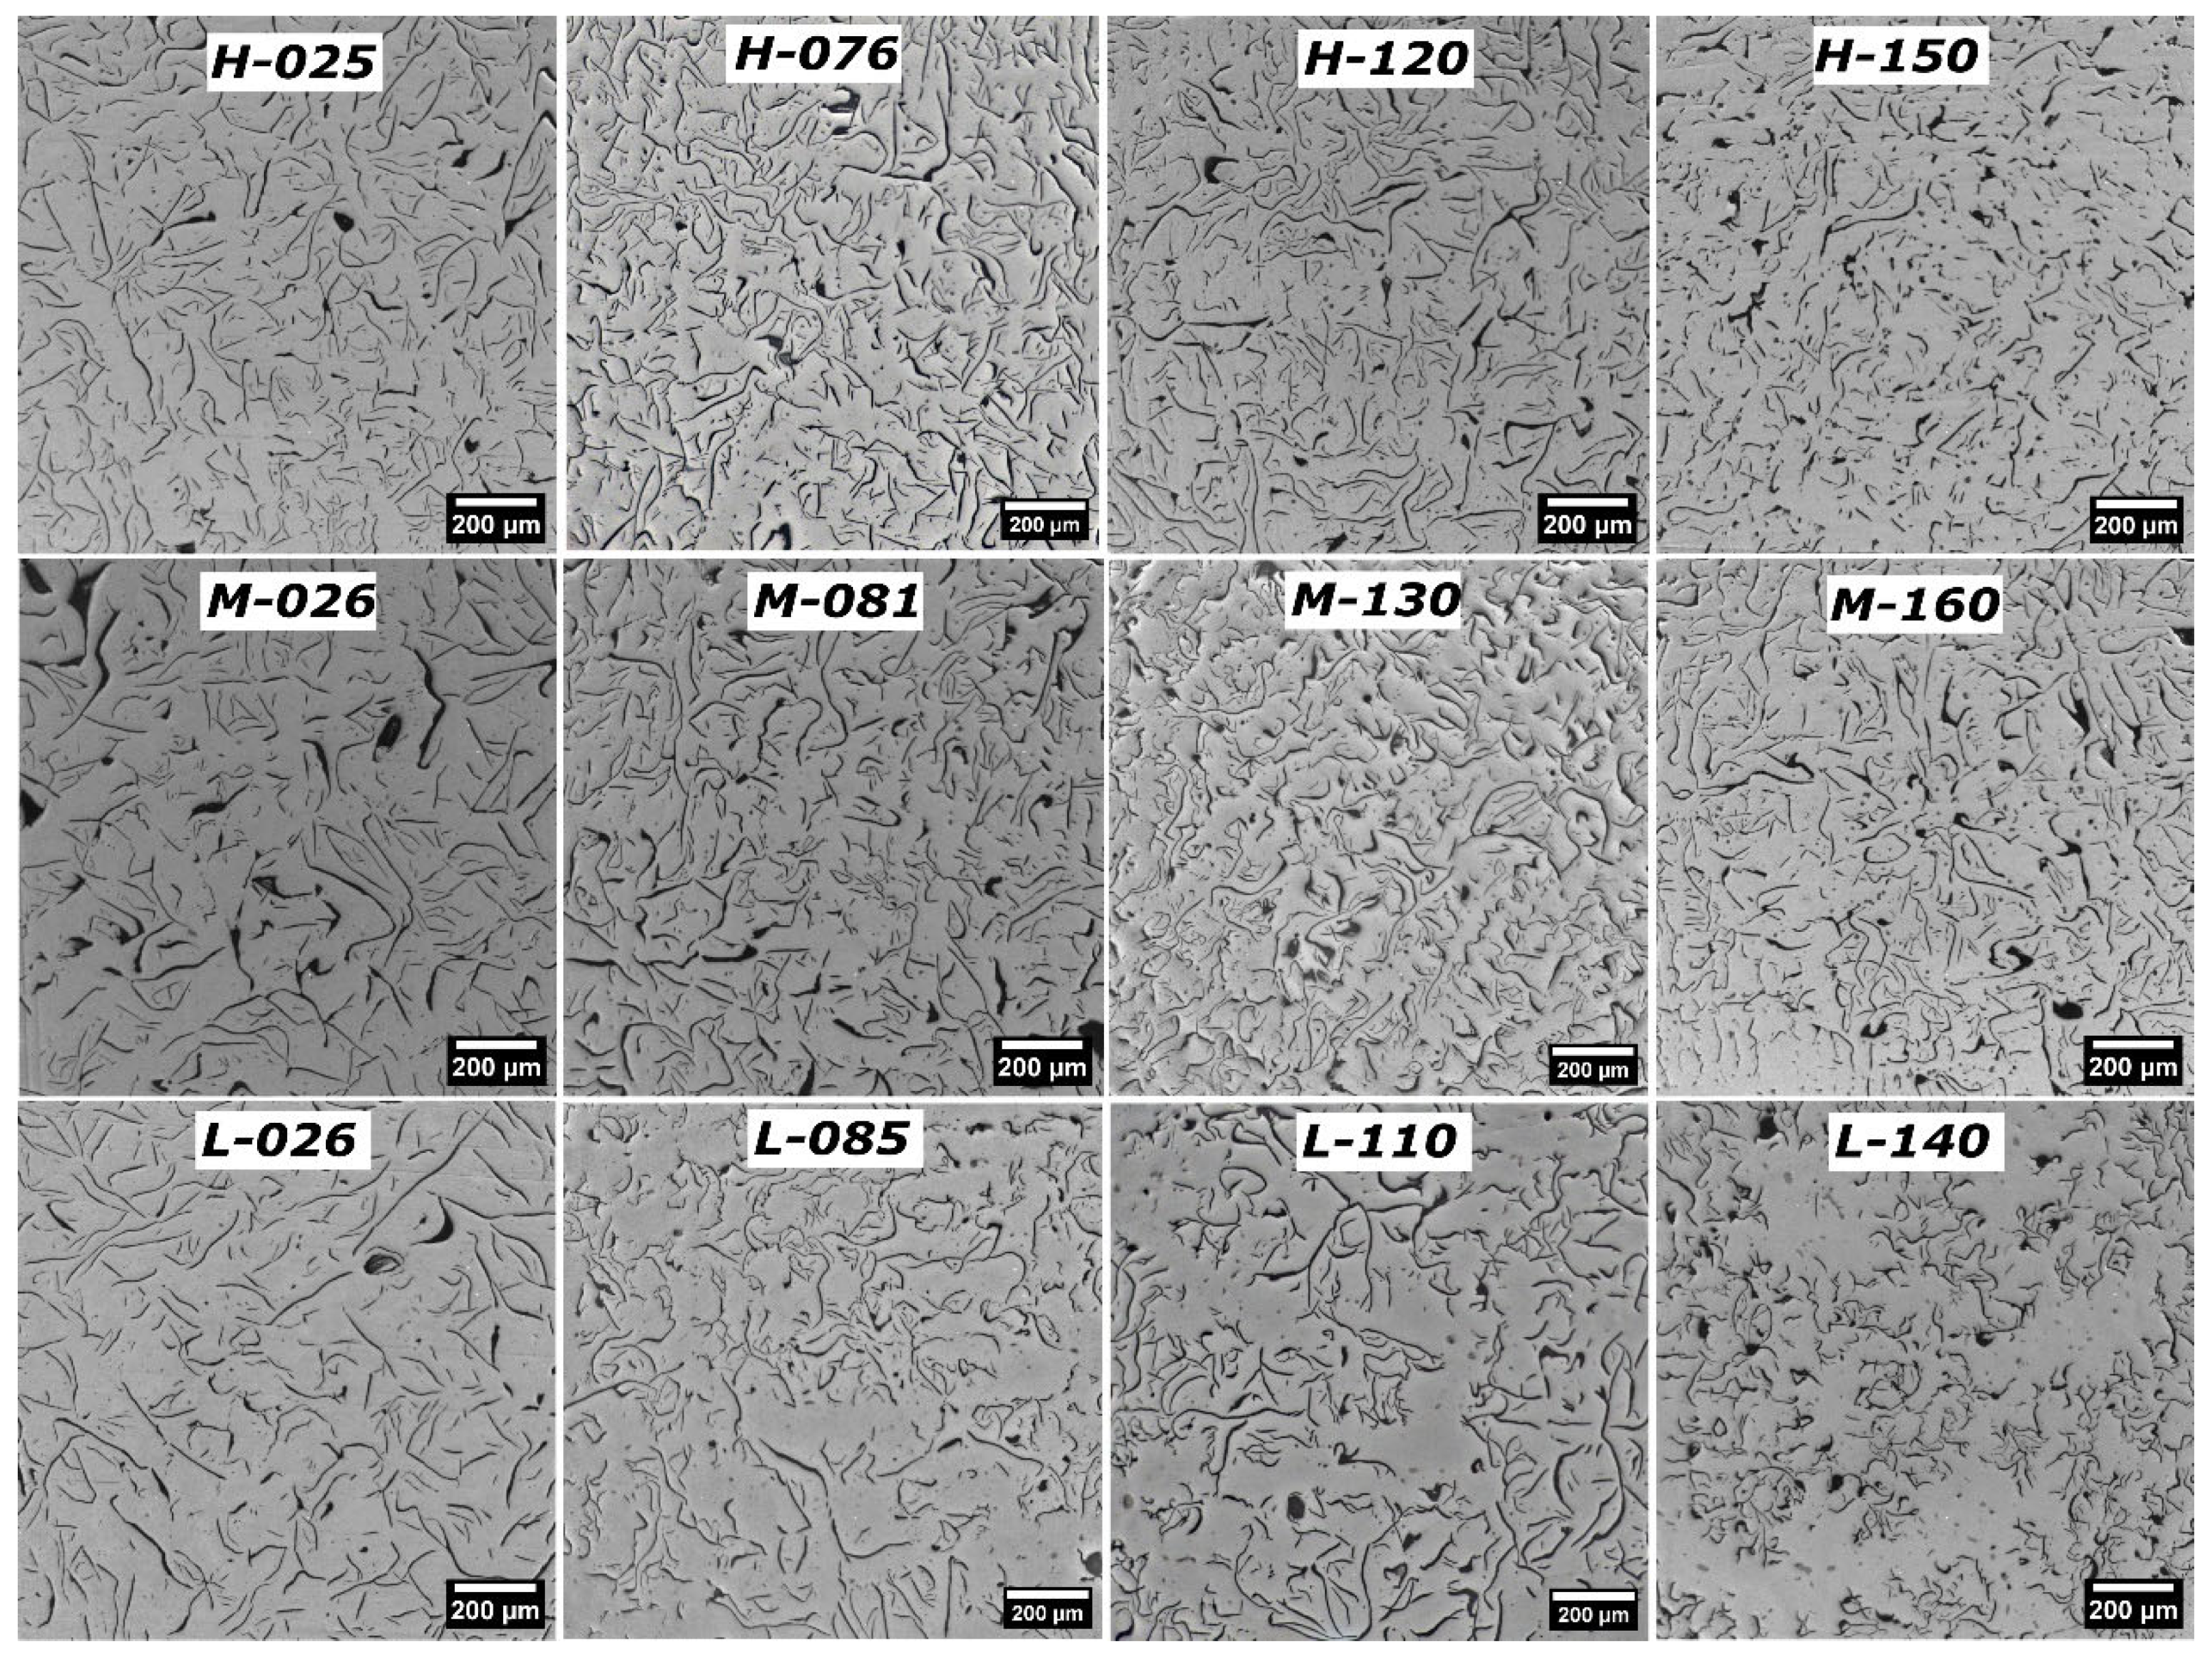
| L-026 | 0.026 | 0.14 | 0.1 | 0.004 | 2 | Type A | 62 | 373.4 |
| L-085 | 0.085 | 0.14 | 0 | 0.012 | 2 | Type A+ traces of type B | 48.3 | 328.9 |
| L-110 | 0.11 | 0.13 | −0.06 | 0.014 | 2 | Type B, traces of type A | 57.5 | 421.8 |
| L-140 | 0.14 | 0.12 | −0.12 | 0.017 | 3 | Type B | 38.9 | 198.9 |
| M-026 | 0.026 | 0.43 | 0.39 | 0.011 | 2 | Type A | 57.9 | 415.5 |
| M-081 | 0.081 | 0.43 | 0.29 | 0.035 | 2 | Type A | 58 | 456.3 |
| M-130 | 0.13 | 0.45 | 0.23 | 0.059 | 3 | Type A | 42.5 | 278.7 |
| M-160 | 0.16 | 0.41 | 0.14 | 0.066 | 2 | Type A, traces of type B | 42.2 | 346.1 |
| H-025 | 0.025 | 0.71 | 0.67 | 0.018 | 3 | Type A | 41 | 263.8 |
| H-076 | 0.076 | 0.71 | 0.58 | 0.054 | 2 | Type A | 48.9 | 337.4 |
| H-120 | 0.12 | 0.69 | 0.49 | 0.083 | 3 | Type A, traces of type B | 43.7 | 310.9 |
| H-150 | 0.15 | 0.69 | 0.44 | 0.104 | 3 | Type A | 34.1 | 207.2 |
| x | Sulfur | Manganese | Mnex | Free S | |||||
|---|---|---|---|---|---|---|---|---|---|
| y | |||||||||
| R2 | m | R2 | m | R2 | m | R2 | m | ||
| Feret avg | 0.39 | −114.2 | 0.2 | −16.5 | 0.05 | −7.6 | 0.05 | −56.5 | |
| Feret max | 0.18 | −707.1 | 0.06 | −83 | 0.01 | −31.4 | 0.036 | −423.8 | |
| LSP avg | 0.29 | −120.9 | 0.25 | −23.04 | 0.09 | −13.1 | 0.007 | −25.8 | |
| LSP max | 0.1 | −823.1 | 0.07 | −138.2 | 0.03 | −74.5 | 0.002 | −133.9 | |
| FL avg | 0.47 | −98.5 | 0.15 | −11.3 | 0.02 | −3.9 | 0.15 | −74.3 | |
| FL max | 0.39 | −580 | 0.01 | −18.8 | 0.01 | 19.5 | 0.23 | −607.4 | |
| %BLSP | 0.36 | 99.4 | 0.38 | −20.7 | 0.6 | −24 | 0.86 | 207.4 | |
| %BN | 0.48 | 93.7 | 0.3 | −15.2 | 0.57 | −19.4 | 0.83 | 165.7 | |
| Cells count | 0.32 | 619.8 | 0.15 | −85.8 | 0.3 | −115.4 | 0.72 | 1243.7 | |
Disclaimer/Publisher’s Note: The statements, opinions and data contained in all publications are solely those of the individual author(s) and contributor(s) and not of MDPI and/or the editor(s). MDPI and/or the editor(s) disclaim responsibility for any injury to people or property resulting from any ideas, methods, instructions or products referred to in the content. |
© 2025 by the authors. Licensee MDPI, Basel, Switzerland. This article is an open access article distributed under the terms and conditions of the Creative Commons Attribution (CC BY) license (https://creativecommons.org/licenses/by/4.0/).
Share and Cite
De Santiago-Méndez, L.F.; Castro-Román, M.d.J.; Herrera-Trejo, M.; Mancha-Molinar, H.; Bravo, B. Influence of S and Mn Initial Concentrations on the Graphite Branching in Gray Cast Iron as Quantified by 2D Image Analysis. Materials 2025, 18, 4837. https://doi.org/10.3390/ma18214837
De Santiago-Méndez LF, Castro-Román MdJ, Herrera-Trejo M, Mancha-Molinar H, Bravo B. Influence of S and Mn Initial Concentrations on the Graphite Branching in Gray Cast Iron as Quantified by 2D Image Analysis. Materials. 2025; 18(21):4837. https://doi.org/10.3390/ma18214837
Chicago/Turabian StyleDe Santiago-Méndez, Luis Filiberto, Manuel de Jesús Castro-Román, Martín Herrera-Trejo, Hector Mancha-Molinar, and Beñat Bravo. 2025. "Influence of S and Mn Initial Concentrations on the Graphite Branching in Gray Cast Iron as Quantified by 2D Image Analysis" Materials 18, no. 21: 4837. https://doi.org/10.3390/ma18214837
APA StyleDe Santiago-Méndez, L. F., Castro-Román, M. d. J., Herrera-Trejo, M., Mancha-Molinar, H., & Bravo, B. (2025). Influence of S and Mn Initial Concentrations on the Graphite Branching in Gray Cast Iron as Quantified by 2D Image Analysis. Materials, 18(21), 4837. https://doi.org/10.3390/ma18214837


