1. Introduction
Ultra-high-performance concrete (UHPC) is a next-generation cementitious composite, and it is renowned for its exceptional mechanical properties and long-term durability. With compressive strengths exceeding 150 MPa, superior ductility, low permeability, and enhanced crack resistance, UHPC has attracted growing interest for its potential in structural engineering applications [
1]. In the field of civil engineering, its significance lies in its capacity to enhance structural durability and safety, reduce material consumption, and align with sustainable development goals [
2,
3]. As fundamental load-bearing components, UHPC beams are widely utilized in bridges, residential buildings, commercial facilities, and other infrastructure. A thorough understanding of their fundamental mechanical behavior is essential for advancing UHPC’s practical application in engineering contexts [
4]. Recent developments in resilient and self-centering structural systems [
5] further demonstrate the growing demand for high-performance materials, such as UHPC, in improving post-earthquake recoverability and energy-dissipation capacity. While the flexural strength of UHPC beams can be reliably estimated using the plane section assumption, accurately predicting their shear strength capacity (SSC) remains challenging. This difficulty arises primarily from the incorporation of fibers, which significantly alter the shear behavior by bridging cracks and enhancing post-cracking resistance. The fiber bridging effect at inclined shear cracks plays a pivotal role and cannot be neglected. Consequently, traditional shear design models often fall short in accurately estimating the SSC of UHPC beams. Furthermore, the SSC is influenced by a complex interplay of multiple parameters, including cross-sectional geometry, shear span ratio, material strength, reinforcement ratio, and fiber characteristics. These factors are strongly interrelated, making it difficult for conventional analytical models to capture the underlying nonlinear relationships effectively. In response to these challenges, this study leverages big data and employs machine learning (ML) algorithms to develop a predictive model for the SSC of UHPC beams. The model is further extended into a probabilistic framework by constructing confidence intervals based on the predictive performance of each ML approach. Finally, a simplified empirical formula for estimating the SSC is proposed, derived from a comprehensive experimental database.
Numerous studies have been conducted to investigate the shear strength capacity (SSC) of UHPC beams, including the development of empirical formulas based on experimental data, adaptations of plastic theory, and modifications to the pressure field theory. Voo et al. [
6,
7] performed shear tests on I-shaped UHPC beams and proposed a simplified SSC model grounded in plastic theory, specifically the Two Bounds Theory. This method assumes a uniform fiber distribution and incorporates fiber reinforcement parameters to account for fiber-induced shear enhancement. The validity of the proposed model was confirmed through experimental results. Baby et al. [
8,
9,
10] tested 11 I-shaped UHPC beam specimens, with variables including UHPC type, the presence or absence of stirrups, and the type of longitudinal reinforcement (prestressed tendons vs. conventional steel bars). To address the lack of reliable tensile performance data for UHPC, a variable participation model was employed to estimate post-cracking tensile strength based on fiber–matrix interaction. Subsequently, a modified pressure field theory was used to develop an SSC prediction method tailored to UHPC beams. Xu et al. [
11] conducted shear tests on nine T-shaped UHPC beams and reported that using existing design codes to estimate SSC often results in overly conservative predictions. A new SSC formula was proposed based on regression analysis of the experimental data. Zheng et al. [
12] performed shear tests on nine prestressed thin-walled UHPC box beams and derived an SSC model by decomposing shear resistance into three components: fiber concrete, stirrups, and prestressing force. Qi et al. [
13,
14] investigated 11 T-shaped UHPC beams, formulating a theoretical model that considers the combined shear contribution from concrete, stirrups, and fibers. The model’s predictions showed good agreement with experimental results. Qiu et al. [
15] compiled a shear test database for UHPC beams and evaluated the predictive accuracy of SSC formulas in various national design codes. The findings revealed that most codes tend to be conservative to varying degrees. Despite these advances, most of the aforementioned models were developed and validated using relatively small experimental datasets. The highest reported prediction accuracy was R
2 = 0.80, as noted by Qiu et al. [
15], indicating the need for further enhancement through data-driven and probabilistic approaches.
In recent years, machine learning (ML) has shown strong potential for predicting the shear strength capacity (SSC) of reinforced-concrete (RC) components by capturing nonlinear, coupled effects that are difficult to express analytically [
16]. Beyond correlation measures such as R
2, recent studies on RC shear walls and columns increasingly report error magnitudes and dispersion/bias metrics (e.g., MAE, RMSE, MAPE, prediction-to-test ratios, CoV) to support engineering reliability [
17,
18,
19,
20,
21,
22,
23,
24,
25]. For shear walls, data-driven and stacked learners demonstrate that complementing R
2 with absolute/relative error gives a fuller view of robustness under varying geometry, concrete strength, reinforcement ratios, and loading conditions [
17,
18,
19,
20]. For columns, joints, slab–column punching, and RC beams, similar practice—benchmarking ML against empirical formulas using MAE/RMSE/MAPE or ratio/CoV—has been adopted to quantify practical accuracy and bias [
21,
22,
23,
24,
25].
Focusing on UHPC beams, Ye et al. (2023) [
26] trained ten algorithms on 532 tests and used SHAP to interpret feature effects (geometry and shear span ratio dominant); CatBoost reached R
2 = 0.943, and the study benchmarks models with error metrics in addition to R
2. Ergen and Katlav (2024) developed interpretable DL pipelines (LSTM/GRU with optimizers) and reported RMSE/MAE/MAPE together with R
2 for model comparison [
27]. Earlier, Solhmirzaei et al. (2020) proposed a unified ML framework for UHPC-beam failure-mode classification and SSC prediction from 360 tests; their genetic-programming expression achieved R
2 ≈ 0.92 with deployment-oriented reporting beyond correlation only [
28]. Ni and Duan (2022) [
29] curated 200 specimens and compared ANN/SVR/XGBoost; besides R
2 (0.8825/0.9016/0.8839), they explicitly reported prediction-to-test means (1.08/1.02/1.10) and coefficients of variation (0.28/0.21/0.28), directly quantifying bias and dispersion [
29].
Broader RC wall studies reinforce this error-aware reporting. Tian et al. [
19] showed that a stacking model achieved R
2 = 0.98 with CoV = 0.147 on the test set, while a DNN baseline reached RMSE ≈ 263 kN and R
2 ≈ 0.95; independent ML models had R
2 = 0.88–0.95 and CoV = 0.179–0.651 [
16]. Zhang et al. (2022) [
18] reported failure-mode accuracy > 95%, a mean predicted-to-tested strength ratio ≈ 1.01, and a predicted-to-tested ultimate drift ratio ≈ 1.08, thereby explicitly addressing bias and dispersion in addition to strength prediction [
18]. Across other RC components—columns [
21], beam–column joints [
22], slab–column punching [
23], conventional RC beams [
24], and synthetic-fiber RC beams [
25]—recent works likewise present MAE/RMSE (and, where available, MAPE or ratio/CoV) alongside R
2, supporting a more engineering-relevant assessment of robustness and practical reliability.
Recent contributions on UHPC + ML advance three complementary fronts. First, for the shear capacity of beams and joints, multiple studies show that interpretable ensembles and gradient-boosting methods (e.g., CatBoost/XGBoost/LightGBM) provide state-of-the-art accuracy and transparent feature attributions, often outperforming plain MLPs on tabular data [
30,
31,
32,
33,
34]; related work on the punching shear of post-tensioned UHPC slabs extends these benefits to slab systems [
32]. Second, for compressive and flexural strengths, recent papers corroborate the advantage of boosting pipelines and introduce CNN/NN variants and SHAP-based explanations for practical insight [
35,
36,
37,
38]. Third, explainable modeling and interface behavior (e.g., steel–UHPC slip) further emphasize engineering interpretability [
38,
39]. Across these studies, common themes include model transparency (via SHAP) and competitive performance of boosting, while typical gaps are heterogeneous or non-grouped validation protocols, limited reporting of calibrated uncertainty, and incomplete statements of applicability domains.
Although the above studies have shown that ML models can provide reliable predictions for SSC in both RC and UHPC members, several limitations remain, as follows:
(1) Underutilization of model complementarity:
Most existing studies focus on comparing individual ML models rather than integrating their complementary strengths. Future work should consider ensemble strategies that combine multiple ML algorithms to enhance both accuracy and robustness.
(2) Lack of uncertainty modeling:
The inherent uncertainty in SSC prediction has not been fully addressed. Probabilistic modeling techniques—such as prediction-interval construction (e.g., residual- or quantile-based) and supervised machine learning regression with cross-validated calibration—should be incorporated to better quantify prediction reliability.
(3) Incomplete evaluation across model types:
There is insufficient comparative analysis between different categories of ML models (e.g., single learners, ensemble methods, and deep learning). A more systematic evaluation is needed to identify the most suitable models for SSC prediction in UHPC beams.
(4) Limited accuracy of current design codes:
Existing national and international design specifications often fail to provide precise SSC predictions for UHPC beams, indicating the need for more data-driven, refined formulations.
To address these limitations, this study first establishes an experimental database containing 563 UHPC beam specimens exhibiting shear failure. Three categories of ML models—single, ensemble, and deep learning—are developed and evaluated under both default and optimized hyperparameter configurations. Model performances are then compared, and their outputs are integrated using a weighted ensemble approach based on prediction accuracy. A 95% confidence interval is constructed to capture uncertainty in SSC predictions. Finally, leveraging both the established database and existing Chinese code formulations, a simplified empirical equation is proposed for engineering applications.
Novelty and Contributions: This work advances UHPC beam shear capacity prediction in four concrete ways: (i) we assemble a large-scale database of 563 shear-failing UHPC beams spanning wide geometric, reinforcement, fiber, and loading attributes; (ii) we propose a multi-metric performance-weighted stacking model that fuses GBR, XGBoost, LightGBM, and CatBoost using MSE, MAE, RMSE, and R2 as weighting criteria (Equations (1)–(3)), achieving R2 = 0.96 with CoV = 0.17 on the test set; (iii) we develop a residual-based probabilistic framework that yields 95% confidence intervals with 95.1% empirical coverage; and (iv) we derive a design-oriented empirical formula calibrated on the database that outperforms multiple code provisions with R2 = 0.83. Collectively, the pipeline—from feature selection and cross-family model benchmarking to stacking, uncertainty quantification, and a practical design equation—provides a unified, data-driven, and reliability-aware solution for UHPC beam shear design.
2. Framework of Probabilistic Models
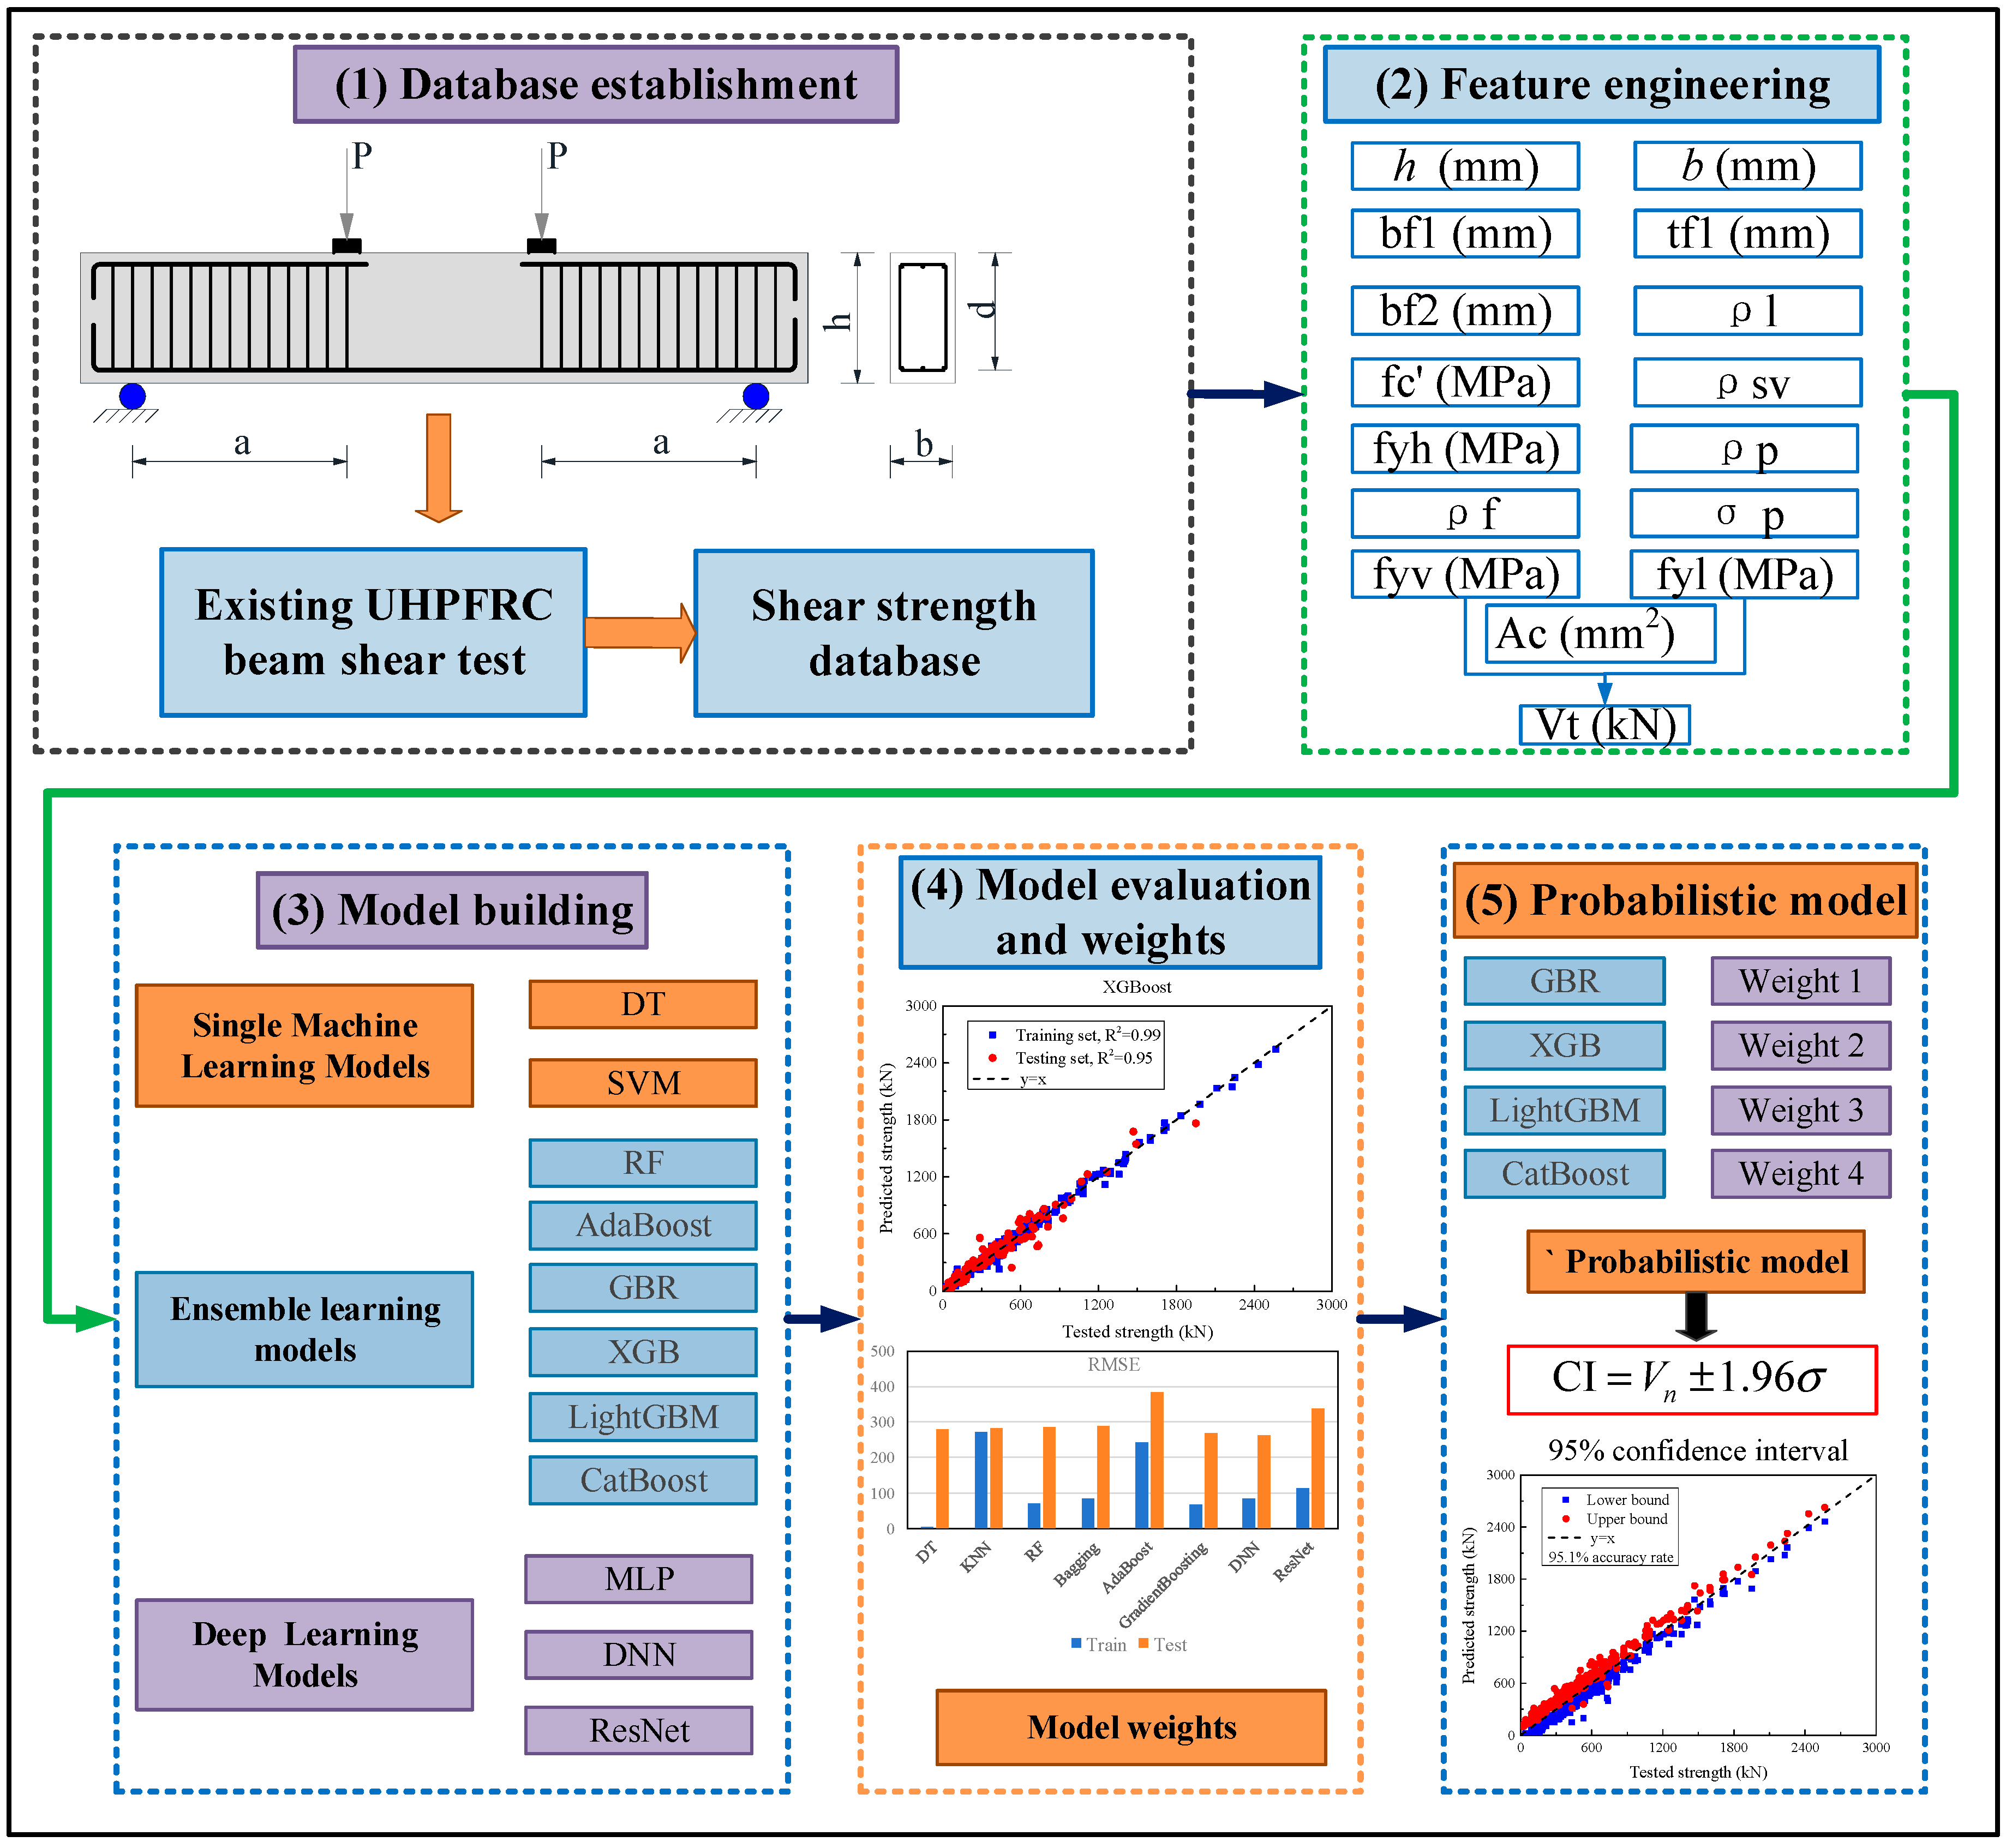
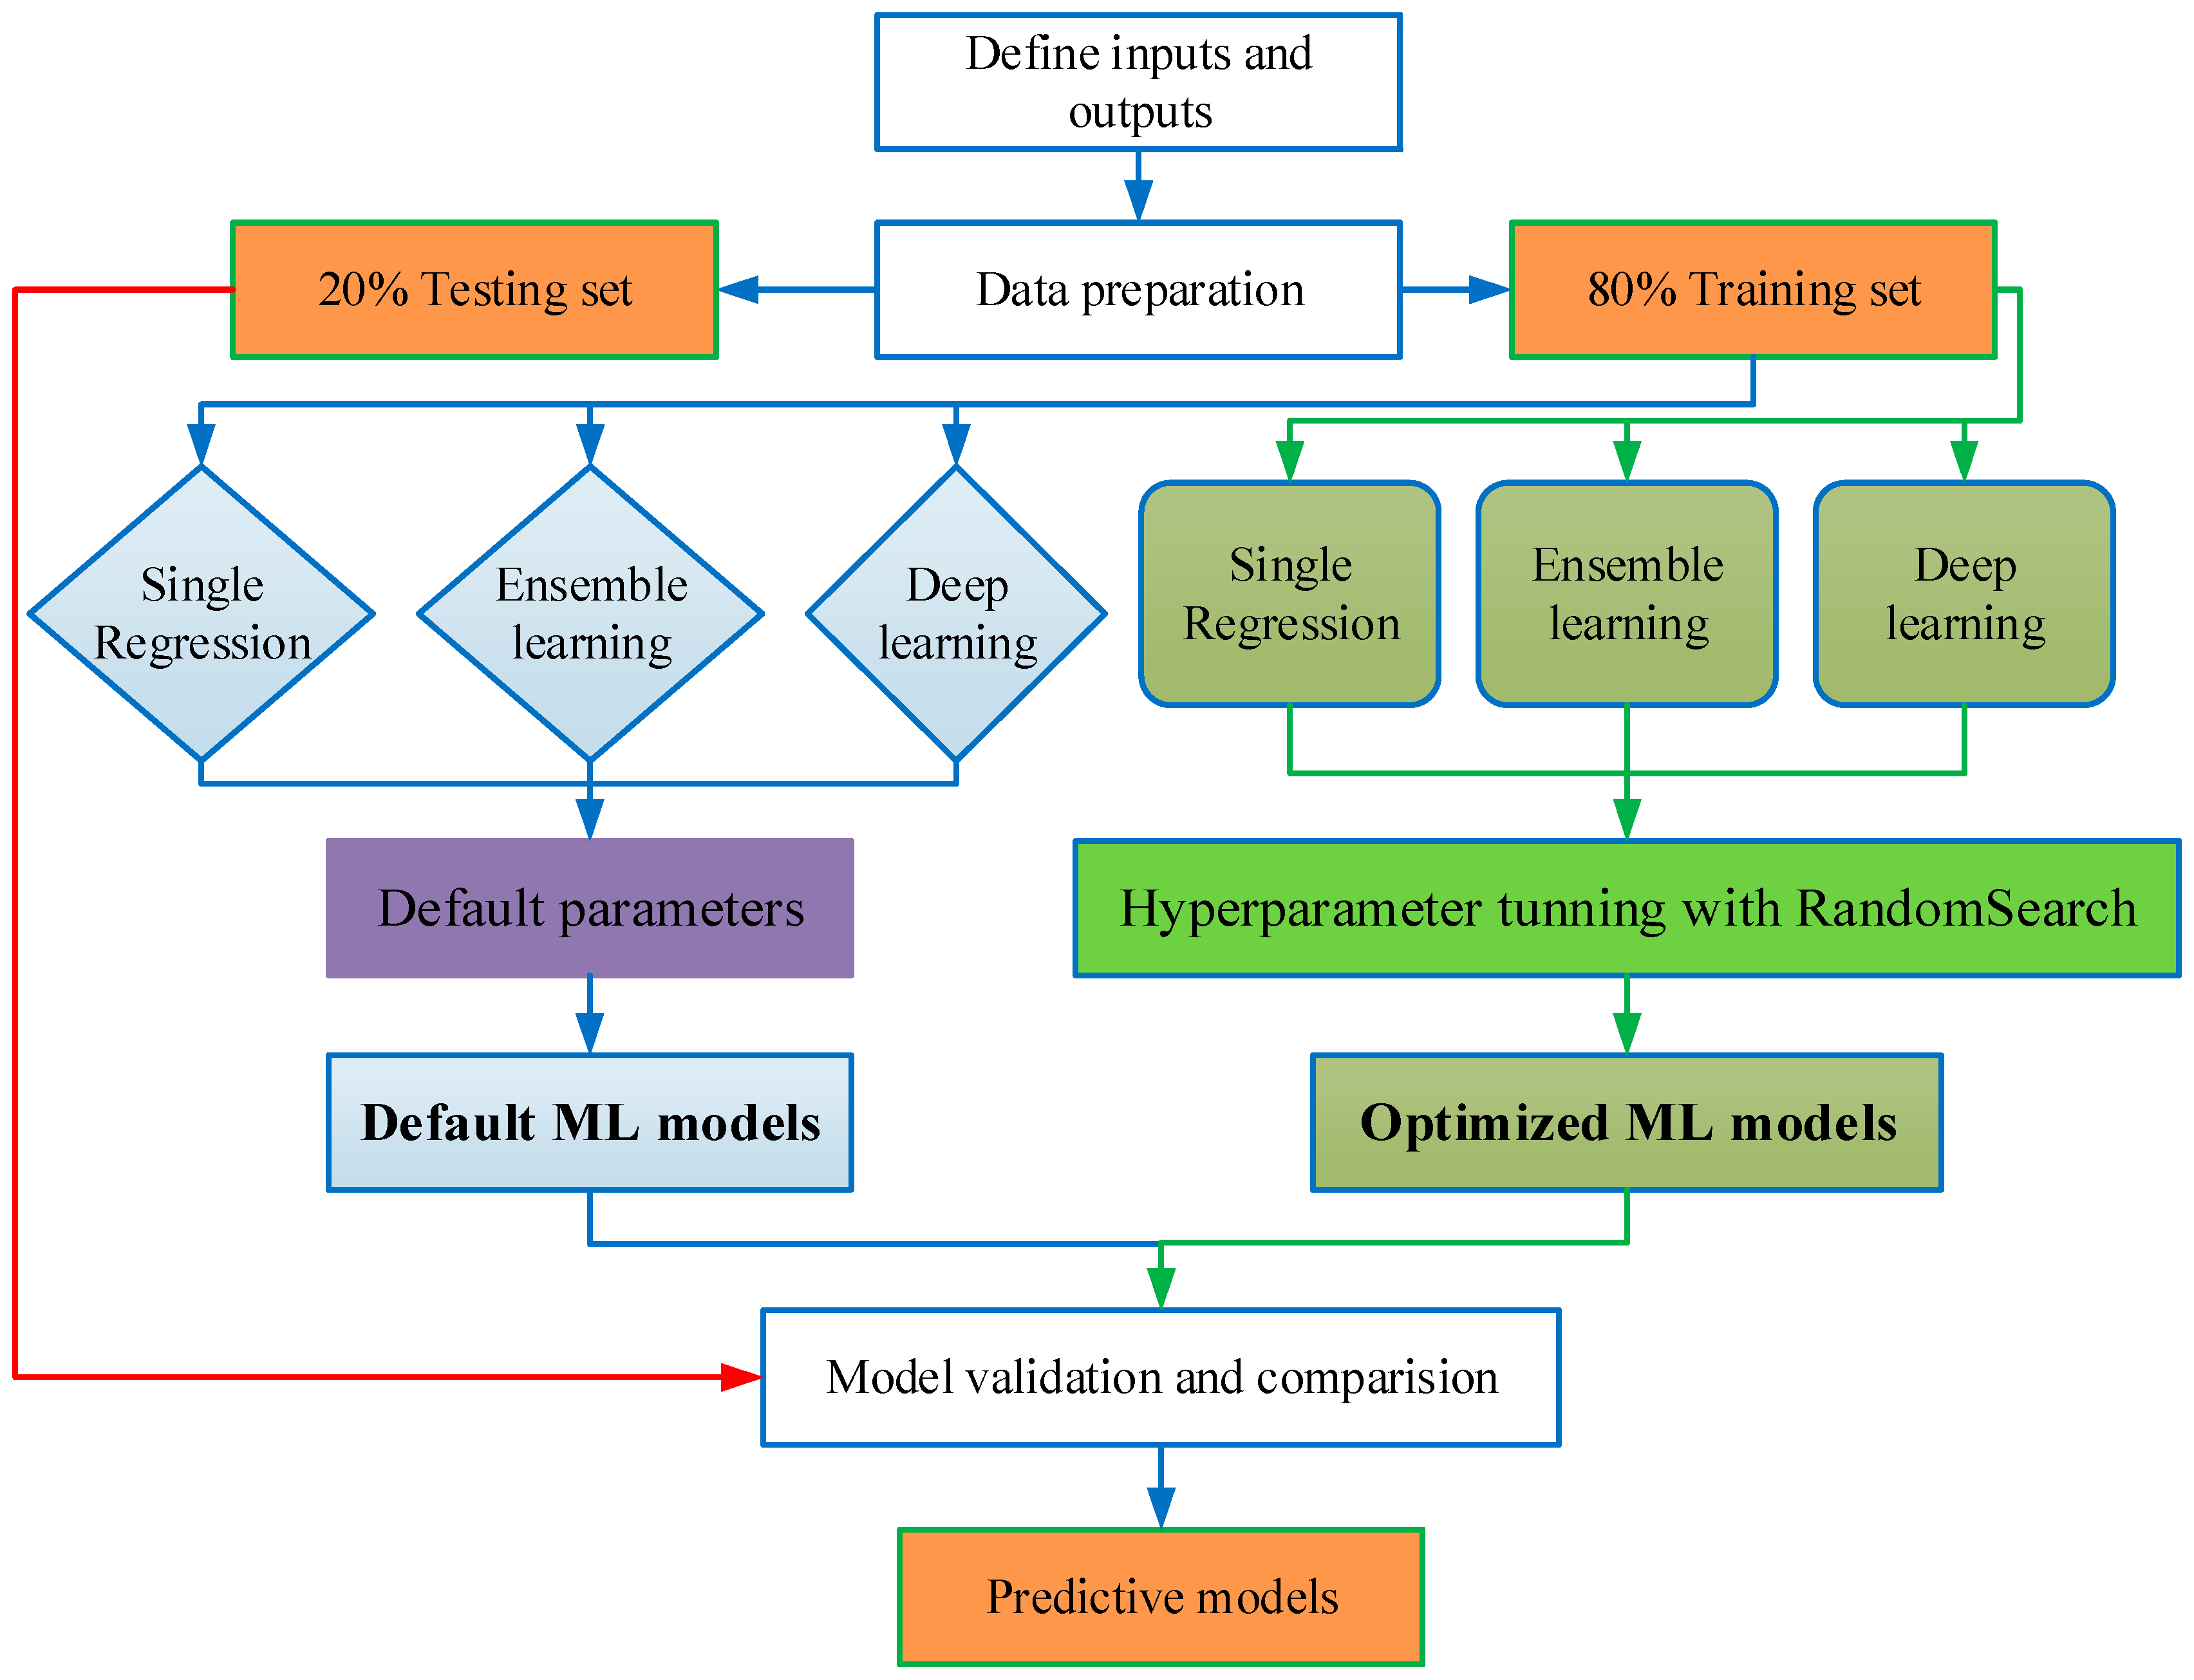
Figure 1 outlines the methodological framework for developing a probabilistic prediction model for the SSC of UHPC beams. The proposed framework consists of five key steps:
Step 1: Experimental Database Compilation
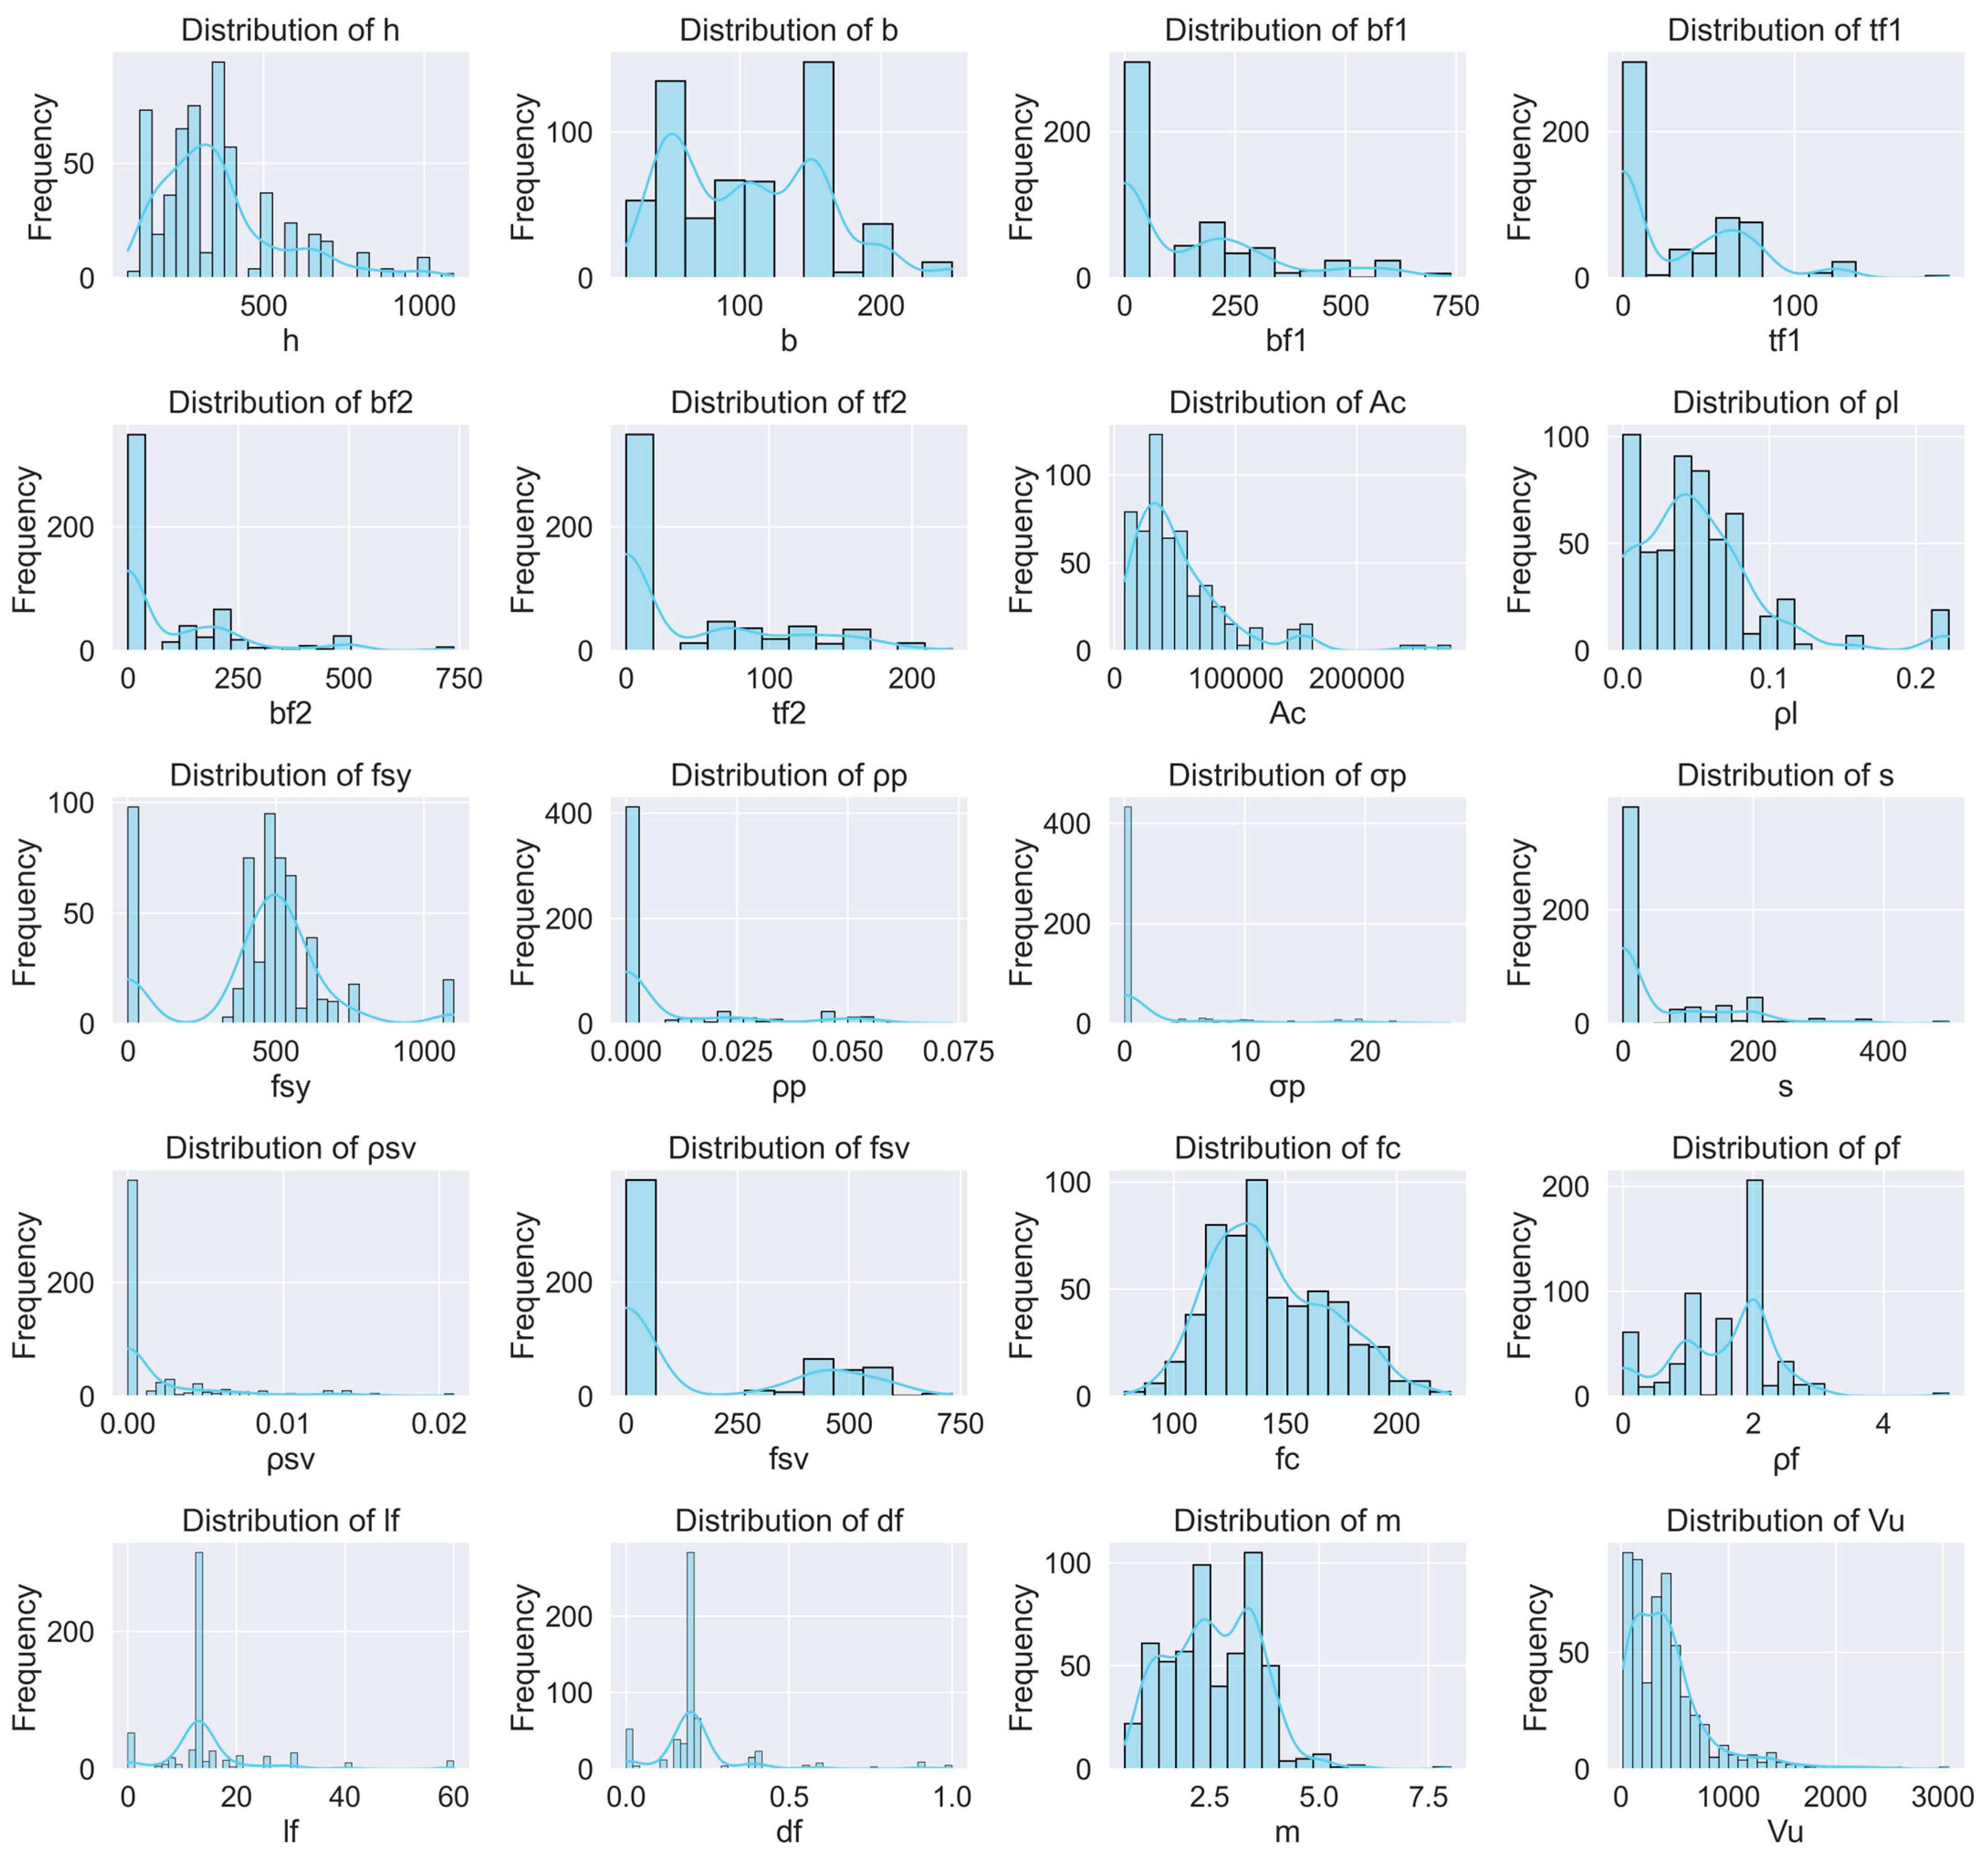
A comprehensive experimental database comprising 563 UHPC beam specimens exhibiting shear failure was constructed by aggregating data from the published literature.
Step 2: Feature Engineering
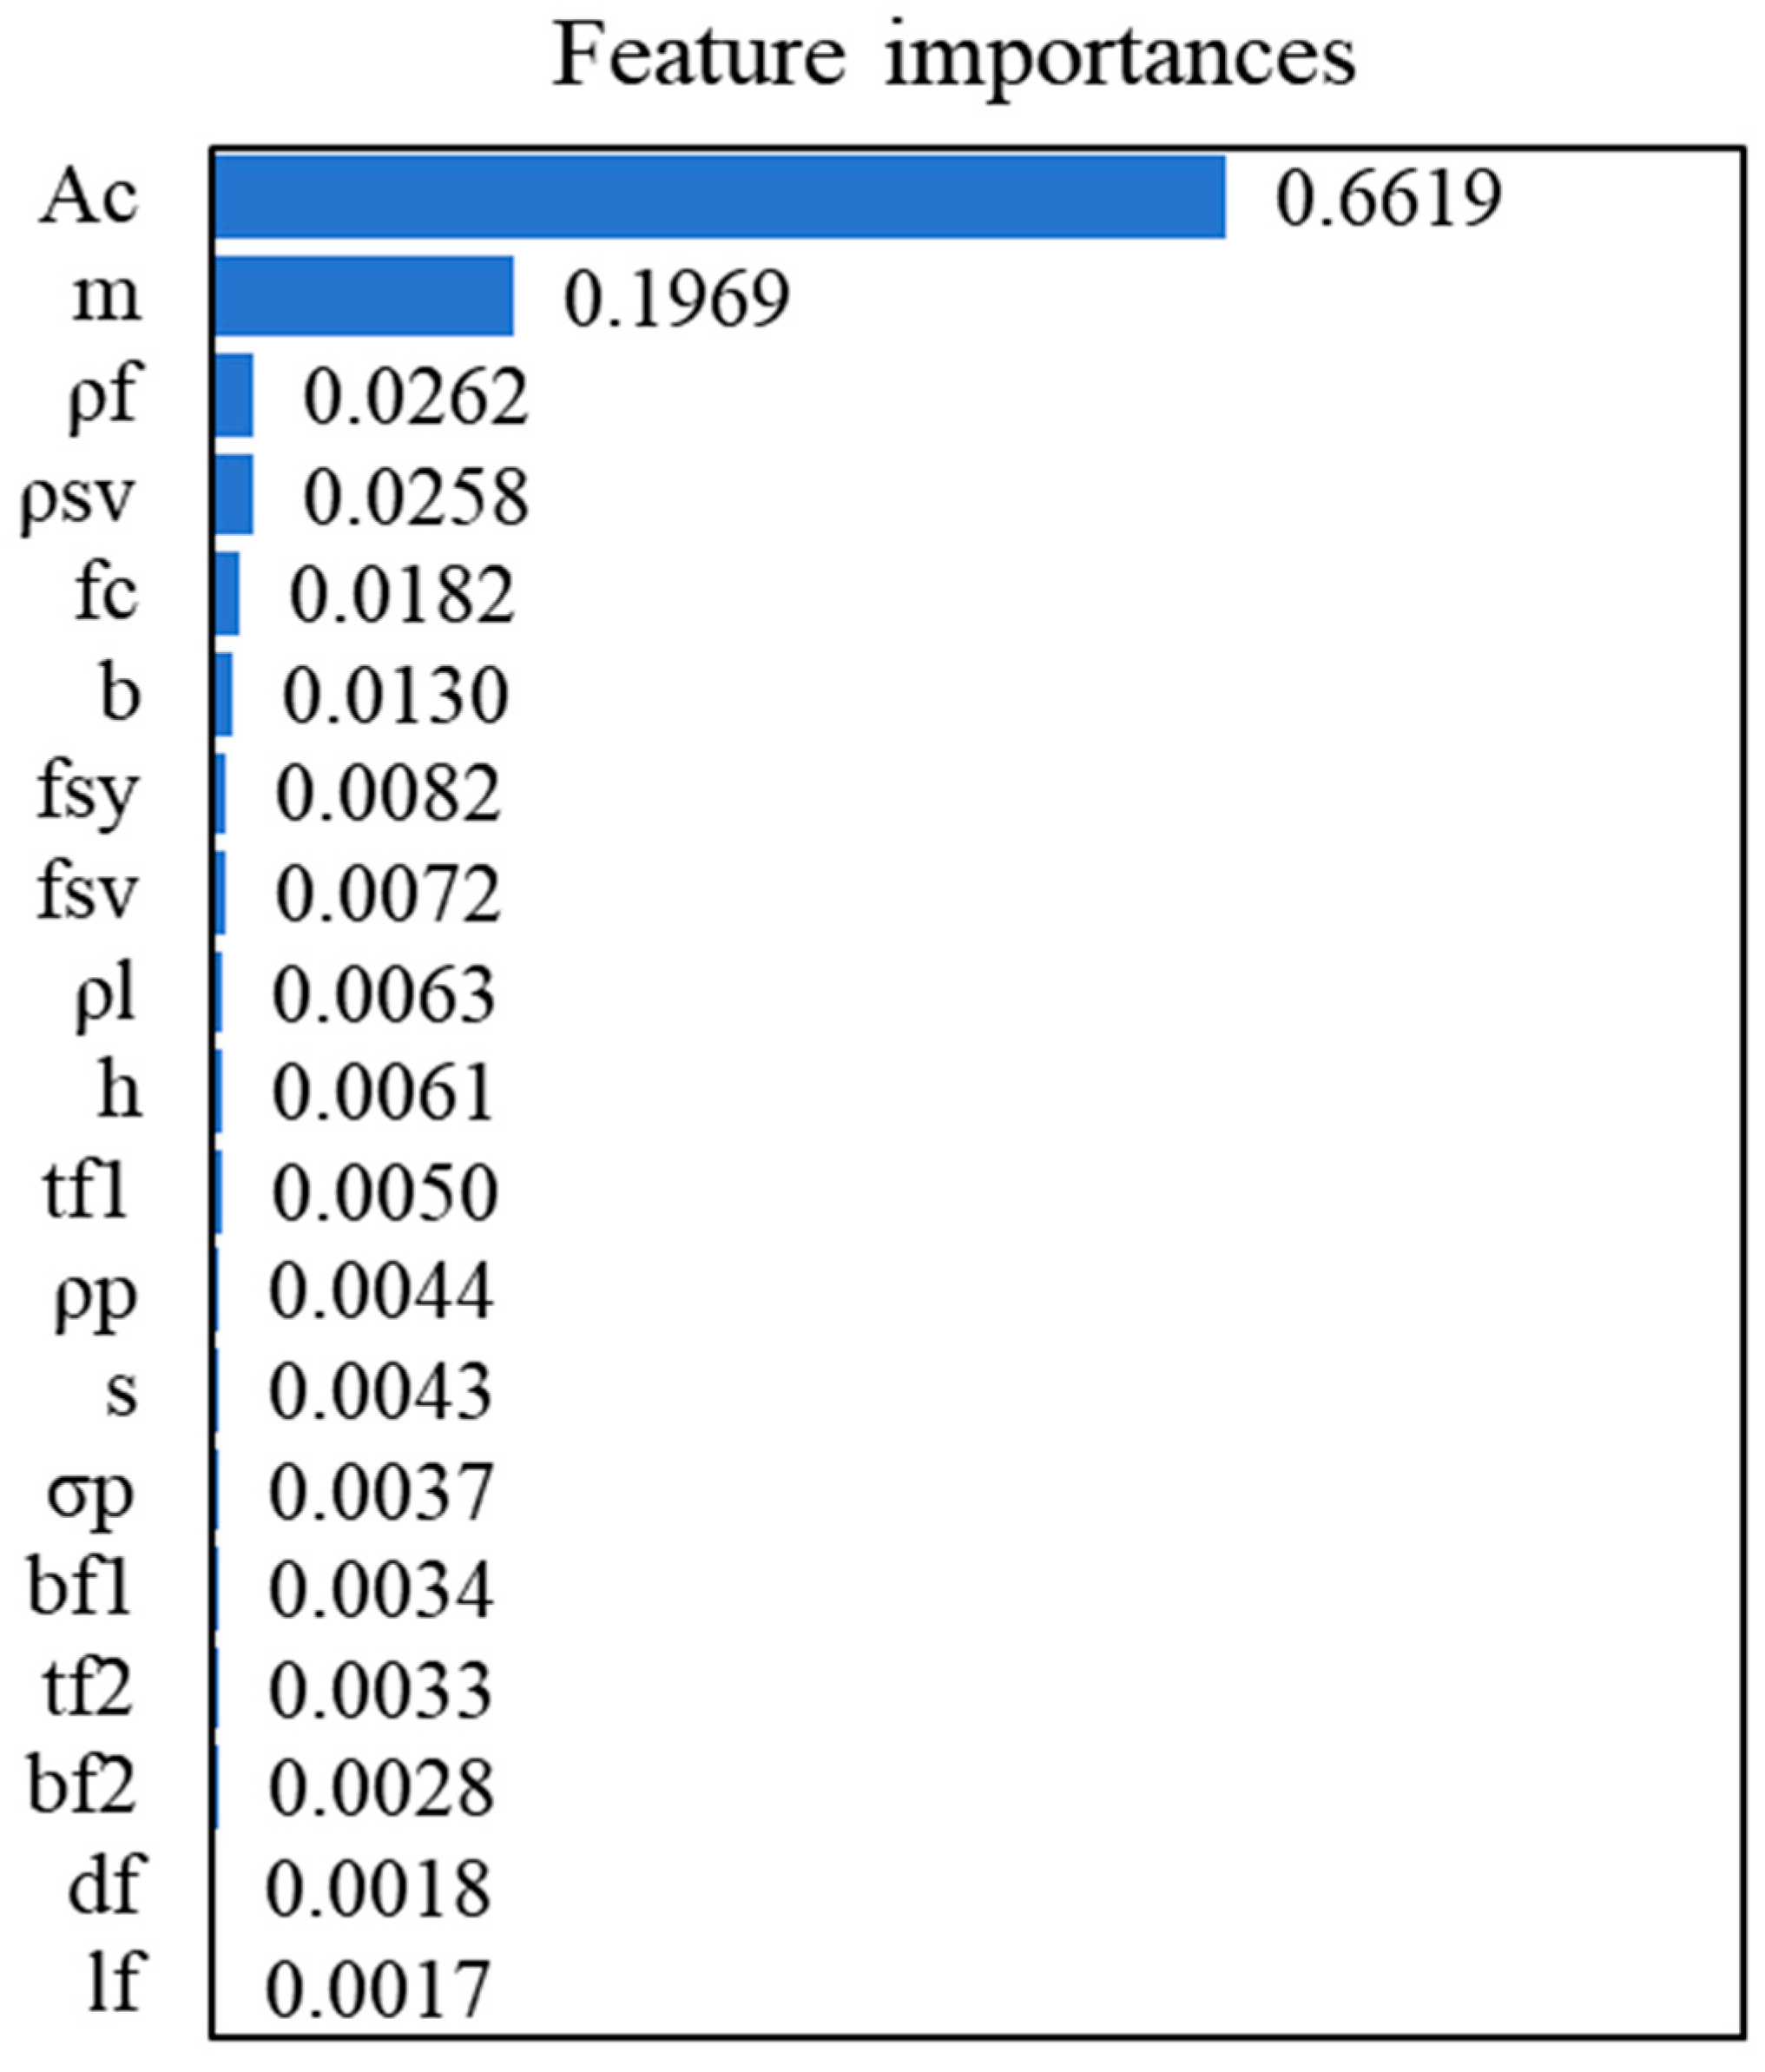
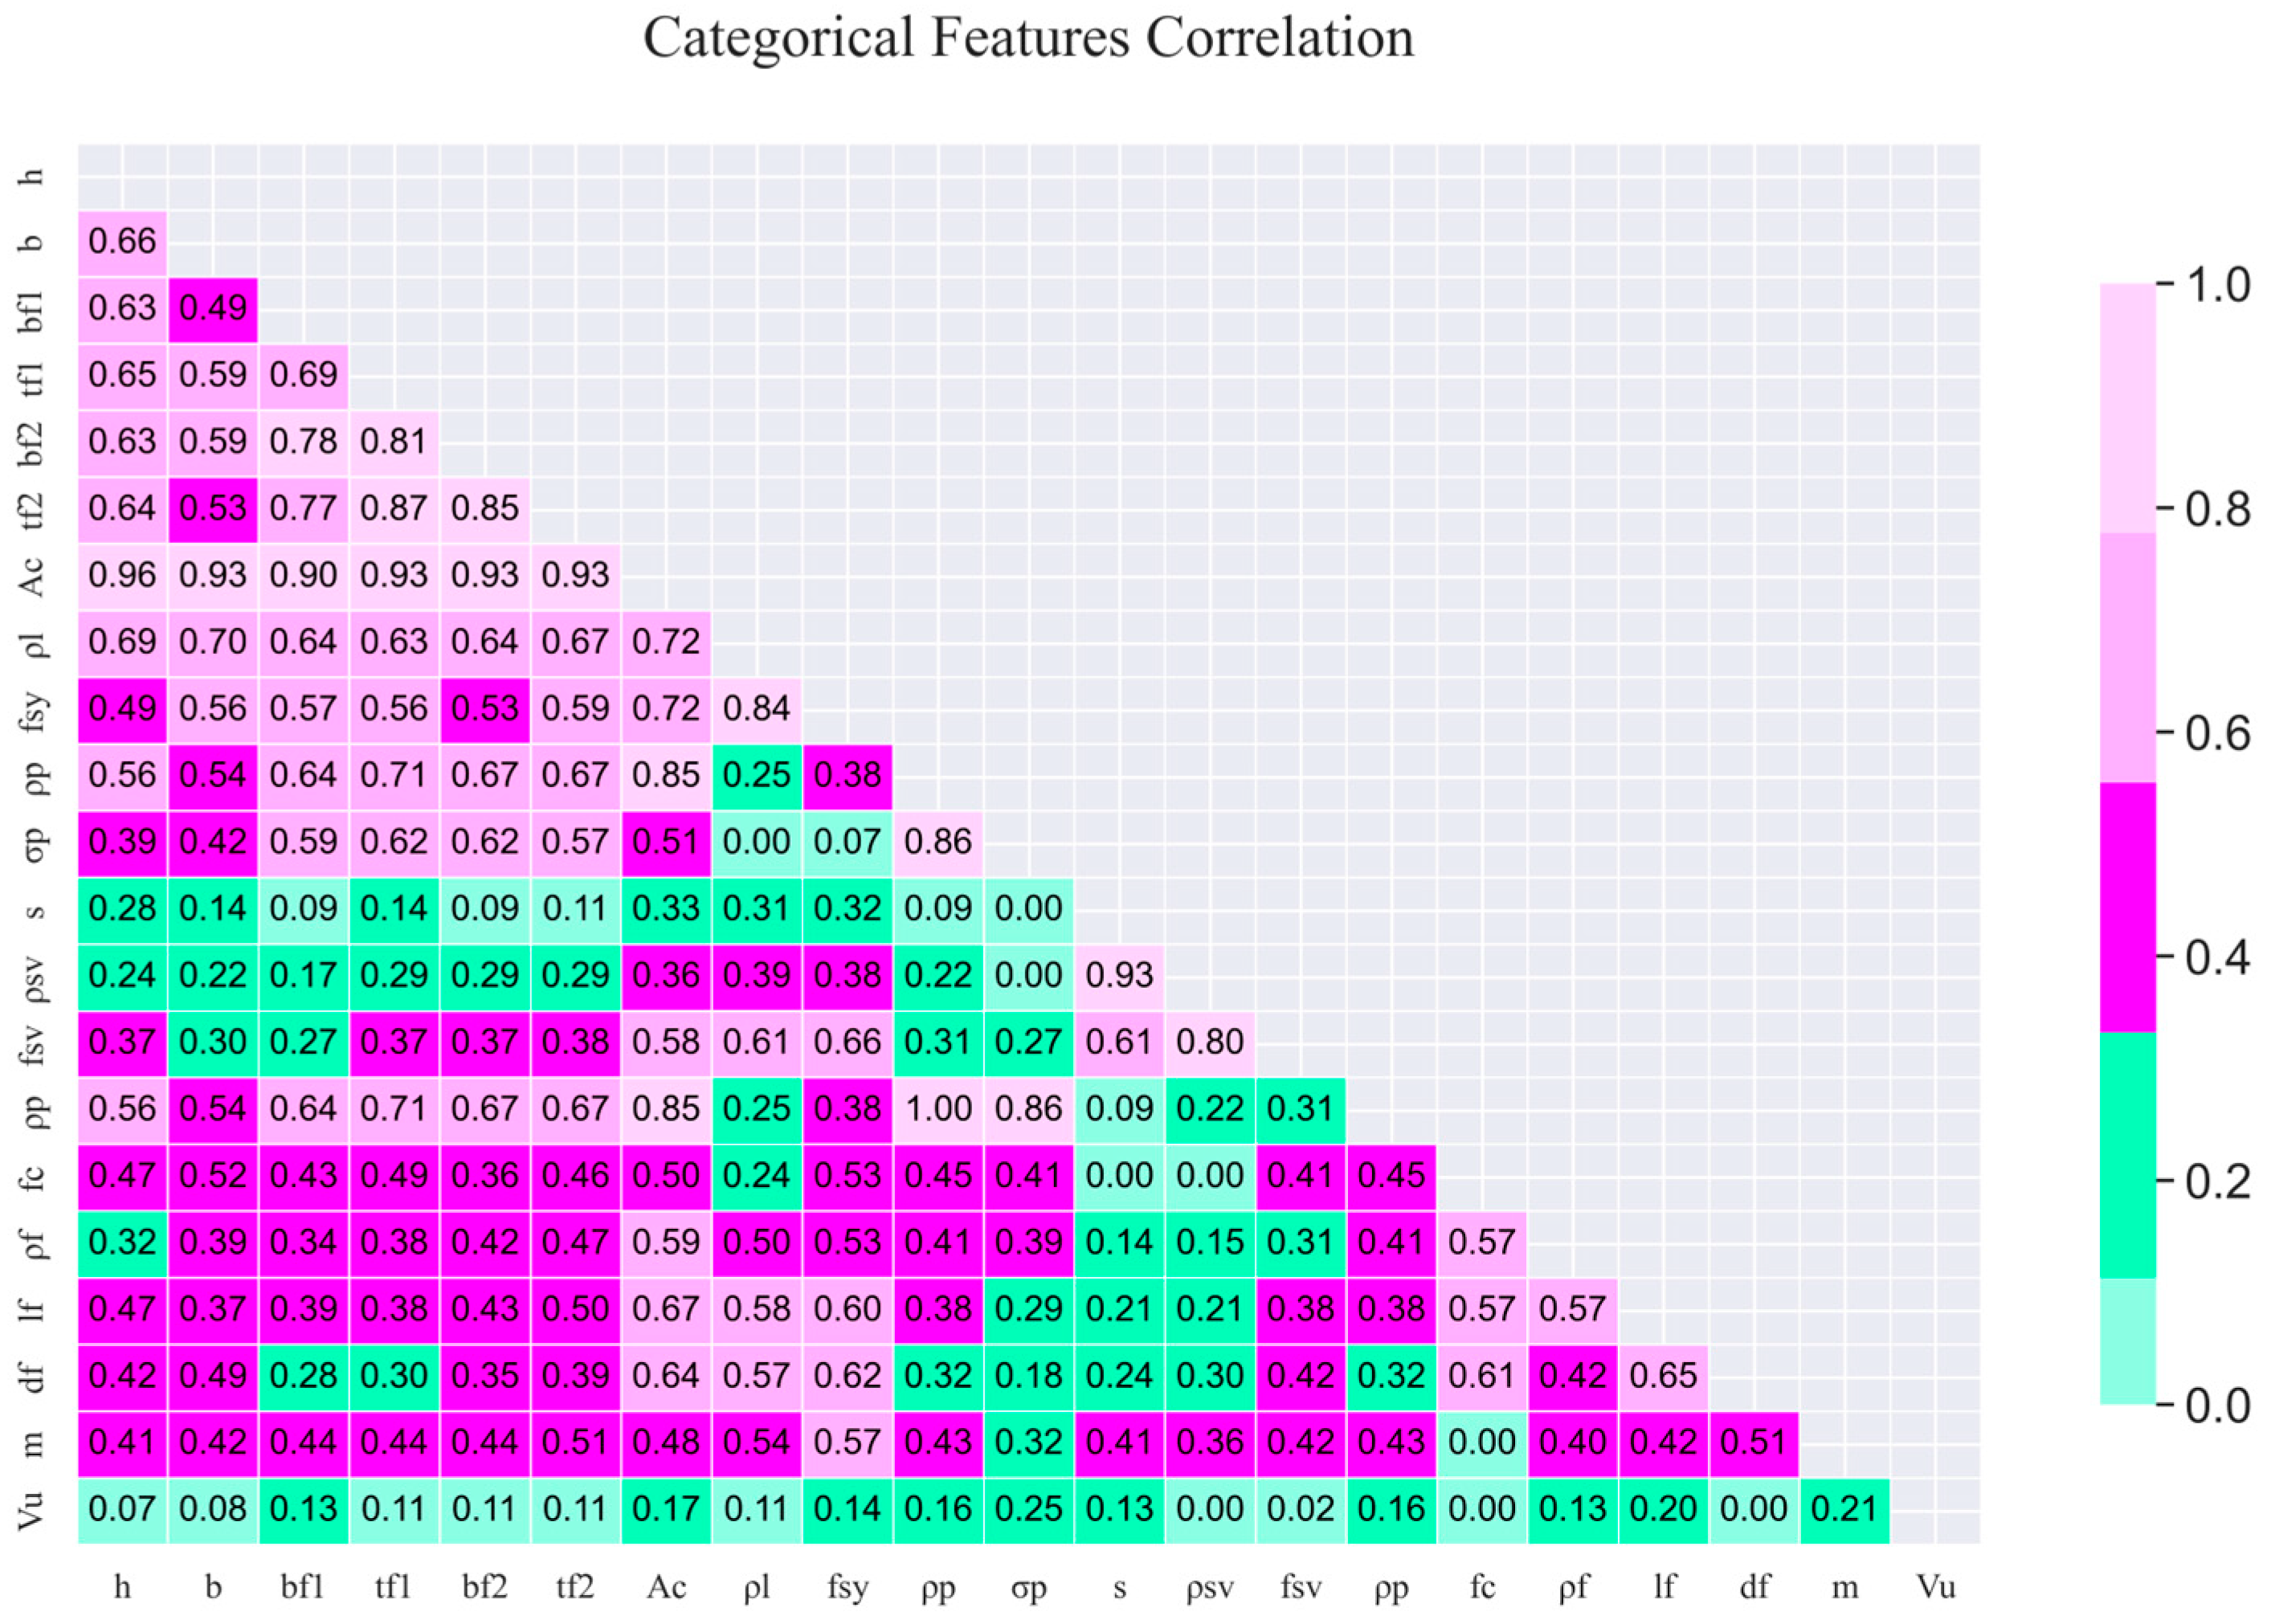
To identify the most influential input variables, feature importance scores were derived using a random forest (RF) regression algorithm. These scores were further analyzed in conjunction with Pearson’s correlation coefficients to eliminate redundant or weakly correlated features, thereby enhancing model efficiency through dimensionality reduction.
Step 3: Model Development
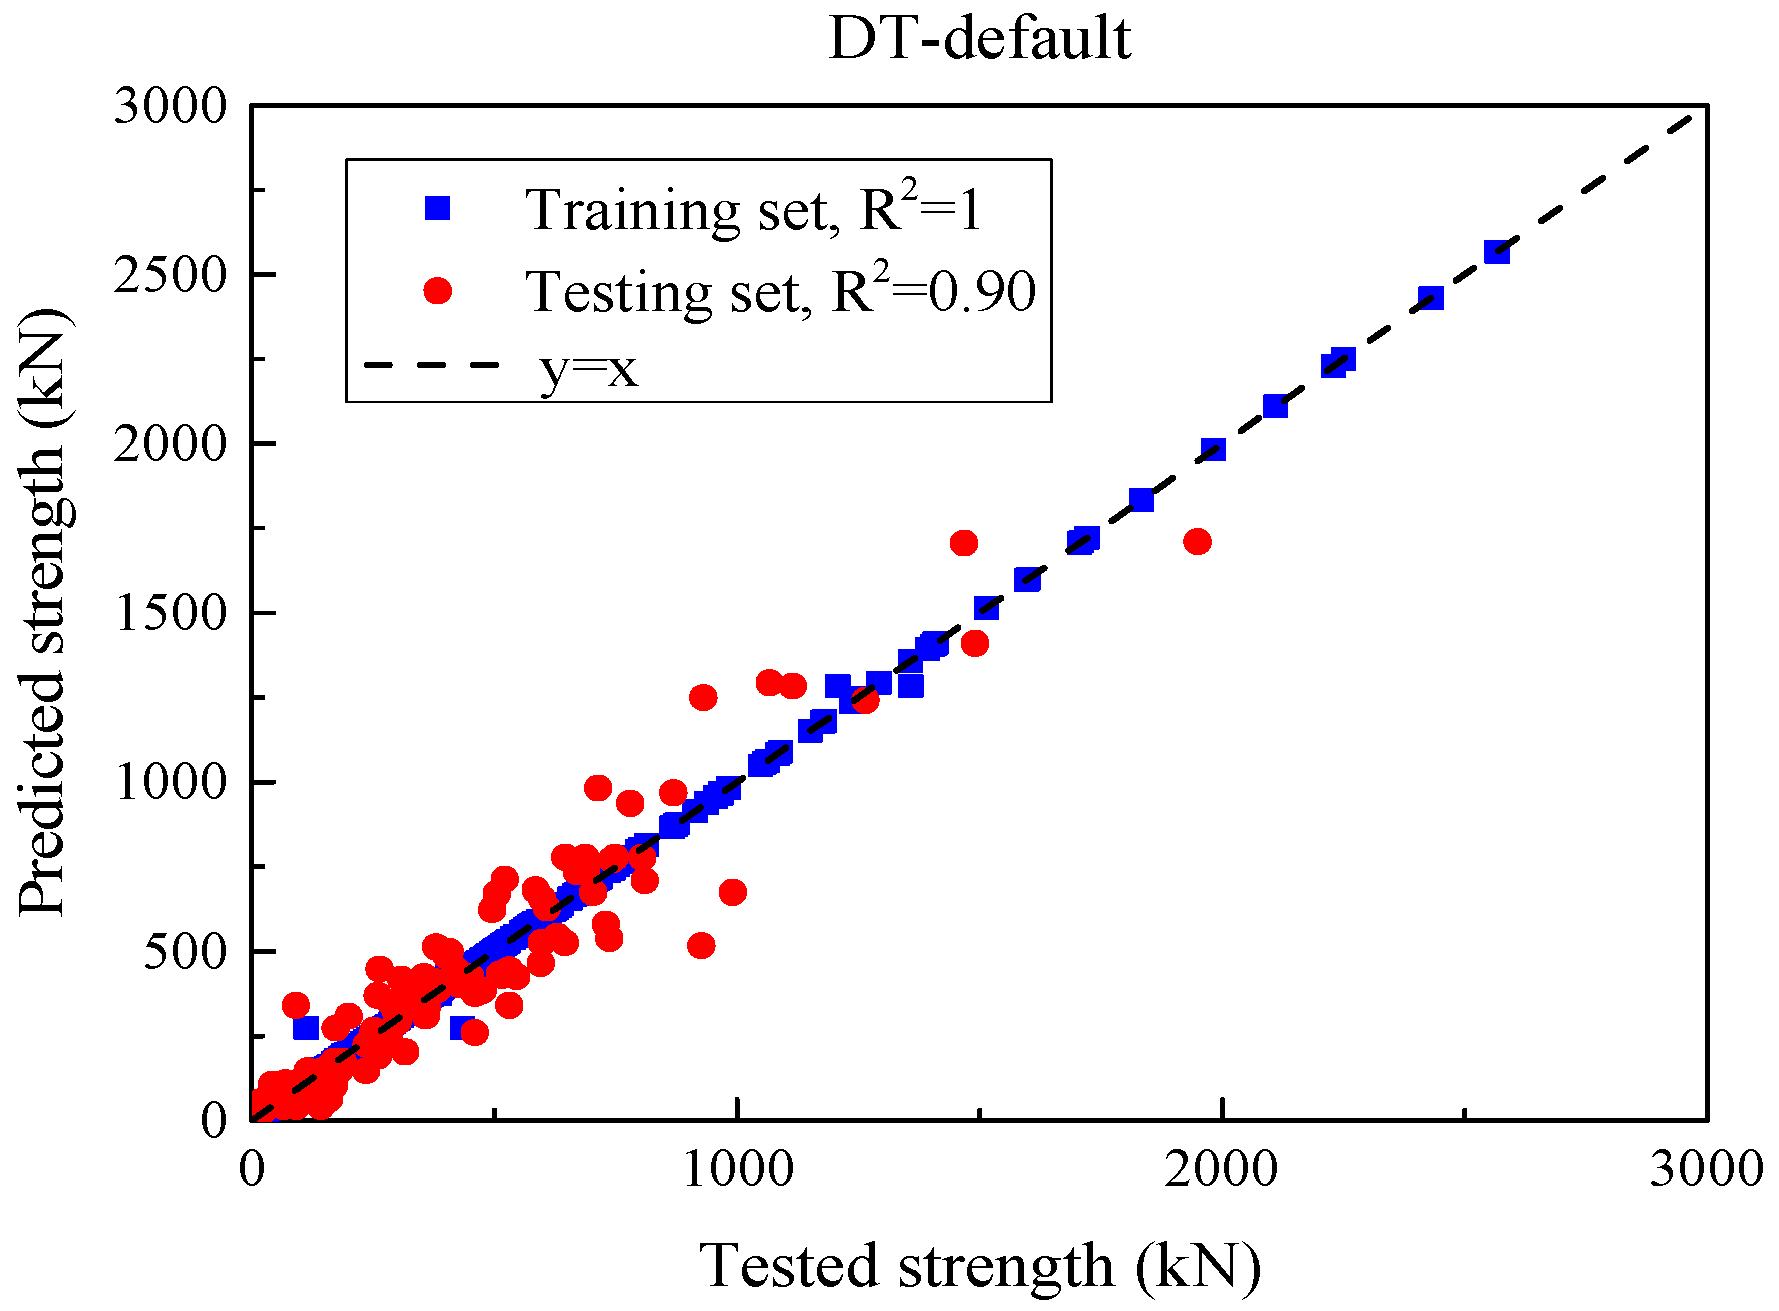
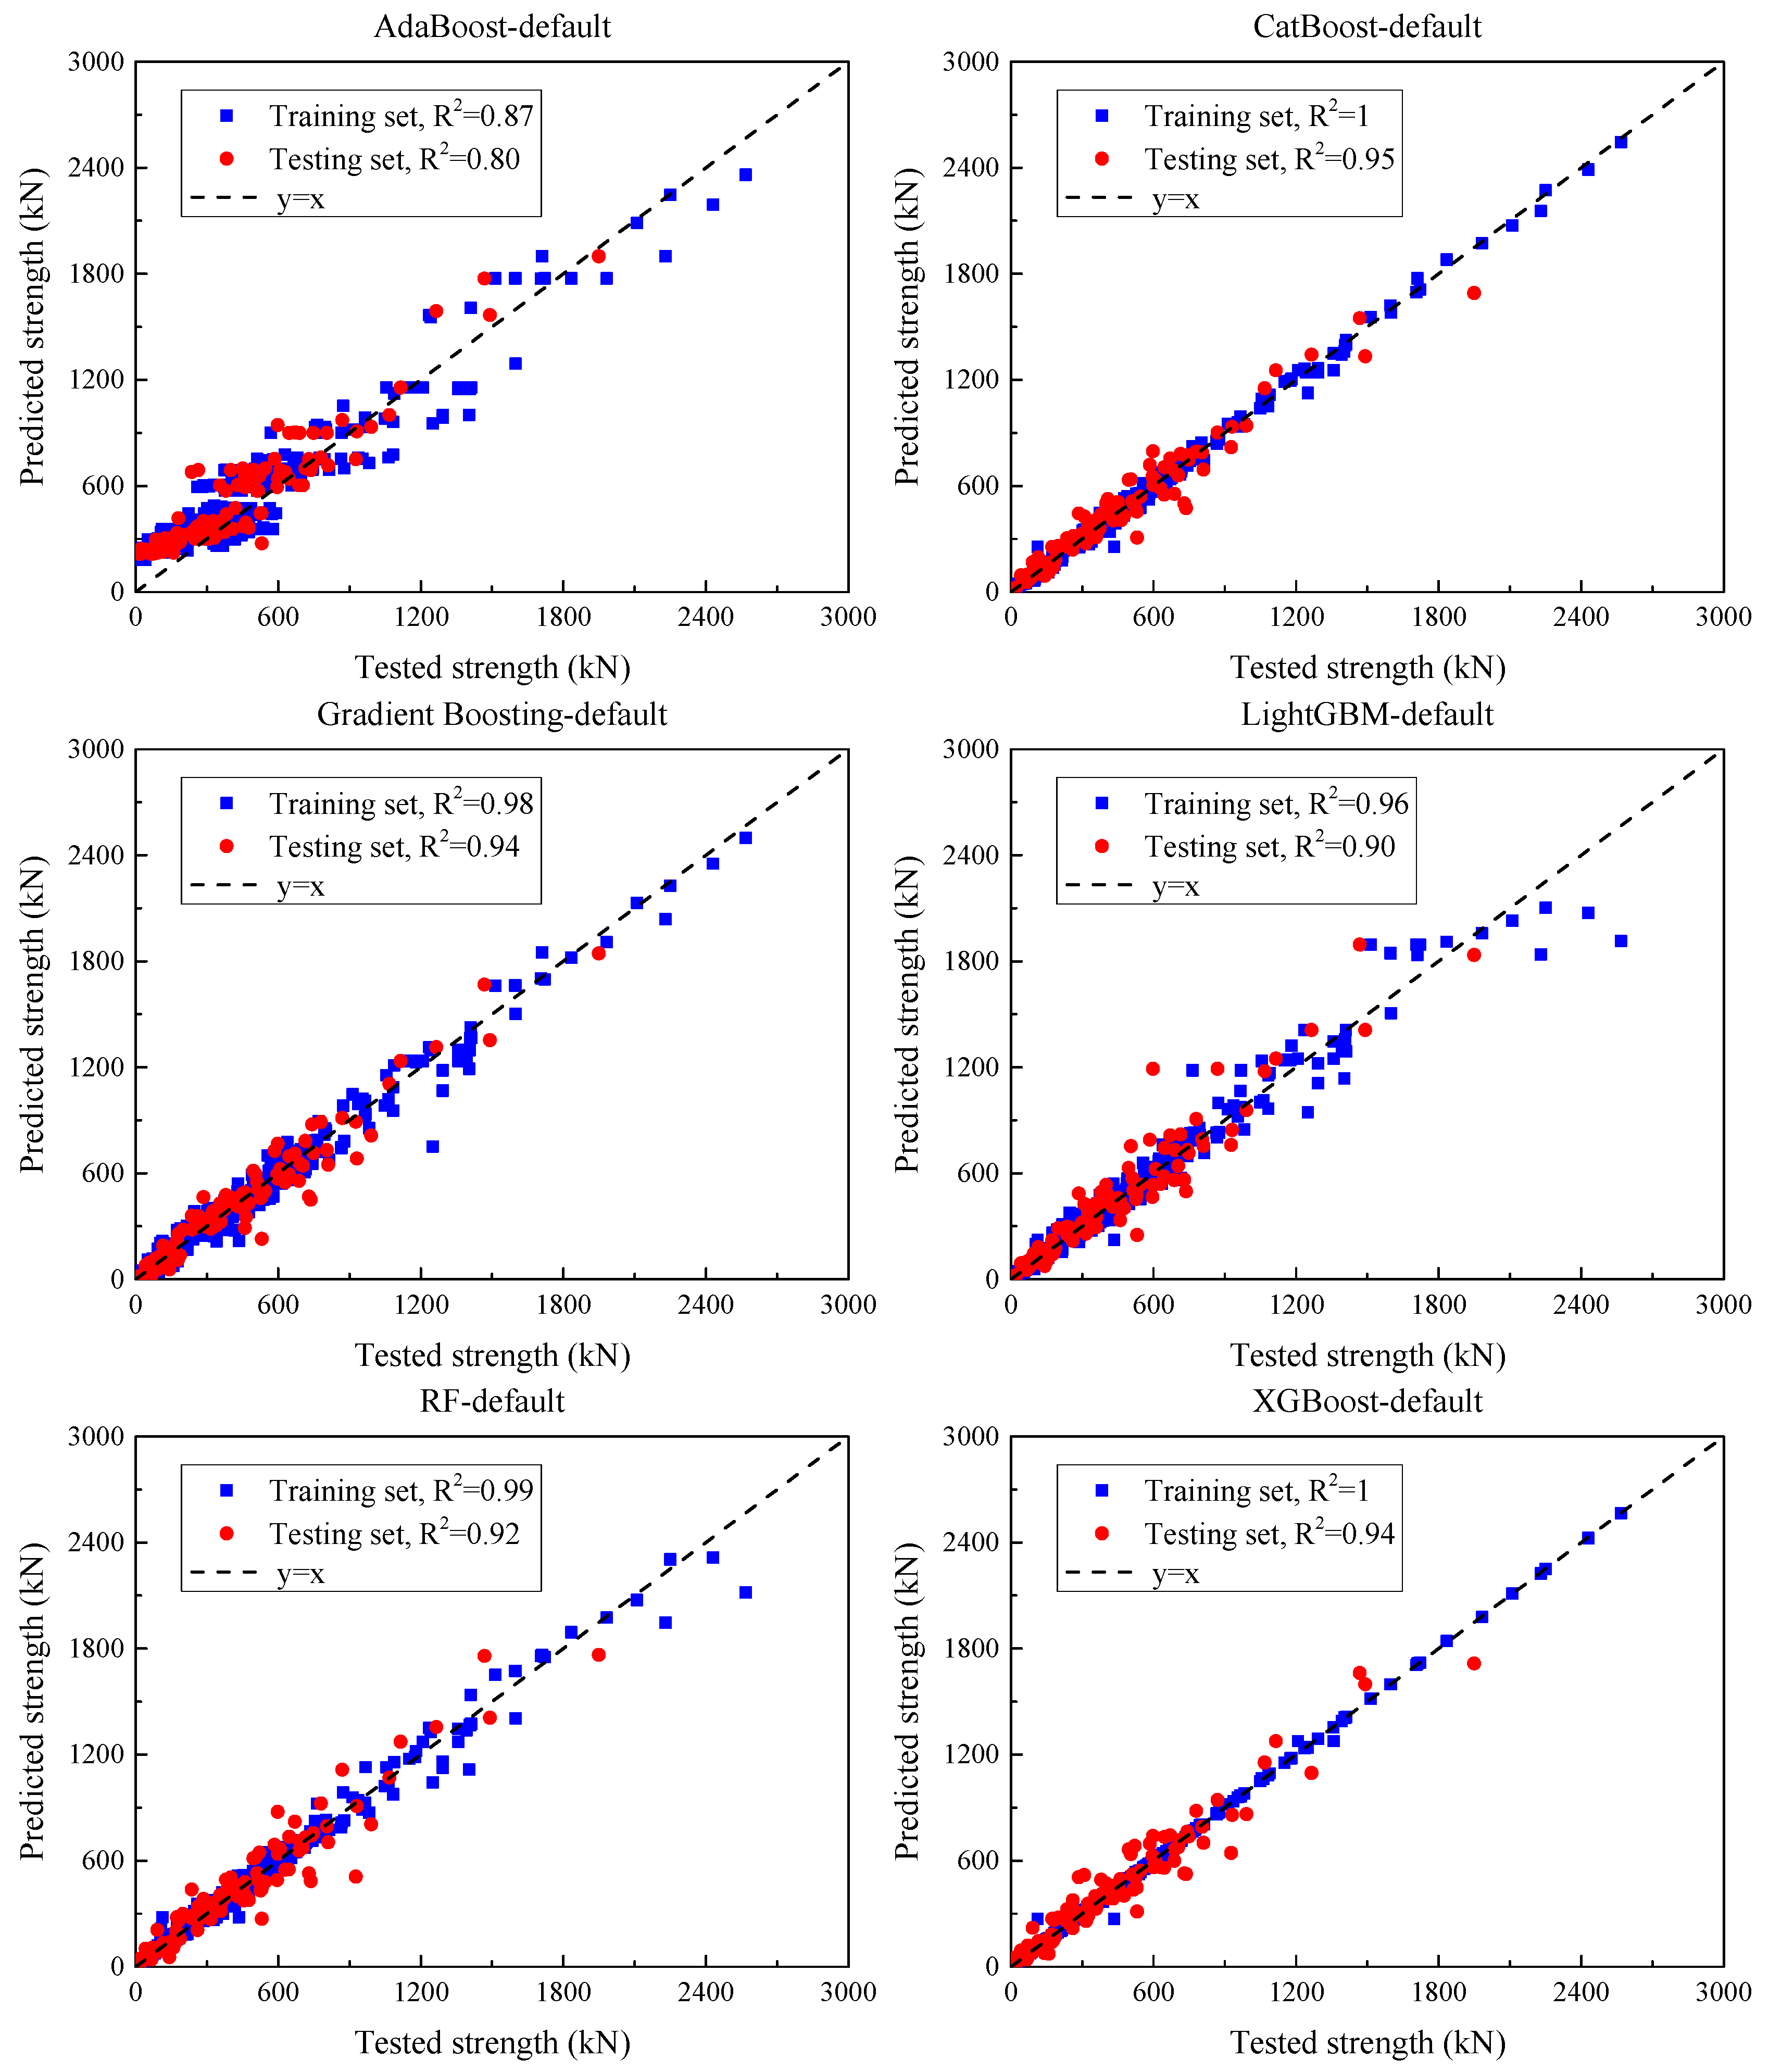
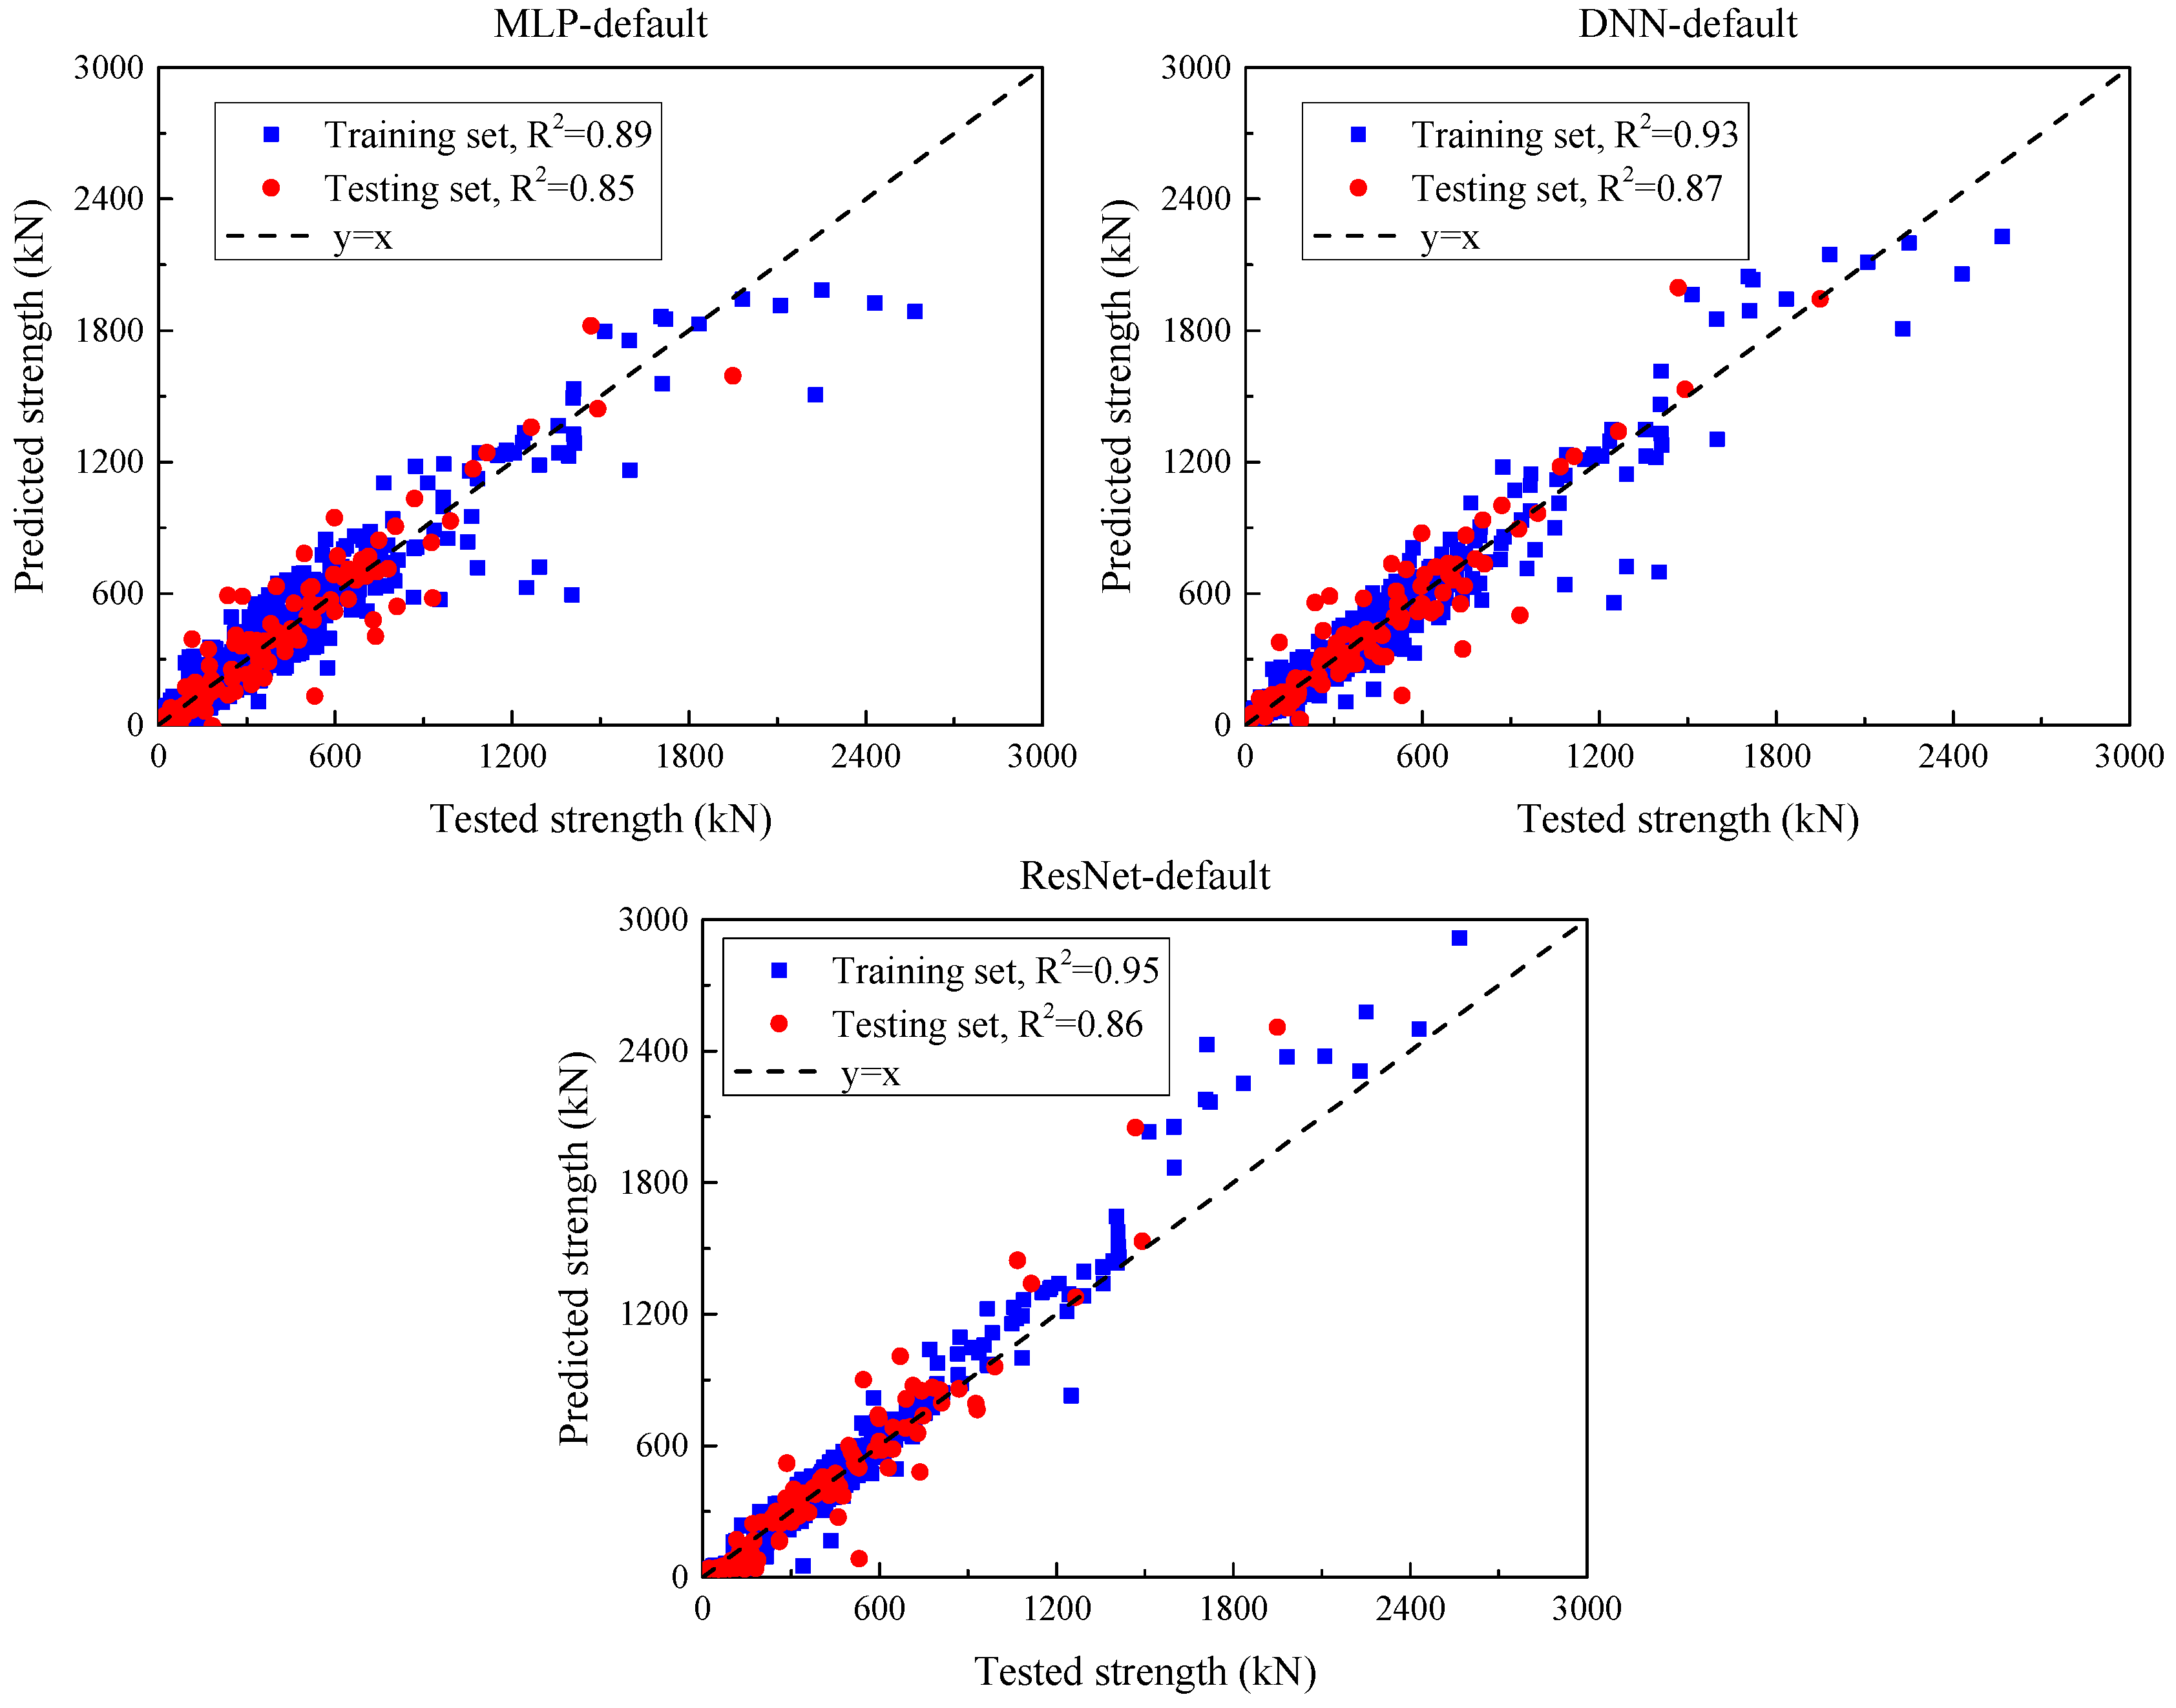
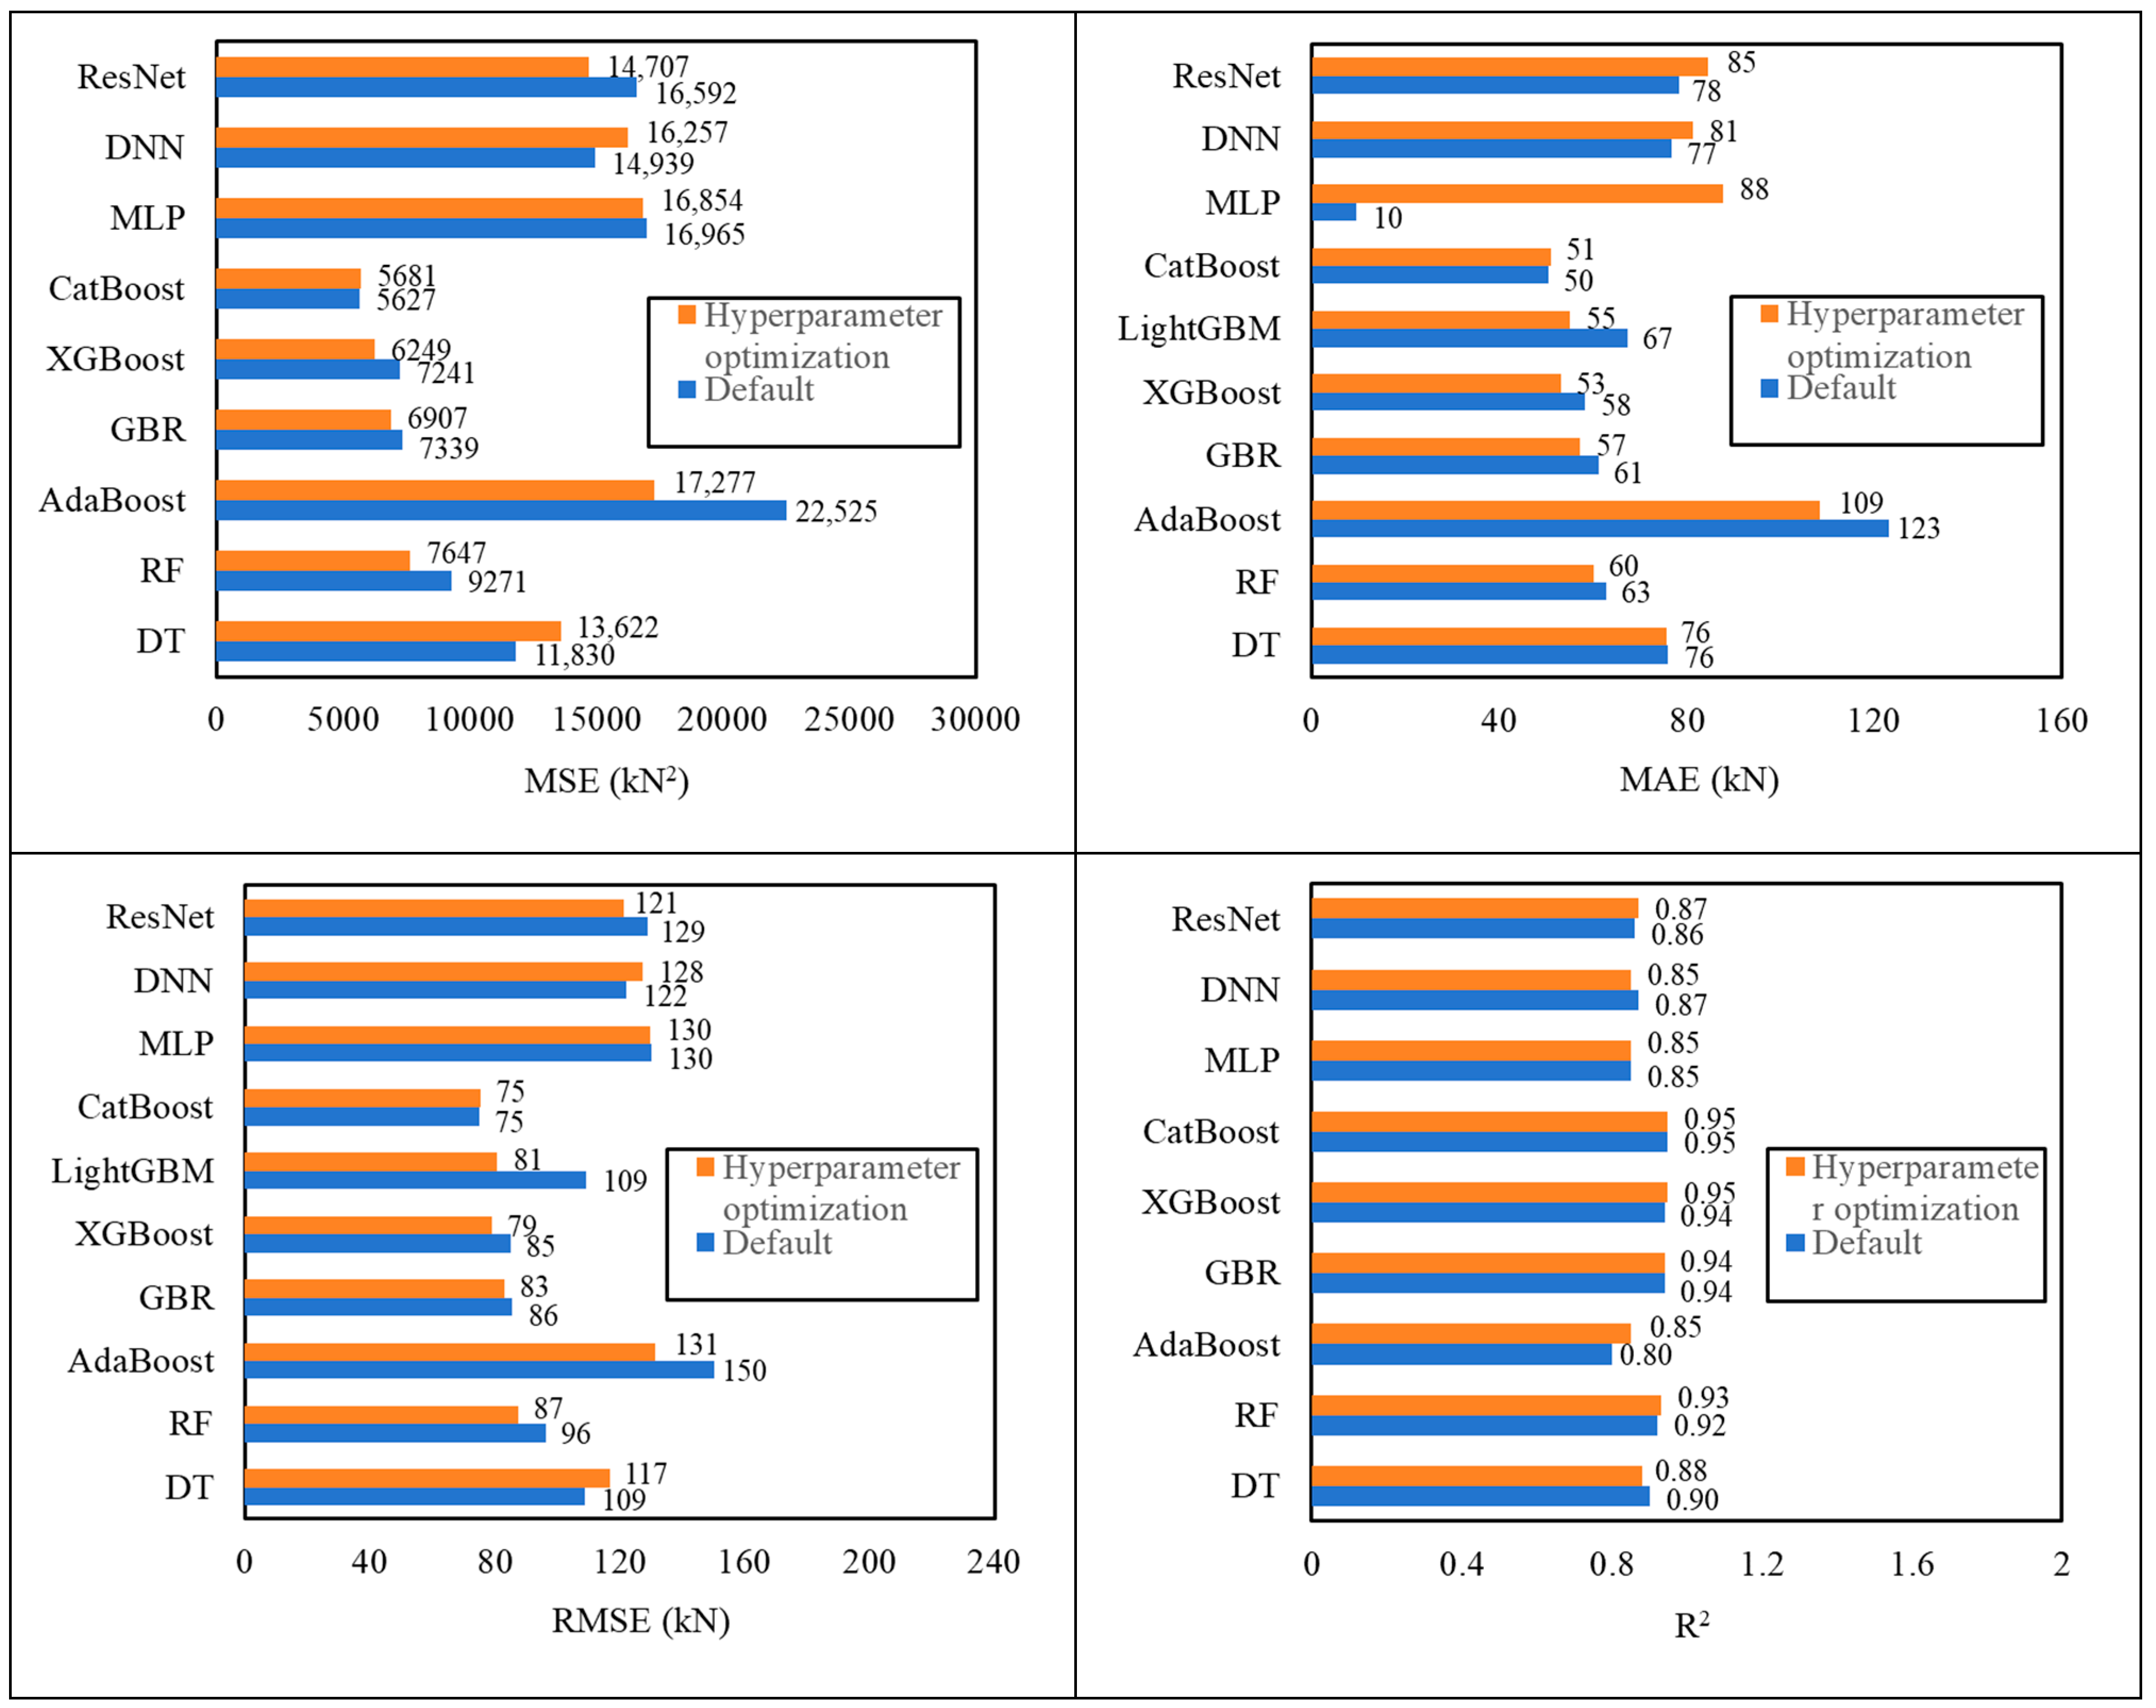
Three categories of ML models—single, ensemble, and deep learning—were trained to predict the SSC of UHPC beams. An initial assessment was carried out using default settings for all models, and subsequent performance improvements were achieved through hyperparameter optimization.
Step 4: Model Performance Assessment and Weight Assignment
Model accuracy was assessed using standard performance metrics (e.g., R2, MAE, RMSE). The four best-performing models were selected based on test-set performance, and relative weights were assigned proportionally to their predictive capabilities.
Step 5: Probabilistic Model Construction
A weighted ensemble approach was used to integrate the selected models. By analyzing the residuals of each specimen’s predicted and actual SSC values, a 95% confidence interval was established to quantify prediction uncertainty. Using the curated database and drawing upon design provisions in the Chinese code, a simplified empirical formula was developed to estimate SSC for practical engineering use.
This framework ensures not only accurate point predictions of SSC but also probabilistic bounds that reflect real-world variability, making it suitable for both academic and design applications.
6. Model Stacking Based on the Predictive Capabilities of Each ML Model
There are obvious differences in the sensitivity of each machine learning model to different characteristic data. Based on MSE, MAE, RMSE and R2, each model is weighted, and a UHPC beam shear capacity prediction model is established by weighted averaging. This method can combine the advantages of multiple models and fully reflect their respective response capabilities to different characteristic data, thereby producing more accurate prediction results. Integrating the outputs of each model by weighted averaging can effectively reduce the error of a single model and improve the robustness and reliability of the overall prediction. This weighting strategy enables the final prediction model to not only reflect the influence of multiple data characteristics but also has strong adaptability, good effectiveness, and accuracy.
Four models with better prediction performance for the test set are selected from the above machine learning models, GBR, XGBoost, LightGBM, and CatBoost. Each model is weighted by MSE, MAE, RMSE, and R
2, respectively, as
w1i,
w2i,
w3i, and
w4i, as shown in the following formula, where
i represents the weight of the
i-th model.
Then, the weight of the
i-th model is as follows:
The calculated shear bearing capacity of UHPC after weighted averaging is as follows:
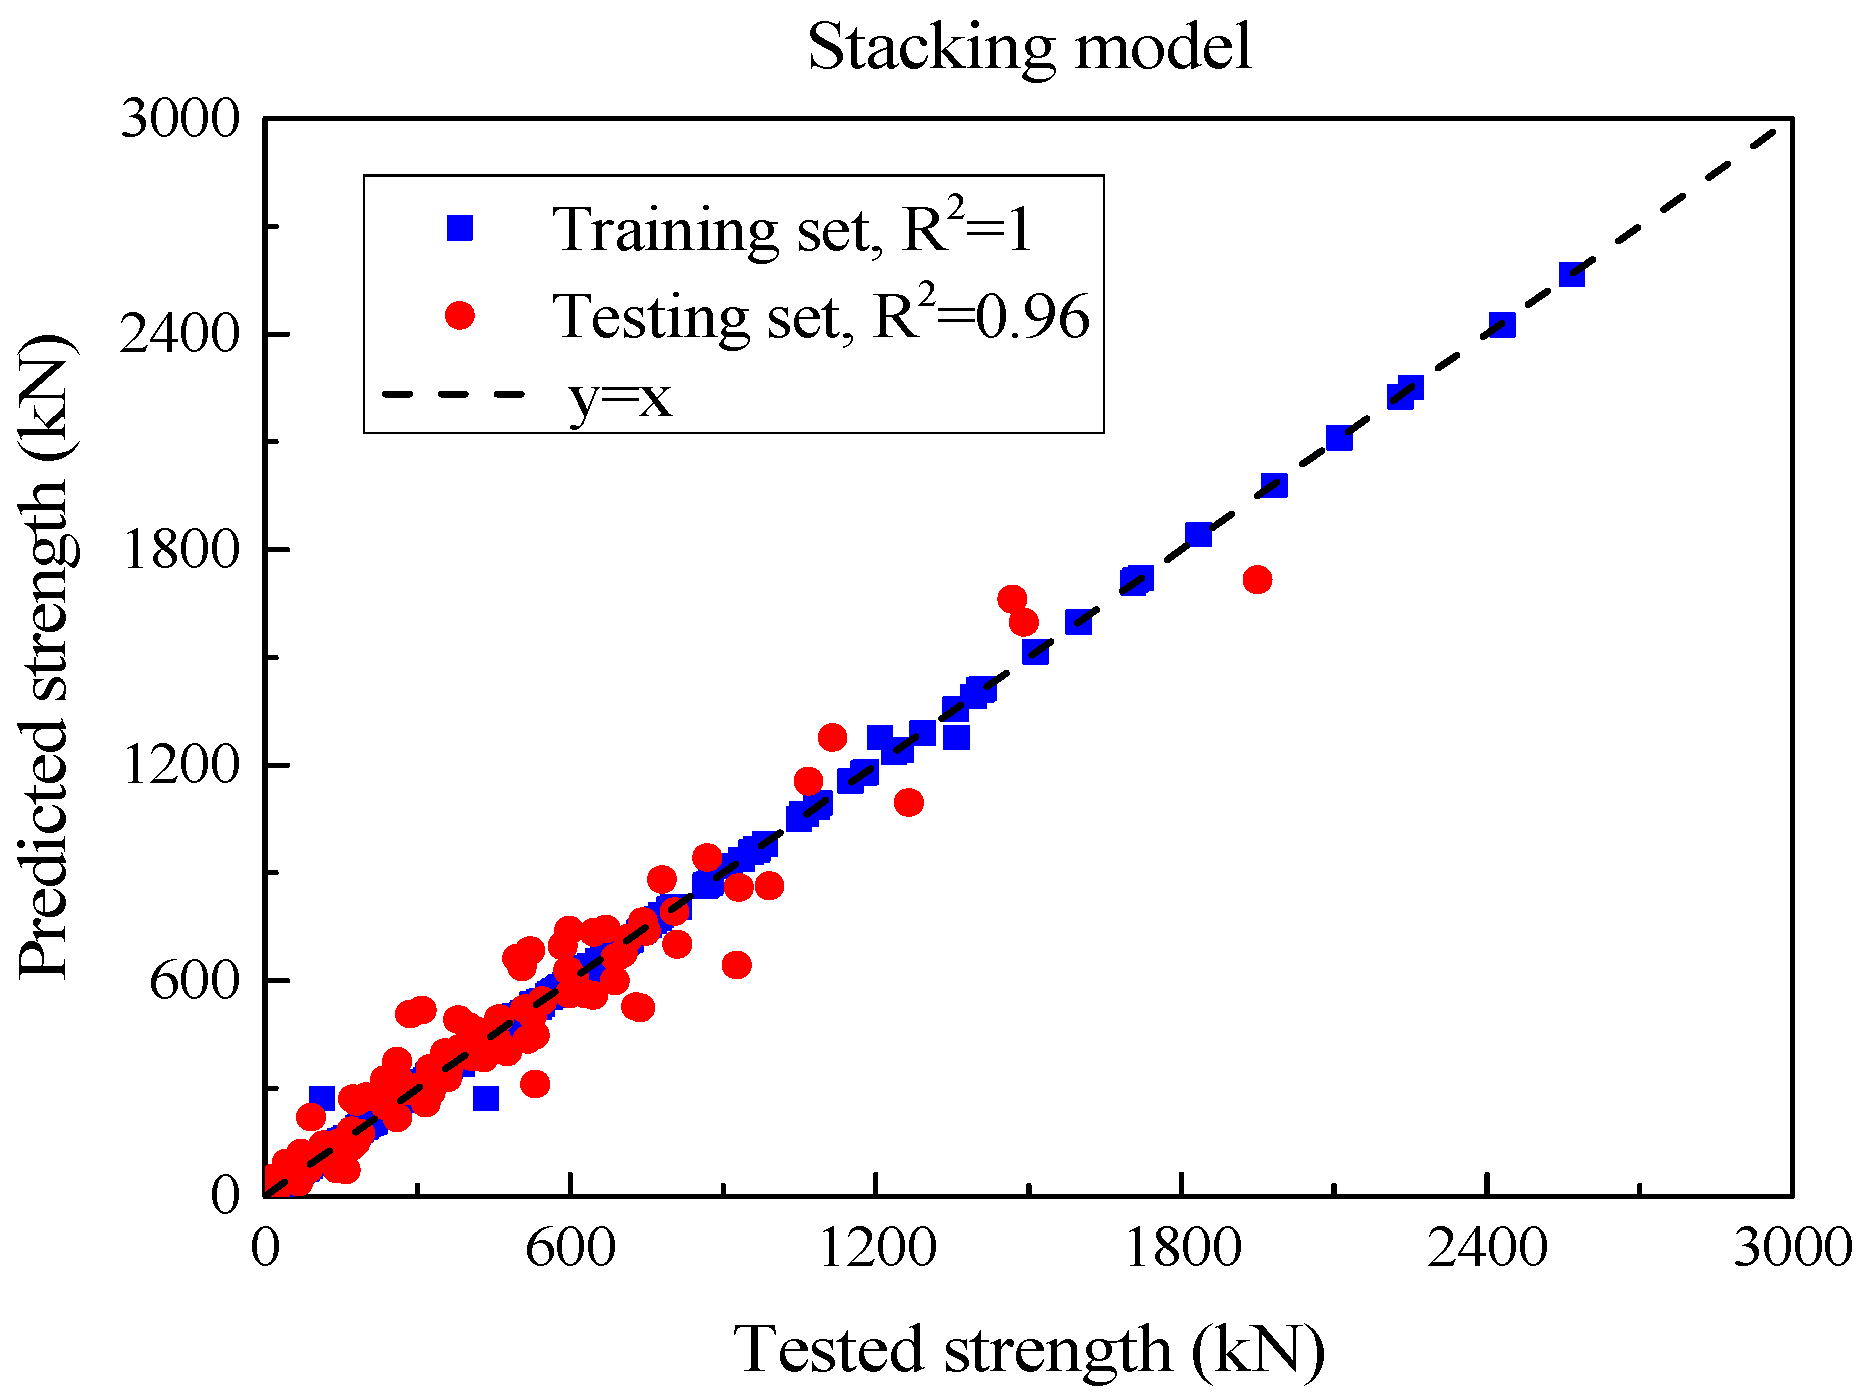
The SSC of each UHPC beam was obtained by the above method and compared with the experimental value, as shown in
Figure 14.
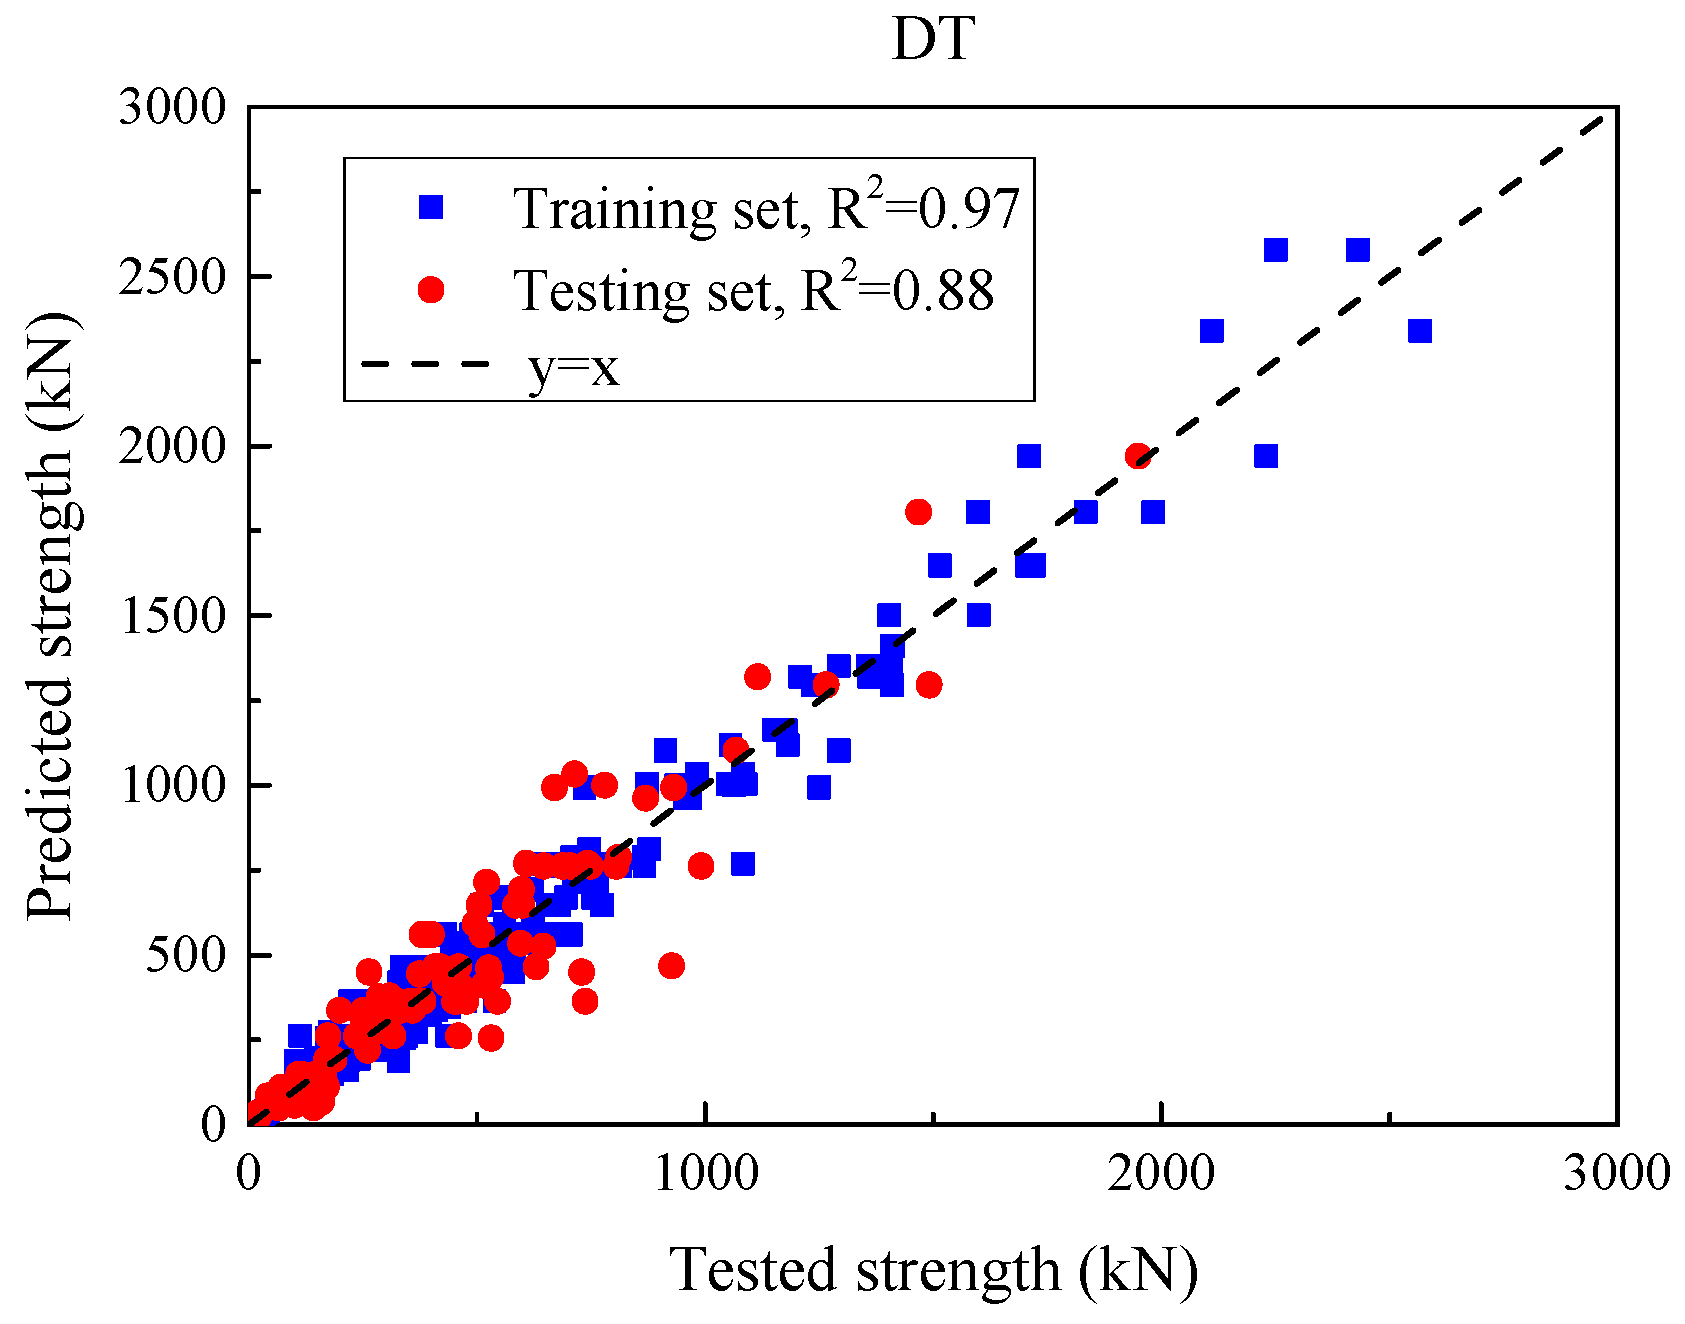
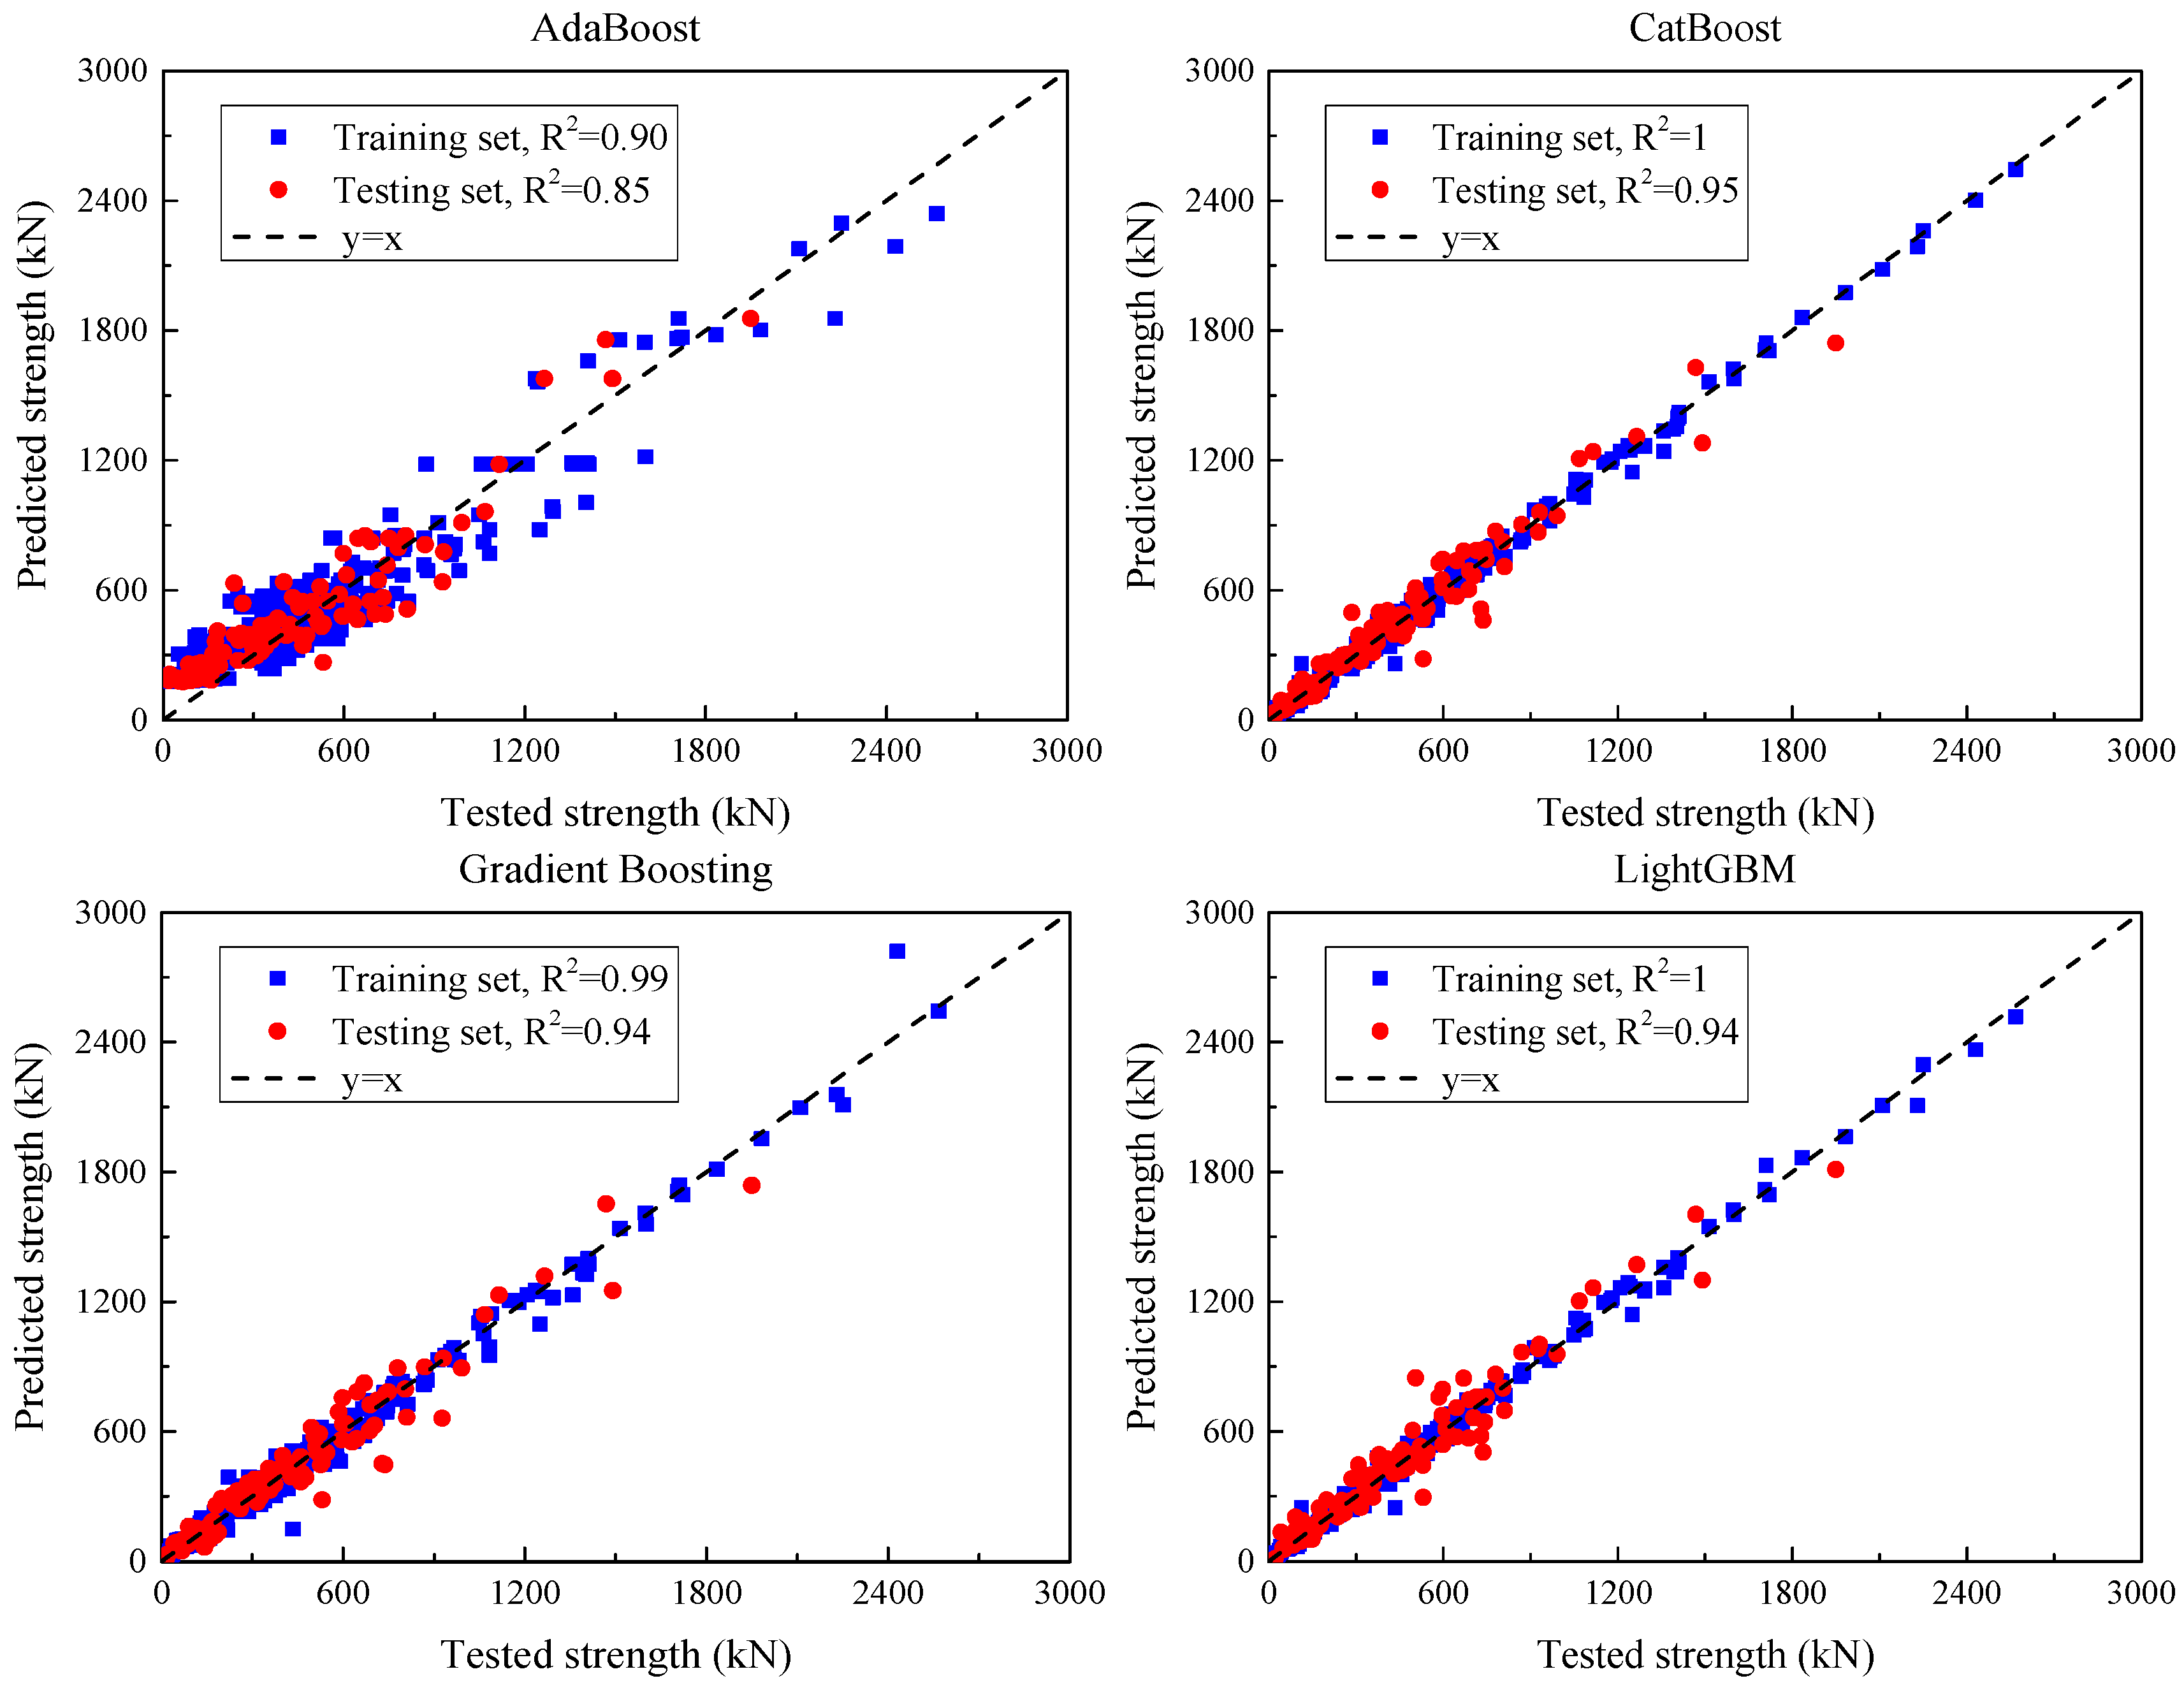
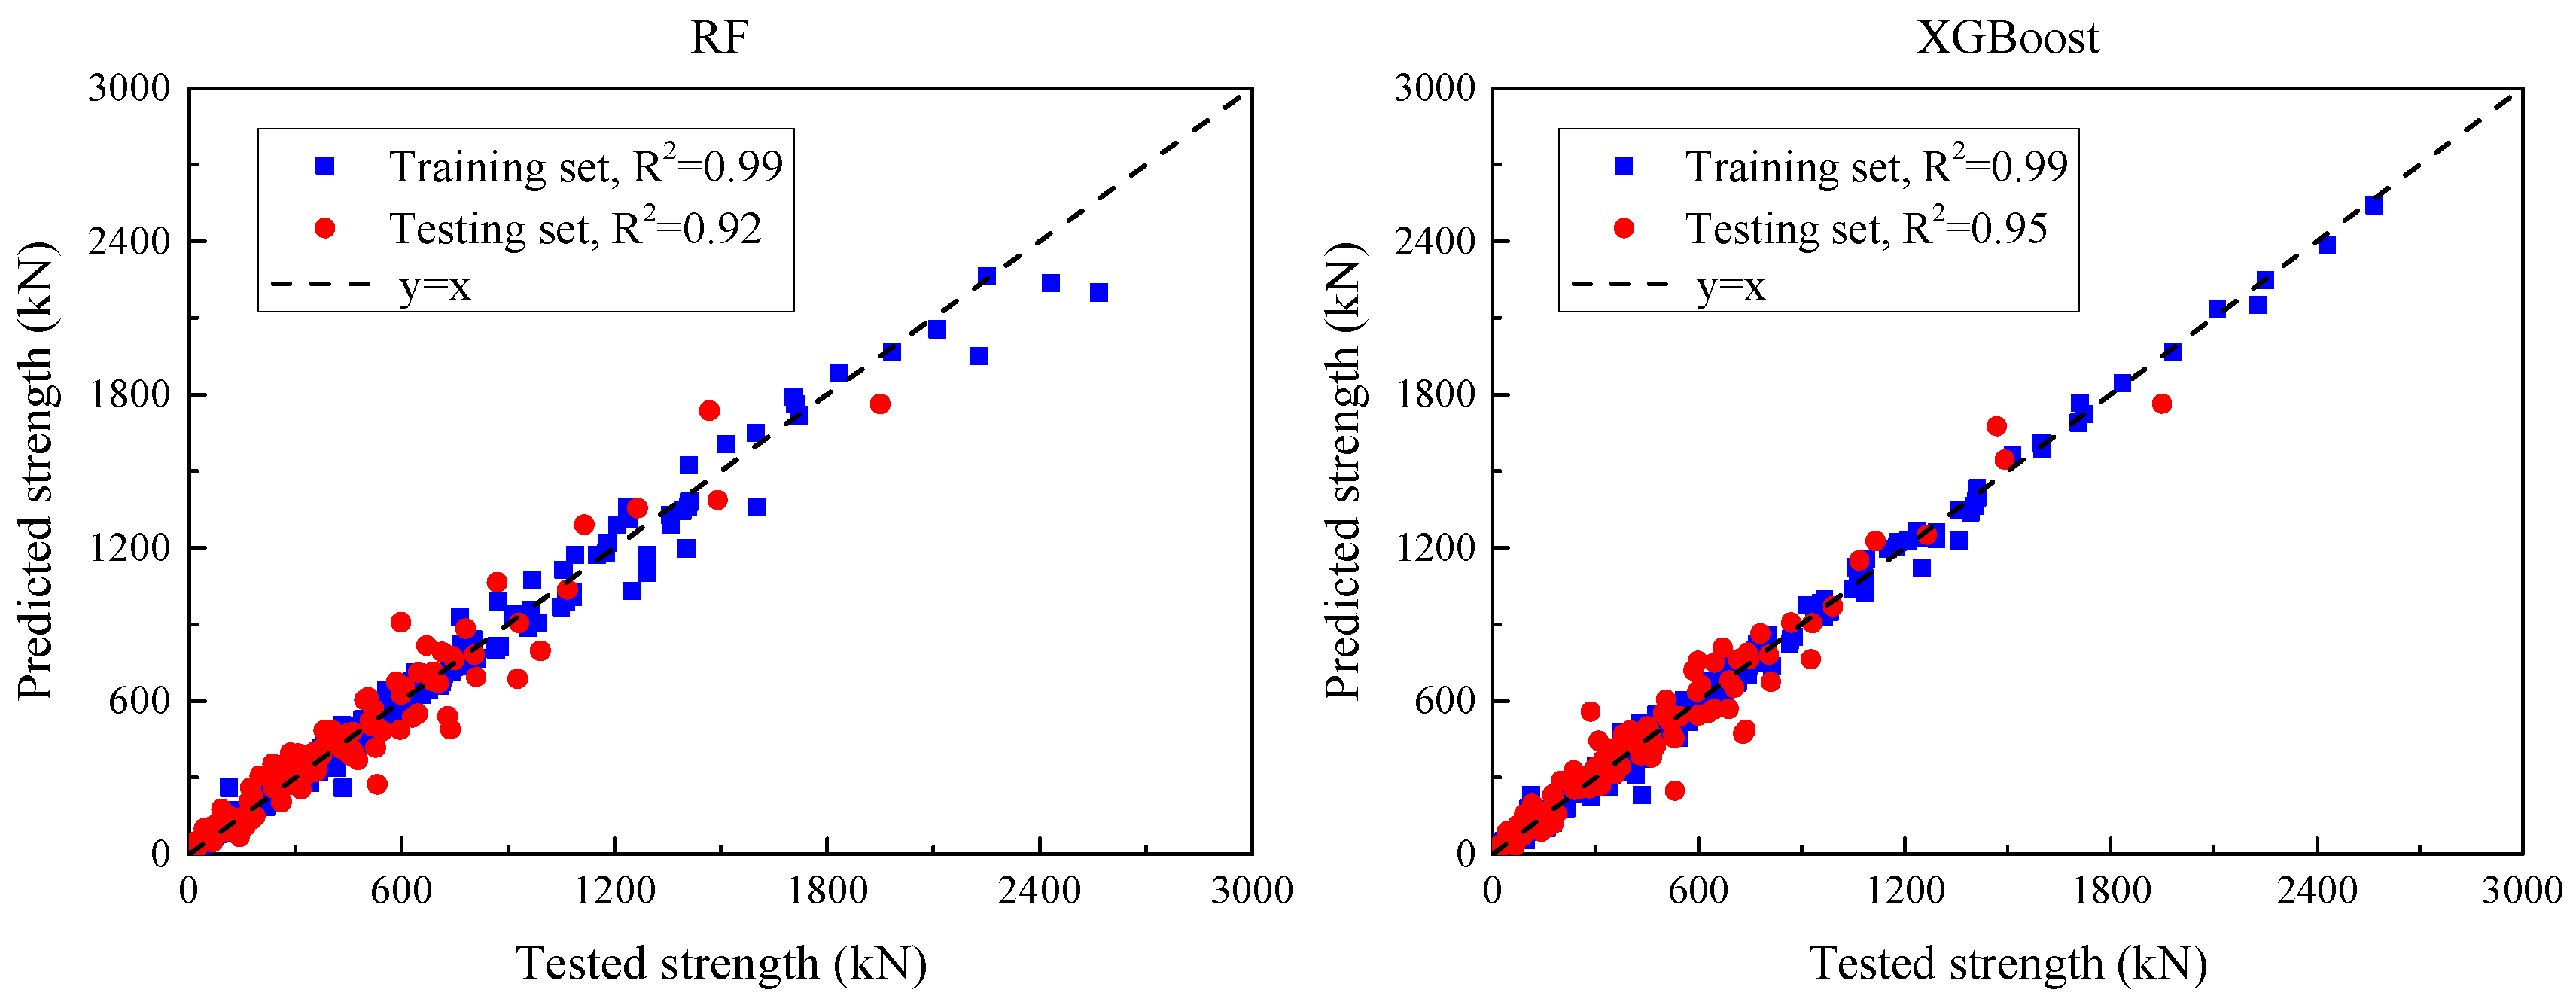
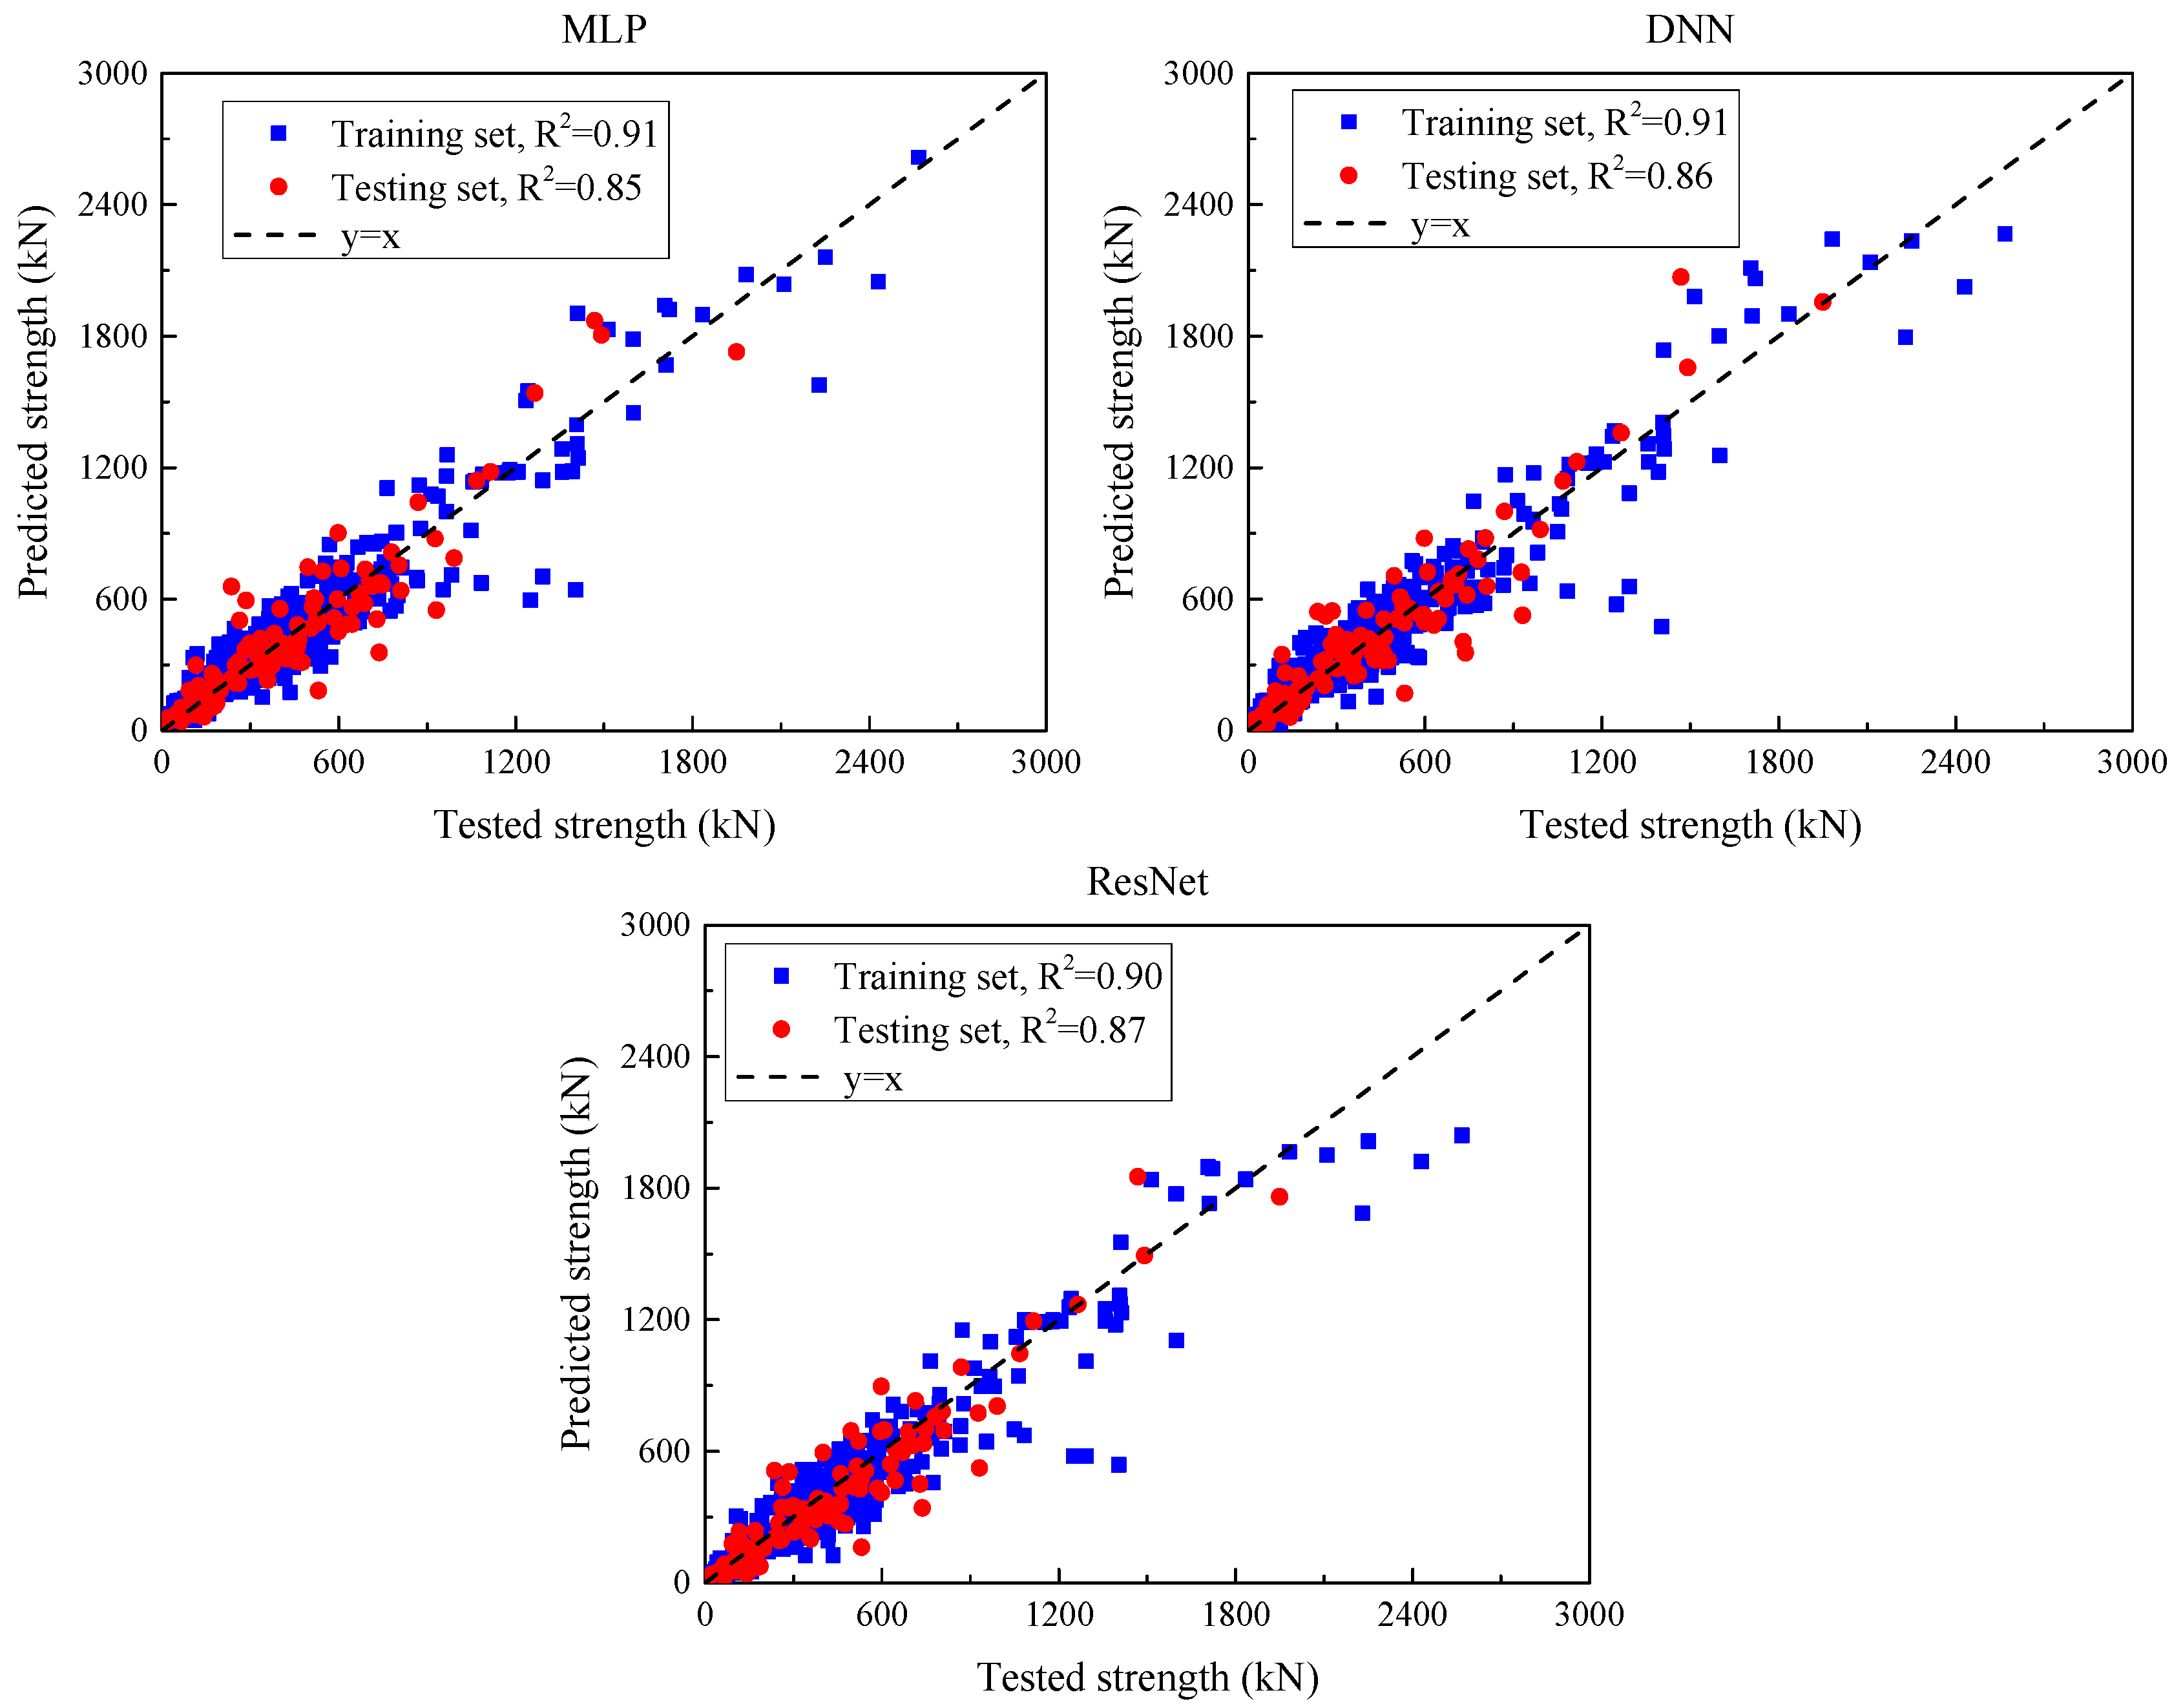
Table 13 summarizes the performance of each model in the test set. From an MSE point of view,
Vn significantly reduced the MSE to 4843.3 after using the weighted average method, highlighting that it is superior to all individual models in prediction accuracy. RMSE also reflects this trend. CatBoost’s RMSE is 75.4, XGBoost and LightGBM are 79.0 and 80.8 respectively, while
Vn’s RMSE is only 69.6, further proving its lower prediction error. In terms of MAE, CatBoost is 50.9, while XGBoost and LightGBM have MAEs of 53.1 and 55.1, respectively. However, the MAE of
Vn is further reduced to 47.0, demonstrating the excellent performance of the model. This performance improvement is not only reflected in the error index, as
Vn also performs well in R
2 (coefficient of determination), with an R
2 of 0.96, which exceeds CatBoost and XGBoost’s 0.95, showing that it has a stronger ability to explain data variation. The coefficient of variation (CoV) of the ratio of calculated values to experimental values is a low value of 0.17, indicating that the prediction results of
Vn have higher stability and consistency. Compared with the CoV of GBR, XGBoost and LightGBM (0.23, 0.24, and 0.30 respectively),
Vn ’s performance is more reliable. In terms of mean ratio, the values of each model are close to 1, indicating that the prediction of shear bearing capacity is relatively reasonable. The mean ratio of
Vn is 1.05, which is slightly higher than that of other models, indicating that its predicted value is slightly higher than the experimental value. In general, as a comprehensive model,
Vn effectively integrates the advantages of other models by weighted averaging, showing obvious prediction advantages. In terms of multiple key performance indicators,
Vn not only leads the single model but also demonstrates improved overall performance in terms of accuracy, explanatory power, and output stability.
7. The 95% Confidence Interval
Multiple machine learning models (GBR, XGBoost, CatBoost, and LightGBM) are used to predict the SSC of UHPC beams, and weights are assigned according to the MSE, MAE, RMSE, and R2 of each model, and then, a 95% confidence interval is established through the residual. First, by integrating the prediction results of multiple models, the advantages of each model under different data characteristics can be fully utilized, thereby improving the robustness and accuracy of the overall prediction and offsetting the limitations of a single model. At the same time, the use of residuals to calculate confidence intervals provides users with a quantification of prediction uncertainty, which can effectively reduce risks in the decision-making process. Secondly, this method performs well in improving interpretability. By displaying confidence intervals, the credibility and potential errors of model predictions are more clearly displayed. At the same time, the introduction of confidence intervals enhances risk management capabilities, allowing decision makers to more comprehensively evaluate prediction risks and reduce losses caused by prediction bias.
The residual, representing the error between predicted and observed values for each model, is computed using the following equation:
where
Vui is the shear bearing capacity test value of the
i-th UHPC beam specimen, and
Vni is the weighted average shear bearing capacity of the
i-th UHPC beam specimen.
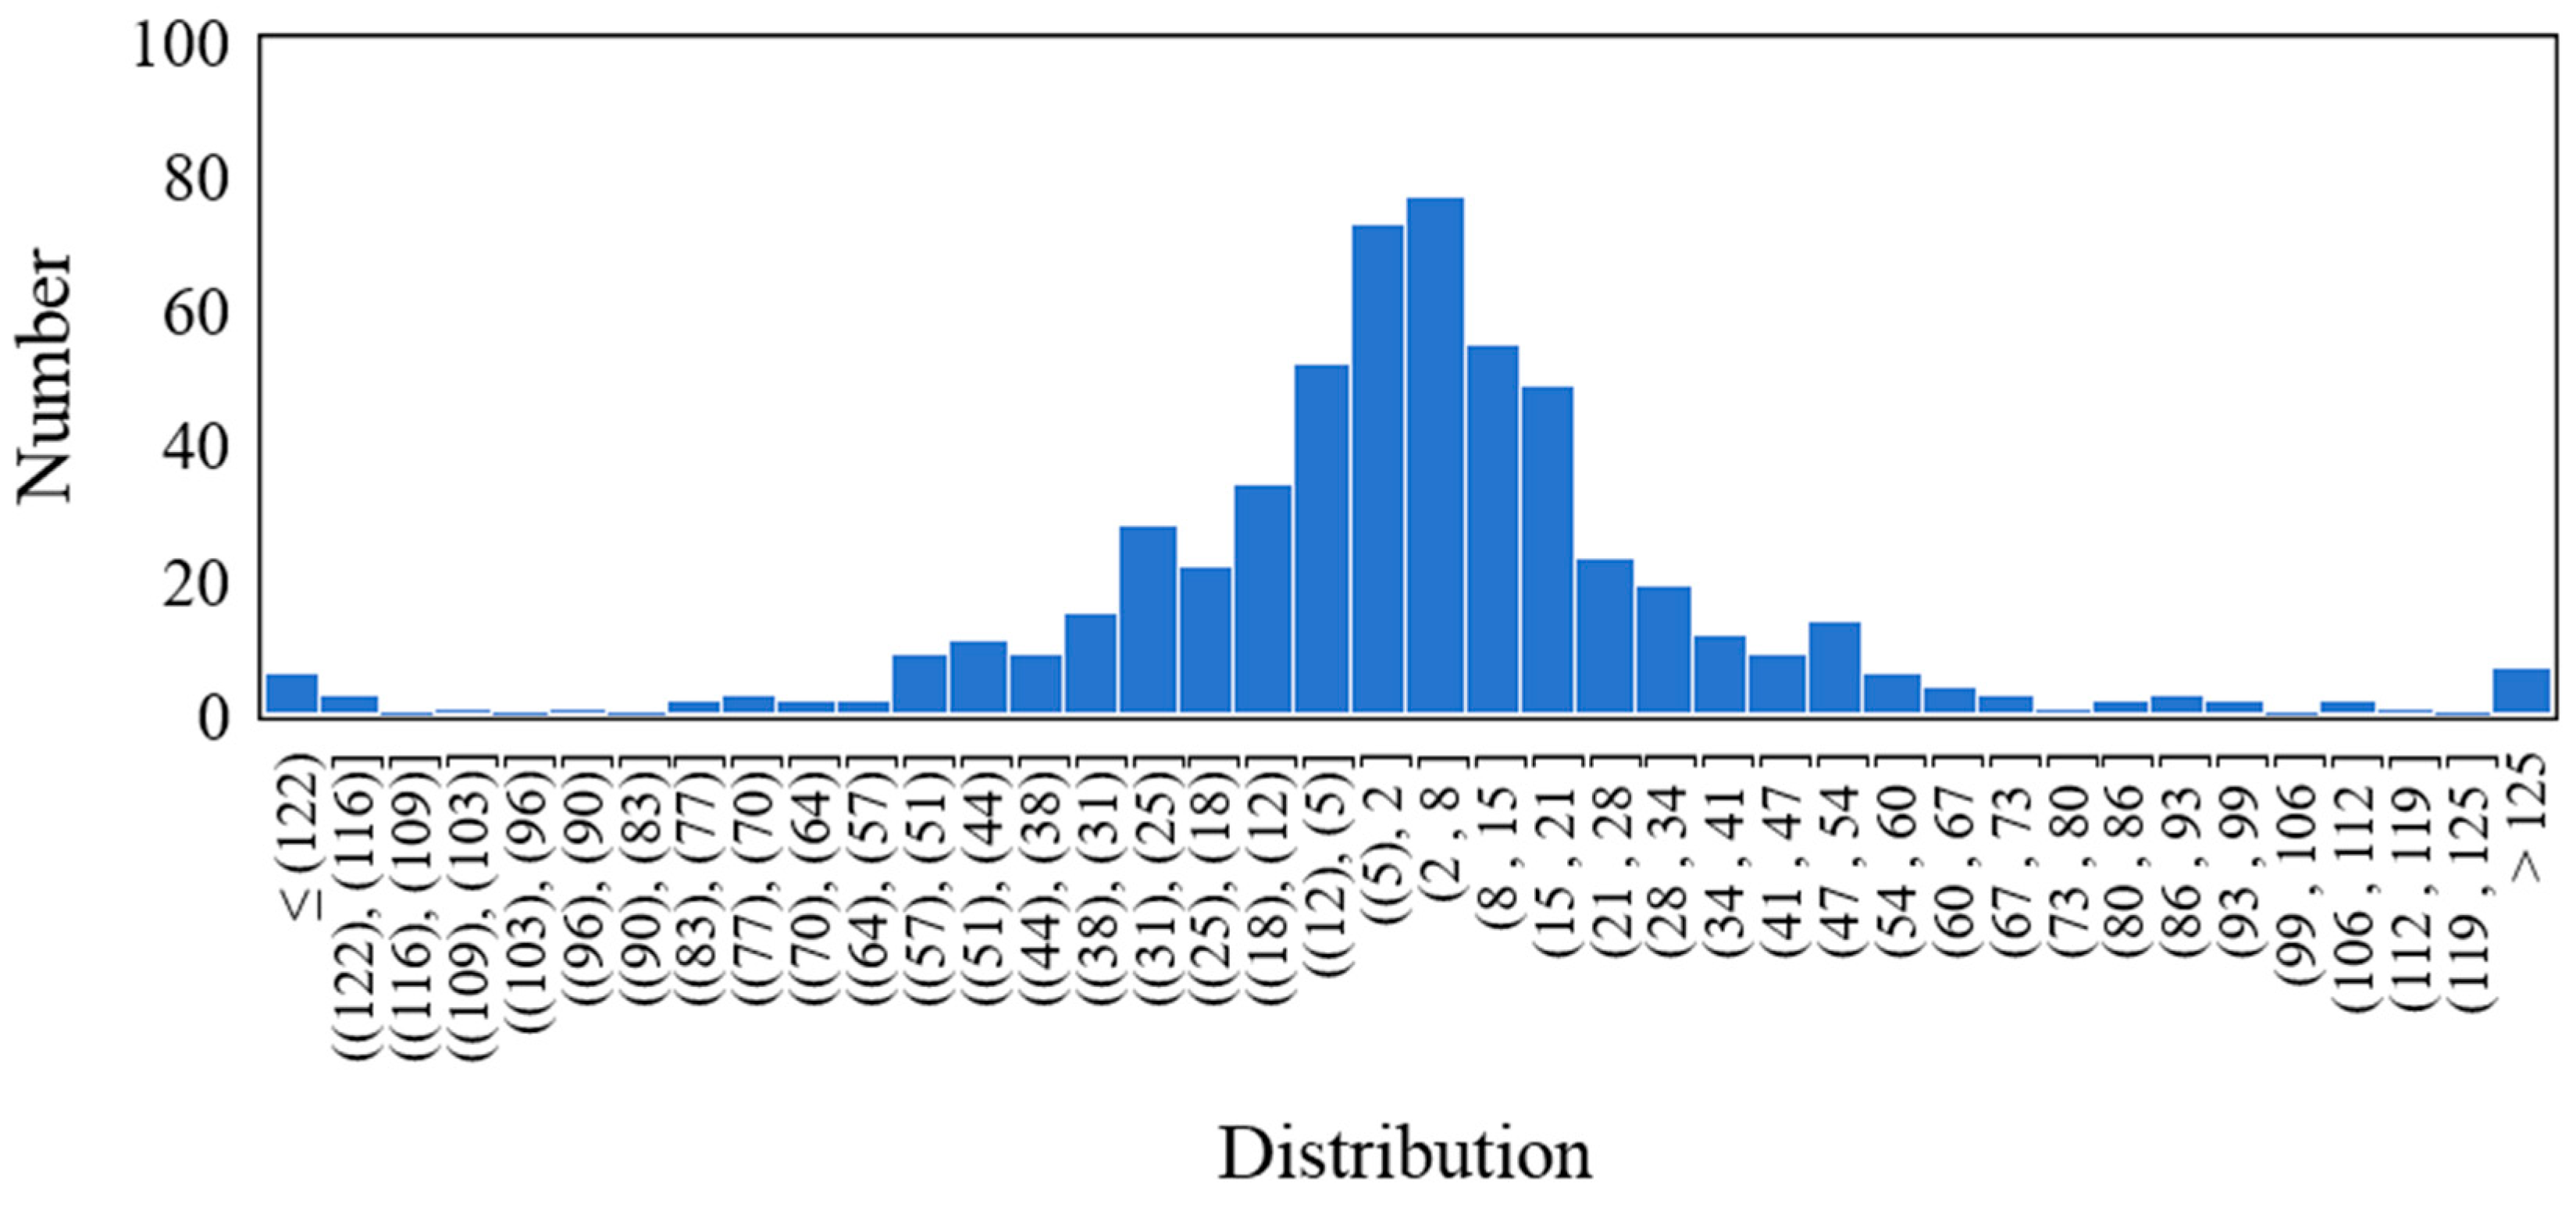
The residual distribution of each UHPC beam specimen obtained above is shown in
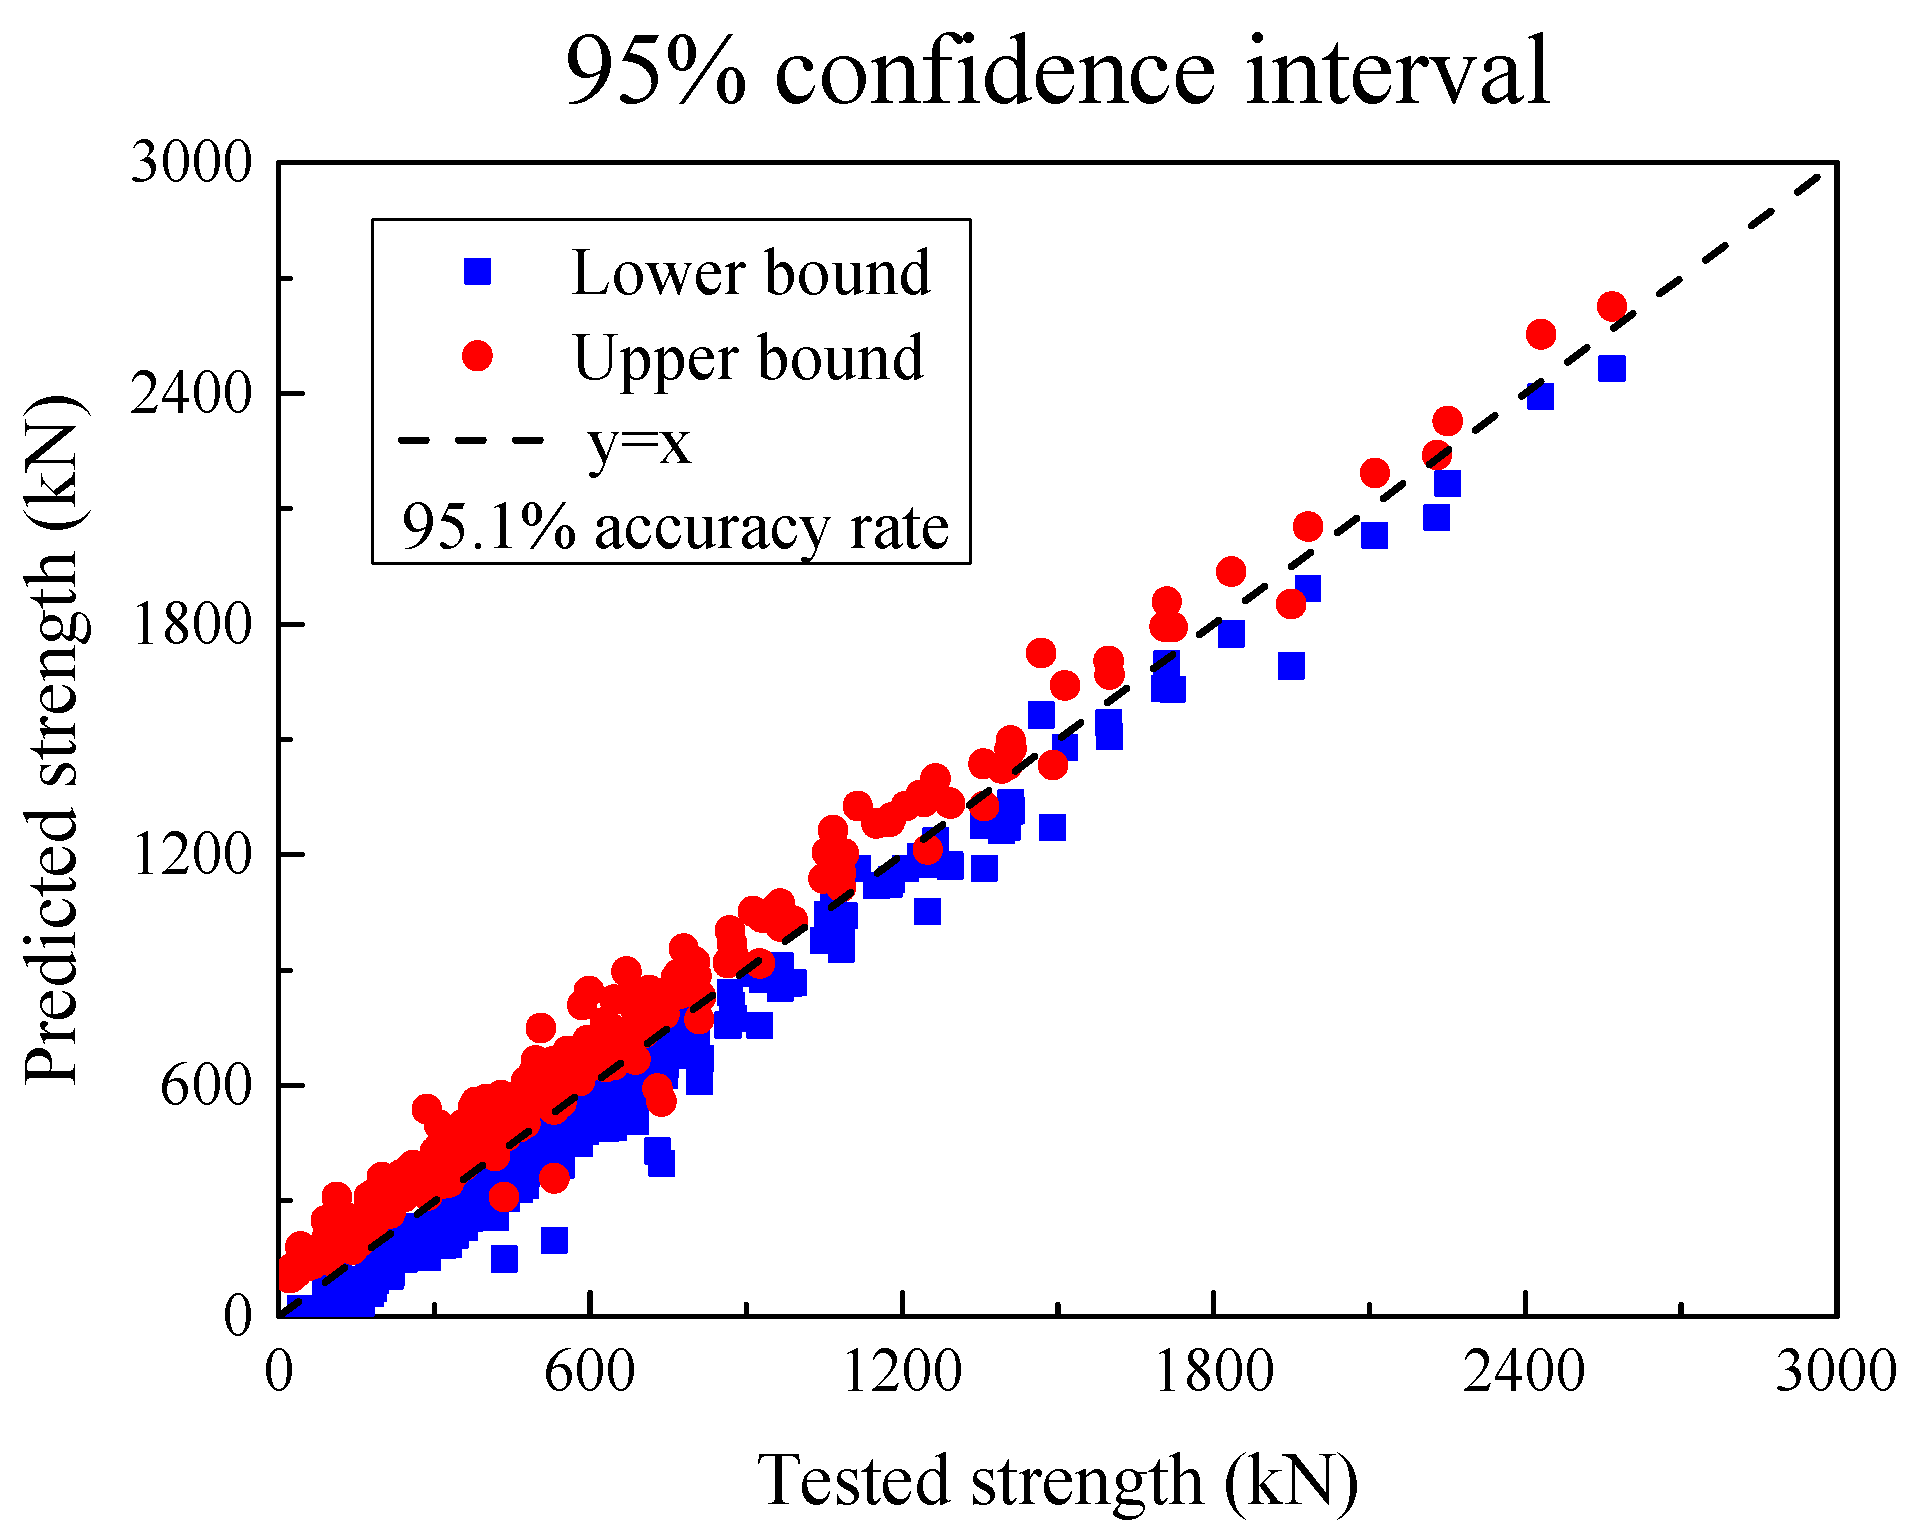
Figure 15 below. The histogram of out-of-fold residuals is bell-shaped and centered near zero, which is consistent with an approximately normal, zero-mean error distribution. We note that a single histogram cannot fully diagnose heteroscedasticity or dependence; therefore, we also report the empirical coverage of the 95% intervals shown as
Figure 16, which is close to the nominal level, and it supports the adequacy of the normal approximation for our data.
This gives the standard deviation of the weighted residual:
where
is the mean value of the residuals, and the 95% confidence interval can be expressed as
where 1.96 means that under a normal distribution, the z value corresponding to the 95% confidence interval is approximately 1.96.
The SSC of each UHPC beam is shown below, with red as the upper limit and blue as the lower limit. For the entire data set, 95.1% of the shear bearing capacity test values of the UHPC beam specimens are within this interval.
8. Simplified Calculation Method for Engineering Design
8.1. Simplified Calculation Method
The SSC of UHPC beams is affected by many factors, and there is no unified shear failure mechanism and shear capacity formula. There are large differences between the current design specifications (such as French NF P18-710 [
106], Swiss SIA 2052 [
107], Japanese JSCE-2006 [
108], GB 50010-2010 [
109], CECS 38:2004 [
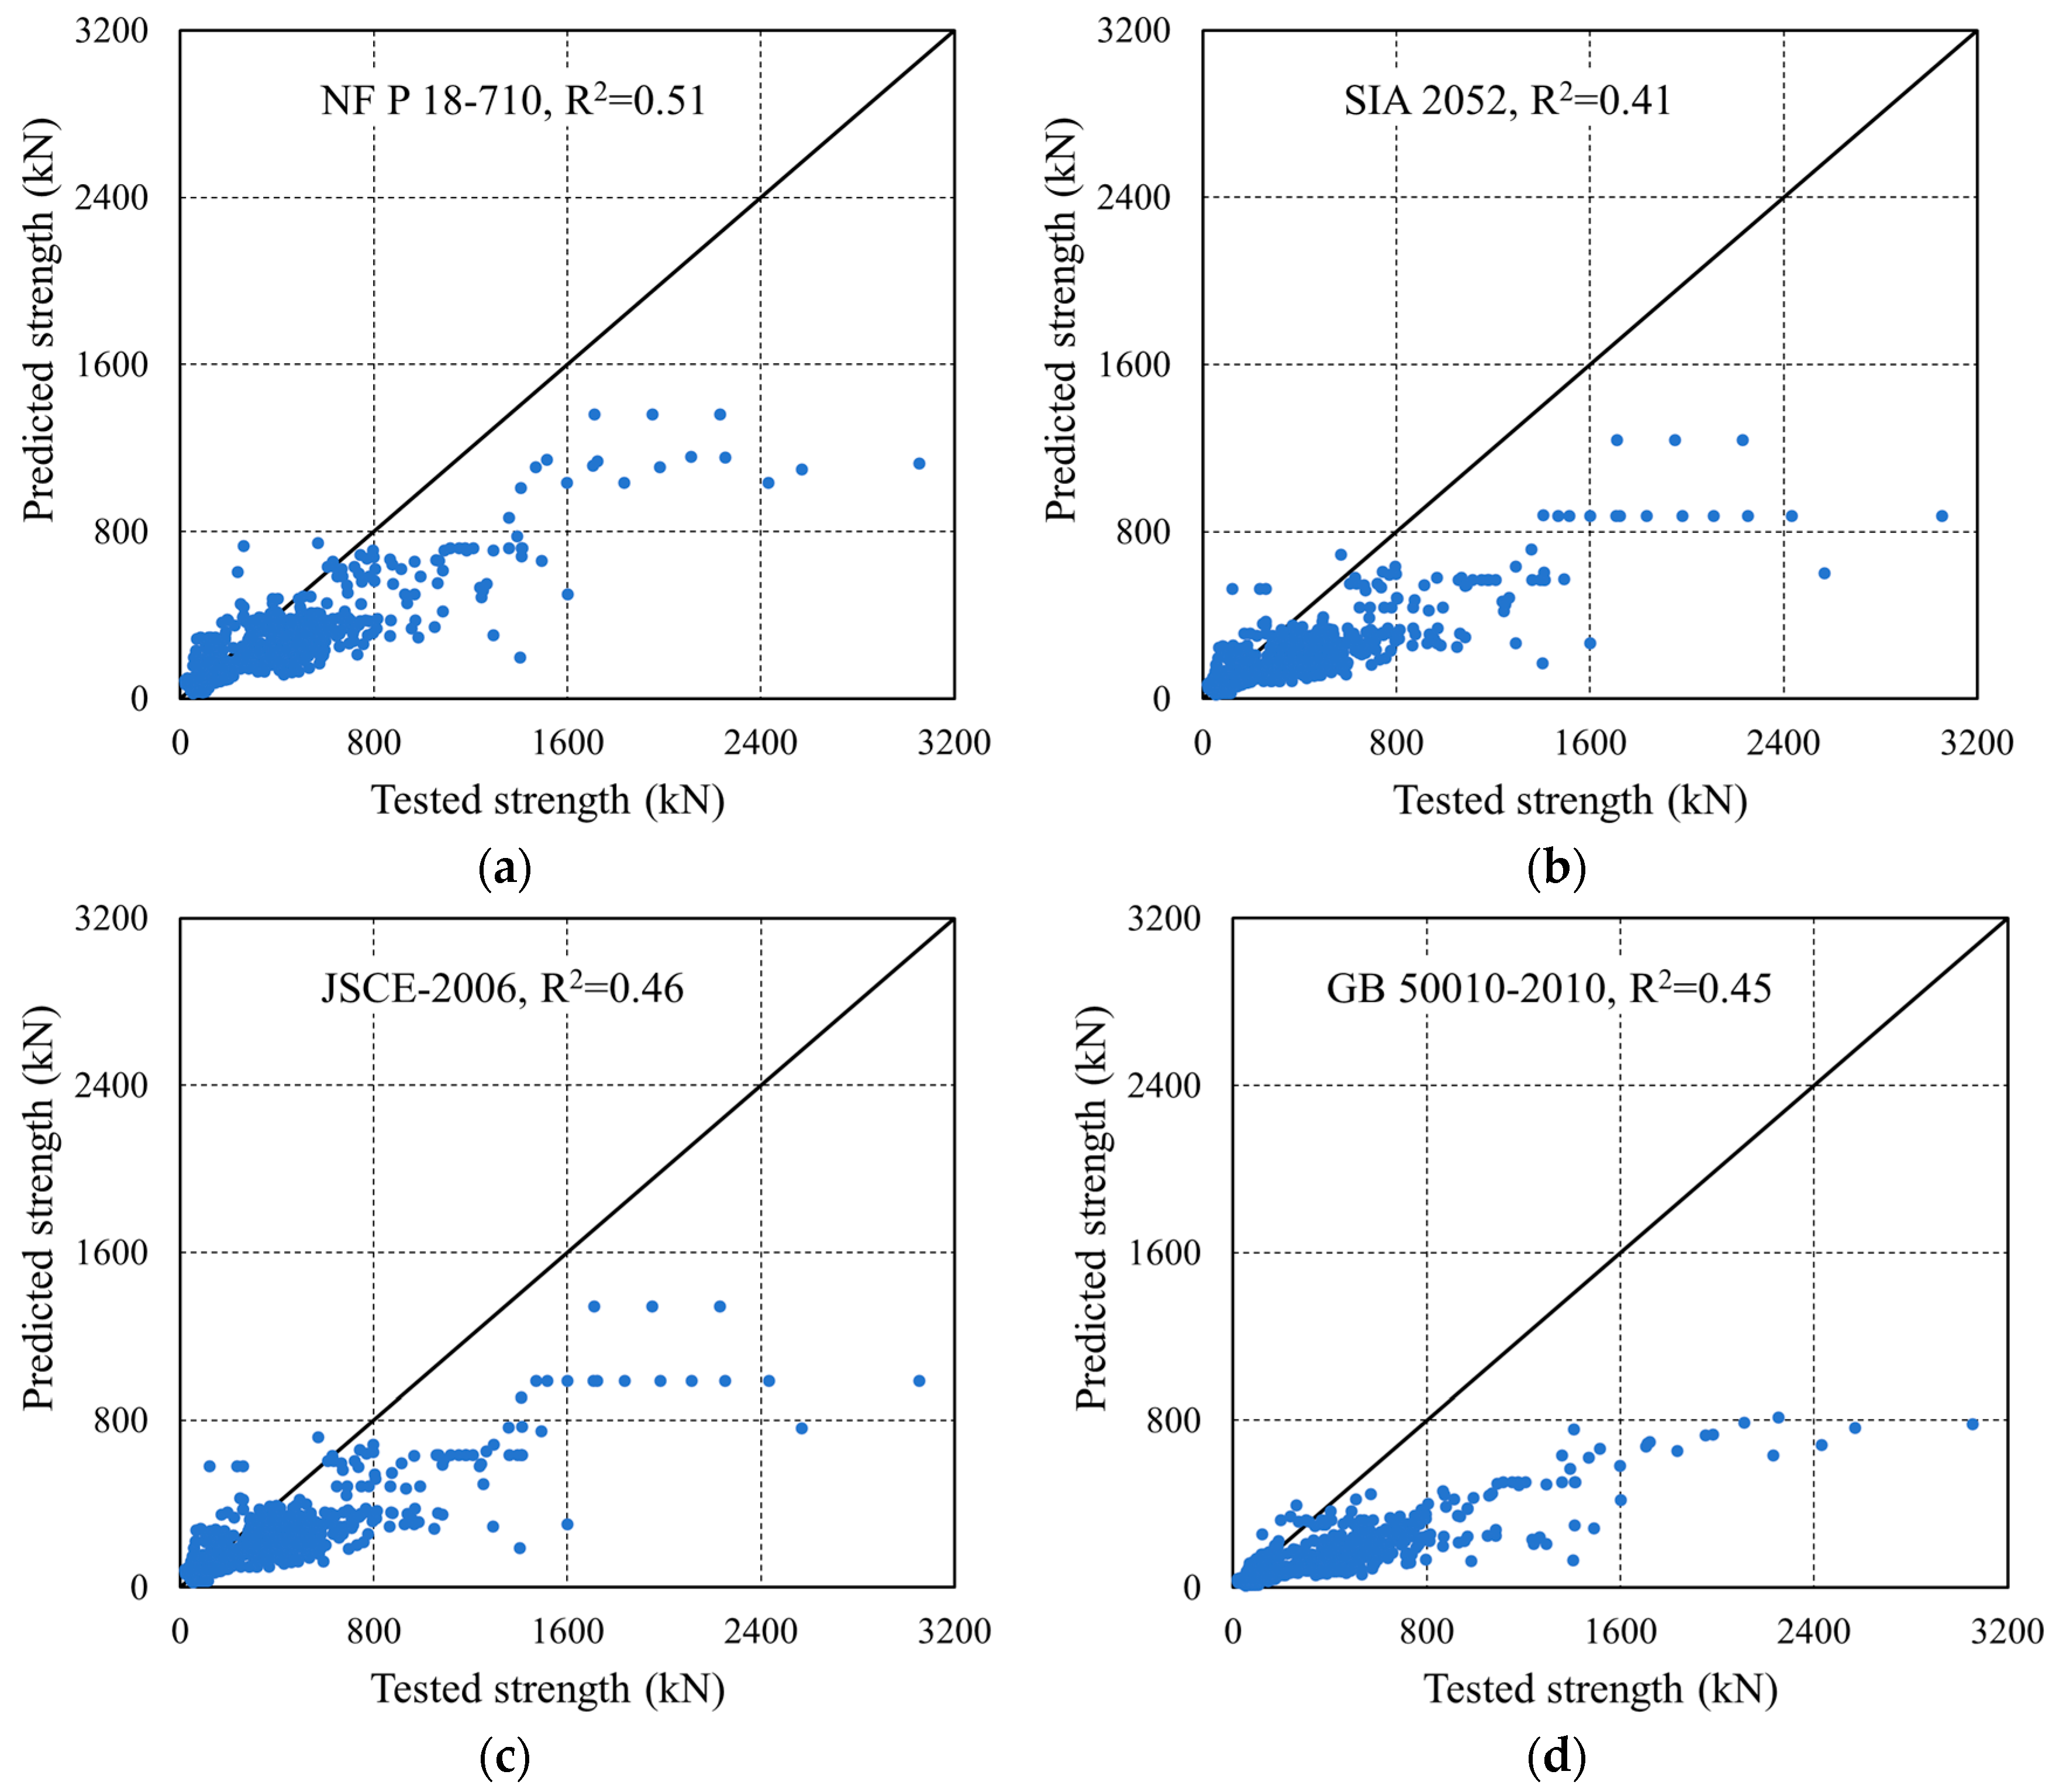
110], etc.), so it is urgent to conduct a systematic study on the shear performance and bearing capacity calculation method of UHPC beams. To this end, based on the UHPC beam shear test database with a wider range of parameters, the bearing capacity calculation formula in the current specifications is evaluated so as to revise and simplify the relevant formulas of the NF P18-710 specification and the CECS 38:2004. The SSC formulas of UHPC beams in French NF P18-710, Swiss SIA 2052, Japanese JSCE-2006, GB 50010-2010, CECS 38:2004, and other regulations are as follows:
(1) French NF P 18-710 standard [
106].
where
γcf,
γE are the safety factors, which are taken as 1.0 when analyzing the test data in this paper;
k is the prestress influence coefficient, which is taken as 1.0 when there is no prestress;
θ is the angle between the principal compressive stress and the horizontal direction, which can be taken as 45° for reinforced UHPC;
Afv is the area of fiber action on the inclined crack, which can be taken as
bz; and
σf is the residual tensile strength of UHPC.
(2) Swiss SIA 2052 guidelines [
107].
where
fUted and
fUtud are the first crack strength and ultimate tensile strength of UHPC, respectively. For the convenience of calculation, this paper uniformly takes the axial tensile strength of UHPC
ft;
α and
β are the angles between the principal compressive stress and the principal tensile stress and the beam axis direction, respectively.
(3) Japanese JSCE-2006 guidelines [
108].
where
Vp is the shear bearing capacity of the prestressed tendon;
θ is the angle between the component axis and the oblique crack;
Pe is the tension force of the prestressed tendon;
αp is the angle between the prestressed tendon and the horizontal direction; and
γb is the partial coefficient, which is taken as 1.0.
λ is the shear span ratio. When λ < 1.5, λ = 1.5; when λ > 3.0, λ = 3.0; ft is the tensile strength of concrete; and Npo is the tension force of the prestressed tendon.
(5) CECS 38:2004 [
110].
where
βv is 0.45, and
λf =
ρflf/
df.
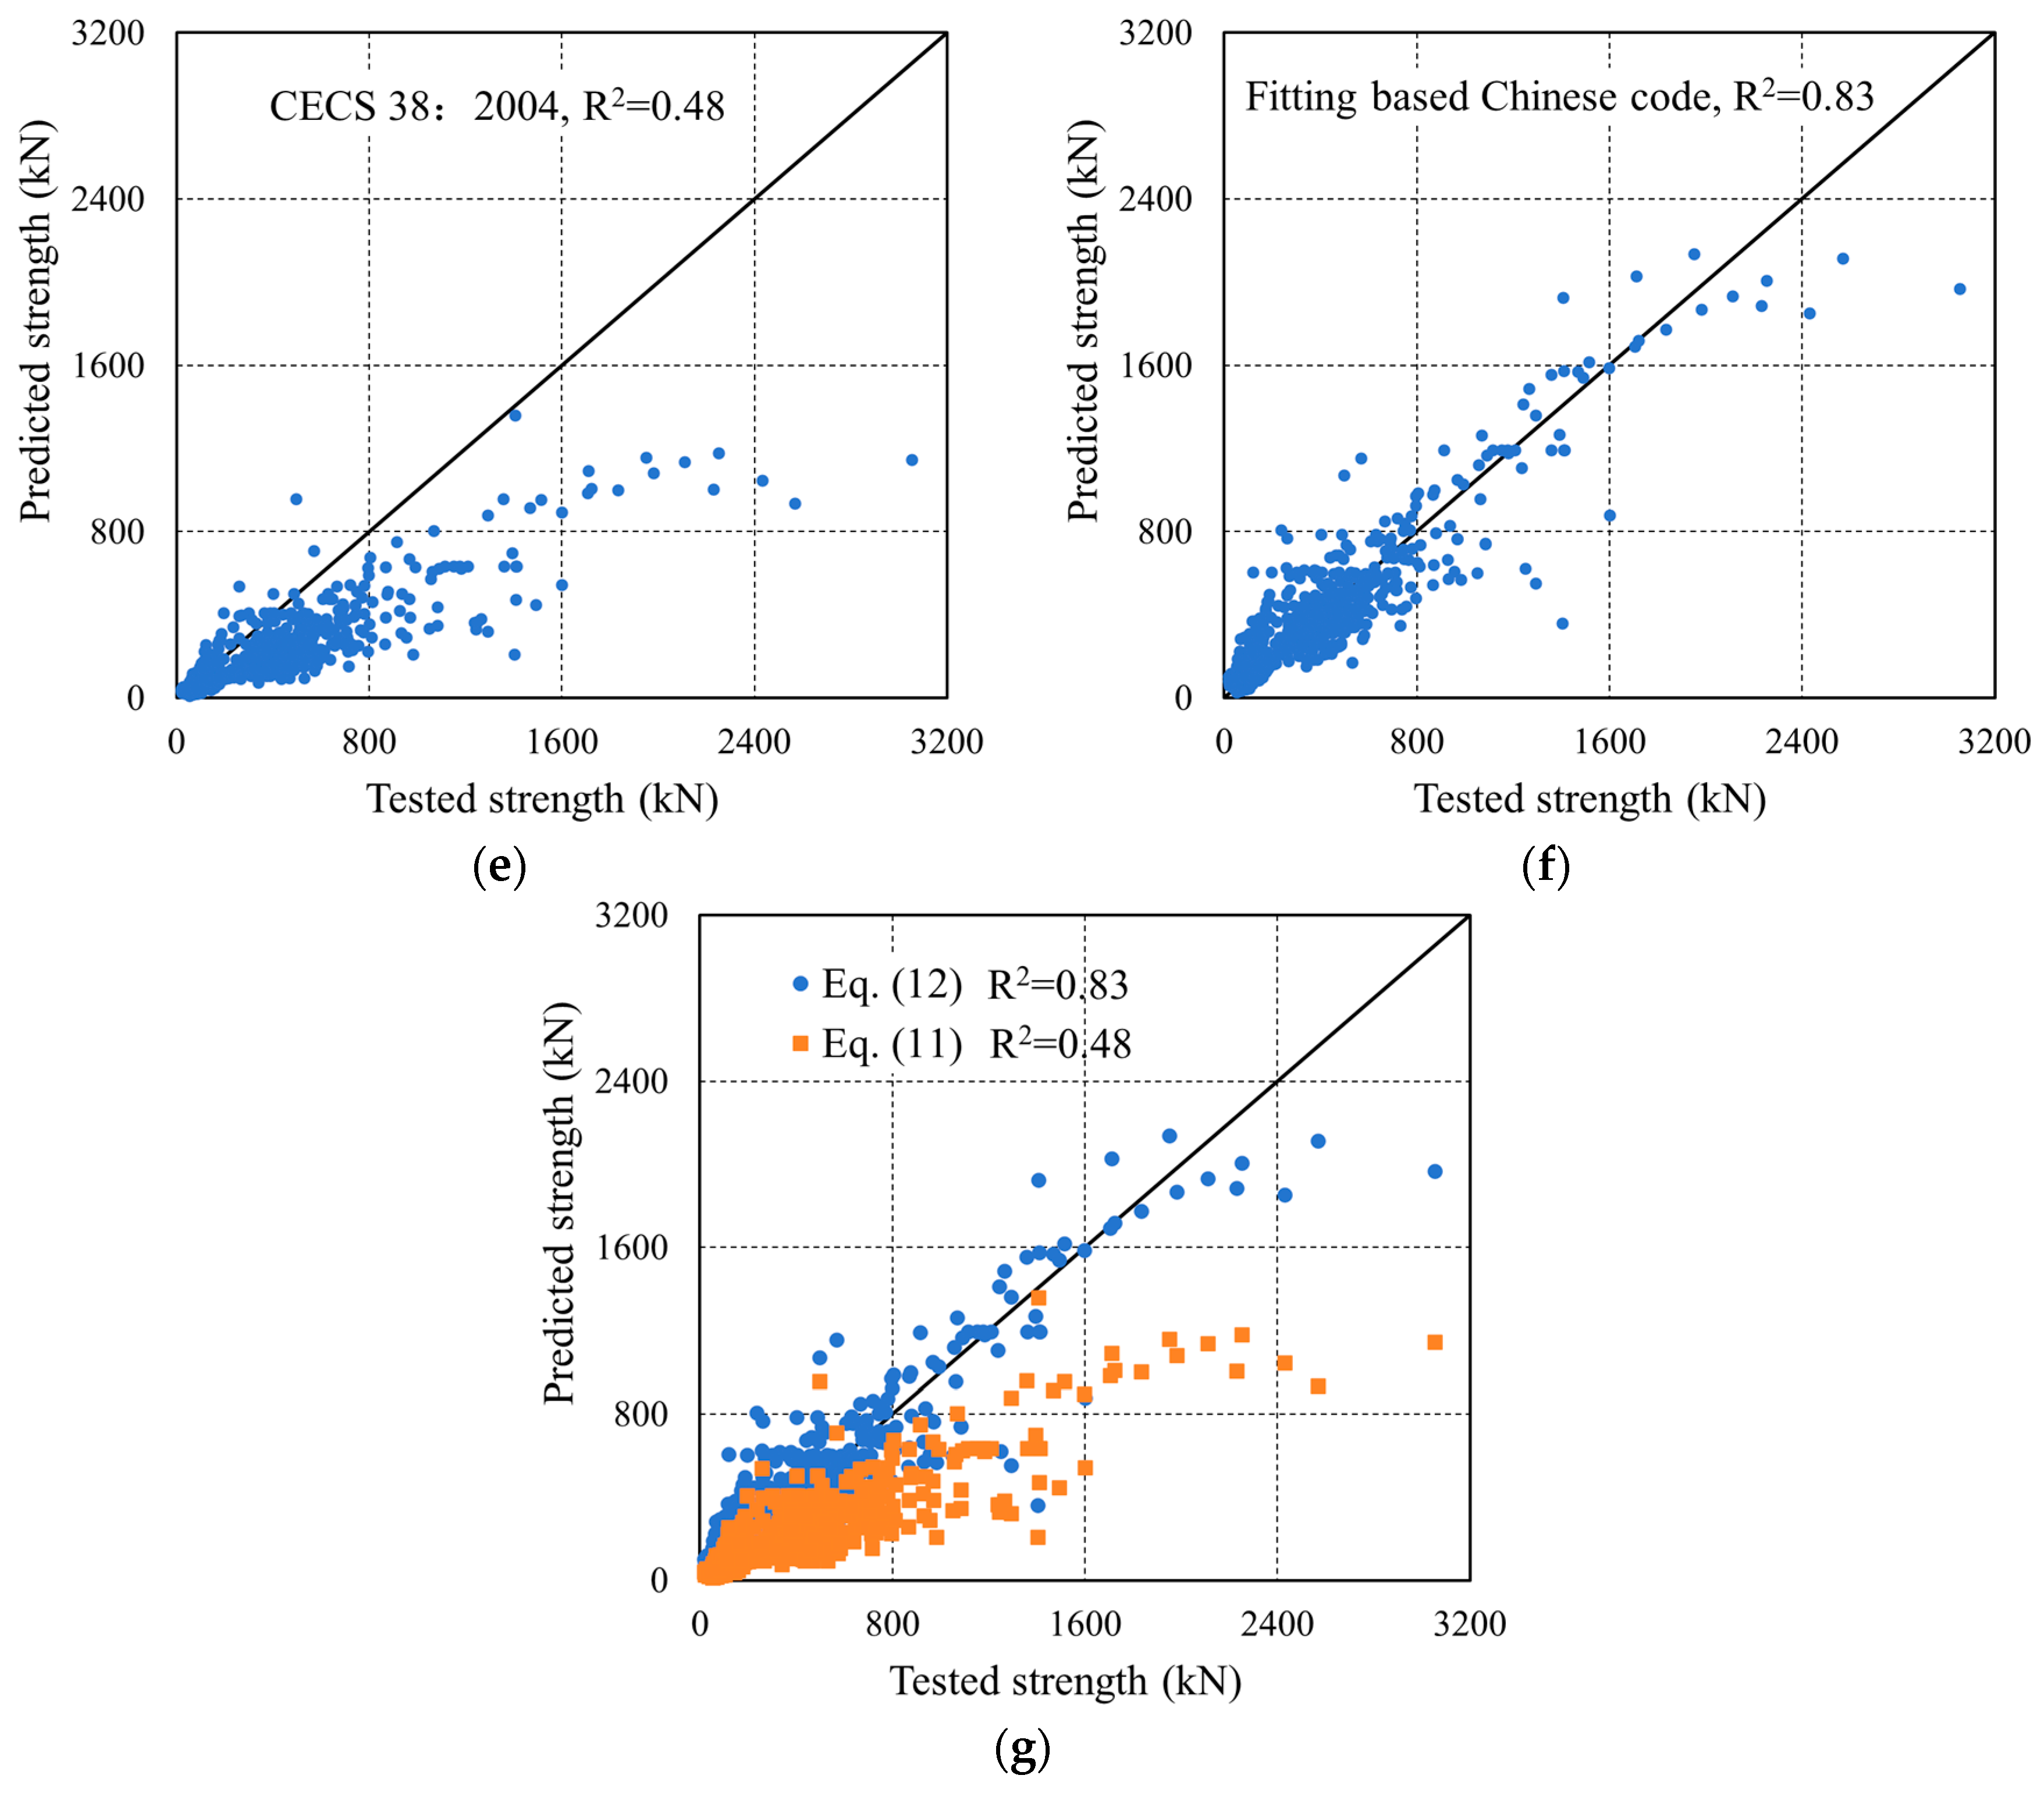
Based on the formulation structure provided in CECS 38:2004 and utilizing the established experimental dataset, a revised empirical equation for the shear capacity of UHPC beams is proposed in Equation (12):
In Equation (12), each bracketed expression (
Xi) is treated as a single fitted regressor; the coefficients
βj are estimated against these composite variables. The following is defined:
with the following coefficients (calibrated on our database):
Figure 17 illustrates the comparison between the predicted and experimental SSC of UHPC beams obtained using different methods, and
Table 12 shows the MAE, MSE, RMSE, R
2 and other values of each calculation method.
The numerical comparison shows that the proposed data-calibrated equation achieves higher accuracy (e.g., higher R
2 with lower MAE/RMSE, presented in
Table 14) than several reference formulas; however, the reasons for the gap are structural.
Scope and calibration domain. Some provisions were not calibrated on UHPC beams or only on narrow ranges of fiber content, reinforcement, and shear span ratios. When applied to our wider dataset—covering rectangular/T/I sections and various a/d—systematic bias appears.
Missing or aggregated mechanisms. Several formulas do not include an explicit fiber term or do not capture fiber–stirrup interactions, size, and a/d effects with sufficient fidelity, leading to under- or over-predictions when fibers control crack bridging or when transverse steel is sparse/dense.
Design format vs. mean prediction. Code expressions often target characteristic resistances with partial safety factors, whereas our benchmarking uses mean test values; this intentional conservatism can manifest as weaker predictive statistics (larger MAE/RMSE, lower R2), even when the provision is appropriate for design safety.
Compared with standard code formulas, the proposed equation (Equation (12)) is spreadsheet-ready and uses the same design-level inputs. It provides, in addition to a point estimate, prediction intervals derived from residuals, enabling reliability-aware choices (e.g., using a one-sided lower bound or a resistance factor ϕ). In practice, this (i) reduces unnecessary conservatism where code formulas are markedly biased for UHPC beams, (ii) keeps implementation cost negligible (single-cell formula, no specialized software), and (iii) remains compatible with code checks, functioning as a companion tool rather than a replacement. For cases outside the data domain, conservative usage (interval lower bound or smaller ϕ) is recommended.
Overall, the performance differences across provisions are consistent with calibration scope and mechanism coverage, while the proposed equation offers a practical, low-cost supplement that improves accuracy and provides transparent uncertainty information for engineering decisions.
8.2. Implications for Engineering Practice
This study offers two complementary deliverables for the design and assessment of UHPC beams in shear:
(1) Code-compatible closed-form design equation.
The proposed formula (Equation (12)) is expressed as a sum-of-force-type regressor with dimensionless coefficients, returning Vu in kN from inputs in MPa/mm. It is spreadsheet-ready, requires only standard design variables (geometry, fc, fiber factor, transverse steel) and is aligned with common code layouts (shear span factor, stirrup term, axial effect). Engineers can thus use it directly for preliminary sizing, option screening, and rapid checks alongside code provisions.
(2) Reliability-aware verification via ML + intervals.
The cross-validated ensemble (boosted trees/stack) supplies a point estimate and a 95% prediction interval (PI) derived from residuals. Two practical uses follow:
Safety margin check: it accepts designs for which the demand VEd is below the 95% lower bound L = Vn − 1.645 σ, with an engineering margin (e.g., VEd ≤ 0.9 L).
Conservative design value: when a single number is required, it adopts Vd = ϕVu, with ϕ chosen to at least remove mean bias (e.g., ϕ ≈ 0.95), or takes Vd = L for a one-sided 95% design.
(3) Where it helps most.
- -
Fiber–stirrup trade-off: the explicit terms in Equation (12) and feature importance from ML highlight how the stirrup spacing s and fiber content ρf jointly influence capacity, informing economical mixes of transverse steel and fibers in short-span/low-height members.
- -
Assessment/retrofit: for existing members with measured properties, the model provides an unbiased capacity estimate with quantified uncertainty, aiding rating decisions and retrofit prioritization.
- -
Parametric exploration: rapid “what-if” scans (e.g., changing a/d, ρsv, ρf) identify efficient regions before detailed nonlinear analysis.
(4) Applicability domain.
The formula and ML models are calibrated over the database ranges reported in the paper. For inputs outside these ranges, (i) it flags as extrapolation, (ii) relies on the lower PI bound or a smaller ϕ, and (iii) corroborates with mechanics-based checks. Before use, it ensures unit consistency (MPa, mm, kN) and that composite regressors (bracketed terms) are computed as kN.
(5) Workflow for practice.
Step 1: Use Equation (12) for a first estimate of Vu (kN).
Step 2: Perform code checks required by the governing standard.
Step 3: Verify with the ML predictor and extract the 95% PI.
Step 4: Select a conservative design value via Vd = ϕVu (e.g., ϕ ≈ 0.95) or the PI lower bound; document the choice and the input ranges.
In summary, the closed-form equation supports fast, code-compatible estimation, while the ML + PI verification adds a transparent, reliability-aware layer for critical design decisions.
While this work targets shear resistance, design should also check rotation capacity in the prospective plastic-hinge region. Recent analyses indicate that the available plastic rotation depends on the plasticization length and boundary restraint and that insufficient ductility can govern ultimate capacity via premature (non-fully developed) mechanisms. In UHPC members, the longitudinal reinforcement ratio/detailing, transverse reinforcement (stirrups), and fiber bridging jointly influence crack control, confinement, hinge length, and thus, rotation capacity for redistribution. We therefore flag ductility verification as a companion check to shear and plan a follow-up study that curates rotation-capacity indicators and develops uncertainty-aware predictors under the same grouped-CV protocol [
111,
112].
