
Improved Grain Boundary Reconstruction Method Based on Channel Attention Mechanism


Abstract
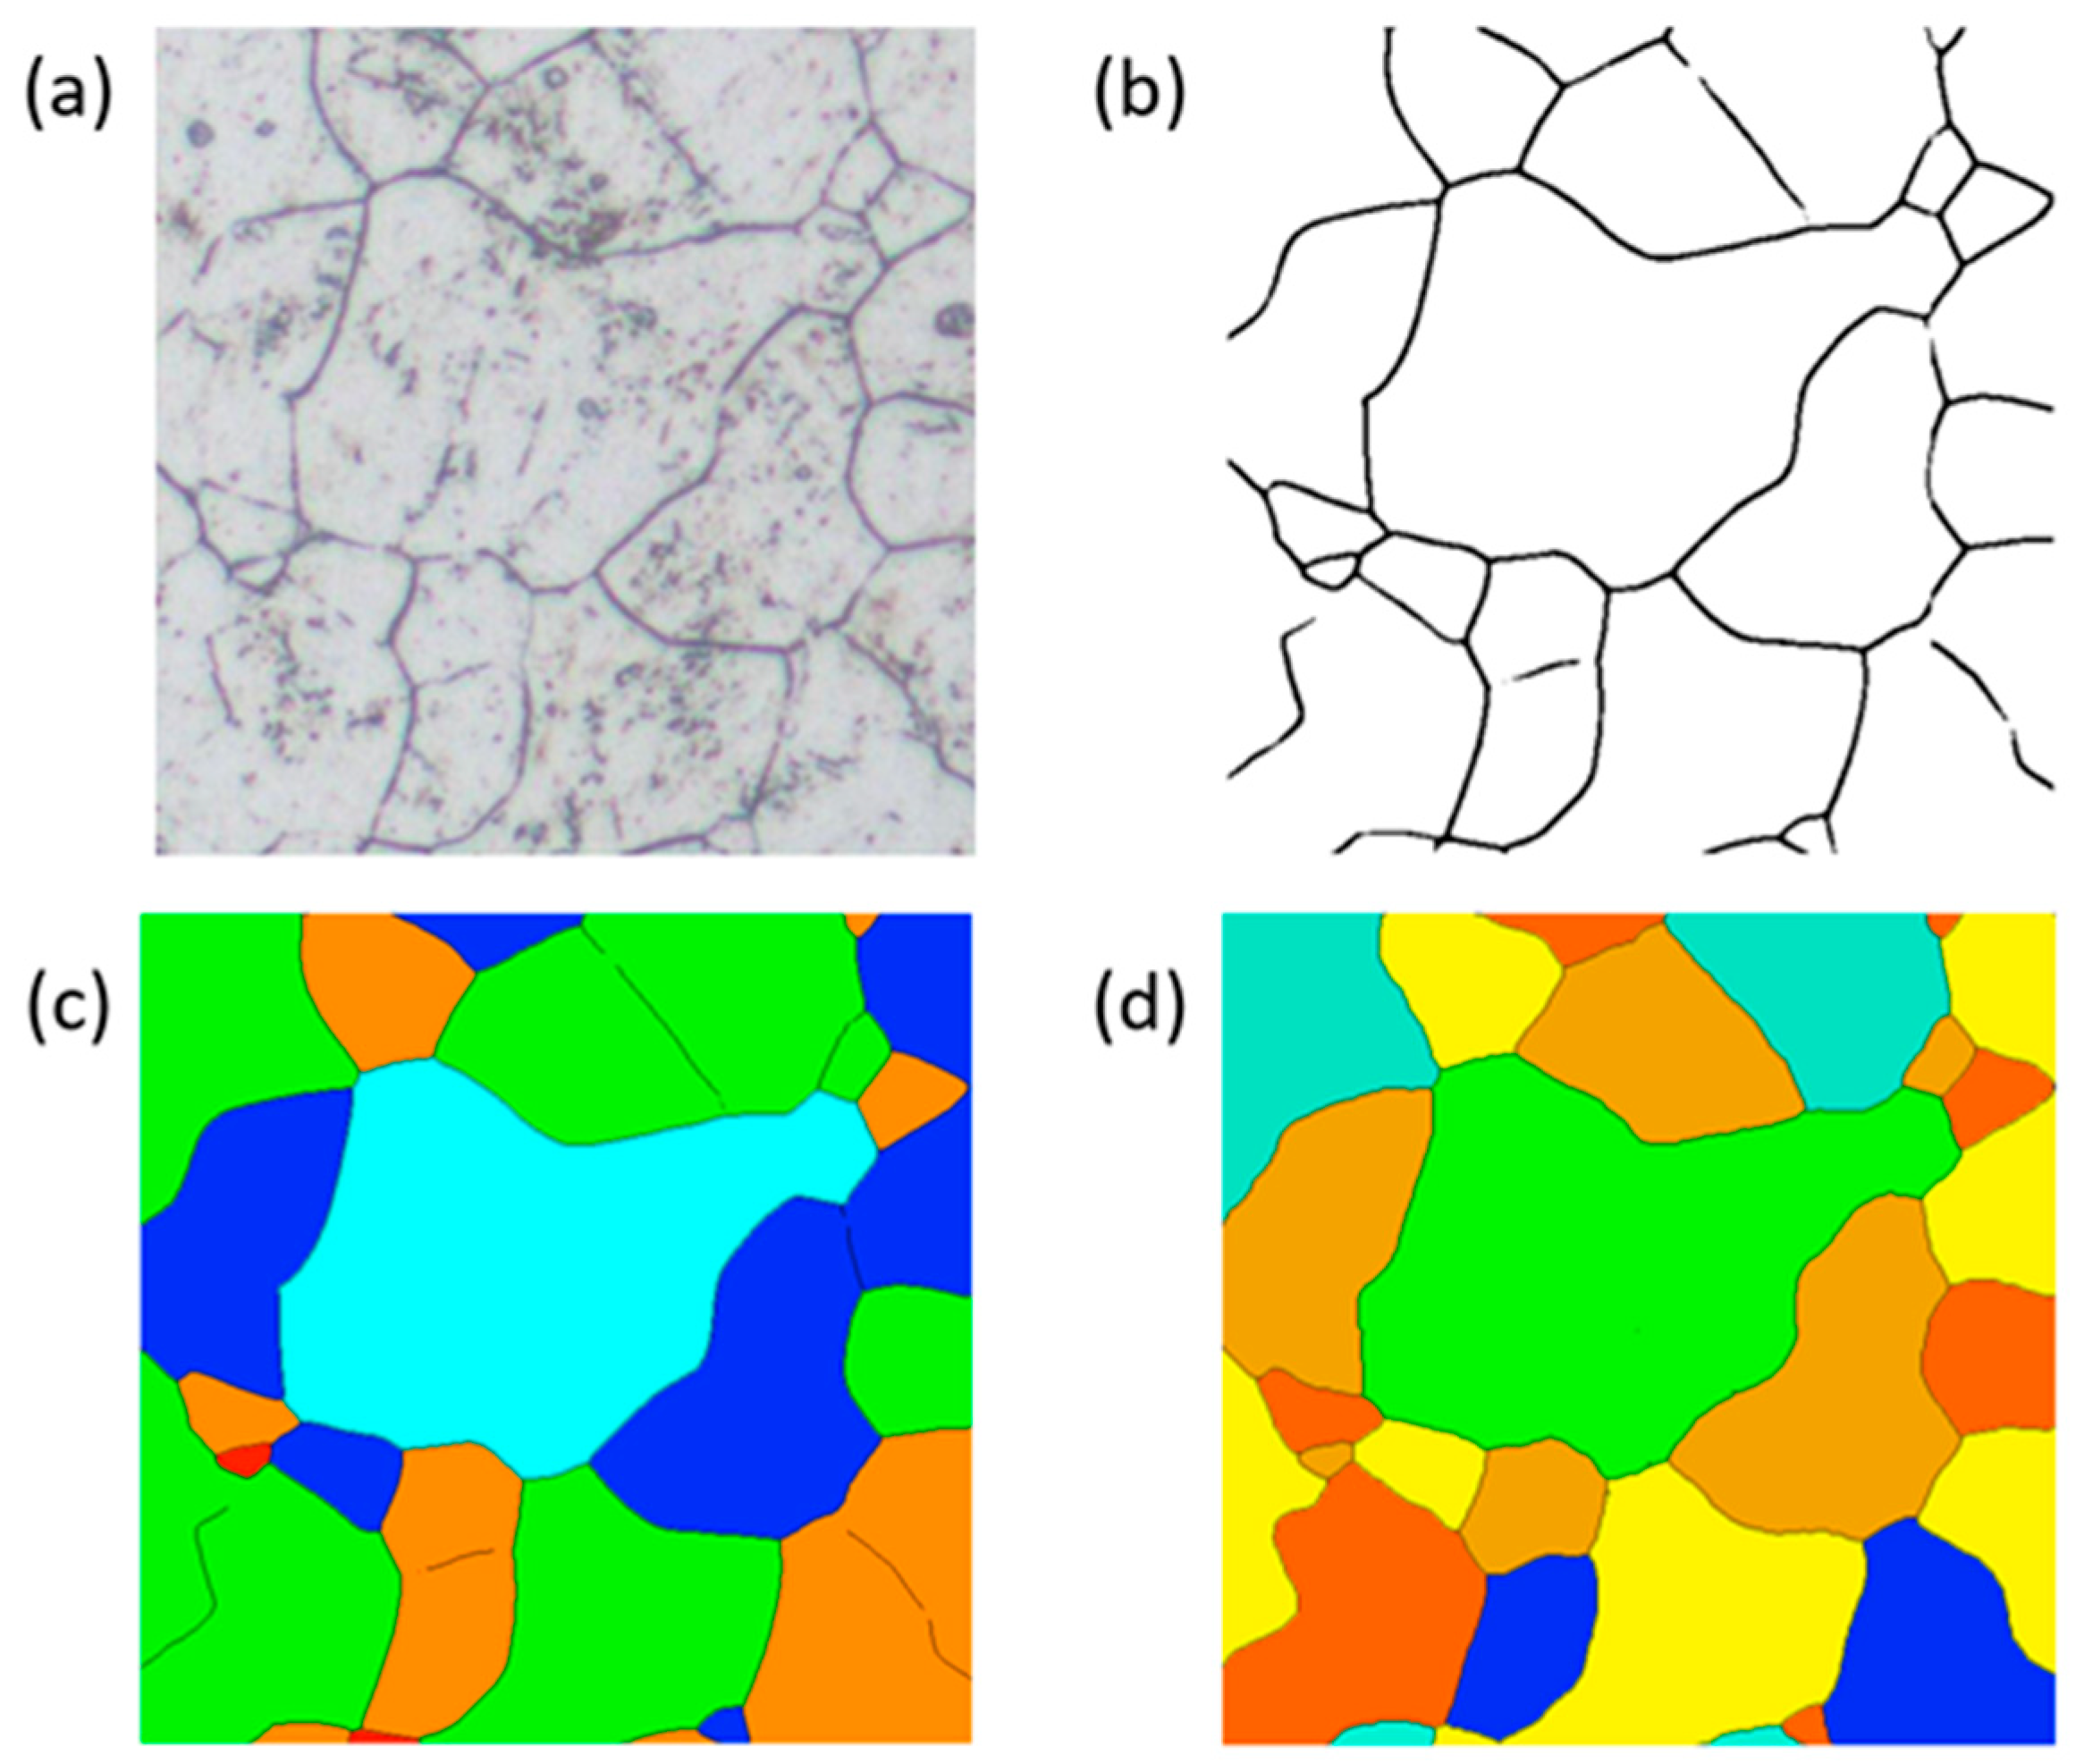
1. Introduction
2. Grain Boundary Reconstruction Model
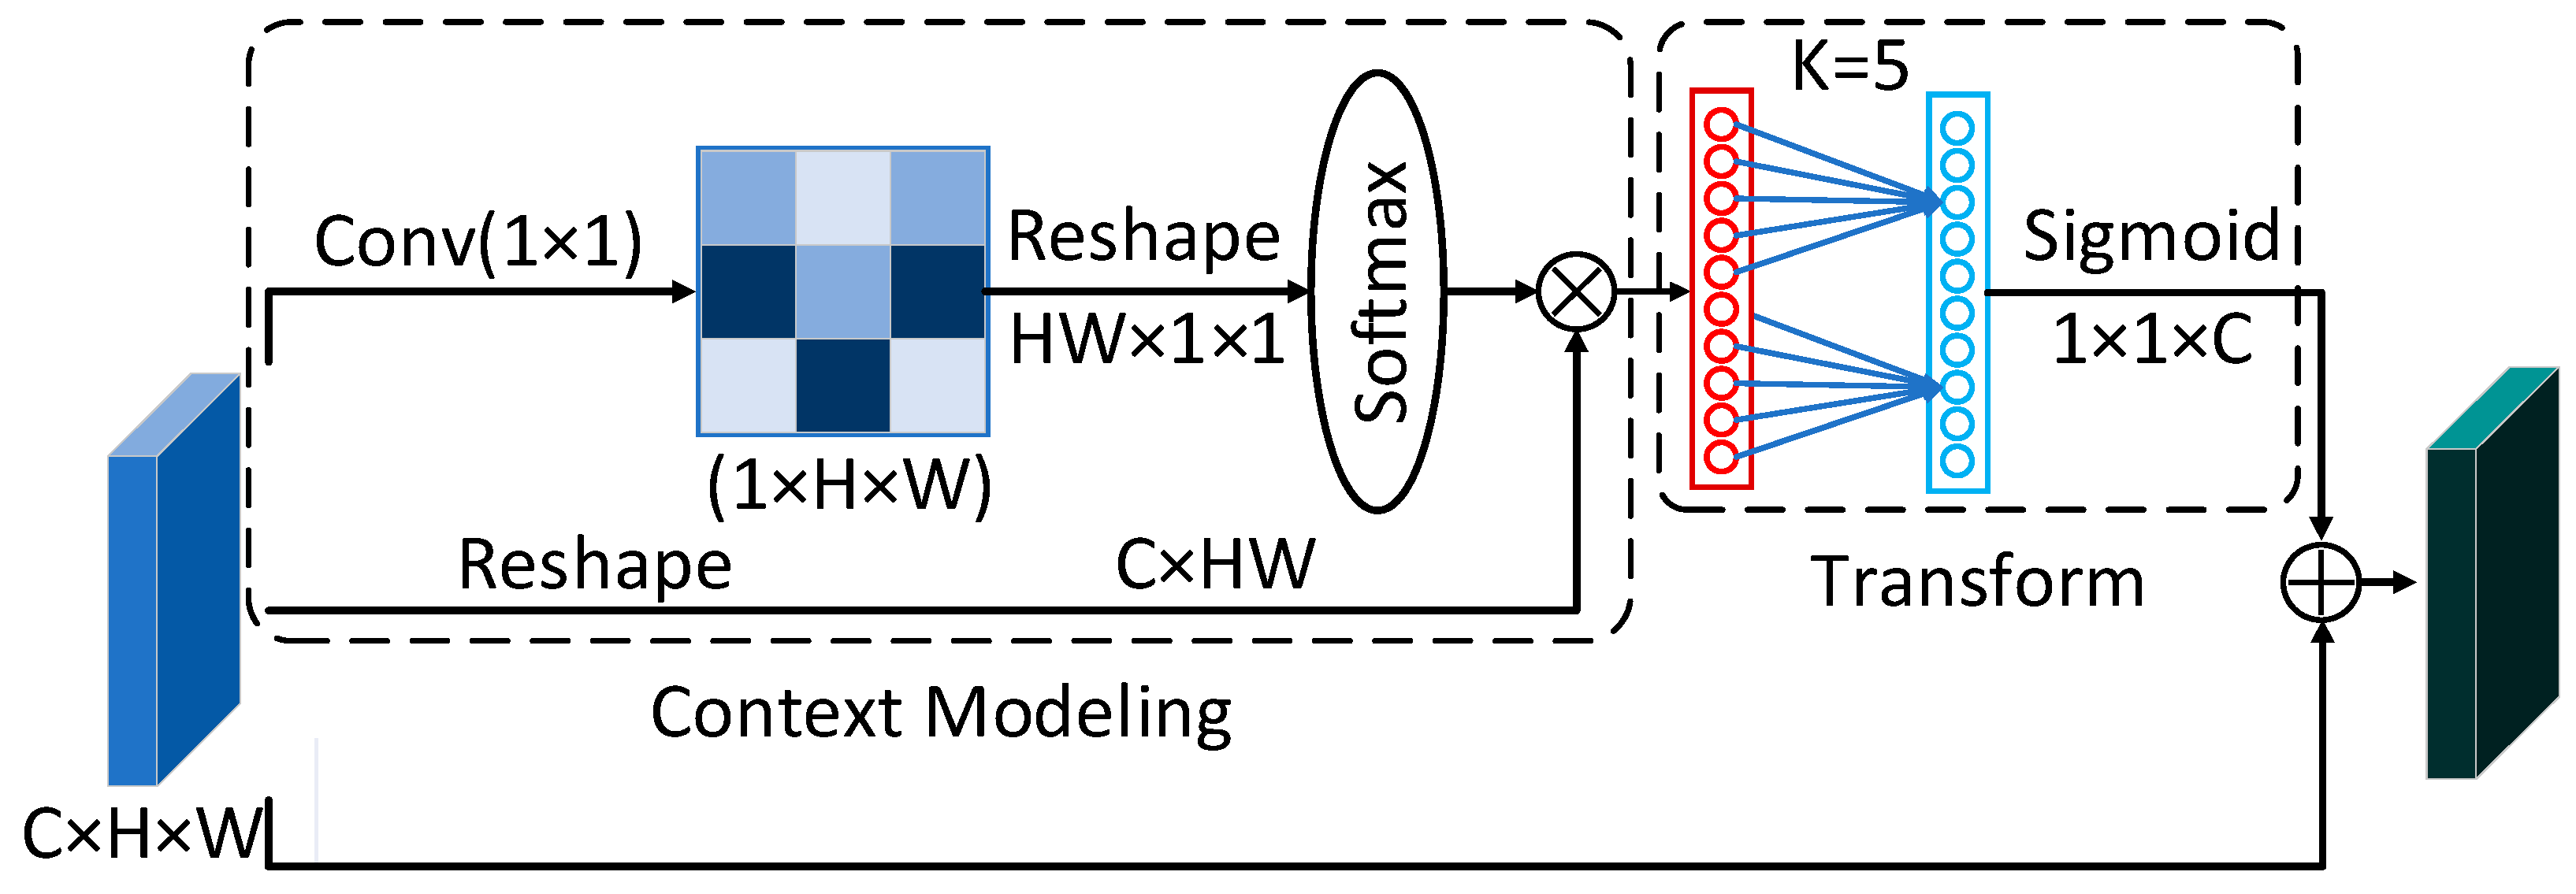
2.1. Improved Channel Attention Mechanism
2.2. Improved Loss Function
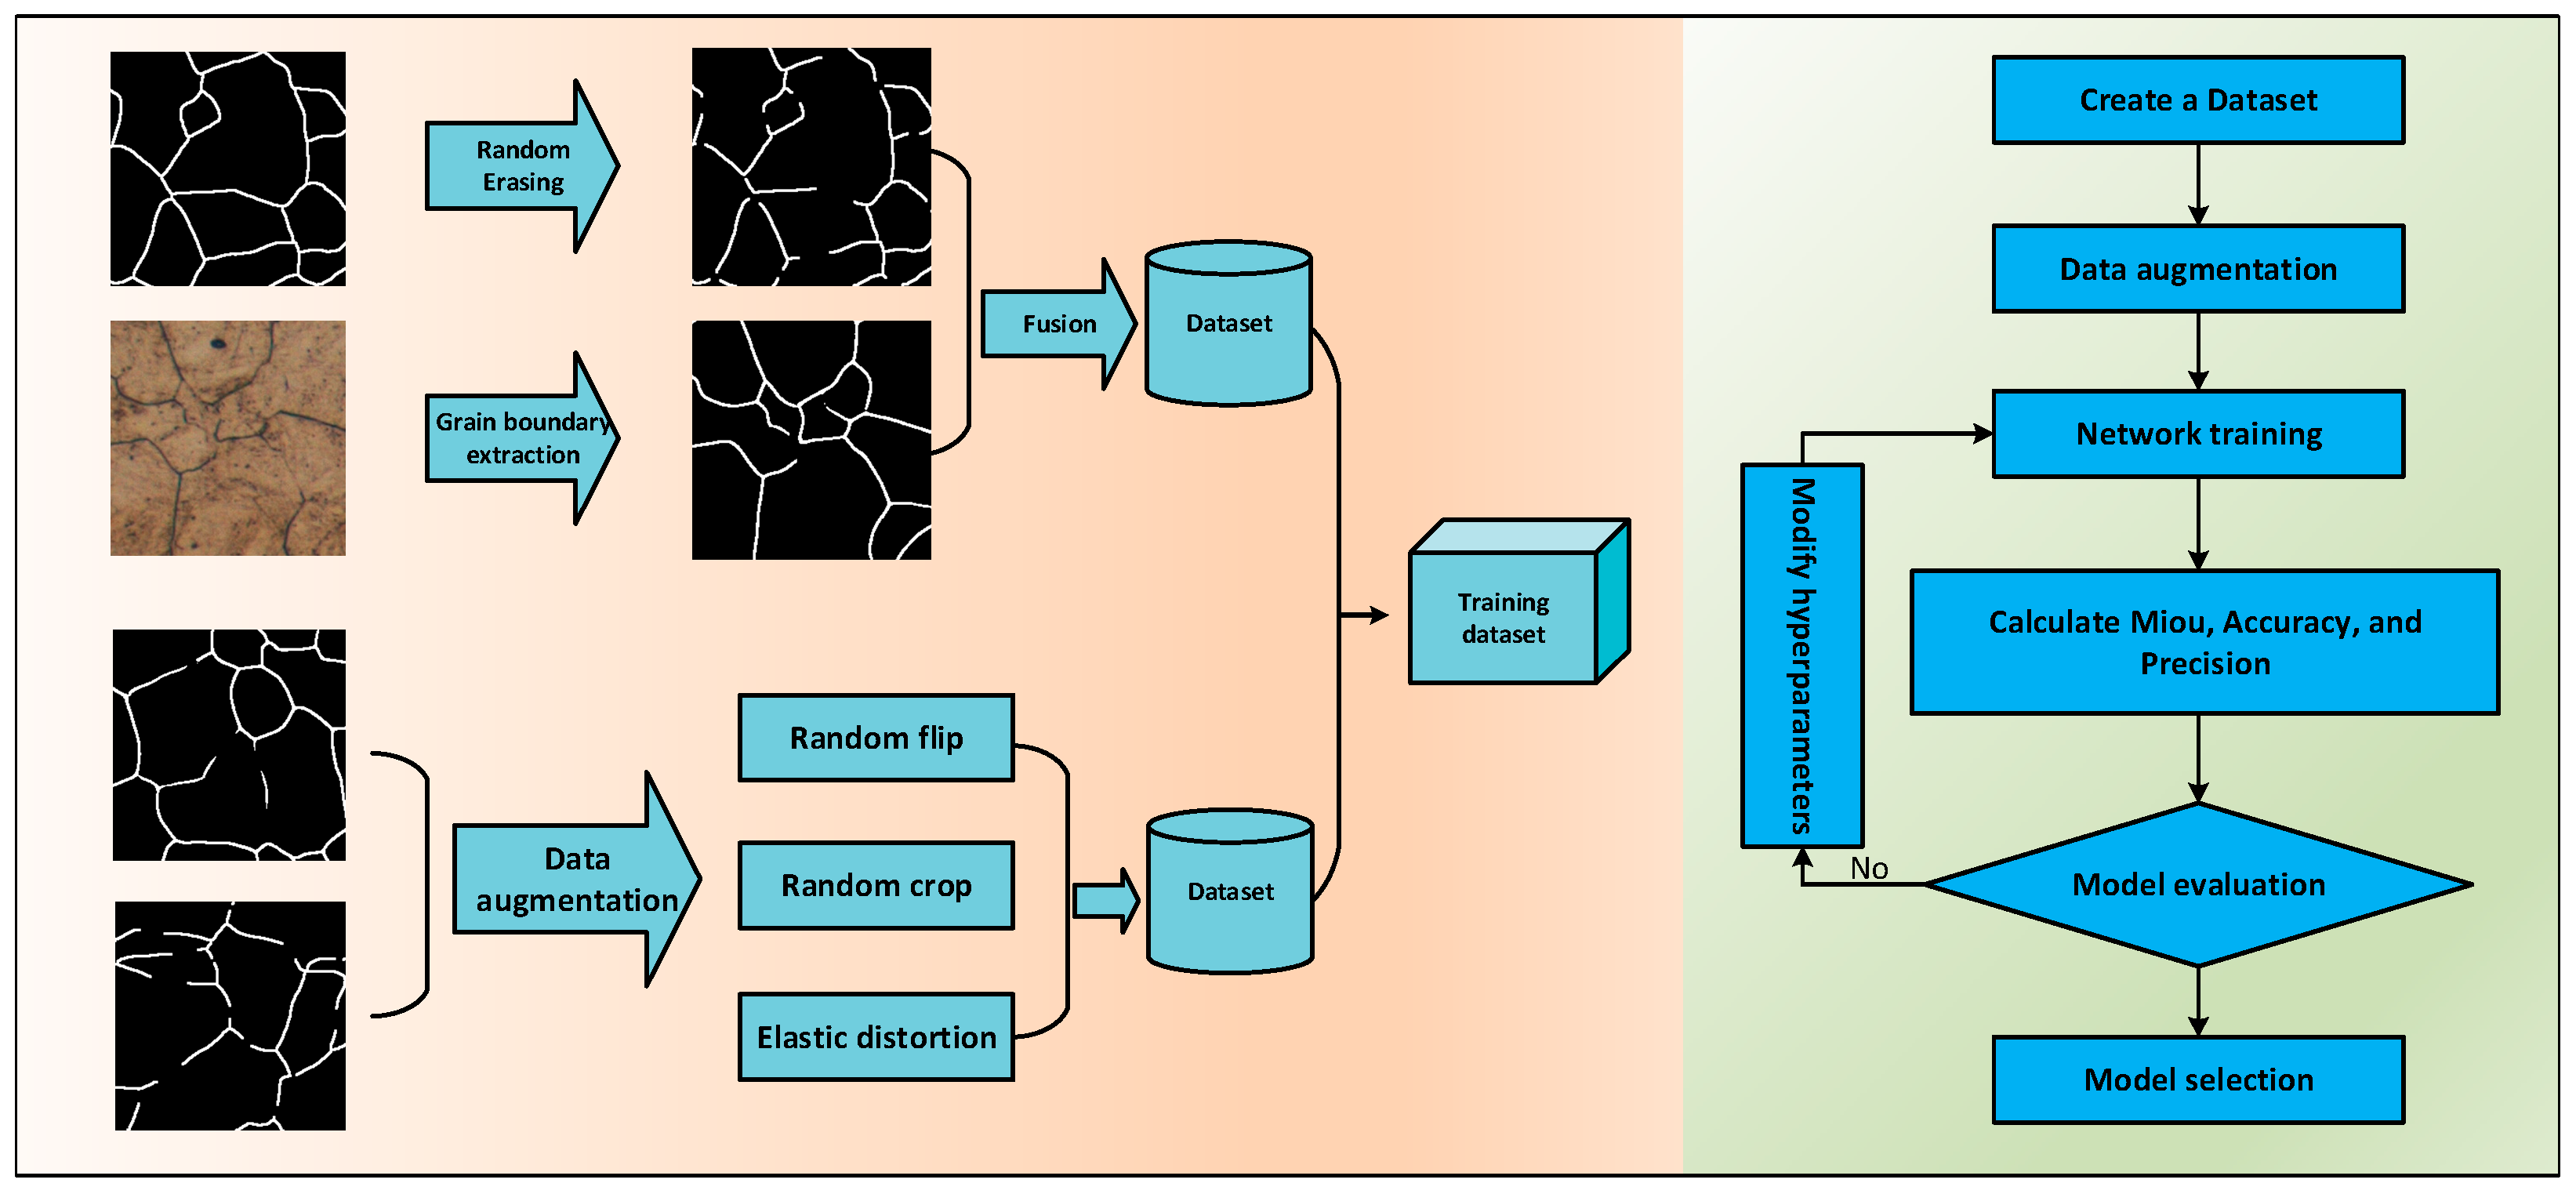
2.3. Dataset Preparation and Training
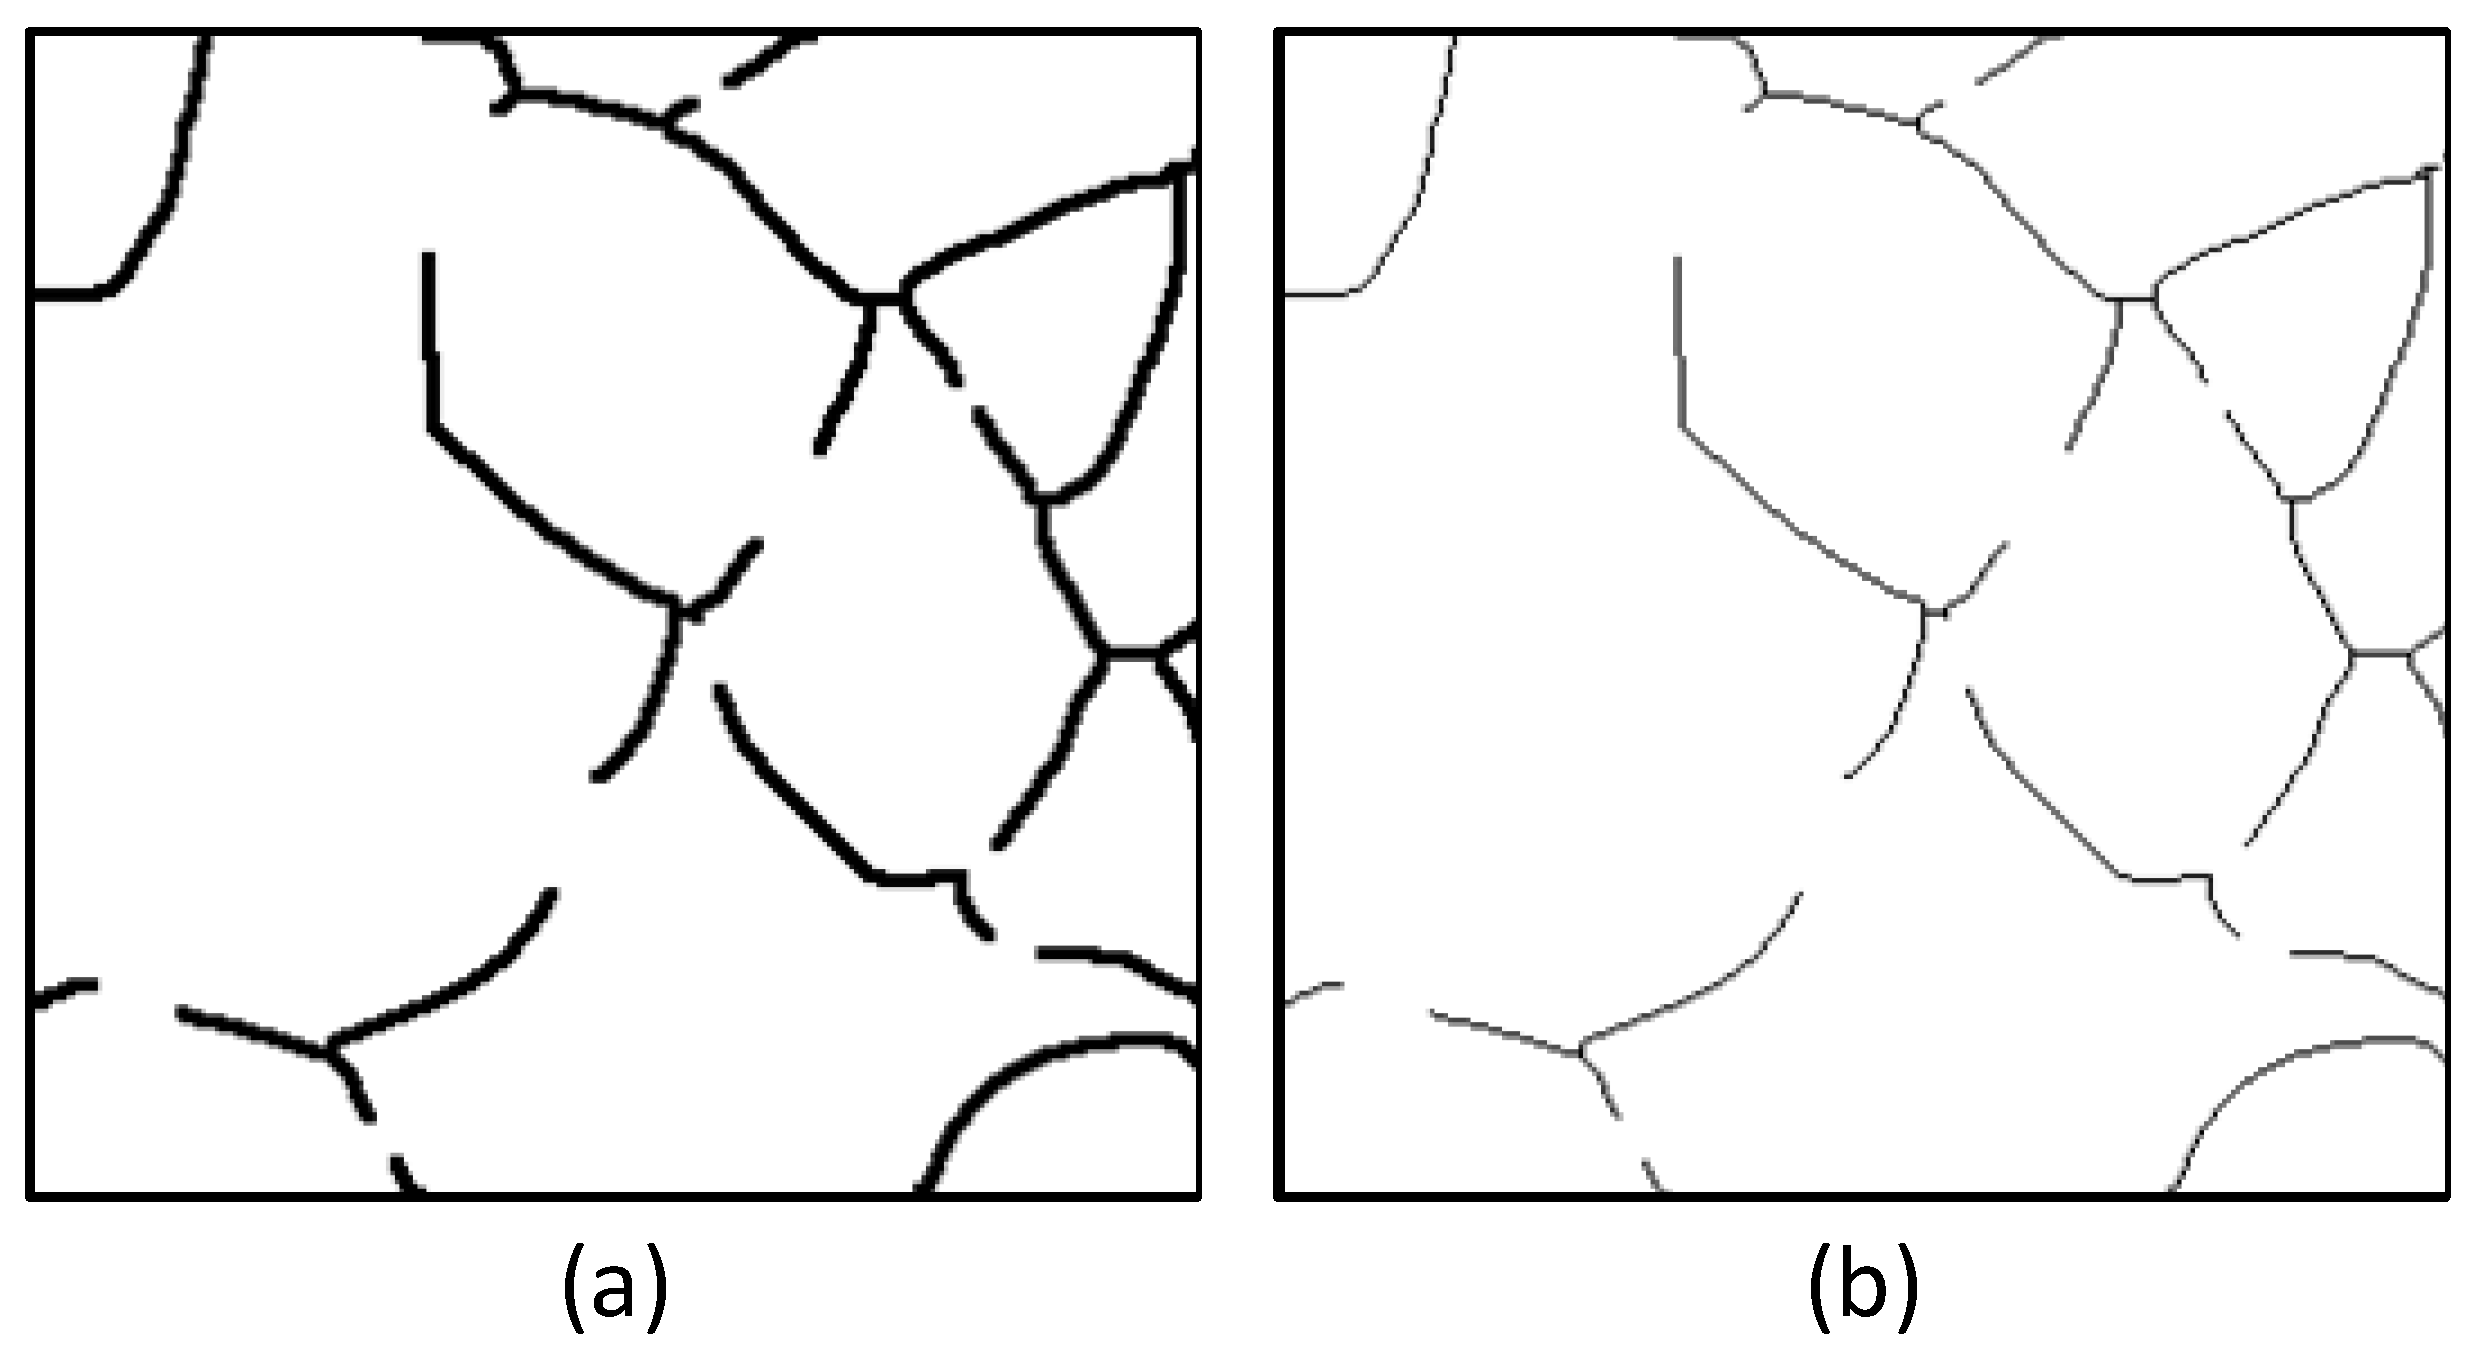
3. Results and Discussion
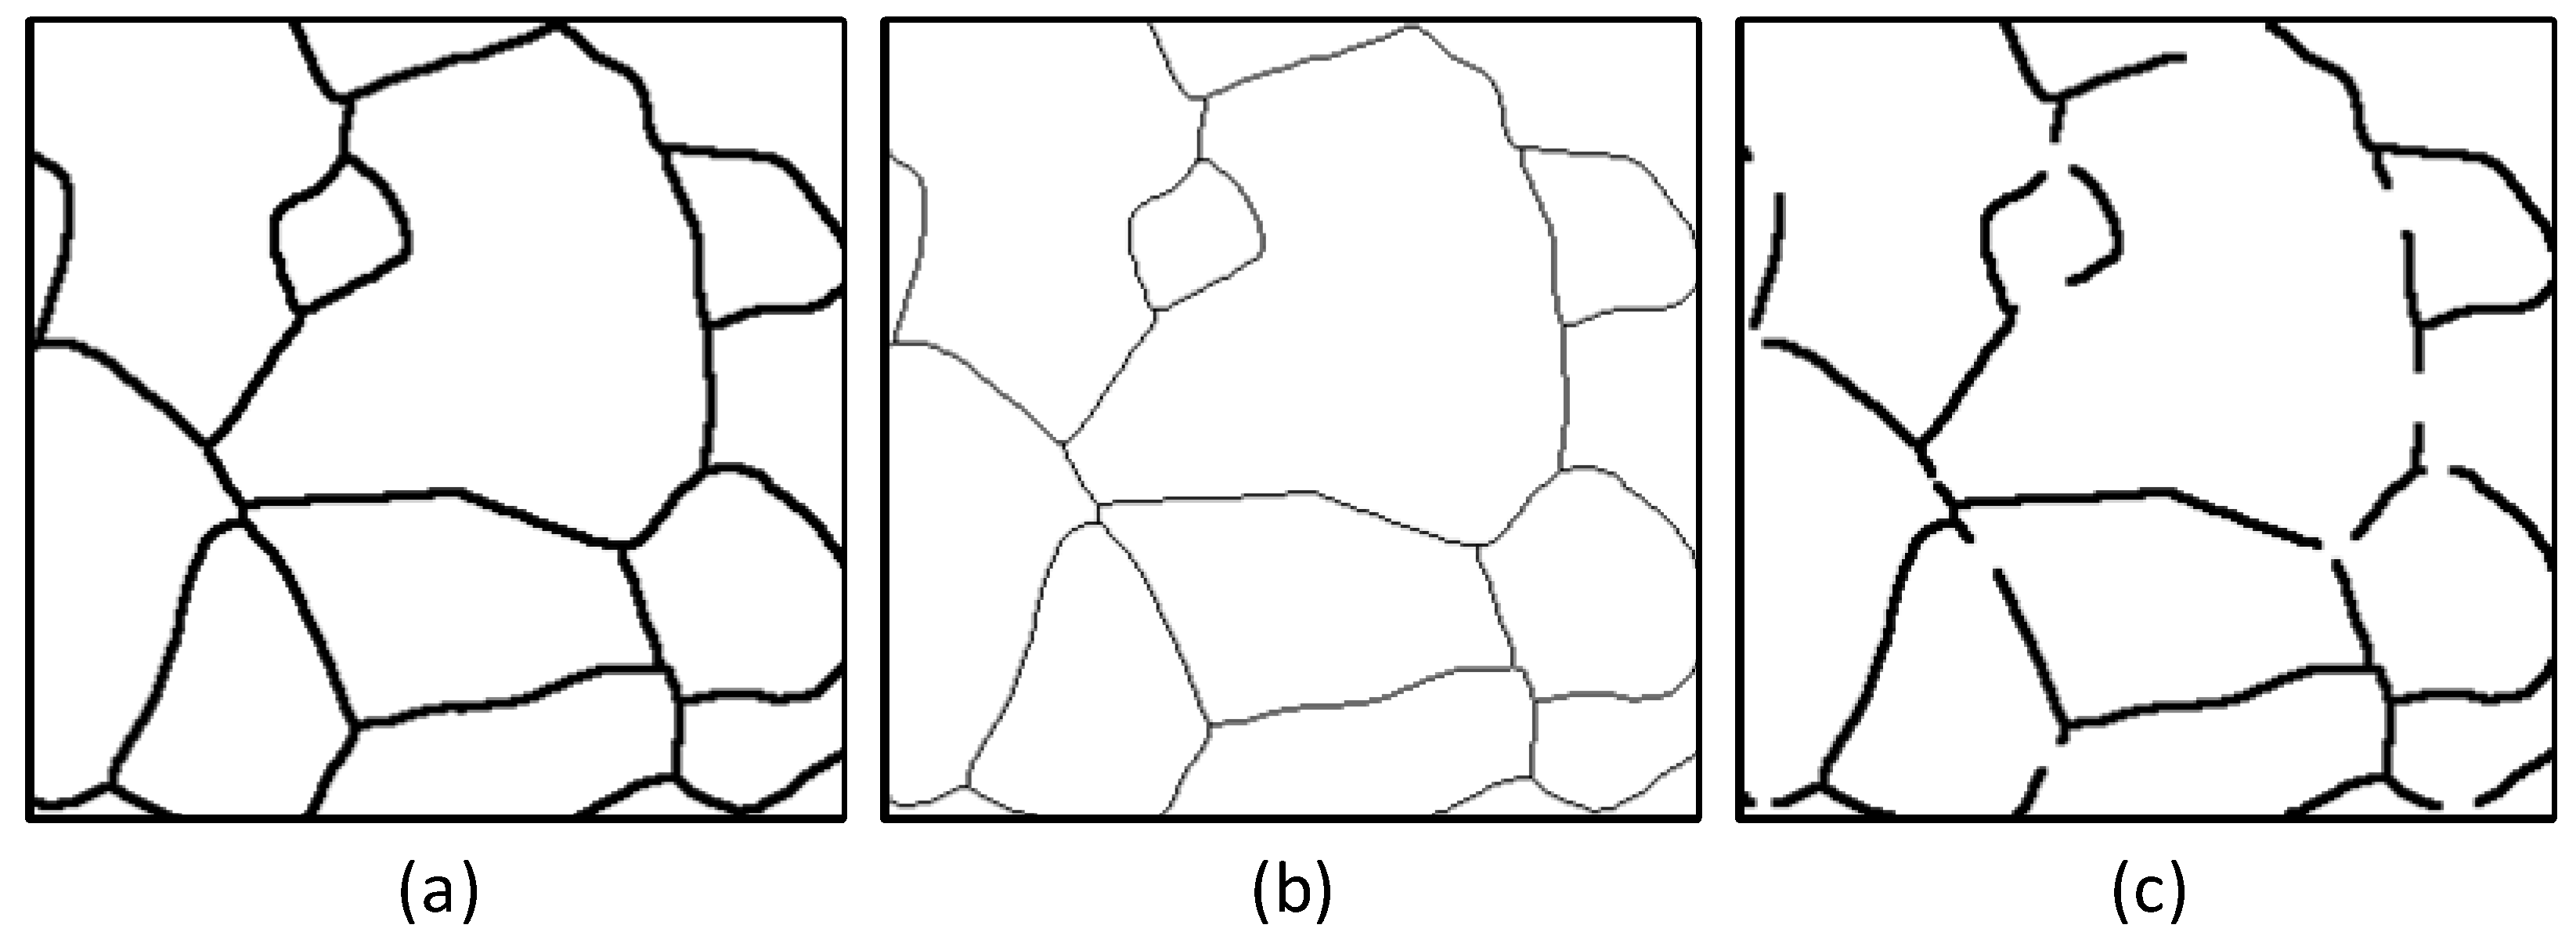
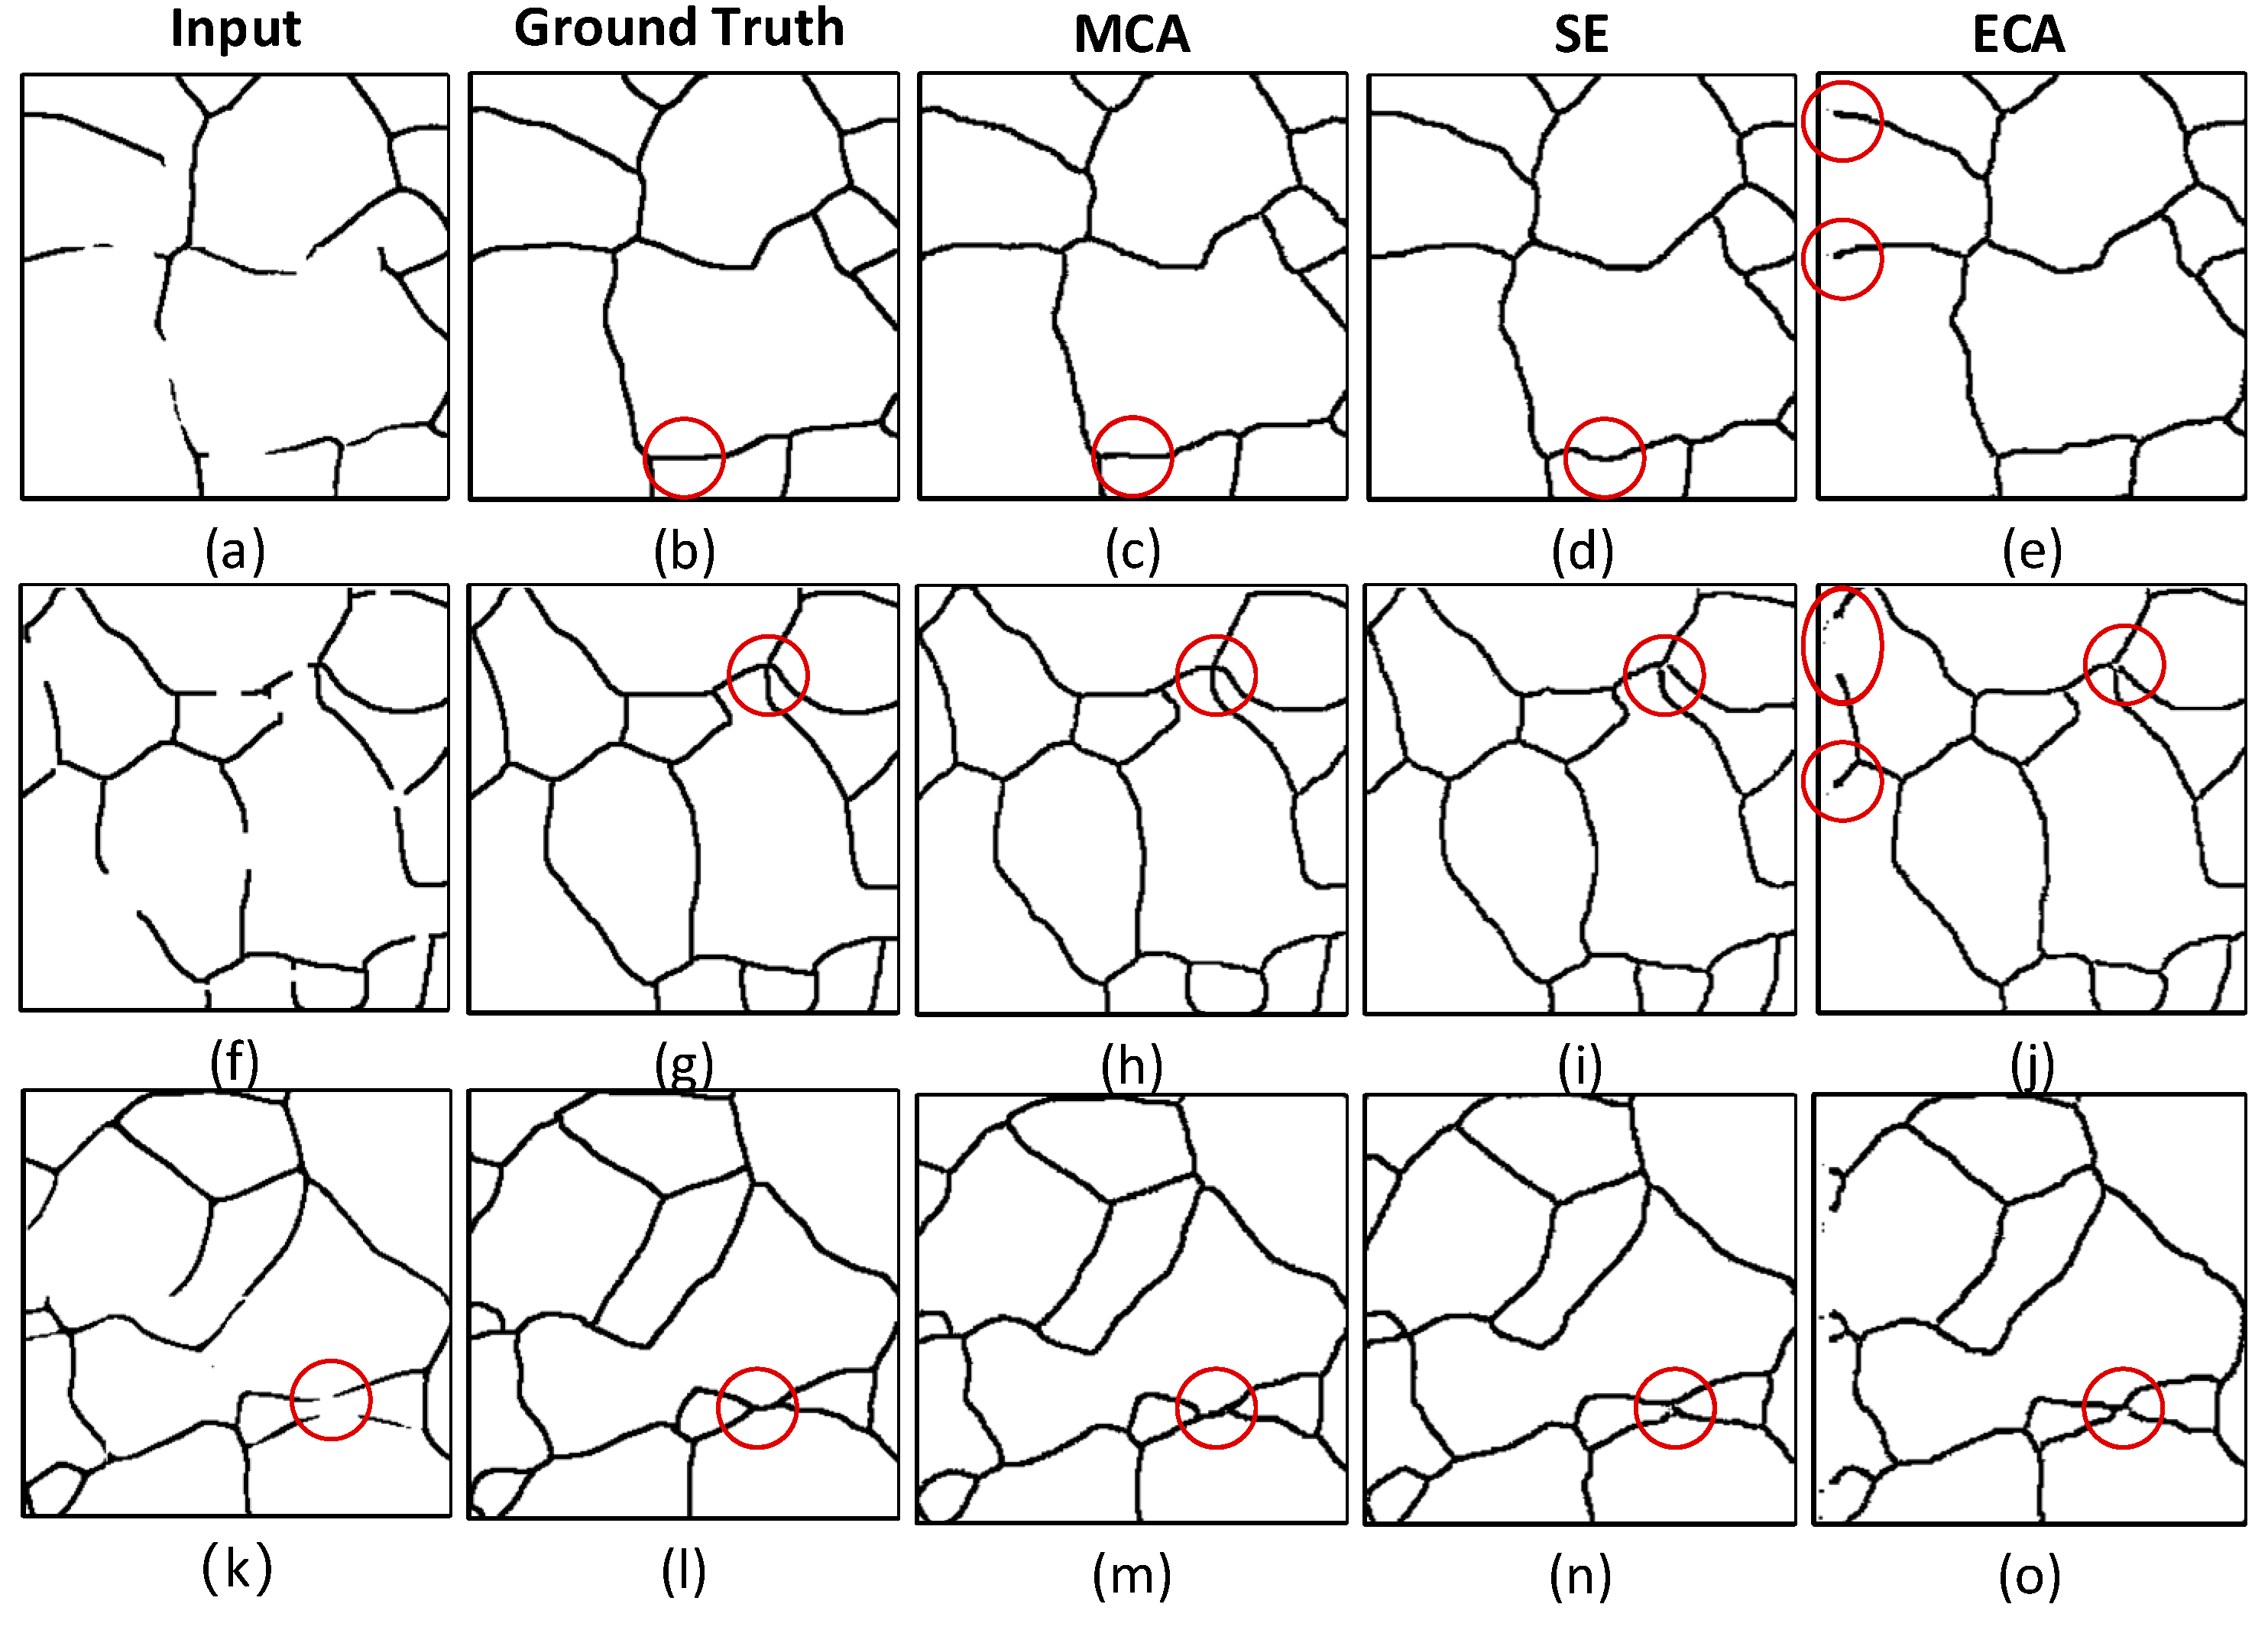
3.1. Performance Analysis of the Channel Attention Module
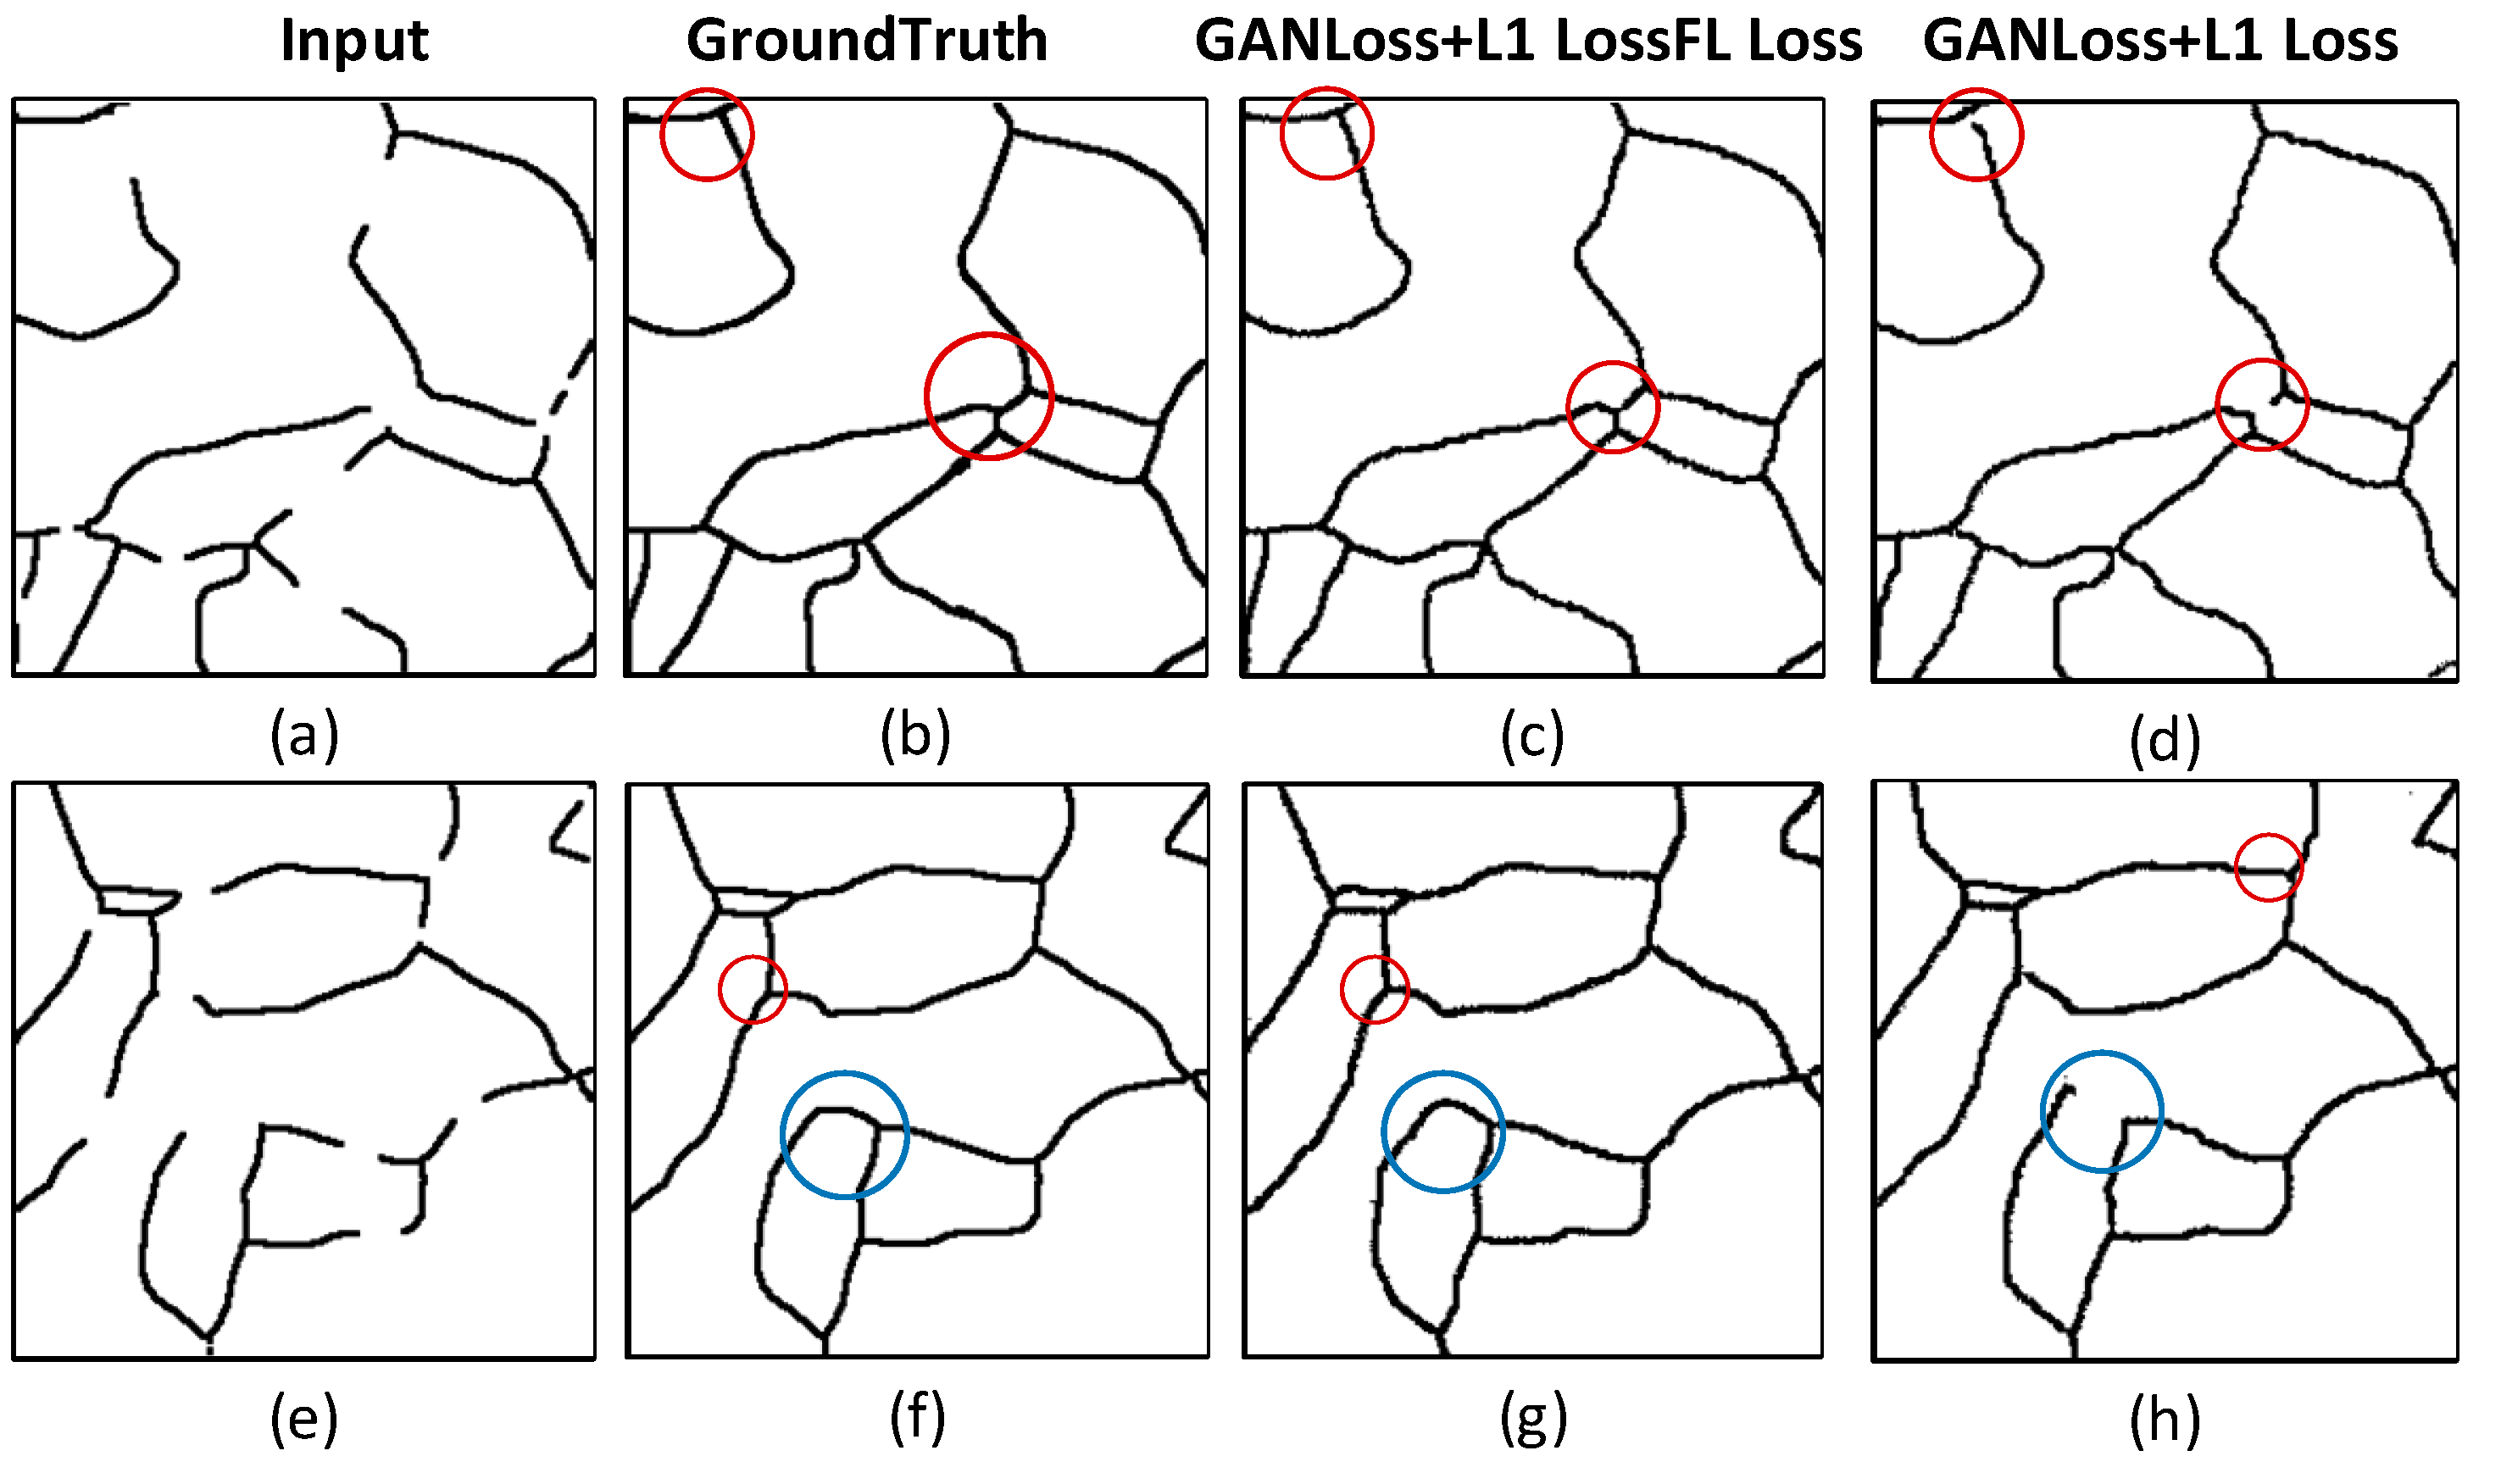
3.2. Performance Analysis of the Loss Function
3.3. Validation of Grain Boundary Reconstruction Effectiveness by Grain Size Grading
4. Conclusions
Author Contributions
Funding
Institutional Review Board Statement
Informed Consent Statement
Data Availability Statement
Acknowledgments
Conflicts of Interest
References
- Bahmani, A.; Moradi, S.; Lotfpour, M.; Jeong, H.T.; Kim, W.J. Effect of grain size on the corrosion resistance of the Fe41Mn25Ni24Co8Cr2 high entropy alloy. Corros. Sci. 2024, 230, 111892. [Google Scholar] [CrossRef]
- Wang, H.; Dong, B.S.; Chen, Z.B.; Liu, J.Q.; Haghdadi, N.; Lu, R.Q.; Primig, S.; Wang, Z.Y.; Pan, Z.X.; Li, H.J.; et al. Effect of compositional heterogeneity on the mechanical properties of a single-phase Cu-9Al alloy with different grain sizes. Acta Mater. 2024, 263, 119531. [Google Scholar] [CrossRef]
- Wang, B.B.; An, X.H.; Xue, P.; Liu, F.C.; Ni, D.R.; Xiao, B.L.; Liu, Y.D.; Ma, Z.Y. Grain size effects on high cycle fatigue behaviors of pure aluminum. Int. J. Fatigue 2023, 170, 107556. [Google Scholar] [CrossRef]
- Shou, H.; He, L.; Zheng, J.; Li, T.; Xia, L.; Yin, D. The effect of grain size on deformation modes and deformation heterogeneity in a rolled Mg–Zn–Ca alloy. J. Mater. Res. Technol. 2023, 22, 1723–1736. [Google Scholar] [CrossRef]
- Cusator, A.; Key, N.L. Development of a novel transonic fan casing making use of rapid prototyping and additive manufacturing. Appl. Sci. 2024, 14, 8400. [Google Scholar] [CrossRef]
- Gupta, S.; Sarkar, J.; Kundu, M.; Bandyopadhyay, N.; Ganguly, S. Automatic recognition of SEM microstructure and phases of steel using LBP and random decision forest operator. Measurement 2020, 151, 107224. [Google Scholar] [CrossRef]
- Wang, Y.H.; He, Q.; Xie, Z. Grain boundary extraction method based on pixel relationship. Measurement 2022, 202, 111796. [Google Scholar] [CrossRef]
- Banerjee, S.; Chakraborti, P.C.; Saha, S.K. An automated methodology for grain segmentation and grain size measurement from optical micrographs. Measurement 2019, 140, 142–150. [Google Scholar] [CrossRef]
- Berus, L.; Skakun, P.; Rajnovic, D.; Janjatovic, P.; Sidjanin, L.; Ficko, M. Determination of the grain size in single-phase materials by edge detection and concatenation. Metals 2020, 10, 1381. [Google Scholar] [CrossRef]
- Cheetham, A.K.; Seshadri, R. Artificial intelligence driving materials discovery? perspective on the article: Scaling deep learning for materials discovery. Chem. Mater. 2024, 36, 3490–3495. [Google Scholar] [CrossRef] [PubMed]
- Yang, H.; Gao, J.; Heng, F.; Cheng, Q.; Liu, Y. A deep neural network method for LCF life prediction of metal materials with small sample experimental data. Met. Mater. Int. 2024, 30, 1667–1686. [Google Scholar] [CrossRef]
- Wang, G.Q.; Zhang, C.Z.; Chen, M.S.; Lin, Y.C.; Tan, X.H.; Kang, Y.X.; Wang, Q.; Zeng, W.-D.; Zhao, W.-W. A high-accuracy and lightweight detector based on a graph convolution network for strip surface defect detection. Adv. Eng. Inform. 2024, 59, 102280. [Google Scholar] [CrossRef]
- Li, J.; Wang, J.; Lin, F.; Wu, W.; Chen, Z.M.; Heidari, A.A.; Chen, H. DSEUNet: A lightweight UNet for dynamic space grouping enhancement for skin lesion segmentation. Expert Syst. Appl. 2024, 255, 124544. [Google Scholar] [CrossRef]
- Ding, W.; Sun, Y.; Huang, J.; Ju, H.; Zhang, C.; Yang, G.; Lin, C.-T. RCAR-UNet: Retinal vessel segmentation network algorithm via novel rough attention mechanism. Inf. Sci. 2024, 657, 120007. [Google Scholar] [CrossRef]
- Patrick, M.J.; Eckstein, J.K.; Lopez, J.R.; Toderas, S.; Asher, S.A.; Whang, S.I.; Levine, S.; Rickman, J.M.; Barmak, K. Automated Grain Boundary Detection for Bright-Field Transmission Electron Microscopy Images via U-Net. Microsc. Microanal. 2023, 29, 1968–1979. [Google Scholar] [CrossRef] [PubMed]
- Shi, P.; Duan, M.; Yang, L.; Feng, W.; Ding, L.; Jiang, L. An improved U-net image segmentation method and its application for metallic grain size statistics. Materials 2022, 15, 4417. [Google Scholar] [CrossRef] [PubMed]
- Li, M.; Chen, D.; Liu, S.; Liu, F. Grain boundary detection and second phase segmentation based on multi-task learning and generative adversarial network. Measurement 2020, 162, 107857. [Google Scholar] [CrossRef]
- Warren, P.; Raju, N.; Prasad, A.; Hossain, S.; Subramanian, R.; Kapat, J.; Manjooran, N.; Ghosh, R. Grain and grain boundary segmentation using machine learning with real and generated datasets. Comput. Mater. Sci. 2024, 233, 112739. [Google Scholar] [CrossRef]
- Zhou, M.; Liu, X.; Yi, T.; Bai, Z.; Zhang, P. A superior image inpainting scheme using Transformer-based self-supervised attention GAN model. Expert Syst. Appl. 2023, 233, 120906. [Google Scholar] [CrossRef]
- Chen, G.; Zhang, G.; Yang, Z.; Liu, W. Multi-scale patch-GAN with edge detection for image inpainting. Appl. Intell. 2023, 53, 3917–3932. [Google Scholar] [CrossRef]
- Huang, H.; Chen, Z.; Zou, Y.; Lu, M.; Chen, C.; Song, Y.; Zhang, H.; Yan, F. Channel prior convolutional attention for medical image segmentation. Comput. Biol. Med. 2024, 178, 108784. [Google Scholar] [CrossRef] [PubMed]
- Liu, H.; Huo, G.; Li, Q.; Guan, X.; Tseng, M.-L. Multiscale lightweight 3D segmentation algorithm with attention mechanism: Brain tumor image segmentation. Expert Syst. Appl. 2023, 214, 119166. [Google Scholar] [CrossRef]
- Hossain, M.S.; Betts, J.M.; Paplinski, A.P. Dual focal loss to address class imbalance in semantic segmentation. Neurocomputing 2021, 462, 69–87. [Google Scholar] [CrossRef]
- Isola, P.; Zhu, J.Y.; Zhou, T.; Efros, A.A. Image-to-image translation with conditional adversarial networks. In Proceedings of the IEEE Conference on Computer Vision and Pattern Recognition, Honolulu, HI, USA, 9 November 2017; pp. 1125–1134. [Google Scholar]
- Martínez-Agustín, F.; Ruiz-Salgado, S.; Zenteno-Mateo, B.; Rubio, E.; Morales, M. 3D pattern formation from coupled Cahn-Hilliard and Swift-Hohenberg equations: Morphological phases transitions of polymers, bock and diblock copolymers. Comput. Mater. Sci. 2022, 210, 111431. [Google Scholar] [CrossRef]
- Cao, Y.; Xu, J.; Lin, S.; Wei, F.; Hu, H. Global context networks. IEEE Trans. Pattern Anal. Mach. Intell. 2020, 45, 6881–6895. [Google Scholar] [CrossRef] [PubMed]
- Wang, X.; Girshick, R.; Gupta, A.; He, K. Non-local neural networks. In Proceedings of the IEEE Conference on Computer Vision and Pattern Recognition, Salt Lake City, UT, USA, 16 December 2018; pp. 7794–7803. [Google Scholar]
- Wang, Q.; Wu, B.; Zhu, P.; Li, P.; Zuo, W.; Hu, Q. ECA-Net: Efficient channel attention for deep convolutional neural networks. In Proceedings of the IEEE/CVF Conference on Computer Vision and Pattern Recognition, Seattle, WA, USA, 13–19 June 2020; pp. 11534–11542. [Google Scholar]
- Hedjazi, M.A.; Genc, Y. Efficient texture-aware multi-GAN for image inpainting. Knowl.-Based Syst. 2021, 217, 106789. [Google Scholar] [CrossRef]
- Zhang, W.; Wang, Y.; Ni, B.; Yang, X. Fully context-aware image inpainting with a learned semantic pyramid. Pattern Recognit. 2023, 143, 109741. [Google Scholar] [CrossRef]
- GB/T 6394-2017; Determination of Estimating the Average Grain Size of Metal. The National Standardization Administration of China: Beijing, China, 2017.


| BaseNet | SENet | ECANet | MCANet | MIoU | Accuracy | Precision |
|---|---|---|---|---|---|---|
| U-Net256 | √ | 85.31% | 94.96% | 84.88% | ||
| U-Net256 | √ | 81.29% | 92.37% | 84.56% | ||
| U-Net256 | √ | 86.25% | 95.06% | 86.54% |
| Loss Function | MIoU | Accuracy | Precision |
|---|---|---|---|
| L1 + GAN Loss | 81.02% | 92.14% | 81.18% |
| L1 + GAN Loss + FL Loss | 85.19% | 94.21% | 86.07% |
| Grain Image | Grain Size Level G |
|---|---|
| Before Grain Boundary Reconstruction | 7.740 |
| After Grain Boundary Reconstruction | 8.003 |
Disclaimer/Publisher’s Note: The statements, opinions and data contained in all publications are solely those of the individual author(s) and contributor(s) and not of MDPI and/or the editor(s). MDPI and/or the editor(s) disclaim responsibility for any injury to people or property resulting from any ideas, methods, instructions or products referred to in the content. |
© 2025 by the authors. Licensee MDPI, Basel, Switzerland. This article is an open access article distributed under the terms and conditions of the Creative Commons Attribution (CC BY) license (https://creativecommons.org/licenses/by/4.0/).
Share and Cite
Duan, X.; Chen, Y.; Duan, X.; Rong, Z.; Nie, W.; Gao, J. Improved Grain Boundary Reconstruction Method Based on Channel Attention Mechanism. Materials 2025, 18, 253. https://doi.org/10.3390/ma18020253
Duan X, Chen Y, Duan X, Rong Z, Nie W, Gao J. Improved Grain Boundary Reconstruction Method Based on Channel Attention Mechanism. Materials. 2025; 18(2):253. https://doi.org/10.3390/ma18020253
Chicago/Turabian StyleDuan, Xianyin, Yang Chen, Xianbao Duan, Zhijun Rong, Wunan Nie, and Jinwei Gao. 2025. "Improved Grain Boundary Reconstruction Method Based on Channel Attention Mechanism" Materials 18, no. 2: 253. https://doi.org/10.3390/ma18020253
APA StyleDuan, X., Chen, Y., Duan, X., Rong, Z., Nie, W., & Gao, J. (2025). Improved Grain Boundary Reconstruction Method Based on Channel Attention Mechanism. Materials, 18(2), 253. https://doi.org/10.3390/ma18020253