Article

Study on Electrochemical Corrosion Behavior of Plasma Sprayed Al2O3-3%TiO2 Coatings Doped with CeO2 for Long-Term Immersion

1
School of Mechanical Engineering, Shenyang University, Shenyang 110044, China
2
Institute of Metal Research, Chinese Academy of Sciences, Shenyang 110016, China
3
Engineering Center for Superlubricity, Jihua Laboratory, Foshan 528000, China
*
Author to whom correspondence should be addressed.
Materials 2025, 18(19), 4532; https://doi.org/10.3390/ma18194532
Submission received: 21 July 2025 / Revised: 22 August 2025 / Accepted: 27 August 2025 / Published: 29 September 2025

Abstract

The long-term corrosion behavior of Al2O3-3%TiO2 (AT3) coatings doped with1%, 5% and 8% CeO2 prepared by plasma spraying was studied in 5% NaCl solution. The results showed that the protective performance of CeO2-doped coatings was significantly higher than that of undoped coatings, primarily due to the reduction in coating porosity caused by the addition of rare-earth elements. Among the doped coatings, the 5% CeO2-doped coating exhibited the best protective performance. The addition of rare-earth oxides CeO2 reduced the content of γ-Al2O3 in the coating, but when the concentration of CeO2 increased to 8%, the Ce element was rich in the gap of the coating. Excessive CeO2 enriched in the gaps and coexisted more with Ti, and prevented the formation of the AlTi phase, which affected the performance of the coating. Electrochemical and XPS results revealed that an appropriate amount of Ce atoms or CeO2 particles could fill the pores of the coating. During long-term immersion, Ce (IV) was converted to Ce (III), which demonstrated that Ce atoms have high chemical activity in coatings. The thermodynamic calculation results show that more CeO2 particles improved the adsorption of corrosive ions. It indicated that the content of doped rare-earth oxides exceeding 5% would be utilized as an active material in the corrosive process.

1. Introduction

Al2O3-TiO2 coating is a ceramic coating with high resistance to heat, corrosion, and wear, as well as low cost, good chemical stability, and excellent wear resistance, which extends the service life of components [1]. It is widely employed in the nuclear industry, petrochemical industry, electronics industry, and other sectors [2,3,4]. There are several techniques to prepare Al2O3-TiO2 coating, such as Sol–Gel [5], CVD [6], laser engraving [7], and plasma spraying. Among these, plasma spraying is popular for fabricating various functional coatings [8,9]. Due to its numerous benefits, including high spraying temperature, high deposition rate, minimal heat effect on the substrate, and a wide range of material options, plasma spray has become a significant surface engineering technology frequently used for the surface repairing and strengthening of mechanical parts [10,11].
Most of the benefits of the Al2O3-TiO2 coating still remain after it has been created via plasma spraying; nevertheless, the coating’s porosity and flaws affect how well it resists corrosion [3,12]. Therefore, many techniques were applied, including heat treatment, sealing, doping rare-earth elements, doping nanoparticles, and nanoscale powders, to reduce the porosity and flaws of the coating [3,13,14,15]. Among these techniques, doping with rare-earth oxides into the coating has proven to be an effective method for reducing its porosity and flaws. Rare-earth oxides typically occupy the inter-splat boundaries and pores of the coating, thereby enhancing its corrosion resistance [16,17]. In our earlier research [18], it was found that the rare-earth oxide CeO2 decreased the coating’s porosity and enhanced protectiveness of the Al2O3-TiO2 coating. The coating doped with 5 wt% CeO2 showed a more compact structure, which prevented chloride ion penetration, and improved its protectiveness. However, the question remains whether further increasing the content of rare-earth oxides in the coating can enhance its qualities, particularly in terms of long-term corrosion resistance. There are now several studies on coating with Al2O3-TiO2 or doping with rare-earth oxide, and many studies on its corrosion behavior [16,19,20], but research on the long-term corrosion behavior of such coatings remains limited. In long-term immersion for the coating prepared by plasma spraying, defects such as pores and cracks become an effective channel for corrosive ions to penetrate the coating, causing a fatal impact on the oxide coating. This process obviously reduces the isolation and shielding effect of the coating, directly causing corrosion to the protected matrix. As an effective method to improve the porosity of the coating, the role of rare-earth elements in the long-term immersion process remains to be further studied.
In this work, an Al2O3-3%TiO2 coating was created on carbon steel (Q235B) by plasma spraying, and different amounts of the rare-earth oxide CeO2 (1%, 5%, 8%) were added. All of the coatings were immersed in 5% NaCl solution for 48 h and monitored by electrochemical methods to evaluate the effect of the rare-earth oxide CeO2 during long-term immersion. This work uniquely quantifies Ce4+→Ce3+ conversion through XPS depth profiling (36 h immersion) and establishes its correlation with electrochemical degradation, and then determines the upper doping limit and long-term electrochemical stability. The valence state changes in different concentrations of CeO2 in the coating during the long-term immersion process, and its role in the corrosion process was investigated in an effort to find the optimal proportion of rare-earth oxide CeO2 in the coating, which provides the first upper doping limit (5 wt%) for long-term stability. The corrosion behavior of the coating during long-term immersion was discussed by thermodynamic calculation.

2. Experimental

The substrate was carbon steel Q235B with a dimension of 20 mm by 15 mm by 3 mm in size. The chemical composition of Q235B (wt. %) is C 0.20, S 0.036, P 0.017, Mn 0.58, Si 0.21, Cu 0.02, and residual Fe. In order to create a rough surface and enough contact points for the sprayed coatings, the substrate was degreased with acetone before spraying.
Shanghai Koting Machinery Technology Co., Ltd. (Shanghai, China) manufactured the spray powder. The quality of the product is 99.9% Al2O3-3% TiO2 (mass fraction) mixed powder (referred to as AT3) and 99.5% CeO2 powder. The CeO2 powder is a lamellar strip with an average diameter of around 20 μm, and the particle length after mixing is 5 μm with a diameter of less than 1 μm.
The appropriate quantities of AT3 and CeO2 powder were combined with alcohol, and the mixing ratio is presented in Table 1. The mass ratio of alcohol to powder was 3:1, and FS400W high-speed dispersion mechanical stirring (400 RPM) was used on the powder for 60 min after ultrasonic dispersion for 30 min. After mixing, the resulting mixture was put into a drying oven set at 50 °C for 72 h to create a powder that is a combination of AT3 and CeO2. In Table 1, the concentration of Ce is the proportion of powder composition during powder mixing, which is the theoretical data. During the spraying process, the distribution of cerium oxide was not uniform due to powder melting, sputtering, and solidification, and the concentration of cerium oxide in the gaps and defects was high.
The particle size was around 20–50 μm, and it was demonstrated that the surface of the AT3 powder to be sprayed was uniformly covered with a layer of rare-earth oxide CeO2. An SX-80 plasma spraying equipment (Guangzhou Sanxin Metal Technology Co. Ltd., Guangzhou, China) was used to spray the AT3-CeO2 composite and AT3 powder, which includes a main power supply, chiller, powder feeder, transfer box, control cabinet, and SG-100 spray gun. Table 2 shows the spraying process parameters and the principal gas used. Reciprocating automatic spray gun operation mode was adopted, where the operation speed is 15 mm s−1, the thickness of each layer is about 15 μm, and a total of 4 layers are sprayed. The coating was cooled naturally after preparation without other post-treatment.
The coating adhesion test was conducted on the Chinese national standard “GB 5270 Metallic coatings on metallic substrates—Electrodeposited and chemically deposited coatings—Review of adhesion testing methods.” After three thermal shock tests at 400 °C, the coating remained undamaged.
The ceramic coating had a thickness of 50–70 µm, which was measured at 10 random locations per sample using SEM cross-sectional analysis (ImageJ v1.53 software, Bethesda, USA). A scanning electron microscope (SEM, S-4800II, Hitachi, Tokyo, Japan) was used to examine the as-sprayed coating surface and cross-sectional morphology. The phase of the coating was determined using a Rigaku-D/max 2000 (Rigaku Corporation, Tokyo, Japan) diffractometer with a Cu K target and a power range of 50 kv−250 mA and a scanning speed of 2°/min.
The chemical composition of the coatings was analyzed with a Thermo VG ESCALAB 250 X-ray photoelectron spectroscopy (XPS) (Thermo Fisher, Waltham, MA, USA). A monochromatic Al Ka was used as the X-ray source (incident energy of 1486.6 eV, pass energy of 50 eV), and it is powered at 150 W. The sample was etched by ionized argon at a vacuum of 6 × 10⁻⁸ mbar and an etching rate of 0.2 nm/s. The etched area was 2 mm × 2 mm. The binding energy (BE) in the XPS spectra was calibrated according to the standard BE of the C 1s peak (284.6 eV).
Surface hydrophobicity and chemical bonding analysis (e.g., FTIR) were not performed due to the focus on electrochemical and microstructural corrosion mechanisms.

Electrochemical Test

On the reverse side of the coated Q235B substrate, a copper wire was attached. After thermal spraying, the samples were encased in Teflon and paraffin, exposing just a 1 cm2 coated area. The samples were cleaned with distilled water, degreased with acetone, and dried with a jet of air before the corrosion test. The Gamry reference 600 electrochemical workstation (Gamry Instruments, Warminster, PA, USA) was used for the electrochemical tests, and measurements were performed using the standard three-electrode system: the coated sample as the working electrode, the Pt electrode as the auxiliary electrode (CE), and the saturated calomel electrode (SCE) as the reference electrode. Corrosion potential (Ecorr) and the corrosion current density (Icorr) were obtained through the linear analysis of the Tafel fitting approximation.
The potentiodynamic polarization test had a scanning range of −0.2 V~0.8 V relative to open-circuit potential. The scanning rate was one millivolt per second. The electrochemical impedance spectroscopy (EIS) test used a sinusoidal AC signal with an amplitude of 10 mV and a scanning frequency ranging from 105 to 10−2 Hz. The Zview software (E Chem software, V3.1, MI, USA) was used to fit the impedance spectra acquired by the EIS test. All the tests were repeated five times to confirm the accuracy of the results. At room temperature (18 °C), 5% NaCl (mass fraction) was utilized as the test solution. To ensure the reproducibility of experiments and the accuracy of data, electrochemical tests were conducted five times each.

3. Results and Discussion

3.1. SEM

The SEM surface morphology and elemental distribution of the as-sprayed AT3 + 1%CeO2, AT3 + 5%CeO2, AT3 + 8%CeO2 coatings are shown in Figure 1. Element distribution mappings reveal that Al interdigitated with Ti, and the coating generated some crevices at the junction of two elements in the coating, which is one of the sources of pores or crevices in the as-sprayed coating; the cross-sectional photo in Figure 2 shows it more clearly.
During the coating spraying, the addition of CeO2 to the powder sufficiently aggravated the melting process of the powder, deposited at the pores or crevices of the coating, and formed a dense coating microstructure [21,22].
The melting point of rare-earth oxides is lower than that of A12O3 and TiO2 [23]. Molten CeO2 particles initially precipitate and collide with molten A12O3/TiO2 particles to form ceramic coatings during cooling and nucleation [24]. As a result, CeO2 may be employed as the non-spontaneous nucleation core of ceramic coatings, increasing nucleation rates and refining coating grains. Simultaneously, the chemical activity of the Ce element is quite high, which can affect the nucleation process of the coated grains, play a role in grain purification, and preferentially precipitate at the grain boundary. Therefore, the elemental mapping revealed a higher concentration of Ce at the interfaces, and the pores or crevices of the coating were filled.
In comparison to the distribution of Ce in the coatings with different CeO2 concentrations, when 1% CeO2 was added to the coatings, the distribution of Ce was significantly diffused. The Ce was more concentrated on the surface pores or crevices of the coating and the interface where the Al-Ti components interacted when the CeO2 content reached 5%. When the concentration is increased to 8%, Ce became enriched in the gaps and coexisted more with Ti, as shown in Figure 2.

3.2. XRD Patterns

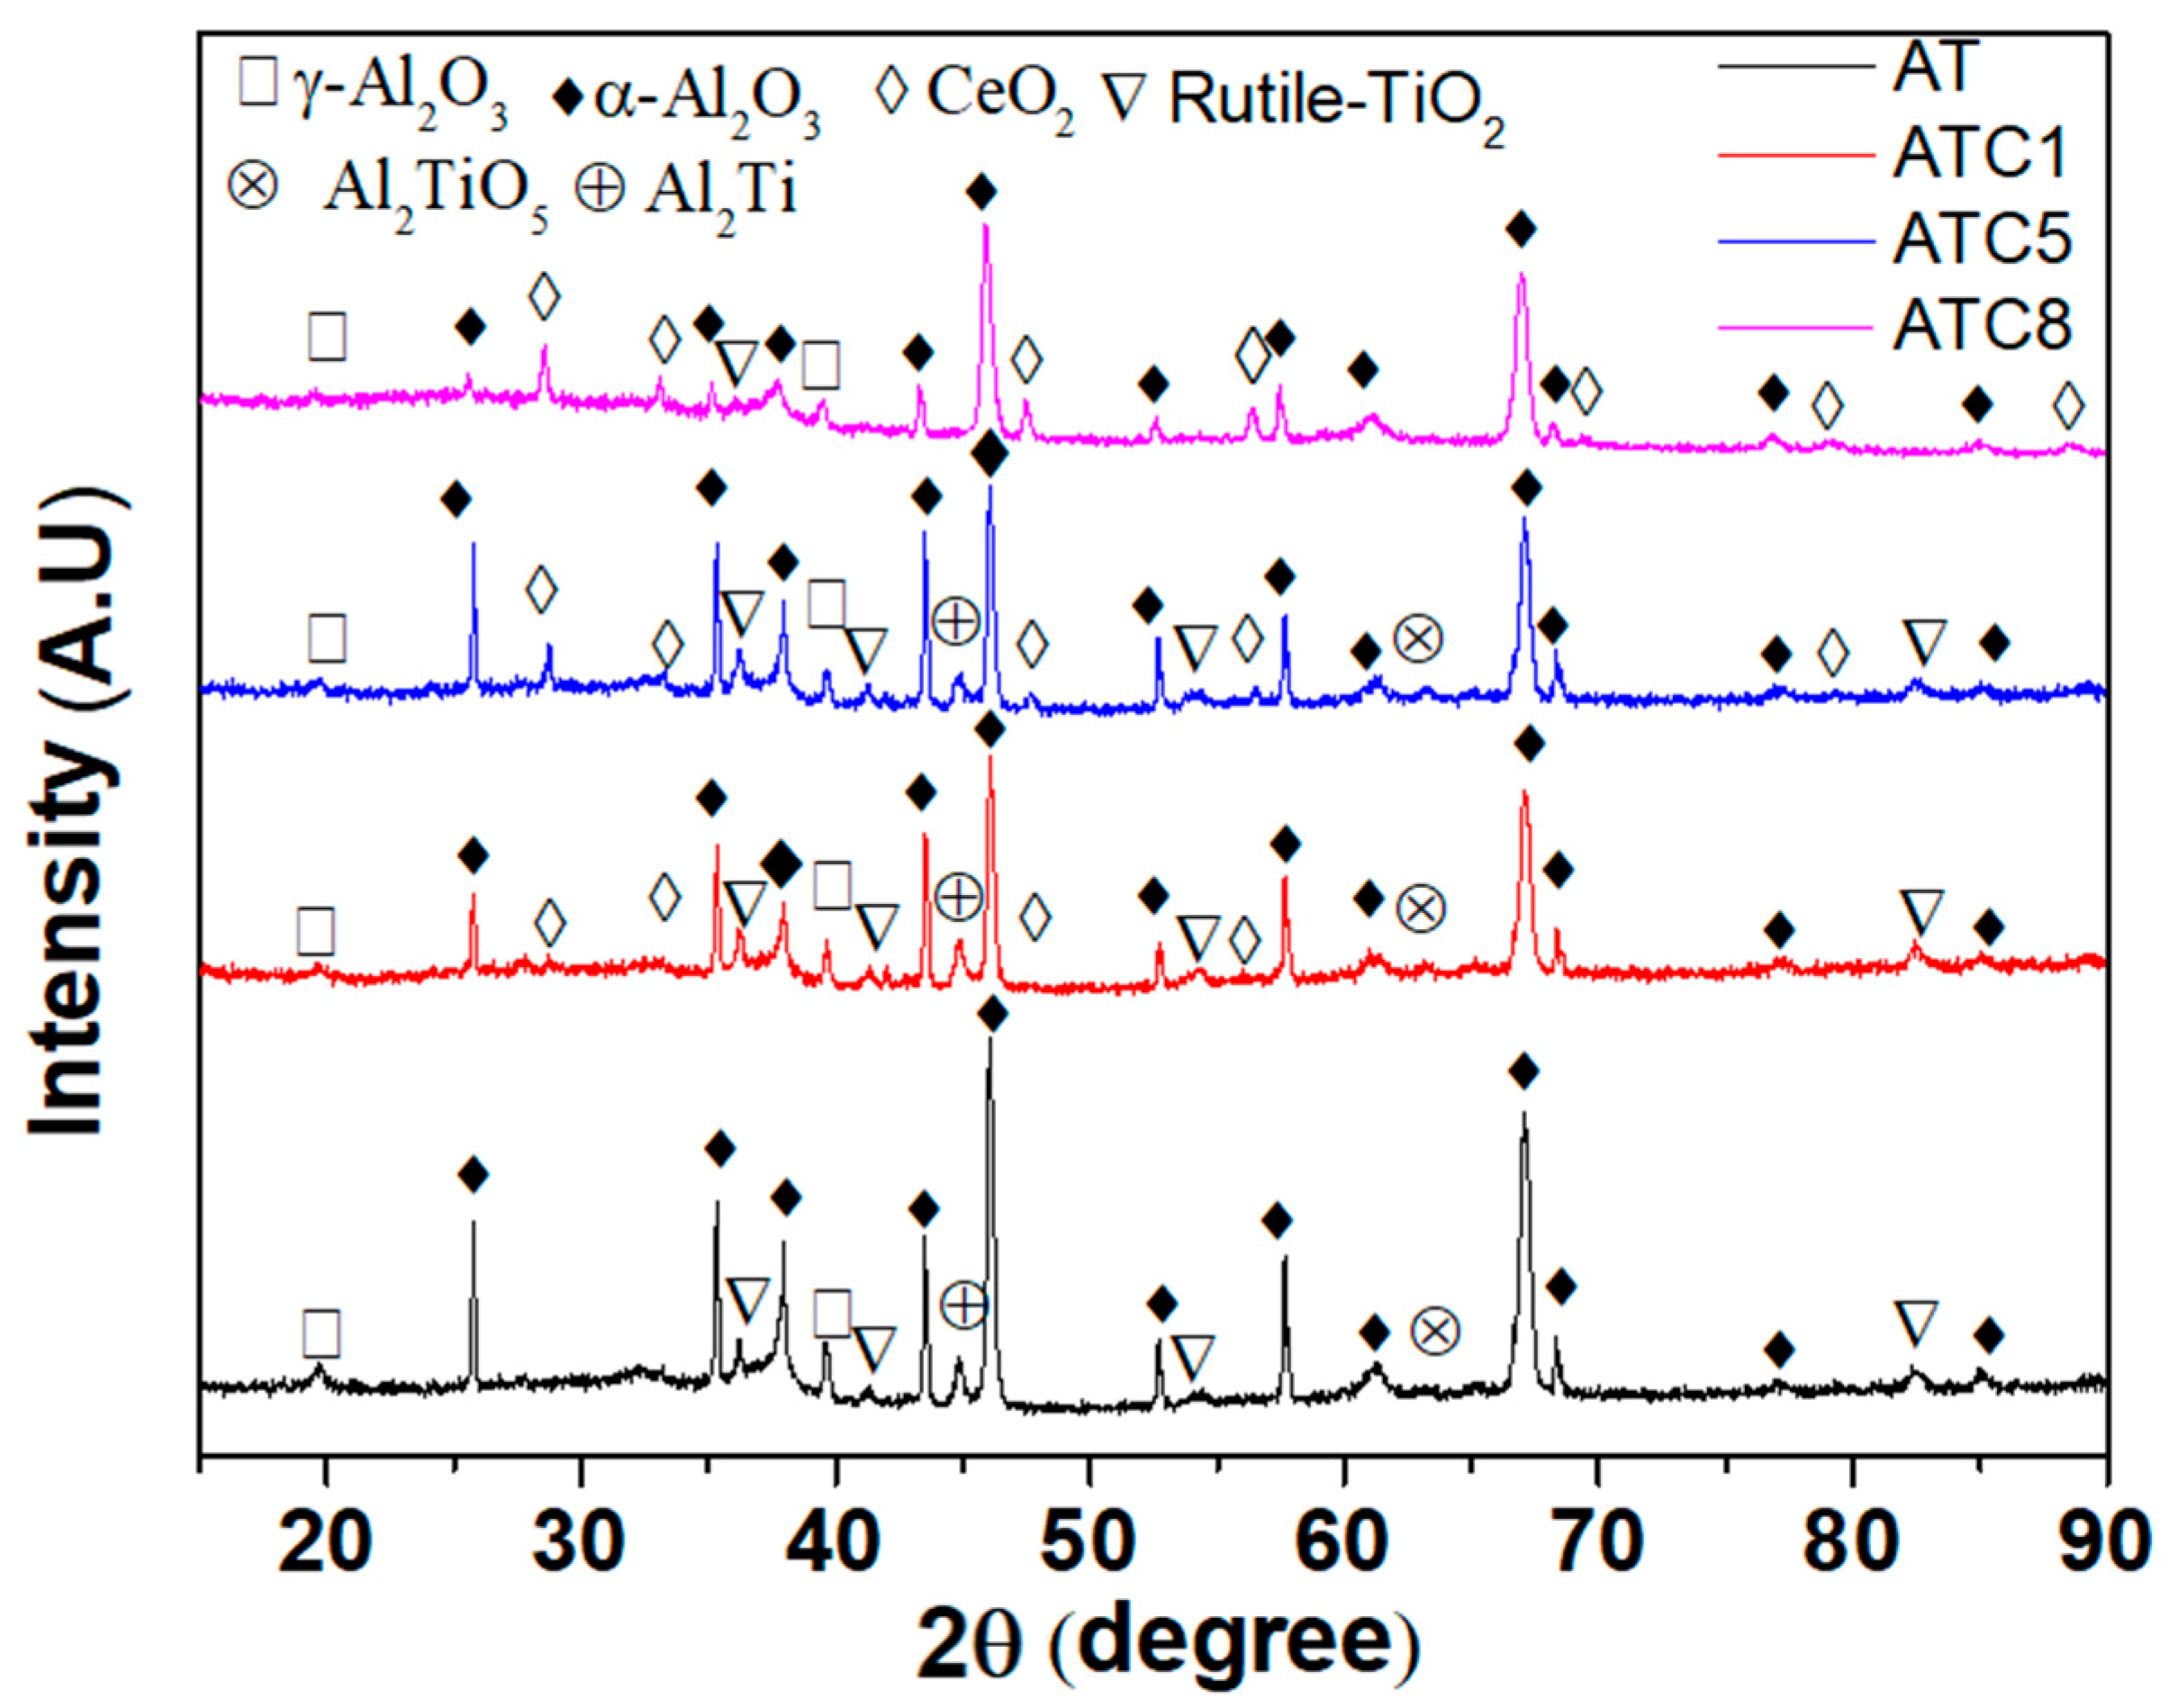
Figure 3 shows XRD patterns of the pure AT3 and doped with 1%, 5%, and 8% CeO2 coatings produced by plasma spraying. The spectra reveal that rutile-TiO2 and α-Al2O3 made up the majority of the AT3 coating, with tiny amounts of γ-Al2O3, Al2Ti, and Al2TiO5. When 1% CeO2 was added to the AT3 coating, the diffraction peak of CeO2 appeared in the spectra, which presented main diffraction peaks for CeO2 at 28.55° and 47.485°. Moreover, the diffraction peak of Al2TiO5 decreased, and the intensity of the diffraction peak for Al2TiO5 became less intense.
The intensity of CeO2′s diffraction peak considerably increased with the addition of CeO2 to the coating. When the addition of CeO2 increased to 8%, the diffraction peak of rutile-TiO2 in the pattern disappeared, and the primary components were α-Al2O3 and CeO2. Meanwhile, the diffraction peak intensity of α-Al2O3 was the greatest among the four coatings.
The addition of rare-earth oxides CeO2 reduced the content of γ-Al2O3 in the coating, but excessive additions occupied the “position” of TiO2, and prevented the formation of the AlTi phase, such as Al2Ti and Al2TiO5, which affected the performance of the coating.

3.3. XPS

Figure 4a shows the 3d XPS spectra of Ce in the as-sprayed coatings of AT3 + 1% CeO2, AT3 + 5% CeO2, and AT3 + 8% CeO2, where in Figure 4(a1) depicts the Ce3d spectra of the coating with various Ce additions, and Table 3 shows the intensity and deconvoluted peaks. There are two stable oxidation states of Ce (Ⅳ) and Ce (Ⅲ), and the electronic structure of Ce is 4f15d16s2. Ce (IV) and Ce (III) can be reversibly transformed by redox reaction with the amount of oxygen in the external environment, and the missing oxygen occurs in the form of an oxygen vacancy defect [25,26].
In Figure 4(a1), the spectra of Ce3d show four characteristic peaks, which are present at 883 eV, 898 eV, 901 eV, and 916 eV. Peak 916.3 eV is due to Ce (IV). The position of the characteristic peak Ce in the 1% CeO2 coating is clearly shifted, which should be related to Ce distribution and content. The intensity of each Ce peak increases clearly as the Ce concentration increases.
The fitting results of 3d XPS spectra of Ce in the AT3 + 8% CeO2 coating are shown in Figure 4(a2). The peaks can be fitted using four peaks, which correspond to Ce 3d3/2 and 3d5/2. There is no typical Ce (III) peak in the spectrum, indicating that Ce exists stably in the coating as Ce (IV) during thermal spraying, which is consistent with the XRD results.
Figure 4b shows the 3d XPS spectra of Ce in the coatings of AT3 + 1% CeO2, AT3 + 5% CeO2, and AT3 + 8% CeO2 after immersion for 36 h. Figure 4(b1) depicts the Ce3d spectra of the coating with various Ce additions after immersion for 36 h, and the results of the intensity and matching distinctive peaks are shown in Table 3.
In Figure 4(b1), the spectra of Ce3d for the coatings show four characteristic peaks, which are present at 882 eV, 885 eV, 899 eV, and 904 eV. By comparing the results of the as-sprayed coating, the position of the characteristic peaks for Ce3d changes; the characteristic Ce(IV) peak at 916 eV disappears, and a Ce(III) peak emerges at 885 eV.
The fitting results of 3d XPS spectra of Ce in the AT3 + 8% CeO2 coating after immersion for 36 h are shown in Figure 4(b2). There was a typical Ce (III) peak at 885 eV in the spectrum, indicating that a certain amount of Ce (IV) was converted to Ce (III) during long-term immersion. This indicates that during the long-term immersion, the rare-earth element Ce in the coating reacts with the corrosive medium in the solution, having a major impact on the coating’s corrosion resistance.

3.4. Open Circuit Potential Curve of Long-Term Immersion

The open circuit potential (Eocp) vs. time curve of AT3, AT3 + 1% CeO2, AT3 + 5% CeO2 and AT3 + 8% CeO2 coatings immersed in 5% NaCl solution for 72 h is shown in Figure 5 As can be seen, the Eocp of AT3 + 5% CeO2 coating is always higher than that of the other coatings, while the Eocp of AT3 coating is the lowest during the initial phase.
The corrosion process of all the coatings immersed in 5% NaCl solution can be divided roughly into three phases. The initial phase is in the range of 0–50 s, when the potential shows a relatively gentle downward trend; the intermediate phase is from 50 s to 7–9 h, and the Eocp rapidly decreases; and in the last phase, the Eocp begins to rise.
The duration of the intermediate phase differs between coatings. After about 7 h of immersion, the potential of the AT3 coating dropped sharply to about −0.699 V. The potential began to move forward gradually with time, and there was a clear inflection point in the overall curve. The inflection point of the Eocp vs. time curve for the coating doped with CeO2 was then obviously extended. At around 23.8 h, the obvious inflection point of the Eocp vs. time curve for AT3 + 1%CeO2 coating appeared. At this point, the lowest value of Eocp was −0.7052 V, and the open circuit potential (OCP) gradually began to rise. At around 33 h, the Eocp curve of the AT3 + 5%CeO2 coating exhibited a distinct inflection point, and the OCP showed a relatively gentle transition.
At this point, the potential fluctuates between −0.657 V and −0.659 V before it began to rise at around 50 h. At around 33 h, the obvious inflection point of the Eocp vs. time curve for AT3 + 8%CeO2 coating appeared. The lowest value of Eocp was −0.7028 V, and the OCP gradually began to rise.
The three phases of the Eocp vs. time curve are associated with long-term immersion processes. At the beginning of the immersion process, the coating surface was infiltrated and wet by solution. The intermediate phase was the process where corrosive ions penetrated and corroded the coating; the Eocp value decreased with time, and the Eocp vs. time curve demonstrated a linear relationship. Because the surface of AT3 coating had more pores, the solution penetrated and corroded the surface of AT3 coating more easily. After doping with CeO2, the coating’s compactness increased, while its porosity decreased. The time required for the solution to penetrate and corrode the coating was relatively prolonged, and the Eocp fluctuated slightly. With the extension of immersion time in the latter phase, the OCP began to rise significantly. It suggests that corrosive ions have gotten through the coating and corroded the metal substrate.

3.5. Potentiodynamic Polarization

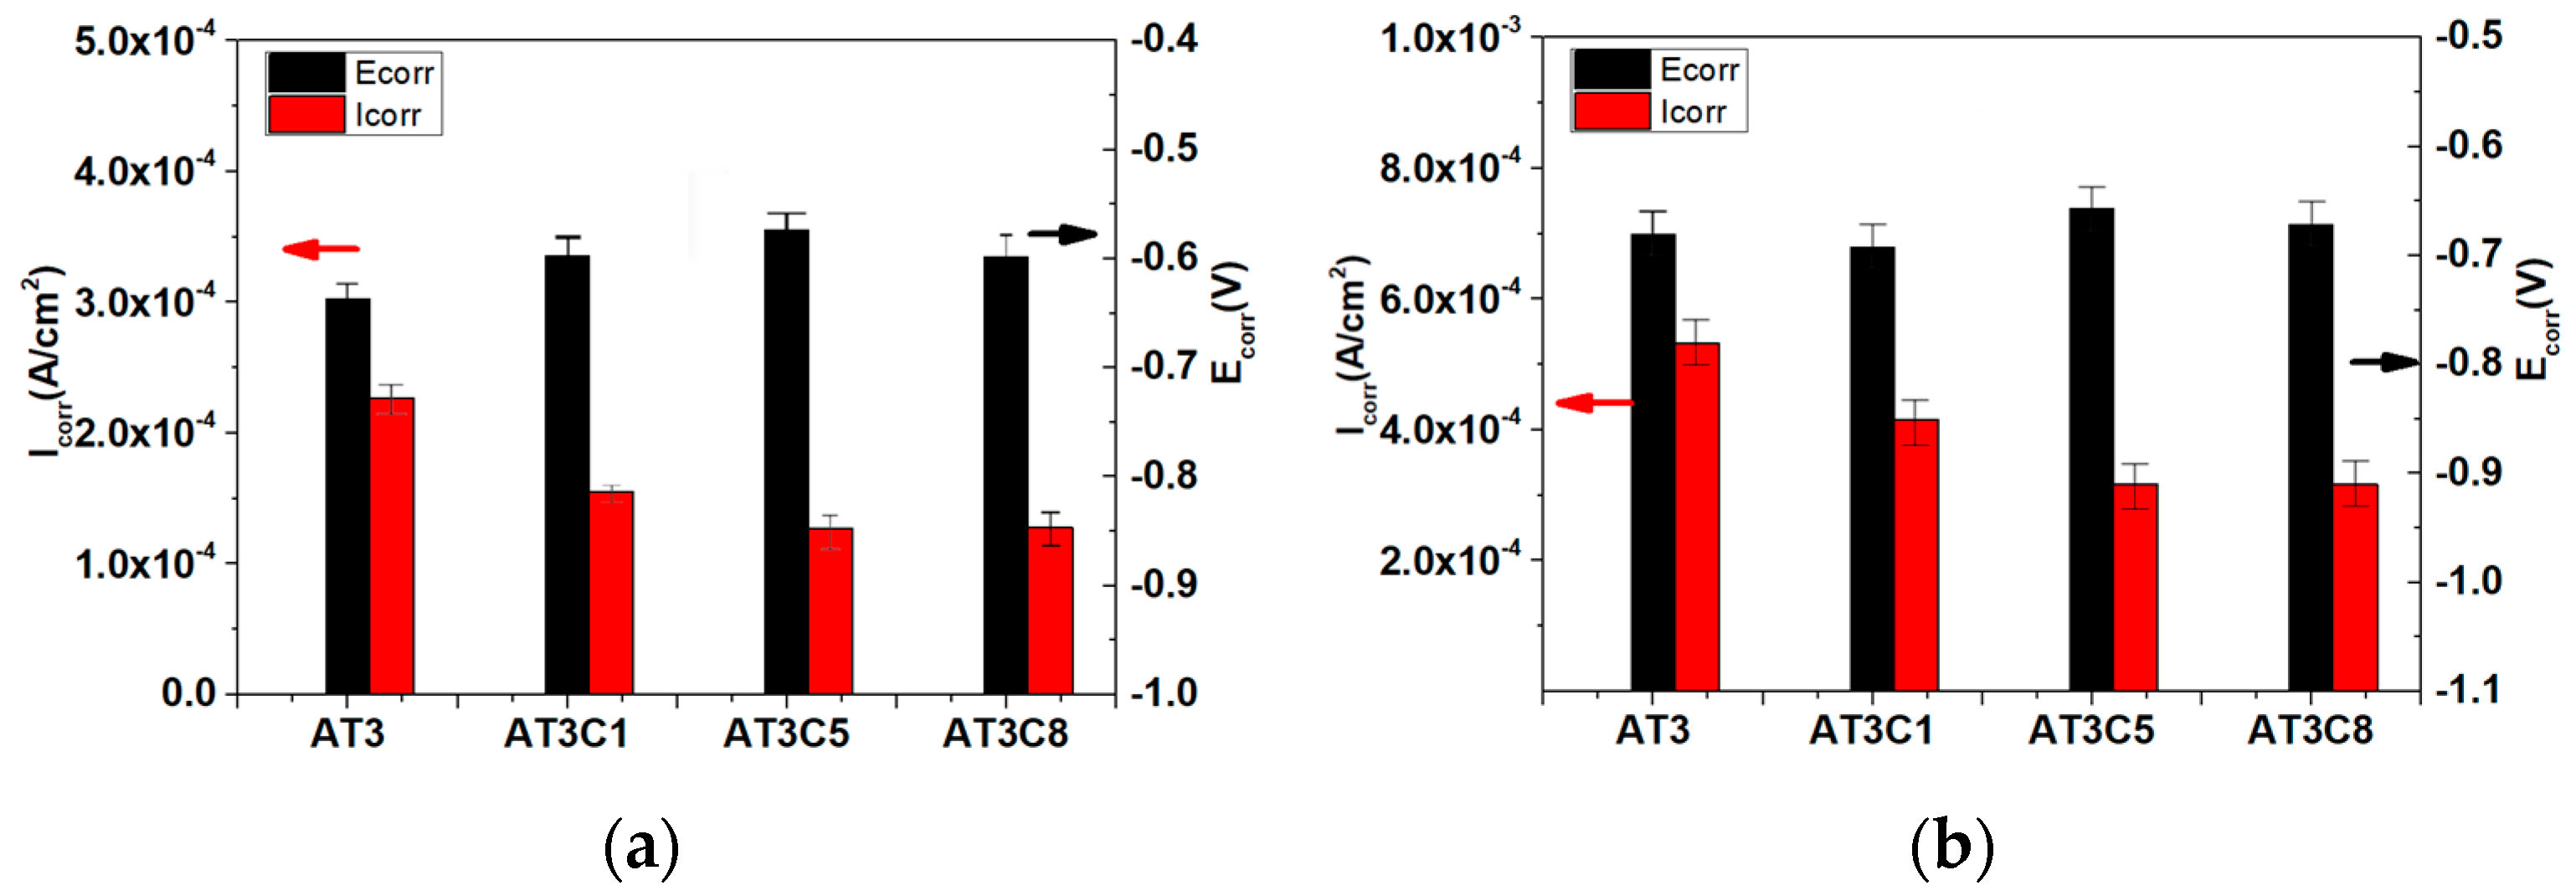
Figure 6 shows the potentiodynamic curve of AT3, AT3 + 1%CeO2, AT3 + 5%CeO2, and AT3 + 8%CeO2 coatings immersed in 5% NaCl solution for 0.5 h and 36 h. Figure 7 shows the corrosion potential and Tafel fitting results.
The results of potentiodynamic polarization measurement show that the corrosion potential of AT3 was the highest corrosion potential at the beginning of ± the experiment, and the corrosion rate of AT3 was the largest among the other CeO2-doped coatings. The corrosion current density of the coating after doping with 1% CeO2 was 1.55 ± 0.19 × 10⁻⁴ A/cm2, which is lower than that of the coating without CeO2. The corrosion current also decreased as the amount of CeO2 was increased. However, when doped with 8% CeO2, the corrosion rate was similar to that of the coating doped with 5% CeO2.
The results of the potentiodynamic polarization measurement changed after being immersed for about 36 h. At this time, the corrosion potential of the AT3 coating was lower than that of the AT3 + 1%CeO2 coating, but its corrosion potential density was slightly higher than that of the AT3 + 1% CeO2 one. The corrosion potential of the coating with 5% CeO2 was lower than that of other coatings, which is consistent with the open circuit potential measurement results. The corrosion current density of 5% CeO2 coating was slightly lower than that of 8% CeO2 coating, but they were very close.

3.6. EIS

The coatings with and without CeO2 were immersed in 5% NaCl solution, and the electrochemical impedance spectrum was measured at various times. Figure 8 shows the frequency–modulus and frequency–phase angle curves.
The equivalent electrical circuit shown in Figure 9 was used to fit the EIS results, in which the frequency–phase angle of AT3 coating was obviously different from that of other coatings. Therefore, the EIS result of the AT3 coating was fitted with (a), and the other coatings were fitted with (b) in Figure 8.
The electrolyte resistance (Rs) is connected in series with the coating unit system in Figure 9. QC is the phase angle element of the capacitor; Qct is the coating’s coated double layer element; and Qro is the phase angle element formed by doping with rare-earth elements CeO2. All of them reflect the inhomogeneity of the coating-substrate interface and are related to the electric double layer between the coating and the substrate [27,28].
Rc is the coating resistance, which is proportional to the coating thickness; Rct is the coating diffusion resistance; and Rro is the rust resistance caused by the addition of rare-earth elements. Zw is the diffusion impedance; the angular frequency ω affects Zw’s value, which is related to the coating performance.
Zw = () −0.5 Yw−1
where Yw is a constant and j is an imaginary unit. The higher the Yw value, the smaller the diffusion resistance of the medium. Diffusion resistance Rct, phase angle element of the coating caused by the addition of the rare-earth element, and Qct connected in series to reflect the coating characteristics when corrosive ions pass through the pores as a result of the adsorption of the intermediate products in the coating.
The fitting results have a mean square error of x2 < 10−3, and a relative error of less than 10% for each parameter. Figure 10 shows the main parameters of the fitted electrochemical parameters.
Figure 10a shows the curve of Rct of four different coatings with immersion time. Rct denotes the coating diffusion resistance in the equivalent electrical circuit, and the corrosion rate is generally inverse. According to the fitting results, the Rct of AT3 coating was relatively higher than that of the others. The diffusion resistance of AT3-CeO2 coating significantly reduced with CeO2 doping, which is related to the reduction in coating porosity and defects and contributed to the current flow during the corrosion process [29].
Rct of the coatings doped with 5% and 8% CeO2 was very close at the start of the experiment, matching the results of polarization curves. Rct gradually decreased as immersion time increased, indicating that the corrosive medium began to penetrate the pores of the coating, reducing corrosion resistance and gradually increasing the corrosion rate. When immersion time reached 30 h, Rct did not decrease, and the corrosion rate reached a steady state.
Rare-earth elements added to the coating have a certain chemical activity. With the action of corrosive medium, the resistance of rare-earth element Rro became more apparent with the addition of corrosive medium, which contributed to the adsorption of corrosive medium and affected the corrosion behavior. The Rro of coatings with 8% Ce was significantly higher than that of the other two coatings, indicating that the addition of excessive Ce increased the coating activity and adsorbed more chloride ions, but easily increased the corrosion rate of the coating in solution.

3.7. Discussion

According to the above experimental results, with the addition of CeO2 during the spraying, the coating has a significant effect on reducing the porosity and changing the phase structure of the coating. The element distribution mapping reveals that CeO2 is distributed in the coating’s flaws, cracks, and layer edges, filling the gaps created during spraying. All of these have improved the corrosion resistance of the coating, so as to delay the penetration of corrosive media, rather than providing intrinsic electrochemical protection.
During the long-term immersion of the coating, the reaction equation for the corrosion of AT3 coating under the standard concentration of NaCl is as follows:
(1) Hydrolysis reaction of Al2O3:
Al2O3 + 3H2O → 2Al3+ + 6OH  ΔG1 = +397.8 kJ/mol
(2) Coordination of Al3+ with Cl
Al3+ + 4Cl → AlCl4  ΔG2 = +322.5 kJ/mol
The calculated ΔG1+2 = 719.3 kJ/mol > 0 shows that the AT3 coating has good corrosion resistance in the NaCl solution, and the potential–pH diagram also shows that Al2O3 is stable (passivation range) between pH 4–9, while in the more acidic or alkaline region, aluminum is dissolved in ionic form.
In the neutral NaCl solution, the concentration of chloride ions in the solution is 0.85 M. If the concentration of Al3+ is very low (such as 1 × 10⁻⁶ m), reaction 1 and reaction 2 need to be corrected as follows:
ΔG2 = ΔG2 + R T lnQ, Q = [Al3+] [Cl]4/[AlCl4]
After correction, the still ΔG2 = 89.9 kJ/mol > 0. However, under non-ideal conditions (e.g., localized [Cl] > 1 M, pH < 4 in defects of the coating, such as pores or crevices), the corrected ΔG2 (Equation (4)) approaches +89.9 kJ/mol, still positive but less prohibitive.
TiO2 in the coating reacts as follows in neutral NaCl solution:
The chemical properties of TiO2 are stable in neutral solution, and weak hydrolysis may occur.
TiO2 + 2H2O → Ti(OH)4  G = +63.5 kJ/mol
The reaction is not spontaneous, and TiO2 is stable in neutral solution and does not participate in a significant corrosion reaction.
However, when there are pores or defects in the coating, Cl intrusion occurs locally, and the metal ions enriched in the pores are hydrolyzed. The pH may be reduced due to hydrolysis reaction (such as Al3+ hydrolysis to produce h+), leading to acidification (local pH reaches 2–3), promoting the dissolution of alumina and further corrosion of metal. In an environment with high chloride ion concentration, local corrosion is more likely to occur. Further calculation shows that when the pH of the local zone of the coating reaches 2.5 and the chloride ion concentration is 3M, ΔG2 (Equation (4)) approaches −28.3 kJ/mol.
When CeO2 exists in the pores or crevices of the coating, the long-term immersion process of CeO2 in the coating has an impact on the corrosion process.
Combined with the Ce-H2O phase diagram in the figure, the reaction of CeO2 in neutral NaCl solution is as follows:
(1) Hydrolysis of cerium oxide, the reaction is a dynamic equilibrium process, and the solubility of CeO2 is very low (KSP ≈ 10−28), but the trace dissolved Ce4+ may participate in the subsequent reaction.
CeO2 + 2H2O ⇌ Ce4+ + 4OH
(2) Conversion of tetravalent Ce4+ to trivalent Ce3+
Ce4+ + e → Ce3+ (E° ≈ 1.28 V vs. SHE)  ΔG1 = −174 KJ
(3) Hydrolysis of Ce4+
Ce3+ + 3OH → Ce(OH)3↓ (pH > 6)   ΔG2 = −285 kJ/mol
(4) Hydrolysis of Ce4+
Ce4+ + 4OH → Ce(OH)4↓ or CeO2 nH2O  ΔG3 = −320 kJ/mol
A compact Ce (OH)3/Ce (OH)4 film was formed to cover the metal surface. The micropores of the coating were blocked, and the penetration rate of Cl was reduced.
So, we assume that CeO2 may prefer to remain solid and release a small amount of Ce3+or Ce4+, while Ce3+or Ce4+ will hydrolyze to form Ce(OH)3 or Ce(OH)4 precipitation at neutral pH solution, which may serve as a protective layer. As shown in the XPS results, Ce (Ⅳ) and Ce (Ⅲ) were formed during the corrosion process of the coating. The change in Ce valence state may be accompanied by a local volume effect, further sealing the pores and indirectly strengthening the barrier function.
The local acidification in the pores of the coating results in high hydrogen ion concentration and low pH value, which also promotes the conversion of Ce. In particular, with the strong permeability of chloride ions, the conversion process of local Ce ions in the pores will be accelerated, resulting in the generation of more Ce3+.
Therefore, CeO2 in the coating can significantly improve the local corrosion caused by coating defects during long-term immersion. However, the porosity in the coating is limited. Once the amount of CeO2 reaches the threshold, more CeO2 tends to aggregate in the coating, forming Ce-rich regions.
CeO2 + 4Cl + 2H2O → CeCl4 + 4OH  ΔG = −403.8 kJ/mol
CeO2 + 3Cl + 2H2O → CeCl3 + 4OH  ΔG = −604.6 kJ/mol
On the other hand, the CeO2 in the coating also reacts with higher concentrations of Cl in the solution during long-term immersion, as follows:
The CeO2 in the coating spontaneously reacts with chloride ions in the solution, becoming the preferred area for corrosion; this is similar to the EIS measurement results. As corrosion occurs in these areas, local pH surpasses the stability range (passivation range) of Al2O3 coating, which leads to the coating corrosion. Notably, when the CeO2 content in the coating is high, localized enrichment of cerium oxide occurs. Specifically, an optimal filling effect on coating gaps and defects is achieved with a 5% addition of CeO2. When it exceeds 5%, the enriched CeO2 is more likely to react with chloride ions. When calculating the ΔG for coatings with 5% and 8% CeO2, 5% CeO2:ΔG5%CeO2 ≈ −180 kJ/mol; 8% CeO2: ΔG8%CeO2 ≈ −220 kJ/mol. It was observed that the ΔG was lower at 8%, indicating a higher propensity for corrosion reactions to occur.
As can be seen from Figure 10a, which is the figure of the evolution of charge transfer resistance (Rct) for coatings with different CeO2 content, the coating doped with CeO2 (5%) shows high initial Rct (about 71 kΩ·cm2) and slower degradation during immersion, and with excessive doped CeO2 (8%), rapid Rct decline emerges. The Rct trends were directly governed by CeO2-induced microstructural and electrochemical changes. The excessive CeO2 (8%) at the coating defects induced the spontaneous Ce-Cl reactions under defect conditions (ΔG8% CeO2 ≈ −220 kJ/mol). These reactions generated highly soluble CeCl3/CeCl4, establishing ion-conduction pathways that reduced Rct. Figure 10b further demonstrates that increasing CeO2 content correlated with a significant rise in electrochemically active sites across the coating. The XPS analysis further confirmed that excessive cerium oxide promoted significant Ce3+ formation during long-term immersion, demonstrating redox-driven corrosion acceleration.
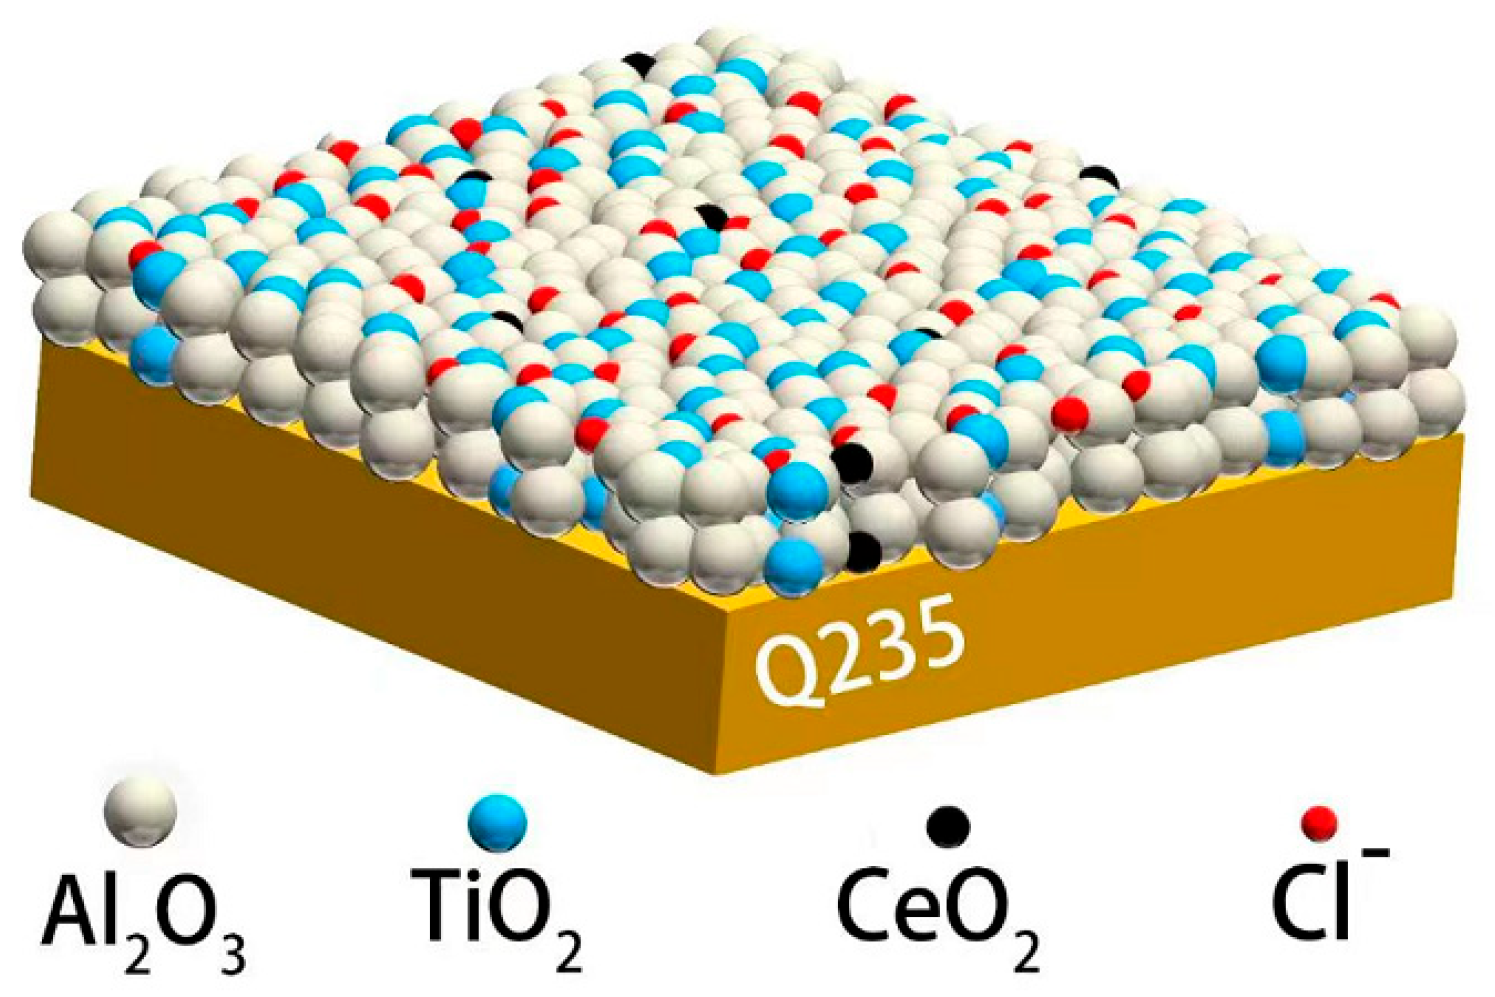
As shown in Figure 11, the addition of CeO2 to the coating can fill the defect areas of the coating, physically hindering the infiltration of corrosive ions. Thus, we hypothesize that the Ce element has high chemical activity and is prone to react preferentially with corrosive ions, which is more evident during long-term immersion. Excessive additions of CeO2 in the coating will adsorb corrosive ions and react to produce Ce3+ in the solution. It was widely assumed that the stability of Ce4+ is greater than that of Ce3+ [30]. The Ce2O3 generated during the long-term corrosion process boosts the activity of the coating and increases corrosive ion adsorption. As a result, high Ce has no discernible effects on corrosion, but the opposite effects. Scalability remains constrained by powder agglomeration during mixing. Achieving <5% agglomeration (Section 2) requires stringent process control, increasing production costs by ~30%.
Limitations of this study include the lack of surface hydrophobicity data (contact angle) and FTIR analysis, which could further elucidate the wetting behavior and chemical bonding changes during immersion. Future work will incorporate these characterizations to provide a more comprehensive understanding.

4. Conclusions

The long-term immersion corrosion behavior of Al2O3-TiO2 coating doped with 1%, 5%, 8% CeO2, and without CeO2, prepared by plasma spraying, was investigated in 5% NaCl solution. XPS, SEM, and electrochemical methods were used to study the impact of different CeO2 on the corrosion process. The results were as follows:
1. The corrosion resistance of CeO2-doped coatings was significantly superior to the undoped coating during long-term immersion, primarily due to reduced porosity. CeO2 addition also decreased the γ-Al2O3 content. However, at 8% CeO2, excessive oxide occupied interstitial spaces, displacing TiO2 and inhibiting the formation of beneficial AlTi phases (Al2Ti, Al2TiO5), degrading coating performance.
2. The coating doped with 5% CeO2 demonstrated the optimal corrosion resistance among all samples, indicating that this concentration provides effective pore filling.
3. The XPS analysis confirmed the conversion of Ce(IV) to Ce(III) during long-term immersion, highlighting the high chemical activity of Ce within the coating. This activity, coupled with thermodynamic calculations, revealed that higher CeO2 content enhances corrosive ion adsorption. Consequently, rare-earth oxide doping levels exceeding 5% actively participate in the corrosion process rather than acting solely as passive inhibitors. And the cost of raw materials increased by 30%. Large-scale production also needs to control the powder agglomeration rate <5%.
4. Limitations of the research include (i) due to a lack of surface hydrophobicity data (contact angle) and surface chemistry, the possible mechanisms are still hypothesized and inferred, (ii) cost increase (~30%) from rare-earth doping, and (iii) agglomeration control requirements for industrial scale-up.

Author Contributions

J.Y.: writing—original draft preparation; Y.Z.: conceptualization, methodology, writing; P.D.: data curation and writing—reviewing; L.Z.: writing—reviewing and editing, funding acquisition, methodology; X.W.: investigation, visualization; X.Y.: data curation. All authors have read and agreed to the published version of the manuscript.

Funding

This work was financially supported by the National Key Laboratory for Remanufacturing Fund “Preparation of Nickel based Metal Coatings with Multi Energy Field Coupling and Evaluation of High Temperature Oxidation Resistance”, No.61420052023KJW04.

Institutional Review Board Statement

Not applicable.

Informed Consent Statement

Not applicable.

Data Availability Statement

The original contributions presented in this study are included in the article. Further inquiries can be directed to the corresponding author.

Conflicts of Interest

The authors declare no conflicts of interest.

References

  1. Tian, W.; Wang, Y.; Zhang, T.; Yang, Y. Sliding wear and electrochemical corrosion behavior of plasma sprayed nanocomposite Al2O3-13%TiO2 Coatings. Mater. Chem. Phys. 2009, 118, 37–45. [Google Scholar] [CrossRef]
  2. Fervel, V.; Normand, B.; Coddet, C. Tribological behavior of plasma sprayed Al2O3-based cermet coatings. Wear 1999, 230, 70–77. [Google Scholar] [CrossRef]
  3. Lin, X.H.; Zeng, Y.; Lee, S.W.; Ding, C. Charatcrization of alumina-3wt% titania coating prepared by plasma spraying of nanostructured powder. J. Eur. Ceram. Soc. 2014, 24, 627–634. [Google Scholar] [CrossRef]
  4. Zavareh, M.A.; Sarhan, A.A.D.M.; Karimzadeh, R.; Singh, R.S.A. Analysis of corrosion protection behavior of Al2O3-TiO2 oxide ceramic coating on carbon steel pipes for petroleum industry. Ceram. Int. 2018, 44, 5967–5975. [Google Scholar] [CrossRef]
  5. Martucci, A.; Innocenzi, P.; Traversa, E. Crystallization of Al2O3-TiO2 sol-gel systems. J. Ceram. Soc. Jpn. 1999, 107, 891–894. [Google Scholar] [CrossRef]
  6. Huang, J.; Cho, Y.; Zhang, Z.; Jan, A.; Wong, K.T.; Nemani, S.D.; Yieh, E.; Kummel, A.C. Selective pulsed chemical vapor deposition of water-free TiO2/Al2O3 and HfO2/Al2O3 nanolaminates on Si and SiO2 in preference to SiCOH. ACS Appl. Mater. Interfaces 2022, 14, 15716–15727. [Google Scholar] [CrossRef] [PubMed]
  7. Tomaszek, R.; Pawlowski, L.; Zdanowski, J.; Grimblot, J.; Laureyns, J. Microstructural transformations of TiO2, Al2O3 + 13TiO2 and Al2O3 + 40TiO2 at plasma spraying and laser engraving. Surf. Coat. Technol. 2004, 185, 137–149. [Google Scholar] [CrossRef]
  8. Bannier, E.; Vicent, M.; Rayón, E.; Benavente, R.; Salvador, M.D.; Sánchez, E. Effect of TiO2 addition on the microstructure and nanomechanical properties of Al2O3 Suspension Plasma Sprayed coatings. Appl. Surf. Sci. 2014, 316, 141–146. [Google Scholar] [CrossRef]
  9. Song, R.G. Hydrogen permeation resistance of plasma-sprayed Al2O3 and Al2O3-13 wt% TiO2 ceramic coatings on austenitic stainless steel. Surf. Coat. Technol. 2003, 168, 191–194. [Google Scholar] [CrossRef]
  10. Singh, H.; Sidhu, B.S.; Puri, D.; Prakash, S. Use of plasma spray technology for deposition of high temperature oxidation/corrosion resistant coatings—A review. Mater. Corros. 2007, 58, 92–102. [Google Scholar] [CrossRef]
  11. Pan, X.; Niu, Y.; Liu, T.; Zhong, X.; Li, C.; Shi, M.; Zheng, X.; Ding, C. Ablation behaviors of ZrC-TiC coatings prepared by vacuum plasma spray: Above 2000 °C. J. Eur. Ceram. Soc. 2019, 39, 3292–3300. [Google Scholar] [CrossRef]
  12. Celik, E.; Ozdemir, I.; Avci, E.; Tsunekawa, Y. Corrosion behaviour of plasma sprayed coatings. Surf. Coat. Technol. 2005, 193, 297–302. [Google Scholar] [CrossRef]
  13. Wang, Y.; Tian, W.; Zhang, T.; Yang, Y. Microstructure, spallation and corrosion of plasma sprayed Al2O3–13%TiO2 coatings. Corros. Sci. 2009, 51, 2924–2931. [Google Scholar] [CrossRef]
  14. Zhang, J.; He, J.; Dong, Y.; Li, X.; Yan, D. Microstructurecharacteristics of Al2O3-13wt% TiO2 coating plasma spray deposited with nanocrystalline powders. J. Mater. Process. Tech. 2008, 197, 31–35. [Google Scholar] [CrossRef]
  15. Kim, H.-J.; Odoul, S.; Lee, C.-H.; Kweon, Y.-G. The electrical insulation behavior and sealing effects of plasma-sprayed alumina–titania coatings. Surf. Coat. Technol. 2001, 140, 293–301. [Google Scholar] [CrossRef]
  16. Zeng, L.; Li, L.M.; Li, Q. Effect of CeO2 on microstructure and properties of plasma sprayed Al2O3-13wt% TiO2 coating. J. Fujian Univ. Technol. 2011, 6, 521–525. [Google Scholar]
  17. Liu, Y.; Gou, G.Q.; Wang, X.M.; Jia, Q.; Chen, H.; Tu, M.J. Effects of rare earth elements on the microstructure and mechanical properties of HVOF-sprayed WC-Co coatings. J. Therm. Spray Technol. 2014, 23, 1225–1237. [Google Scholar] [CrossRef]
  18. Zhang, Y.; Sun, S.; Zhao, L.; Yang, C.; Wu, L.; Guo, Y.; Ang, A.S.M. Corrosion behavior of plasma-sprayed Al2O3-3%TiO2 coatings doped with CeO2. J. Therm. Spray Technol. 2022, 32, 290–305. [Google Scholar] [CrossRef]
  19. Çelik, E.; Şengil, I.; Avcı, E. Effects of some parameters on corrosion behaviour of plasma-sprayed coatings. Surf. Coat. Technol. 1997, 97, 355–360. [Google Scholar] [CrossRef]
  20. Harju, M.; Järn, M.; Dahlsten, P.; Rosenholm, J.B.; Mäntylä, T. Influence of long-term aqueous exposure on surface properties of plasma sprayed oxides Al2O3, TiO2 and their mixture Al2O3–13TiO2. Appl. Surf. Sci. 2008, 254, 7272–7279. [Google Scholar] [CrossRef]
  21. Ding, Q.J.; Zhao, G. Effects of CeO2 on the microstructure and tribological properties of atmospheric plasma-sprayed Cr2O3-TiO2 coatings. Ind. Lubr. Tribol. 2020, 72, 341–347. [Google Scholar] [CrossRef]
  22. Wang, Y.; Jiang, S.; Wang, M.; Wang, S.; Xiao, T.; Strutt, P.R. Abrasive wear characteristics of plasma sprayed nanostructured alumina/titania coatings. Wear 2000, 237, 176–185. [Google Scholar] [CrossRef]
  23. Tao, Z.; Xun, C.; Shunxing, W.; Shian, Z. Effect of CeO2 on microstructure and corrosive wear behavior of laser-cladded Ni/WC coating. Thin Solid Films 2000, 379, 128–132. [Google Scholar] [CrossRef]
  24. He, L.; Tan, Y.; Wang, X.; Xu, T.; Hong, X. Microstructure and wear properties of Al2O3-CeO2/Ni-base alloy composite coatings on aluminum alloys by plasma spray. Appl. Surf. Sci. 2014, 314, 760–767. [Google Scholar] [CrossRef]
  25. Holgado, J.P.; Alvarez, R.; Munuera, G. Study of CeO2 XPS spectra by factor analysis: Reduction of CeO2. Appl. Surf. Sci. 2000, 161, 301–315. [Google Scholar] [CrossRef]
  26. Bagus, P.; Nelin, C.; Ilton, E.; Baron, M.; Abbott, H.; Primorac, E.; Kuhlenbeck, H.; Shaikhutdinov, S.; Freund, H.-J. The complex core level spectra of CeO2: An analysis in terms of atomic and charge transfer effects. Chem. Phys. Lett. 2010, 487, 237–240. [Google Scholar] [CrossRef]
  27. Wenjuan, L.; Fahe, C.; Linrong, C.; Zhao, Z.; Jianqing, Z. Effect of rare earth element Ce and La on corrosion behavior of AM60 magnesium alloy. Corros. Sci. 2009, 51, 1334–1343. [Google Scholar] [CrossRef]
  28. Arrabal, R.; Matykina, E.; Viejo, F.; Skeldon, P.; Thompson, G. Corrosion resistance of WE43 and AZ91D magnesium alloys with phosphate PEO coatings. Corros. Sci. 2008, 50, 1744–1752. [Google Scholar] [CrossRef]
  29. Duan, H.; Du, K.; Yan, C.; Wang, F. Electrochemical corrosion behavior of composite coatings of sealed MAO film on magnesium alloy AZ91D. Electrochim. Acta 2006, 51, 2898–2908. [Google Scholar] [CrossRef]
  30. Zhang, Z.; Liu, W.; Xue, Q. Study on lubricating mechanisms of La(OH)3 nanocluster modified by compound containing nitrogen in liquid paraffin. Wear 1998, 218, 139–144. [Google Scholar] [CrossRef]
Figure 1. Element distribution maps of AT3 doped with 1%, 5%, 8% CeO2 coatings: a. Element distribution maps of AT3 + 1% CeO2 coating—(a1) surface morphology of AT + 1% CeO2 coating, (a2) Al element distribution maps, (a3) Ti element distribution maps, and (a4) Ce element distribution maps; b. Element distribution maps of AT3 + 5% CeO2 coating—(b1) surface morphology of AT3 + 5% CeO2 coating, (b2) Al element distribution maps, (b3) Ti element distribution maps, and (b4) Ce element distribution maps; c. Element distribution maps of AT3 + 8% CeO2 coating—(c1) surface morphology of AT3 + 8% CeO2 coating, (c2) Al element distribution maps, (c3) Ti element distribution maps, and (c4) Ce element distribution maps.
Materials 18 04532 g001aMaterials 18 04532 g001b
Figure 2. Figures and element distribution of cross-section morphology for AT3 doped with 5%, 8% CeO2 coatings ((a): with 5% CeO2; (b): with 8% CeO2).
Materials 18 04532 g002
Figure 3. XRD patterns and phase analysis of the pure AT3 and doped with 1%,5%,8% CeO2 coatings.
Materials 18 04532 g003
Figure 4. Three-dimensional XPS spectra of Ce and peak deconvolution in the coatings. a: as-sprayed coating; (a1): XPS patterns of the pure AT3 and doped with 1%, 5%, and 8% CeO2 coating; and (a2): Fitting result of Ce 3d pattern of AT3 + 8% CeO2 coating. b: The coating after 36 h immersion in 5% NaCl; (b1): XPS patterns of the pure AT3 and doped with 1%, 5%, and 8% CeO2 coating; and (b2): Fitting result of Ce 3d pattern of AT3 + 8% CeO2 coating.
Materials 18 04532 g004
Figure 5. Open circuit potential (Eocp) vs. time curve of AT3, AT3 + 1%CeO2, AT3 + 5%CeO2, and AT3 + 8%CeO2 coatings immersed in 5% NaCl solution for 72 h (optimum data from 5 repeated experiments).
Materials 18 04532 g005
Figure 6. Potentiodynamic curve of AT3, AT3 + 1%CeO2, AT3 + 5%CeO2, and AT3 + 8%CeO2 coatings immersed in 5% NaCl solution ((a): immersed for 0.5 h; (b): immersed for 36 h) (optimum data from 5 repeated experiments).
Materials 18 04532 g006
Figure 7. Corrosion potential and Tafel fitting results (mean ± SD, n = 5) for AT3, AT3 + 1%CeO2, AT3 + 5%CeO2 and AT3 + 8%CeO2 coatings immersed in 5% NaCl solution ((a): immersed for 0.5 h; (b): immersed for 36 h) (optimum data from 5 repeated experiments).
Materials 18 04532 g007
Figure 8. EIS curve of AT3, AT3 + 1%CeO2, AT3 + 5%CeO2, and AT3 + 8%CeO2 coatings immersed in 5% NaCl solution ((a): AT3 coating; (b): AT3 + 1%CeO2 coating; (c): AT3 + 5%CeO2 coating; (d): AT3 + 8%CeO2 coating) (optimum data from 5 repeated experiments).
Materials 18 04532 g008
Figure 9. Equivalent electrical circuit for EIS result ((a): AT3 coating; (b): AT3 + 1%CeO2 coating, AT3 + 5%CeO2 coating, and AT3 + 8%CeO2 coating).
Materials 18 04532 g009
Figure 10. Main parameters (Rct (a) and Rpro (b)) of fitted electrochemical parameters (error bars represent standard deviation from quintuplicate tests; optimum data from 5 repeated experiments).
Materials 18 04532 g010
Figure 11. Diagram of corrosion process of coating in 5% NaCl solution.
Materials 18 04532 g011
Table 1. Proportion of powder composition for plasma spraying (mass fraction,%).
SpecimensAT3/wt%CeO2/wt%(Add as Powder)Ce/wt%
110000
29910.81
39553.87
49286.03
Table 2. Plasma spray process parameters.
Voltage/VElectric Current/ASpray Distance/mmAr Flow Rate/(L·min−1)H2 Flow Rate/(L·min−1)Powder Feeding/(g·min−1)
27580100451230
Table 3. XPS spectra fitting results for Ce 3d of AT3 + CeO2 coatings before and after immersion.
As Prepare After Immersion
PeakBinding Energy
(eV)
Intensity
(a.u)
FWHM
(eV)
Valence StatePeakBinding Energy
(eV)
Intensity
(a.u)
FWHM
(eV)
Valence State
AT3 + CeO2 1% Coating 1881.927109.973.75Ce4+1881.71389.850.89Ce4+
2899.743437.794.07Ce4+2885.46817.292.83Ce3+
3904.142461.443.95Ce4+3904.0184.321Ce4+
4916.652196.463.2Ce4+-----
AT3 + CeO2 5% Coating 1883.0129,485.894.45Ce4+1881.713731.993.71Ce4+
2898.269825.022Ce4+2885.235326.554.43Ce3+
3901.0514,137.624.06Ce4+3900.074005.154.86Ce4+
4916.497491.321.88Ce4+4904.134776.946.29Ce4+/Ce3+
AT3 + CeO2 8% Coating 1883.0329,914.544.52Ce4+1882.024514.661.69Ce4+
2898.2810,104.112.03Ce4+2885.4410,634.822.92Ce3+
3901.0813,584.213.95Ce4+3899.882177.492.99Ce4+
4916.517339.721.85Ce4+4904.3433,682.549.41Ce4+/Ce3+
Disclaimer/Publisher’s Note: The statements, opinions and data contained in all publications are solely those of the individual author(s) and contributor(s) and not of MDPI and/or the editor(s). MDPI and/or the editor(s) disclaim responsibility for any injury to people or property resulting from any ideas, methods, instructions or products referred to in the content.