Article

Microscopic Phase-Field Modeling with Accurate Interface Thickness Representation: Applied to Ceramic Matrix Composites

1
State Key Laboratory of Structural Analysis, Optimization and CAE Software for Industrial Equipment, Dalian University of Technology, Dalian 116024, China
2
International Center for Computational Mechanics, Dalian University of Technology, Dalian 116024, China
3
State Key Laboratory of Intelligent Construction and Healthy Operation and Maintenance of Deep Underground Engineering, China University of Mining & Technology, Xuzhou 221116, China
4
Yunlong Lake Laboratory of Deep Underground Science and Engineering, China University of Mining & Technology, Xuzhou 221116, China
*
Author to whom correspondence should be addressed.
Materials 2025, 18(19), 4496; https://doi.org/10.3390/ma18194496
Submission received: 17 August 2025 / Revised: 5 September 2025 / Accepted: 25 September 2025 / Published: 27 September 2025

Abstract

Ceramic matrix composites (CMCs) are promising candidates for high-temperature structural applications. However, their fracture toughness remains low due to strong chemical bonding between fibers and the matrix. To improve toughness, engineered interfaces such as pyrolytic carbon (PyC) and hexagonal boron nitride (h-BN) are commonly introduced. These interfaces promote crack deflection and fiber bridging, leading to improved damage tolerance and pseudo-ductile behavior. To investigate the influence of interface thickness on mechanical performance and to identify optimal thickness ranges, we propose a microscopic phase-field model that accurately resolves interface thickness and material contrast. This model overcomes the limitations of conventional smeared interface approaches, particularly in systems with variable interface thickness and closely packed fibers. We apply the model to simulate the fracture behavior of unidirectional SiC fiber reinforced SiC matrix (SiCf/SiCm) composites with PyC and h-BN interfaces of varying thickness. The numerical results show strong agreement with experimental findings from the literature and reveal optimal interface thicknesses that maximize toughening effects. These results demonstrate the model’s predictive capabilities and its potential as a tool for interface design in brittle composite systems.

Graphical Abstract

1. Introduction

Fiber-reinforced ceramic matrix composites (CMCs) have gained widespread attention for advanced thermal-structural applications due to their high-temperature strength, oxidation resistance, and damage tolerance [1,2]. Their low density and excellent thermomechanical performance make them promising replacements for traditional superalloys in aerospace and energy systems [3], where weight reduction and efficiency are critical. As operating temperatures continue to rise in gas turbines [4], nuclear reactors, and hypersonic platforms, CMCs are increasingly indispensable for components exposed to extreme thermal and mechanical loads [5]. Among various CMCs, silicon carbide fiber-reinforced silicon carbide matrix composites (SiCf/SiCm) stand out for their chemical compatibility, low thermal expansion mismatch, and stability in oxidizing environments [6]. They are already used in non-load-bearing components such as combustor liners and insulation parts, and with advances in processing and interface design, their application is expanding toward high-load components like turbine vanes and blades [7]. This trend is driven by the need to improve thermal efficiency, extend service life, and reduce weight—especially in environments where metal alloys suffer from oxidation or creep. Despite their advantages, SiCf/SiCm composites still face challenges related to fracture toughness, which is highly sensitive to microscale fiber–matrix interactions. Strong chemical bonding formed during high-temperature sintering, while beneficial for load transfer, often inhibits key toughening mechanisms such as crack deflection and fiber pull-out—resulting in brittle fracture behavior [8,9,10].
To address this, engineered interfaces such as pyrolytic carbon (PyC) and hexagonal boron nitride (h-BN) are commonly introduced between fibers and the matrix [11,12], as shown in Figure 1. These weak interfaces facilitate crack deflection and fiber bridging during fracture, which in turn improves damage tolerance and enables pseudo-ductile response [13]. In particular, PyC interfaces have been shown to significantly enhance toughness and structural reliability in SiCf/SiCm composites. The mechanical performance of these systems is closely tied to interface thickness. Therefore, when studying the mechanical response of ceramic matrix composites, the influence of the interface thickness must be taken into account.
The mechanical behavior of ceramic matrix composites (CMCs) is commonly investigated using both experimental techniques and numerical simulations. While experimental methods [15,16]—such as mechanical testing, microscopy, and fractography—offer direct insight into damage and failure mechanisms, they often involve high material costs, complex sample preparation, and limited flexibility in controlling microstructural parameters. This makes it challenging to systematically study the influence of interfacial and structural variations on composite performance. In contrast, numerical simulation provides a powerful and efficient alternative for exploring damage evolution and fracture processes under controlled conditions. It enables detailed analysis of material response at multiple scales and offers predictive capabilities that complement experimental findings. As such, the development of robust and adaptable numerical approaches is essential for advancing the design and optimization of CMCs.
Several computational methods have been established for simulating fractures in composite materials, including the cohesive zone model (CZM) [17,18,19], extended finite element method (XFEM) [20,21,22], virtual crack closure technique (VCCT) [23,24], and peridynamics [25,26]. While effective in certain applications, these methods often face limitations such as mesh dependency, predefined crack paths, or poor adaptability to complex microstructures. The phase field method for fracture has emerged as a promising alternative, particularly well-suited for modeling complex crack initiation and propagation in brittle [27,28,29,30,31,32,33,34,35] and multi-phase materials [36,37,38]. By introducing a continuous scalar field to represent crack evolution [39,40,41,42], the phase-field approach eliminates the need for explicit crack tracking and can naturally capture arbitrary crack paths, coalescence, and branching. Its variational foundation ensures energy consistency and facilitates coupling with other physical fields, making it highly versatile for simulating fractures in CMCs. Given the inherently brittle nature of CMCs and the critical role of fiber–matrix interactions, this study employs a phase field modeling framework to accurately simulate damage initiation and growth in ceramic composite microstructures.
In phase-field modeling of fracture in composite microstructures, two main approaches are currently used to represent the fiber–matrix interface. The first approach explicitly defines the interface as a separate region within the model geometry [43,44,45]. This method directly assigns thickness and material properties to the interface, but requires generating a separate mesh for each interface configuration. It also demands fine mesh resolution across the interface, especially for thin layers, resulting in high computational cost and modeling complexity. The second approach is the smeared interface method [46,47,48,49], which uses a continuous transition function to gradually interpolate material properties. This avoids the need to explicitly define the interface geometry. Due to its flexibility and efficiency, this method has gained increasing interest and is considered a promising direction for large-scale or parametric simulations. However, current smeared interface methods often assume thin interface characteristics and struggle to capture variations in interface thickness, especially in microstructures with closely spaced fibers. As a result, their accuracy in predicting mechanical response is limited.
To overcome the limitations, this work proposes a novel unified framework for smeared interface modeling in phase-field model of microscopic fracture. Without explicit geometric partitioning of the interface region in the model, the proposed approach avoids the need to remesh or remodel for each interface thickness, significantly improving computational efficiency. The method is demonstrated in this study through two common applications in ceramic matrix composites. First, it is used to investigate the effect of varying h-BN interface thickness in a single-fiber SiCf/SiCm composite under transverse tension. Second, it is applied to simulate the three-point bending fracture behavior of PyC-coated SiCf/SiCm composites, where the predictions are validated against experimental results. These examples highlight the method’s accuracy in capturing interface-driven fracture mechanisms and its potential for guiding interface design in complex composite microstructures.

2. Conventional Phase-Field Modeling in Microscopic Composite Models: Methods and Limitations

In micromechanical modeling of composite materials, the microstructure is typically considered as a heterogeneous system composed of fibers, matrix, voids, and the fiber–matrix interface [36,50,51]. Although the interface plays a critical role in mechanical behavior—particularly in damage initiation and failure evolution—its extremely small thickness often prevents accurate measurement of geometric and material properties. This poses significant challenges for phase-field modeling of failure processes. To address this issue, the auxiliary interface phase field approach has been developed, which constructs an equivalent continuous material field to represent the fiber, matrix, and interface within a unified computational framework. However, conventional smearing functions used to interpolate material properties across phases exhibit notable limitations when the thickness of the interface needs to be taken into consideration or when fiber spacing is small. In such cases, the overlap of smeared regions leads to significant numerical errors.

2.1. Overview of Phase-Field Theory for Fracture

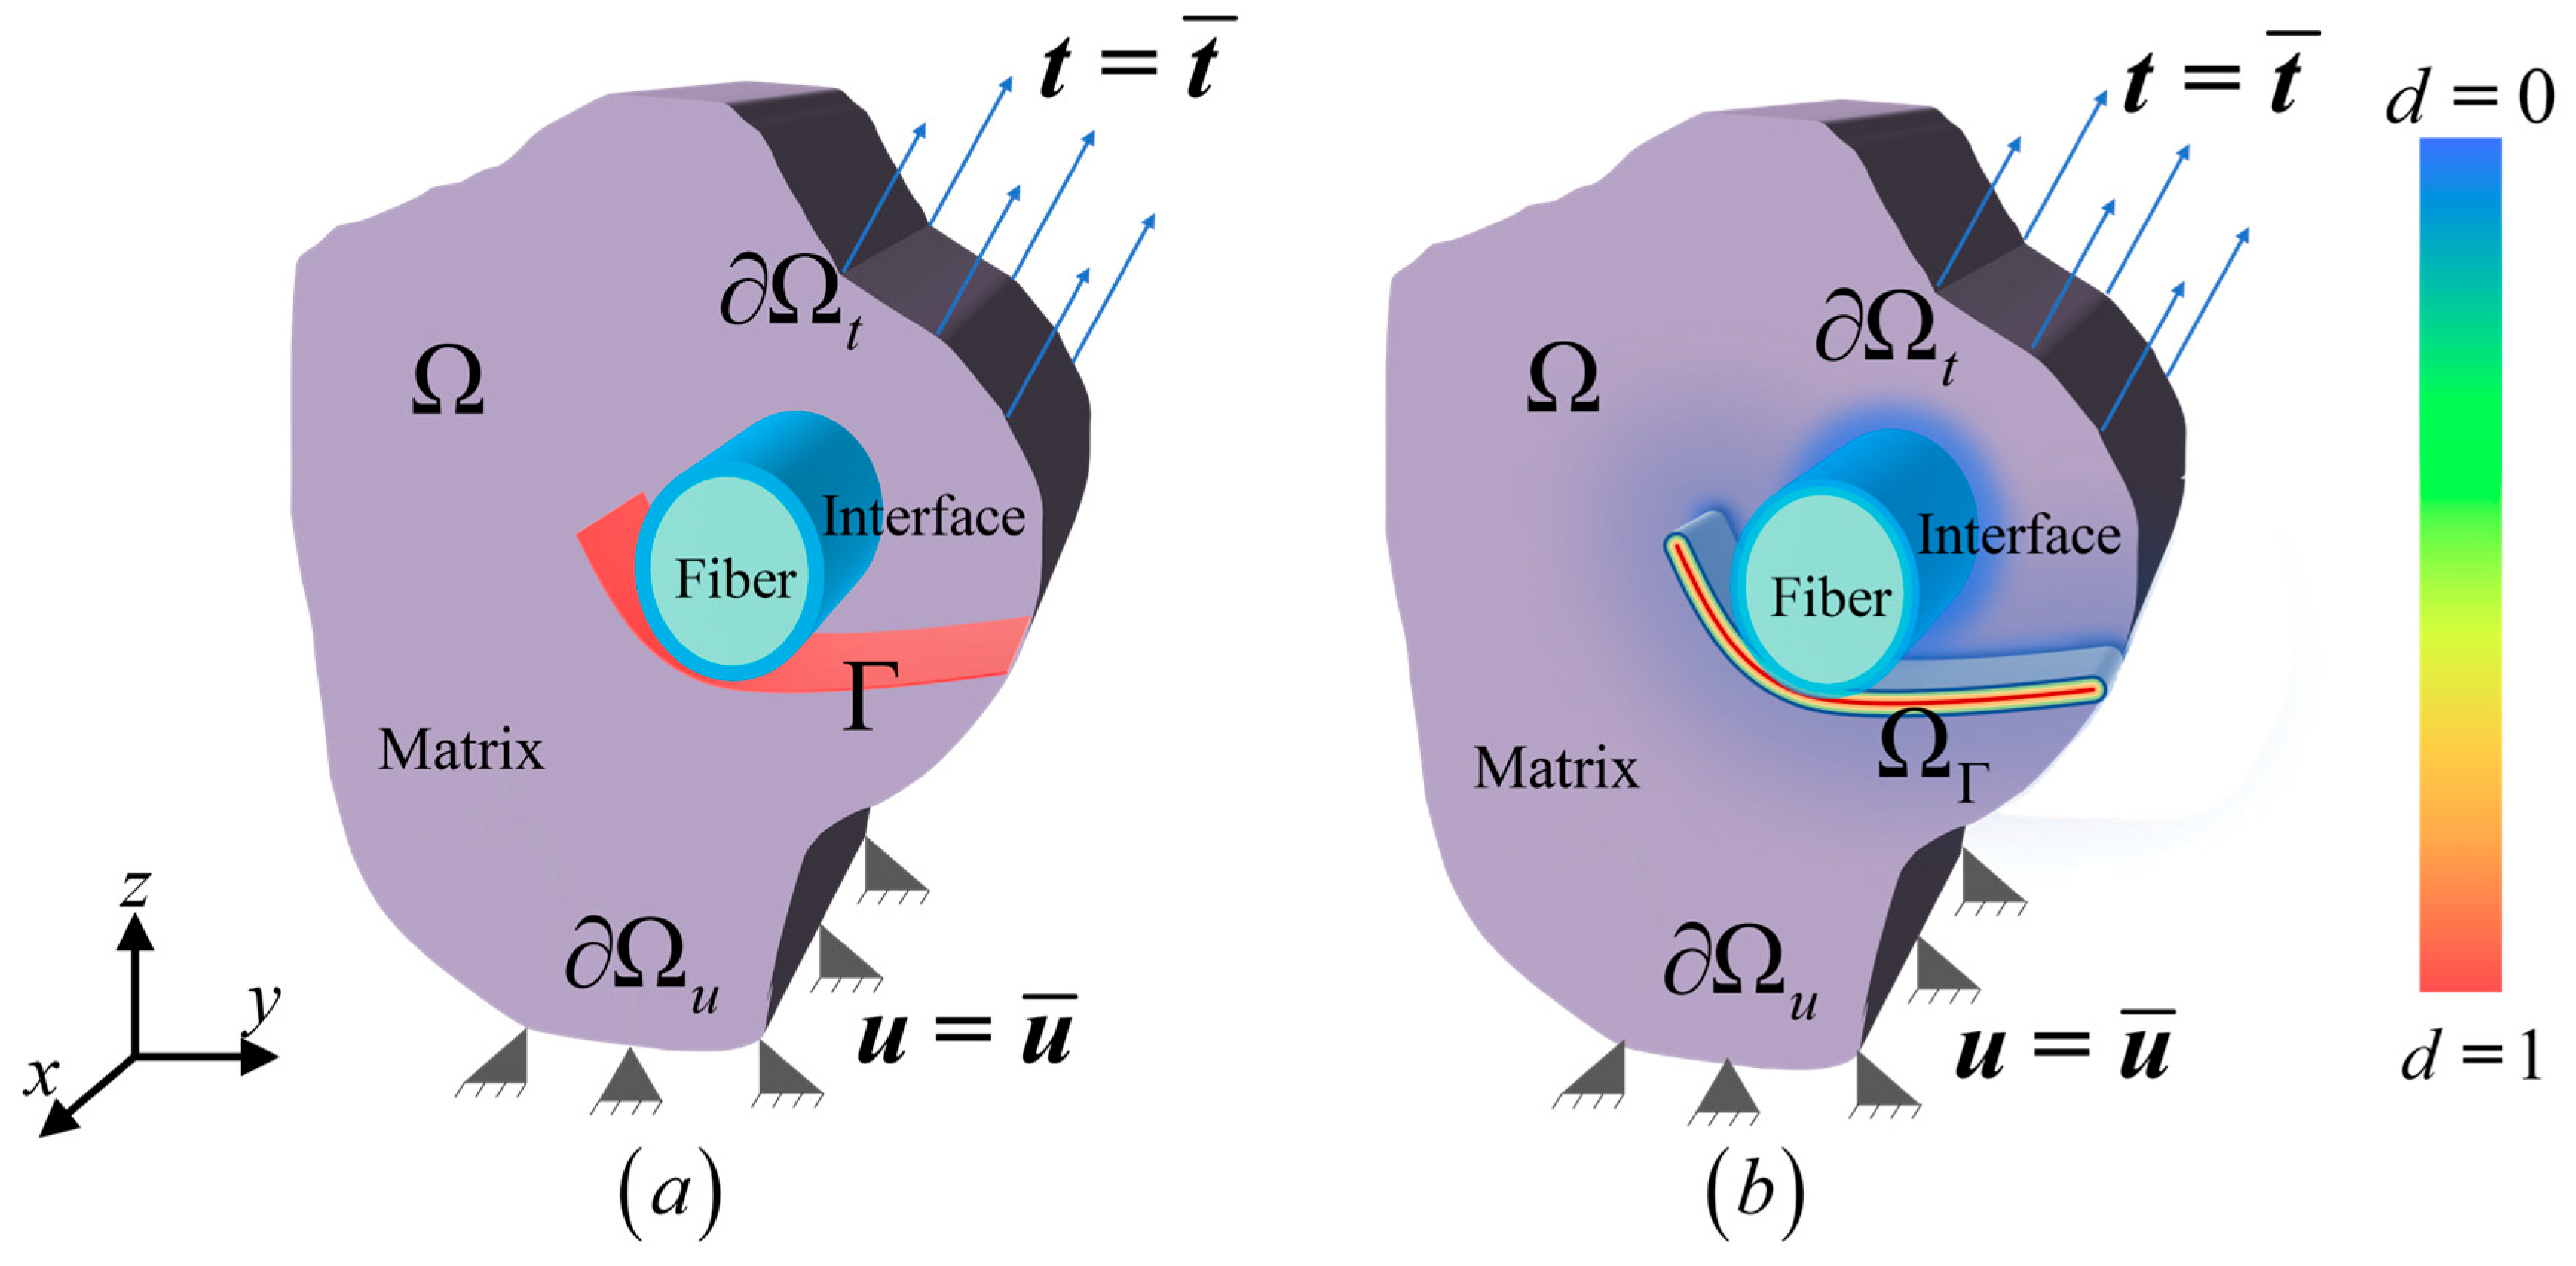
For a micro-scale structure Ω containing crack set Γ shown in Figure 2, it is considered to be consisted of matrix domain Ω m , fiber domain Ω f and interface domain Ω i . The traction t ¯ is applied on the boundary Ω t and the displacement u ¯ is prescribed on the boundary Ω u . According to the Francfort-Marigo variational principle [41], the total potential energy of the system W is
W = W m + W f + W i + W d W e x t = Ω m Γ Φ ε d V + Ω f Γ Φ ε d V + Ω i Γ Φ ε d V + Γ G c d S Ω t t · u   d S
where W e x t is the total potential of the external force. W m , W f and W i are elastic potential of the matrix, fiber and interface zones, W d is the fracture energy, Φ ε is the strain energy density in undamaged region, G c is the critical energy release rate.
The phase-field model, as a smeared method, allows the crack set Γ to be approximately described by a continuous scalar phase-field variable d 0 ,   1 , as shown in Figure 2b. The material is intact when d = 0 , and fully failed when d = 1 . Thus, Equation (1) can be rewritten as [42,52]
W = Ω ω d Φ ε d V + Ω G c γ d , d d V Ω t t u   d S
where ω d is the energy degradation function, γ d , d is the crack surface density functional defined as [53]
γ d , d = 1 c 0 α d l 0 + l 0 d 2
where l 0 is a scalar internal length scale parameter used to control the width of the regularization area, α d is the crack geometric function which characterizes homogenous evolution of phase field, c 0 = 4 0 1 α x   d x is a scaling parameter ensuring the regularized crack surface approximates the discrete crack surface Γ .
The AT2 model [39] and the unified phase field model proposed by Wu [53]—also referred to as the phase field regularized cohesive zone model (PF-CZM)—are among the most widely used approaches in fracture phase field modeling. The specific functional forms and corresponding parameters of these models are summarized in Table 1. Notably, PF-CZM can represent various cohesive zone models by tuning its parameters, and two commonly adopted types are presented in the table.
In order to ensure that cracking only takes place under tensile stress state, the elastic potential is split into tensile part Φ ε + and compressive part Φ ε , and only the tensile part contributes to the evolution of the phase field. Then, Equation (2) is changed into:
W = Ω ω d Φ + + Φ d V + Ω G c γ d , d d V Ω t t u   d S
In this paper, two methods are employed for the elastic potential decomposition. The first method is based on principal strains [54]:
Φ ± = 1 2 λ tr ε ^ ± 2 + μ tr ε ^ ± 2
where λ and μ are the Lamé constants. x ± : = x ± x / 2 is the Macaulay bracket. ε ^ is the principal strain tensor. The second method is based on principal stresses [46]:
Φ ± = 1 + v 2 E tr σ ^ ± 2 v 2 E tr σ ^ ± 2
where v is Poisson’s ratio. σ ^ is the principal stress tensor. Meanwhile, In order to ensure that the damage does not heal itself, i.e., the requirement of d ˙ 0 , Miehe et al. [55] introduced a historically relevant variable:
H = max τ [ 0 , t ] Φ + ε x , τ
The variation in Equation (4) can be given as follows:
δ W = Ω ω d Φ ¯ + ε : δ ε + Φ ¯ ε : δ ε d V   + Ω ω d Φ ¯ + δ d d V + Ω G c c 0 α d l 0 δ d + 2 l 0 d δ d d V   Ω t t δ u d S Ω f δ u d V
Then the governing equations and boundary conditions for the current problem can be obtained as:
ω d σ + + σ + f = 0     x , y Ω ω d H + G c c 0 α d l 0 2 l 0 Δ d = 0 x , y Ω ω d σ + + σ n   =   t   x , y Ω   t d n = 0   x , y Ω   u   =   u ¯   x , y Ω u
The above represents a coupled system consisting of the modified stress equilibrium, given by the first equation, and the phase-field evolution, described by the second equation. The third and fifth equations correspond to the natural and essential boundary conditions associated with the stress equilibrium, while the fourth equation provides the natural boundary condition related to the phase-field evolution. Although the satisfaction of the fourth equation may appear trivial, it in fact imposes an upper bound on the choice of the regularization parameter l 0 with respect to the domain size, ensuring that the phase-field sufficiently decays to zero at the boundary.

2.2. An Auxiliary Phase Field for Fiber-Matrix Interface

An auxiliary interface phase field is introduced to generate an equivalent material field representing the three material phases. For a better illustration of the regularization of the interface material using phase field model, a one-dimensional long bar is used to explain the theory [37]. Let us consider the bar with volume Ω = Γ L × L in Figure 3a, where Γ L is the cross-sectional area, and L is the length of the bar. This bar is made up of three materials. The cross-section area of the bar is a unit, and an interface Γ i locates at x = x * . In this case, the interface can be represented strictly as a weak discontinuity using a scalar function:
D x = 1 at   x = x * 0 at   x x *
where D   = 1 and D   = 0 represents interface and matrix or fiber, respectively.
However, the representation of the interface using Equation (10) could always bring challenges to numerical modelling, especially when the topology of the interface become complex. In the interface phase field model, we assume that the transition between the interface and matrix is smooth, and can be expressed using a phase field function η ( x ) :
η ( x ) = e x x * l i
where η ( x * ) = 1 and η ( ± ) = 0 represents interface and matrix, respectively. The area with η ( x ) ( 0 , 1 ) represents a transition zone. In Equation (11), the internal length scale l i is used to control the size of the smeared zone. When l i 0 , the smeared representation of Equation (11) degenerates to the discrete representation Equation (10).
The interface phase field function Equation (11) is the optimal solution of the following variational principle:
η = Arg inf η W i Γ i η
where W i is the boundary condition and Γ i η is defined by
Γ i η = 1 2 l i η 2 + l i 2 η 2 d V
The variation in Equation (13) with respect to η gives the Euler equation of the interface phase field model and the boundary condition, as specified by
η l i 2 Δ η = 0 , x Ω R η ( x ) = 1 ,   x Γ i η n = 0 , x Ω R
where R = 1 , 2 , 3 represents the space dimension. The fundamental differential equation can be solved with prescribed boundary conditions.
Then, on the basis of the distribution of interface phase field, the equivalent material properties Θ s η in the transition zone can be determined through the following function
Θ s η = {     Θ i 1 h η + Θ m h η x x *     Θ i 1 h η + Θ f h η   x < x * ( Θ = G c , σ max )
where Θ s represents the equivalent material property in the transition area, and Θ i , Θ m and Θ f represent the material parameters of the interface and the other two material components, respectively. h η is a transition function, which is defined by
h η = 1 η 2
it must satisfy:
h 0 = 1 , h 1 = 0 , h η < 0
The last condition of Equation (17) ensures that the material parameters are monotonic after the interface dispersion. The first two conditions guarantee two critical conditions, namely:
Θ s 1 = Θ i , Θ s 0 = Θ m x x * Θ f x < x *

2.3. Limitations of Existing Interface Modeling Approaches

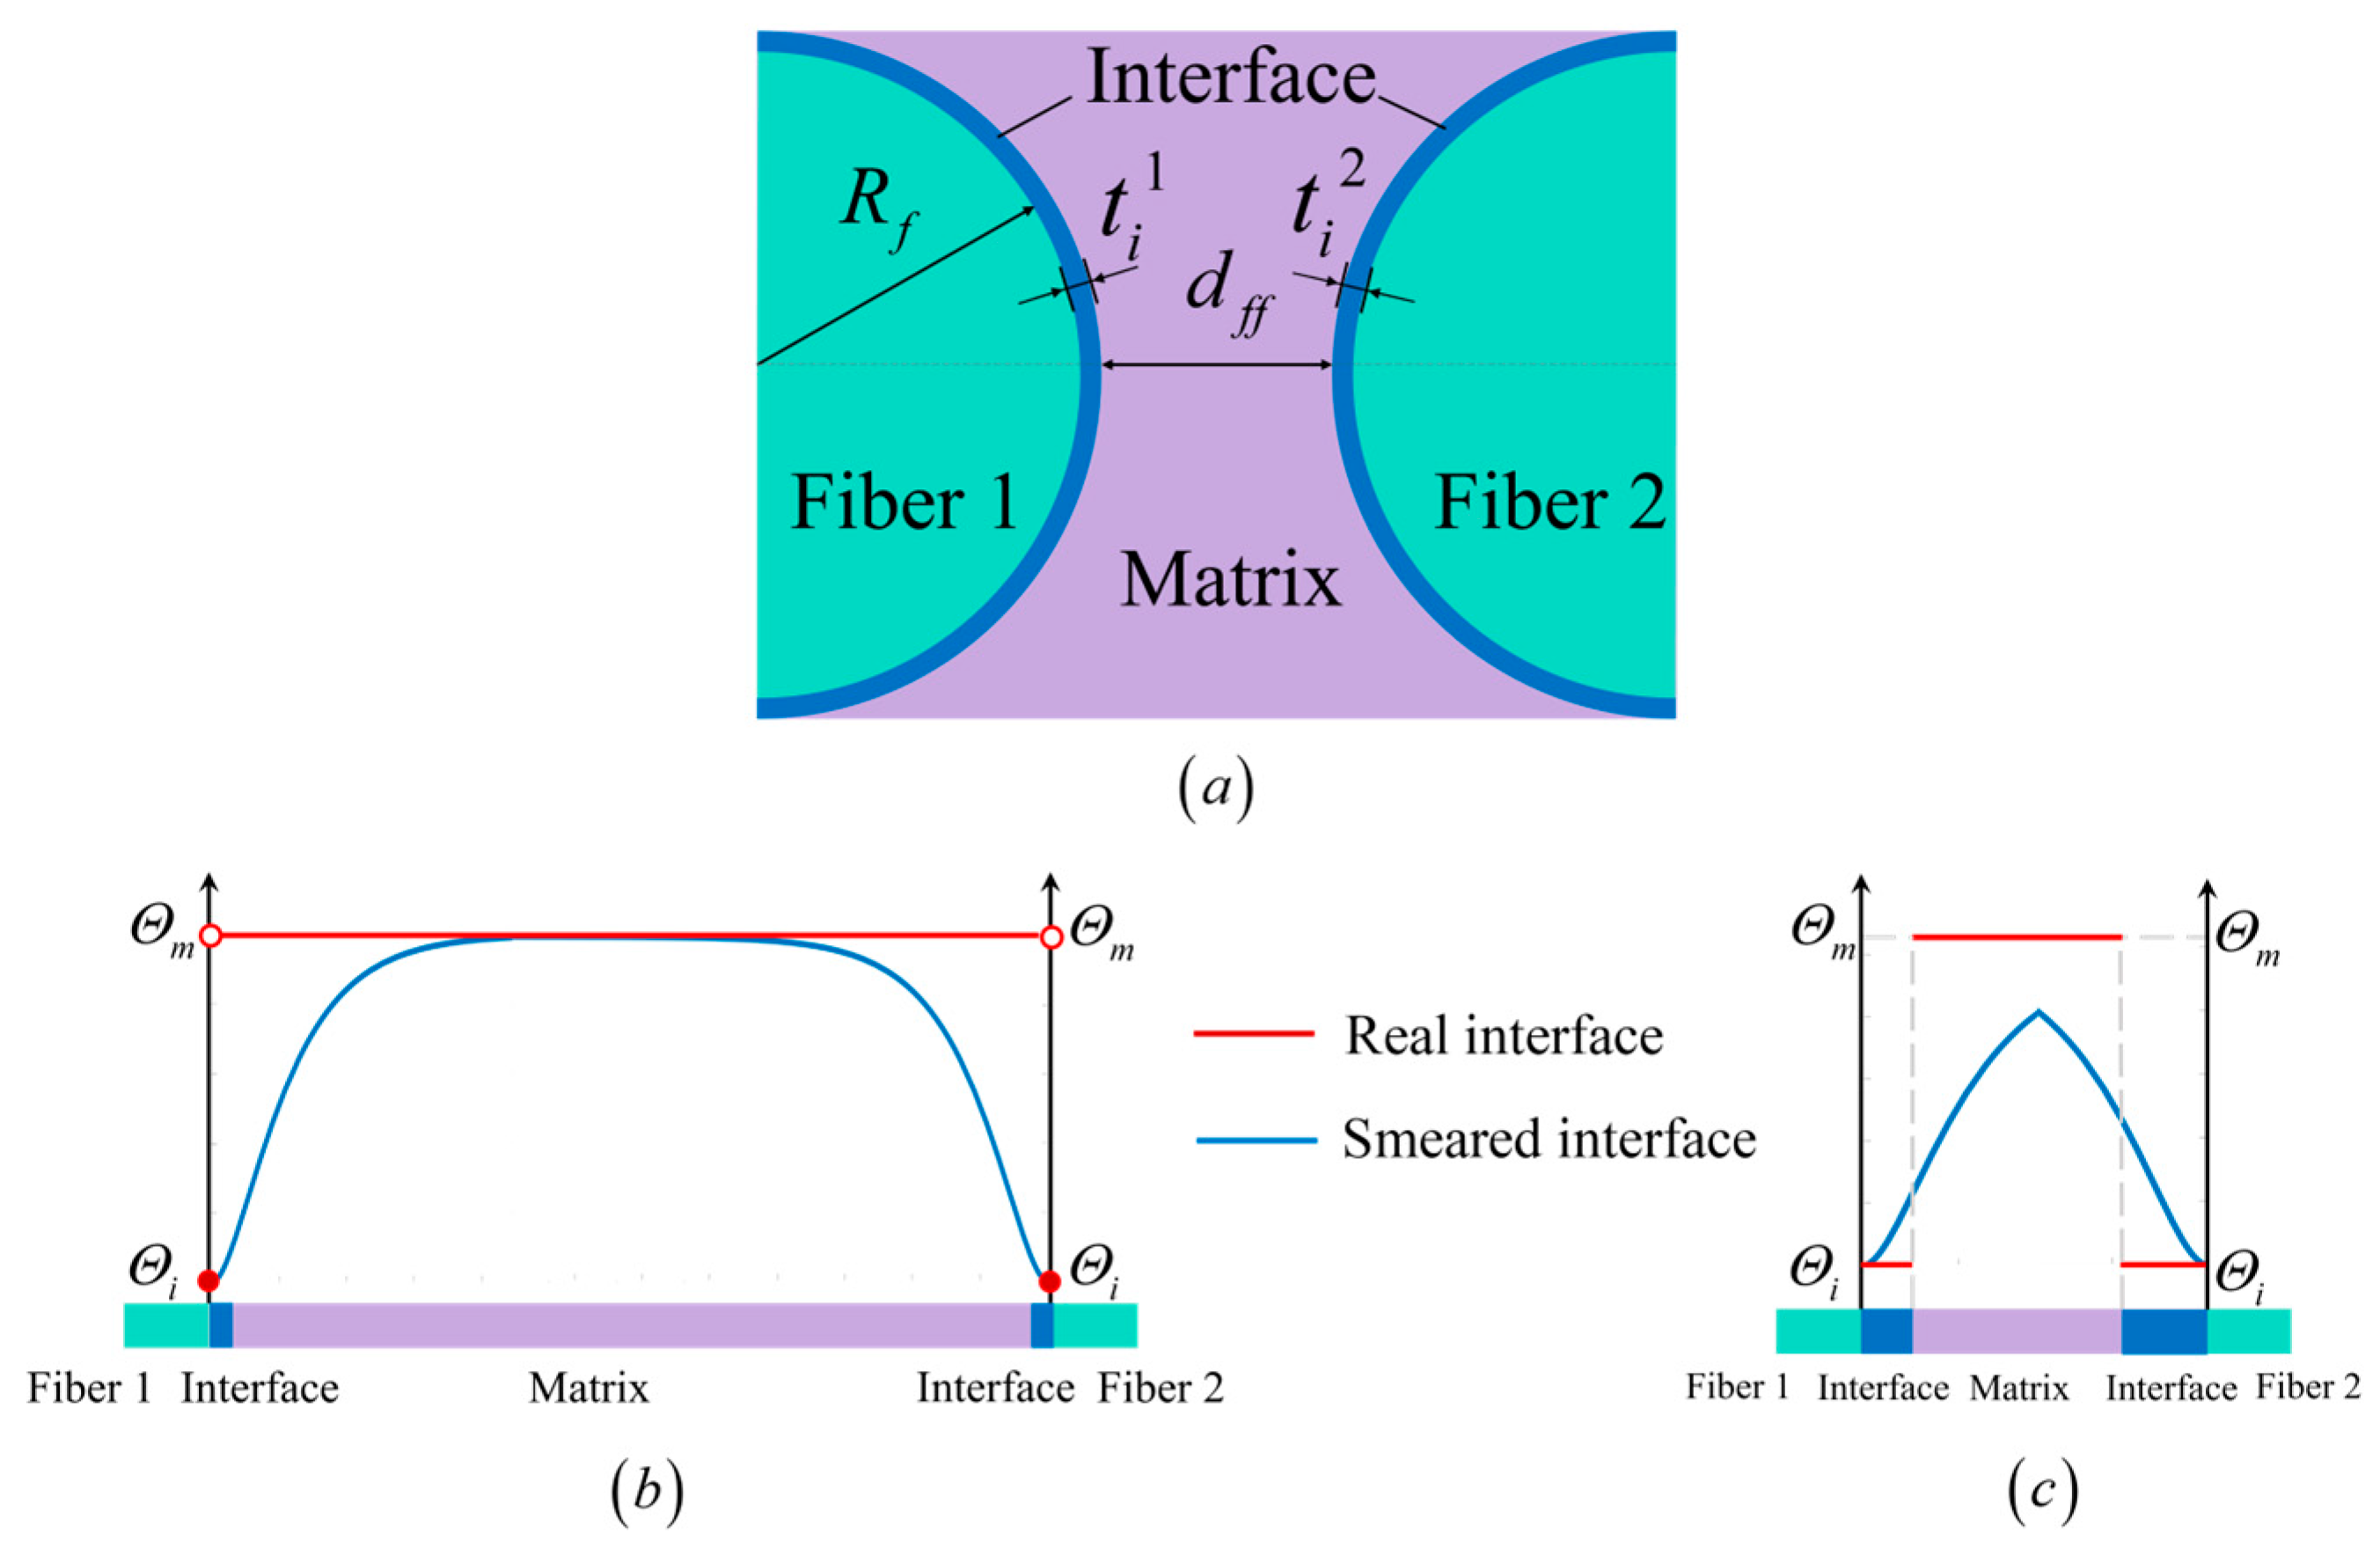
To better elucidate the relationship between material property smearing and the microstructure of composite materials, a microstructure is considered, as shown in Figure 4a. Fibers 1 and 2 have the same radius R f , with interface thicknesses t i 1 and t i 2 , respectively. The distance between the two fibers is d f f . When d f f is significantly larger than the fiber radius R f and both interface thicknesses are so small that they are difficult to measure, the material property smearing approach described in Section 2.2 yields the distribution shown in Figure 4b. This approach approximates the actual distribution of material properties and alleviates numerical challenges associated with sharp material property discontinuities. Moreover, it only requires the fracture strength and critical energy release rate of the interfacial as input parameters.
In contrast, consider the scenario depicted in Figure 4c, where the interface thicknesses t i 1 and t i 2 are different, measurable, and they are non-negligible relative to both the fiber radius R f and the fiber spacing d f f . In such cases, the difference in interface thickness is expected to significantly influence structural failure behavior. Applying the conventional smearing method under these conditions, as shown by the blue curve in Figure 4c, leads to a material property distribution that deviates markedly from the actual distribution (red line). Specifically, the material properties within the matrix region are underestimated in terms of fracture strength and critical energy release rate. Furthermore, an artificial peak appears in the smeared property profile between the two fibers. These inaccuracies lead to underestimation of the fracture energy release during failure and overlook essential elastic properties such as the modulus and Poisson’s ratio of the interfacial material, which are not captured by the traditional smearing model.
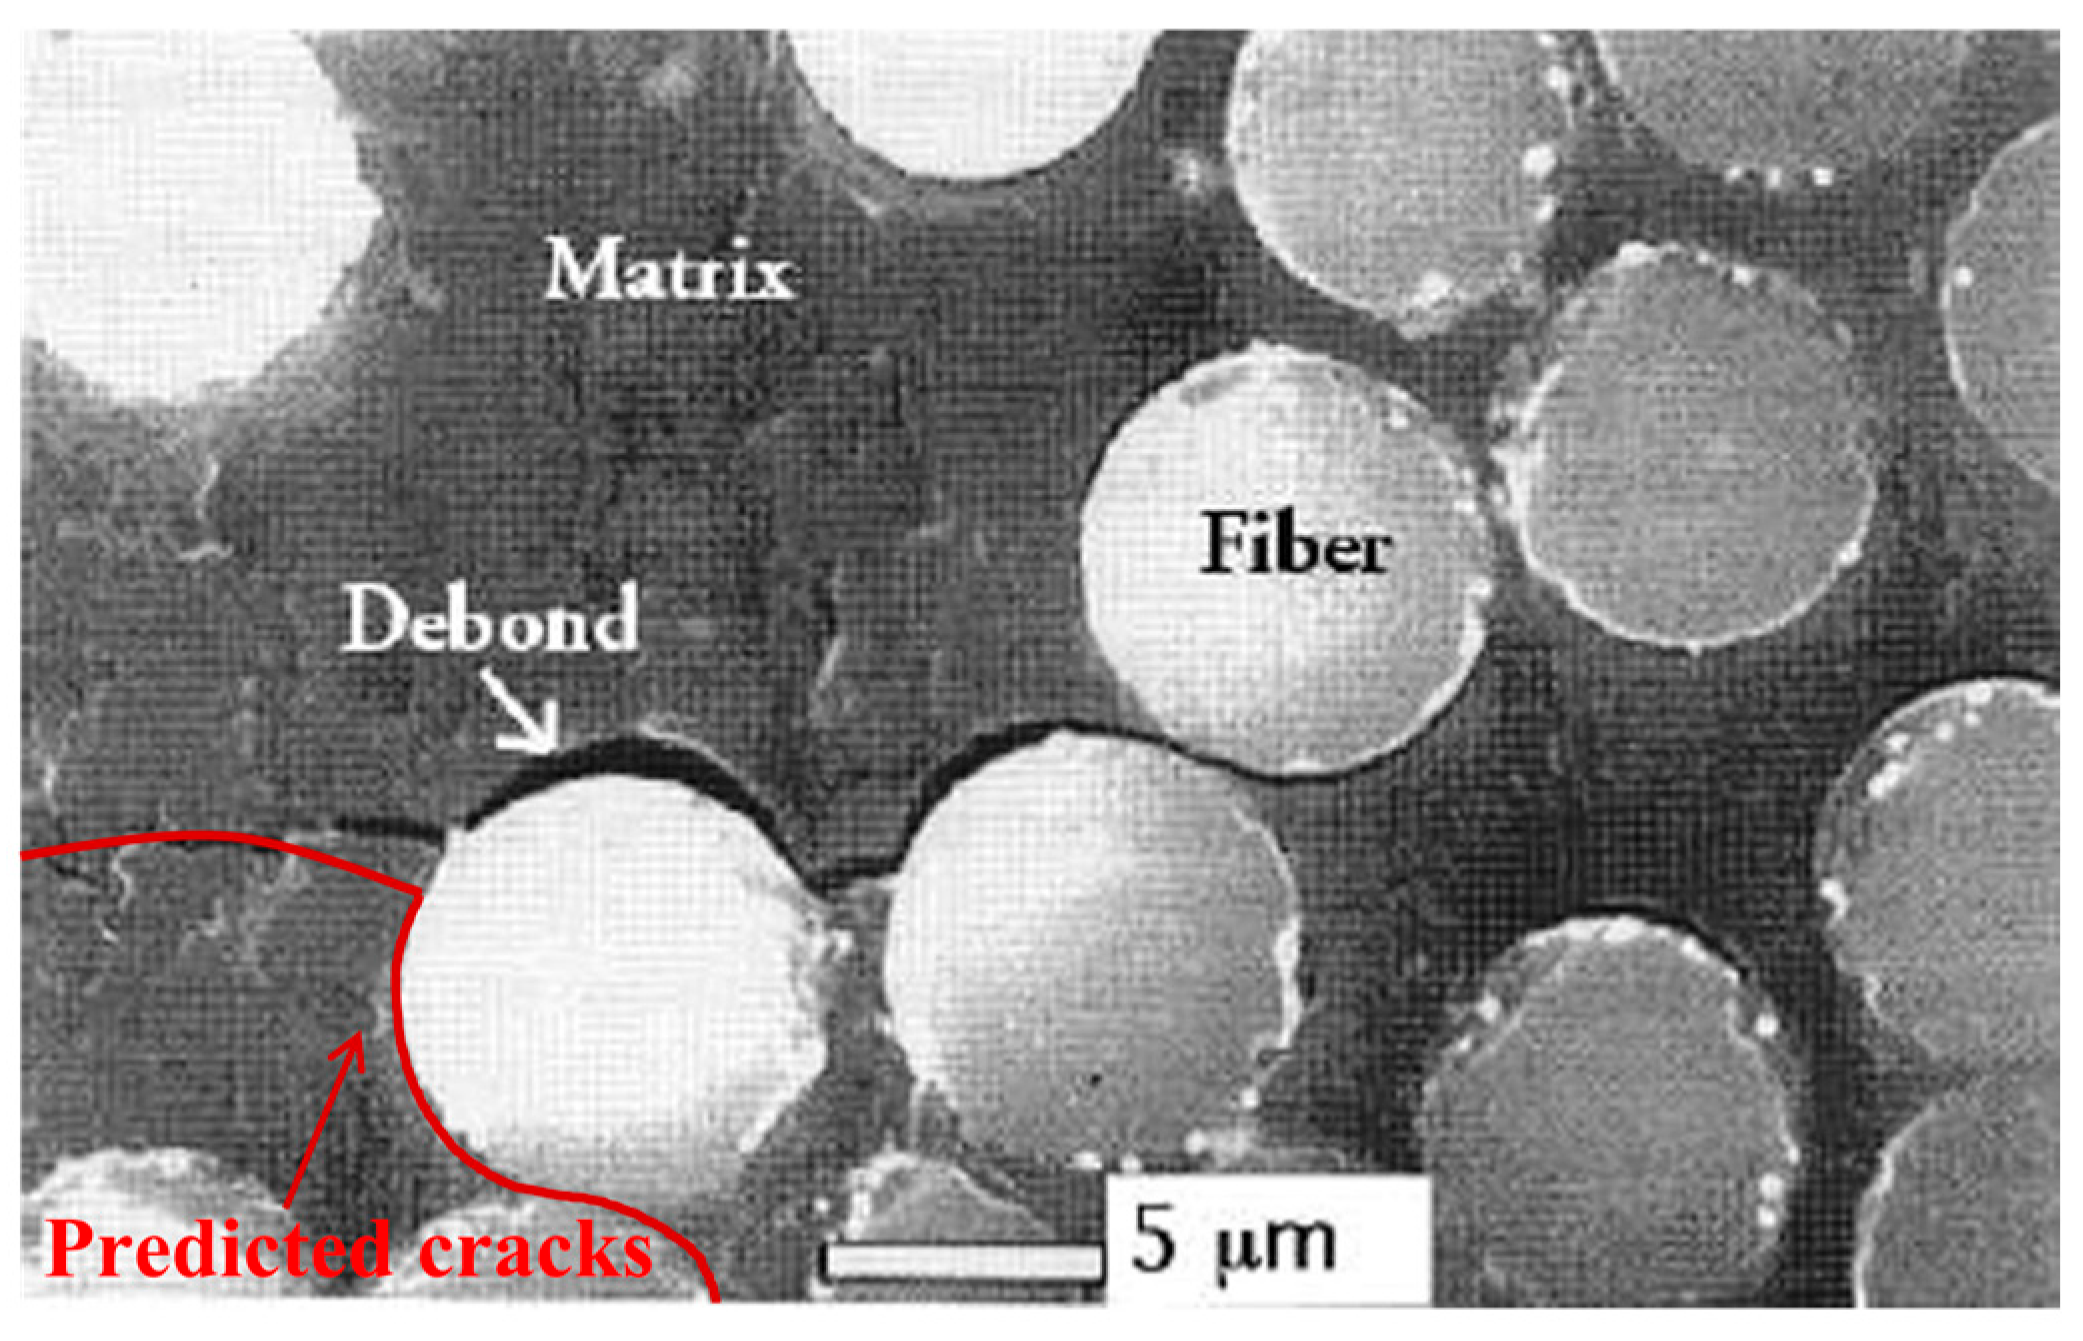
However, attempting to address these discrepancies using finer mesh resolution—ensuring the phase field characteristic length l i exceeds five times the minimum mesh size—the number of elements between fibers becomes computationally prohibitive. More critically, the conventional smearing method remains fundamentally incapable of describing the effects of different interface thicknesses. This limitation becomes particularly evident in scenarios such as that shown in Figure 5 [56], where actual crack propagation paths deviate significantly from those predicted by conventional smearing method. Notably, cracks do not necessarily initiate between closely spaced fibers, contradicting the predictions made by the conventional approach. These discrepancies highlight the urgent need for an improved smearing formulation that can simultaneously account for non-uniform interface thicknesses and a complete set of interfacial material properties, thereby enabling more accurate and physically meaningful predictions of failure in composite materials.

3. A Novel Unified Framework for Smeared Interface Modeling in Phase-Field Model of Microscopic Fracture

3.1. A Novel Interfacial Material Transition Function

Currently, in phase-field modeling of fracture in composite materials with varying interfacial thicknesses, a common approach is to explicitly define the interfacial regions within the structure by directly drawing them based on their actual geometry [43,44,45]. This allows for the investigation of how interface thickness affects the overall structural behavior. While such a method is feasible for structures containing a single fiber or a small number of fibers with regular geometries, it becomes impractical for microstructures containing multiple fibers with irregular shapes and varying interface thicknesses. In such cases, explicitly modeling each interface leads to excessive preprocessing complexity and computational cost. On the other hand, the conventional smearing method has notable limitations—such as its inability to capture spatial variations in interface thickness or to incorporate realistic interfacial material properties—it still offers certain advantages. In particular, it simplifies the modeling process by avoiding the need for explicit interface representation or complex domain partitioning [46,47,48]. This makes it highly effective in scenarios where the interface is extremely thin and its mechanical influence can be neglected. Nevertheless, when the interface thickness becomes non-negligible and varies across fibers, the limitations of the conventional approach become pronounced.
To overcome these limitations, we propose a novel interfacial transition function that retains the advantages of the conventional smearing method while extending its applicability to cases involving different interface thicknesses. This new function enables a more flexible and accurate representation of the interface in complex composite microstructures. The proposed transition function is defined as follows:
h new η = 1 η n 1 η n + e k ( η η i )
where n and k are shape-controlling parameters that adjust the profile of the transition function. η i is the specified interface phase value, which plays a critical role in controlling the effective thickness of the interface, and is defined as
η i = e x i l i
where x i is the specified thickness of the interface in the problem to be calculated and its unit is consistent with that of l i .
To evaluate the performance of the proposed interfacial transition function, we consider a one-dimensional bar with a total length of L = 20   mm , as illustrated in Figure 3. The interface region is assumed to have a thickness of 4   mm , with the remaining 8   mm on either side representing the fiber and matrix regions, respectively. For analysis, we focus on the right half of the bar, which includes the matrix and half of the interface region, as shown in Figure 6.
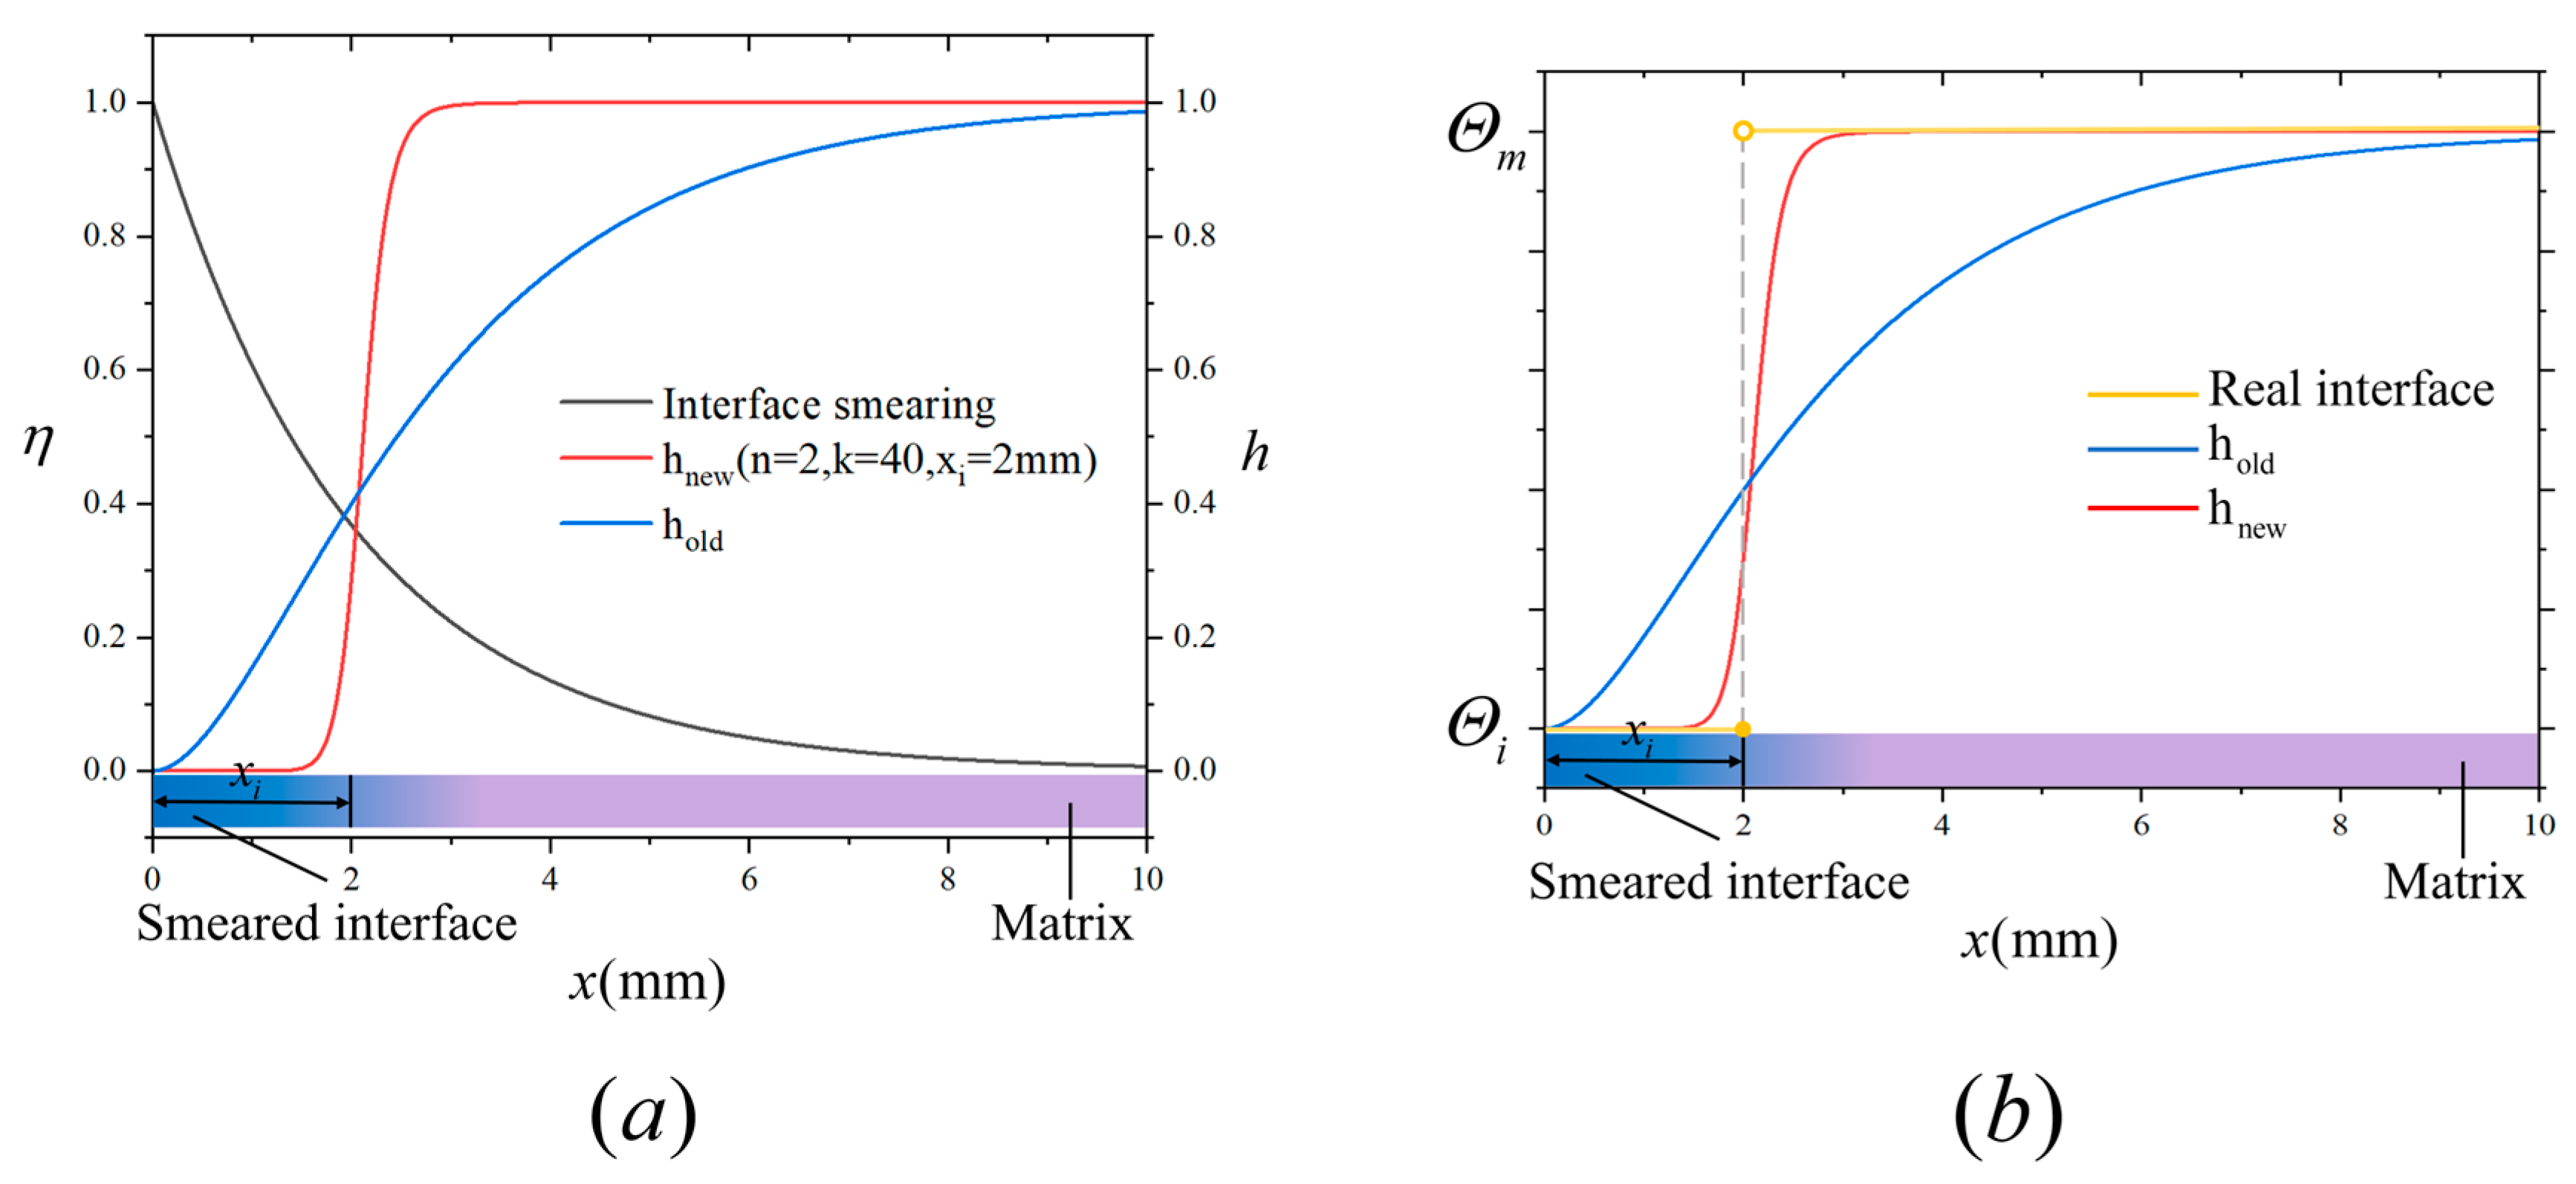
A smearing width of l i = 2   mm is selected, and the resulting distribution of the interfacial phase-field value over the right half of the bar is shown as the black curve in Figure 6a (the left vertical axis). Using this interfacial phase-field value, material properties are smeared across the same region using two different approaches: Equation (16) is shown as the blue curve in Figure 6a (the right vertical axis), representing the conventional transition function (denoted as h old ), and Equation (19) is shown as the red curve in Figure 6a (the right vertical axis), representing the proposed transition function (denoted as h new ), with parameters n = 2 , k = 40 and x i = 2   mm (half of the interface thickness). The corresponding material property distributions are shown in Figure 6b as the blue and red curves, respectively. The yellow curve represents the distribution of material properties under the real interface. As observed in Figure 6b, the proposed transition function yields a distribution that not only incorporates interface thickness but also more closely approximates the real variation in material properties. This demonstrates the improved accuracy and flexibility of the proposed approach compared to conventional methods.
To further investigate the influence of individual parameters on the shape of the transition function, we continue analyzing the same problem described above with l i = 2   mm . Using the interfacial phase field distribution obtained earlier, we substitute it into Equation (19) and explore the sensitivity of the function to its three key parameters— n , k and x i —by varying one parameter while keeping the other two fixed. The resulting transition function profiles are shown in Figure 7.
In Figure 7a, we fix n = 2 and x i = 1.5   mm , and vary k from 1 to 30. This corresponds to an interface thickness of 1.5   mm . As k increases, the transition function becomes increasingly steep, approaching a step-like change, which better approximates the real material transition.
In Figure 7b, we fix k = 40 and x i = 1.5   mm , and vary n from 1 to 10. It is observed that increasing n has little effect on the slope of the transition but extends the region where the function value remains near zero. In other words, increasing n effectively shifts the curve to the right without significantly altering its steepness.
In Figure 7c, we fix n = 2 and k = 40 , and vary x i from 0.5   mm to 2.5   mm . This corresponds to studying five different interface thicknesses. As x i increases, the slope of the transition region decreases, resulting in a smoother material transition. This effect becomes particularly pronounced when x i > l i , as in the case of x i = 2.5   mm . Based on these observations, it is recommended that the internal length scale of interfacial phase field l i be chosen to be at least twice the interfacial thickness x i , to ensure the smeared property distribution accurately reflects the physical material transition.
As discussed in Section 2, when the interface is extremely thin (rendering elastic modulus and Poisson’s ratio of the interfacial material unmeasurable) or when the interface thickness is much smaller than the fiber diameter and the inter-fiber spacing, the conventional method remains a reliable and efficient modeling strategy. To establish consistency between the proposed transition function ( h new ) and the conventional one ( h old ) under these assumptions, we perform a parameter fitting procedure involving the three key variables in h new : n , k and x i . Specifically, we constrain the fitting to the interval 0 < x < 5 l i , and enforce that h new and h old are exactly equal at the endpoints x = 0 and x = 5 l i .
h old 0 = h new 0 ; θ h old 5 l i = h new 5 l i ; θ θ = n , k , x i
Within this domain, we minimize the mean squared error (MSE) between the two functions, as defined in Equation (22).
min θ   E θ = 1 N j = 1 N h old x j h new x j ; θ 2 θ = n , k , x i
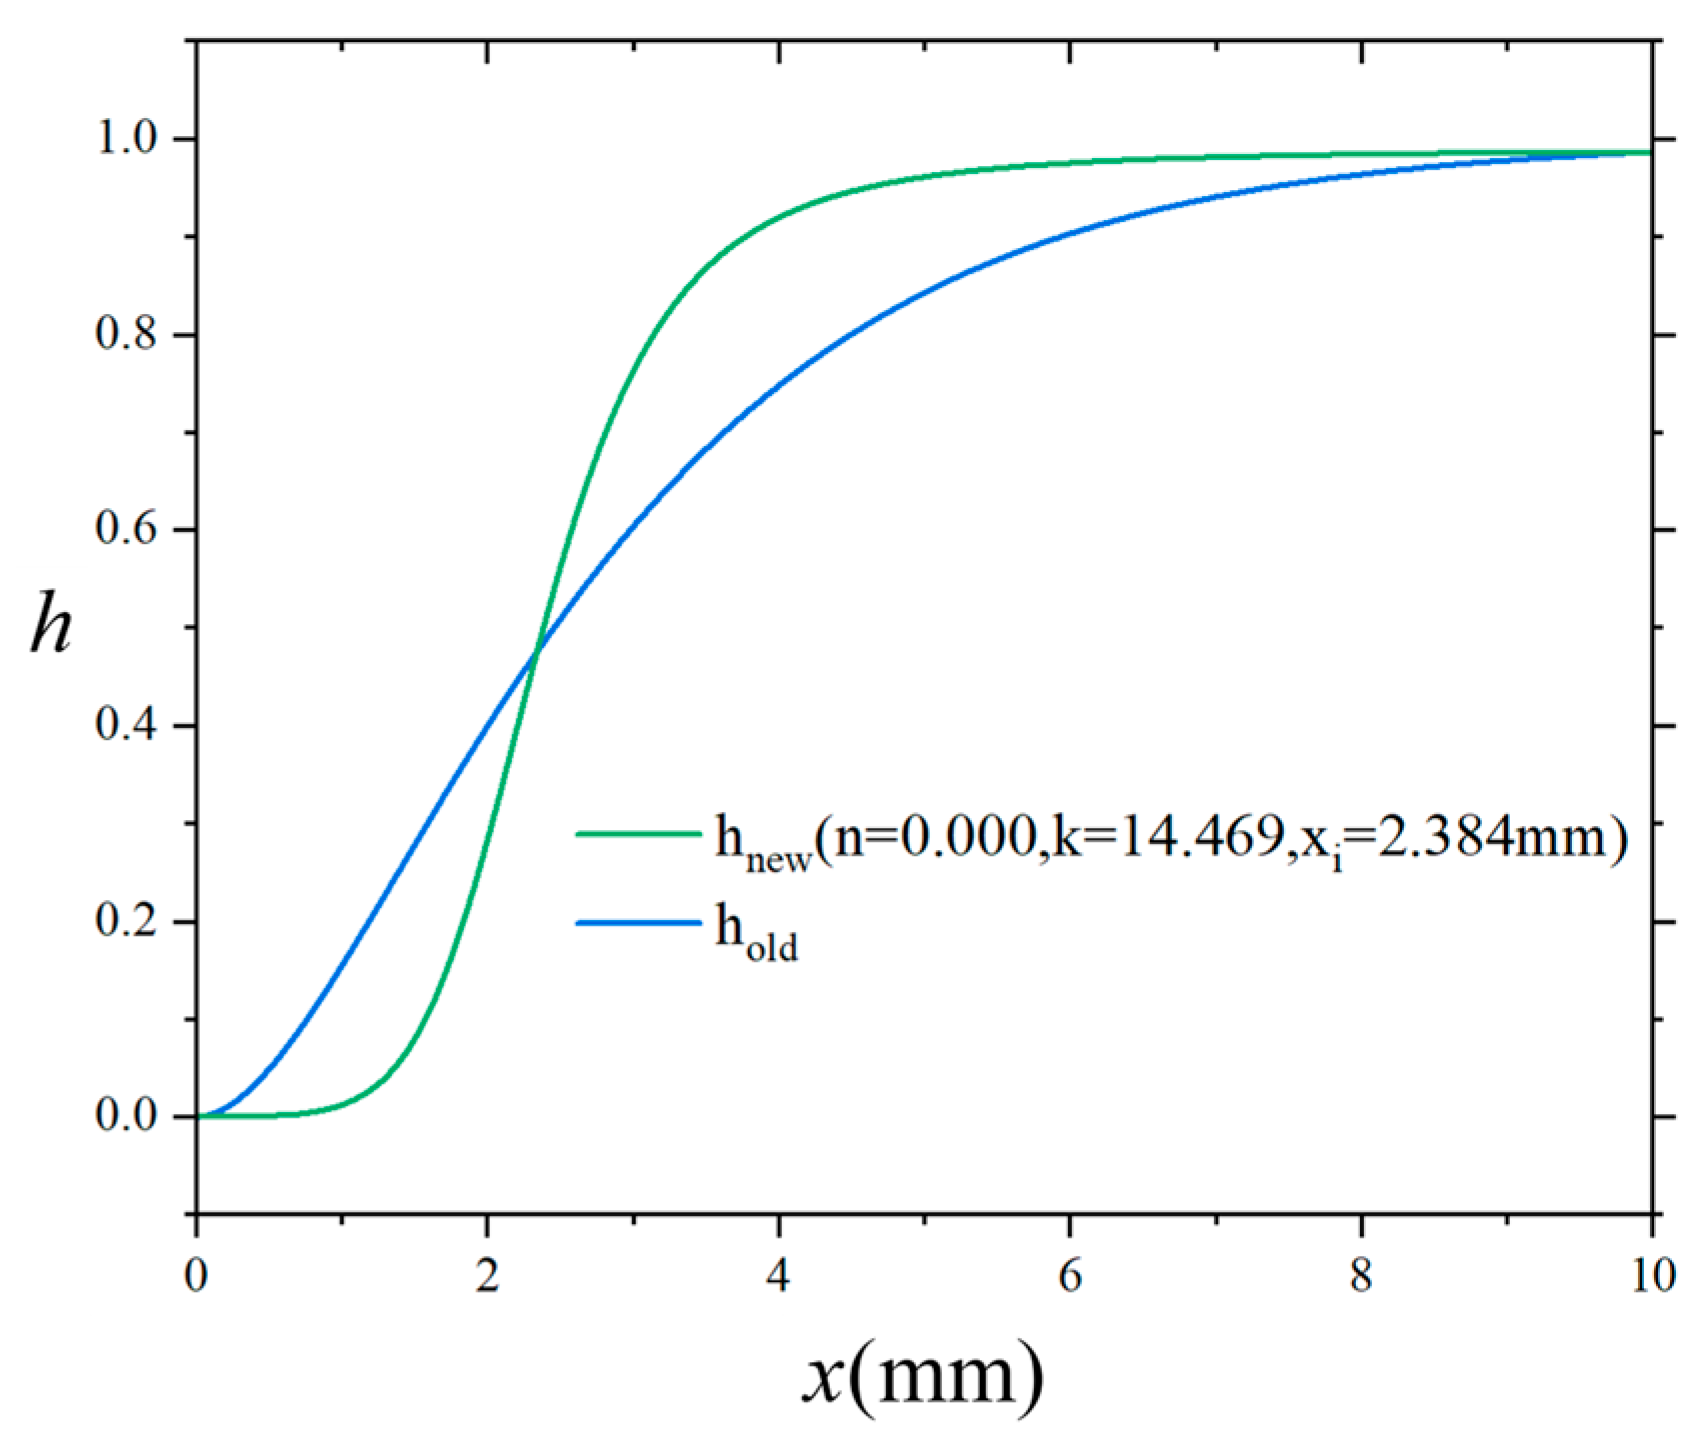
For example, when l i = 2   mm , the optimal fitting yields n = 0.000 , k = 14.469 and x i = 2.384   mm . The resulting comparison of the two functions is shown in Figure 8. Additionally, Table 2 summarizes the fitted values of n , k and x i for several representative values of l i . The effectiveness of this fitted h new function in replicating the behavior of the original h old function will be further examined through numerical simulations in Section 4.
Thus, the proposed transition function is capable of addressing two distinct scenarios: Case I, where the fiber–matrix interface is extremely thin and can be considered negligible, and Case II, where varying interface thicknesses significantly affect the structural response. Accordingly, Equation (15) can be reformulated as follows:
Θ s η =     Θ i 1 h new η + Θ m h new η x x *     Θ i 1 h new η + Θ f h new η   x < x * Θ = G c , σ max Case   I E , v , G c , σ max Case   II

3.2. Correction of Interface Energy Release Rate

When the interface debonding process has completed, the energy dissipated per unit area W i must align with the critical energy release rate of the interface G i ,
W i = G i
In Figure 3a, the discrete representation of the interface allows for the direct fulfillment of this requirement. When the interface is regularized by a crack phase field as shown in Figure 3b, and assume a crack represented by d takes place at the interface, the dissipated energy can be calculated using the following equation
W i = ς ς G s η 1 c 0 α d l 0 + l 0 d 2 d V
where ς represents the half bandwidth of the crack phase field. The conservation of fracture energy leads to the following relationship
G i = ς ς G s η 1 c 0 α d l 0 + l 0 d 2 d V
Within this equation, the integrand is a result of the multiplication between the equivalent property G s and the surface density functional. The integration of the latter corresponds to the area of the crack surface. Notably, for the current investigation, the equivalent critical energy release rate G s is not a fixed value. instead, it can be determined using Equation (23) as presented by
G s η =     G i 1 h η + G m h η   x x *     G i 1 h η + G i h η       x < x *
When G m > G i and G f > G i , we have G s > G i , thereby
ς ς G s η 1 c 0 α d l 0 + l 0 d 2 d V > ς ς G i η 1 c 0 α d l 0 + l 0 d 2 d V = G i
It is evident from the above inequality that incorporating Equation (15) directly into the interface dispersion equation fails to uphold the equivalence condition of fracture energy. Similarly, the equivalent condition may not be satisfied when G m G i and G f G i . Therefore, a generalized interface critical energy release rate G ¯ i is introduced here to replace the real energy release rate on the interface, forcing the value of Equation (24) to meet the interface fracture energy equivalence.
G i = ς x * G ¯ i 1 h η + G m h η 1 c 0 α d l 0 + l 0 d 2 d V + x * ς G ¯ i 1 h η + G f h η 1 c 0 α d l 0 + l 0 d 2 d V
The generalized interface critical energy release rate G ¯ i is obtained [46,48,57],
G ¯ i = G i G m ς x * h η   1 c 0 α d l 0 + l 0 d 2 d V G f x * ς h η   1 c 0 α d l 0 + l 0 d 2 d V ς ς 1 h η 1 c 0 α d l 0 + l 0 d 2   d V
This equation can be solved numerically in practice.

3.3. Finite Element Formulation

The finite element method is employed to discretize the interface phase field, the fracture phase field and the displacement field, as expressed in Equation (31).
η = N η η e                   d = N d d e                   u   =   N u u e
where N η , N d and N u represent standard shape function matrices for the interface phase field, the fracture phase field and the displacement field, respectively. The vectors η e , d e and u e correspond to the nodal interface phase field, the nodal fracture phase field and the nodal displacement of an element. The gradient of the interface phase field η , the gradient of the fracture phase field d , the strain vector ε are defined as follows:
η = B η η e             d = B d d e             ε   =   B u u e
where the matrix B η , B d and B u are the derivatives of the shape function matrices. Their forms can be obtained through the conventional manner, thus not listed here for simplicity. The corresponding residual vector of the interface phase field, the fracture phase field and the displacement field can be expressed by:
R η = e Ω e η e l i 2 N η T d V + Ω e B η T B η η e d V
R d = e Ω e ω d H N d T d V + Ω e G c c 0 α d l 0 N d T + 2 l 0 B d T B d d e d V
R u = e Ω e N u T f d V + Ω t e N u T t d S Ω e ω d B u T D B u u e d V
where Σ e represents element assembly, D are the stiffness matrix. The tangential stiffness matrices at the l th increment step can be expressed by
K l η = e Ω e 1 l i 2 N η T d V + Ω e B η T B η d V
K l d d = e Ω e ω d H N d T N d d V + Ω e G c c 0 α d l 0 N d T N d + 2 l 0 B d T B d d V
K l u u = e Ω e ω d B u T D l e B u d V
K l u d = K l d u = 0
where D l e is the stiffness matrix of the element at the l th increment step describing the relationship between stress and total strain. In a certain incremental step, the iteration scheme of the interface phase filed can be written as
η l + 1 = η l K l η 1 R η l
The iteration scheme of the fracture phase filed and the displacement field coupling can be written as
u d l + 1 = u d l K l u u K l d d 1 R u R d l
In the present method, we have an equivalent staggered iteration form. And we assume a hybrid formulation proposed by Ambati to calculate and degrade the displacement field, which not only guarantees the same result as the original formulation, but also delivers a saving in computational cost of about one order of magnitude [40].

4. Verification

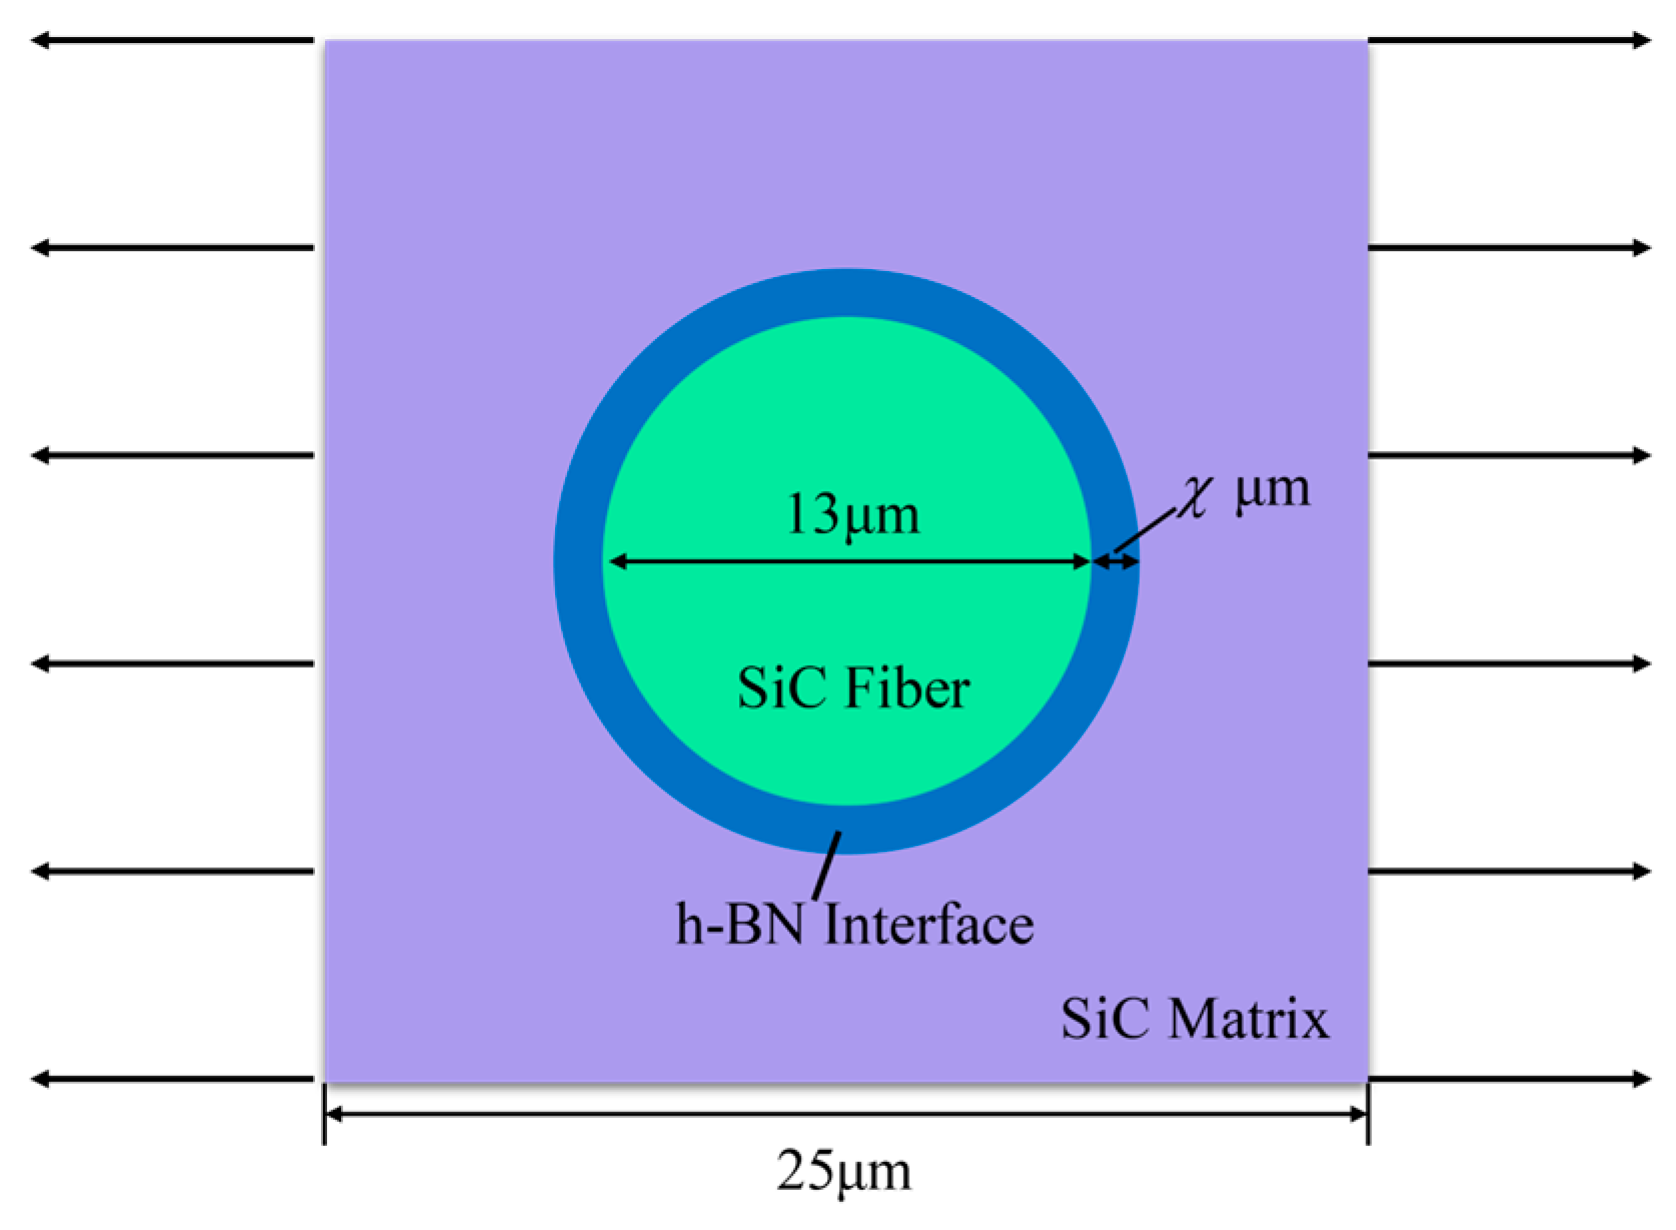
To validate the proposed unified framework for smeared interface modeling, this section considers a representative volume element (RVE) of a single-fiber SiCf/SiCm composite with an h-BN interface subjected to transverse tensile loading, as illustrated in Figure 9. The typical material properties of the SiCf/SiCm composite constituents, including the h-BN interface, are listed in Table 3 [43,58]. Following the assumptions made in [43], all materials are treated as isotropic for modeling purposes. Although h-BN is intrinsically an anisotropic layered material, exhibiting distinct mechanical properties in the transverse and longitudinal directions (as reported in Table 3), it is modeled here as isotropic using its transverse mechanical properties. This simplification is justified by the relatively thin interface and the application of transverse tensile loading in this case. The RVE model has dimensions of 25   μ m × 25   μ m , with a fiber diameter of 13   μ m , consistent with commonly reported values. The thickness of the h-BN interface is varied systematically across five cases: 0.1   μ m , 0.25   μ m , 0.5   μ m , 0.75   μ m , and 1   μ m . These configurations not only allow for quantitative evaluation of the proposed method’s accuracy in capturing the mechanical response across different interface thicknesses, but also it easier to understand how interface thickness affects the transverse tensile strength of the composite. Understanding this relationship is essential in the design and optimization of SiCf/SiCm composites, where the interface plays a critical role in damage initiation, crack deflection, and overall structural performance.
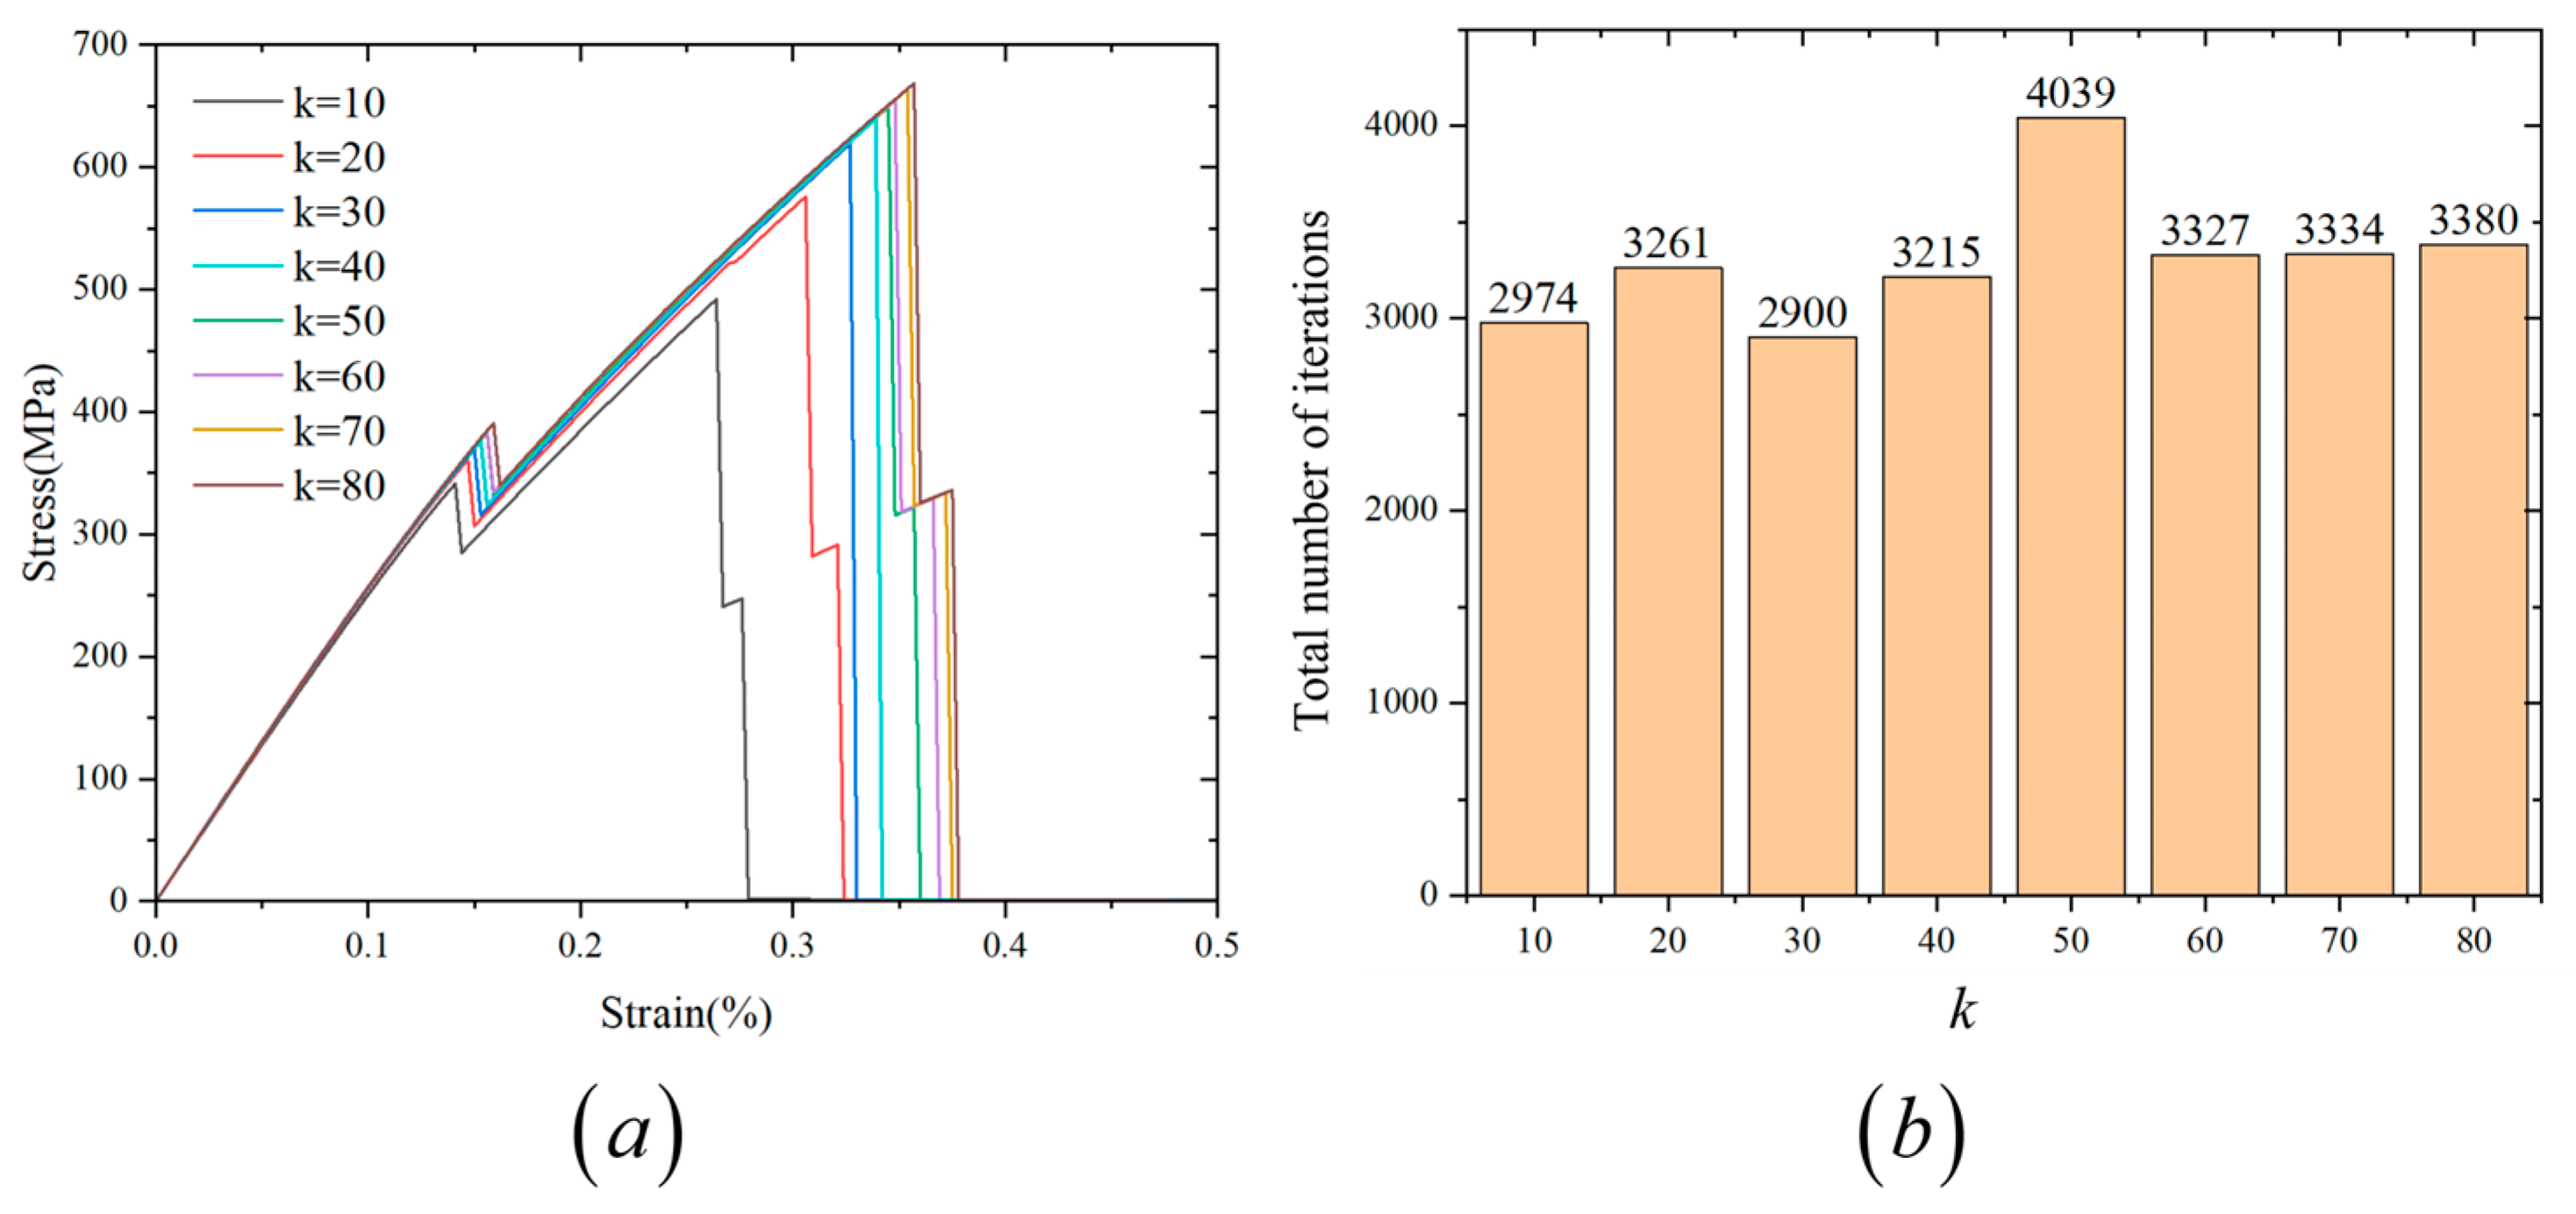
Before performing the simulations, it is necessary to determine appropriate values for the parameters of the proposed transition function. As established in Section 3.1, the shape of the proposed transition function is governed by three parameters: n , k and x i . Among these, x i corresponds directly to the physical thickness of the interface in the composite. To ensure numerical stability, x i must remain smaller than the internal length scale of interfacial phase field l i . Based on the parametric study shown in Figure 7b, the function is relatively insensitive to changes in n , and a value of n = 2 is found to provide sufficient smoothness and accuracy. However, the parameter k strongly influences the steepness of the transition function and, therefore, requires further investigation. To determine an appropriate value for k , we consider a test case with an interface thickness of x i = 0.5   μ m , while keeping n = 2 fixed. Use the internal length scale of interfacial phase field l i = 2   μ m to smear the interface. A series of simulations is conducted with k values ranging from 10 to 80 (specifically, k = 10 , 20 , 30 , 40 , 50 , 60 , 70 , 80 ). The resulting stress–strain curves are shown in Figure 10a. It is important to note that changes in k alter the steepness of the material transition, which in turn affects the convergence behavior during computation. To assess this, we record the total number of nonlinear iterations required under a fixed number of loading steps for each value of k . These results are plotted in Figure 10b. From Figure 10a, it is observed that the simulation results tend to converge as k increases. When k 60 , the stress–strain response becomes nearly unchanged, indicating numerical convergence. Meanwhile, Figure 10b shows that the total number of iterations stabilizes for k 60 . Therefore, to balance accuracy and computational efficiency, a value of k = 70 is selected for all subsequent simulations in this study. In summary, the transition function parameters used throughout this work are fixed as n = 2 and k = 70 , unless otherwise specified.
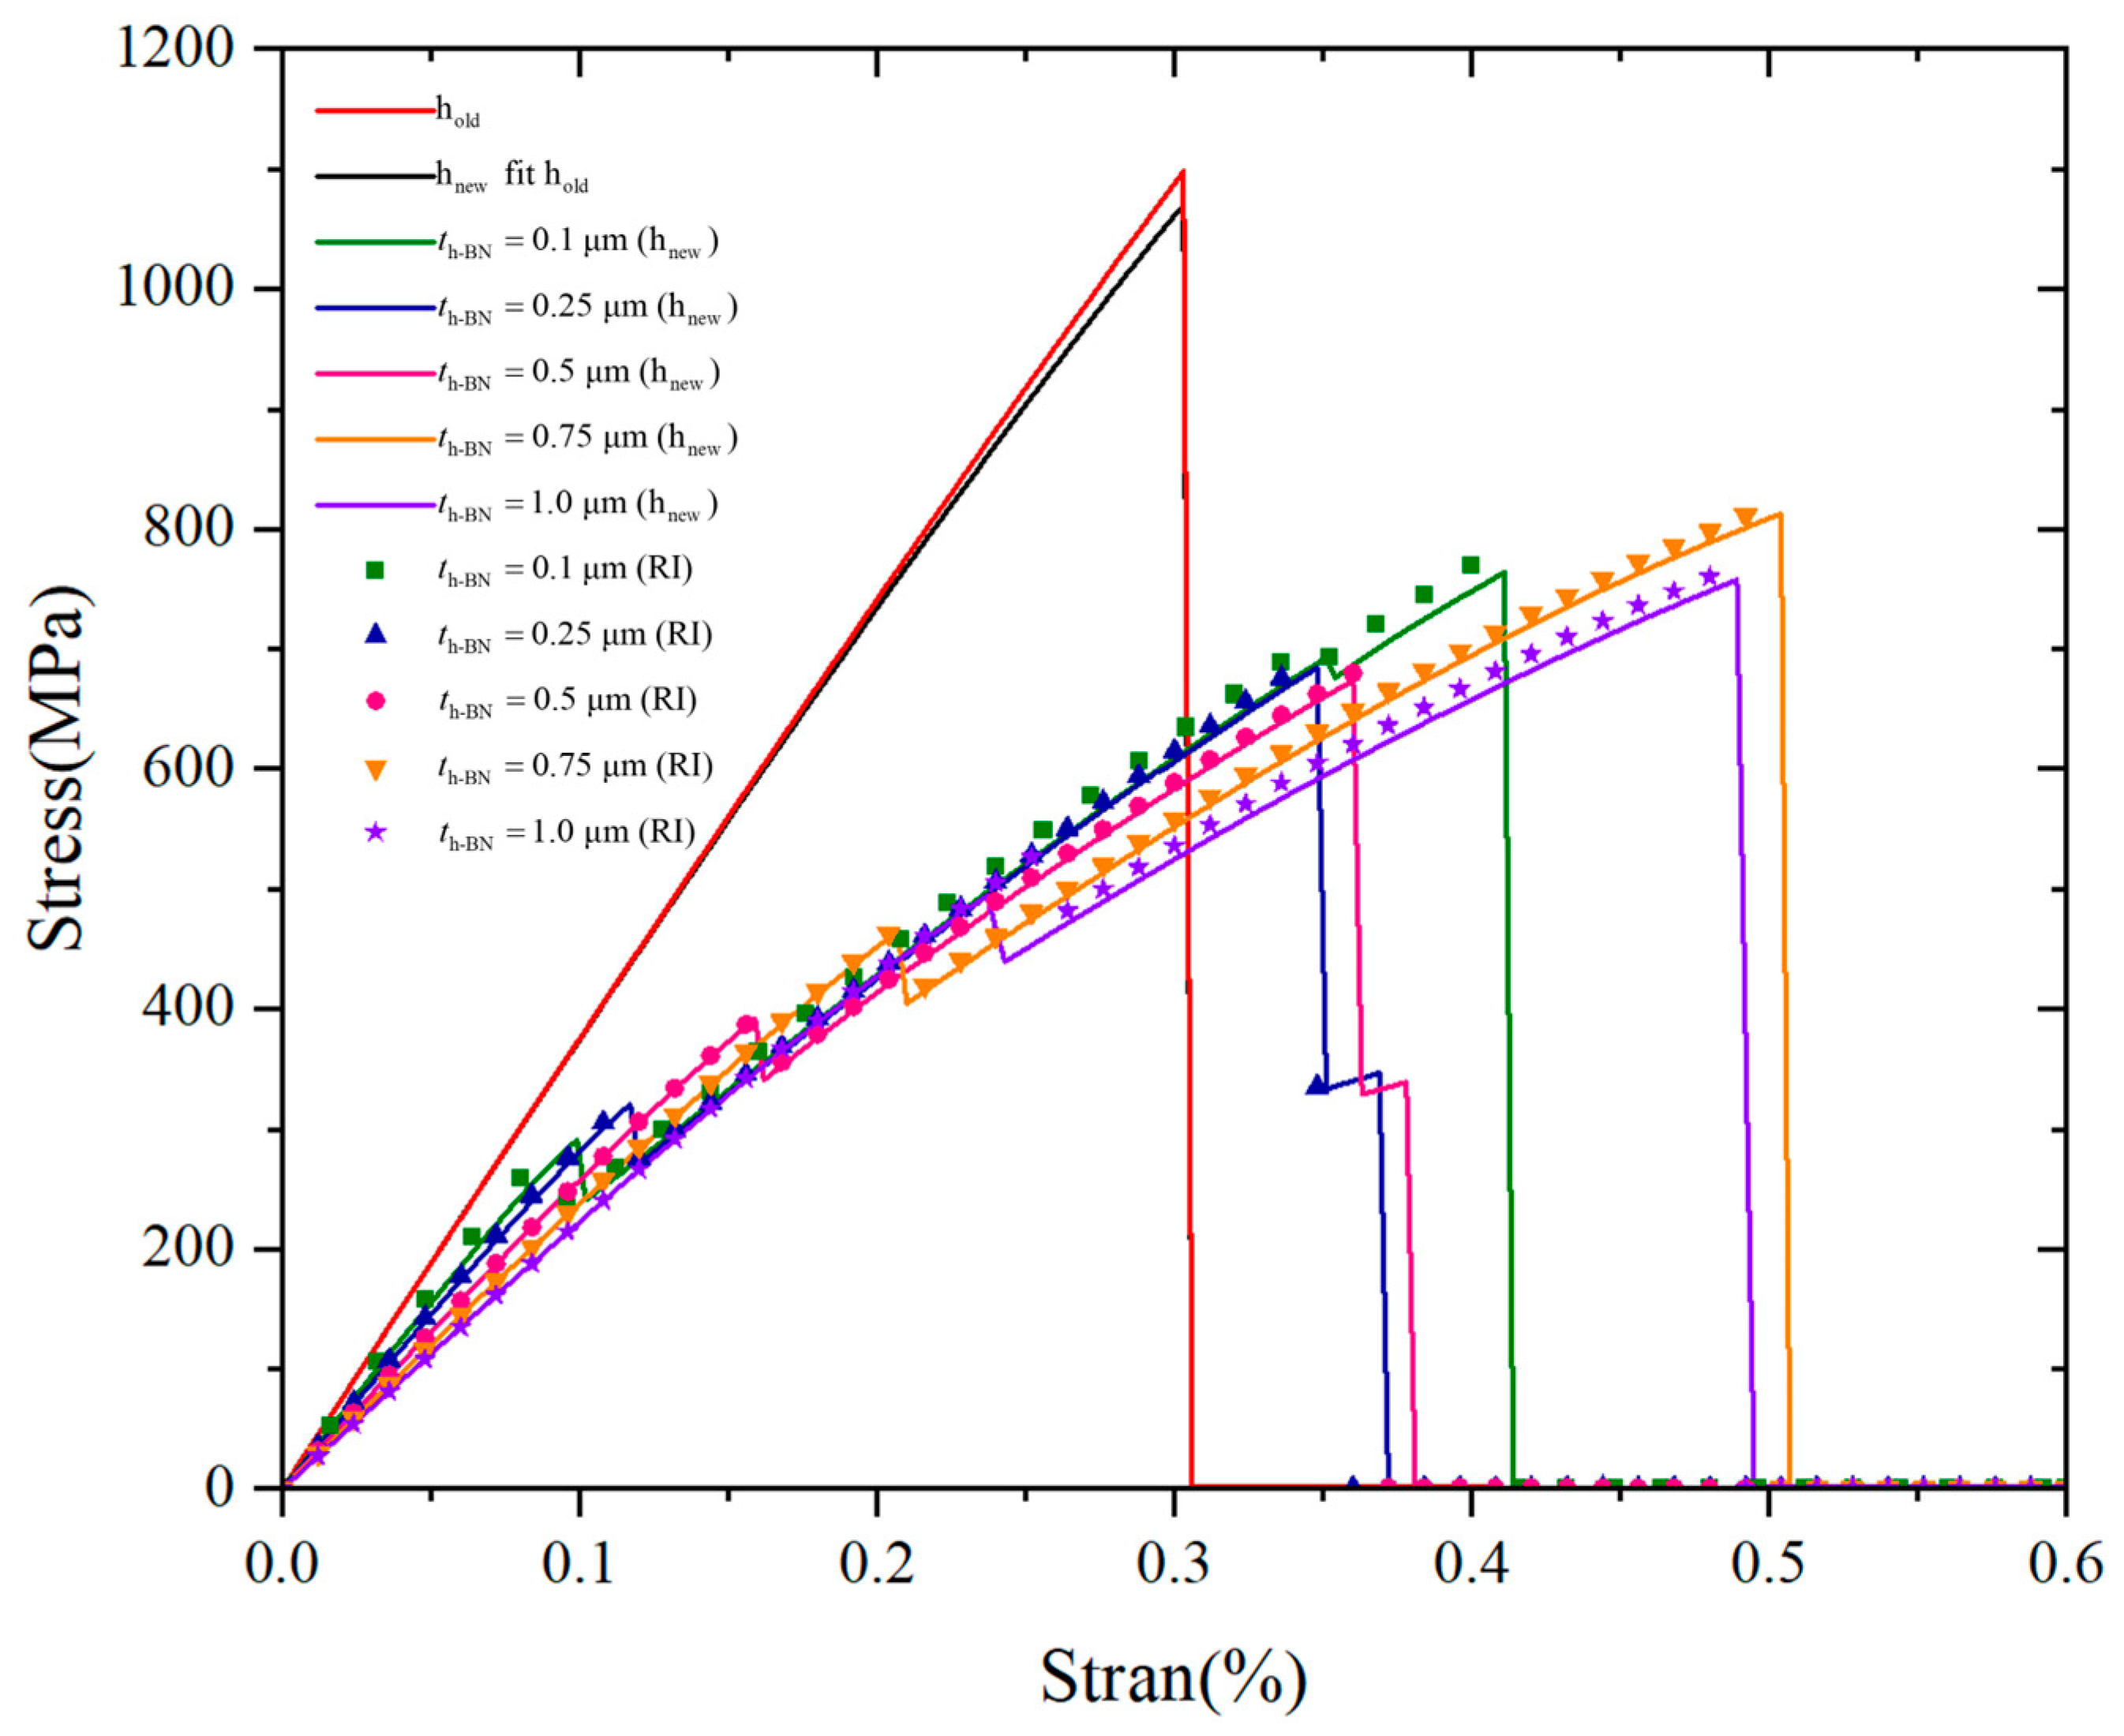
A series of simulations was performed to evaluate the performance and flexibility of the proposed interfacial transition function ( h new ) under varying interface thicknesses. The internal length scale of interfacial phase field was fixed at l i = 2   μ m , and the internal length scale of fracture phase field was set to l 0 = 0.06   μ m . For each case using h new , the parameter x i was set to 0.1   μ m , 0.25   μ m , 0.5   μ m , 0.75   μ m , and 1   μ m . To provide a reliable reference for accuracy assessment, a set of models was constructed in which the interface regions were explicitly defined in the geometry to reflect their real thickness. These models, referred to as RI (real interface), serve as the benchmark solution, as they directly represent the physical geometry and material interfaces of the system. For comparison, a second set of simulations was carried out using the traditional smearing approach ( h old ) described in Section 2.2. h old cannot capture the influence of varying interface thickness, and therefore produces only a single result. In addition, an auxiliary case was included where the parameters of h new were fitted to reproduce the result of h old under thin-interface conditions (specifically, at l i = 2   μ m described in Section 3.1). This case, denoted as h new fit h old . The predicted crack patterns obtained using the proposed interfacial transition function ( h new ) are shown in Figure 11. All simulations in this section are conducted using the AT2 phase field model, which is widely adopted in the literature as a baseline fracture formulation. The quadratic degradation function ensures smooth crack evolution and stable numerical implementation, making it a suitable choice for verification studies and for capturing general brittle fracture behavior. The elastic potential is decomposed into tensile and compressive components following the formulation given in Equation (5). The corresponding stress–strain curves for all simulated cases are presented in Figure 12.
The predicted stress–strain responses using h new are compared with those obtained from the real interface (RI) models, which serve as the benchmark for accuracy. As shown in Figure 12, the stress–strain curves generated by h new closely follow those of RI across all interface thicknesses. Although the peak strength in h new predictions is consistently slightly lower than that of RI , the overall curve shapes—such as stiffness, peak location, and post-peak behavior—show a high degree of consistency. This systematic underestimation is expected and can be attributed to the smoothing effect inherent in the smeared transition formulation, which effectively reduces local stress concentrations and leads to a slightly softened mechanical response. Nevertheless, the good agreement confirms that h new provides an accurate and reliable approximation of the mechanical behavior produced by more detailed geometric interface models. In terms of computational efficiency, the advantage of h new is significant. The RI approach, while accurate, requires a separate geometry and mesh for every interface thickness, which becomes impractical when calculating the microstructure of composite materials with a large number of fibers and interfaces. In contrast, h new achieves this flexibility within a single model and mesh by simply modifying the parameters n , k and x i . This greatly simplifies the simulation process, reduces pre-processing time, and makes parametric studies much more accessible.
When compared to the conventional smearing approach ( h old ), the benefits of h new become even more apparent. As shown in Figure 12, the h old curve significantly deviates from the benchmark in both slope and peak stress. Since h old assumes a zero-thickness interface, it cannot capture the transition in material properties, nor can it reflect the effects of finite interface geometry. This leads to poor approximation of both stiffness and strength. Furthermore, it offers no capacity for adjusting interface thickness, making it unsuitable for studies focused on interface design. The resulting curve of h new fit h old is almost identical to the original h old result, verifying that h new retains compatibility with h old in the appropriate limit. This reinforces the robustness and versatility of h new , as it is capable of covering both thin- and finite-thickness interface scenarios within a unified framework.
Beyond numerical accuracy, the simulations also reveal valuable insights into how interface thickness influences crack propagation and transverse strength. As shown in Figure 12, the maximum transverse tensile strength is observed when the interface thickness is 0.75   μ m . The corresponding crack patterns in Figure 11 show that, at this thickness, the crack deflects in the interface region before reaching the matrix region. This crack deflection increases the energy dissipation during fracture, delays complete failure, and results in higher load-bearing capacity. This behavior is characteristic of toughening mechanisms in ceramic matrix composites, where the presence of a soft interface allows cracks to deviate and spread rather than propagate straight to the matrix. When the interface is thick enough to enable significant stress redistribution but not so thick as to weaken the material excessively, it contributes positively to fracture resistance. In contrast, for thinner interfaces ( < 0.5   μ m ), the crack path shows little to no deflection, often propagating directly to the matrix. Although these cases still include interfacial material, the thickness is insufficient to trigger meaningful crack deviation. At the same time, the addition of a soft interfacial material reduces the overall stiffness and strength slightly compared to the zero-thickness case, which explains why the transverse strength is lower for very thin interfaces. Interestingly, although increasing the interface thickness beyond 0.75   μ m continues to support crack deflection, it eventually begins to reduce overall strength. At 1   μ m , the transverse strength declines slightly compared to 0.75   μ m , though it remains higher than the strength in the 0.1   μ m case. This suggests a trade-off: as the interface becomes too thick, its inherent softness begins to dominate, weakening the structural integrity more than it enhances toughness. Taken together, these results suggest that an optimal interface thickness exists, balancing two competing effects: (i) crack deflection and energy dissipation, which tend to increase strength, and (ii) stiffness reduction due to excessive interfacial softness, which tends to lower it. Based on our simulations, this optimal thickness falls into the range of 0.75   μ m   ,   1   μ m . Further refinement within this range may help identify the precise interface design that maximizes transverse strength and fracture resistance in SiCf/SiCm composites.

5. Validation

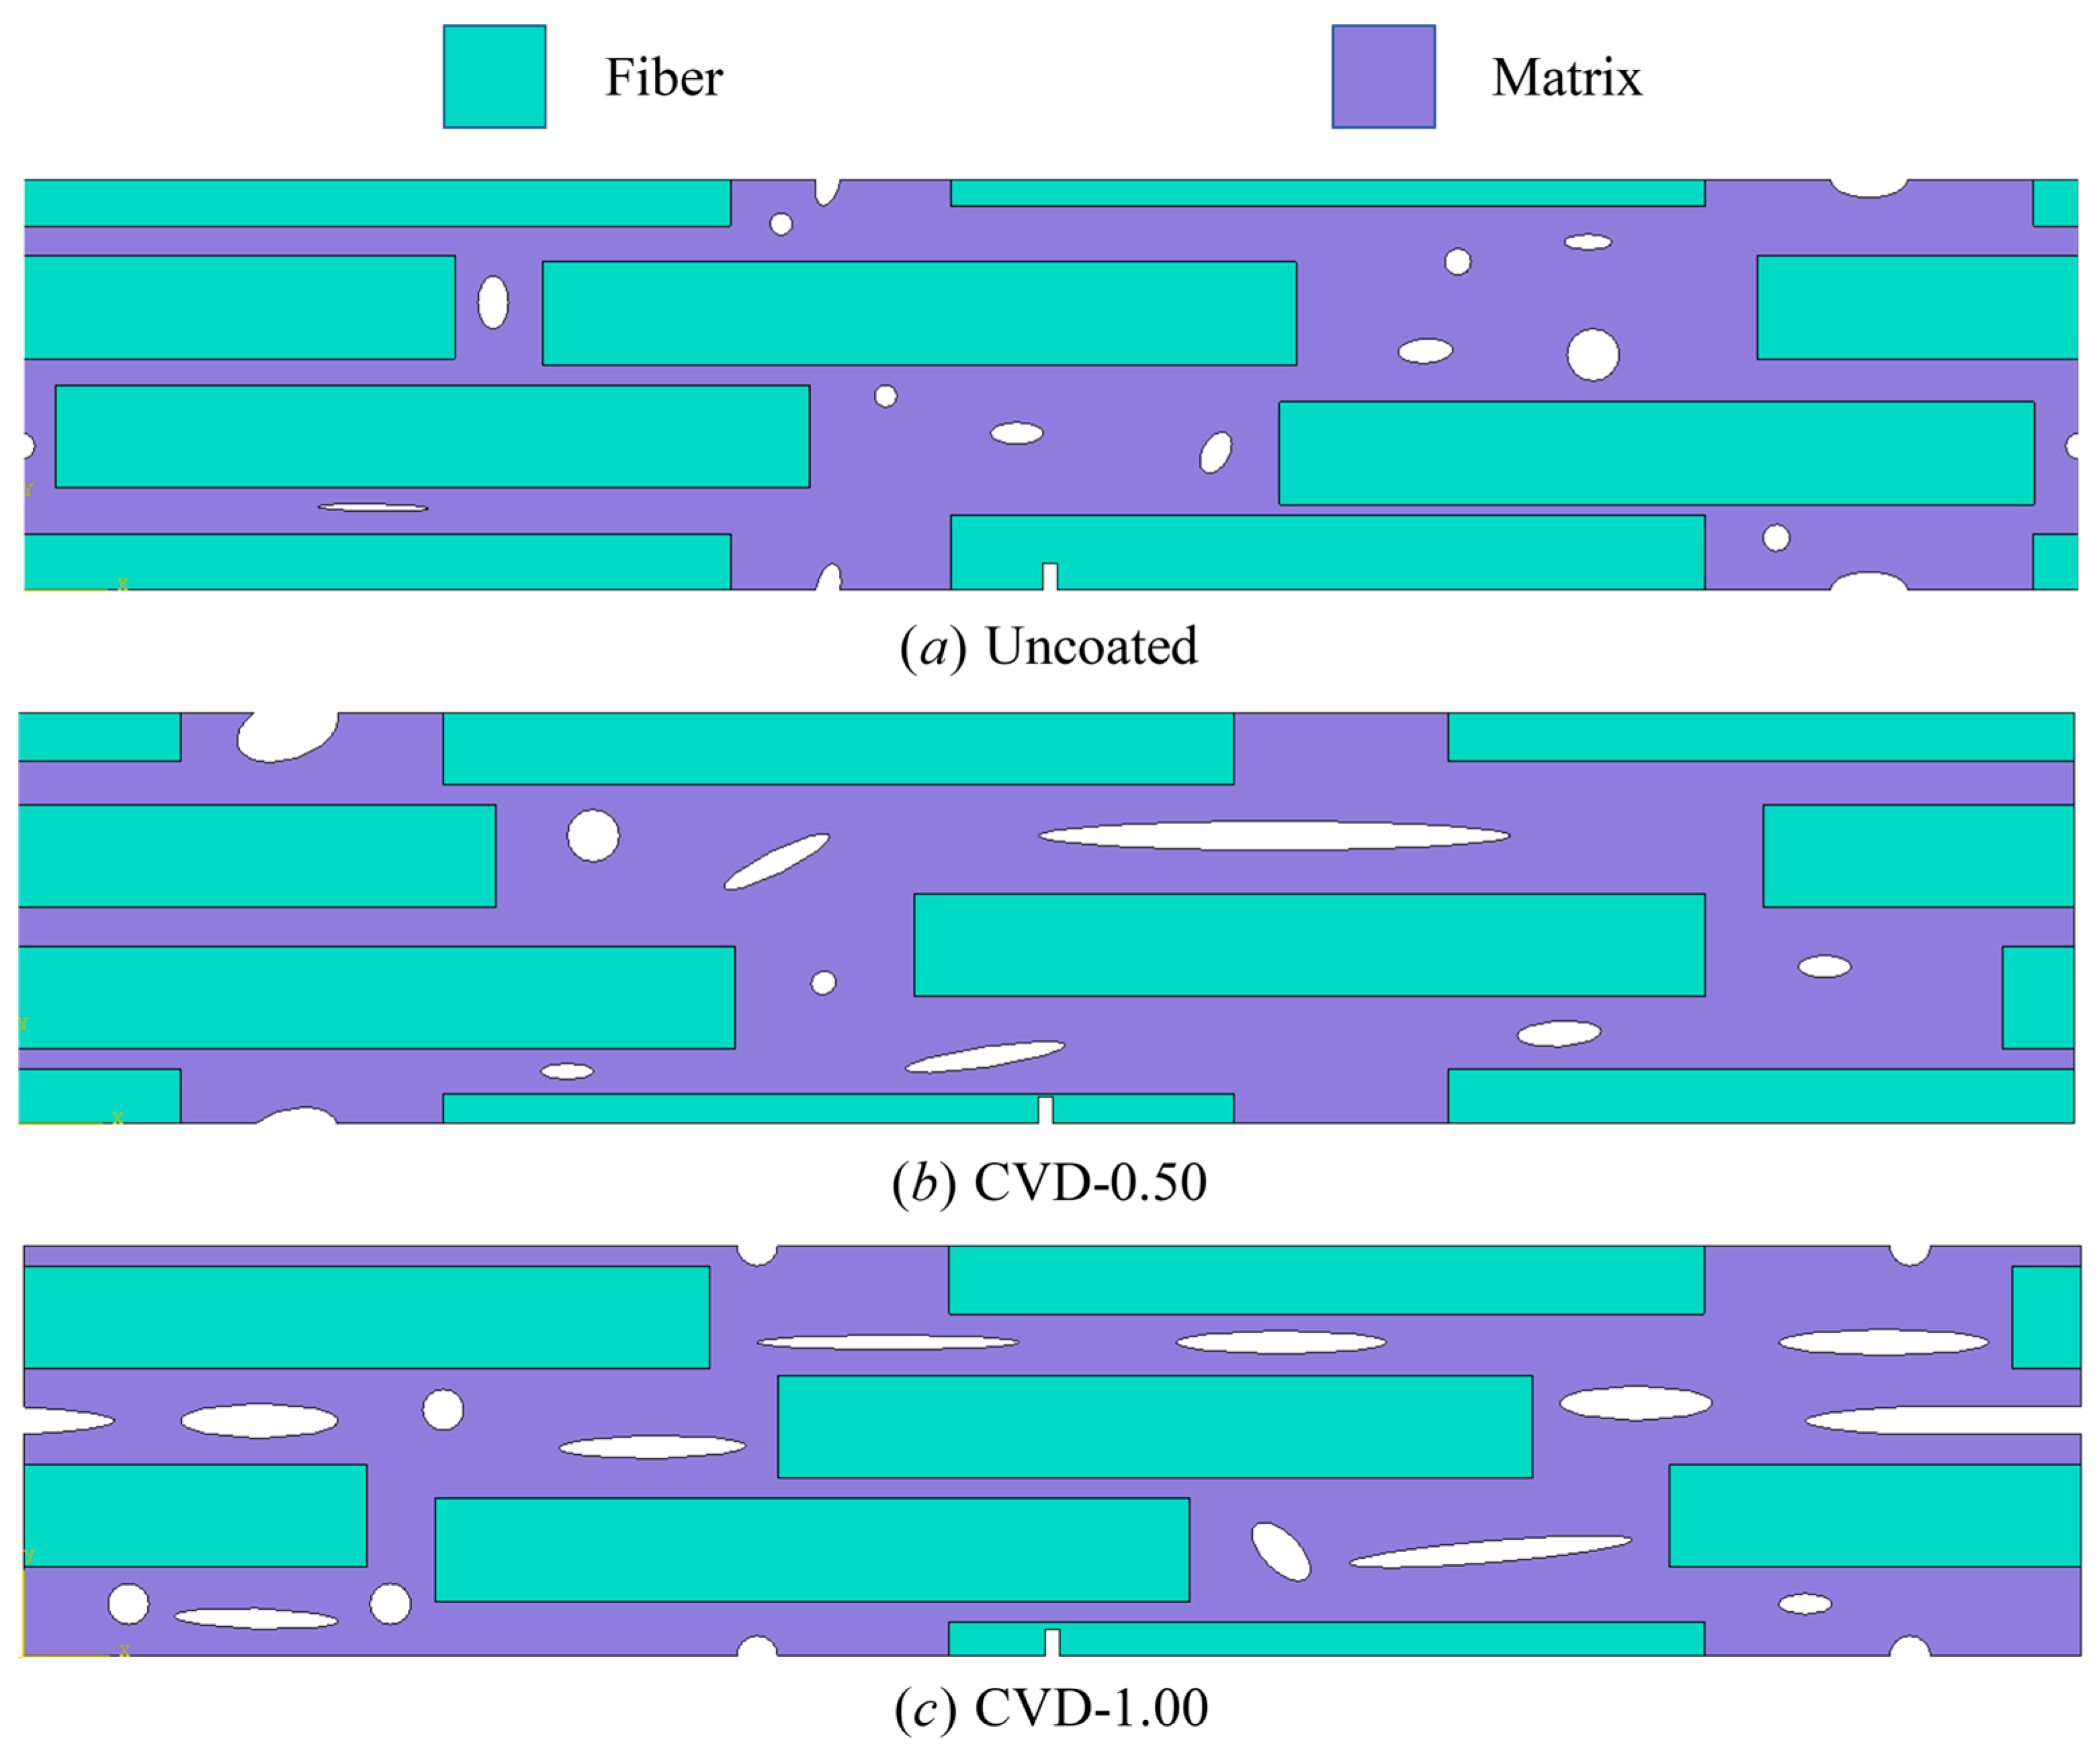
SiCf/SiCm composites offer excellent high-temperature performance and low neutron activation, making them ideal for advanced nuclear systems. However, their fracture toughness remains highly sensitive to the fiber–matrix interface properties. To address this and to optimize the balance between high flexural strength and pseudo-ductile fracture behavior, Shimoda et al. [59,60] investigated the influence of PyC interface thickness on the microstructure and mechanical properties of unidirectional SiCf/SiCm composites fabricated using the Nano-Infiltration and Transient Eutectic-phase (NITE) process. By precisely controlling the thickness of PyC layer via chemical vapor deposition (CVD) process, they produced composites with interfaces thicknesses of 0   μ m (Uncoated), 0.5   μ m (CVD-0.50), and 1   μ m (CVD-1.00), and systematically evaluated the resulting density, porosity, crack paths, and tensile strength. Figure 13 shows field emission scanning electron microscopy (FE-SEM) images of uncoated and PyC coated fibers formed with CVD coating technique. Most filaments in the tows through CVD were well coated, with the thickness of appropriately 0.5   μ m and 1   μ m , which respectively called CVD-0.50 and CVD-1.00. In the experimental study [59], the SiCf/SiCm composites were fabricated using unidirectional TyrannoTM-SA fibers as reinforcement, which have a diameter of approximately 7.5   μ m . The matrix was formed by nano-sized SiC powder densified through NITE process. The PyC interface between fiber and matrix was deposited by CVD process, with thicknesses precisely controlled at 0   μ m , 0.5   μ m and 1   μ m . The corresponding volume fractions of fibers and pores under each interface condition are listed in Table 4.
Inspired by their findings, we performed a set of phase field simulations to replicate these interface configurations and validate the proposed smeared interface transition model ( h new ). In [59], the three-point bending tests were performed using an INSTRON 5581 universal testing machine with rectangular bar specimens of dimensions 4.0   mm (width) × 25.0   mm (length) × 2.0   mm (thickness). A crosshead speed of 0.5   mm / min and an outer support span of 18.0   mm were applied, in accordance with standard three-point bending practice. Between three and five specimens were tested for each condition to ensure statistical reliability. The same mechanical loading configuration was adopted to evaluate the flexural strength. The specimen geometry was modeled with dimensions of 150   μ m × 30   μ m , as shown in Figure 14. Boundary and loading conditions followed the standard three-point bending layout. The stress–strain response was calculated using the conventional bending formula:
σ = 3 P l 2 w t 2 ε = 6 D t l 2
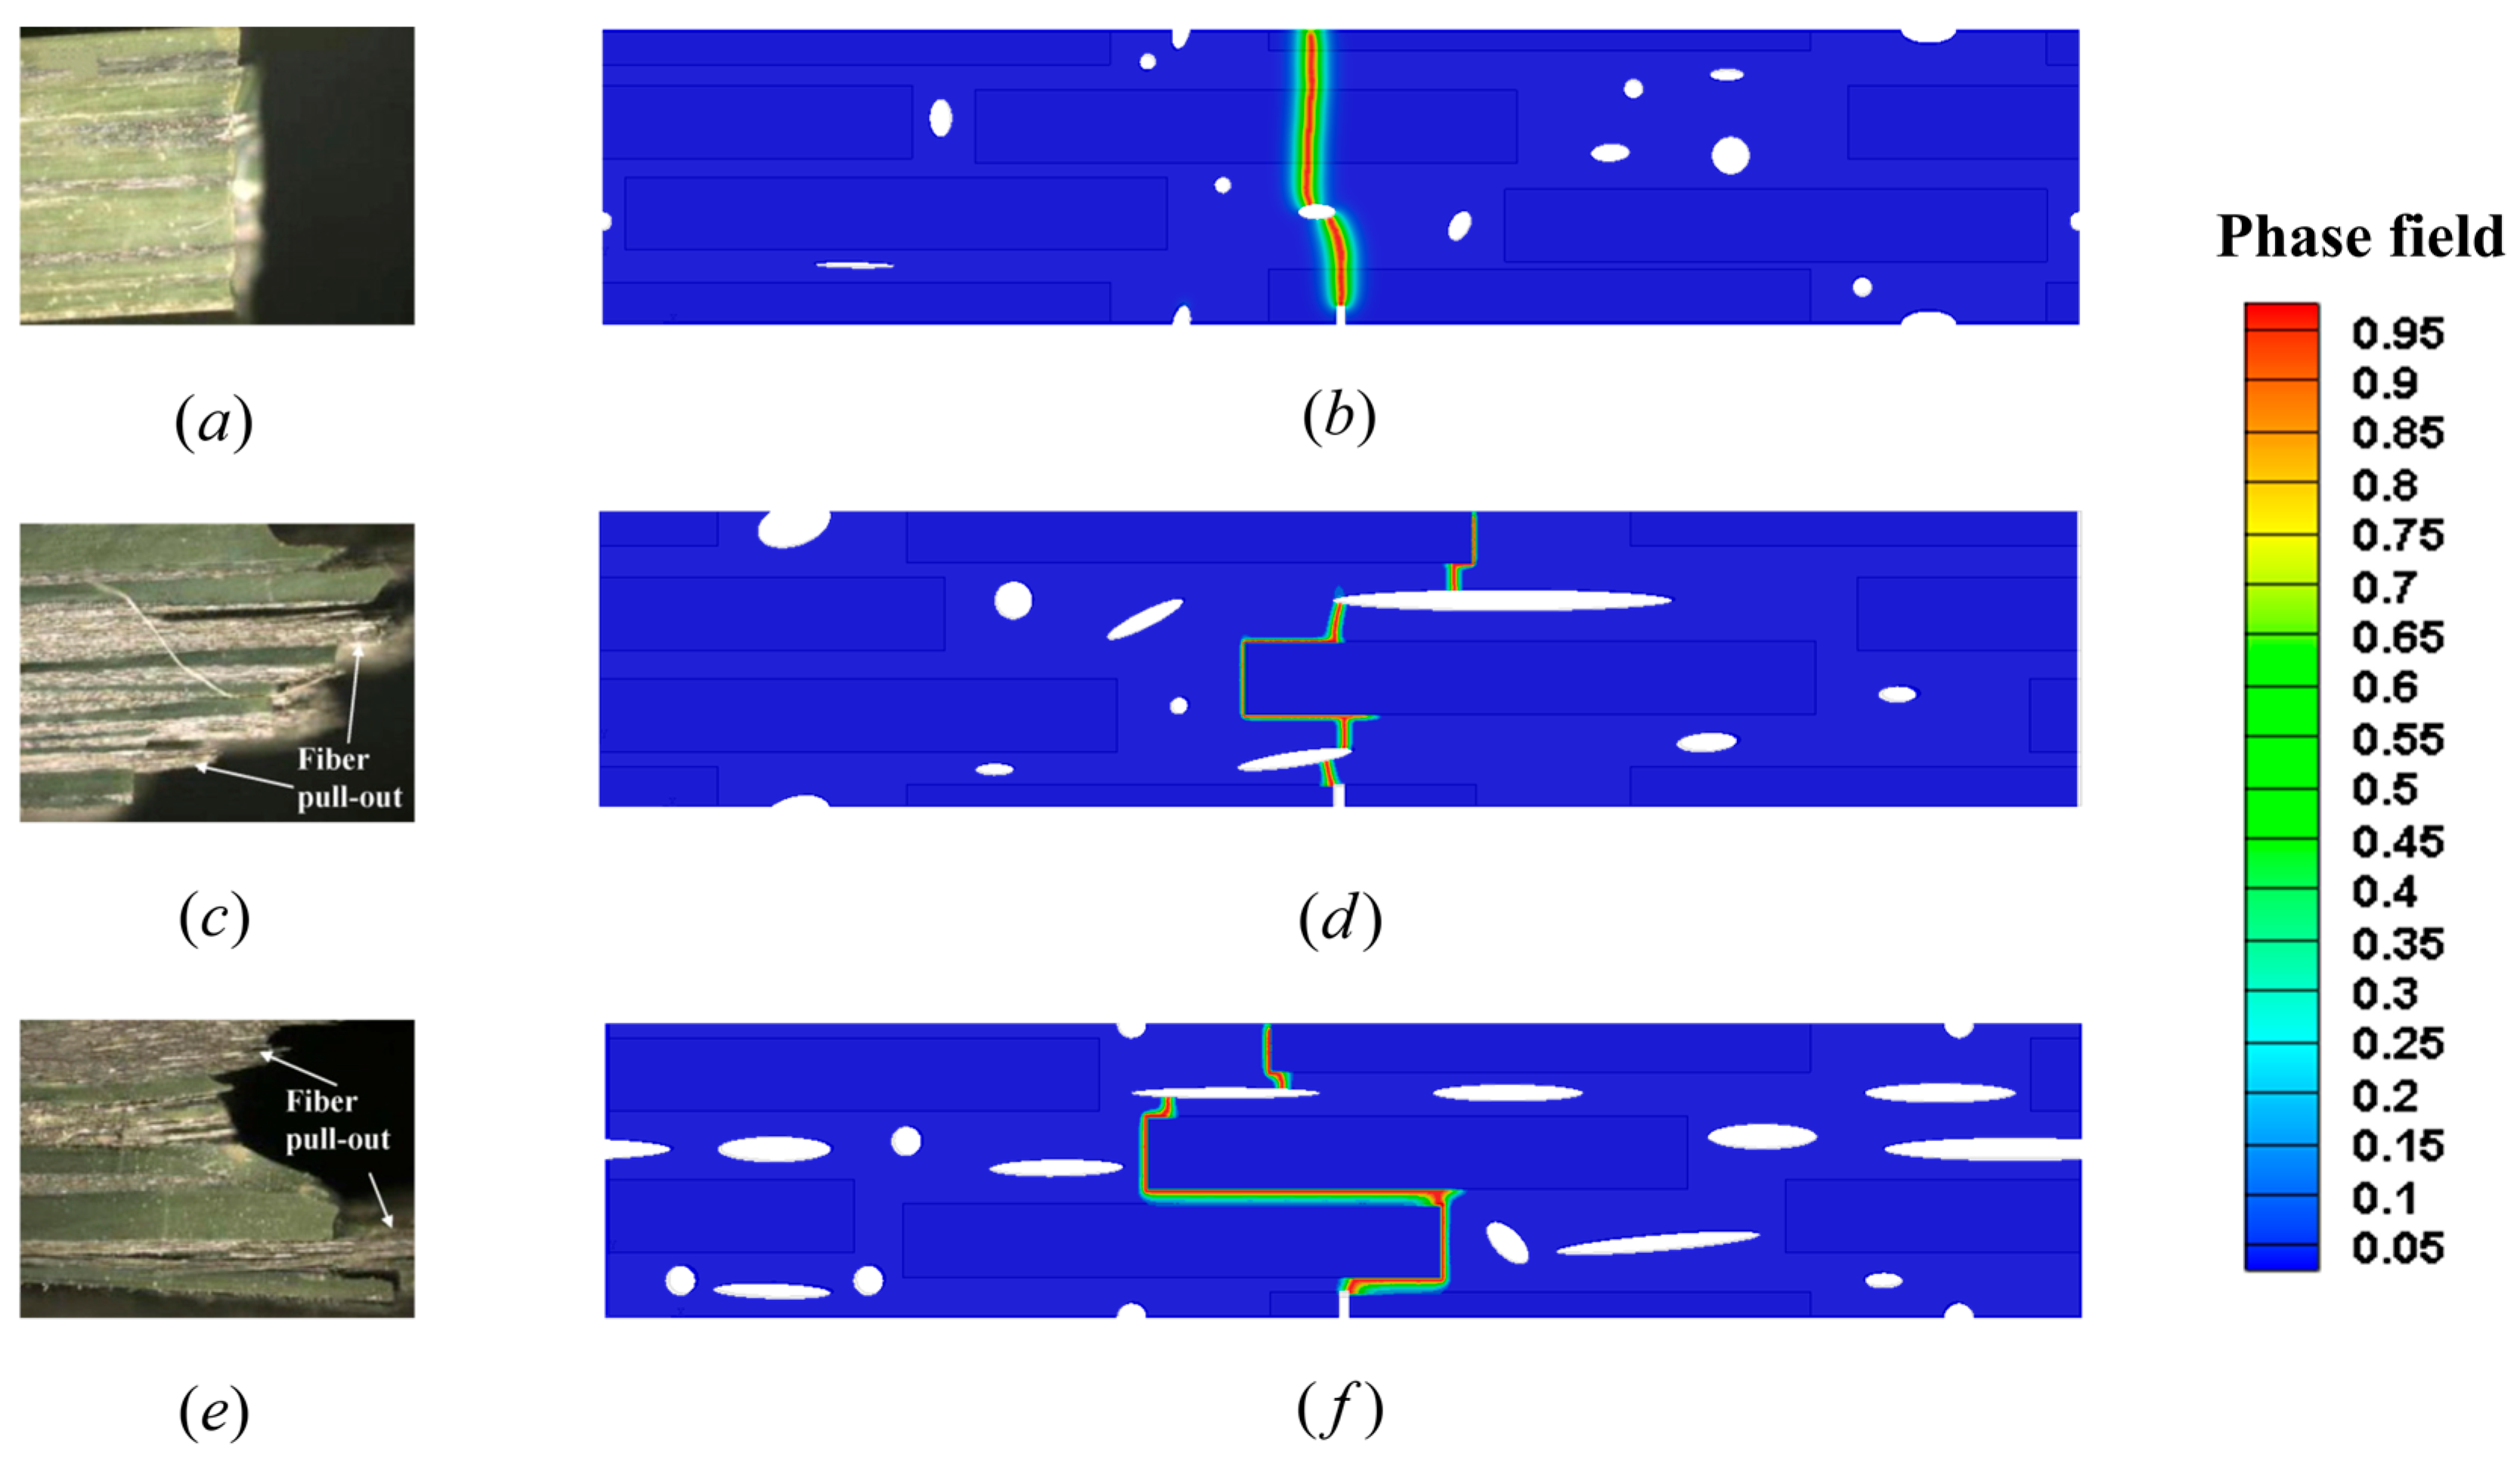
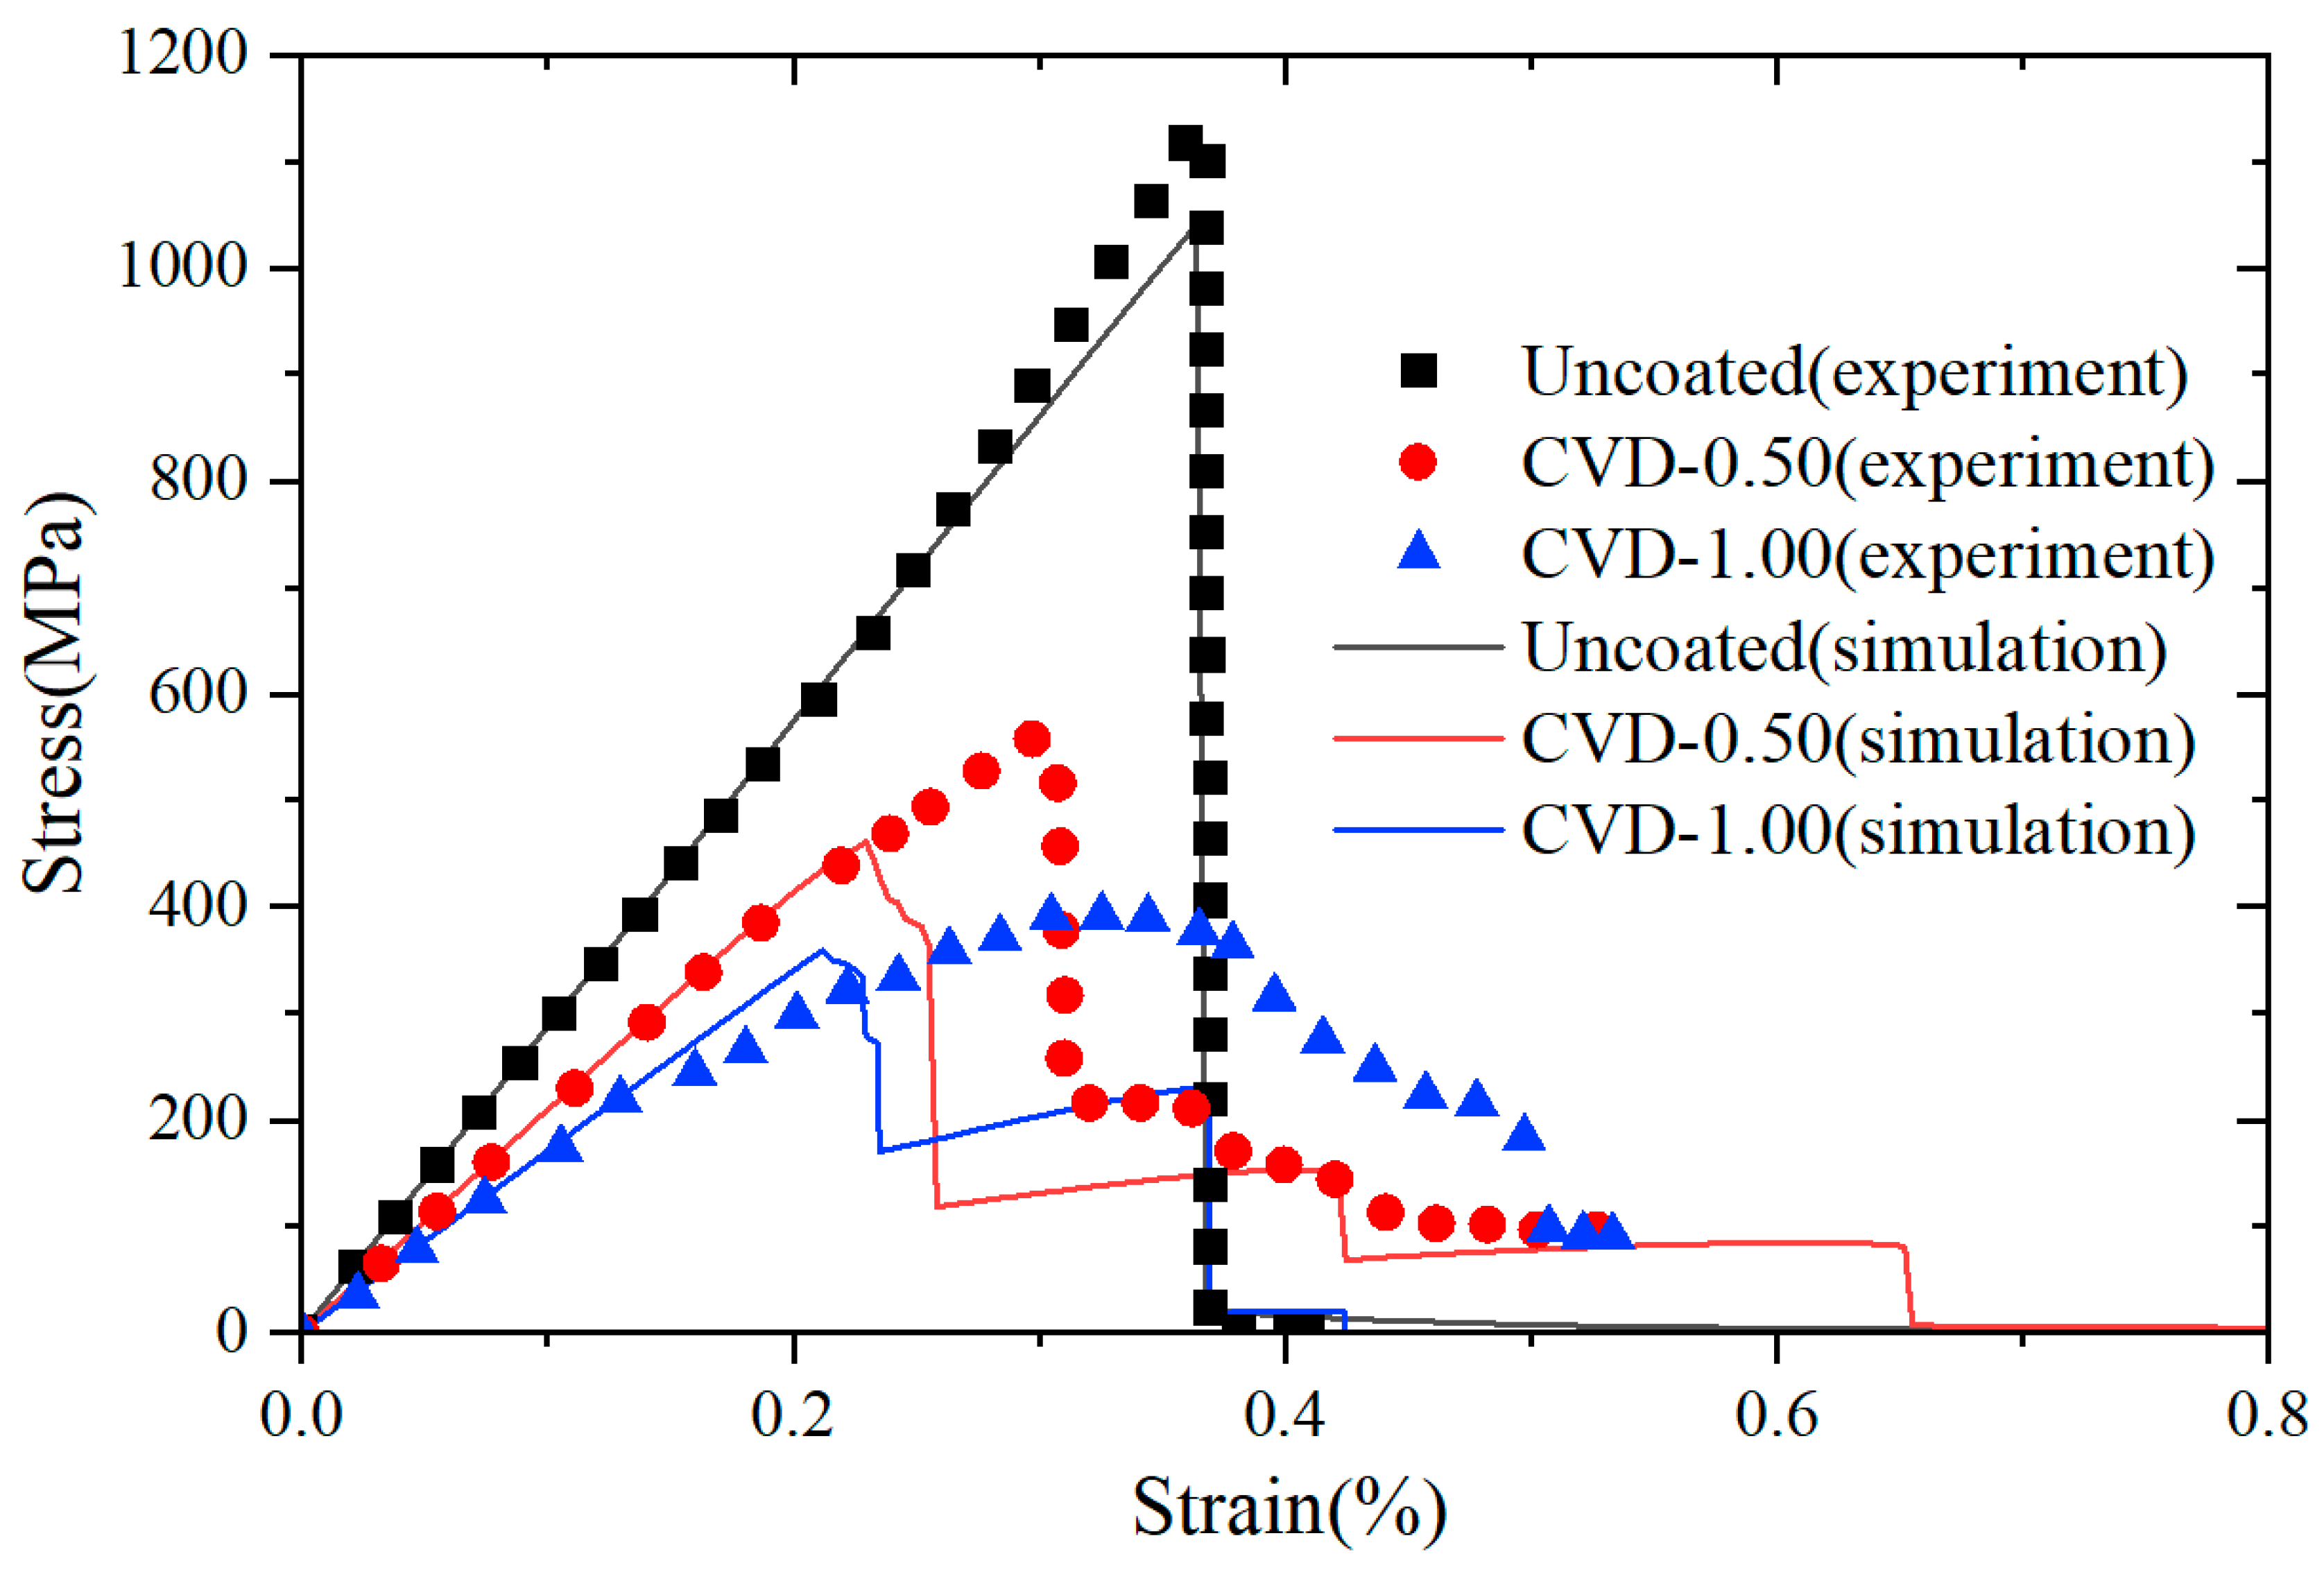
where P is load at a point of deflection of a load–displacement curve in test, l is outer support span, w is specimen width, t is specimen thickness, D is deflection at beam center at a given point in the test. The microstructural models used in these simulations are shown in Figure 15. Based on the constituent ratios in Table 4, a RVE was constructed in which fibers, pores, and matrix are randomly distributed. Periodic microstructural features were imposed such that the fiber and pore morphology on opposing edges (left–right and top–bottom) align continuously, satisfying RVE conditions. The fiber diameter and volume fraction were matched to the experimental data. The internal length scale of interfacial phase field was fixed at l i = 2   μ m . The internal length scale of fracture phase field was set to l 0 = 0.6   μ m in Uncoated case and CVD-1.00 case, and the internal length scale of fracture phase field was set to l 0 = 0.2   μ m in CVD-0.50 case. The material properties of the SiCf/SiCm composite constituents, including the PyC interface, are listed in Table 5. The transition function parameters used for the CVD-0.50 case are n = 2 , k = 70 and x i = 0.5   μ m , while for the CVD-1.00 case, the parameters are n = 2 , k = 70 and x i = 1   μ m , respectively. All simulations in this section are conducted using the PF-CZM model with linear degradation. This model is more convenient for analyzing interface-driven damage in composites because it provides a closer link to cohesive-zone traction–separation laws. The linear degradation directly connects fracture energy dissipation with interfacial strength parameters, thereby enabling a more accurate representation of interfacial fracture phenomena. The elastic potential is decomposed into tensile and compressive components following the formulation given in Equation (6), The simulated fracture patterns and the corresponding experimental fracture images are shown in Figure 16, and the comparison of stress–strain curves obtained from experiments and numerical simulations for all cases is presented in Figure 17.
As shown in Figure 16, both the experimental and simulated fracture surfaces for the Uncoated case exhibit relatively smooth fracture surfaces. In this case, damage occurred in both the fibers and the matrix. No fiber pull-out or crack deflection is observed, indicating that the absence of a soft interface causes the crack to propagate directly across the composite cross-section. This behavior is reflected in the stress–strain curve (Figure 17, black square point set and black line), which shows a steep linear increase followed by abrupt failure, characteristic of brittle fracture. The corresponding simulation reproduces this behavior well, capturing both the fracture mode and the overall stiffness response. This sudden brittle failure, typical of uncoated composites, poses a serious limitation in structural applications, as it lacks any forewarning before final fracture, making failure unpredictable and potentially unsafe under service conditions.
In contrast, the CVD-0.50 case reveals distinct signs of crack deflection and fiber pull-out in both experimental and numerical results. The simulation accurately predicts that the crack path is redirected along the interface rather than penetrating the fibers directly. This redirection is enabled by the presence of a relatively weak PyC interface, which accommodates debonding under loading. The stress–strain curve (Figure 17, red dots point set and red line) exhibits a more gradual post-peak softening, indicating pseudo-ductile behavior, in close agreement with experimental observations [59]. Notably, the maximum stress is lower than that of the Uncoated case. Fractographic evidence confirms that this configuration leads to the most favorable combination of toughness and strength, as it activates multiple toughening mechanisms such as crack deflection, fiber bridging, and interfacial sliding [65,66].
For the CVD-1.0 case, the simulated crack morphology remains similar to that of the CVD-0.50 case, with significant crack deflection and interface failure. However, the increased thickness of the interface leads to a reduction in matrix continuity and potentially increases the risk of interfacial degradation under thermal or chemical exposure. Experimentally, this case shows a slightly lower flexural strength than the CVD-0.50 composite (Figure 17, red dots and blue triangles point set), and the simulation similarly predicts a modest decrease in peak load. The stress–strain response (Figure 17, blue line) shows a pseudo-ductile trend, but with reduced stiffness and peak strength compared to the CVD-0.50 case.
The simulation results are in strong agreement with experimental observations, reaffirming the critical role of interfacial design in SiCf/SiCm composites. Specifically, the model successfully reproduces the key finding reported in the referenced work [59]: A better balance between high flexural strength and pseudo-ductile fracture behavior is achieved when a PyC interface thickness of approximately 0.5   μ m is used, enabling effective crack deflection and fiber pull-out. These results confirm that the thickness and condition of the PyC interface significantly influence microstructural evolution and dominate the mechanical and fracture responses of the composite system.
From Figure 17, it can be observed that the experimental and numerical results show good agreement in the Uncoated case. In contrast, for the CVD-0.50 and CVD-1.00 cases, the experimental results exhibit significantly higher strengths compared to the numerical predictions. Quantitative comparisons of the flexural strengths are summarized in Table 6, along with their corresponding relative errors. The Uncoated case exhibits excellent agreement between simulation and experiment, with relative error below 10%, confirming the validity of the model in predicting brittle fracture behavior. However, for the CVD-0.50 and CVD-1.00 cases, the relative errors exceed 10%. This discrepancy is primarily attributed to differences between the nominal and real interface thicknesses in the experimental composites. As reported by Shimoda et al. [59], the PyC layers deposited during the CVD process underwent partial degradation during hot pressing, due to chemical reactions with oxide sintering additives, as described by the following thermodynamically favorable reaction mechanism [67,68]:
3 C ( s ) + SiO 2 ( s , l ) = SiC ( s ) + 2 CO ( g )
As a result, the real interfaces in the experiments were thinner than modeled, thereby yielding higher strength than predicted numerically.
Despite this, the model successfully captures the dominant fracture mechanisms in all three cases. It reproduces key features such as brittle fracture in the uncoated condition, pseudo-ductile response with deflection in the CVD-0.50 case and CVD-1.00 case, demonstrating the versatility and robustness of the proposed smeared-interface approach. Furthermore, the numerical method offers significant advantages over purely experimental approaches. For instance, while the experimental setup requires fabricating separate specimens with different interface geometries, the numerical model achieves this by adjusting only the transition function parameters in a single RVE mesh. This reduces modeling workload, eliminates geometric meshing challenges near thin interfaces, and allows efficient exploration of a broader parameter space—including interface thicknesses that may be difficult or impossible to fabricate precisely in practice.
In conclusion, the proposed phase-field framework, incorporating a flexible interfacial transition function, proves capable of capturing the microstructural fracture responses of SiCf/SiCm composites across a range of interface thicknesses. It offers both accuracy and computational efficiency, making it a powerful tool for guiding interface design in advanced structural ceramics.

6. Conclusions

This work proposes a novel unified framework for smeared interface modeling in phase-field simulations of microscopic fracture, capable of accurately capturing the influence of variable interface thickness across composite microstructures. A new transition function governed by three parameters n , k and x i is developed to describe the spatial variation in material properties within the interface zone. The role of each parameter in shaping the material transition was systematically analyzed, and a simplified single fiber example was used to illustrate a practical guideline for parameter selection. In this study, the parameters were determined as n = 2 , k = 70 , while x i was directly set according to the actual interface thickness.
The proposed model was then applied to simulate transverse tensile failure in a ceramic matrix composite with an h-BN interface. Five cases with different interface thicknesses ( 0.1   μ m , 0.25   μ m , 0.5   μ m , 0.75   μ m , and 1   μ m ) were studied to determine the optimal interface thicknesses for maximizing transverse strength. Results revealed that the highest strength was achieved when the interface thickness falls into the range of 0.75   μ m   ,   1   μ m . A benchmark comparison with real interface models confirmed the accuracy and reliability of the proposed smeared interface approach. Furthermore, by fitting the conventional smearing function with the proposed one, it was demonstrated that the new method retains the capability of classical models while extending their applicability to more complex scenarios.
In the validation stage, the model was employed to replicate the experiments reported in [59], where the influence of PyC interface thickness on the flexural strength and fracture behavior of ceramic composites was studied. The numerical simulations not only reproduced the key experimental trends, including pseudo-ductile fracture at 0.5   μ m PyC thickness, but also confirmed that this thickness offers an optimal balance between interfacial protection and crack deflection.
Finally, to further demonstrate the generality of the proposed framework, the smeared-interface method was applied within two different phase-field formulations (AT2 and PF-CZM with linear degradation). The consistent performance across these cases shows that the method is not restricted to a specific phase-field model but can be extended broadly to different formulations for composite fracture simulations.
In conclusion, the proposed method provides a more comprehensive and physically meaningful framework for modeling fiber–matrix interfaces in composite microstructures, enhancing both the predictive capability and practical flexibility of phase-field simulations across a wide range of composite material systems.

Author Contributions

Conceptualization, X.H. and T.W.; methodology, T.W.; software, X.H.; validation, X.H., T.W. and W.Y.; formal analysis, Z.S.; investigation, Z.S.; resources, X.H.; data curation, W.Y.; writing—original draft preparation, T.W.; writing—review and editing, X.H.; visualization, Z.S.; supervision, W.Y.; project administration, W.Y.; funding acquisition, X.H. All authors have read and agreed to the published version of the manuscript.

Funding

This work was funded by the National Natural Science Foundation of China (grant No. 12272084).

Data Availability Statement

The original contributions presented in this study are included in the article. Further inquiries can be directed to the corresponding author.

Acknowledgments

This work was funded by the National Natural Science Foundation of China (grant No. 12272084).

Conflicts of Interest

The authors declare no conflict of interest.

References

  1. Phillips, D. Fiber-reinforced ceramics. In Concise Encyclopedia of Advanced Ceramic Materials; Elsevier: Amsterdam, The Netherlands, 1991; pp. 155–160. [Google Scholar]
  2. Krenkel, W. Ceramic Matrix Composites: Fiber Reinforced Ceramics and Their Applications; John Wiley & Sons: Hoboken, NJ, USA, 2008. [Google Scholar]
  3. Arai, Y.; Inoue, R.; Goto, K.; Kogo, Y. Carbon fiber reinforced ultra-high temperature ceramic matrix composites: A review. Ceram. Int. 2019, 45, 14481–14489. [Google Scholar] [CrossRef]
  4. Kameda, T.; Itoh, Y.; Hijikata, T.; Okamura, T. Development of continuous fiber reinforced reaction sintered silicon carbide matrix composite for gas turbine hot parts application. In Turbo Expo: Power for Land, Sea, and Air; American Society of Mechanical Engineers: New York, NY, USA, 2000; p. V004T002A006. [Google Scholar]
  5. Jia, T.; Deng, Y.; Hao, Y.; Gao, X.; Zhang, C.; Cheng, T.; Li, W.; Yun, G. An analytical model for the high temperature fracture strength of SiC fiber reinforced ceramic matrix composites considering oxidation and residual thermal stresses. Compos. Part A Appl. Sci. Manuf. 2023, 173, 107668. [Google Scholar] [CrossRef]
  6. Fan, X.; Yin, X. Progress in research and development on matrix modification of continuous fiber-reinforced silicon carbide matrix composites. Adv. Compos. Hybrid Mater. 2018, 1, 685–695. [Google Scholar] [CrossRef]
  7. Zhao, M.; Zheng, J.; Wang, X.; Zhang, J.; Zhang, D. Gradient-structured SiCf/SiC hybrid woven metamaterials with superior broadband absorption and high-load bearing. Ceram. Int. 2024, 50, 49400–49411. [Google Scholar] [CrossRef]
  8. Li, L.; Song, Y.; Sun, Y. Modeling the tensile behavior of cross-ply C/SiC ceramic-matrix composites. Mech. Compos. Mater. 2015, 51, 359–376. [Google Scholar] [CrossRef]
  9. Li, L.; Song, Y.; Sun, Y.C. Modeling the tensile behavior of unidirectional C/SiC ceramic-matrix composites. Mech. Compos. Mater. 2014, 49, 659–672. [Google Scholar] [CrossRef]
  10. Erdman, D.; Weitsman, Y. The multi-fracture response of cross-ply ceramic composites. Int. J. Solids Struct. 1998, 35, 5051–5083. [Google Scholar] [CrossRef]
  11. Naslain, R.R.; Pailler, R.J.F.; Lamon, J.L. Single-and multilayered interphases in SiC/SiC composites exposed to severe environmental conditions: An overview. Int. J. Appl. Ceram. Technol. 2010, 7, 263–275. [Google Scholar] [CrossRef]
  12. Zhang, Y.; Hu, J.; Dong, S.; Li, Y. Influence of the thickness of pyrolytic carbon interphase on the mechanical behavior of SiC/(BN/PyC)/SiC composites. Ceram. Int. 2024, 50, 22085–22093. [Google Scholar] [CrossRef]
  13. Lv, X.; Yue, M.; Yang, W.; Feng, X.; Li, X.; Wang, Y.; Wang, J.; Zhang, J.; Wang, J. Tunable strength of SiCf/β-Yb2Si2O7 interface for different requirements in SiCf/SiC CMC: Inspiration from model composite investigation. J. Mater. Sci. Technol. 2021, 67, 165–173. [Google Scholar] [CrossRef]
  14. Yang, B.; Zhou, X.; Chai, Y. Mechanical properties of SiCf/SiC composites with PyC and the BN interface. Ceram. Int. 2015, 41, 7185–7190. [Google Scholar] [CrossRef]
  15. Petrie, C.M.; Koyanagi, T.; McDuffee, J.L.; Deck, C.P.; Katoh, Y.; Terrani, K.A. Experimental design and analysis for irradiation of SiC/SiC composite tubes under a prototypic high heat flux. J. Nucl. Mater. 2017, 491, 94–104. [Google Scholar] [CrossRef]
  16. Inghels, E.; Lamon, J. An approach to the mechanical behaviour of SiC/SiC and C/SiC ceramic matrix composites: Part 1 Experimental results. J. Mater. Sci. 1991, 26, 5403–5410. [Google Scholar] [CrossRef]
  17. Giusti, R.; Lucchetta, G. Cohesive Zone Modeling of the Interface Fracture in Full-Thermoplastic Hybrid Composites for Lightweight Application. Polymers 2023, 15, 4459. [Google Scholar] [CrossRef]
  18. Jia, W.; Fang, L.; Chen, Z.; Zhao, K.; Huang, H.; Pan, L. A microscopic cohesive zone model and effects of interface on the transverse mechanical properties for composites. Fibers Polym. 2021, 22, 1352–1365. [Google Scholar] [CrossRef]
  19. Kang, F.; Mei, H.; Gao, X.; Zhang, D.; Ye, F.; Zhang, Y.; Cheng, L. Three-dimensional in-situ observation and cohesive zone modeling of tension-induced delamination of two-dimensional C/SiC composites via deep learning-based damage identification. Carbon 2025, 233, 119842. [Google Scholar] [CrossRef]
  20. Jia, L.; Zhang, C.; Hu, Z.; Song, P.; Yu, L.; Tang, C. Failure analysis of composite laminates under transverse shear load via XFEM. Compos. Struct. 2021, 262, 113615. [Google Scholar] [CrossRef]
  21. Liu, G.; Guo, J.; Bao, Y.; Zhu, H.; Sun, K. Multiscale simulation of debonding in fiber-reinforced composites by a combination of MsFEM and XFEM. Eng. Fract. Mech. 2024, 306, 110216. [Google Scholar] [CrossRef]
  22. Vellwock, A.E.; Libonati, F. XFEM for composites; biological; bioinspired materials: A review. Materials 2024, 17, 745. [Google Scholar] [CrossRef]
  23. Kumar, V.; Dewangan, H.C.; Sharma, N.; Panda, S.K. Combined damage influence prediction of curved composite structural responses using VCCT technique and experimental verification. Int. J. Appl. Mech. 2021, 13, 2150086. [Google Scholar] [CrossRef]
  24. Martulli, L.; Bernasconi, A. An efficient and versatile use of the VCCT for composites delamination growth under fatigue loadings in 3D numerical analysis: The Sequential Static Fatigue algorithm. Int. J. Fatigue 2023, 170, 107493. [Google Scholar] [CrossRef]
  25. Buryachenko, V.A. Peridynamic micromechanics of composites: A review. J. Peridynamics Nonlocal Model. 2024, 6, 531–601. [Google Scholar] [CrossRef]
  26. Yin, B.; Huang, J.; Sun, W. Peridynamics-fueled convolutional neural network for predicting mechanical constitutive behaviors of fiber reinforced composites. Comput. Methods Appl. Mech. Eng. 2024, 431, 117309. [Google Scholar] [CrossRef]
  27. Shao, Y.; Duan, Q.; Qiu, S. Adaptive analysis for phase-field model of brittle fracture of functionally graded materials. Eng. Fract. Mech. 2021, 251, 107783. [Google Scholar] [CrossRef]
  28. Molnár, G.; Gravouil, A. 2D and 3D Abaqus implementation of a robust staggered phase-field solution for modeling brittle fracture. Finite Elem. Anal. Des. 2017, 130, 27–38. [Google Scholar] [CrossRef]
  29. Msekh, M.A.; Sargado, J.M.; Jamshidian, M.; Areias, P.M.; Rabczuk, T. Abaqus implementation of phase-field model for brittle fracture. Comput. Mater. Sci. 2015, 96, 472–484. [Google Scholar] [CrossRef]
  30. Storvik, E.; Both, J.W.; Sargado, J.M.; Nordbotten, J.M.; Radu, F.A. An accelerated staggered scheme for variational phase-field models of brittle fracture. Comput. Methods Appl. Mech. Eng. 2021, 381, 113822. [Google Scholar] [CrossRef]
  31. Zhuang, X.; Ren, H.; Rabczuk, T. Nonlocal operator method for dynamic brittle fracture based on an explicit phase field model. Eur. J. Mech. -A/Solids 2021, 90, 104380. [Google Scholar] [CrossRef]
  32. Peng, F.; Huang, W.; Zhang, Z.-Q.; Guo, T.F.; Ma, Y.E.; Zhang, Y. Conservational integrals of the fourth-order phase field model for brittle fracture via Noether theorem. Eng. Fract. Mech. 2021, 245, 107590. [Google Scholar] [CrossRef]
  33. Xue, T.; Adriaenssens, S.; Mao, S. Mapped phase field method for brittle fracture. Comput. Methods Appl. Mech. Eng. 2021, 385, 114046. [Google Scholar] [CrossRef]
  34. Nguyen, K.D.; Augarde, C.E.; Coombs, W.M.; Nguyen-Xuan, H.; Abdel-Wahab, M. Non-conforming multipatches for NURBS-based finite element analysis of higher-order phase-field models for brittle fracture. Eng. Fract. Mech. 2020, 235, 107133. [Google Scholar] [CrossRef]
  35. Nguyen-Thanh, N.; Nguyen-Xuan, H.; Li, W. Phase-field modeling of anisotropic brittle fracture in rock-like materials and polycrystalline materials. Comput. Struct. 2024, 296, 107325. [Google Scholar] [CrossRef]
  36. Tarafder, P.; Dan, S.; Ghosh, S. Finite deformation cohesive zone phase field model for crack propagation in multi-phase microstructures. Comput. Mech. 2020, 66, 723–743. [Google Scholar] [CrossRef]
  37. Zhang, P.; Hu, X.; Yang, S.; Yao, W. Modelling progressive failure in multi-phase materials using a phase field method. Eng. Fract. Mech. 2019, 209, 105–124. [Google Scholar] [CrossRef]
  38. Nguyen, T.T.; Réthoré, J.; Yvonnet, J.; Baietto, M.C. Multi-phase-field modeling of anisotropic crack propagation for polycrystalline materials. Comput. Mech. 2017, 60, 289–314. [Google Scholar] [CrossRef]
  39. Bourdin, B.; Francfort, G.A.; Marigo, J.J. Numerical experiments in revisited brittle fracture. J. Mech. Phys. Solids 2000, 48, 797–826. [Google Scholar] [CrossRef]
  40. Ambati, M.; Gerasimov, T.; De Lorenzis, L. A review on phase-field models of brittle fracture and a new fast hybrid formulation. Comput. Mech. 2015, 55, 383–405. [Google Scholar] [CrossRef]
  41. Francfort, G.A.; Marigo, J.J. Revisiting brittle fracture as an energy minimization problem. J. Mech. Phys. Solids 1998, 46, 1319–1342. [Google Scholar] [CrossRef]
  42. Bourdin, B.; Francfort, G.A.; Marigo, J.J. The variational approach to fracture. J. Elast. 2008, 91, 5–148. [Google Scholar] [CrossRef]
  43. Gao, J.; Bai, Y.; Fan, H.; Song, G.; Zou, X.; Zheng, Y.; He, X. Phase-field simulation of microscale crack propagation/deflection in SiCf/SiC composites with weak interphase. J. Am. Ceram. Soc. 2023, 106, 4877–4890. [Google Scholar] [CrossRef]
  44. Xiao, Y.; Liu, Z.; Peng, X.; Zhu, W.; Zhou, Y.; Yang, L. Spallation mechanism of thermal barrier coatings with real interface morphology considering growth and thermal stresses based on fracture phase field. Surf. Coat. Technol. 2023, 458, 129356. [Google Scholar] [CrossRef]
  45. Gljušćić, M.; Lanc, D.; Franulović, M.; Žerovnik, A. Microstructural analysis of the transverse and shear behavior of additively manufactured CFRP composite RVEs based on the phase-field fracture theory. J. Compos. Sci. 2023, 7, 38. [Google Scholar] [CrossRef]
  46. Zhang, P.; Yao, W.; Hu, X.; Bui, T.Q. 3D micromechanical progressive failure simulation for fiber-reinforced composites. Compos. Struct. 2020, 249, 112534. [Google Scholar] [CrossRef]
  47. Hu, X.; Zhang, P.; Yao, W. Phase field modelling of microscopic failure in composite laminates. J. Compos. Mater. 2021, 55, 1853–1865. [Google Scholar] [CrossRef]
  48. Wang, T.; Sun, Z.; Hu, X.; Xu, H.; Zhang, P.; Yao, W. Simulation of progressive failure process in solid rocket propellants using a phase-field model. Eng. Fract. Mech. 2024, 312, 110577. [Google Scholar] [CrossRef]
  49. Zhou, S.; Wang, T.; Wu, X.; Sun, Z.; Li, Y.; Berto, F. Three-dimensional phase field modeling of progressive failure in aramid short fiber reinforced paper. Mech. Adv. Mater. Struct. 2023, 30, 5106–5121. [Google Scholar] [CrossRef]
  50. Michel, J.-C.; Moulinec, H.; Suquet, P. Effective properties of composite materials with periodic microstructure: A computational approach. Comput. Methods Appl. Mech. Eng. 1999, 172, 109–143. [Google Scholar] [CrossRef]
  51. Mikdam, A.; Makradi, A.; Koutsawa, Y.; Belouettar, S. Microstructure effect on the mechanical properties of heterogeneous composite materials. Compos. Part B: Eng. 2013, 44, 714–721. [Google Scholar] [CrossRef]
  52. Bourdin, B.; Chambolle, A. Implementation of an adaptive finite-element approximation of the Mumford-Shah functional. Numer. Math. 2000, 85, 609–646. [Google Scholar] [CrossRef]
  53. Wu, J.Y. A unified phase-field theory for the mechanics of damage and quasi-brittle failure. J. Mech. Phys. Solids 2017, 103, 72–99. [Google Scholar] [CrossRef]
  54. Miehe, C.; Welschinger, F.; Hofacker, M. Thermodynamically consistent phase-field models of fracture: Variational principles and multi-field FE implementations. Int. J. Numer. Methods Eng. 2010, 83, 1273–1311. [Google Scholar] [CrossRef]
  55. Miehe, C.; Hofacker, M.; Welschinger, F. A phase field model for rate-independent crack propagation: Robust algorithmic implementation based on operator splits. Comput. Methods Appl. Mech. Eng. 2010, 199, 2765–2778. [Google Scholar] [CrossRef]
  56. Sudhir, A.; Talreja, R. Simulation of manufacturing induced fiber clustering and matrix voids and their effect on transverse crack formation in unidirectional composites. Compos. Part A Appl. Sci. Manuf. 2019, 127, 105620. [Google Scholar] [CrossRef]
  57. Hu, X.; Tan, S.; Xu, H.; Sun, Z.; Wang, T.; Min, L.; Wang, Z.; Yao, W. Modelling high temperature progressive failure in C/SiC composites using a phase field model: Oxidation rate controlled process. Comput. Methods Appl. Mech. Eng. 2025, 433, 117544. [Google Scholar] [CrossRef]
  58. Braginsky, M.; Przybyla, C.P. Simulation of crack propagation/deflection in ceramic matrix continuous fiber reinforced composites with weak interphase via the extended finite element method. Compos. Struct. 2016, 136, 538–545. [Google Scholar] [CrossRef]
  59. Shimoda, K.; Park, J.-S.; Hinoki, T.; Kohyama, A. Influence of pyrolytic carbon interface thickness on microstructure and mechanical properties of SiC/SiC composites by NITE process. Compos. Sci. Technol. 2008, 68, 98–105. [Google Scholar] [CrossRef]
  60. Shimoda, K.; Park, J.S.; Hinoki, T.; Kohyama, A. Microstructural optimization of high-temperature SiC/SiC composites by NITE process. J. Nucl. Mater. 2009, 386–388, 634–638. [Google Scholar] [CrossRef]
  61. Morishita, K.; Ochiai, S.; Okuda, H.; Inshikawa, T.; Sato, M.; Inoue, T. Fracture Toughness of a Crystalline Silicon Carbide Fiber (Tyranno-SA3®). J. Am. Ceram. Soc. 2006, 89, 2571–2576. [Google Scholar] [CrossRef]
  62. Yin, X.W.; Cheng, L.F.; Zhang, L.T.; Travitzky, N.; Greil, P. Fibre-reinforced multifunctional SiC matrix composite materials. Int. Mater. Rev. 2016, 62, 117–172. [Google Scholar] [CrossRef]
  63. Kabel, J.; Hosemann, P.; Zayachuk, Y.; Armstrong, D.E.J.; Koyanagi, T.; Katoh, Y.; Deck, C. Ceramic composites: A review of toughening mechanisms and demonstration of micropillar compression for interface property extraction. J. Mater. Res. 2018, 33, 424–439. [Google Scholar] [CrossRef]
  64. Jin, E.; Sun, W.; Liu, H.; Wu, K.; Ma, D.; Sun, X.; Feng, Z.; Li, J.; Yuan, Z. Effect of Interface Coating on High Temperature Mechanical Properties of SiC–SiC Composite Using Domestic Hi–Nicalon Type SiC Fibers. Coatings 2020, 10, 477. [Google Scholar] [CrossRef]
  65. Friedrich, K. Fractographic analysis of polymer composites. In Composite Materials Series; Elsevier: Amsterdam, The Netherlands, 1989; pp. 425–487. [Google Scholar]
  66. Pantazopoulos, G.A. A short review on fracture mechanisms of mechanical components operated under industrial process conditions: Fractographic analysis and selected prevention strategies. Metals 2019, 9, 148. [Google Scholar] [CrossRef]
  67. Shimoda, K.; Eto, M.; Lee, J.; Park, J.; Hinoki, T.; Kohyama, A. Influence of surface micro-chemistry of SiC nano-powder on the sinterability of NITE-SiC. Appl. Surf. Sci. 2004, 253, 9450–9456. [Google Scholar] [CrossRef]
  68. Gomez, E.; Echeberria, J.; Iturriza, I.; Castro, F. Liquid phase sintering of SiC with additions of Y2O3, Al2O3 and SiO2. J. Eur. Ceram. Soc. 2004, 24, 2895–2903. [Google Scholar] [CrossRef]
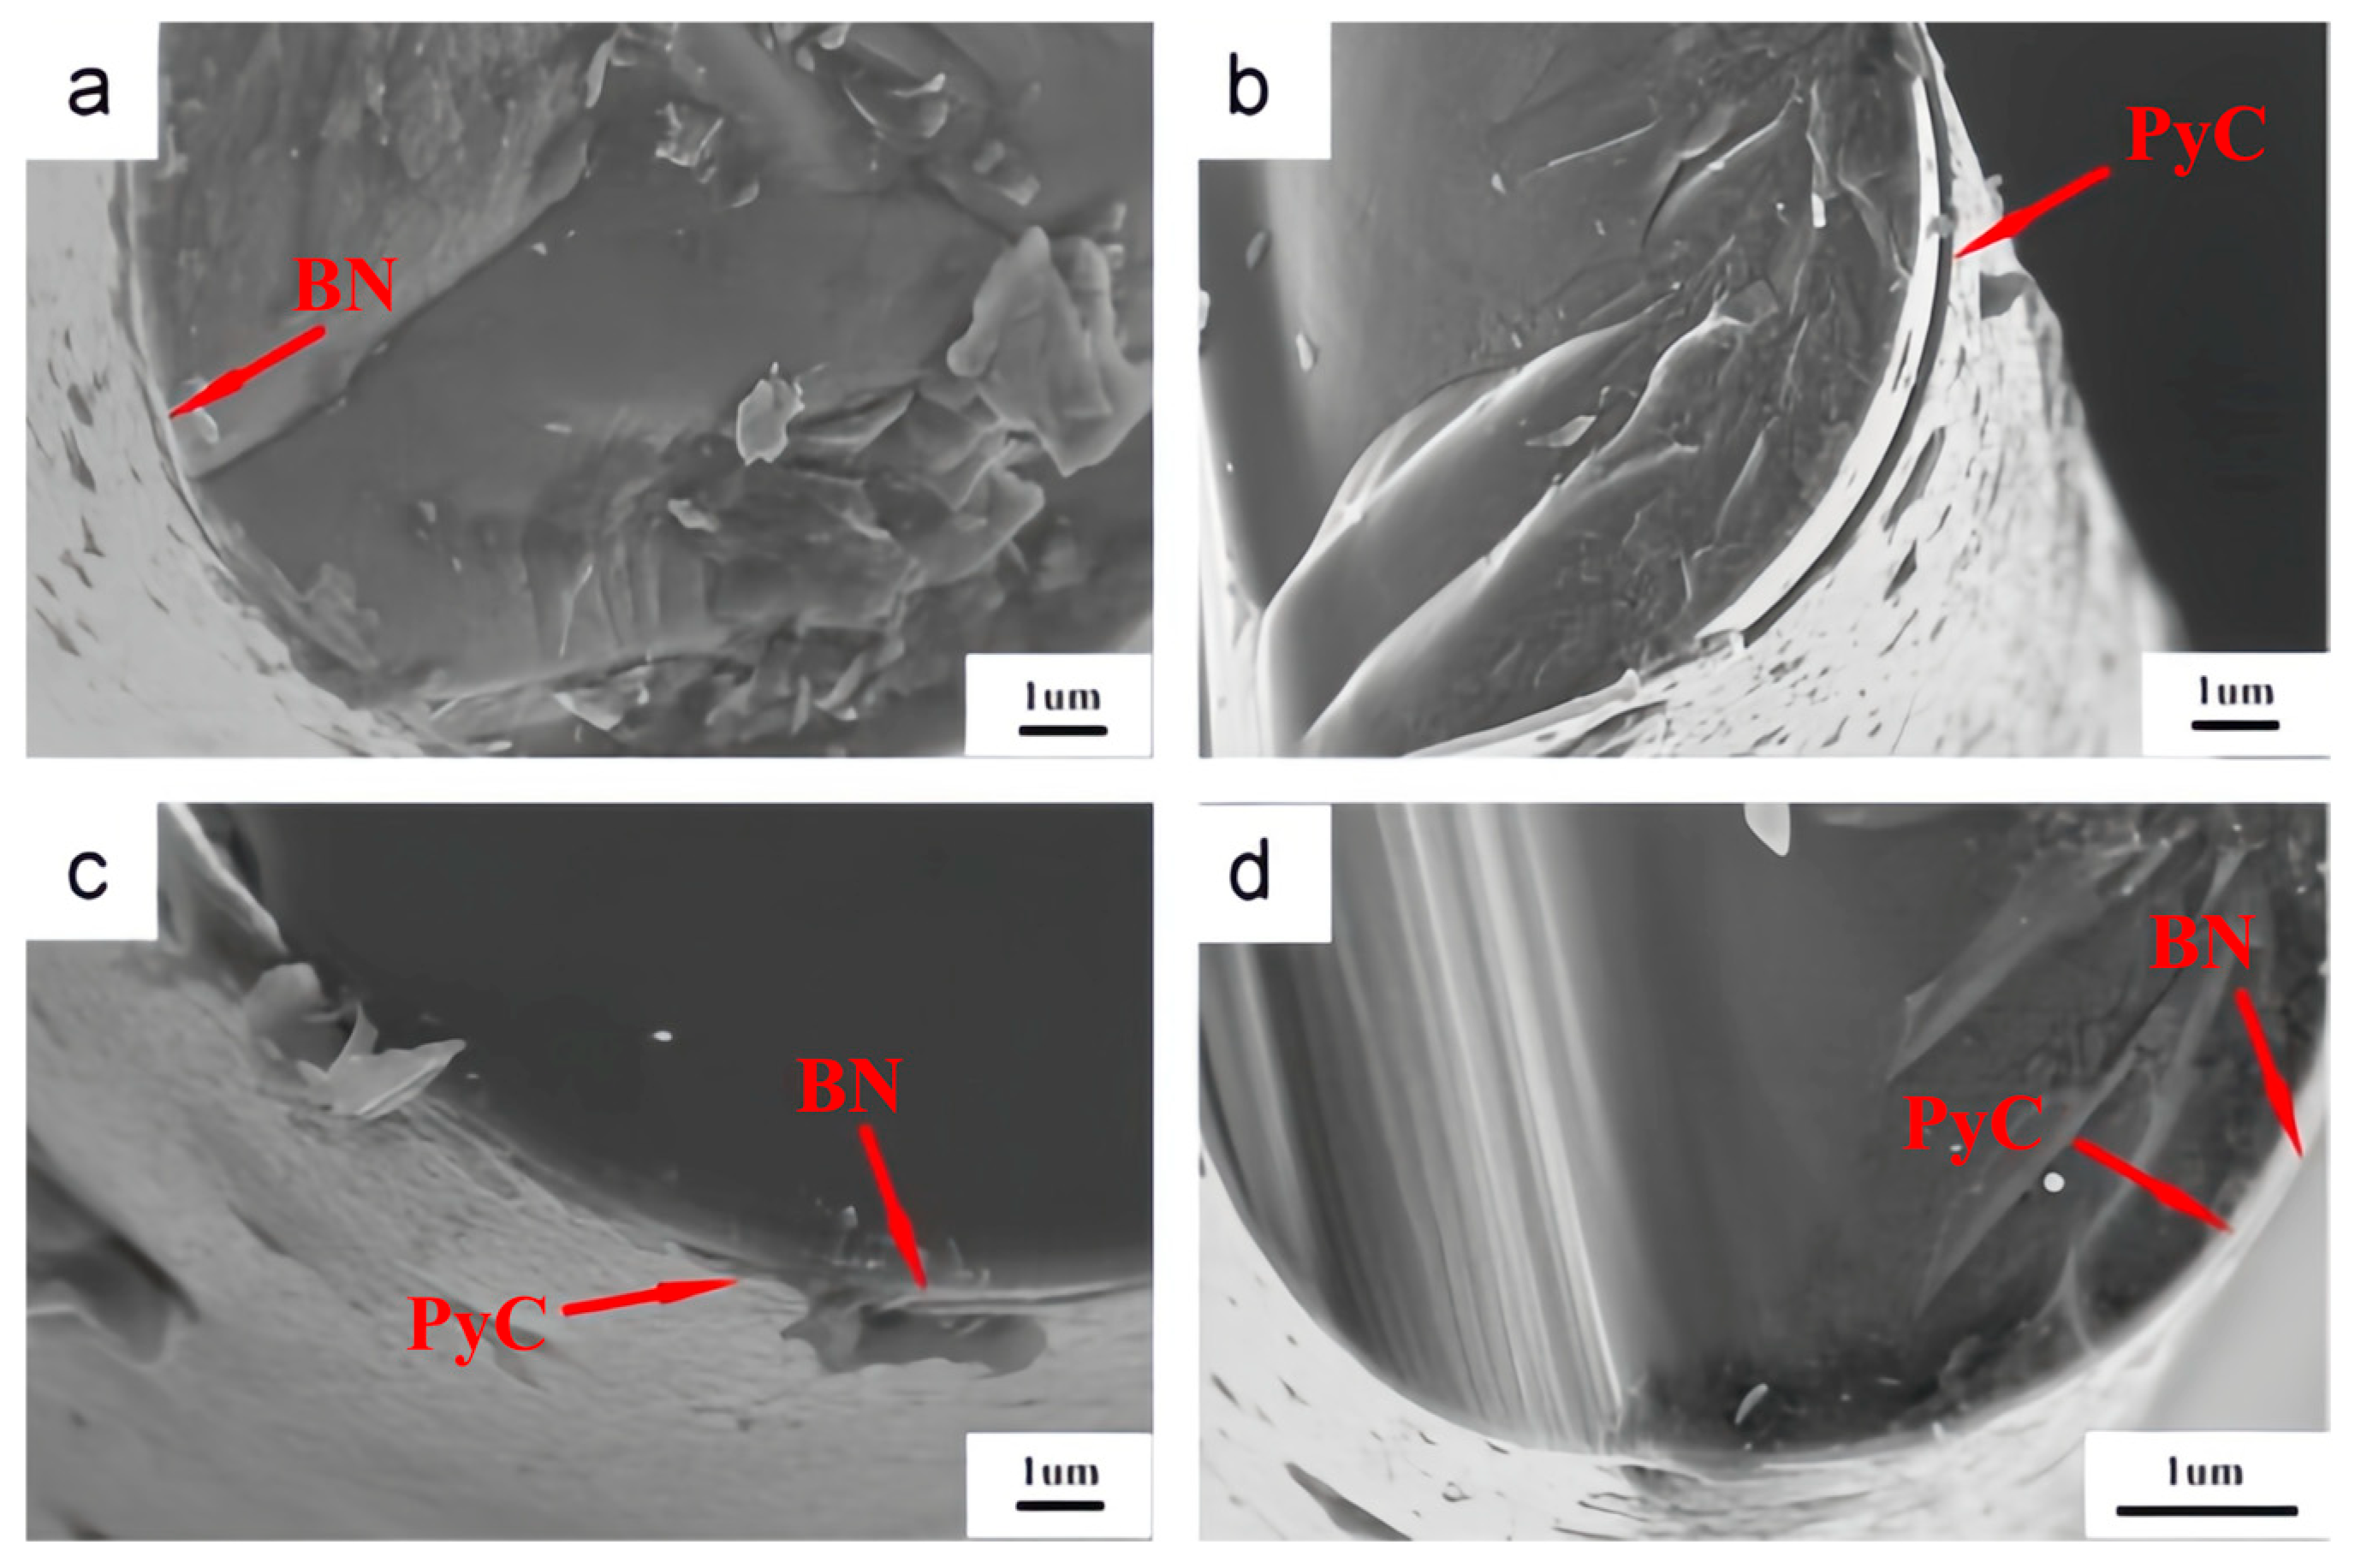
Figure 1. Fracture surface morphology of SiC fibers with different coatings: (a) dip-coated BN, (b) PyC, (c) dip-coated BN/PyC, and (d) PyC/dip-coated BN [14].
Materials 18 04496 g001
Figure 2. Diagram of a three-dimensional system containing (a) discrete cracks and (b) smeared cracks.
Materials 18 04496 g002
Figure 3. (a) Discrete representation and (b) smeared representation of the interface in a one-dimensional bar.
Materials 18 04496 g003
Figure 4. (a) Schematic of the composite microstructure. (b) Comparison between real and smeared material property distributions when the inter-fiber distance is large and the interface thickness is negligible. (c) Comparison between real and smeared material property distributions when the inter-fiber distance is small and the interface thicknesses are different and non-negligible.
Materials 18 04496 g004
Figure 5. A fracture diagram of an E-glass/carbon/epoxy interlayer hybrid composite [56] (the red line represents the prediction result of the fracture phase field model using the conventional smeared interface method).
Materials 18 04496 g005
Figure 6. Schematic illustration of interface smearing and material property smearing.(a) Interface dispersion results and curves of the two transition functions. (b) The distribution of real material properties and the distribution of material properties described by two transition functions.
Materials 18 04496 g006
Figure 7. Effects of individual parameters on the shape of the proposed interfacial material transition function: (a) Influence of parameter k with fixed n and x i ; (b) Influence of parameter n with fixed k and x i ; (c) Influence of parameter x i with fixed n and k .
Materials 18 04496 g007
Figure 8. Comparison of the conventional transition function and the proposed method–based fitted transition function.
Materials 18 04496 g008
Figure 9. Single-fiber representative volume element model and loading condition.
Materials 18 04496 g009
Figure 10. (a) Stress–strain curves under different values of k with fixed n and x i . (b) Total number of iterations required for different values of k with fixed n and x i .
Materials 18 04496 g010
Figure 11. Predicted crack patterns under different interface thicknesses. (a) 0.1   μ m . (b) 0.25   μ m . (c) 0.5   μ m . (d) 0.75   μ m . (e) 1   μ m .
Materials 18 04496 g011
Figure 12. Stress–strain response of SiCf/SiCm composites under transverse tensile for the different interface thickness.
Materials 18 04496 g012
Figure 13. Cross-sections of uncoated and PyC coated SA fibers formed with CVD technique: (a) uncoated, (b) CVD-0.50 and (c) CVD-1.00 [59].
Materials 18 04496 g013
Figure 14. The geometry and boundary conditions of three-point bending test.
Materials 18 04496 g014
Figure 15. Two-dimensional RVE models of SiCf/SiCm composites under different PyC interface thickness conditions. (a) composites with interfaces thicknesses of 0   μ m (Uncoated). (b) composites with interfaces thicknesses of 0.5   μ m (CVD-0.50). (c) composites with interfaces thicknesses of 1   μ m (CVD-1.00).
Materials 18 04496 g015
Figure 16. Comparison between experimental fracture images and simulation results of SiCf/SiCm composites with different PyC interface thicknesses under three-point bending: (a) Experimental result for uncoated case. (b) Simulation result for uncoated case. (c) Experimental result for CVD-0.50 case. (d) Simulation result for CVD-0.50 case. (e) Experimental result for CVD-1.00 case. (f) Simulation result for CVD-1.00 case.
Materials 18 04496 g016
Figure 17. Flexural stress–strain curves of SiCf/SiCm composites with various PyC interface thickness.
Materials 18 04496 g017
Table 1. The specific functional expressions and parameters of the two phase-field models.
ModelAT2PF-CZM
α ( d ) d 2 2 d d 2
c 0 2 π
ω ( d ) ( 1 d ) 2 ( 1 d ) p ( 1 d ) p + Q ( d )   ( Q ( d ) = a 1 d ( 1 + a 2 d + a 2 a 3 d 2 ) ) TypeLinearCornelissen
p 22
a 1 4 E G c π l 0 σ max 2 4 E G c π l 0 σ max 2
a 2 −0.51.3868
a 3 00.6567
Note: E is Young’s modulus, σ max is the material strength.
Table 2. Fitting parameters n , k and x i for h new at different l i .
l i n k x i
0.10.00014.4690.596
0.50.00014.4691.192
1.00.00014.4691.788
1.50.00014.4692.384
2.00.00014.4692.979
Table 3. Properties of HiPerComp SiC fiber, SiC matrix, and h-BN interface [43,58].
Material PropertySiC FiberSiC Matrixh-BN Interface
Young’s modulus E 380   GPa 360   GPa 10 / 360 800   GPa
Poisson’s ratio υ 0.185 0.185 0.005 / 0.18
Critical energy release rate G c 17   J / m 2 8   J / m 2 1.7 / 5 131   J / m 2
Fracture strength σ max 2600   MPa 800   MPa 75 / 800   MPa
Table 4. Fiber volume, porosity and density of hot-pressed SiCf/SiCm composites with various interface conditions [59].
Fiber Volume ( % )Open Porosity ( % )Density ( g / cm 3 )
Uncoated 55 1.6 3.15
CVD-0.50 48 3.3 3.01
CVD-1.00 46 6.9 2.84
Table 5. Properties of TyrannoTM-SA grade-3 polycrystalline SiC fiber, SiC matrix, and PyC interface.
Material PropertySiC Fiber [59,61]SiC Matrix [62]PyC Interface [63,64]
Young’s modulus E 409   GPa 400   GPa 30   GPa
Poisson’s ratio υ 0.185 0.2 0.4
Critical energy release rate G c 17.823   J / m 2 20   J / m 2 2.5   J / m 2
Fracture strength σ max 2510   MPa 700   MPa 119   MPa
Table 6. The real mechanical properties of SiCf/SiCm composites under different interface conditions and the predicted flexural strength by numerical simulation.
Real PyC Thickness ( nm )Simulation PyC Thickness ( nm )Experimental Flexural Strength ( MPa )Simulation Flexural Strength ( MPa )The Relative Error Compared to the Central Value of the Experiment ( % )
Uncoated 0 0 1145 ± 50 1040.38 9.14
CVD-0.50 100 250 500 600 ± 26 460.81 23.20
CVD-1.00 450 600 1000 409 ± 60 359.31 12.15
Disclaimer/Publisher’s Note: The statements, opinions and data contained in all publications are solely those of the individual author(s) and contributor(s) and not of MDPI and/or the editor(s). MDPI and/or the editor(s) disclaim responsibility for any injury to people or property resulting from any ideas, methods, instructions or products referred to in the content.