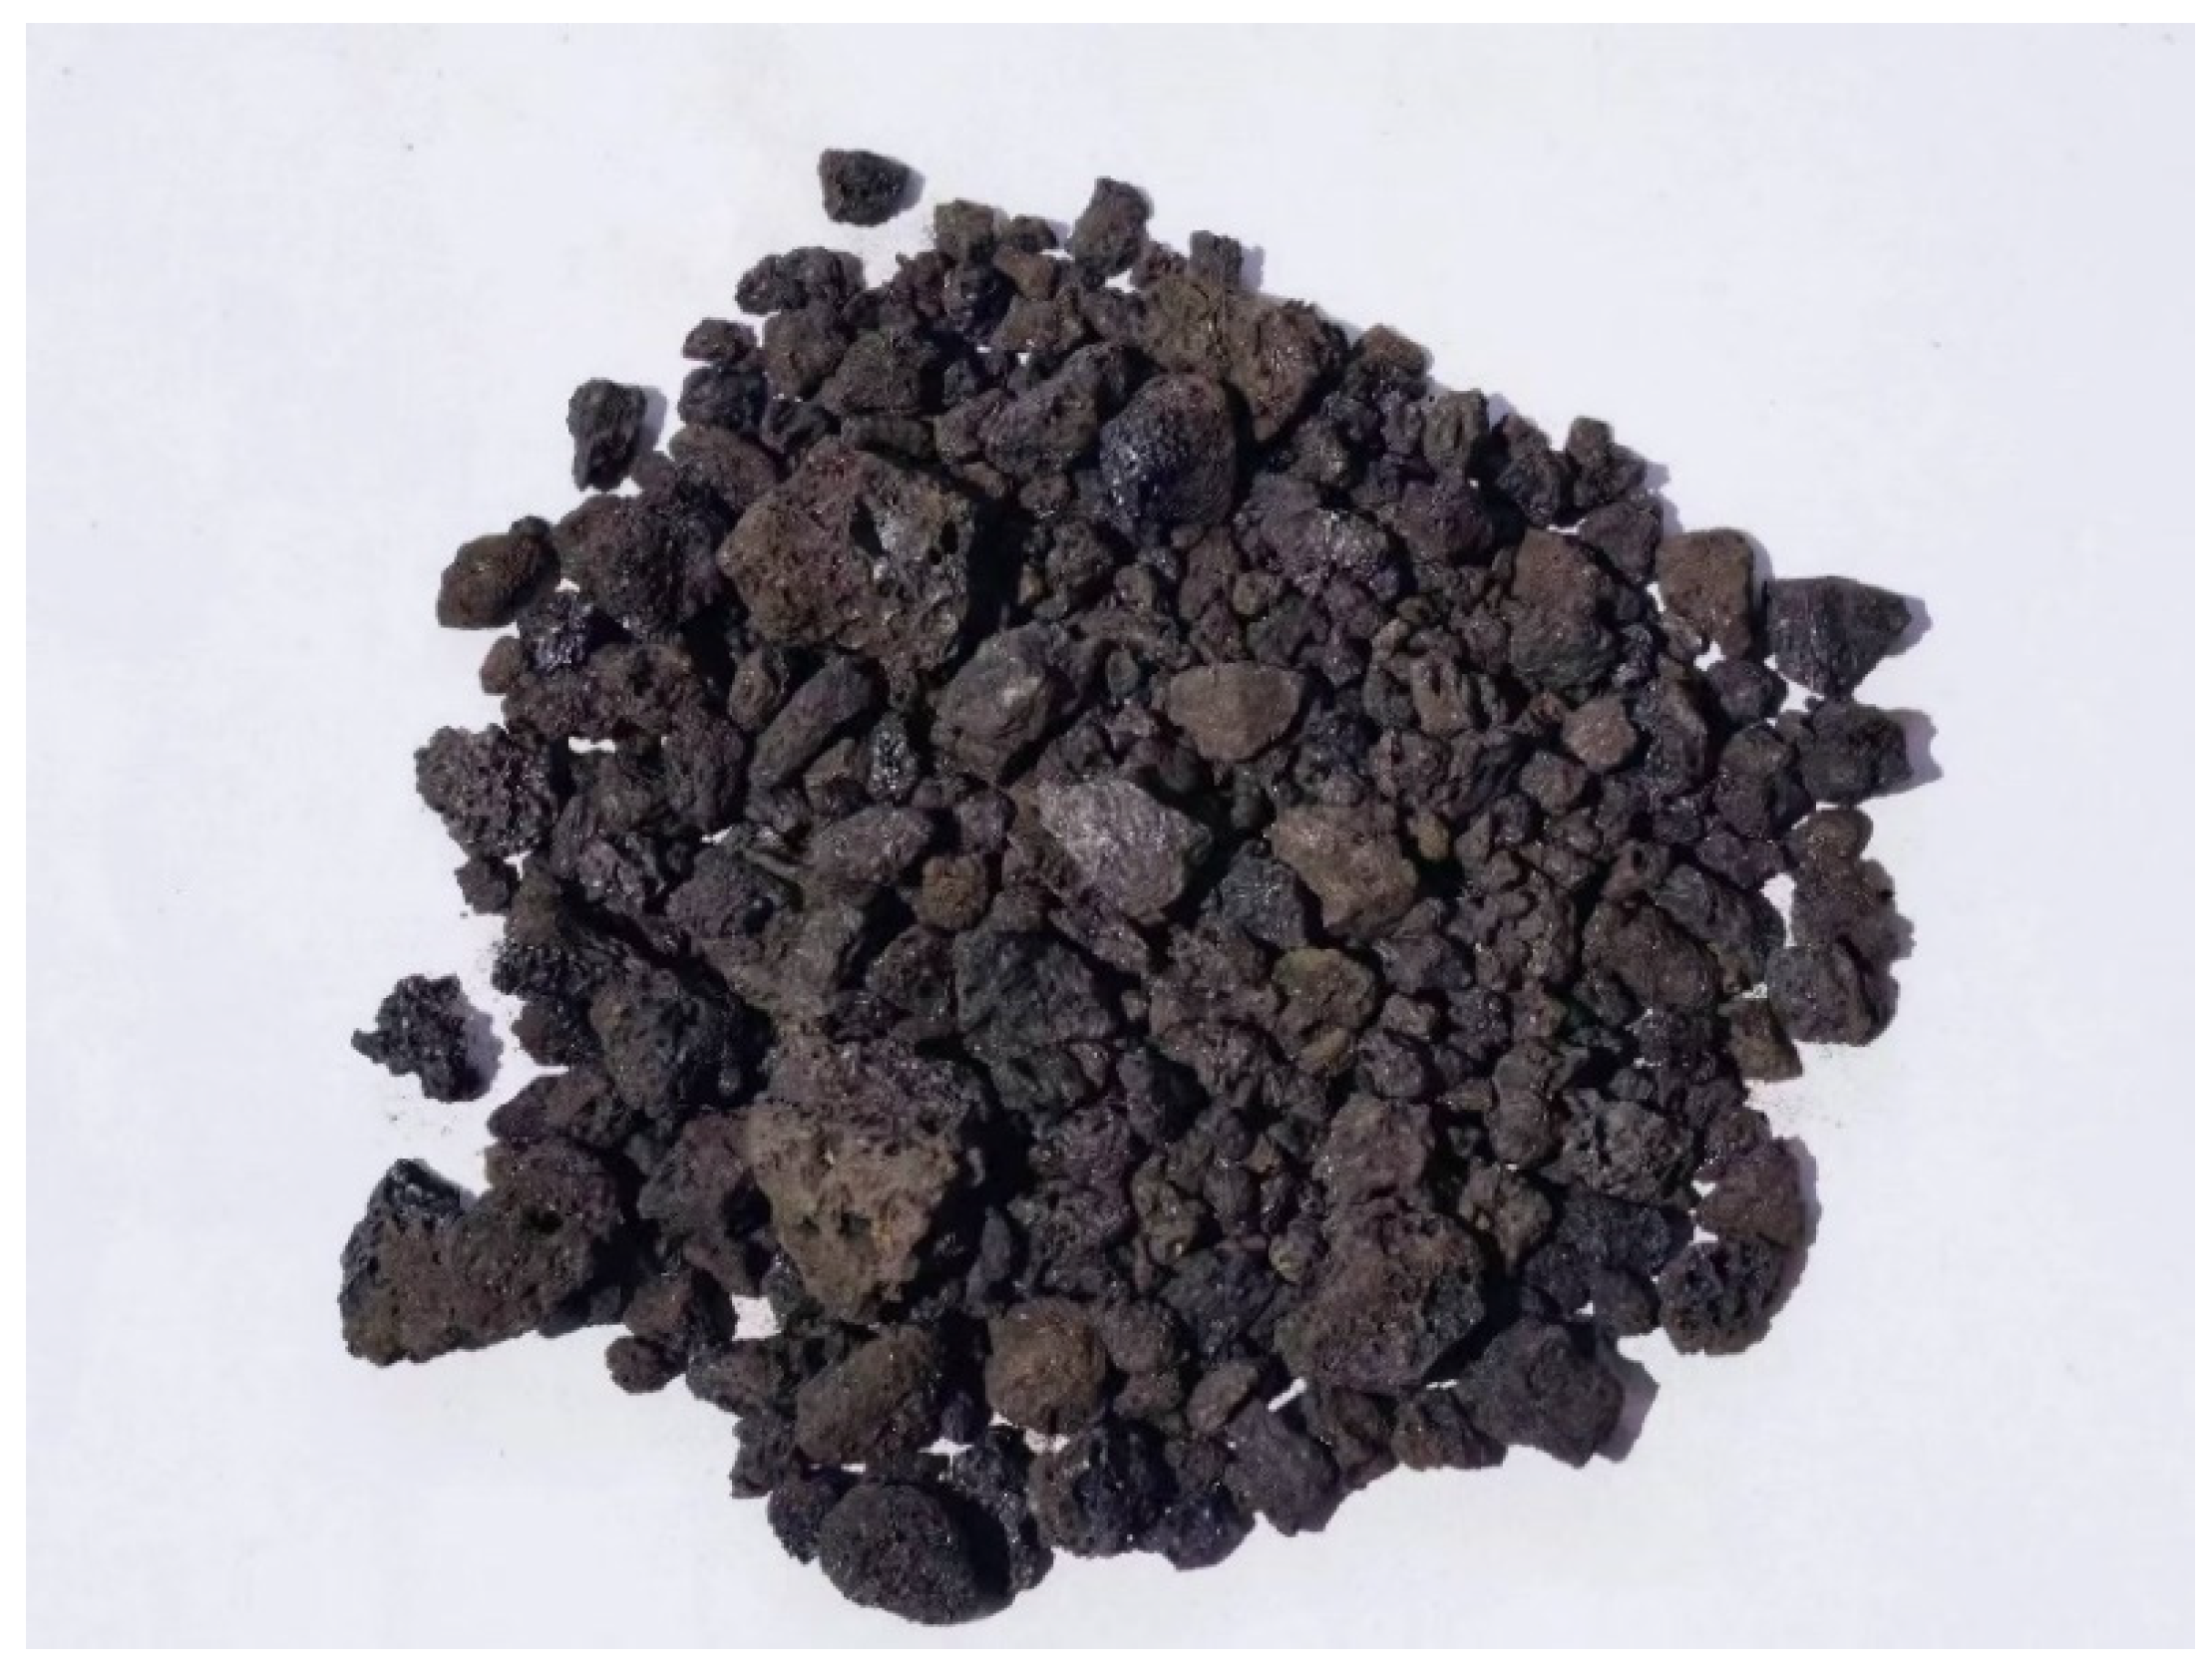
Figure 1.
Volcanic slag raw materials.
Figure 1.
Volcanic slag raw materials.
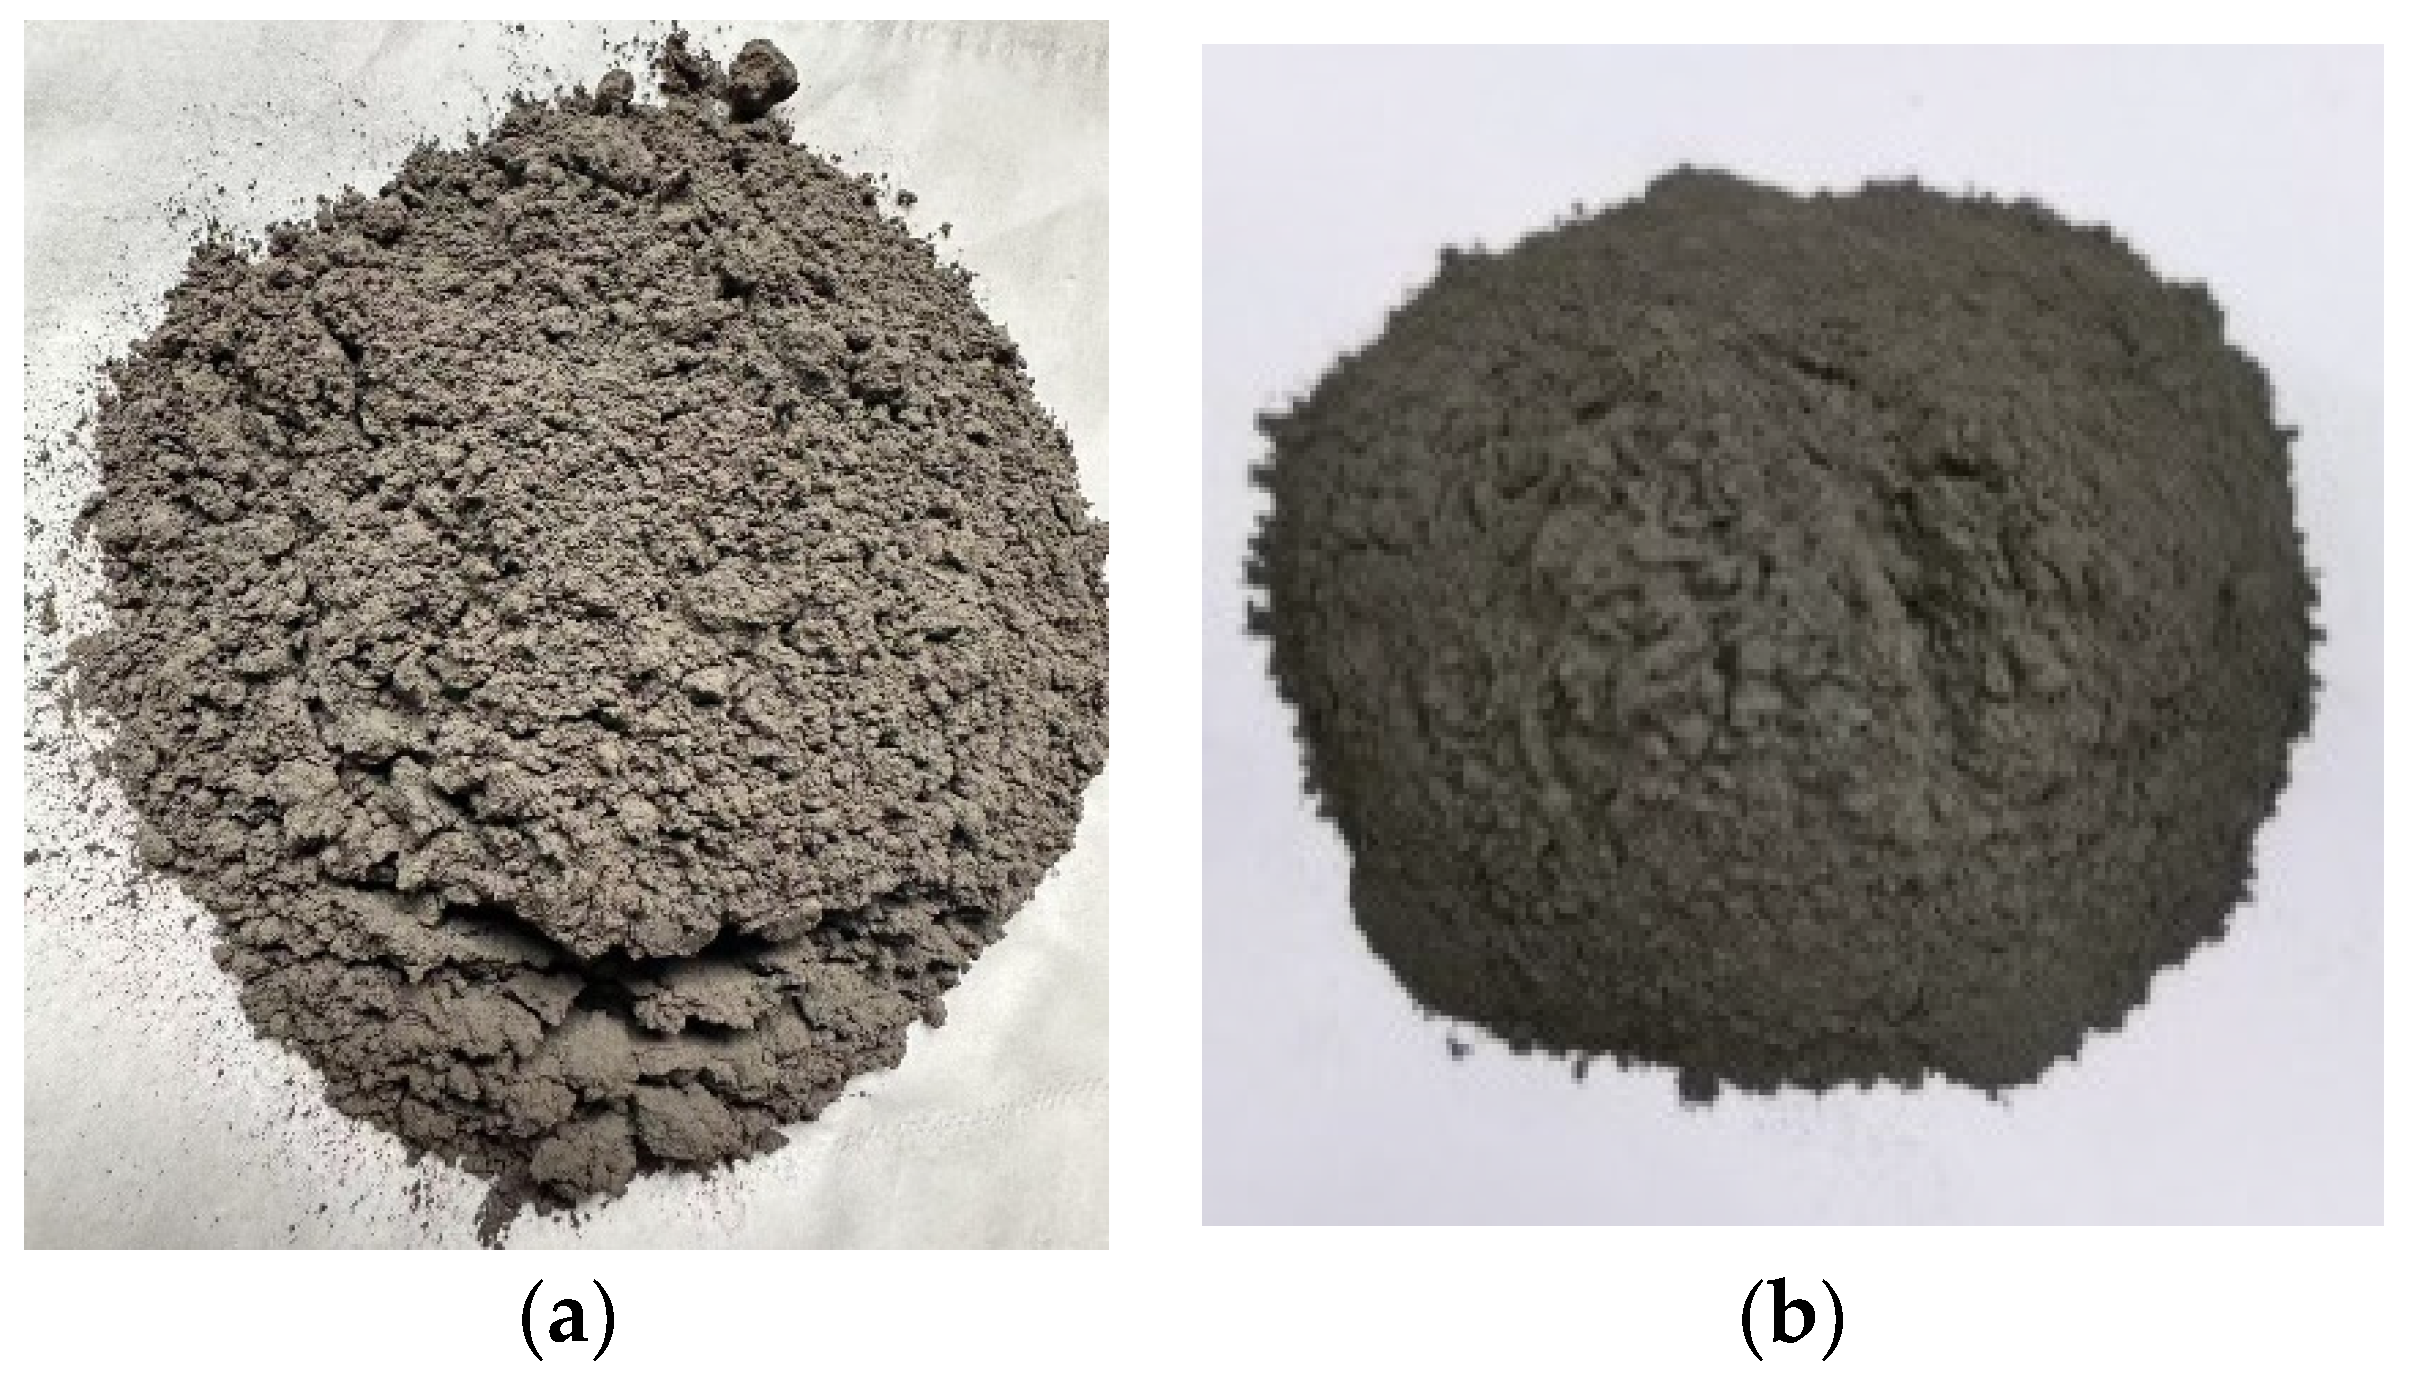
Figure 2.
Comparison of lunar regolith simulants (
a) CQU-1 and (
b) HUST-1 [
9].
Figure 2.
Comparison of lunar regolith simulants (
a) CQU-1 and (
b) HUST-1 [
9].
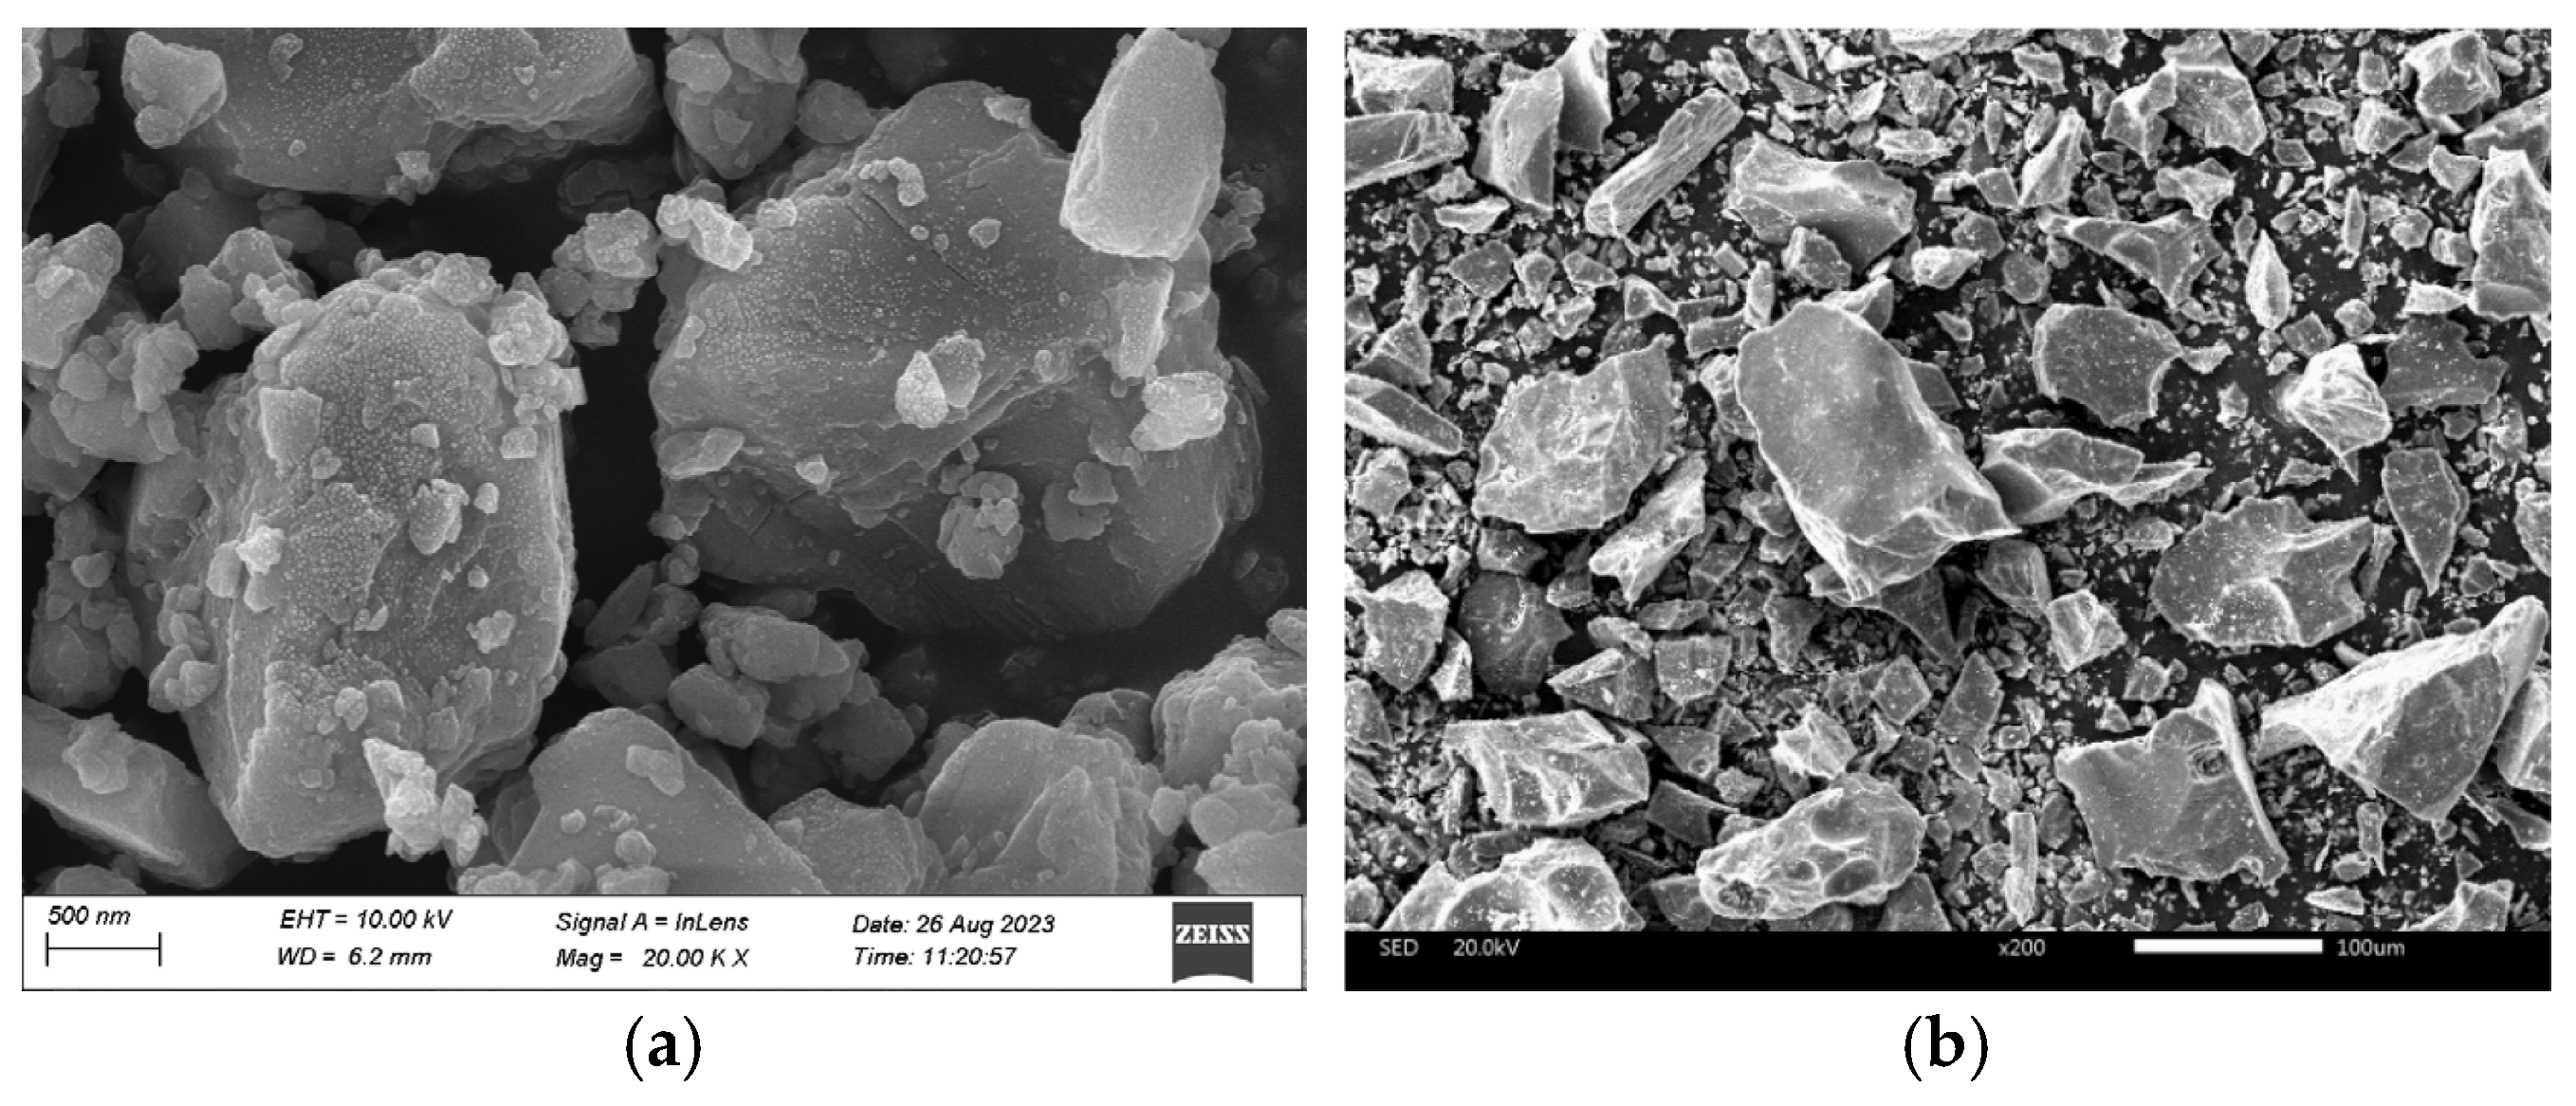
Figure 3.
Microscopic comparison of lunar regolith simulants (
a) CQU-1 and (
b) HUST-1 [
9].
Figure 3.
Microscopic comparison of lunar regolith simulants (
a) CQU-1 and (
b) HUST-1 [
9].
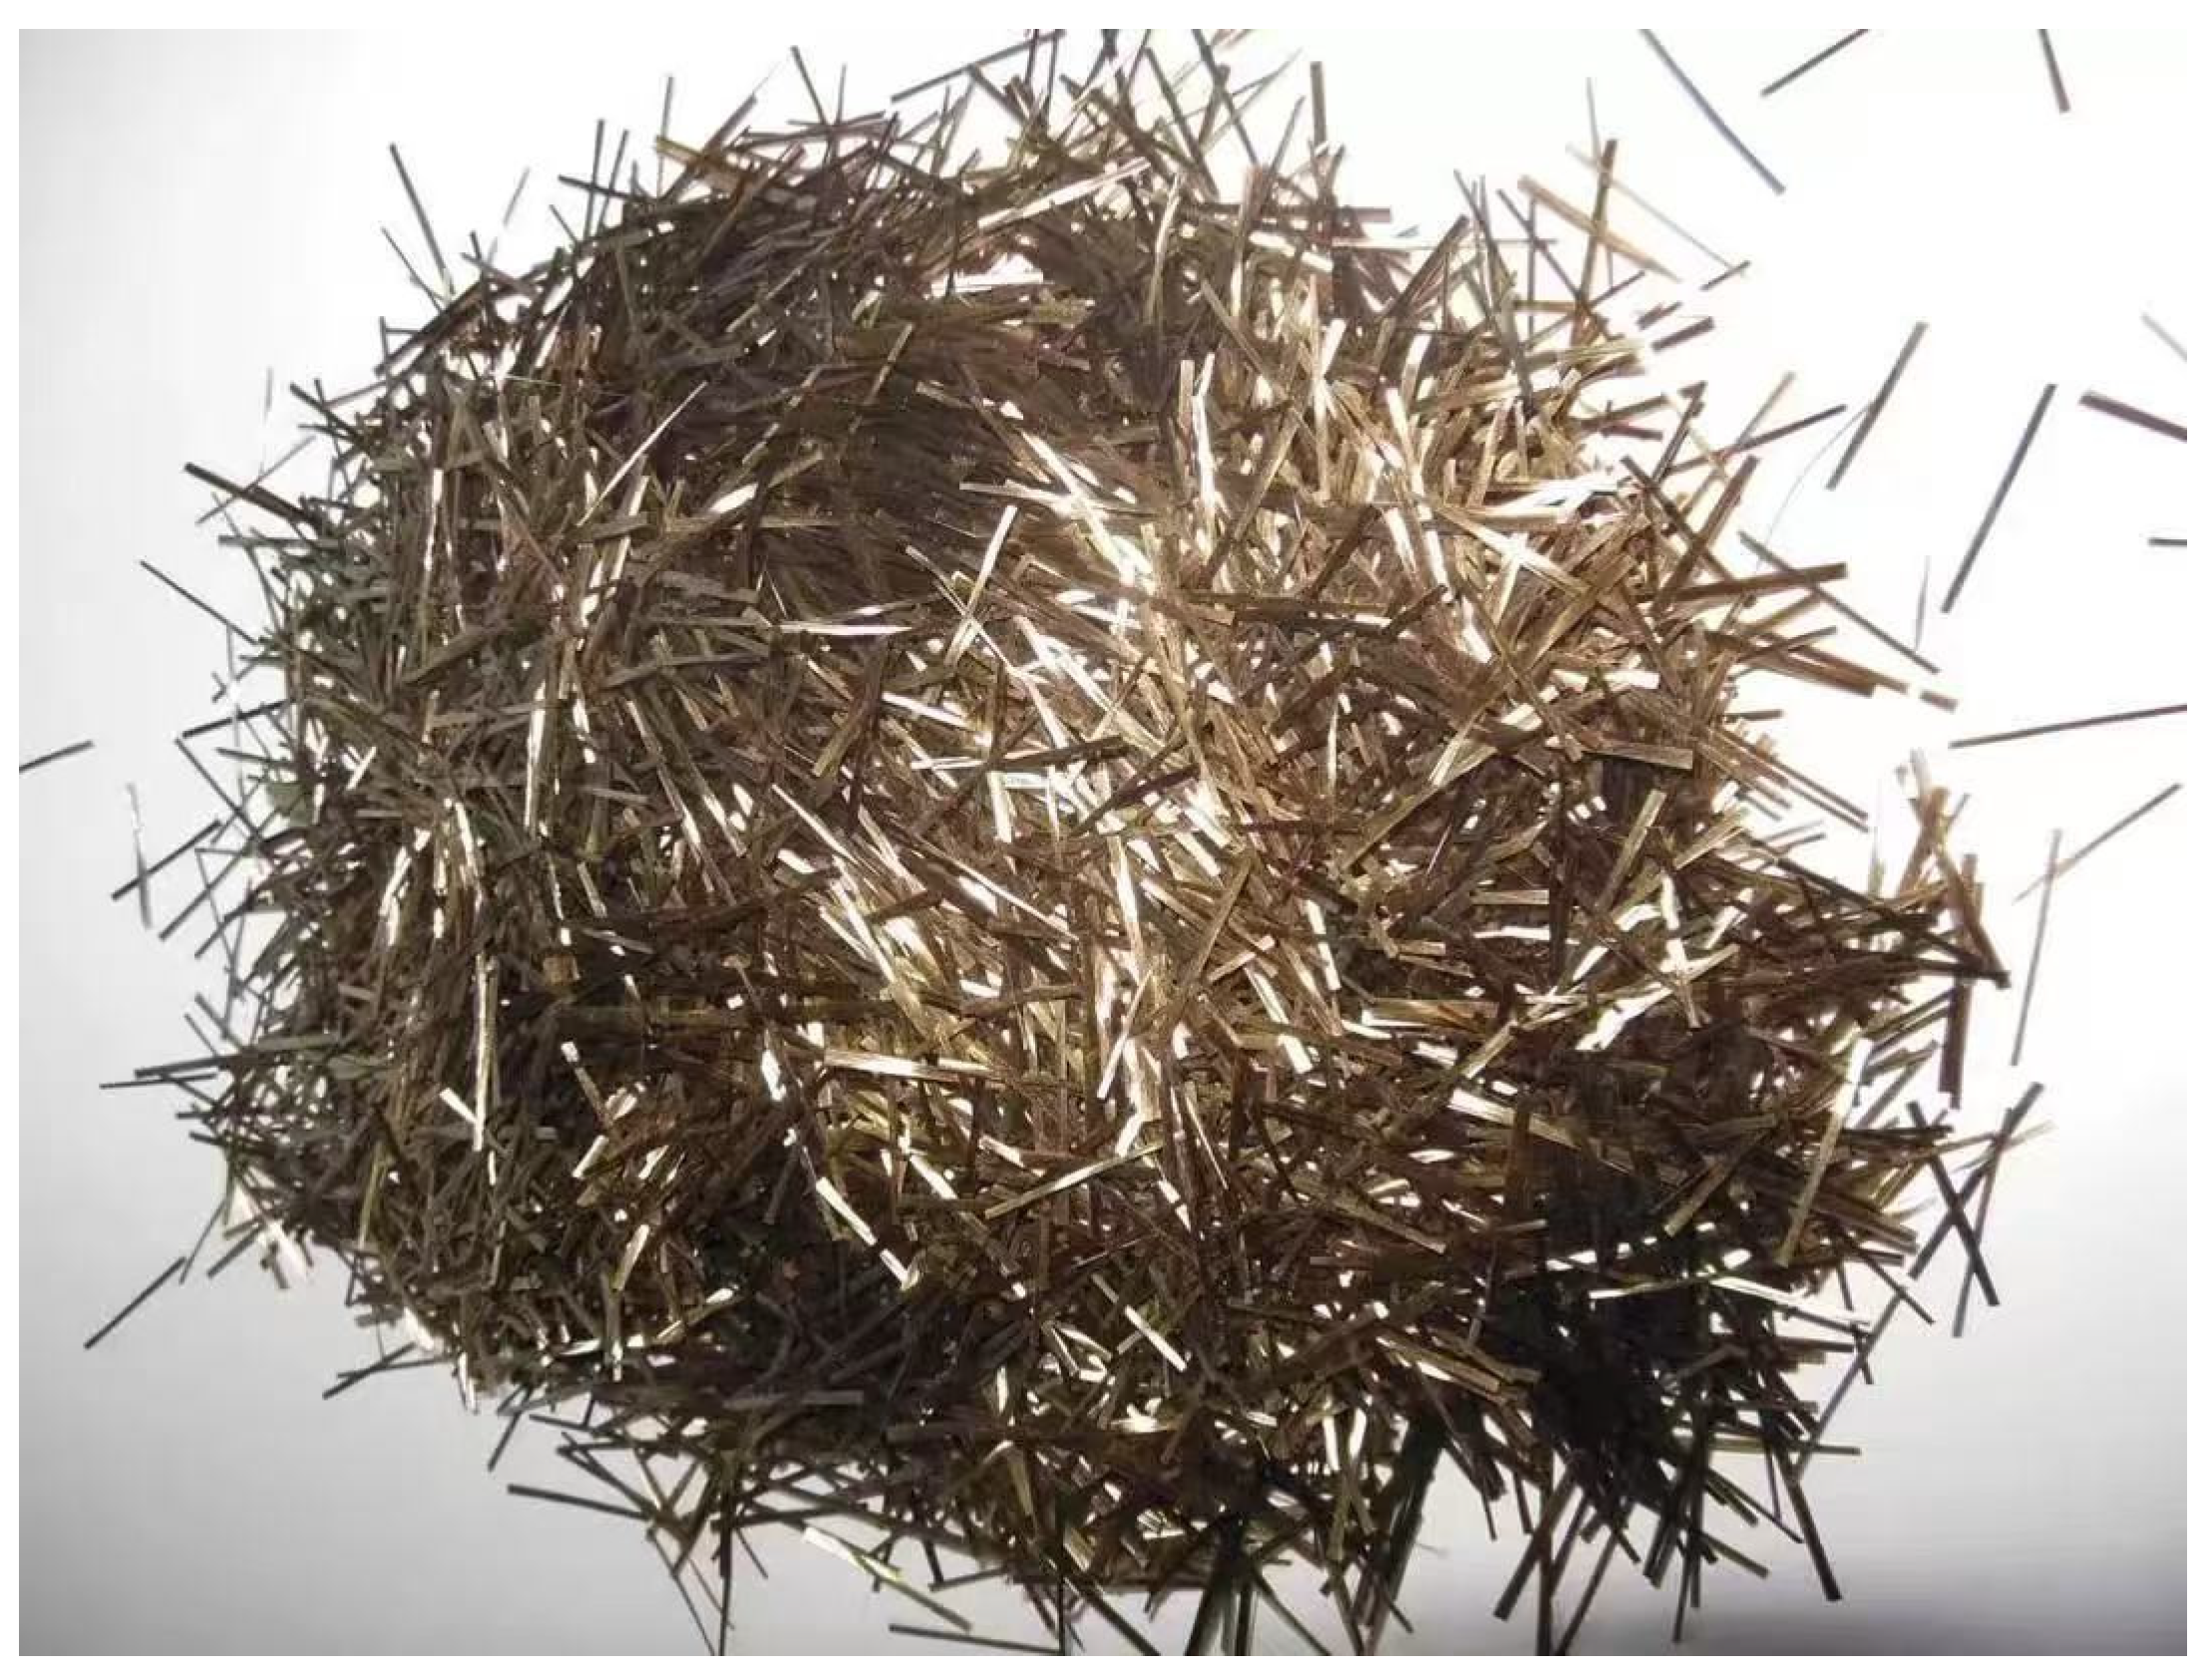
Figure 5.
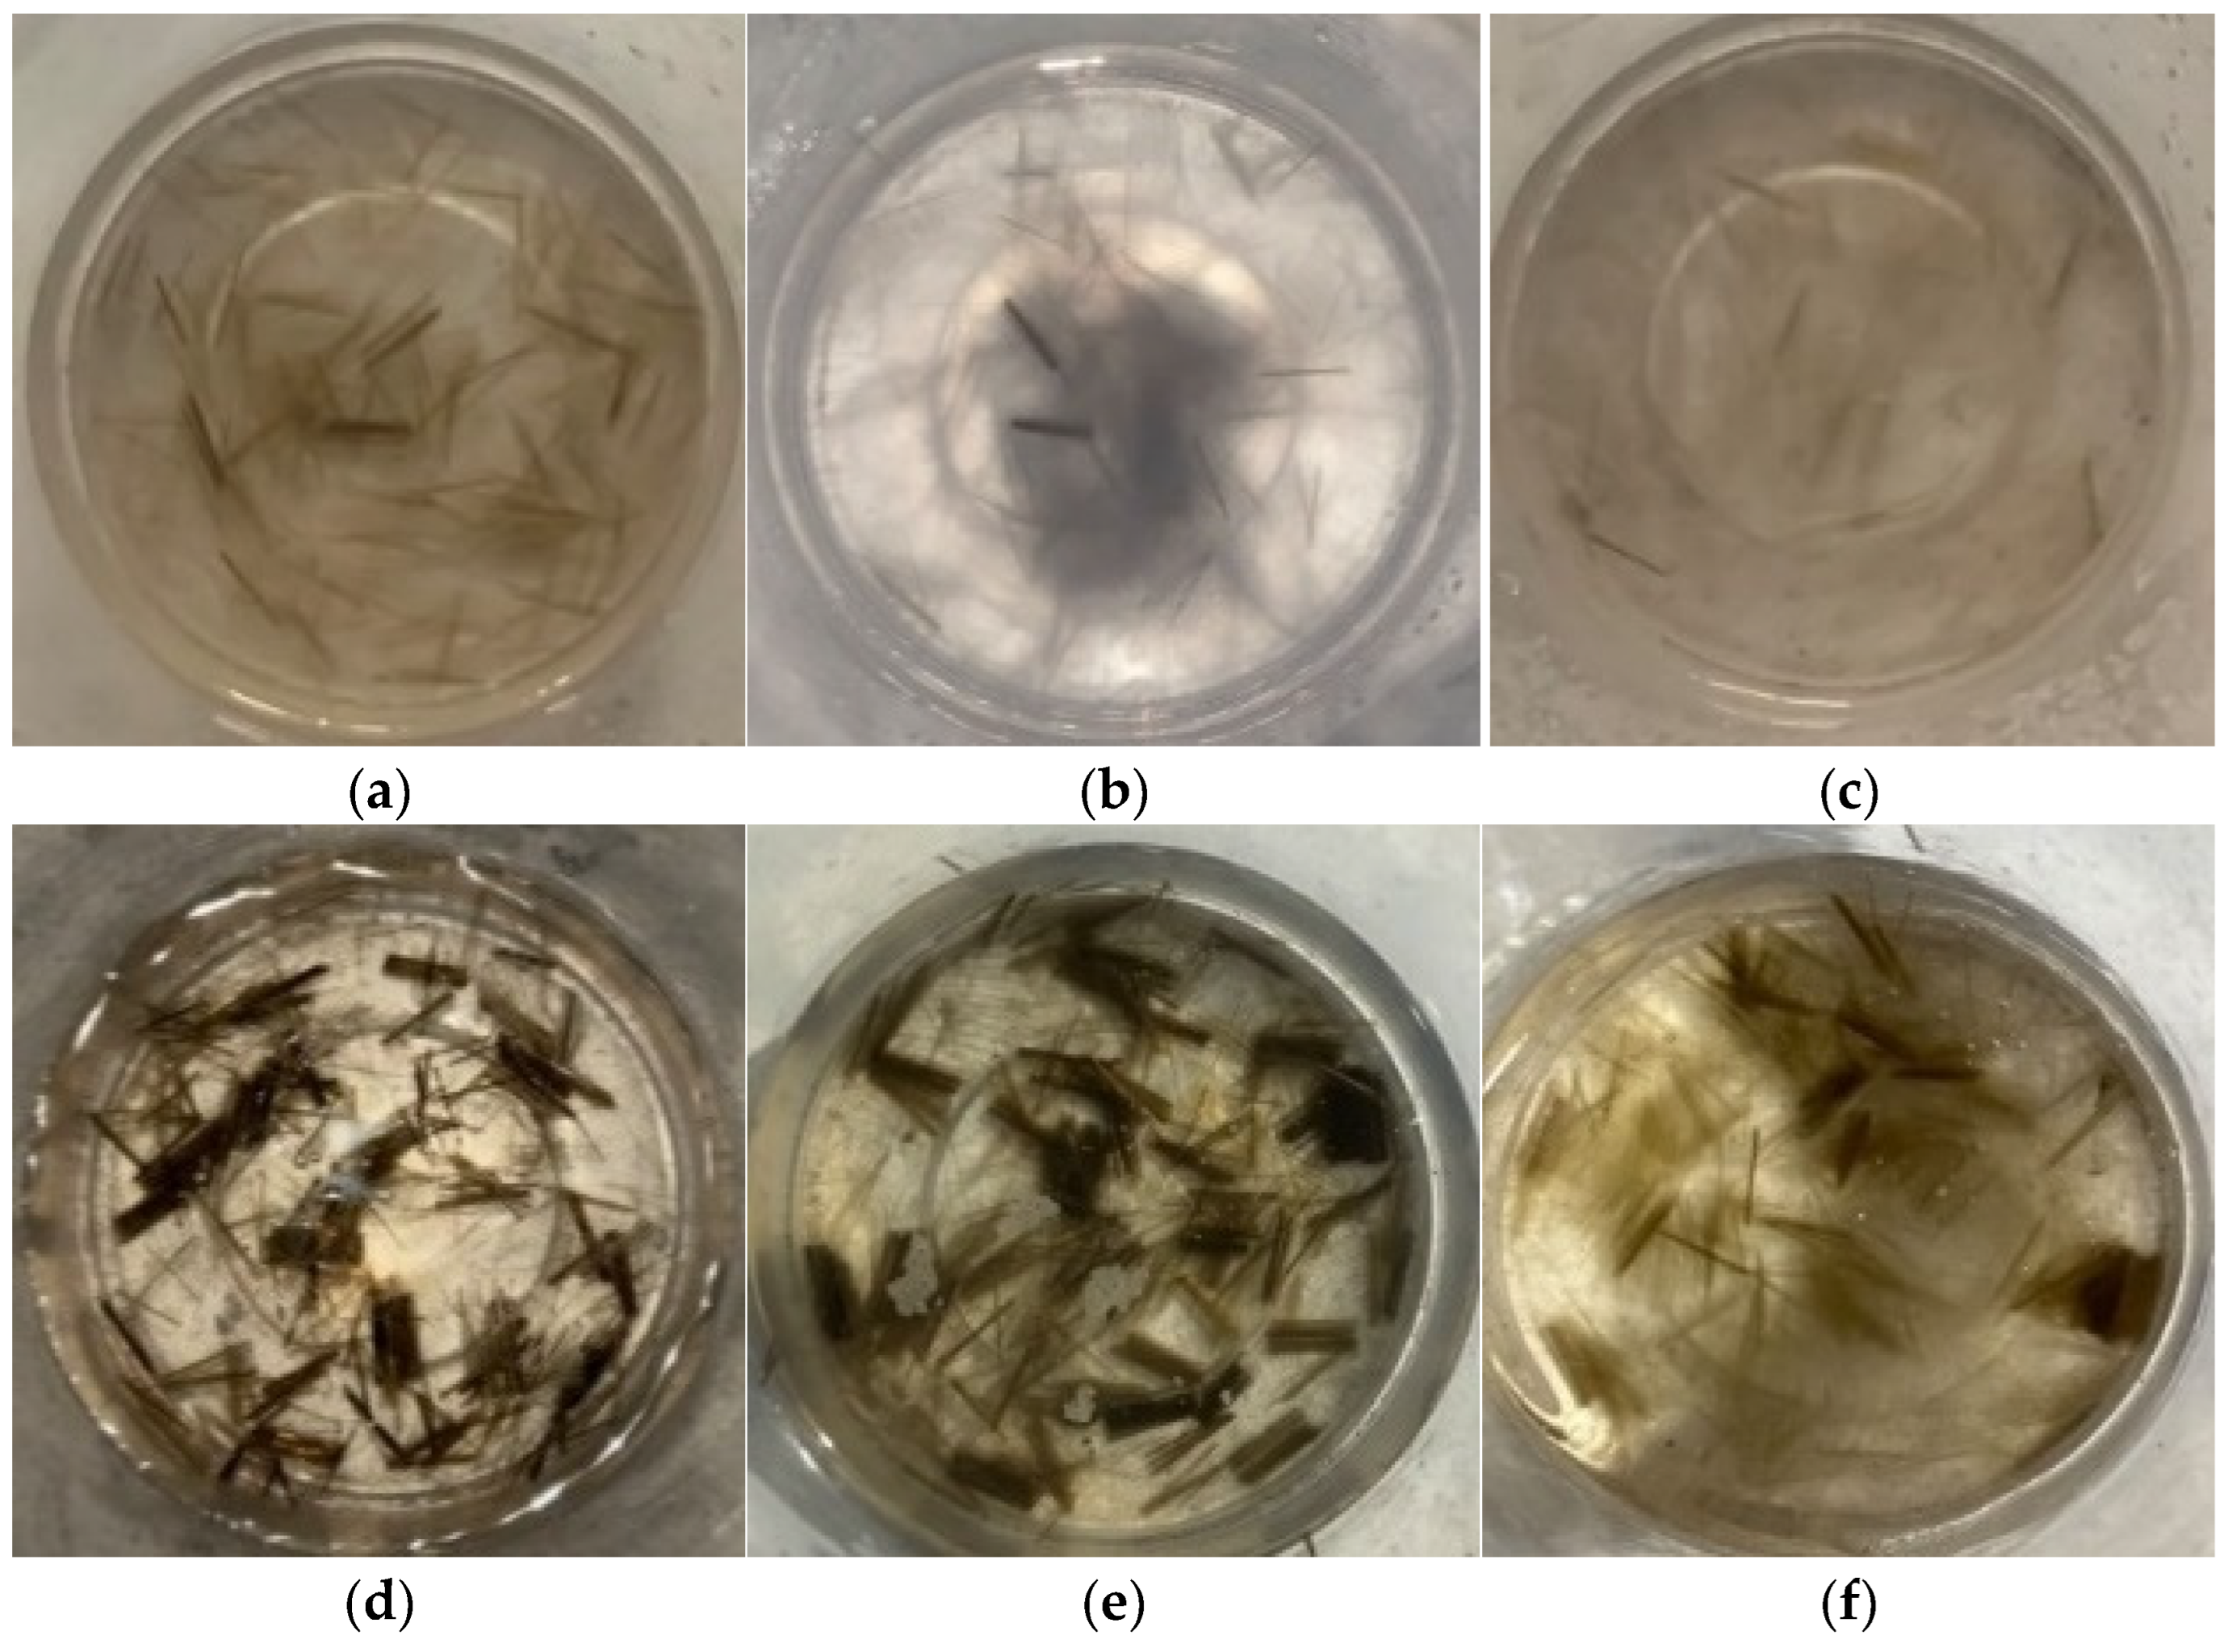
Basalt fibers in strong and weak alkaline solution environments. (a) As a cured state under strong alkali activation with standard curing. (b) 1 d of standard curing under strong alkali activation. (c) 7 d of high-temperature curing at 80 °C under strong alkali activation. (d) As a cured state under weak alkali activation with standard curing. (e) 1 d of standard curing under weak alkali activation. (f) 7 d of high-temperature curing at 80 °C under weak alkali activation.
Figure 6.
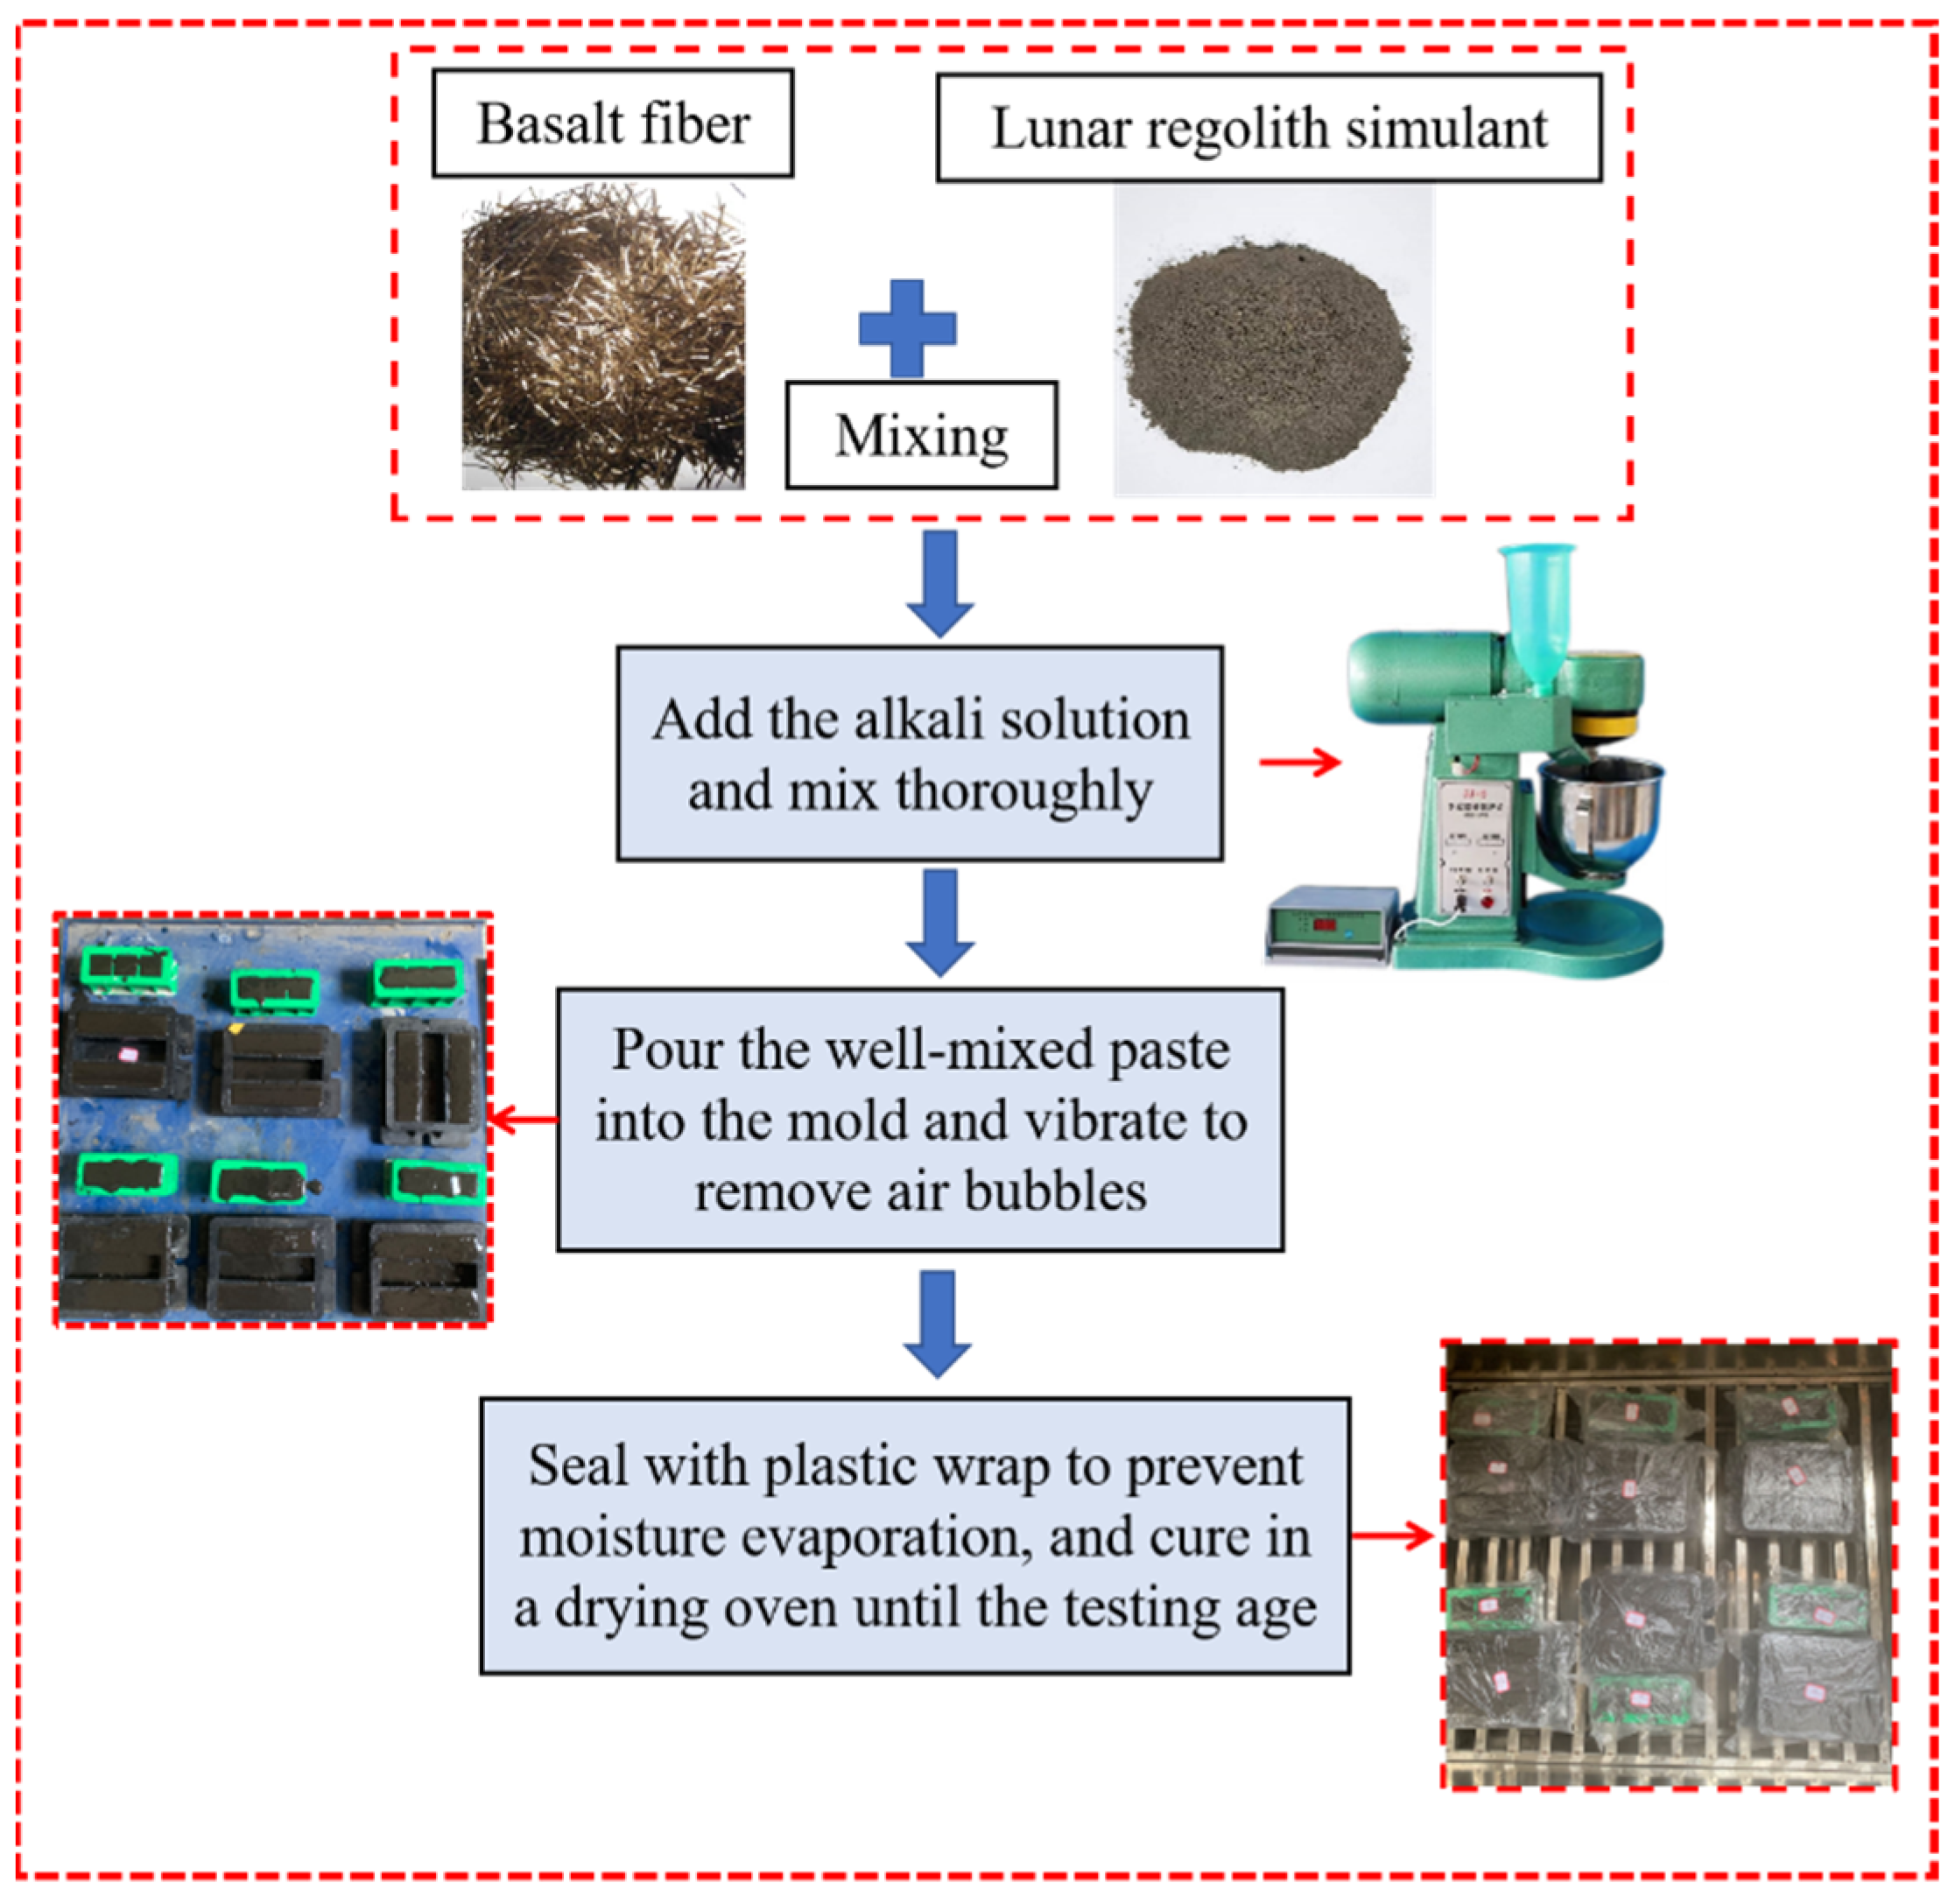
Test procedure.
Figure 6.
Test procedure.
Figure 7.
LRS geopolymers cured by strong alkali at 20 °C room temperature for 1 d.
Figure 7.
LRS geopolymers cured by strong alkali at 20 °C room temperature for 1 d.
Figure 8.
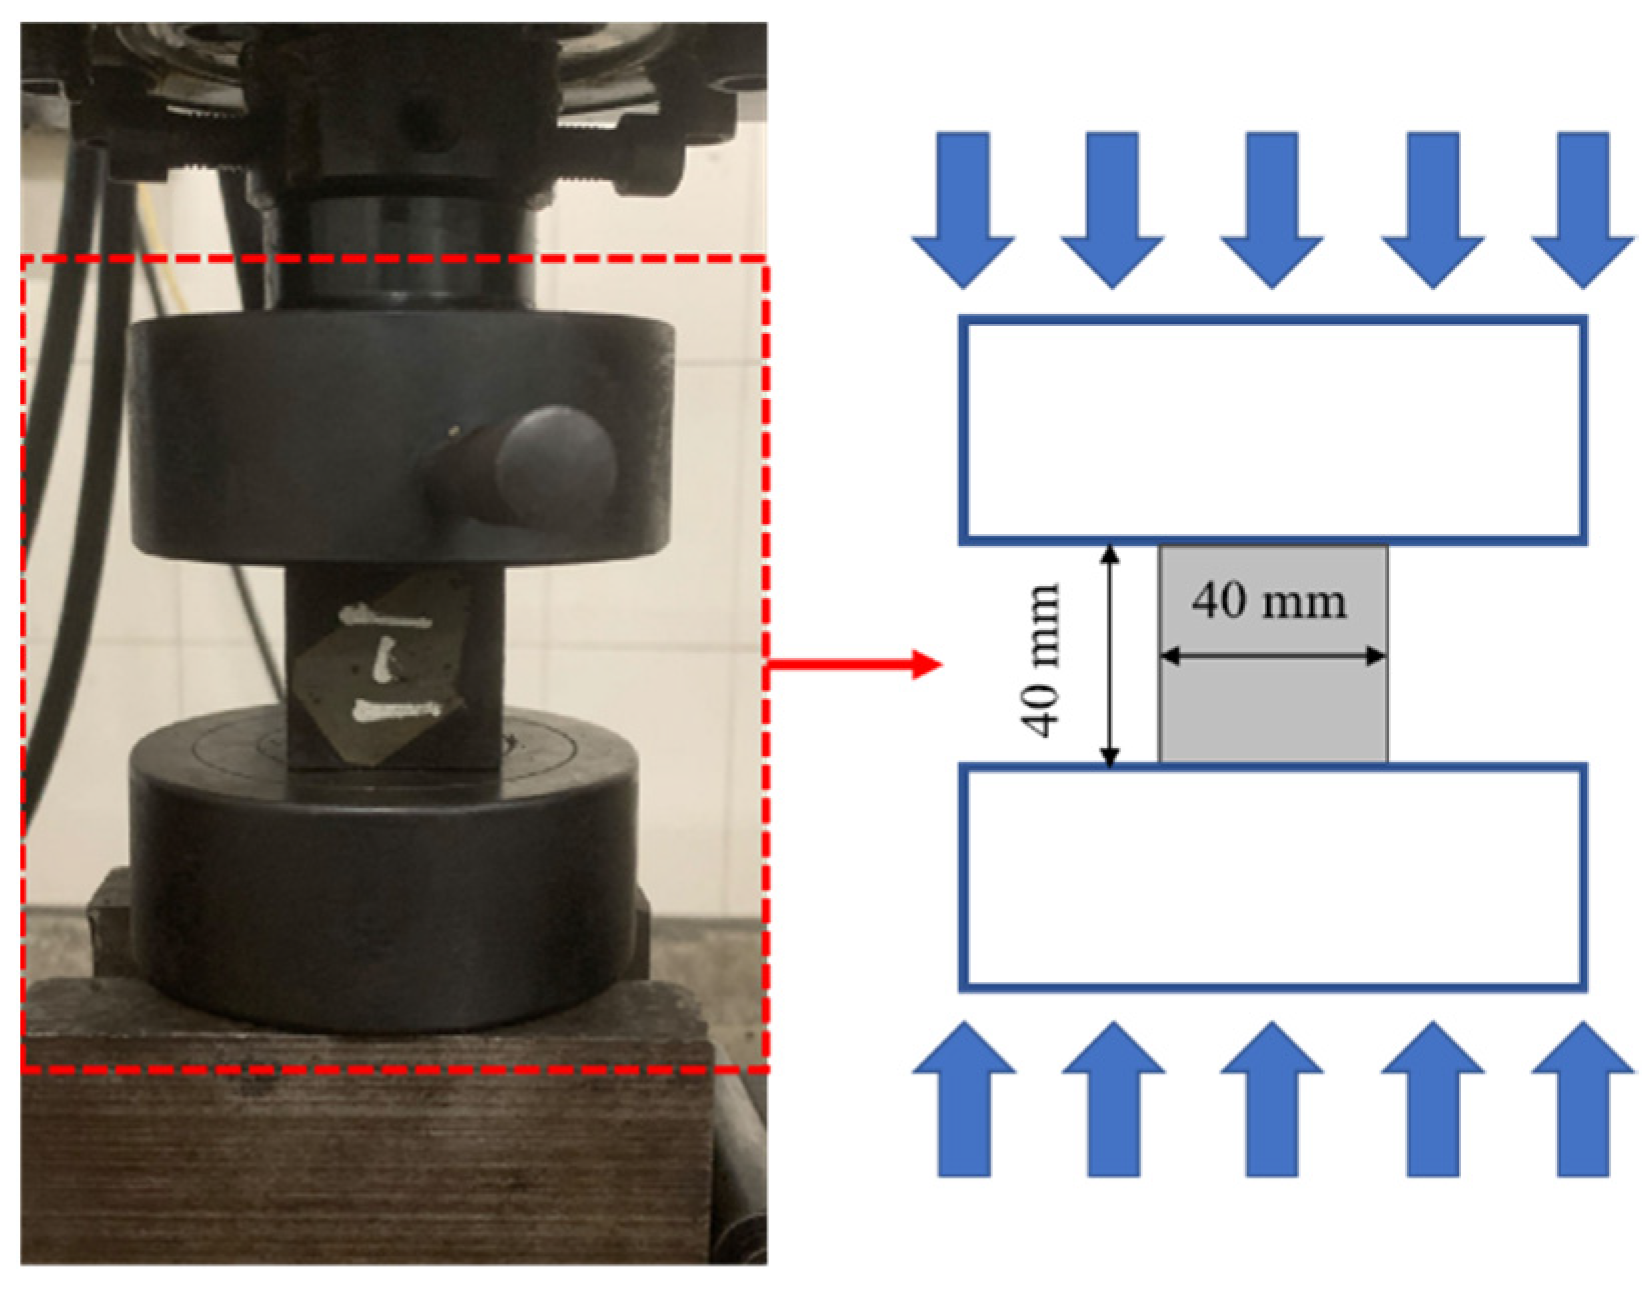
Compressive strength test.
Figure 8.
Compressive strength test.
Figure 9.
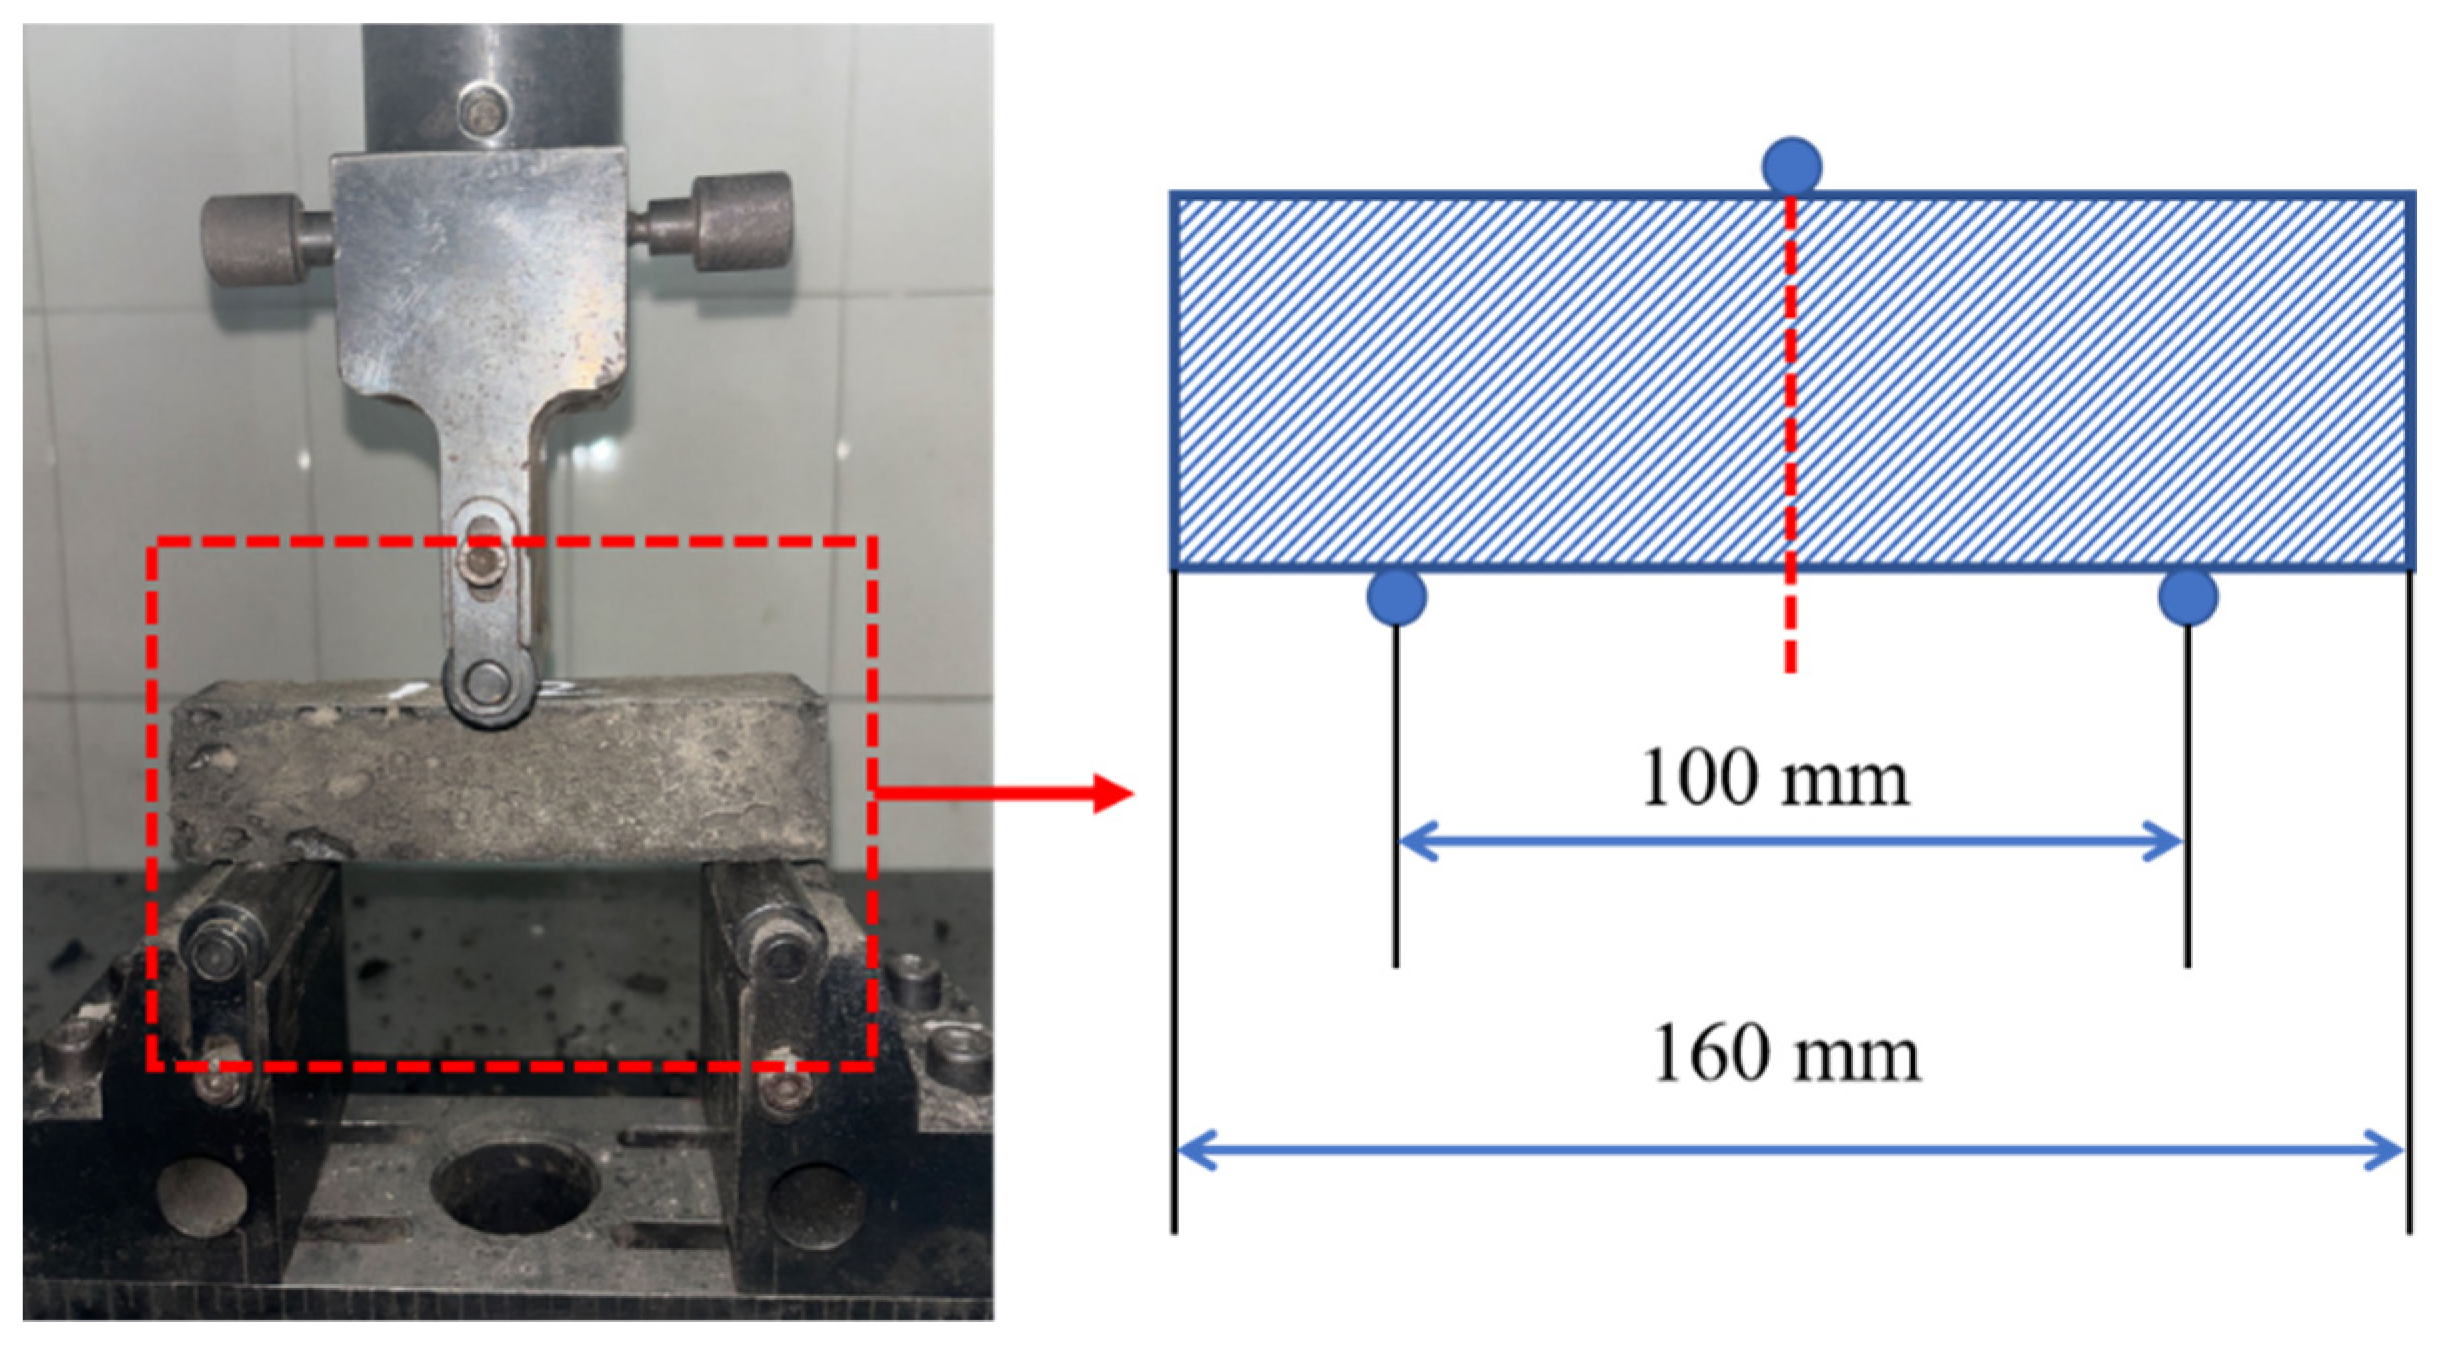
Flexural strength test.
Figure 9.
Flexural strength test.
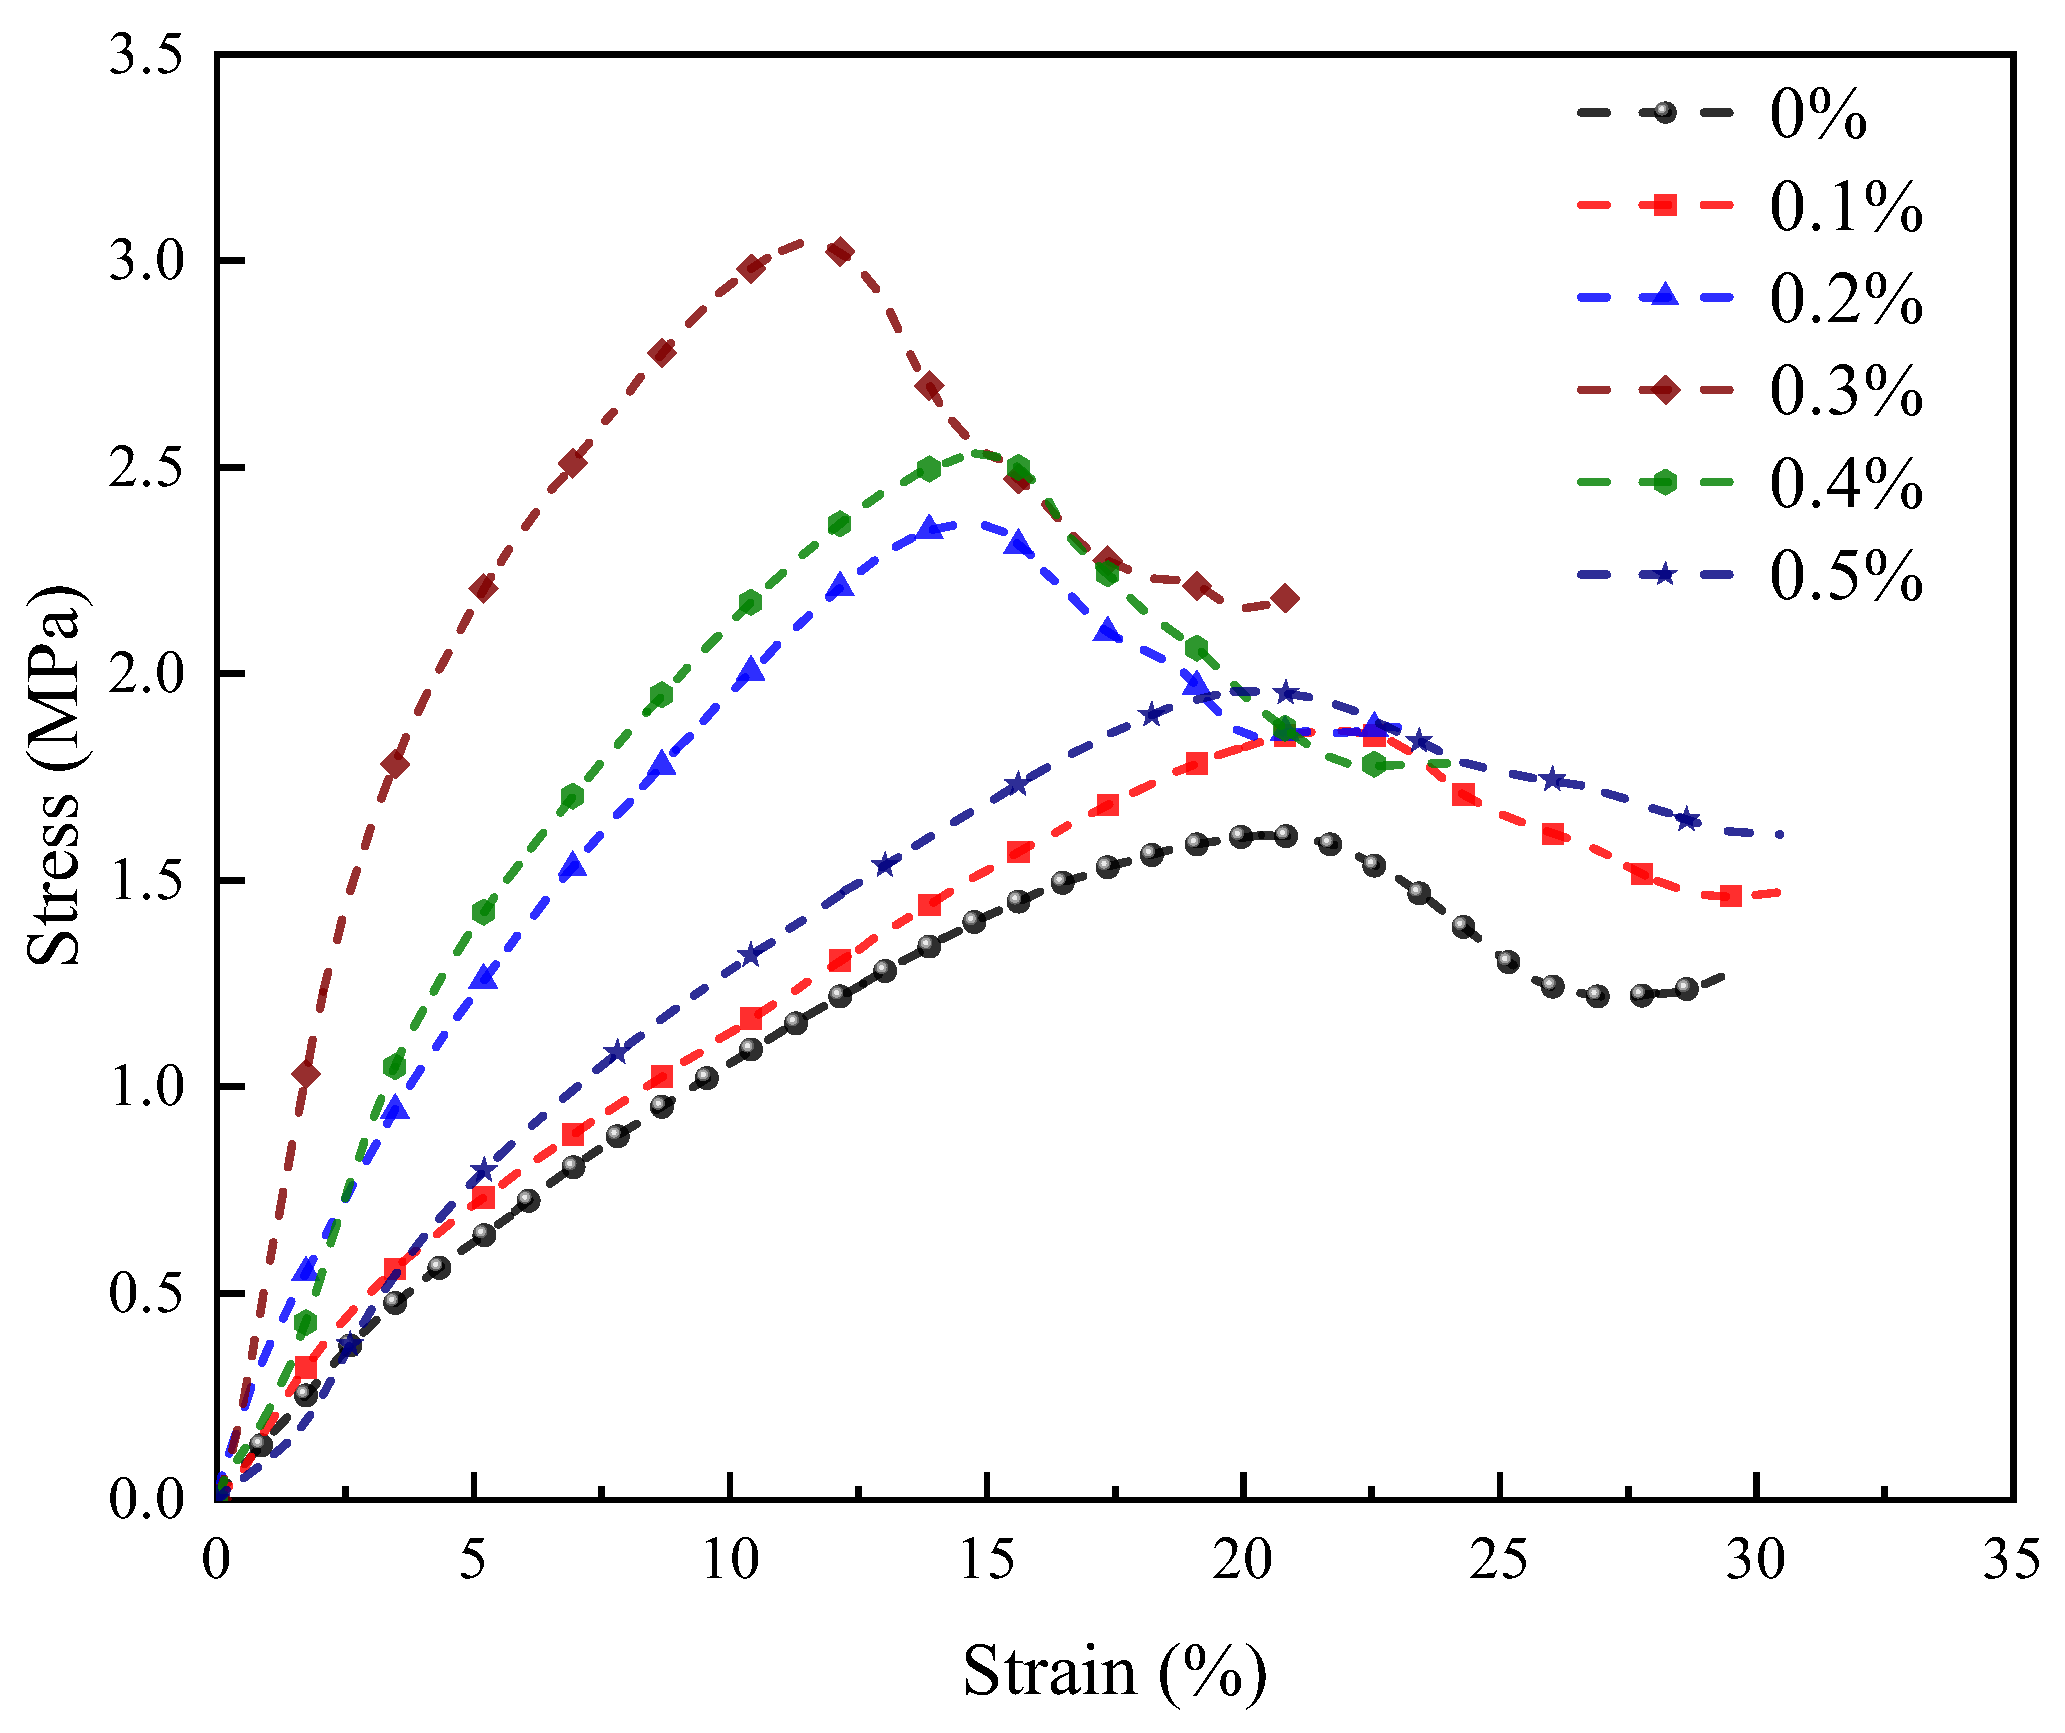
Figure 10.
Stress-strain curves of LRS geopolymers with different fiber contents under strong alkali activation and cured at 20 °C for 7 d.
Figure 10.
Stress-strain curves of LRS geopolymers with different fiber contents under strong alkali activation and cured at 20 °C for 7 d.
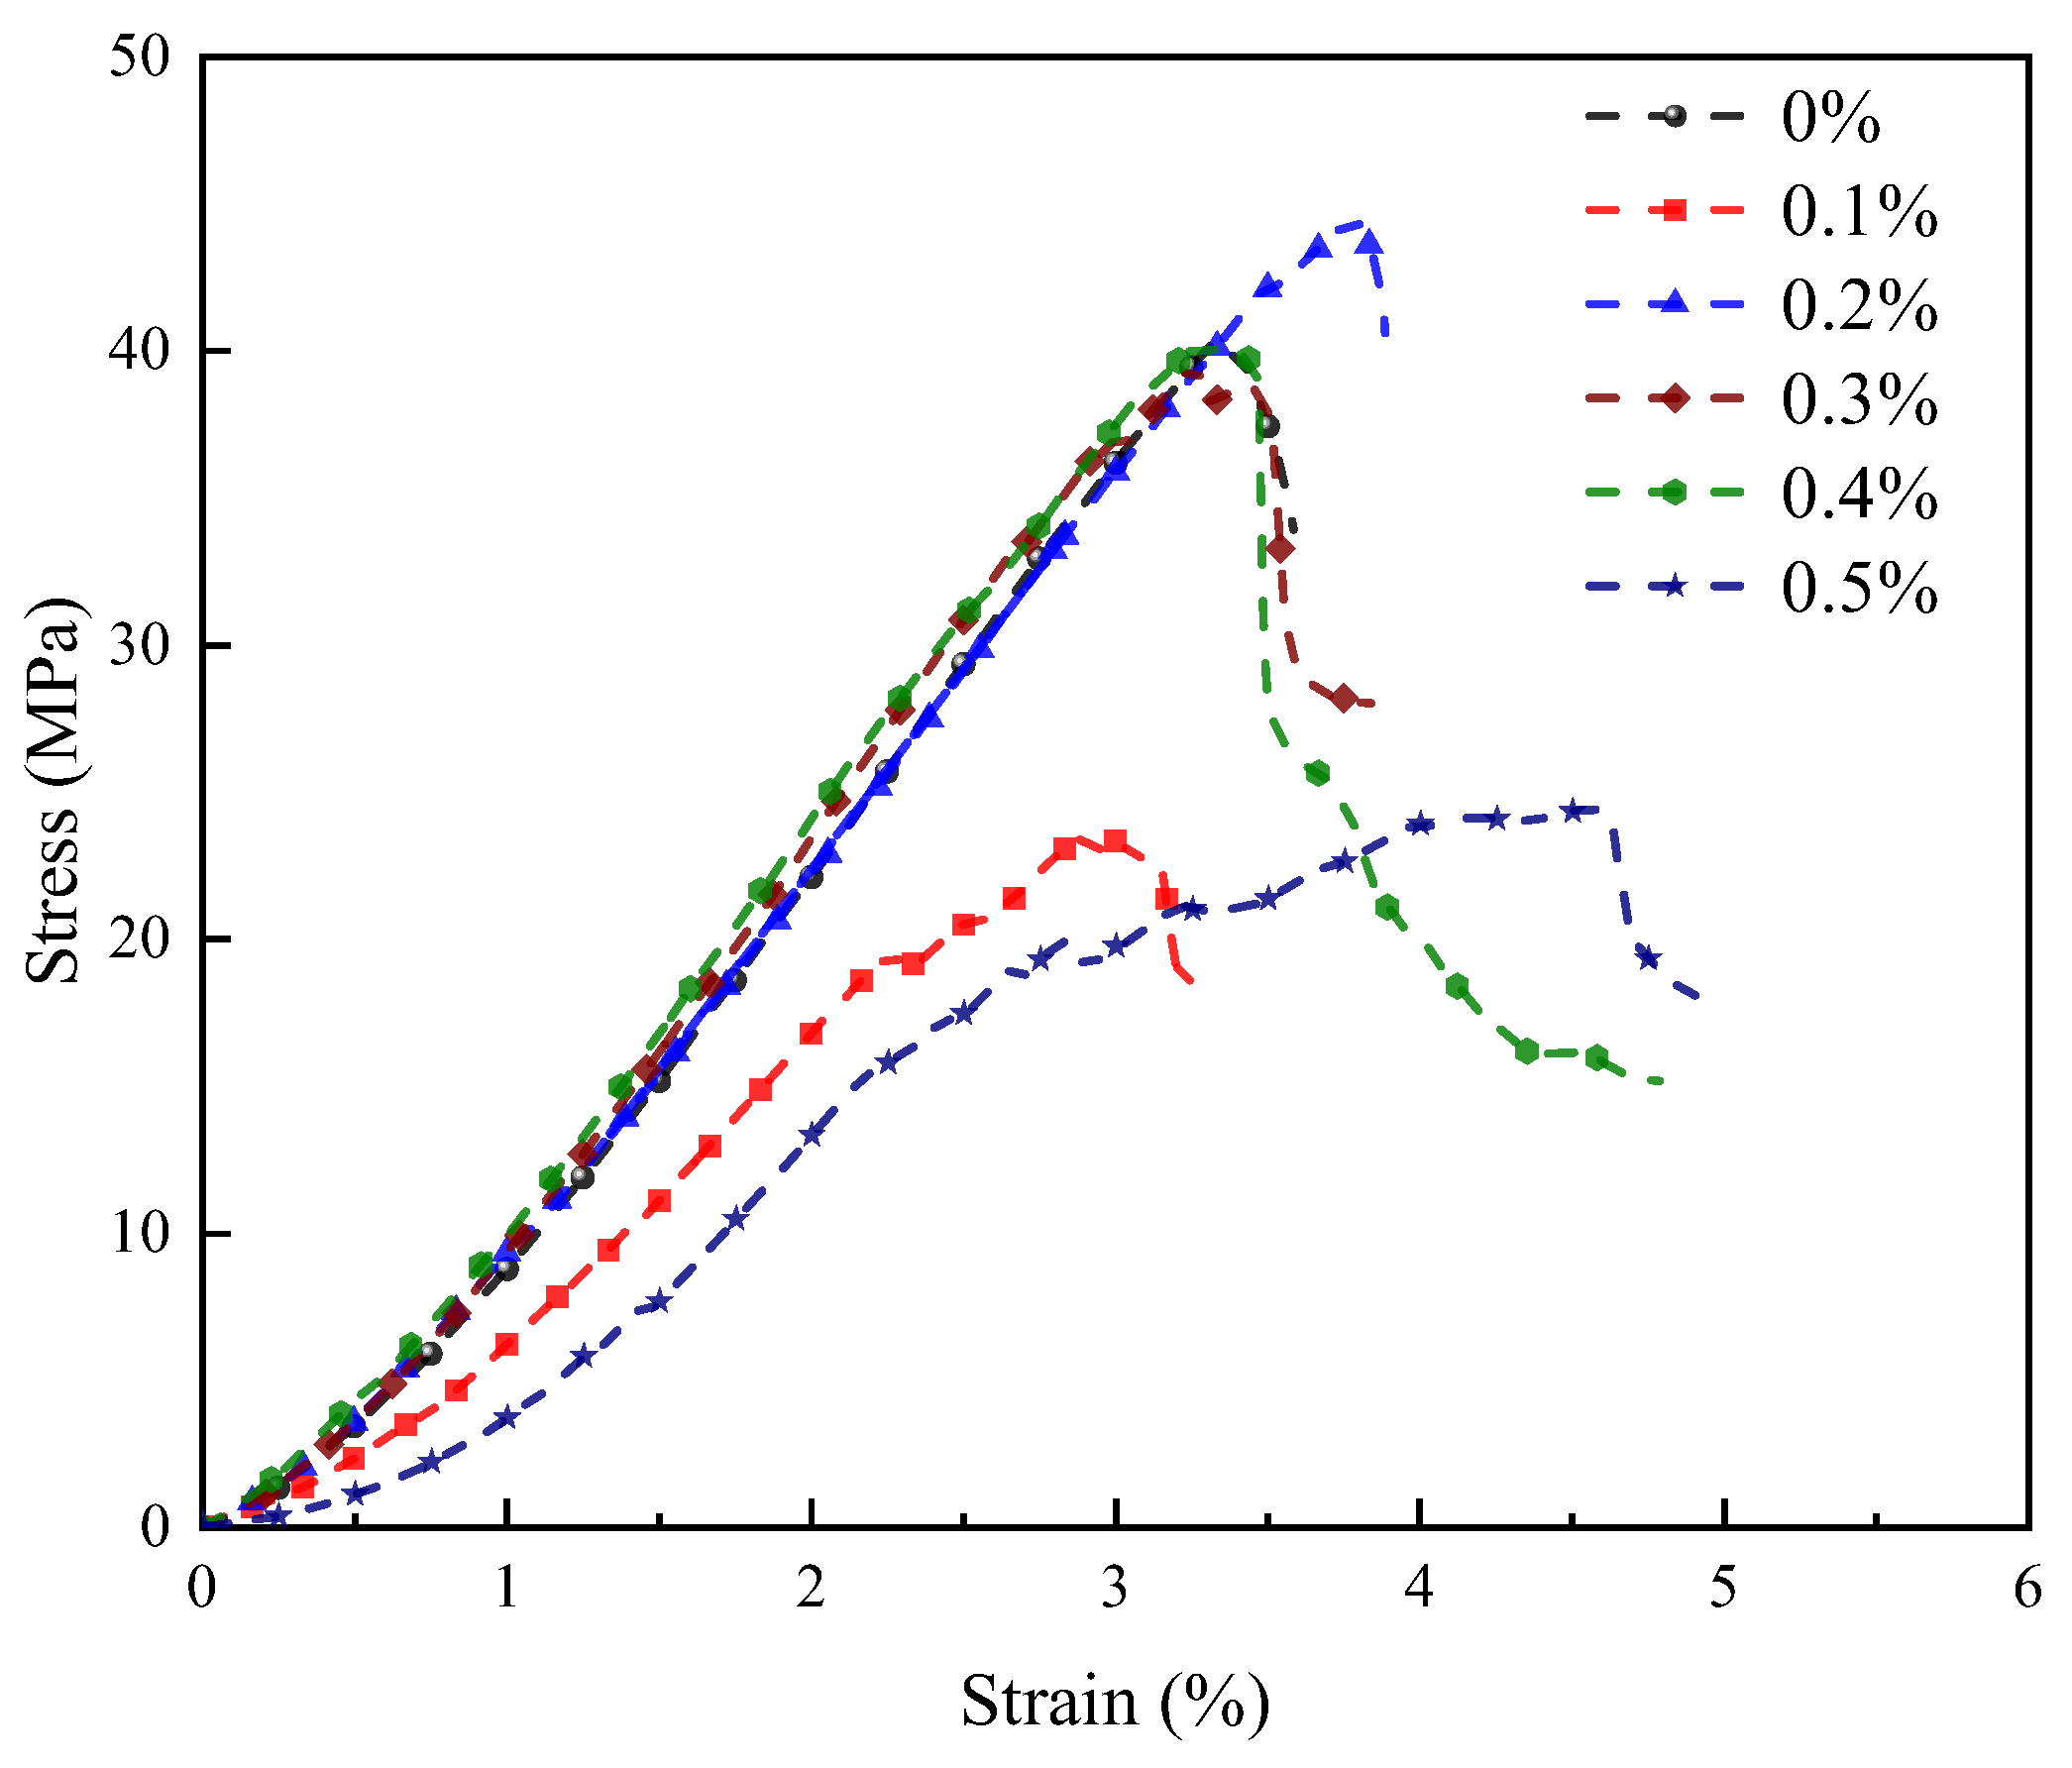
Figure 11.
Stress-strain curves of LRS geopolymers with different fiber contents under strong alkali activation and cured at 80 °C for 1 d.
Figure 11.
Stress-strain curves of LRS geopolymers with different fiber contents under strong alkali activation and cured at 80 °C for 1 d.
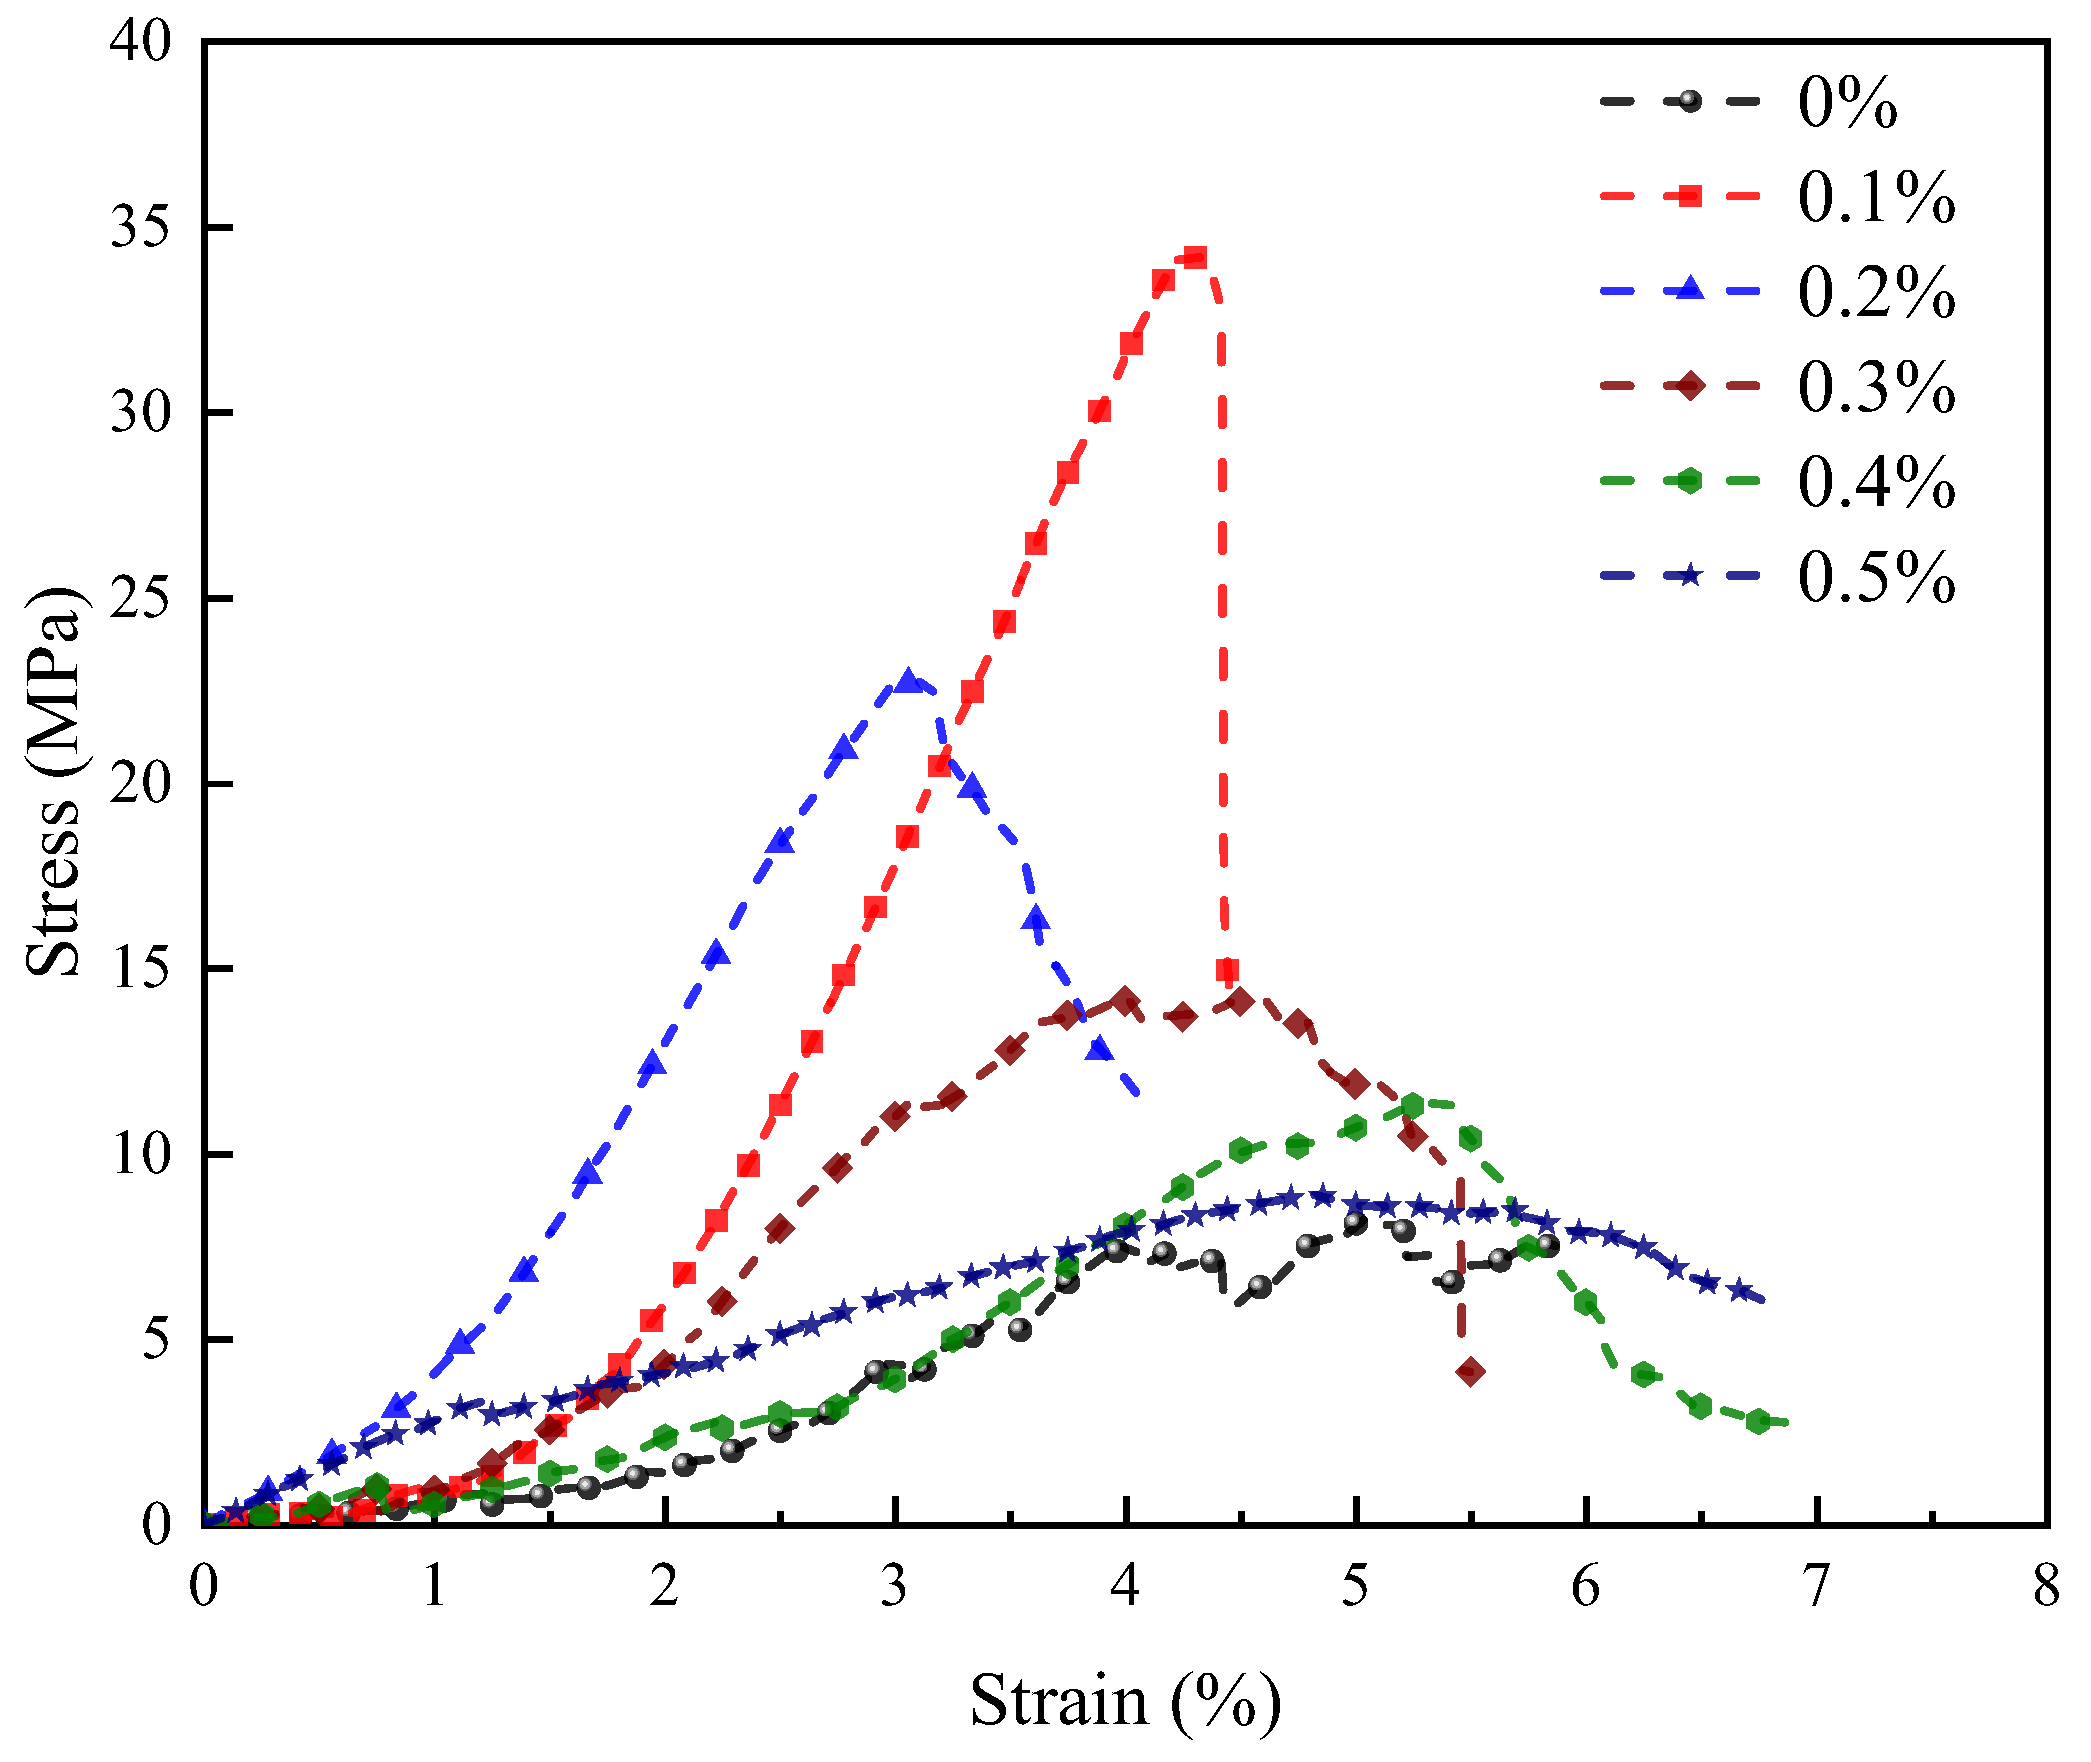
Figure 12.
Stress-strain curves of LRS geopolymers with different fiber contents under weak alkali activation and cured at 80 °C for 7 d.
Figure 12.
Stress-strain curves of LRS geopolymers with different fiber contents under weak alkali activation and cured at 80 °C for 7 d.
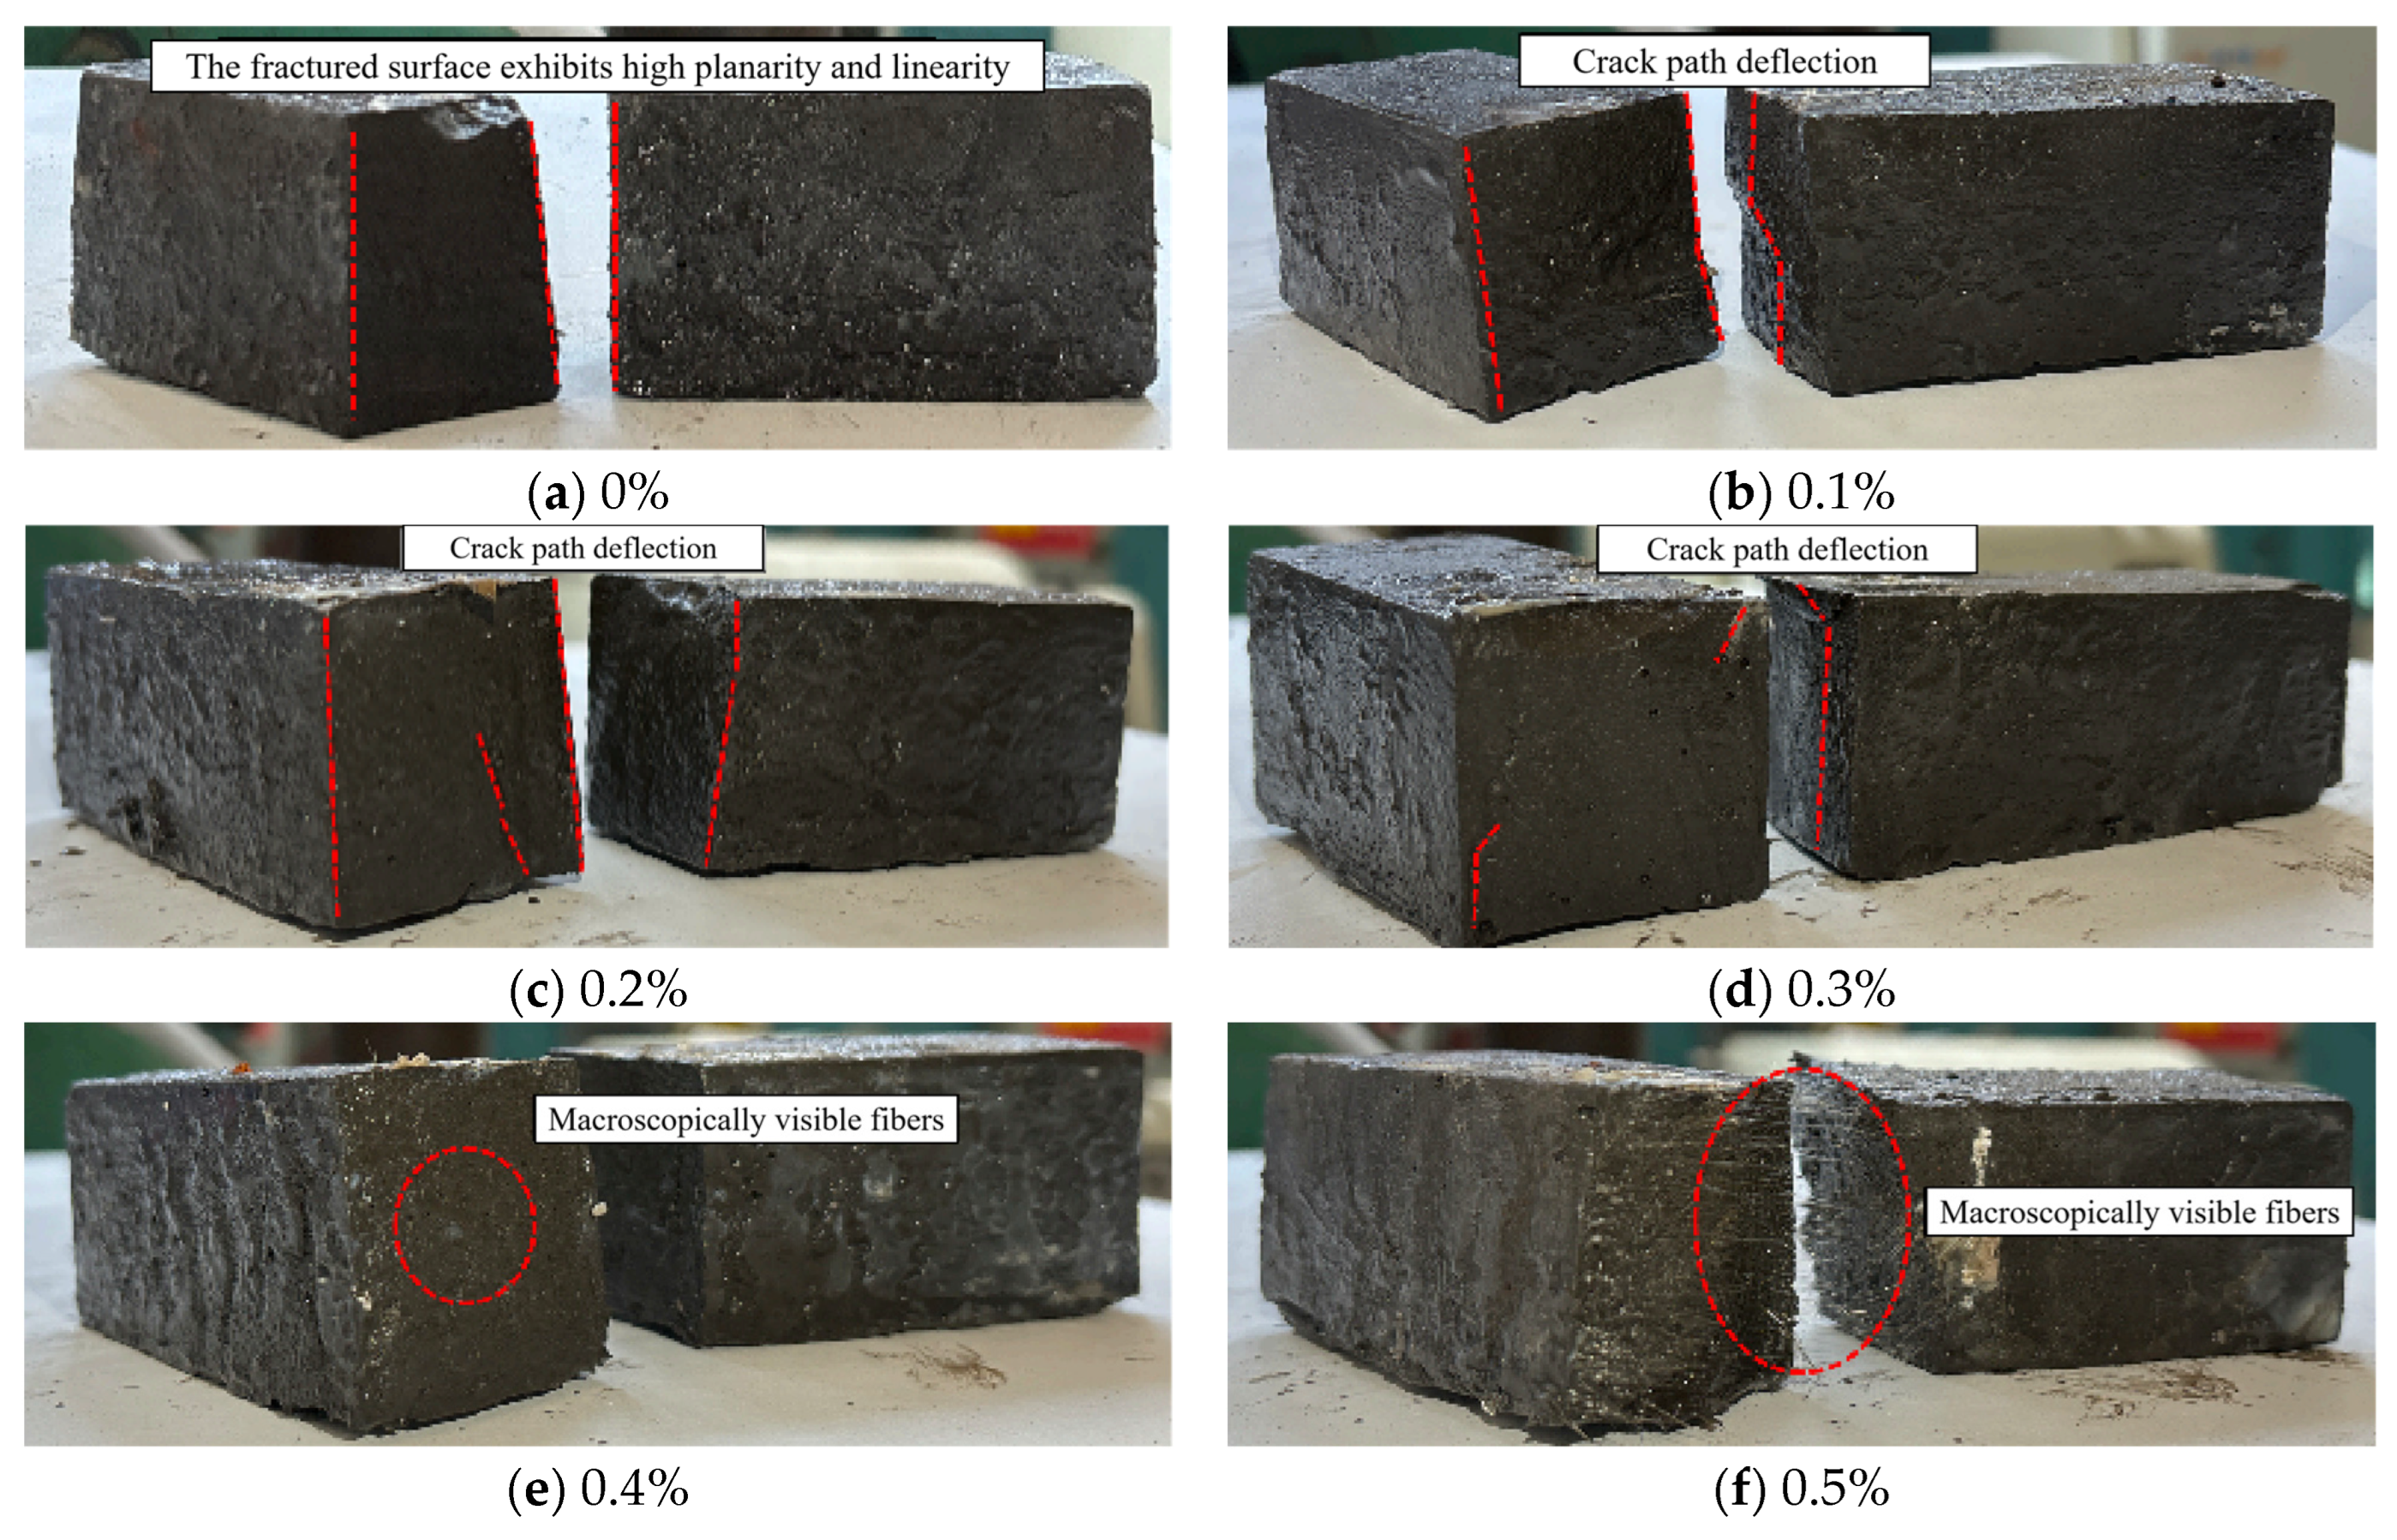
Figure 13.
Compressive failure modes of LRS geopolymers with different fiber contents under strong alkali activation and cured at 20 °C for 7 d.
Figure 13.
Compressive failure modes of LRS geopolymers with different fiber contents under strong alkali activation and cured at 20 °C for 7 d.
Figure 14.
Flexural failure modes of LRS geopolymers with different fiber contents under strong alkali activation and cured at 20 °C for 7 d.
Figure 14.
Flexural failure modes of LRS geopolymers with different fiber contents under strong alkali activation and cured at 20 °C for 7 d.
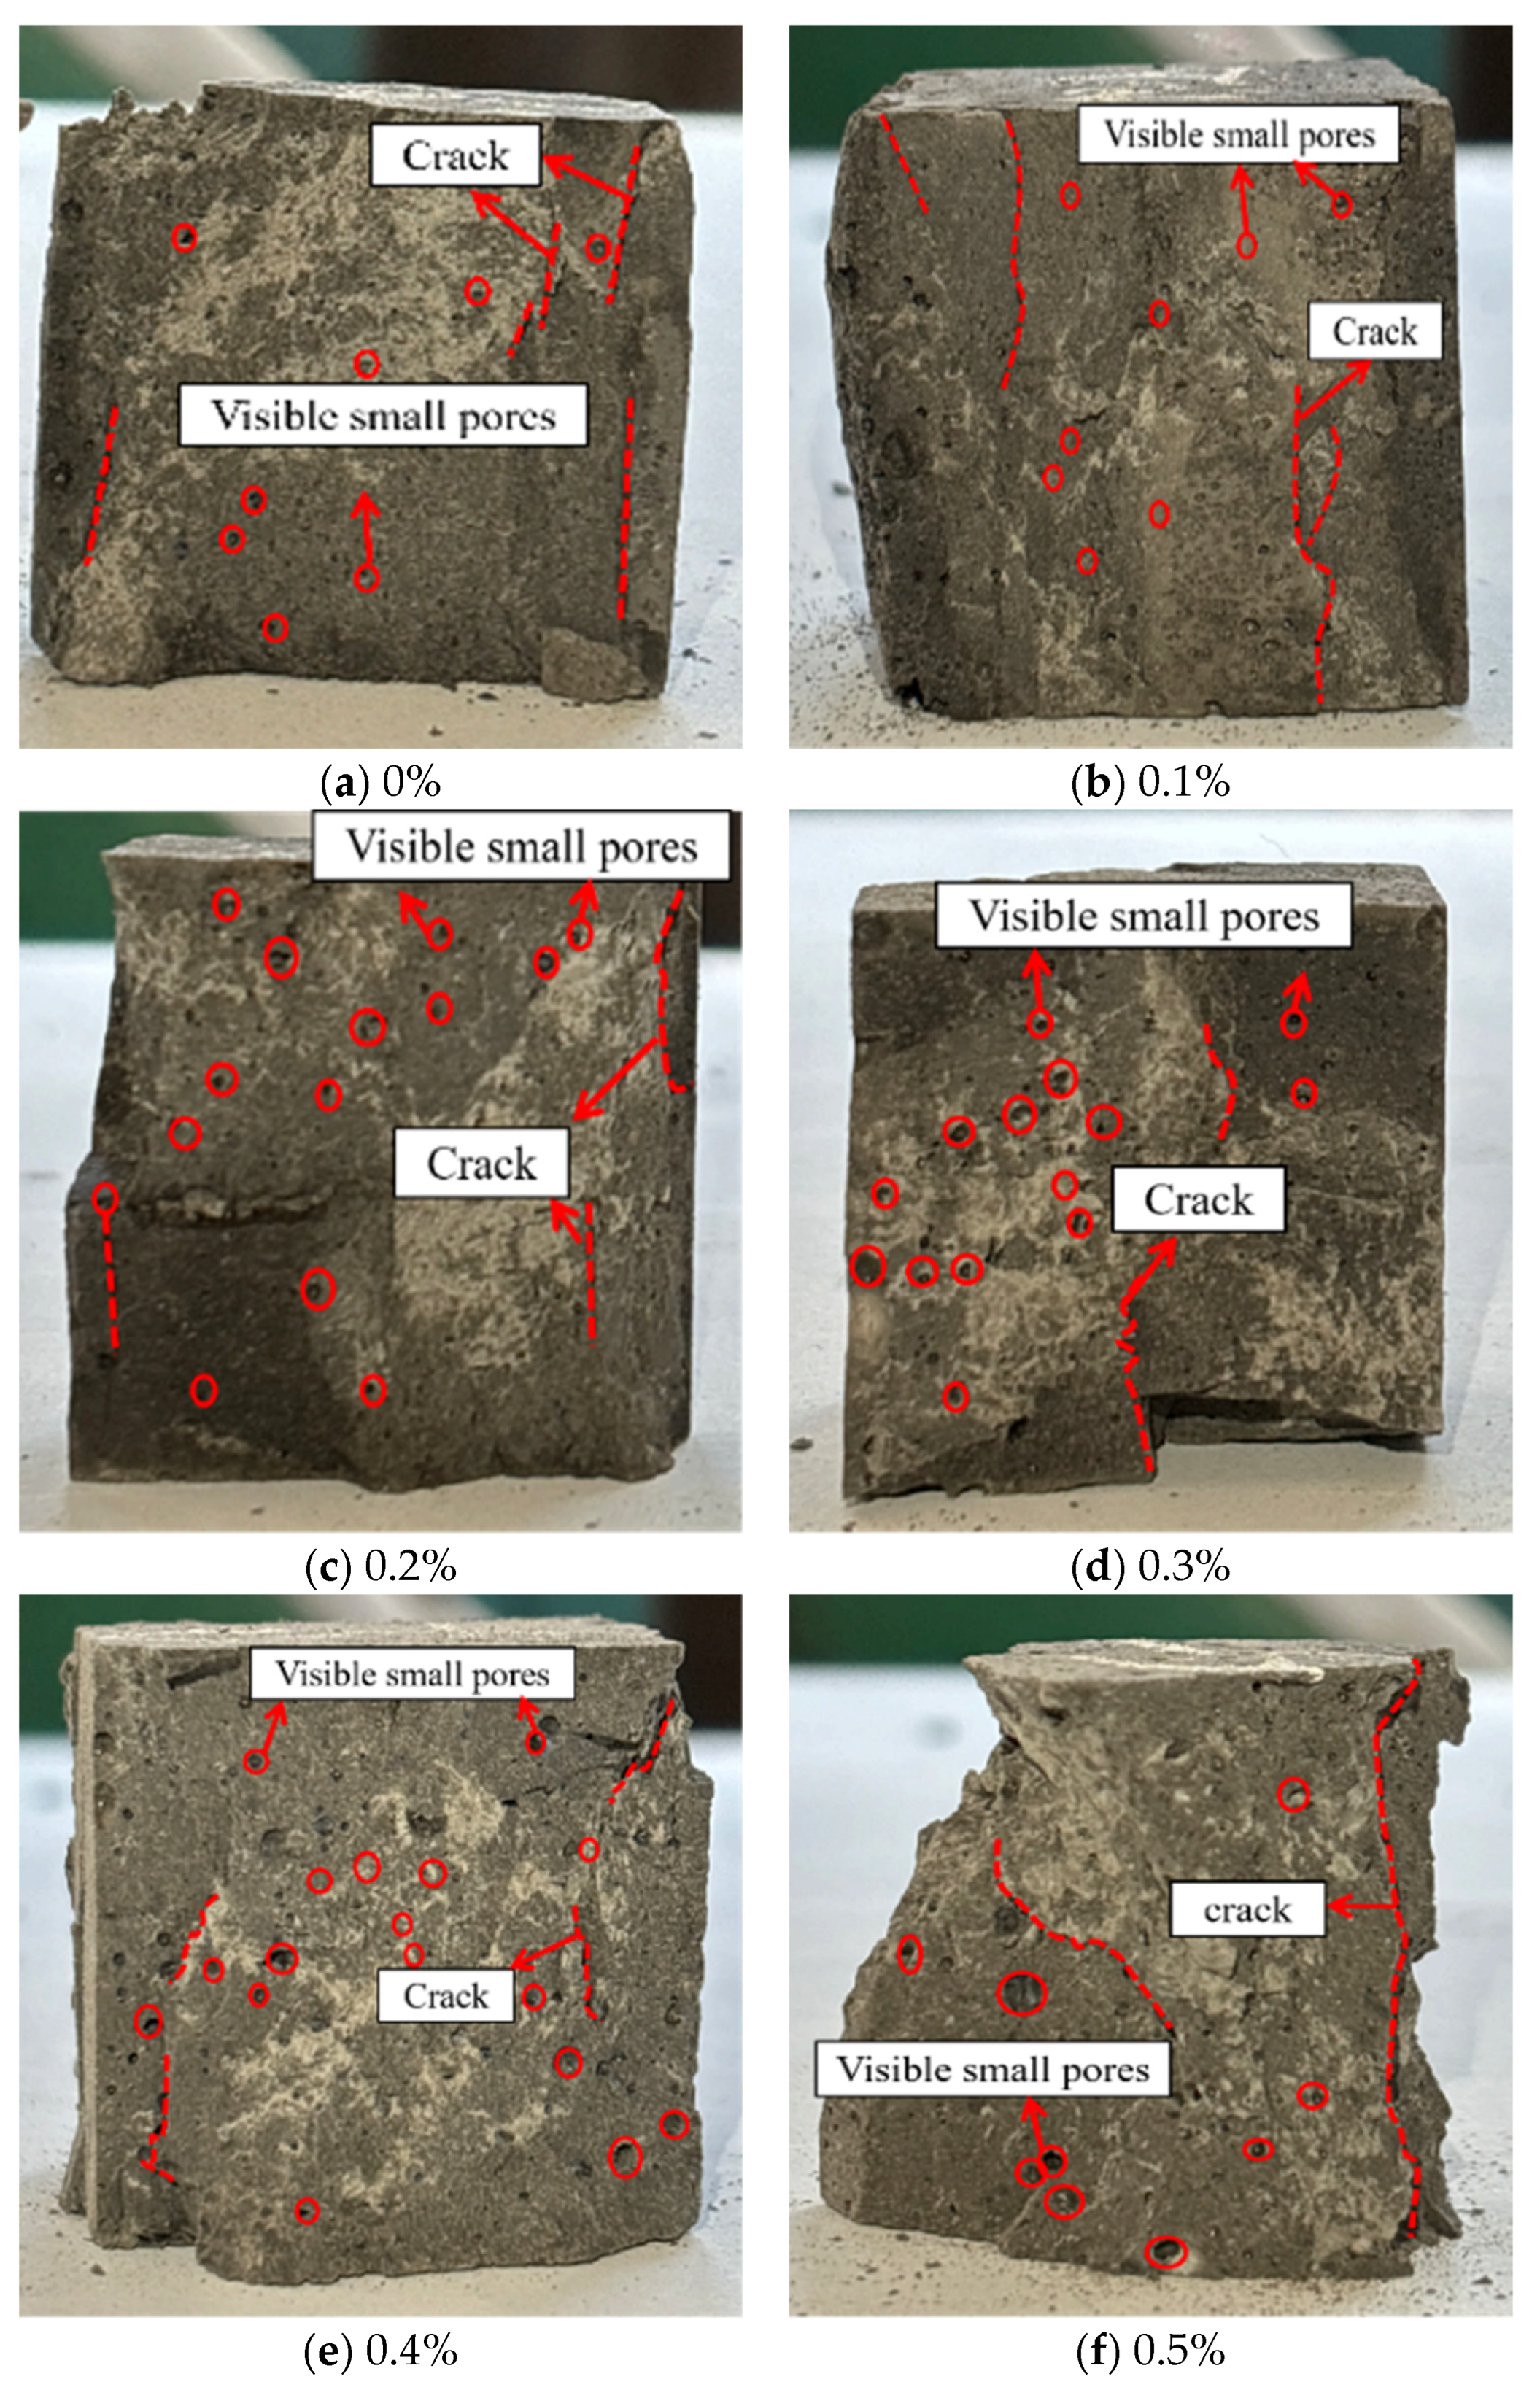
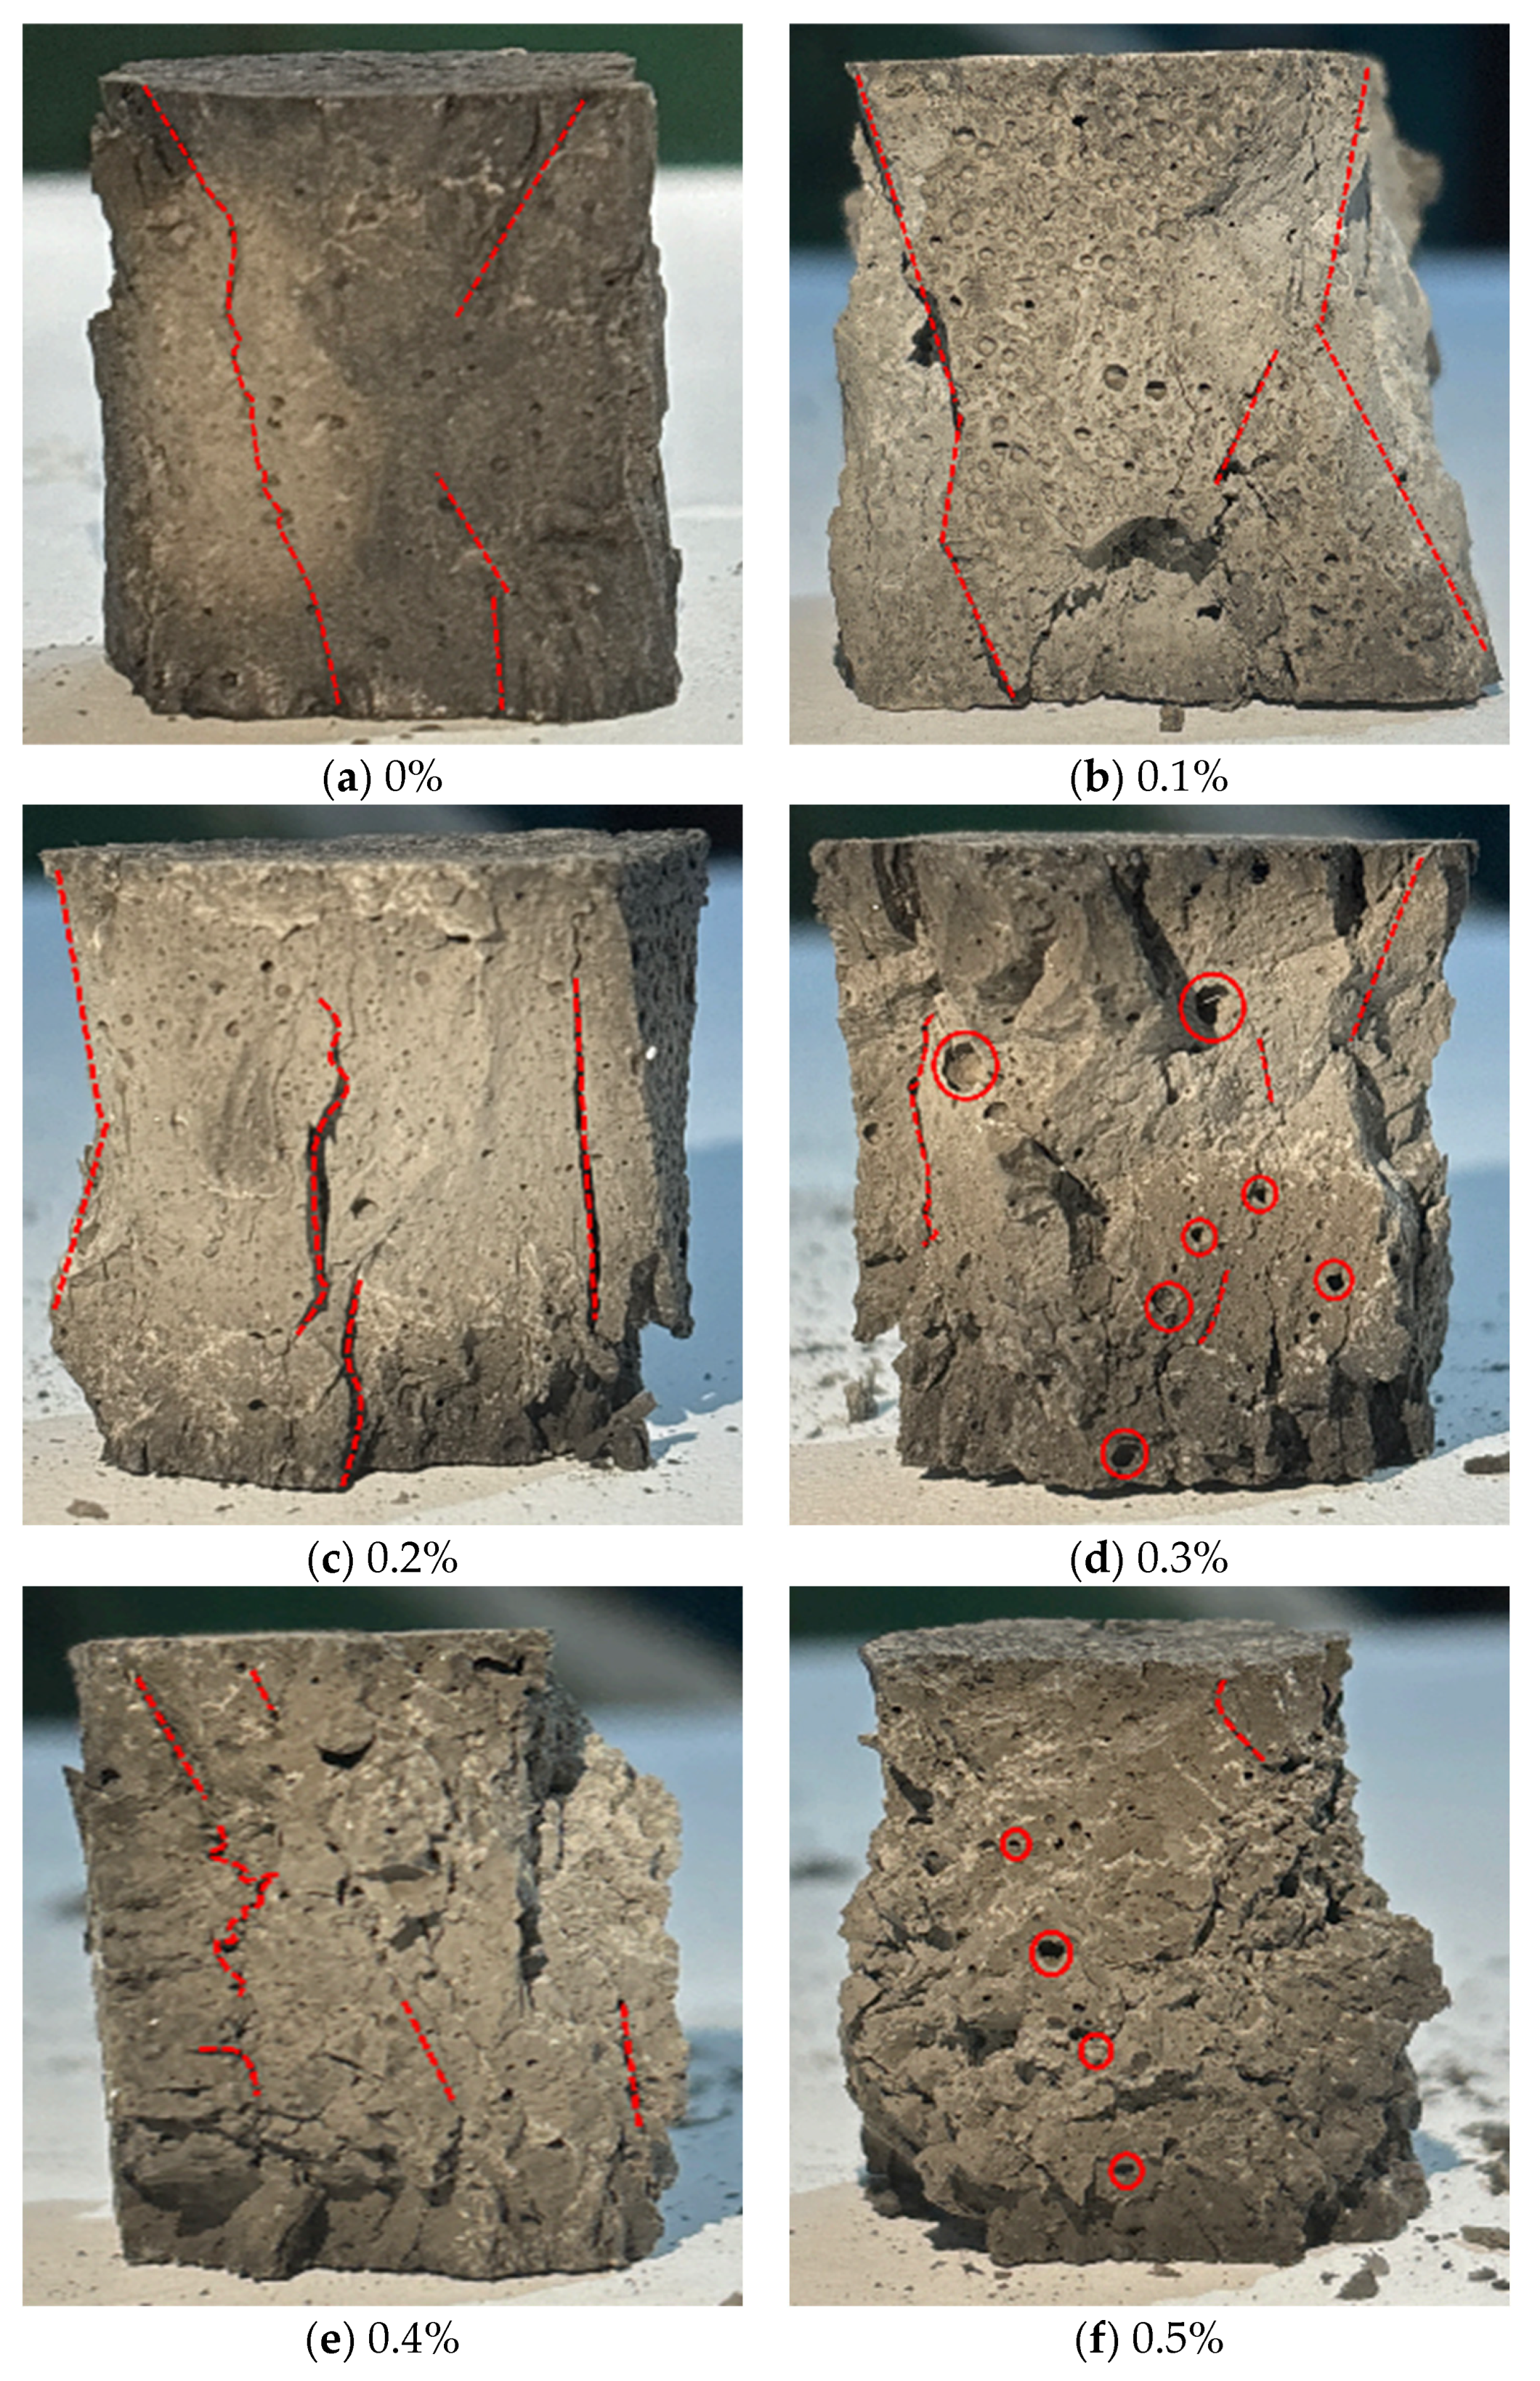
Figure 15.
Compressive failure modes of LRS geopolymers with different fiber contents under strong alkali activation and cured at 80 °C for 1 d.
Figure 15.
Compressive failure modes of LRS geopolymers with different fiber contents under strong alkali activation and cured at 80 °C for 1 d.
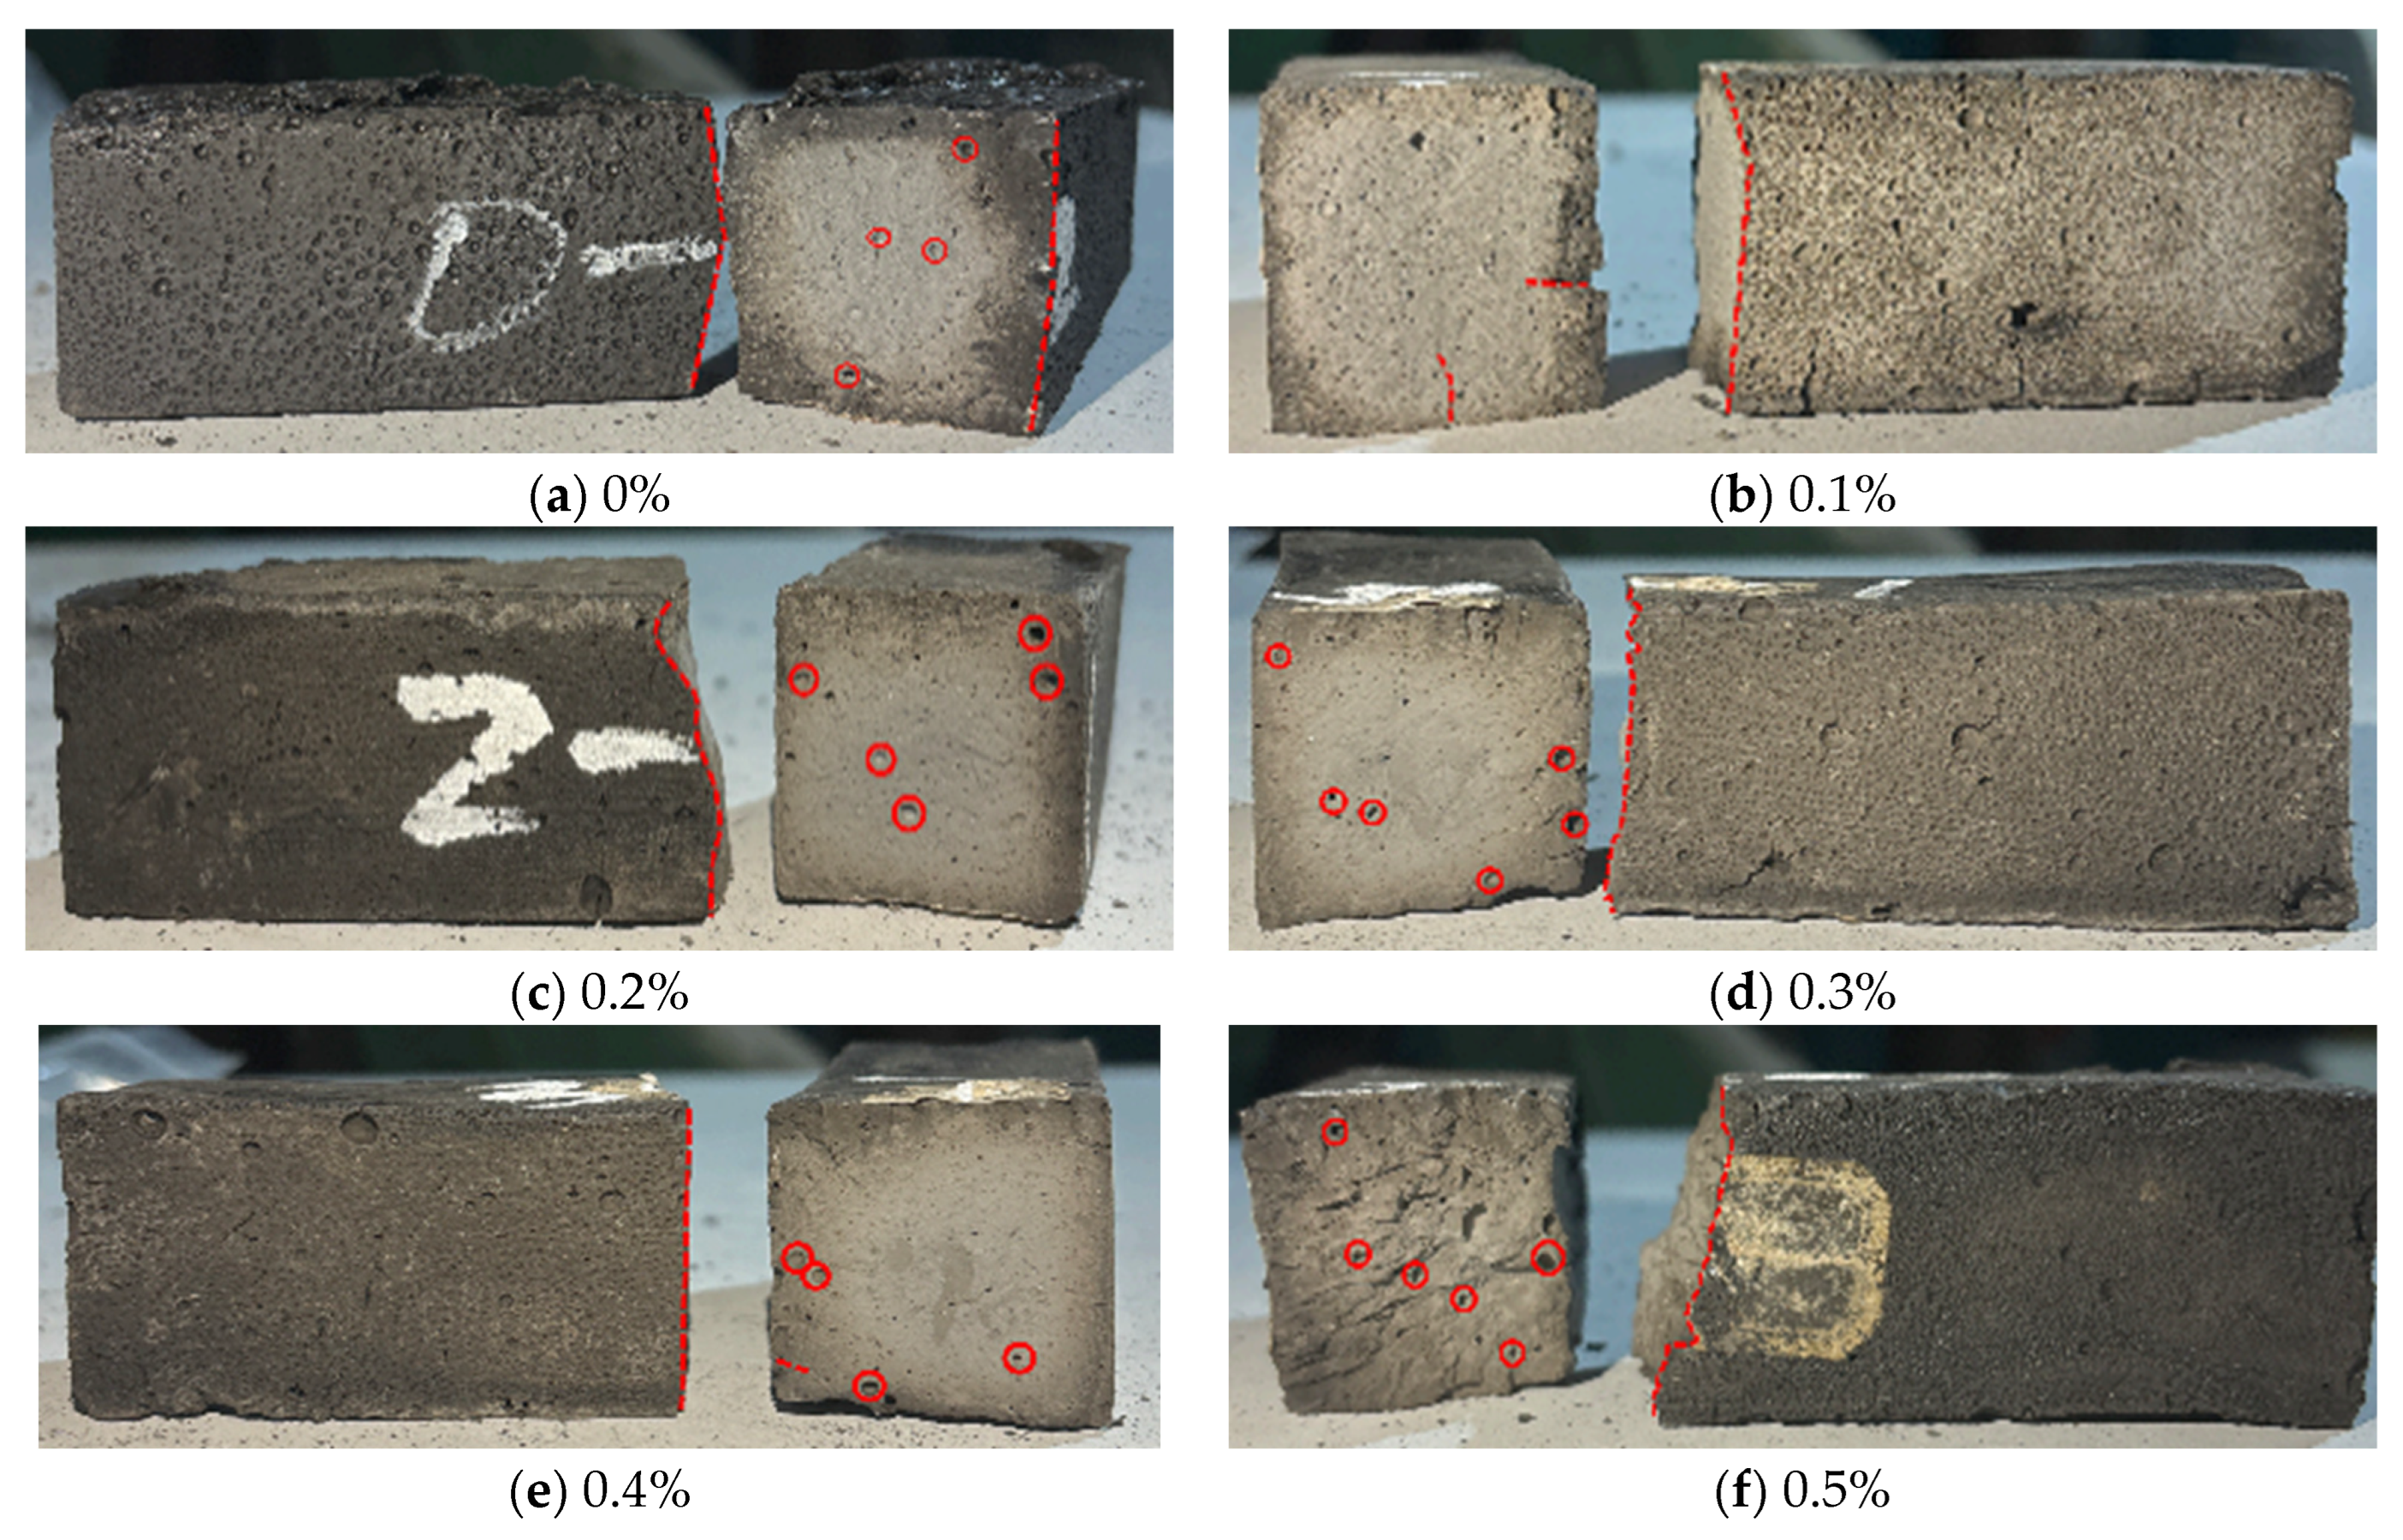
Figure 16.
Flexural failure modes of LRS geopolymers with different fiber contents under strong alkali activation and cured at 80 °C for 1 d.
Figure 16.
Flexural failure modes of LRS geopolymers with different fiber contents under strong alkali activation and cured at 80 °C for 1 d.
Figure 17.
Compressive failure modes of LRS geopolymers with different fiber contents under weak alkali activation and cured at 80 °C for 7 d.
Figure 17.
Compressive failure modes of LRS geopolymers with different fiber contents under weak alkali activation and cured at 80 °C for 7 d.
Figure 18.
Flexural failure modes of LRS geopolymers with different fiber contents under weak alkali activation and cured at 80 °C for 7 d.
Figure 18.
Flexural failure modes of LRS geopolymers with different fiber contents under weak alkali activation and cured at 80 °C for 7 d.
Figure 19.
Compressive strength of LRS geopolymers with different fiber contents under strong alkali activation and cured at 20 °C for 7 d.
Figure 19.
Compressive strength of LRS geopolymers with different fiber contents under strong alkali activation and cured at 20 °C for 7 d.
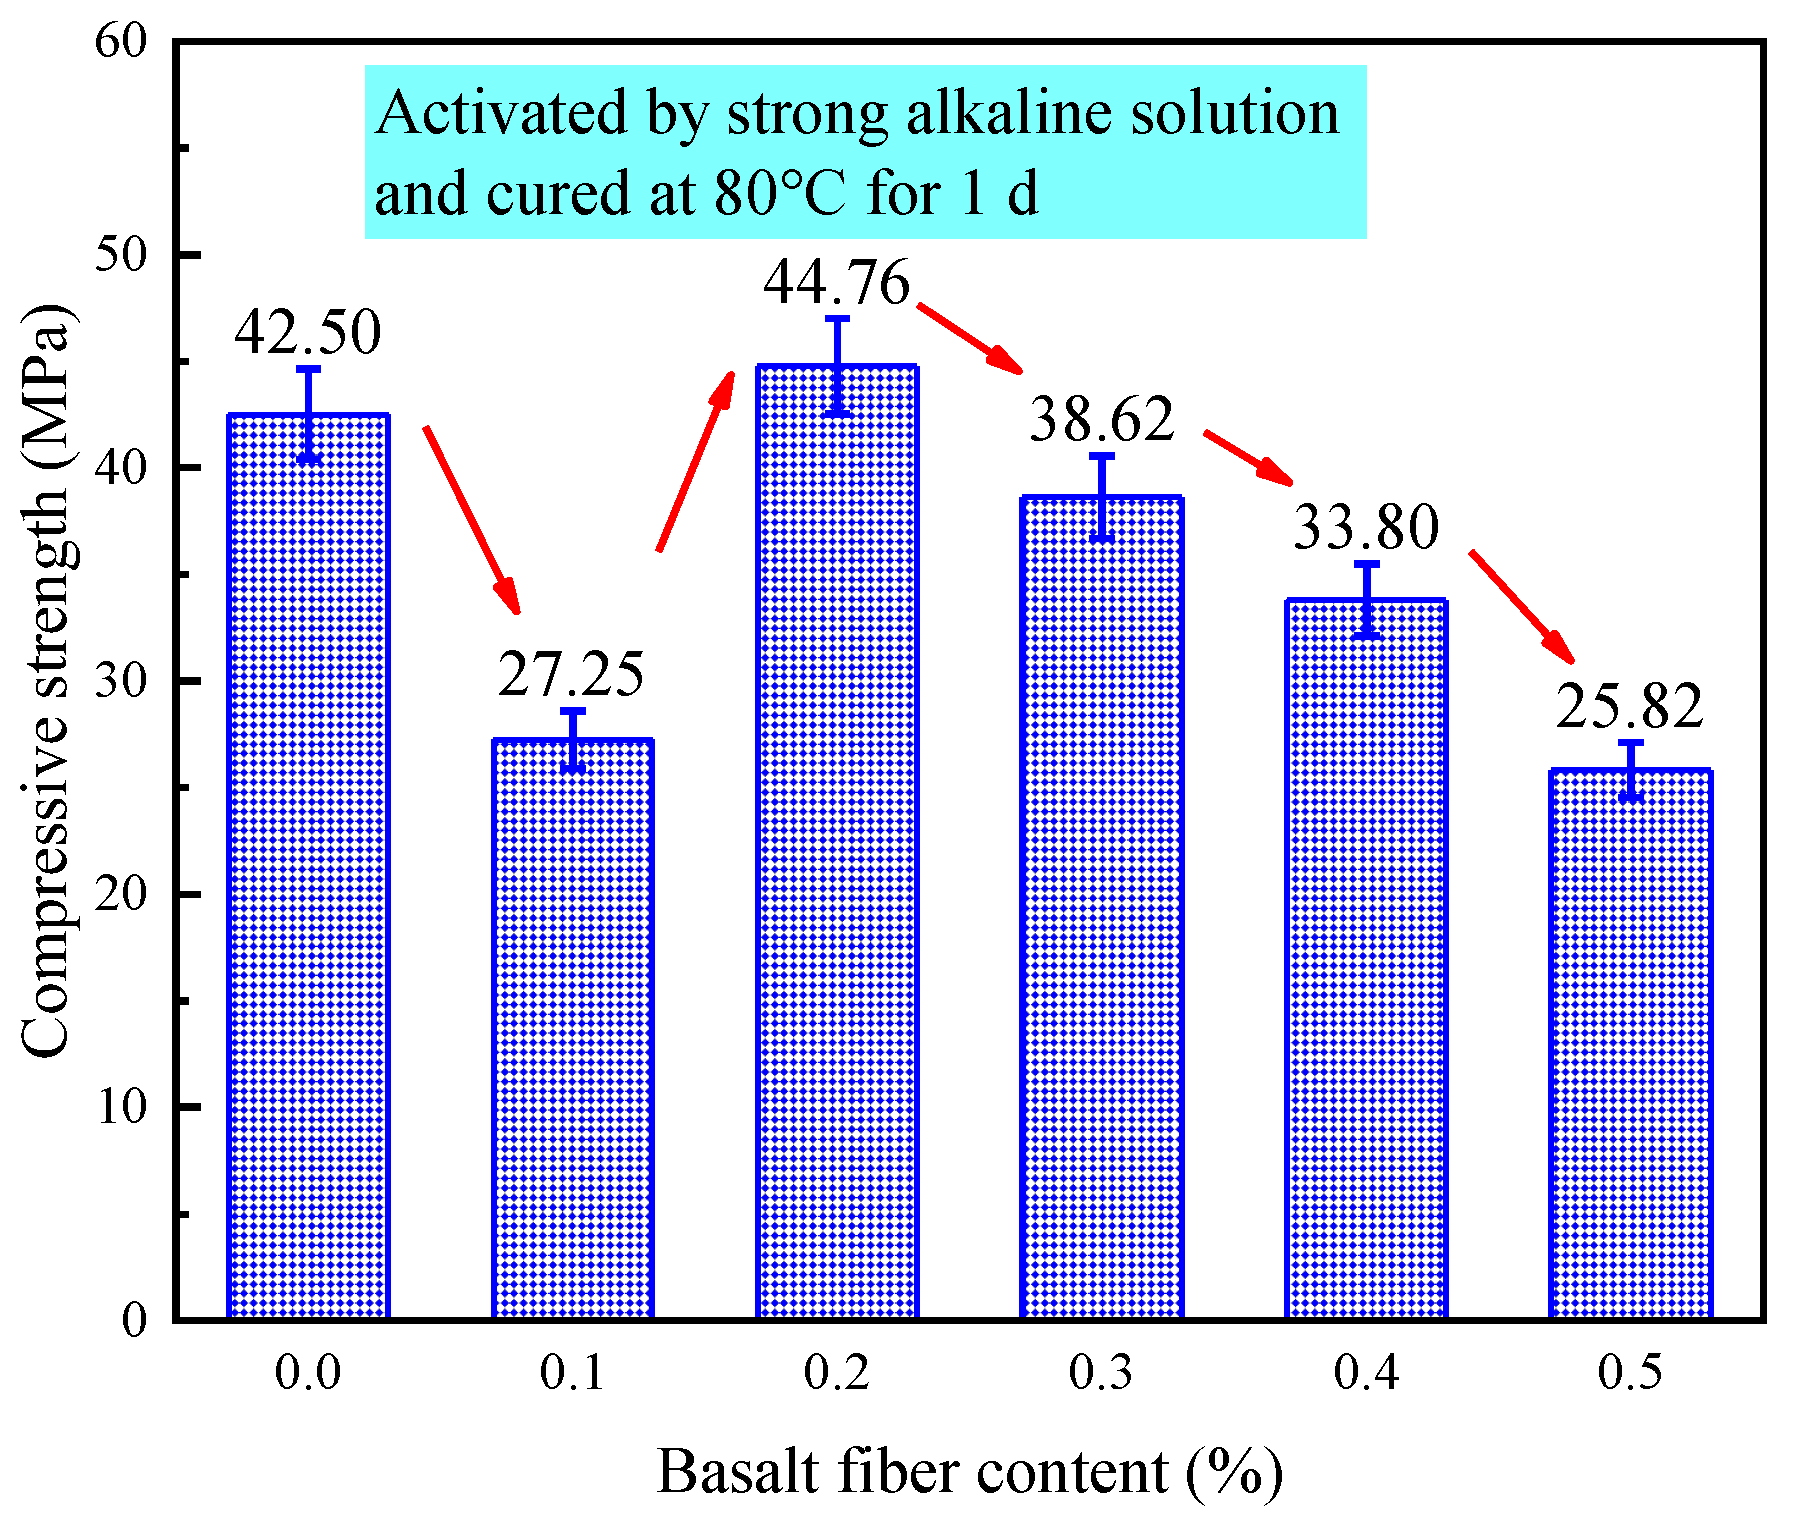
Figure 20.
Compressive strength of LRS geopolymers with different fiber contents under strong alkali activation and cured at 80 °C for 1 d.
Figure 20.
Compressive strength of LRS geopolymers with different fiber contents under strong alkali activation and cured at 80 °C for 1 d.
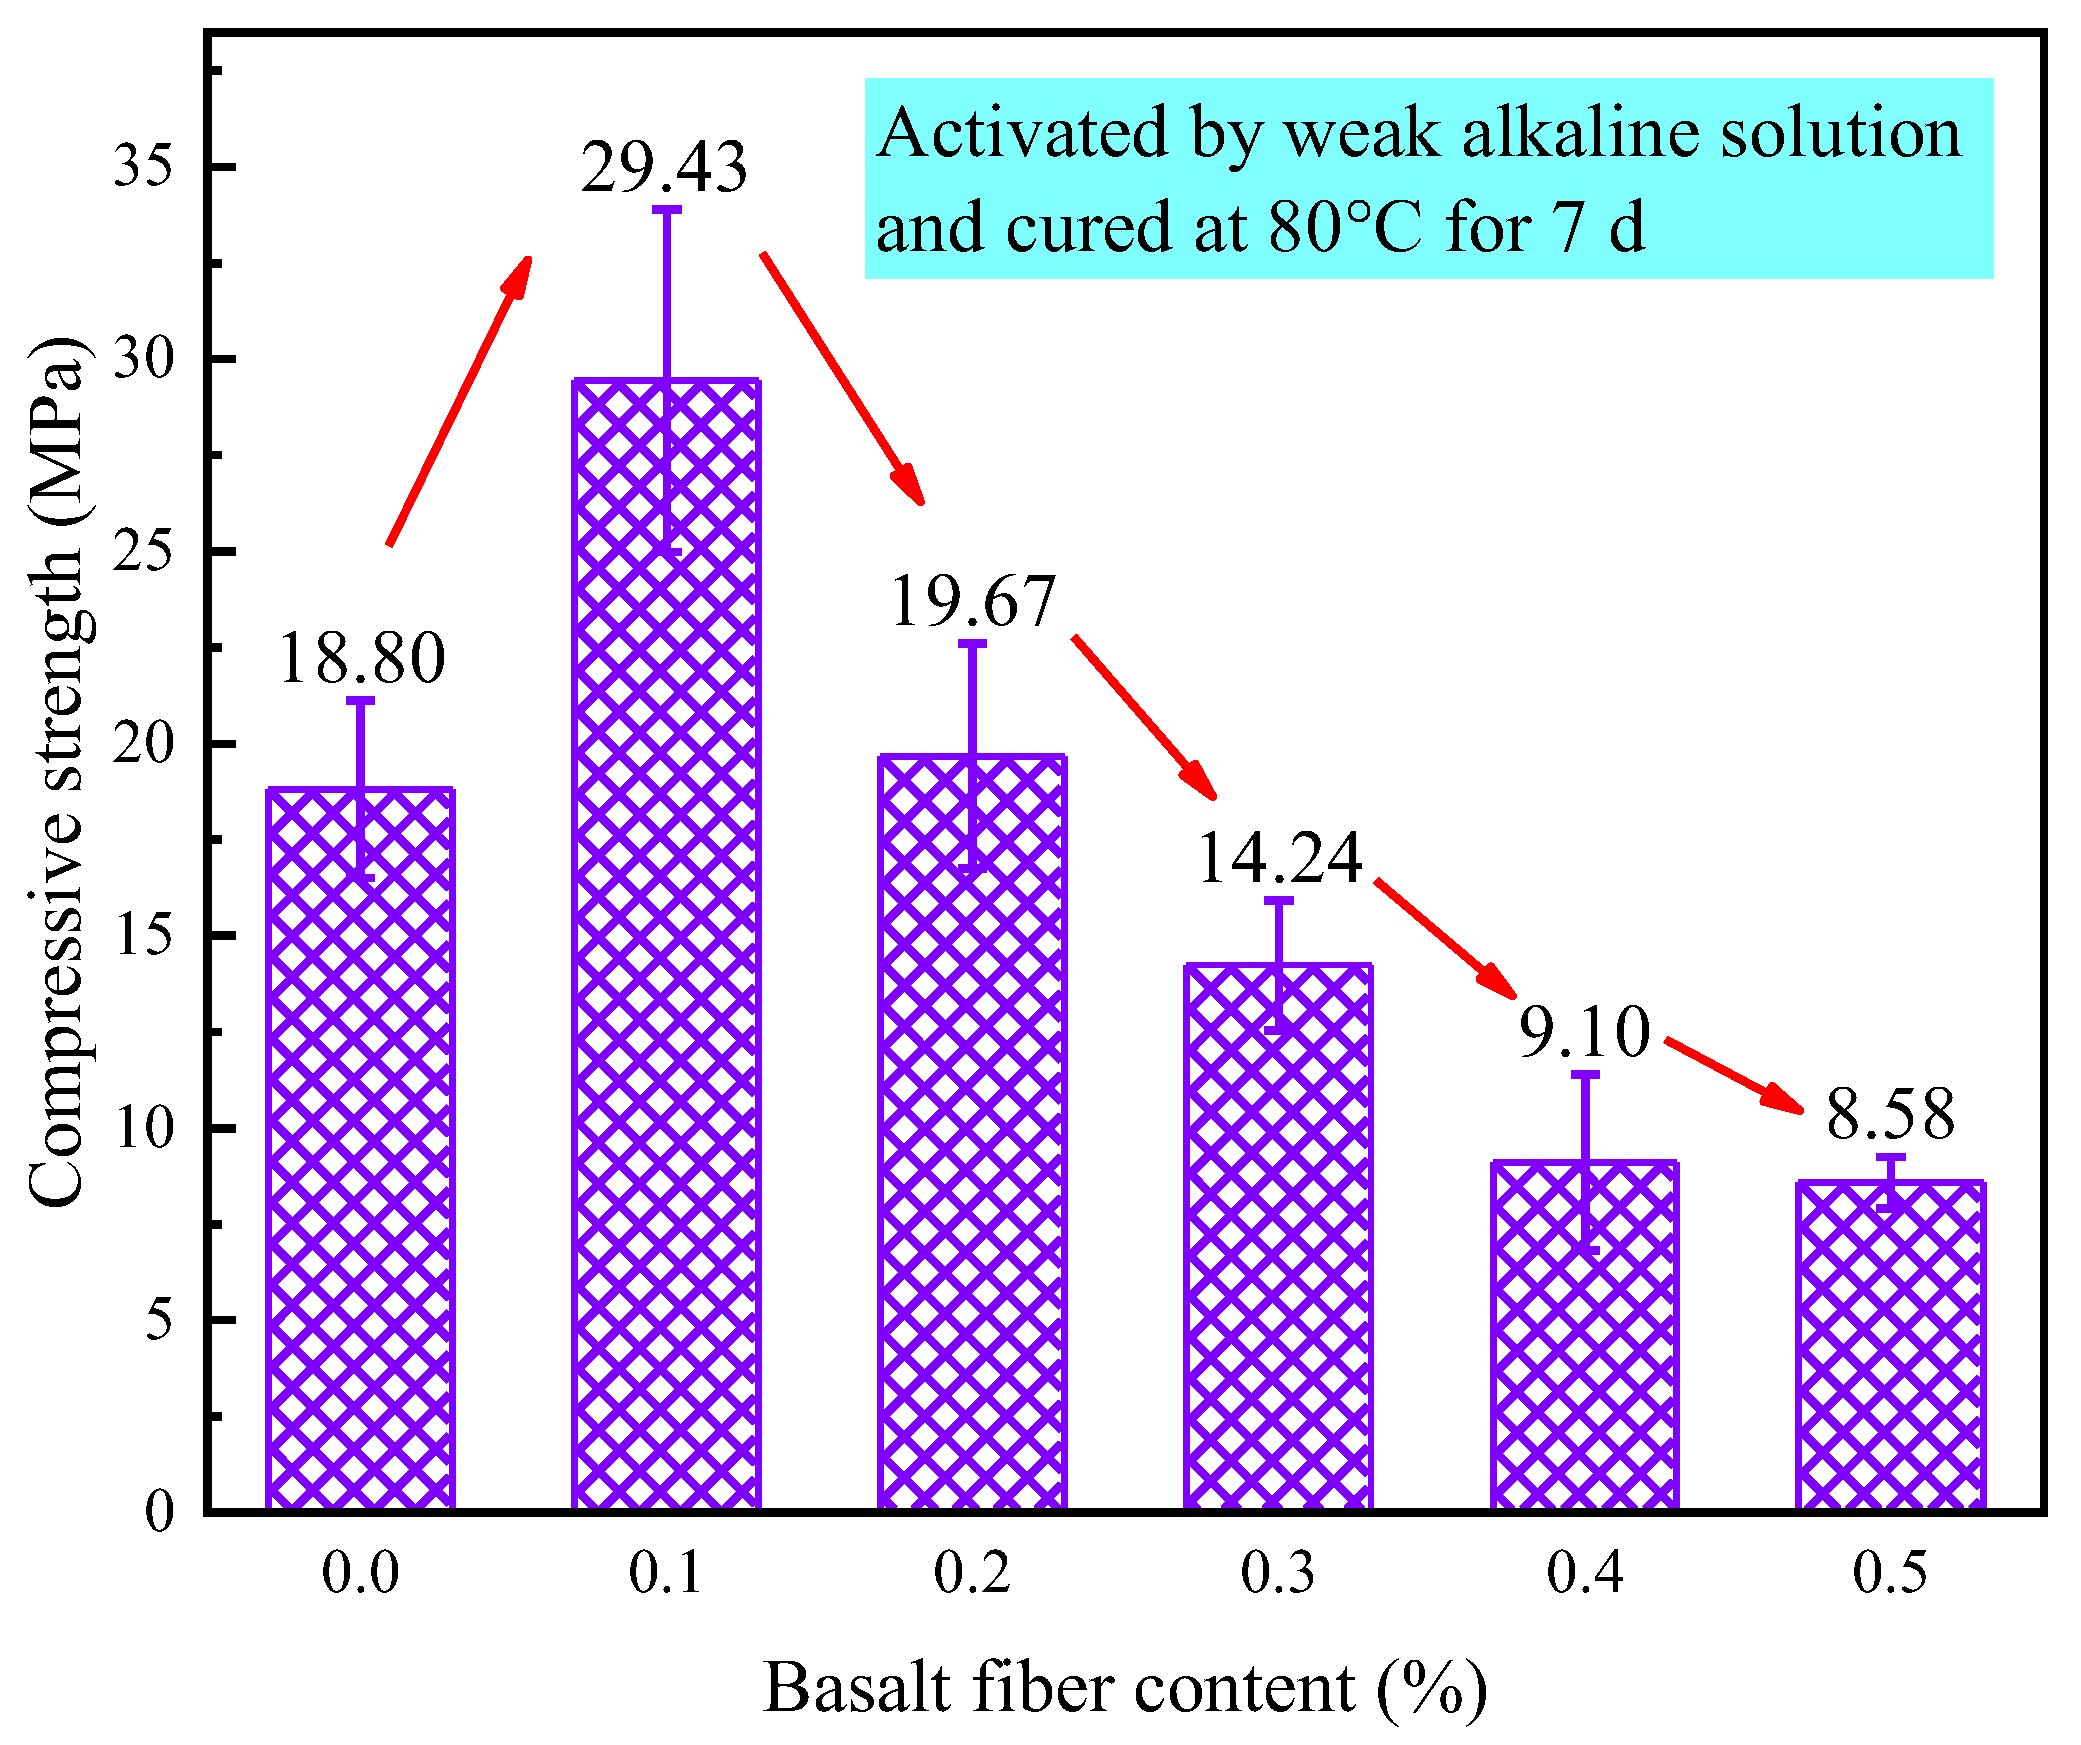
Figure 21.
Compressive strength of LRS geopolymers with different fiber contents under weak alkali activation and cured at 80 °C for 7 d.
Figure 21.
Compressive strength of LRS geopolymers with different fiber contents under weak alkali activation and cured at 80 °C for 7 d.
Figure 22.
Flexural strength of LRS geopolymers with different fiber contents under strong alkali activation and cured at 20 °C for 7 d.
Figure 22.
Flexural strength of LRS geopolymers with different fiber contents under strong alkali activation and cured at 20 °C for 7 d.
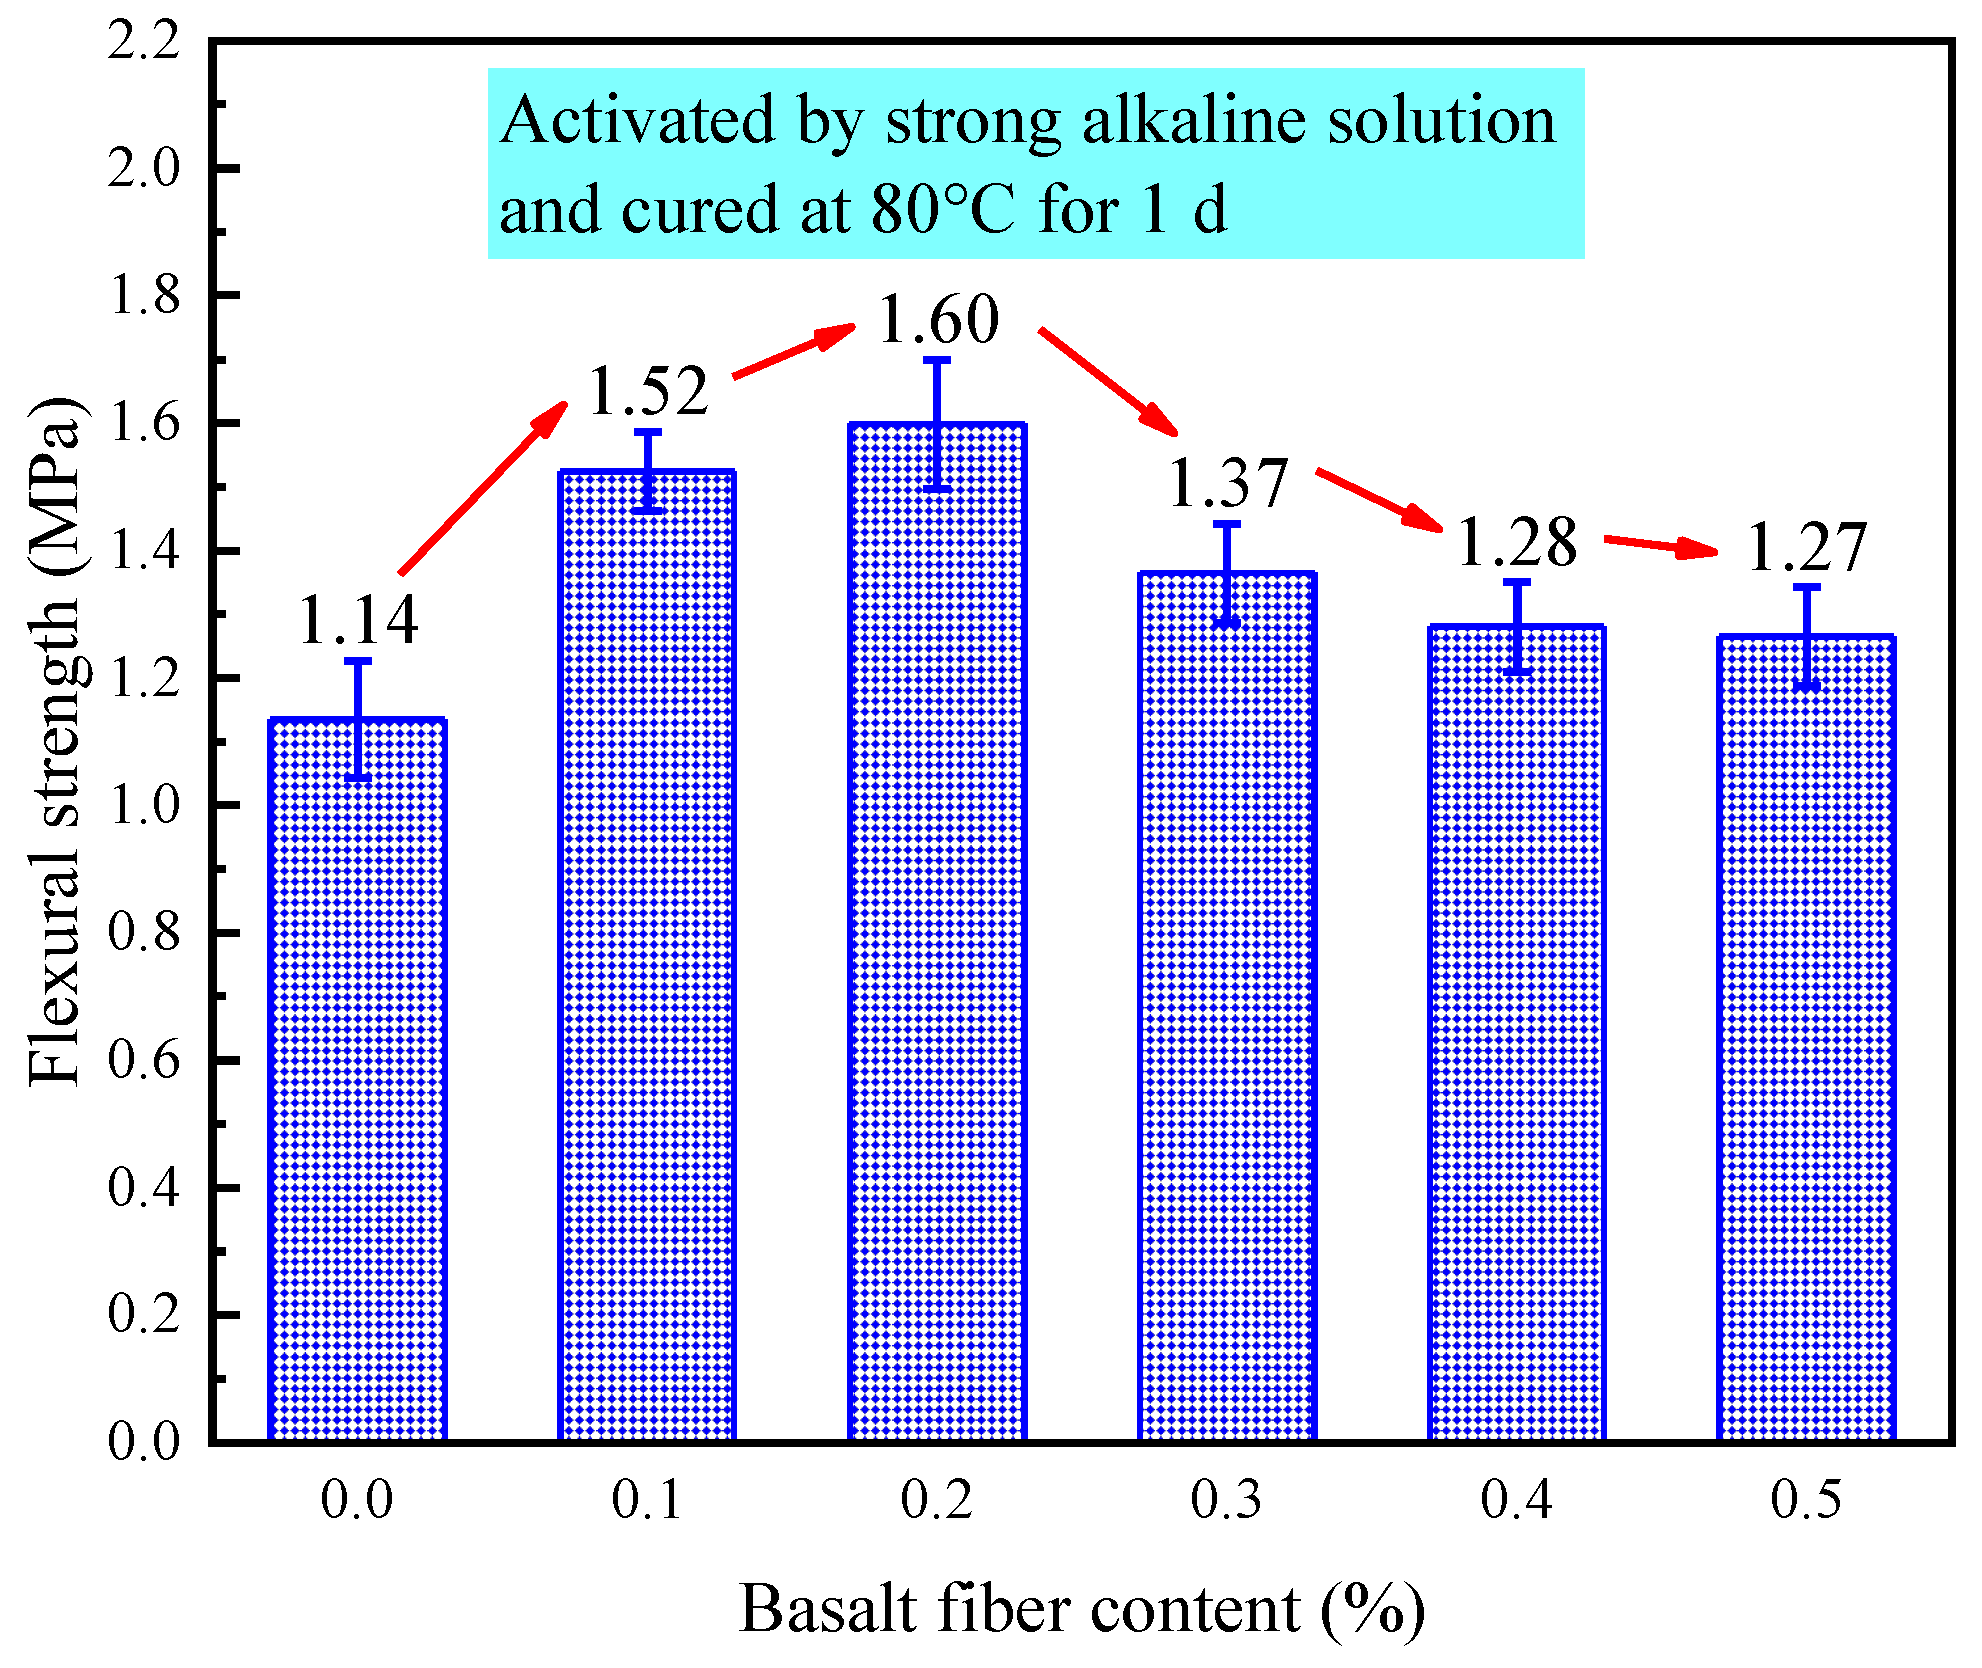
Figure 23.
Flexural strength of LRS geopolymers with different fiber contents under strong alkali activation and cured at 80 °C for 1 d.
Figure 23.
Flexural strength of LRS geopolymers with different fiber contents under strong alkali activation and cured at 80 °C for 1 d.
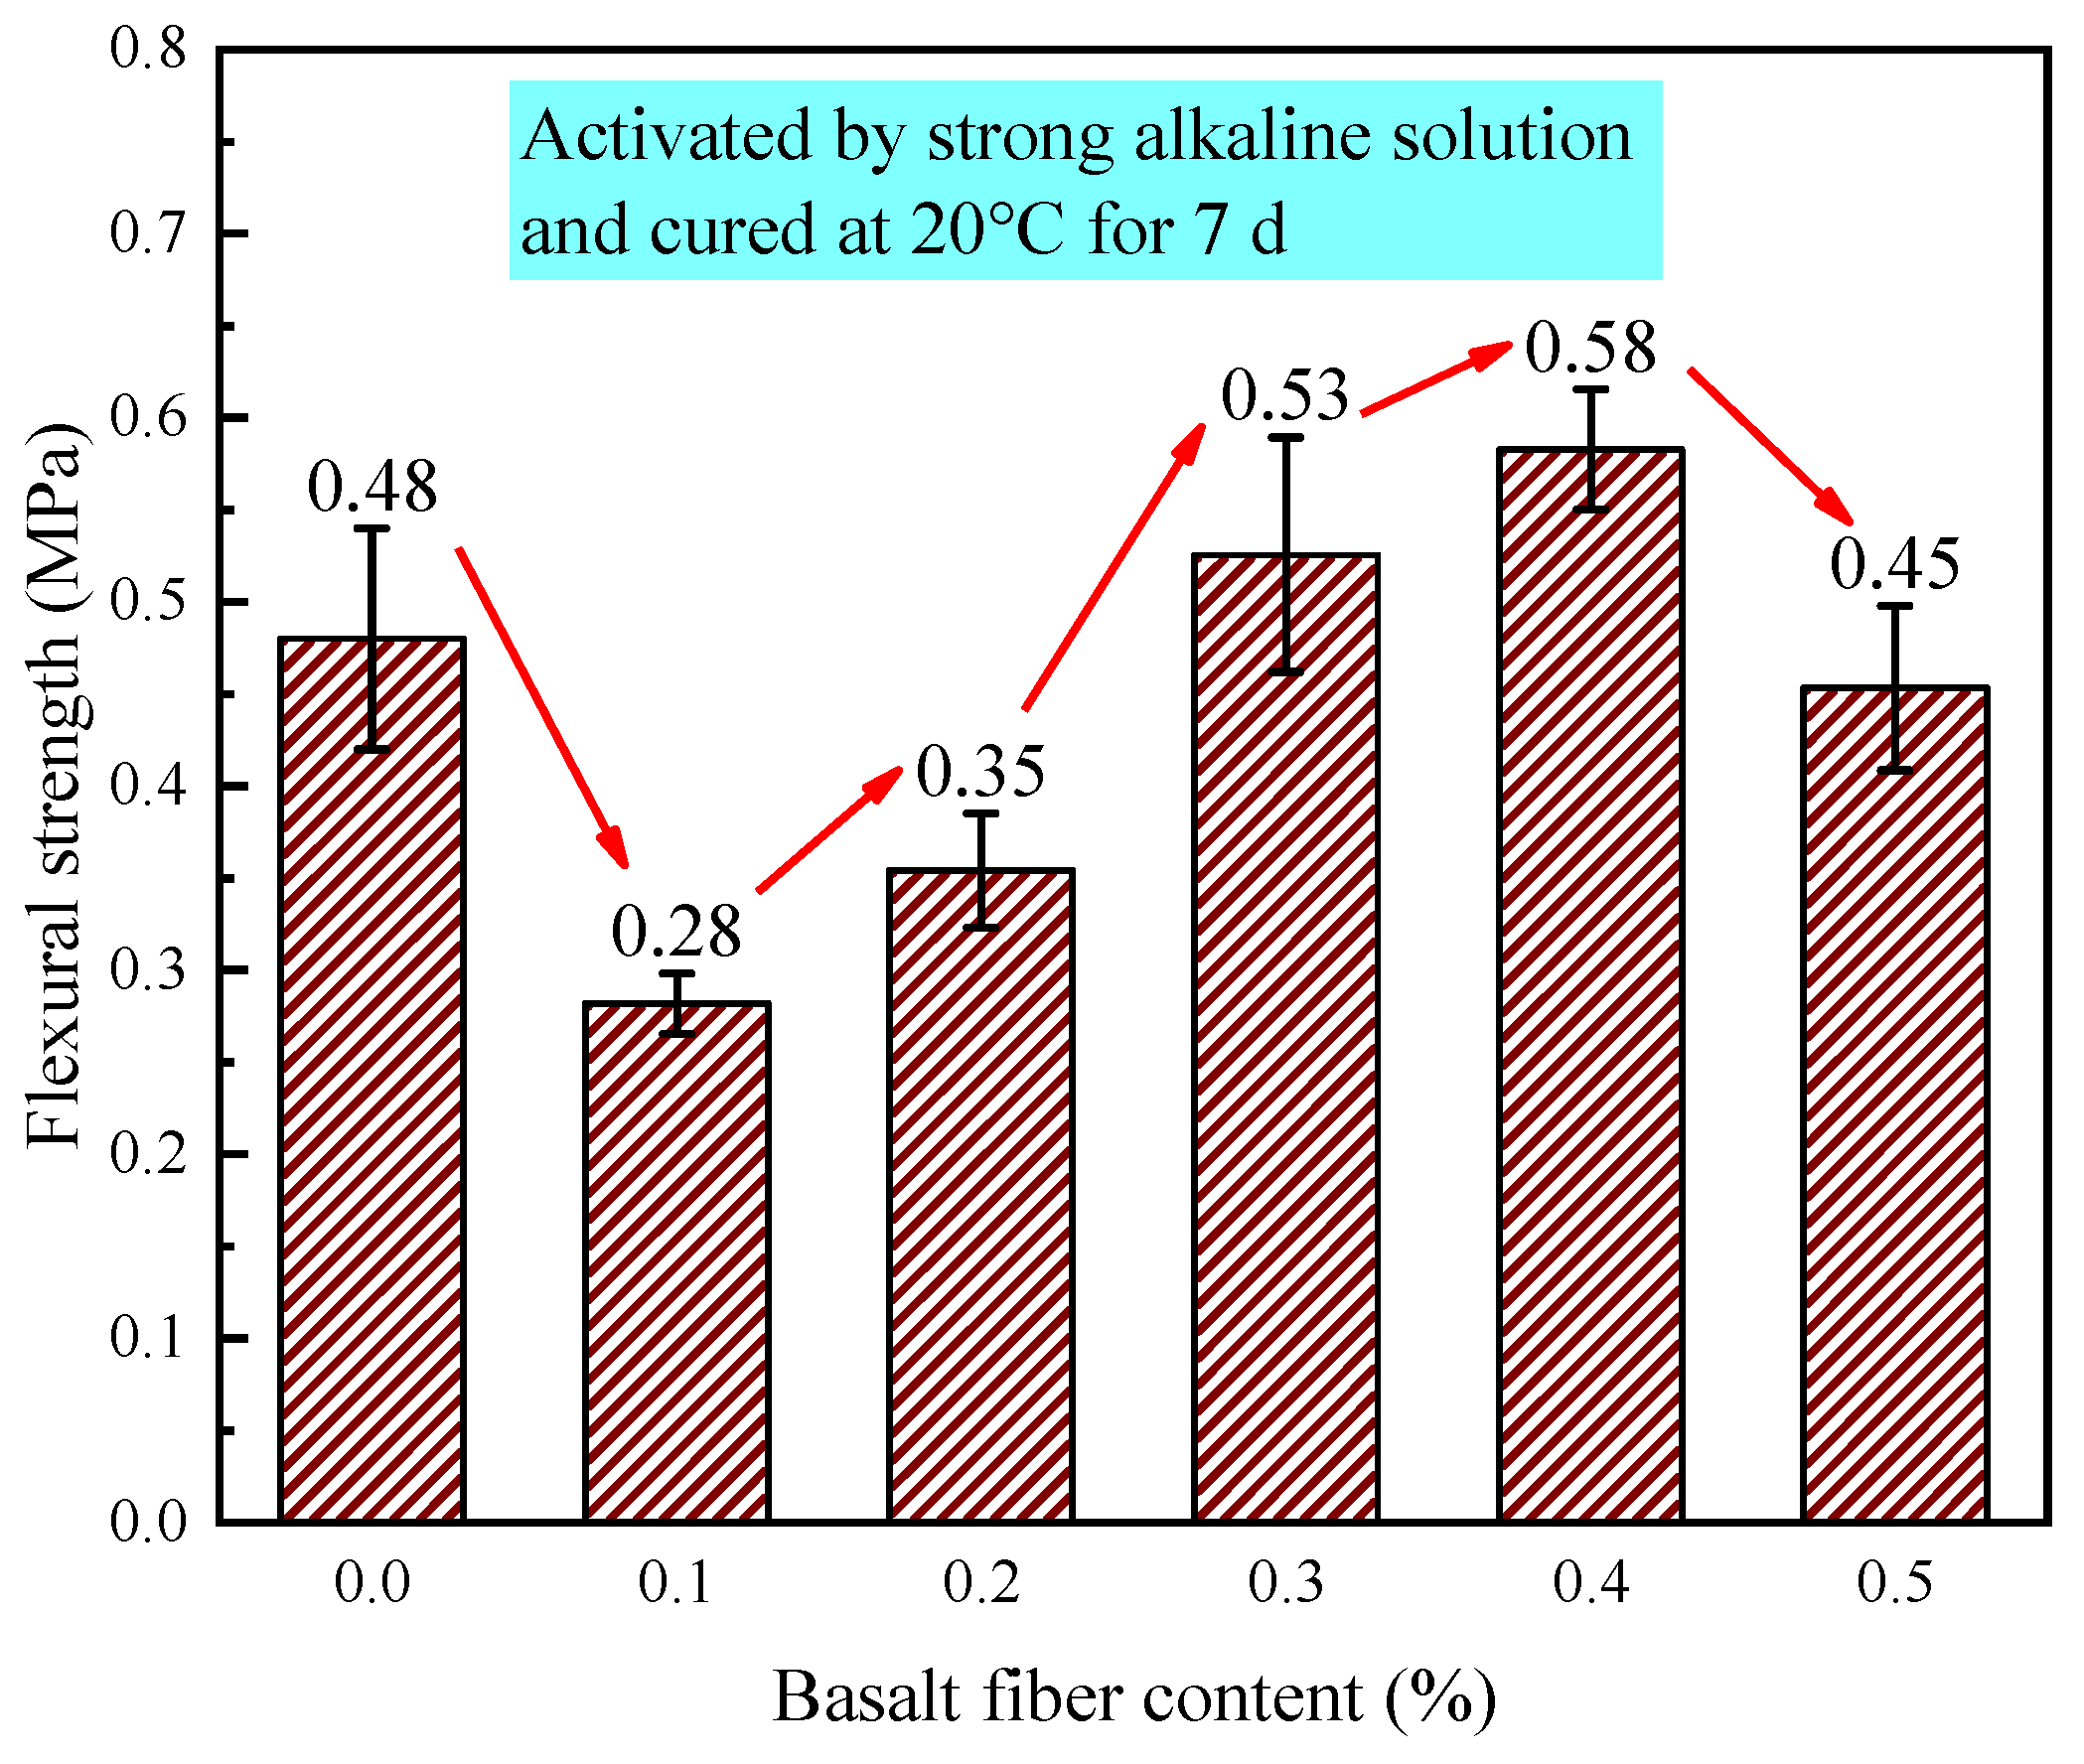
Figure 24.
Flexural strength of LRS geopolymers with different fiber contents under weak alkali activation and cured at 20 °C for 7 d.
Figure 24.
Flexural strength of LRS geopolymers with different fiber contents under weak alkali activation and cured at 20 °C for 7 d.
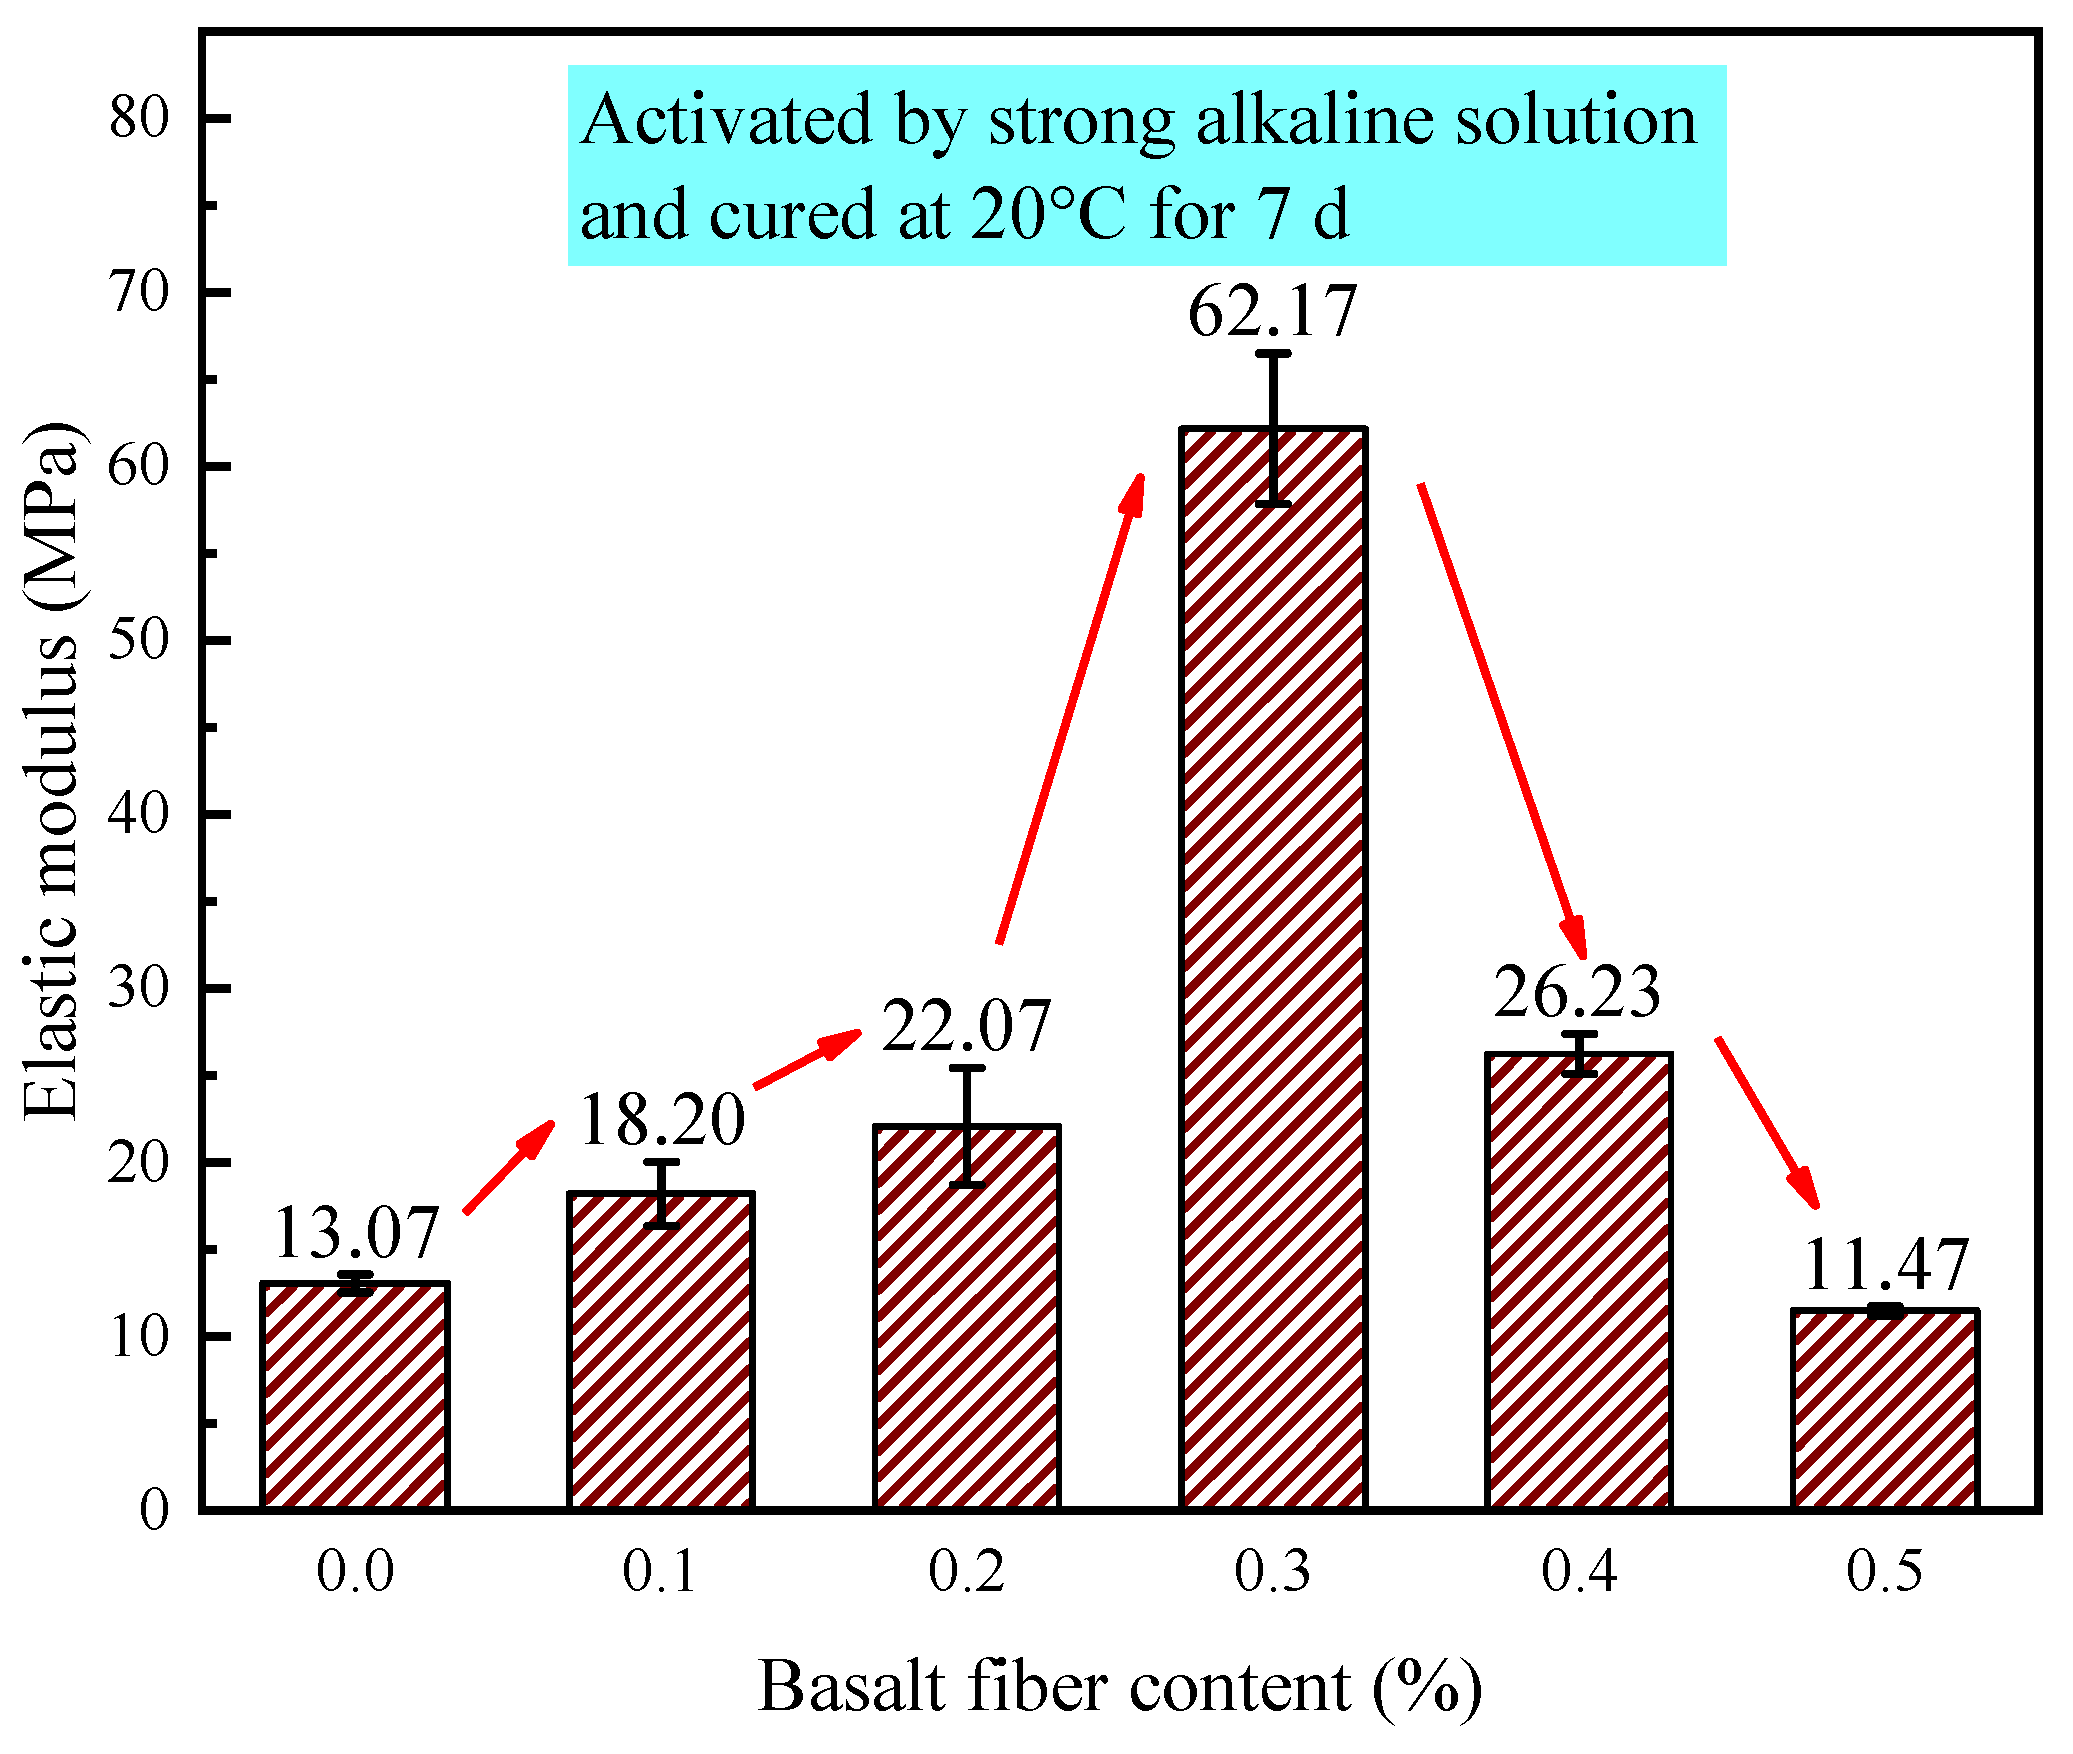
Figure 25.
Elastic modulus of LRS geopolymers with different fiber contents under strong alkali activation and cured at 20 °C for 7 d.
Figure 25.
Elastic modulus of LRS geopolymers with different fiber contents under strong alkali activation and cured at 20 °C for 7 d.
Figure 26.
Elastic modulus of LRS geopolymers with different fiber contents under strong alkali activation and cured at 80 °C for 1 d.
Figure 26.
Elastic modulus of LRS geopolymers with different fiber contents under strong alkali activation and cured at 80 °C for 1 d.
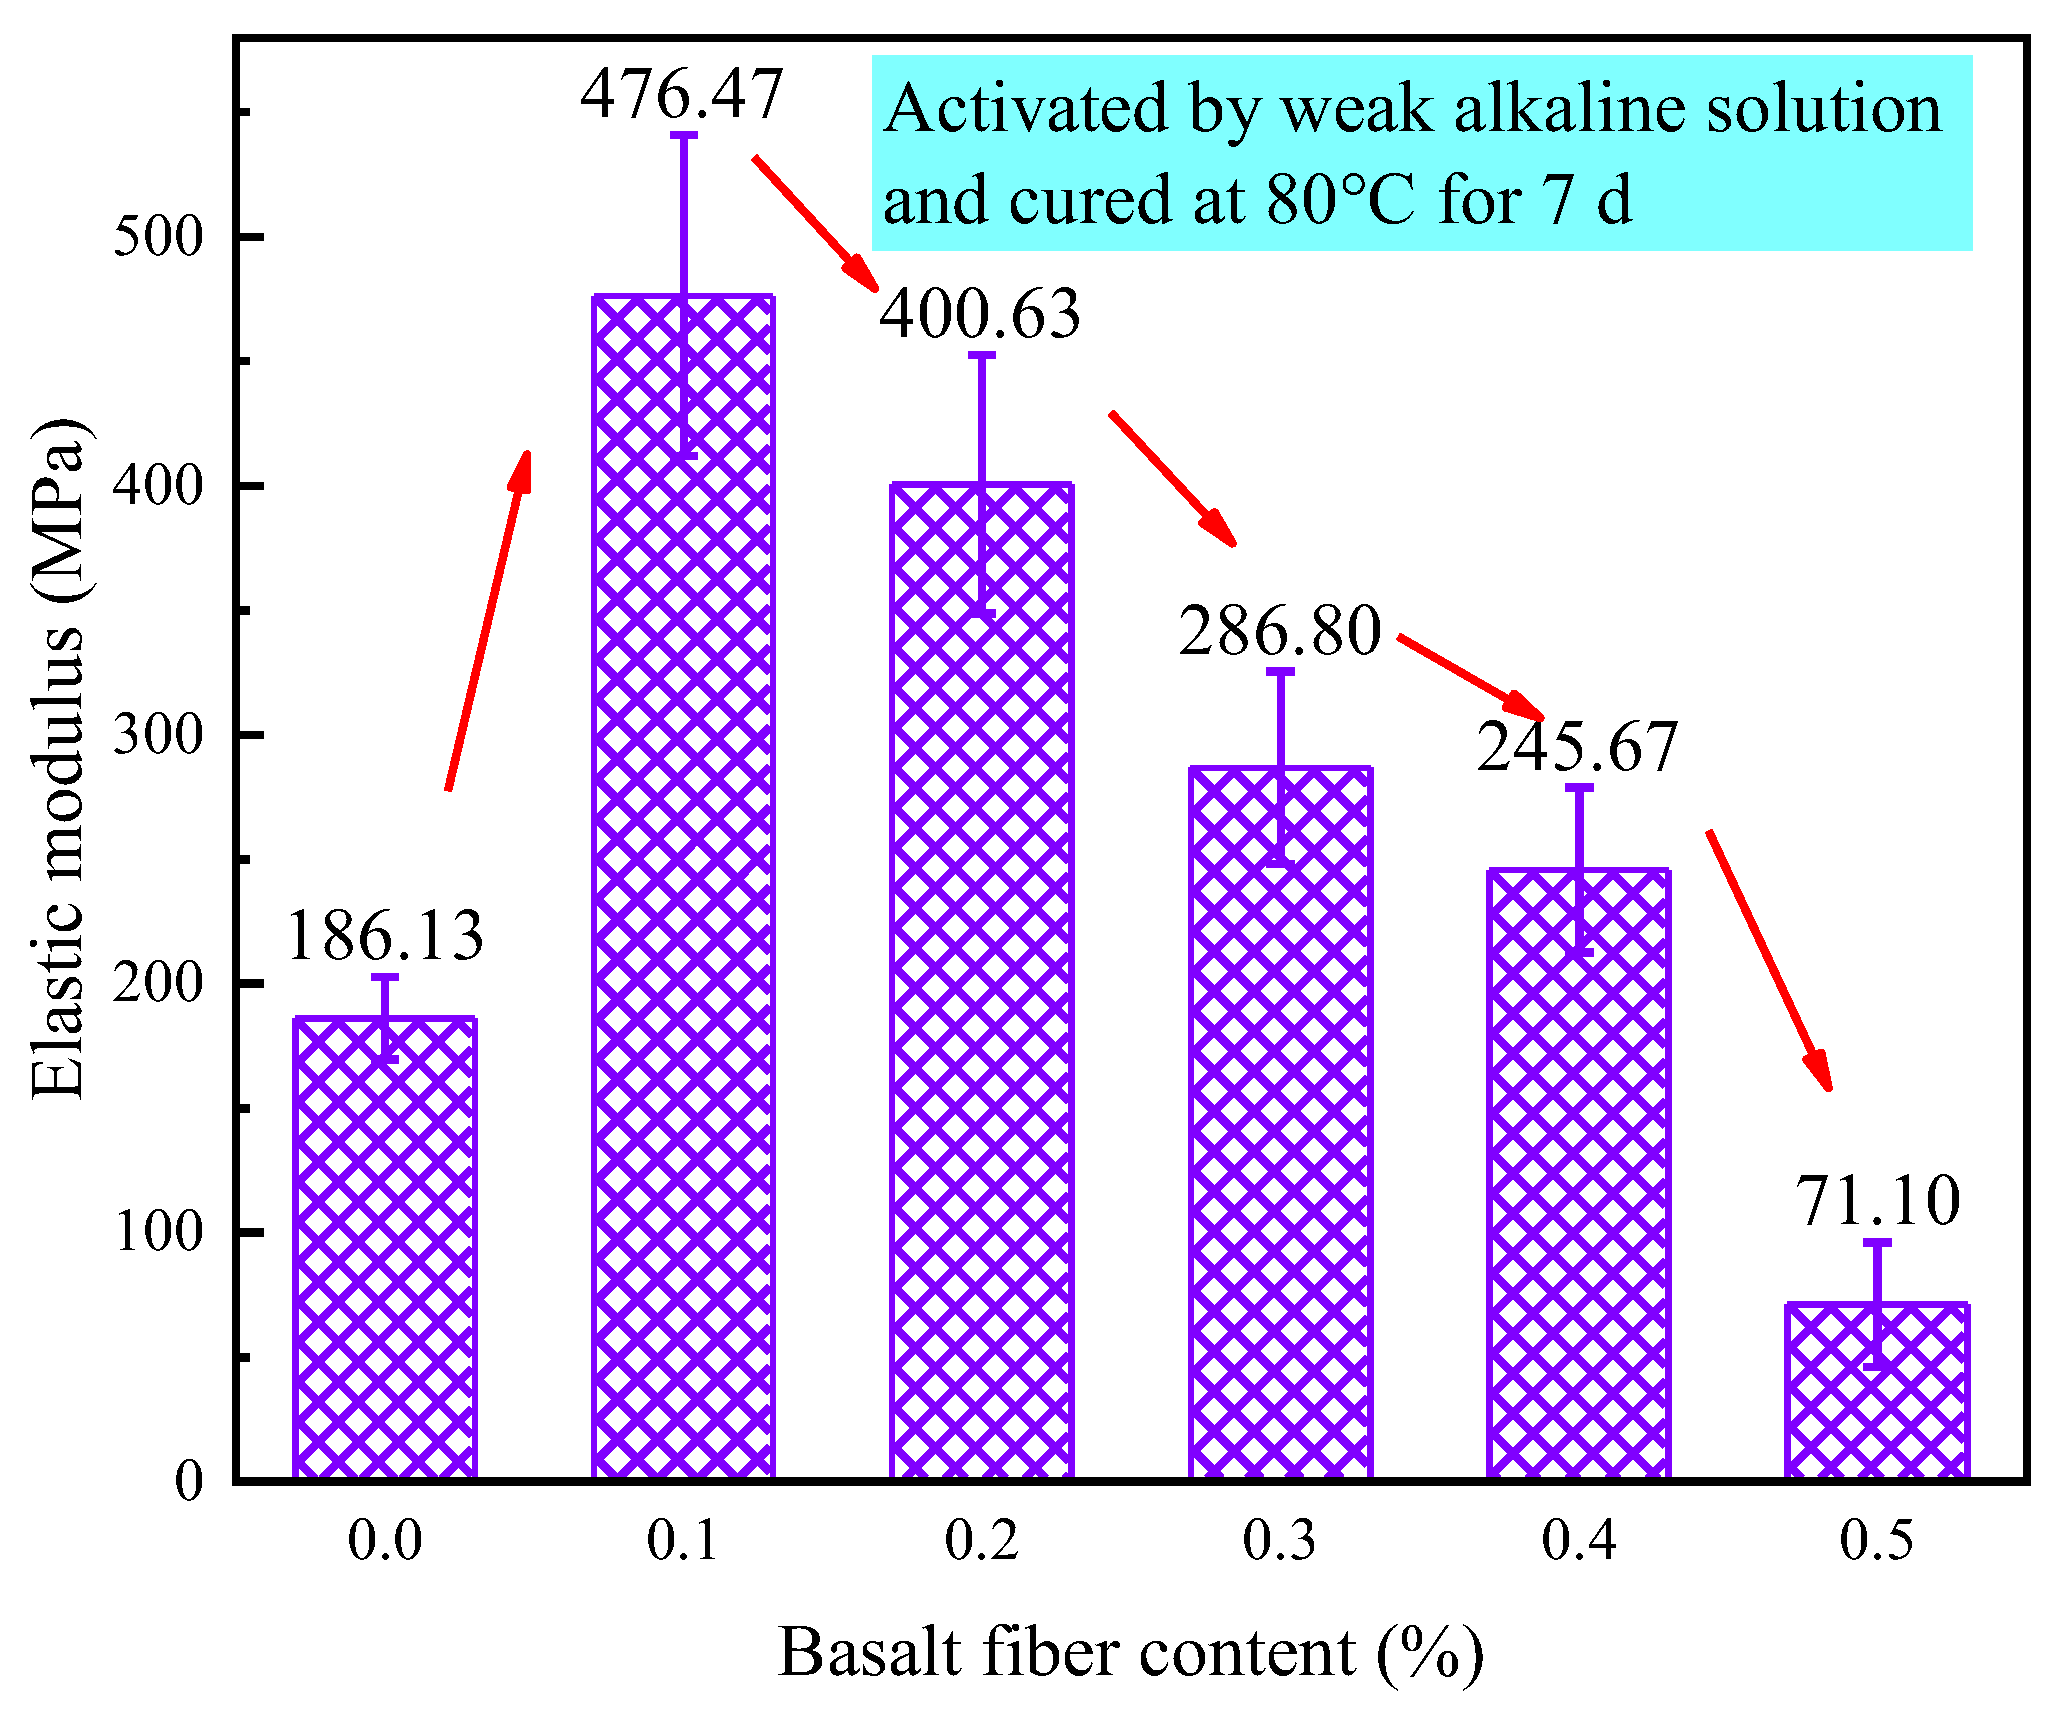
Figure 27.
Elastic modulus of LRS geopolymers with different fiber contents under weak alkali activation and cured at 80 °C for 7 d.
Figure 27.
Elastic modulus of LRS geopolymers with different fiber contents under weak alkali activation and cured at 80 °C for 7 d.
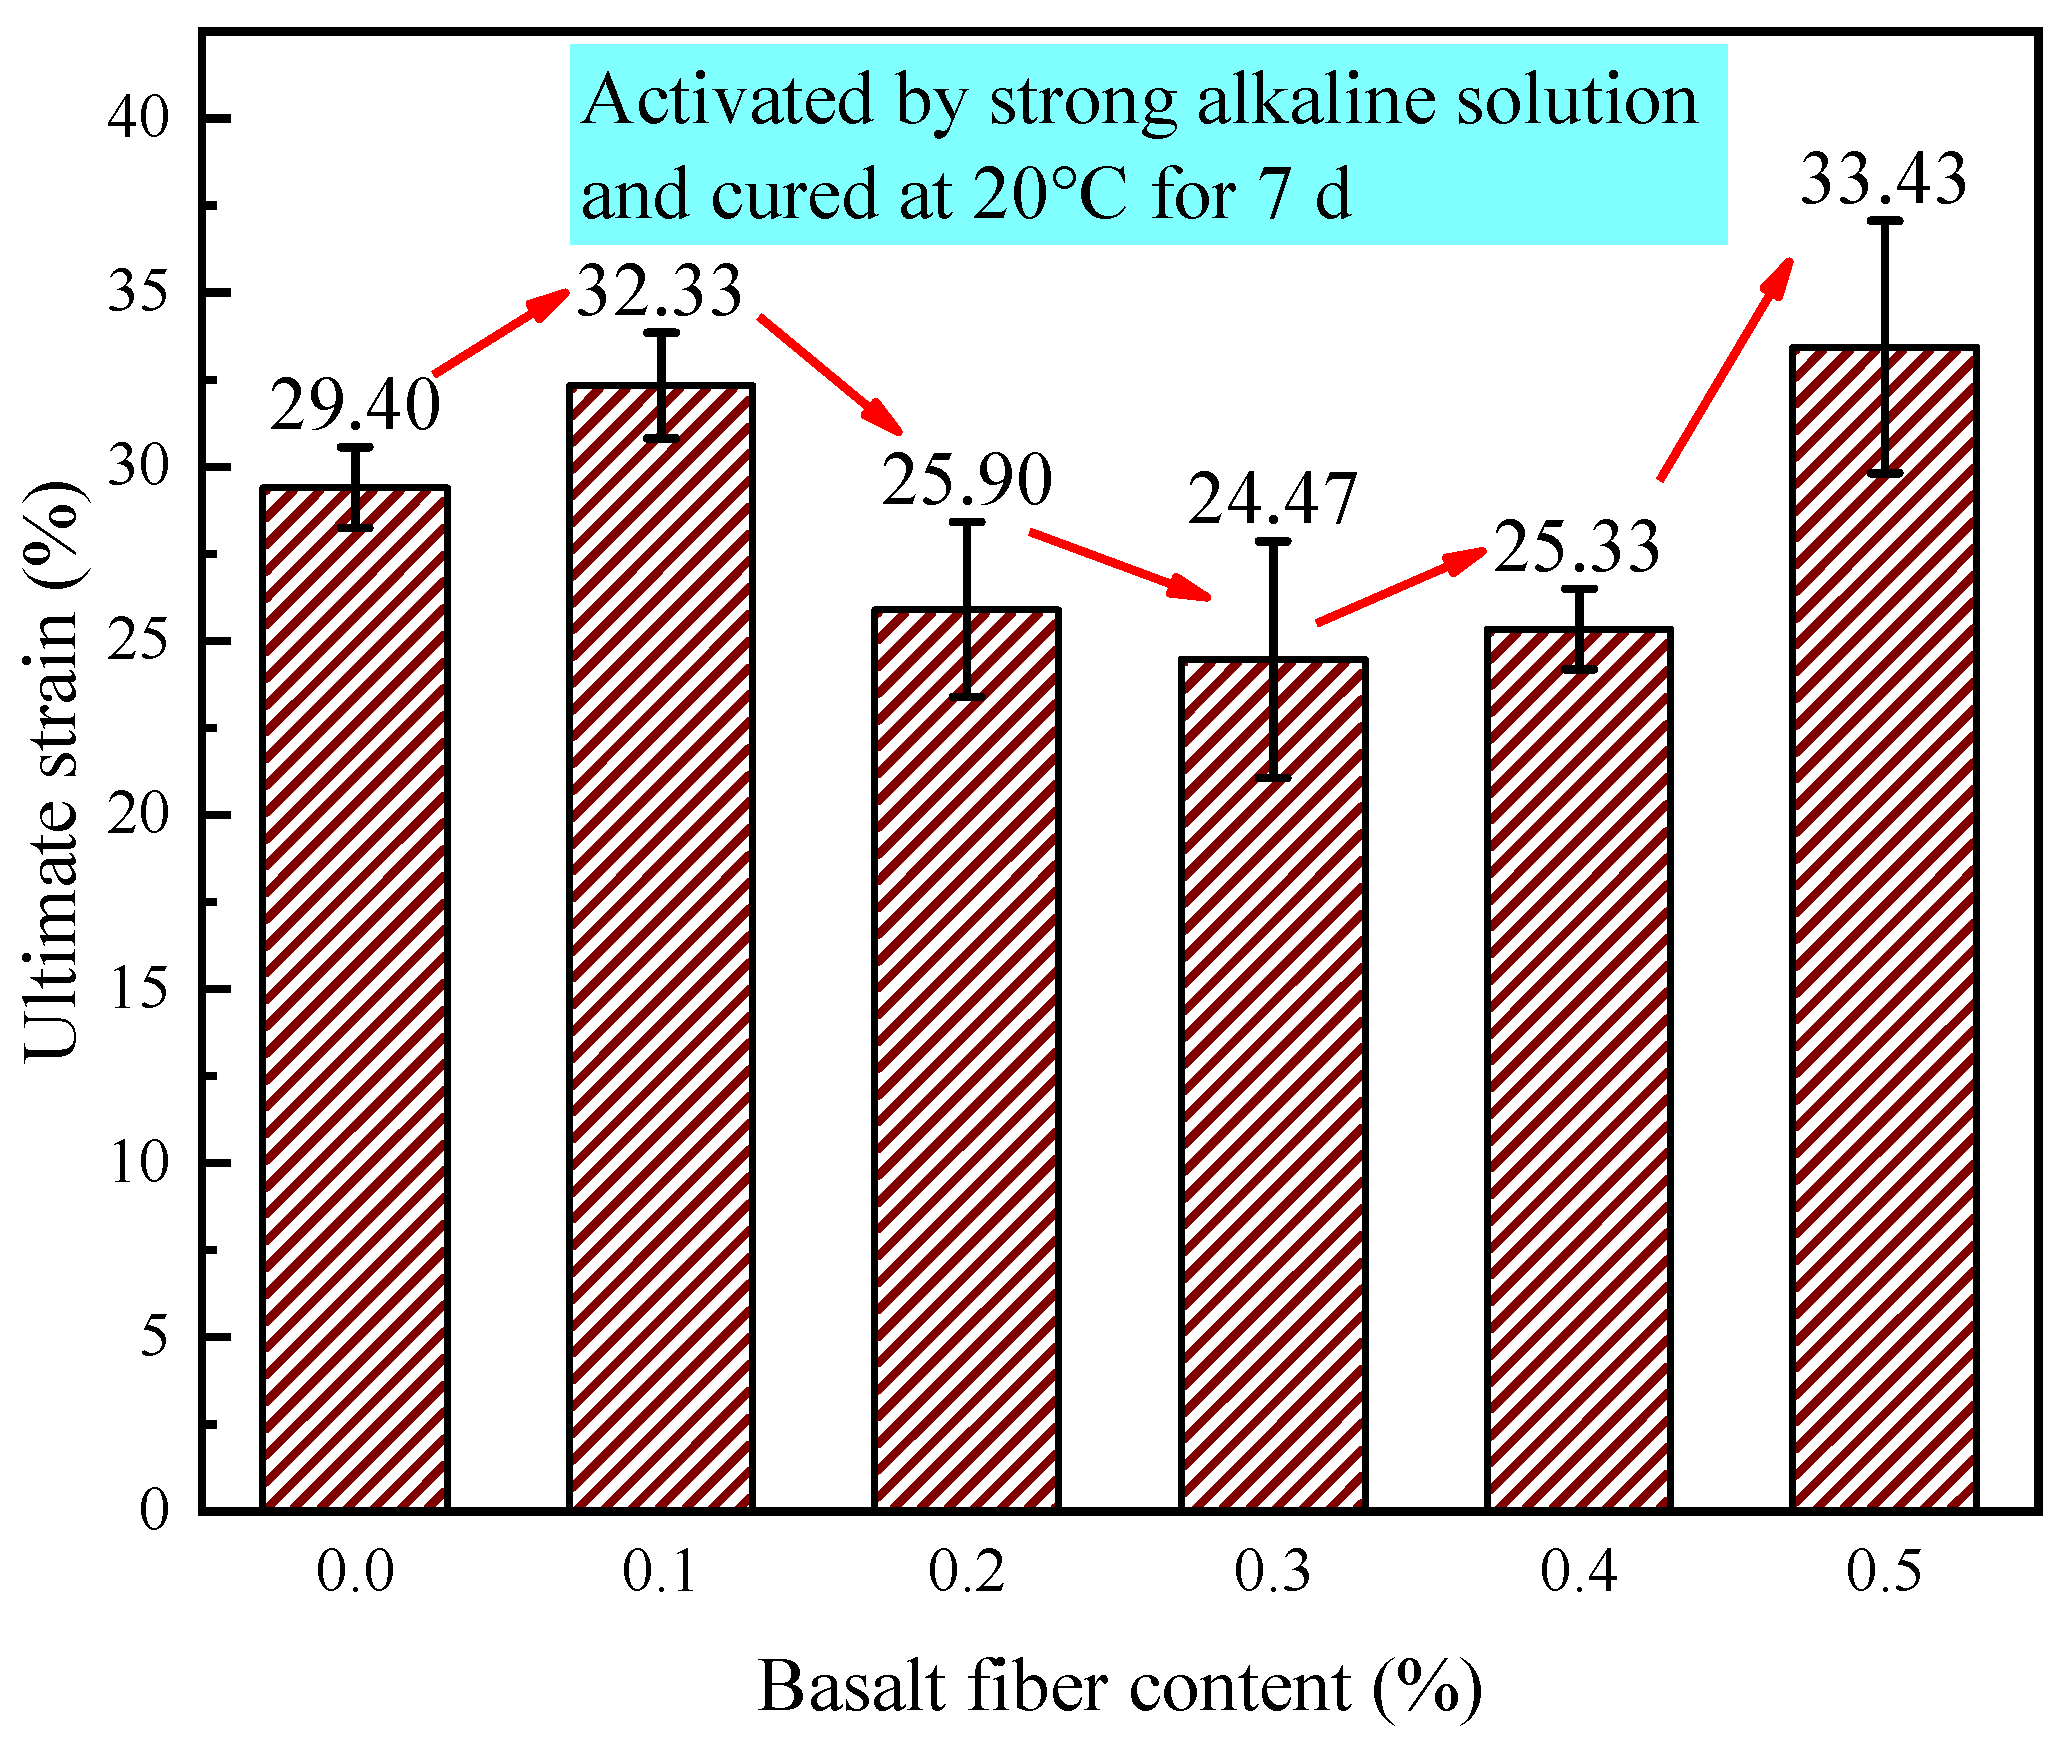
Figure 28.
Ultimate strain of LRS geopolymers with different fiber contents under strong alkali activation and cured at 20 °C for 7 d.
Figure 28.
Ultimate strain of LRS geopolymers with different fiber contents under strong alkali activation and cured at 20 °C for 7 d.
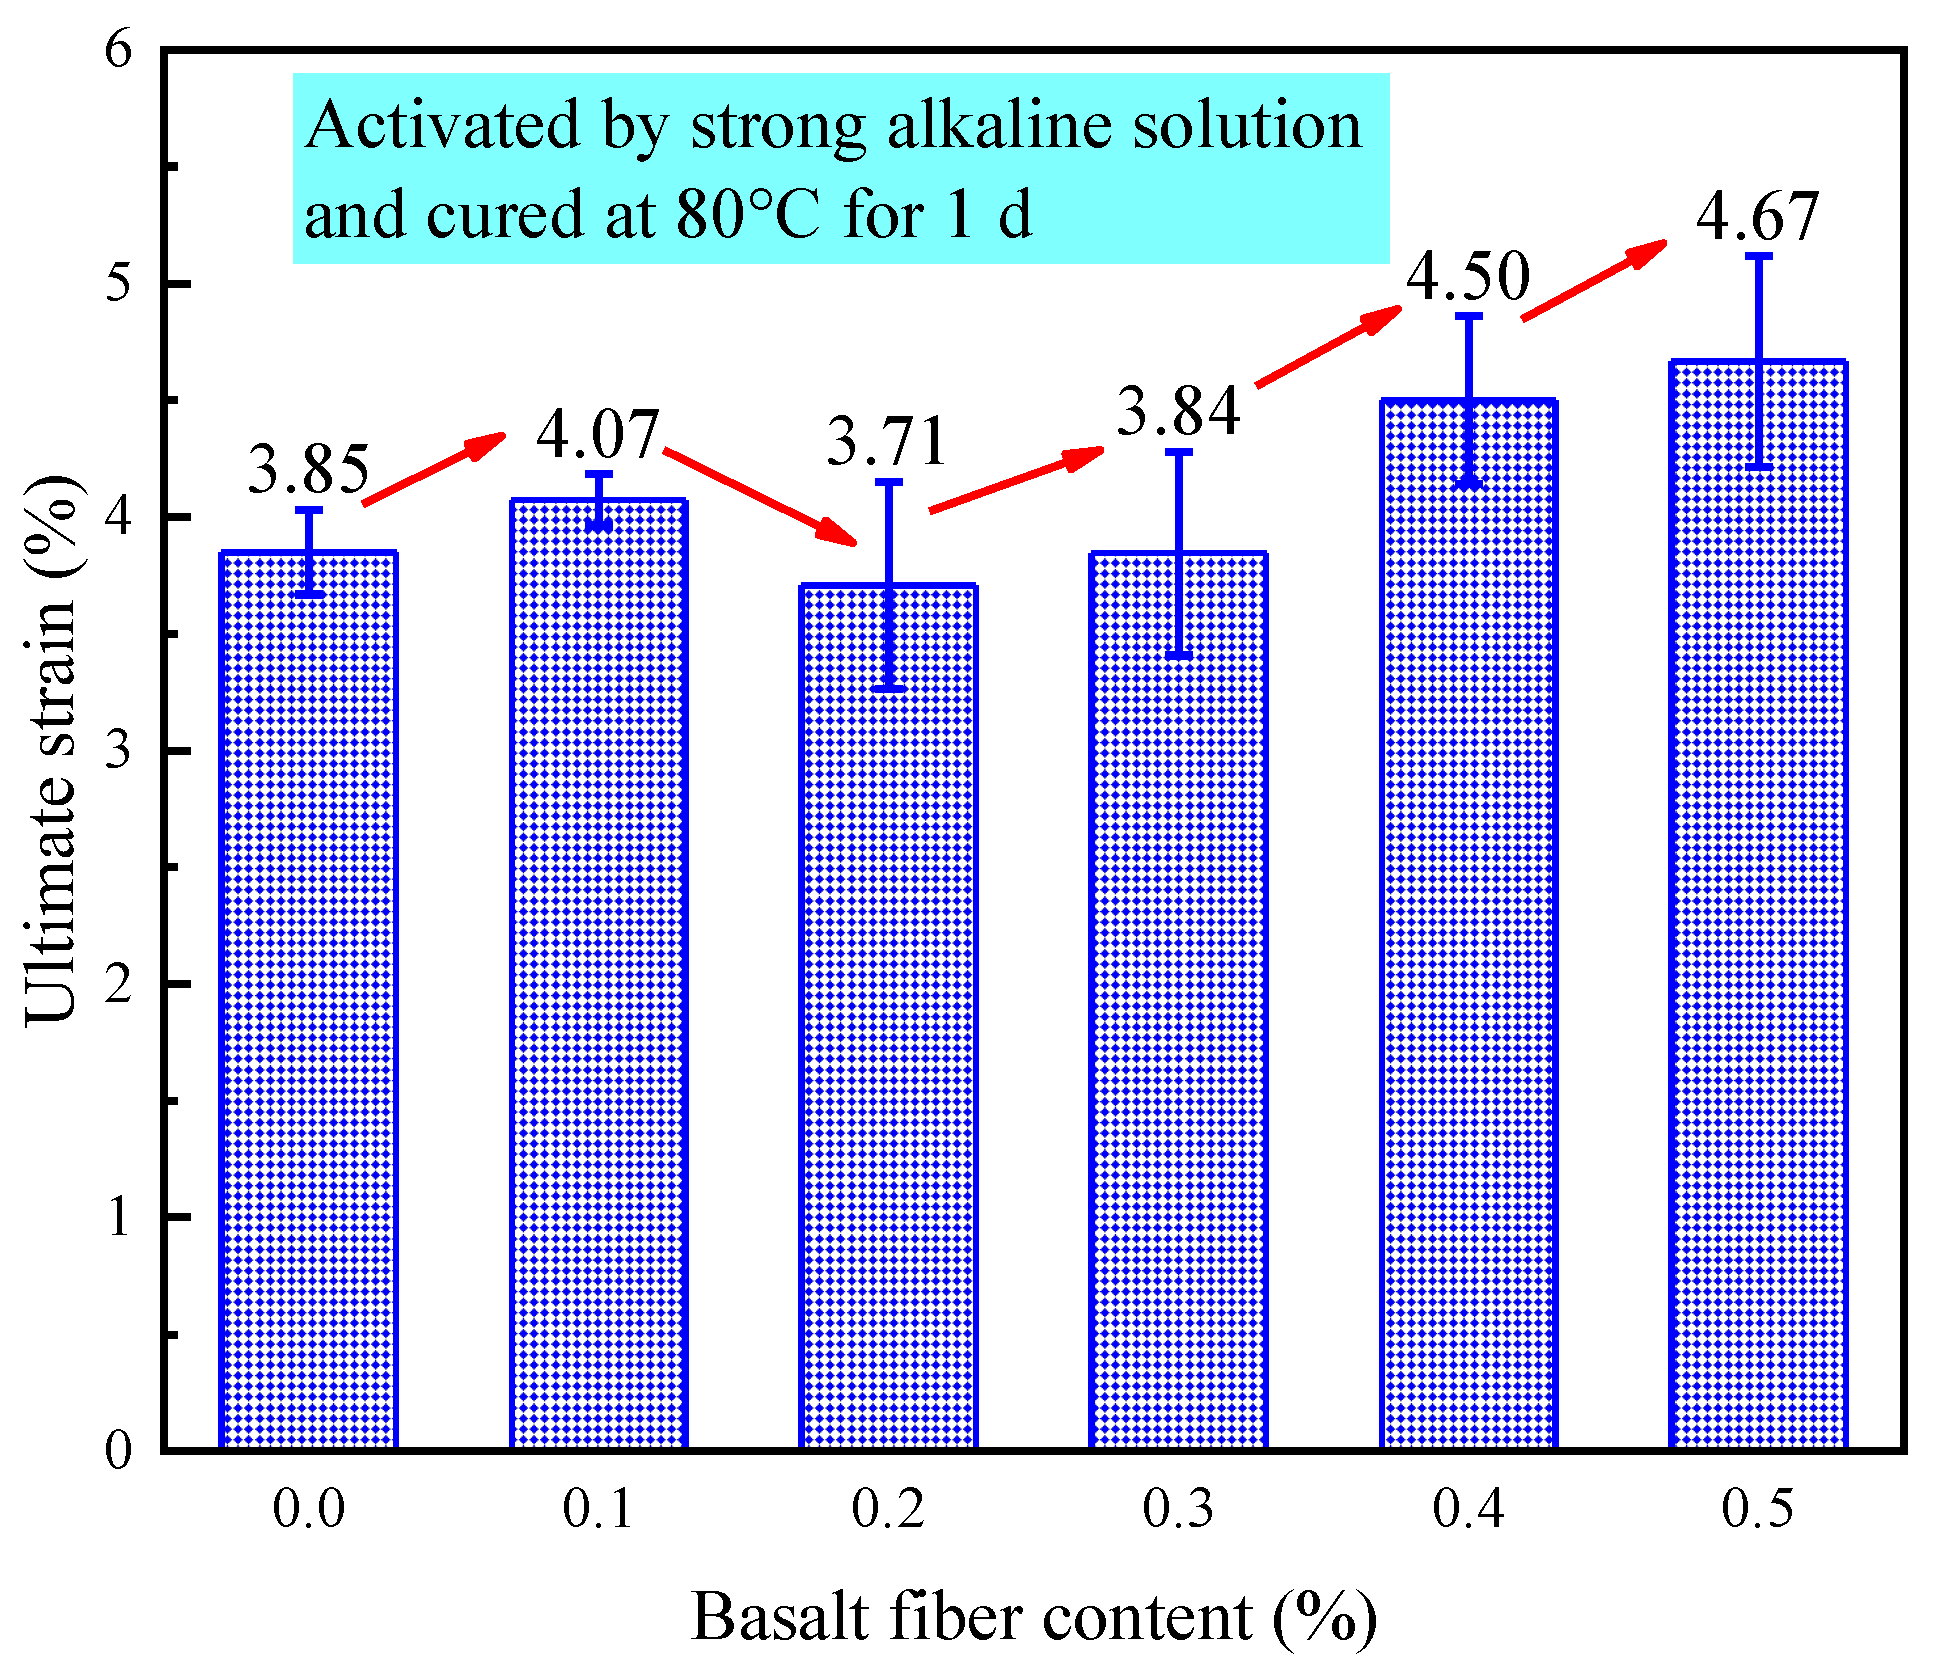
Figure 29.
Ultimate strain of LRS geopolymers with different fiber contents under strong alkali activation and cured at 80 °C for 1 d.
Figure 29.
Ultimate strain of LRS geopolymers with different fiber contents under strong alkali activation and cured at 80 °C for 1 d.
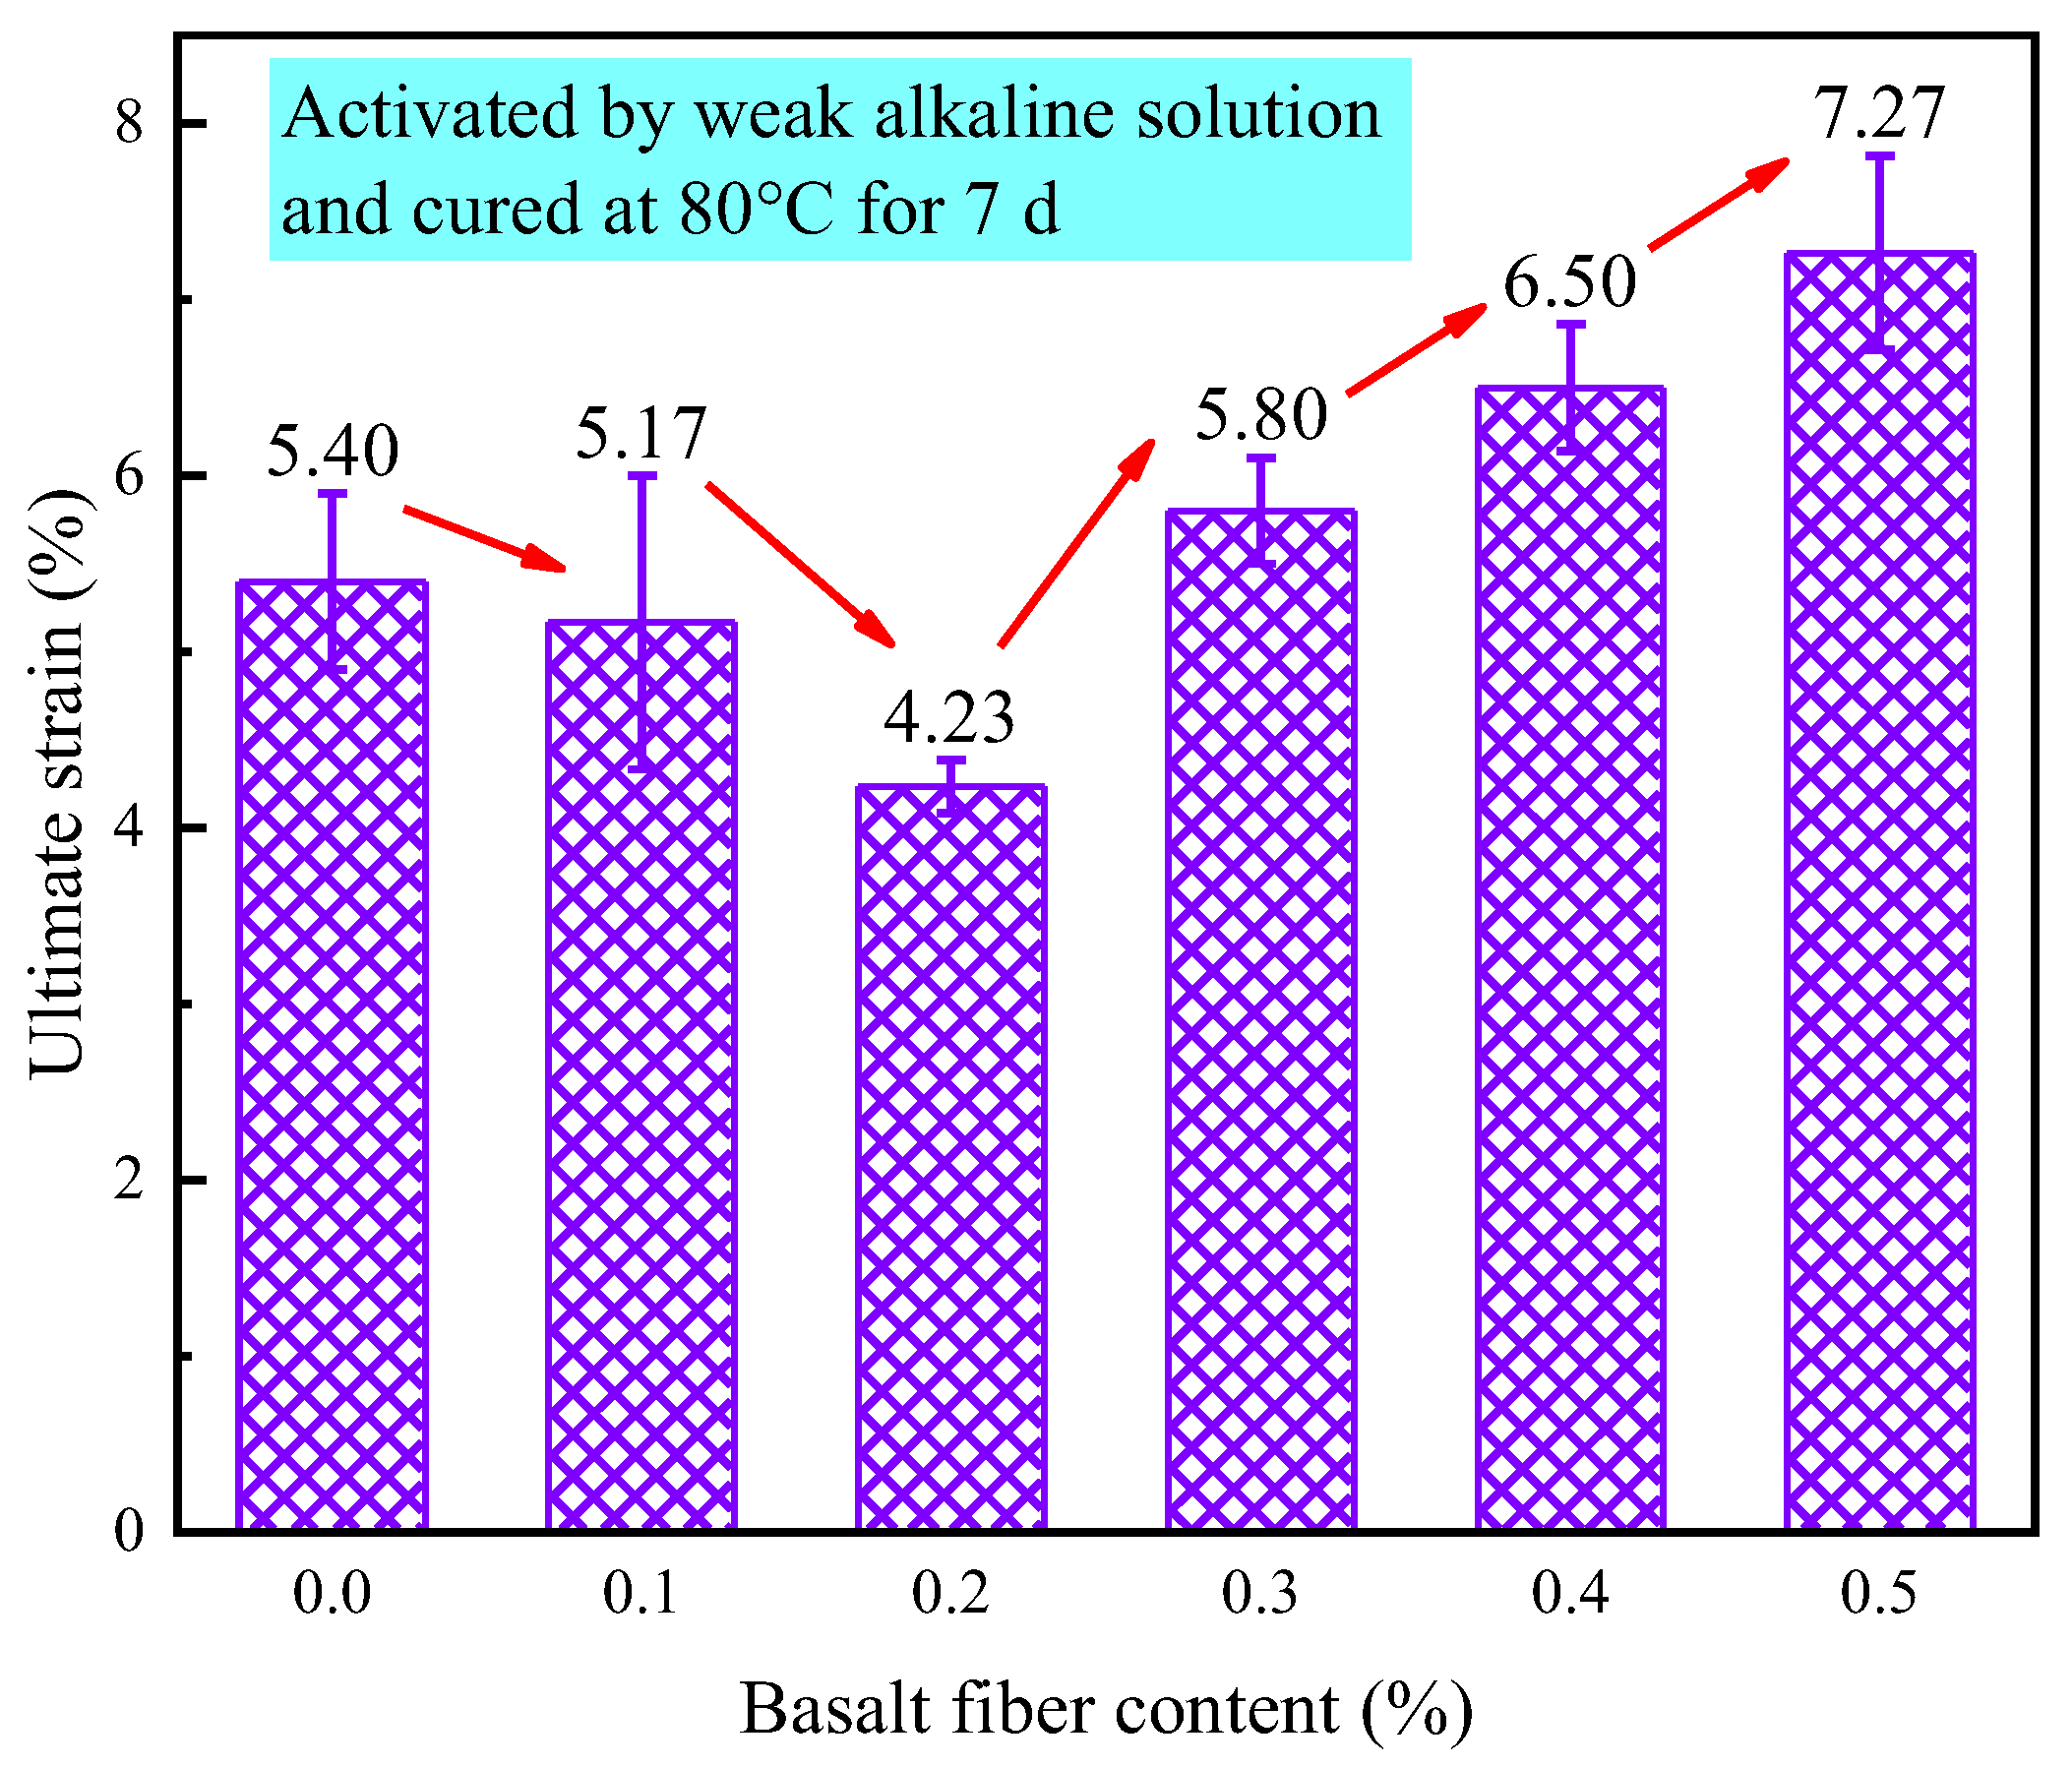
Figure 30.
Ultimate strain of LRS geopolymers with different fiber contents under weak alkali activation and cured at 80 °C for 7 d.
Figure 30.
Ultimate strain of LRS geopolymers with different fiber contents under weak alkali activation and cured at 80 °C for 7 d.
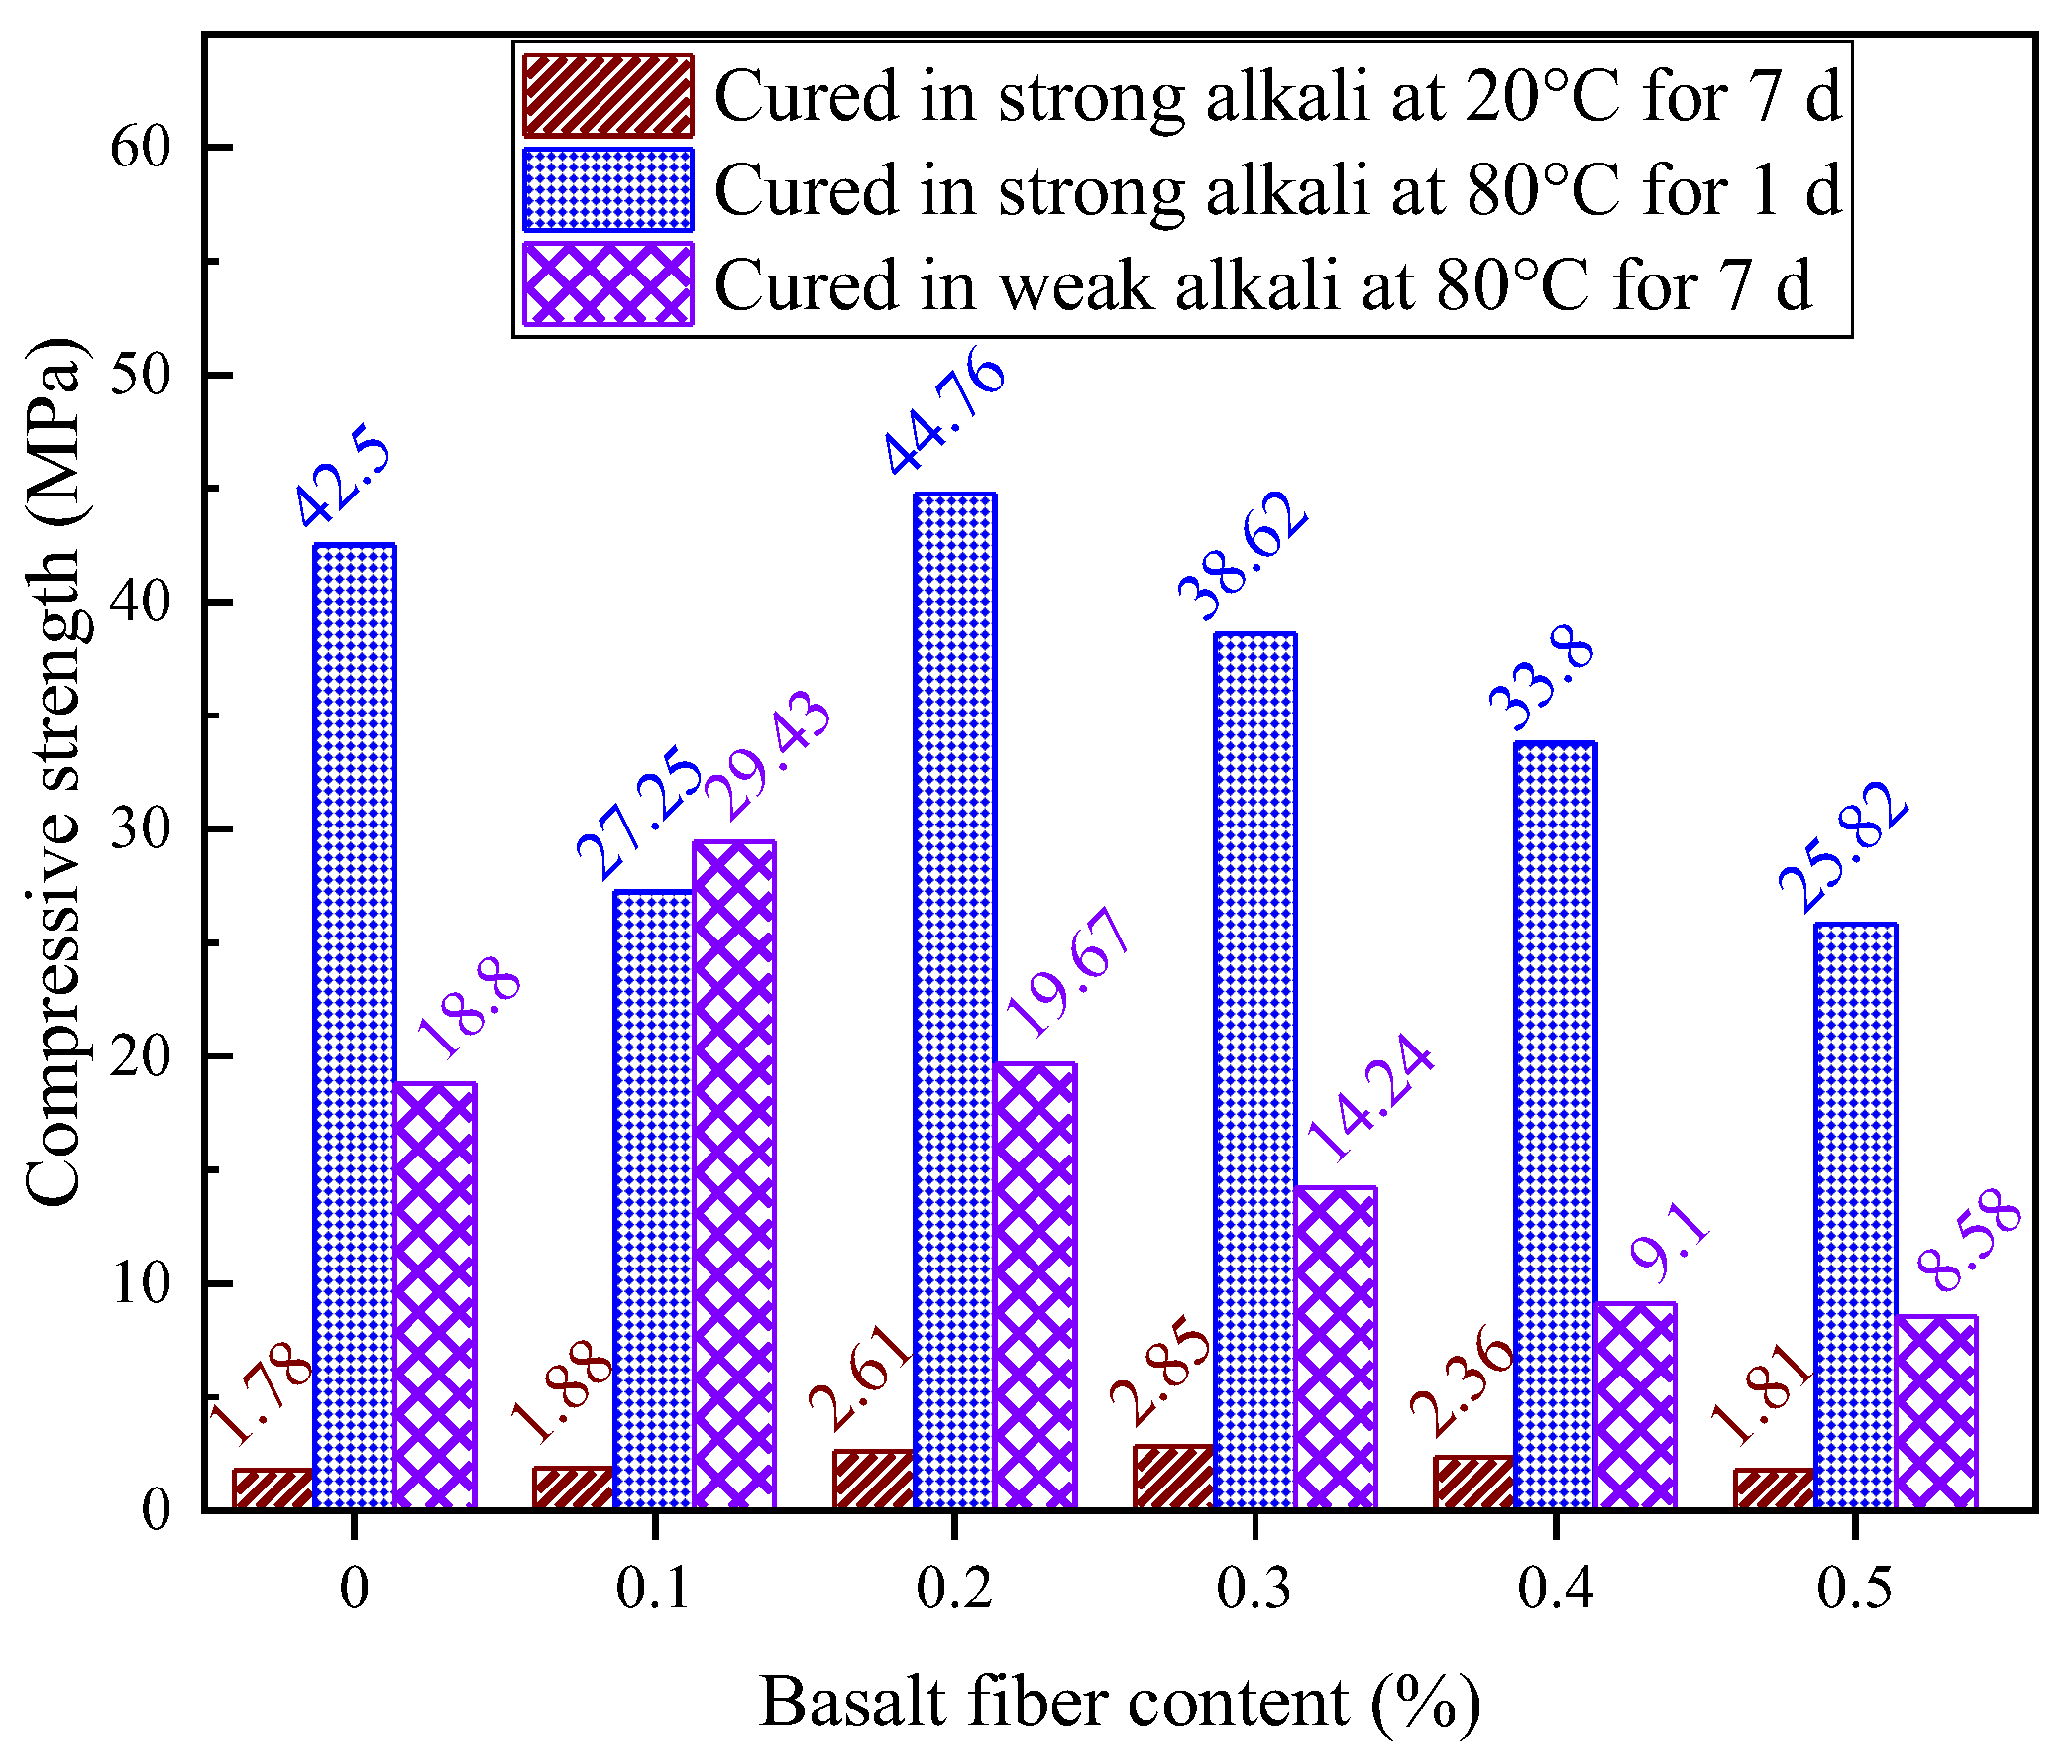
Figure 31.
Comparison of compressive strength of LRS geopolymers in different environments.
Figure 31.
Comparison of compressive strength of LRS geopolymers in different environments.
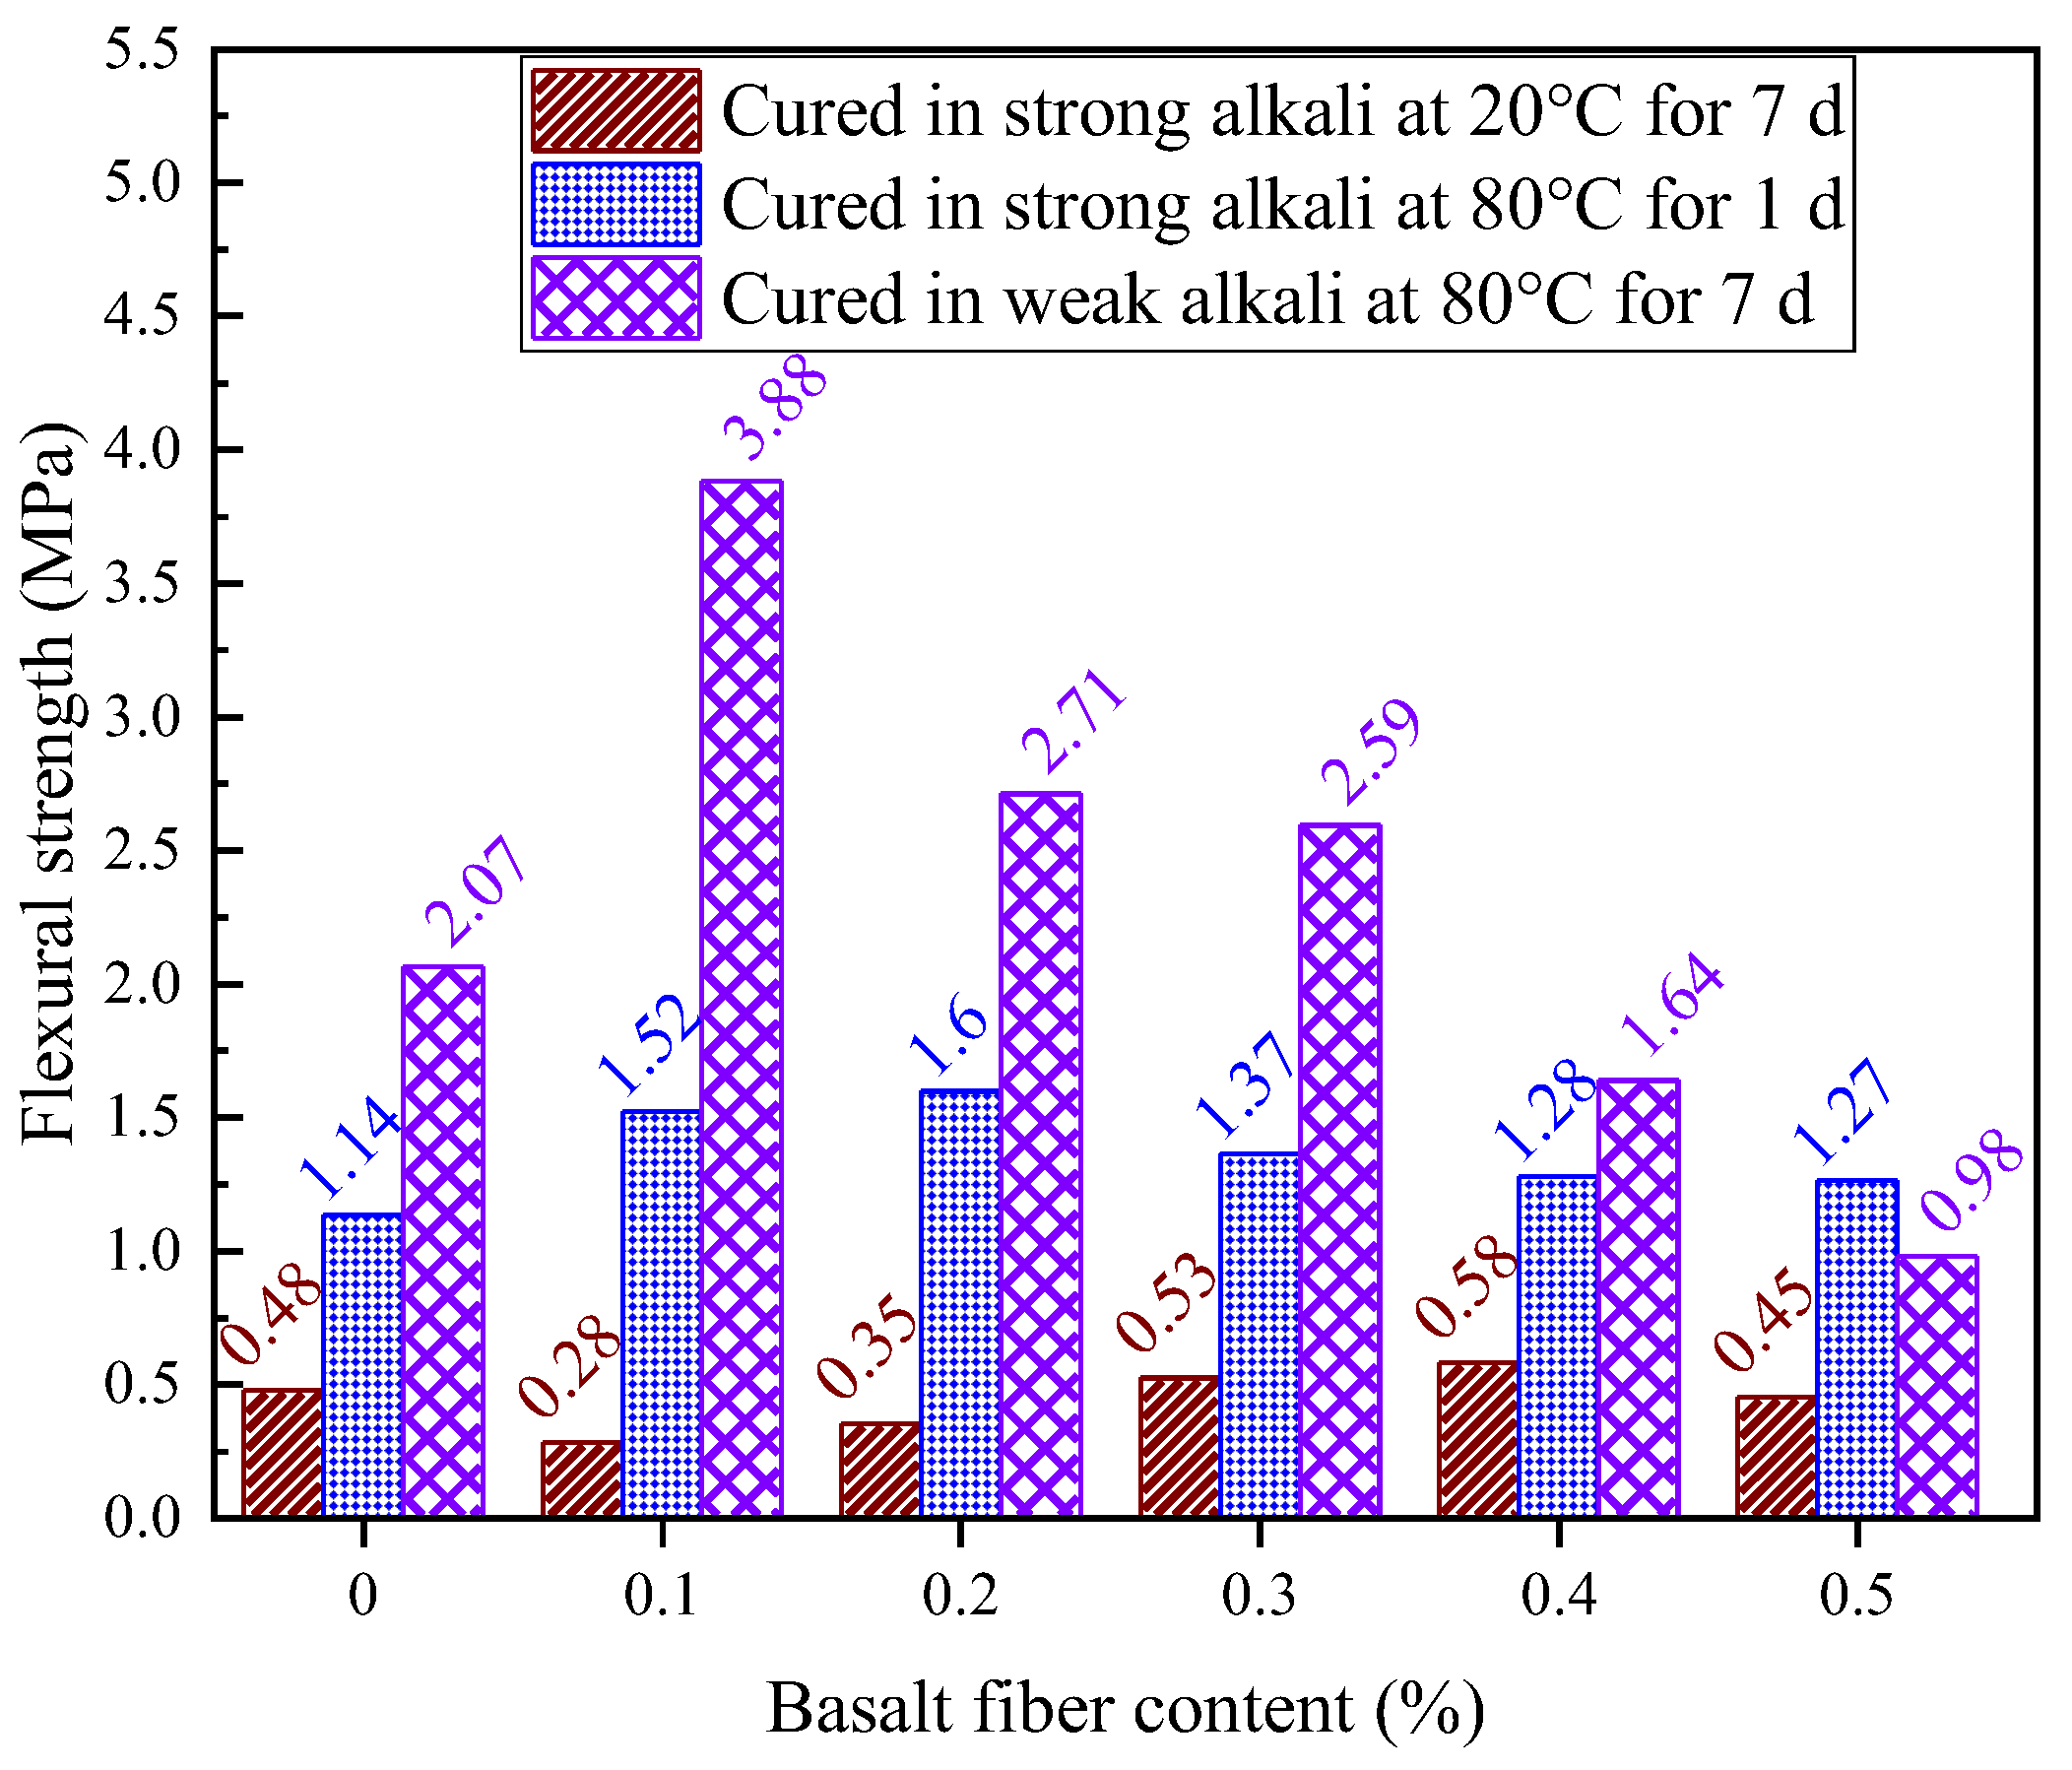
Figure 32.
Comparison of flexural strength of LRS geopolymers in different environments.
Figure 32.
Comparison of flexural strength of LRS geopolymers in different environments.
Figure 33.
Comparison of compressive failure modes of LRS geopolymer compressive test blocks in different environments. (a) Curing in strong alkali at 20 °C for 7 d. (b) Strong alkali curing at 80 °C for 1 d. (c) Weak alkali curing at 80 °C for 7 d.
Figure 33.
Comparison of compressive failure modes of LRS geopolymer compressive test blocks in different environments. (a) Curing in strong alkali at 20 °C for 7 d. (b) Strong alkali curing at 80 °C for 1 d. (c) Weak alkali curing at 80 °C for 7 d.
Figure 34.
Comparison of flexural failure modes of LRS geopolymer compressive test blocks in different environments. (a) Curing in strong alkali at 20 °C for 7 d. (b) Strong alkali curing at 80 °C for 1 d. (c) Weak alkali curing at 80 °C for 7 d.
Figure 34.
Comparison of flexural failure modes of LRS geopolymer compressive test blocks in different environments. (a) Curing in strong alkali at 20 °C for 7 d. (b) Strong alkali curing at 80 °C for 1 d. (c) Weak alkali curing at 80 °C for 7 d.
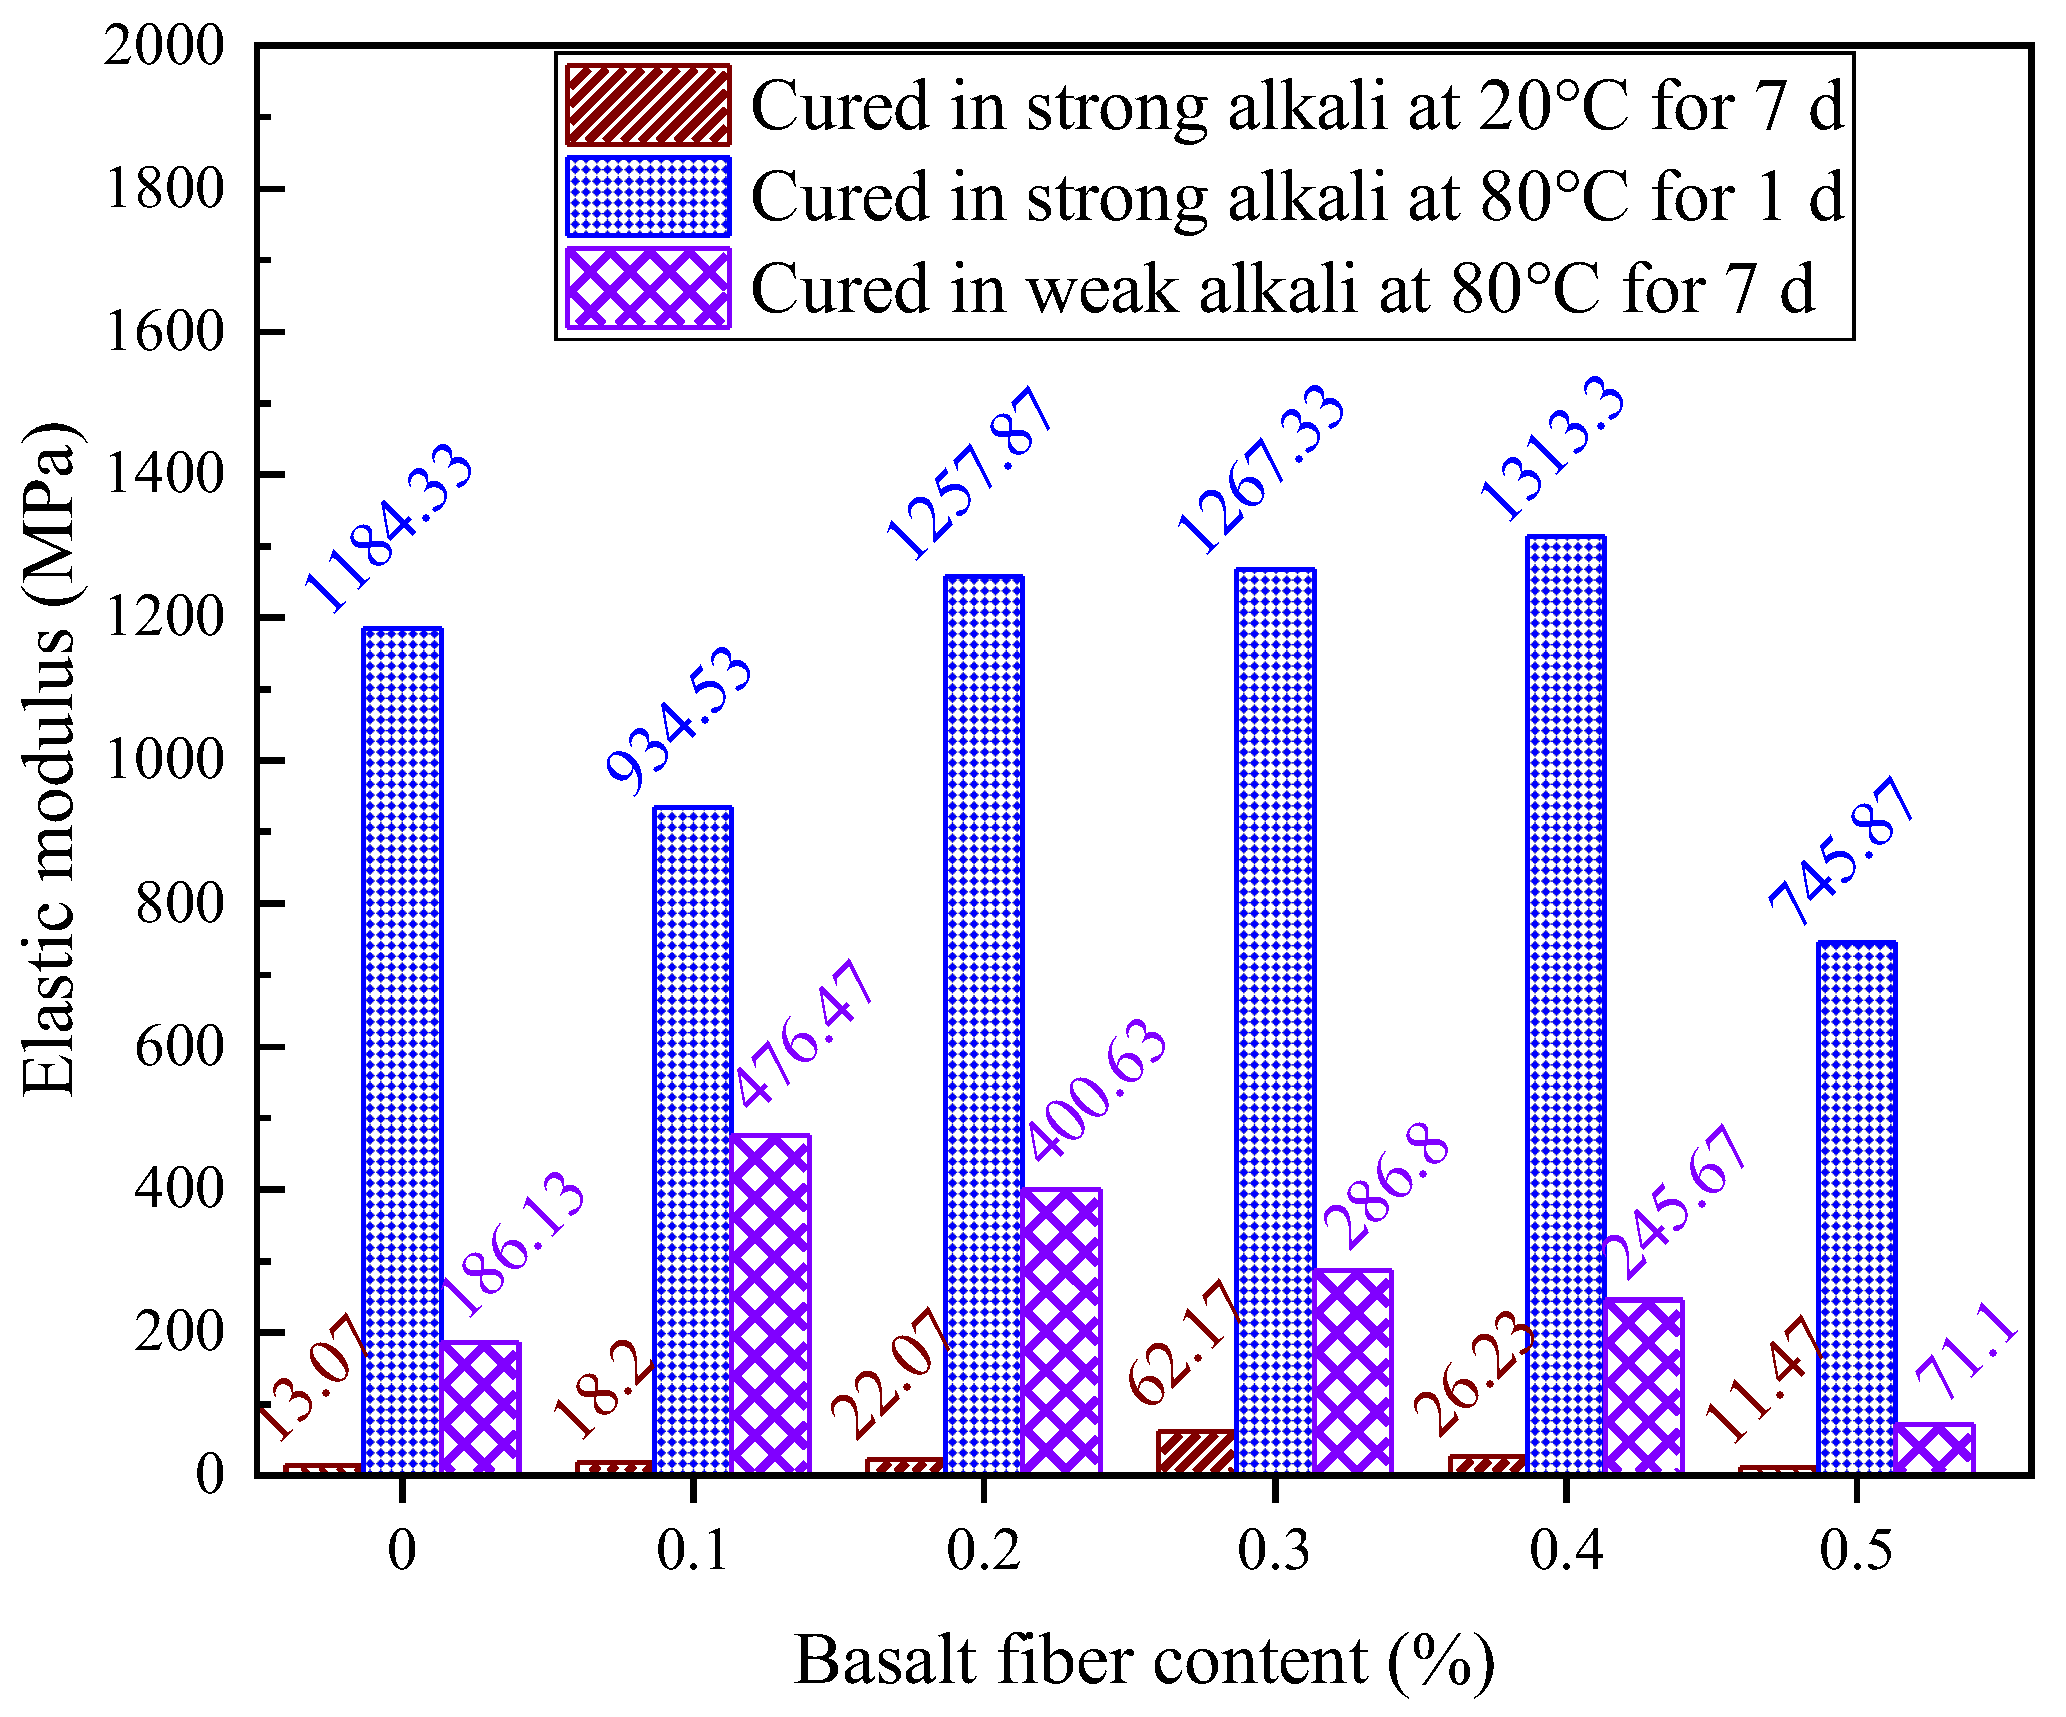
Figure 35.
Comparison of the elastic modulus of LRS geopolymers in different environments.
Figure 35.
Comparison of the elastic modulus of LRS geopolymers in different environments.
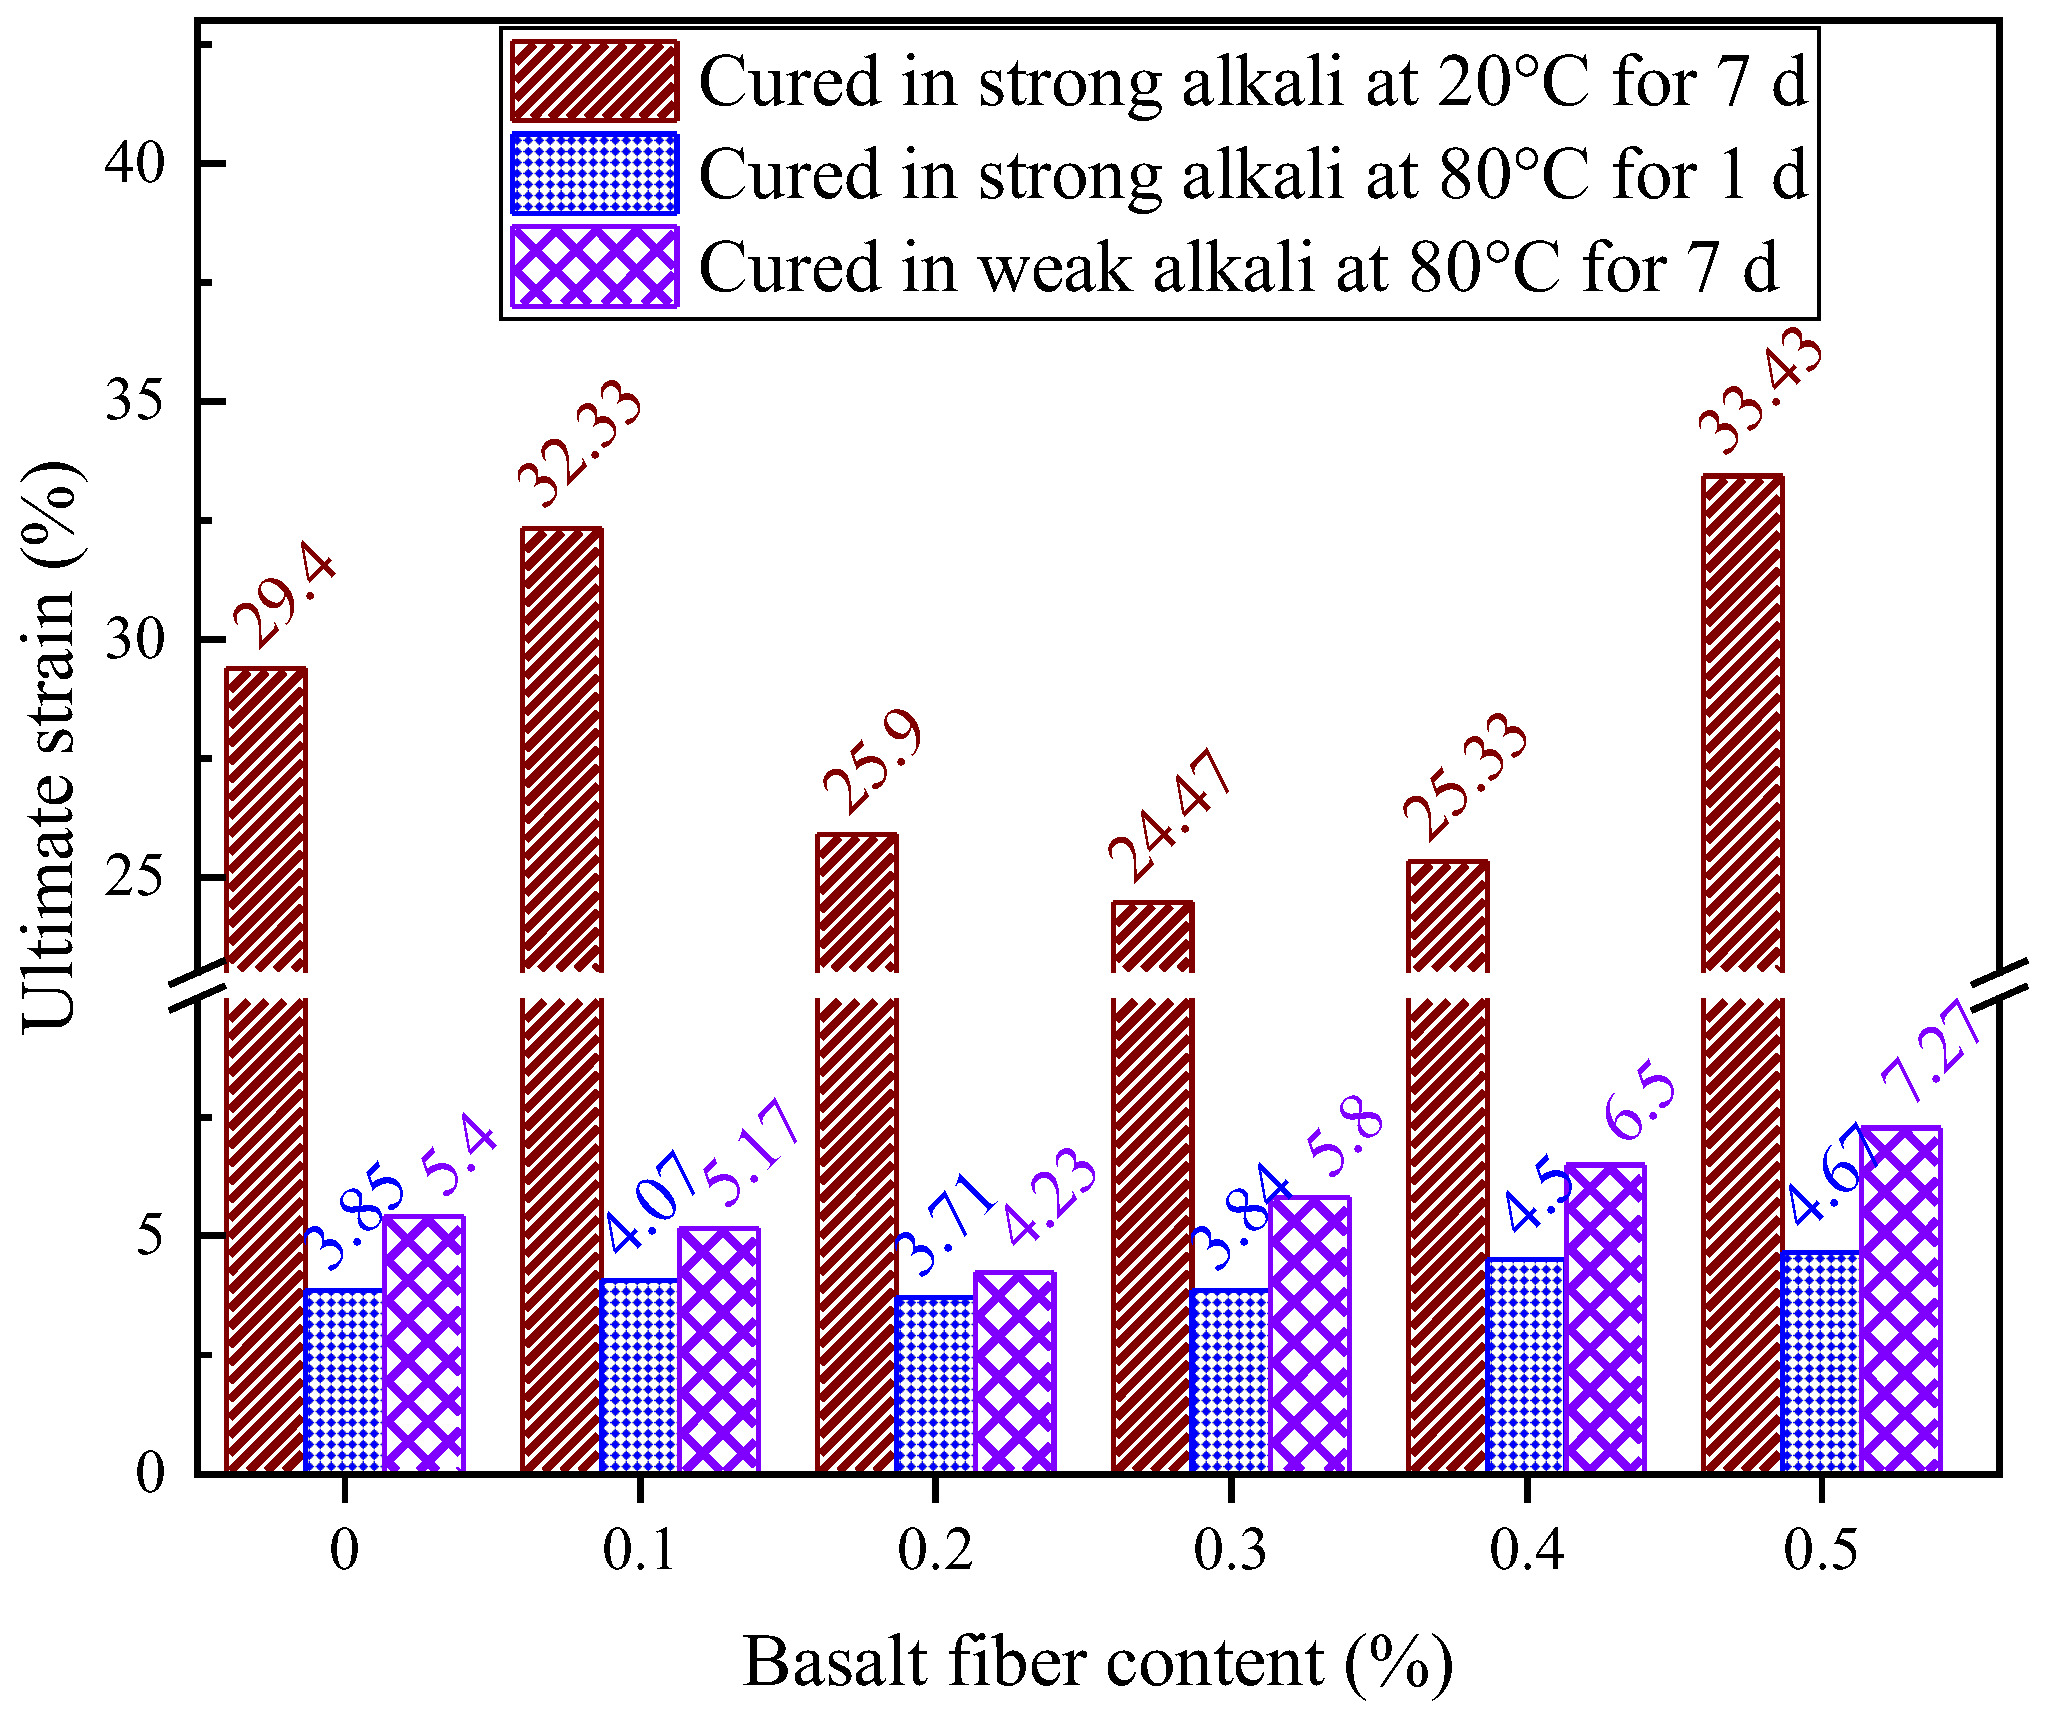
Figure 36.
Comparison of ultimate strains of LRS geopolymers in different environments.
Figure 36.
Comparison of ultimate strains of LRS geopolymers in different environments.
Table 1.
Comparison of the chemical composition of lunar regolith simulant (%).
Table 1.
Comparison of the chemical composition of lunar regolith simulant (%).
| Sample | SiO2 | TiO2 | Al2O3 | Fe2O3 | CaO | MgO | Na2O | K2O | P2O5 |
|---|
| CQU-1 | 45.31 | 2.80 | 15.01 | 15.67 | 8.34 | 3.41 | 4.50 | 3.33 | 0.65 |
| HUST-1 [9] | 48.23 | 2.96 | 18.29 | 11.19 | 7.89 | 4.41 | 3.70 | 2.15 | 0.50 |
| BH-1 [10] | 43.30 | 2.90 | 16.50 | 16.70 | 8.80 | 3.00 | 3.80 | 3.30 | 0.70 |
| CAS-1 [8] | 49.24 | 1.91 | 15.80 | 11.47 | 7.20 | 8.72 | 3.08 | 1.03 | 0.30 |
| CE-5 [27] | 42.20 | 5.00 | 10.80 | 22.50 | 11.00 | 6.48 | 0.26 | 0.19 | 0.23 |
| Apollo 14 [28] | 48.10 | 1.70 | 17.40 | 10.40 | 10.70 | 9.40 | 0.70 | 0.55 | 0.51 |
Table 2.
Parameters of sodium silicate solution.
Table 2.
Parameters of sodium silicate solution.
| SiO2/wt.% | Na2O/wt.% | Modulus | Density (20 °C) g/mL | Baumé Degree (20 °C) | Transparency/% | Fe/% |
|---|
| 26.5 | 8.3 | 3.3 | 1.368 | 39.0 | 85.0 | 0.005 |
Table 3.
Physical properties of basalt fibers.
Table 3.
Physical properties of basalt fibers.
| Monofilament Diameter | Density (g/cm3) | Elastic Modulus (GPa) | Tensile Strength (MPa) | Service Temperature | Bonding Temperature |
|---|
| 10 μm | 2.63~2.65 | 91~110 | 3000~4800 | −269–650 °C | 1050 °C |
Table 4.
Alkali solution parameters.
Table 4.
Alkali solution parameters.
| Type of Solution | Modulus | Alkali Content | Water-Binder |
|---|
| Strong alkali | 1.5 | 10 | 0.25 |
| Weak alkali | 3.3 | 8.3 | 0.456 |
Table 5.
Mix proportion.
| Number | Water/
Binder Ratio | Na2O Content (%) | Modulus | LRS (g) | NaOH (g) | Na2SiO3 (g) |
|---|
| Strong alkaline solution | 0.25 | 10 | 1.5 | 100 | 7.05 | 54.67 |
| Weak alkaline solution | 0.456 | 8.3 | 3.3 | 100 | 0 | 100 |
Table 6.
Comparison of mechanical properties between the optimal content group and the control group after 7 d of curing at 20 °C.
Table 6.
Comparison of mechanical properties between the optimal content group and the control group after 7 d of curing at 20 °C.
| Number | Compressive Strength (MPa) | Flexural Strength (MPa) | Elastic Modulus (MPa) | Ultimate Strain (%) |
|---|
| Treatment group | 1.78 | 0.48 | 13.07 | 29.4 |
| Optimal content (0.3%) | 2.85 | 0.53 | 62.17 | 24.5 |
Table 7.
Comparison of the mechanical properties of the optimal content group and the control group after 1 d of curing at 80 °C.
Table 7.
Comparison of the mechanical properties of the optimal content group and the control group after 1 d of curing at 80 °C.
| Number | Compressive Strength (MPa) | Flexural Strength (MPa) | Elastic Modulus (MPa) | Ultimate Strain (%) |
|---|
| Treatment group | 42.5 | 1.14 | 1184.33 | 3.85 |
| Optimal content (0.2%) | 44.76 | 1.6 | 1207.87 | 3.71 |
Table 8.
Comparison of the mechanical properties of the optimal content group and the control group after 7 d of curing at 80 °C.
Table 8.
Comparison of the mechanical properties of the optimal content group and the control group after 7 d of curing at 80 °C.
| Number | Compressive Strength (MPa) | Flexural Strength (MPa) | Elastic Modulus (MPa) | Ultimate Strain (%) |
|---|
| Treatment group | 29.43 | 2.07 | 186.13 | 5.4 |
| Optimal content (0.1%) | 18.8 | 3.88 | 476.47 | 5.17 |
