3.2. Microstructure Analysis
Figure 4 illustrates the microstructure at the interface between the coating and the substrate for various laser scanning speeds. As shown in
Figure 4, no penetrating cracks were observed at the interface between the substrate and the coating. There is an unfilled gap between the coating and the substrate. There are no densely distributed pores near the interface. On the contrary, the pores are linearly distributed along the interface. These results demonstrate that the interface bonding quality of the coatings prepared at various laser scanning speeds is satisfactory.
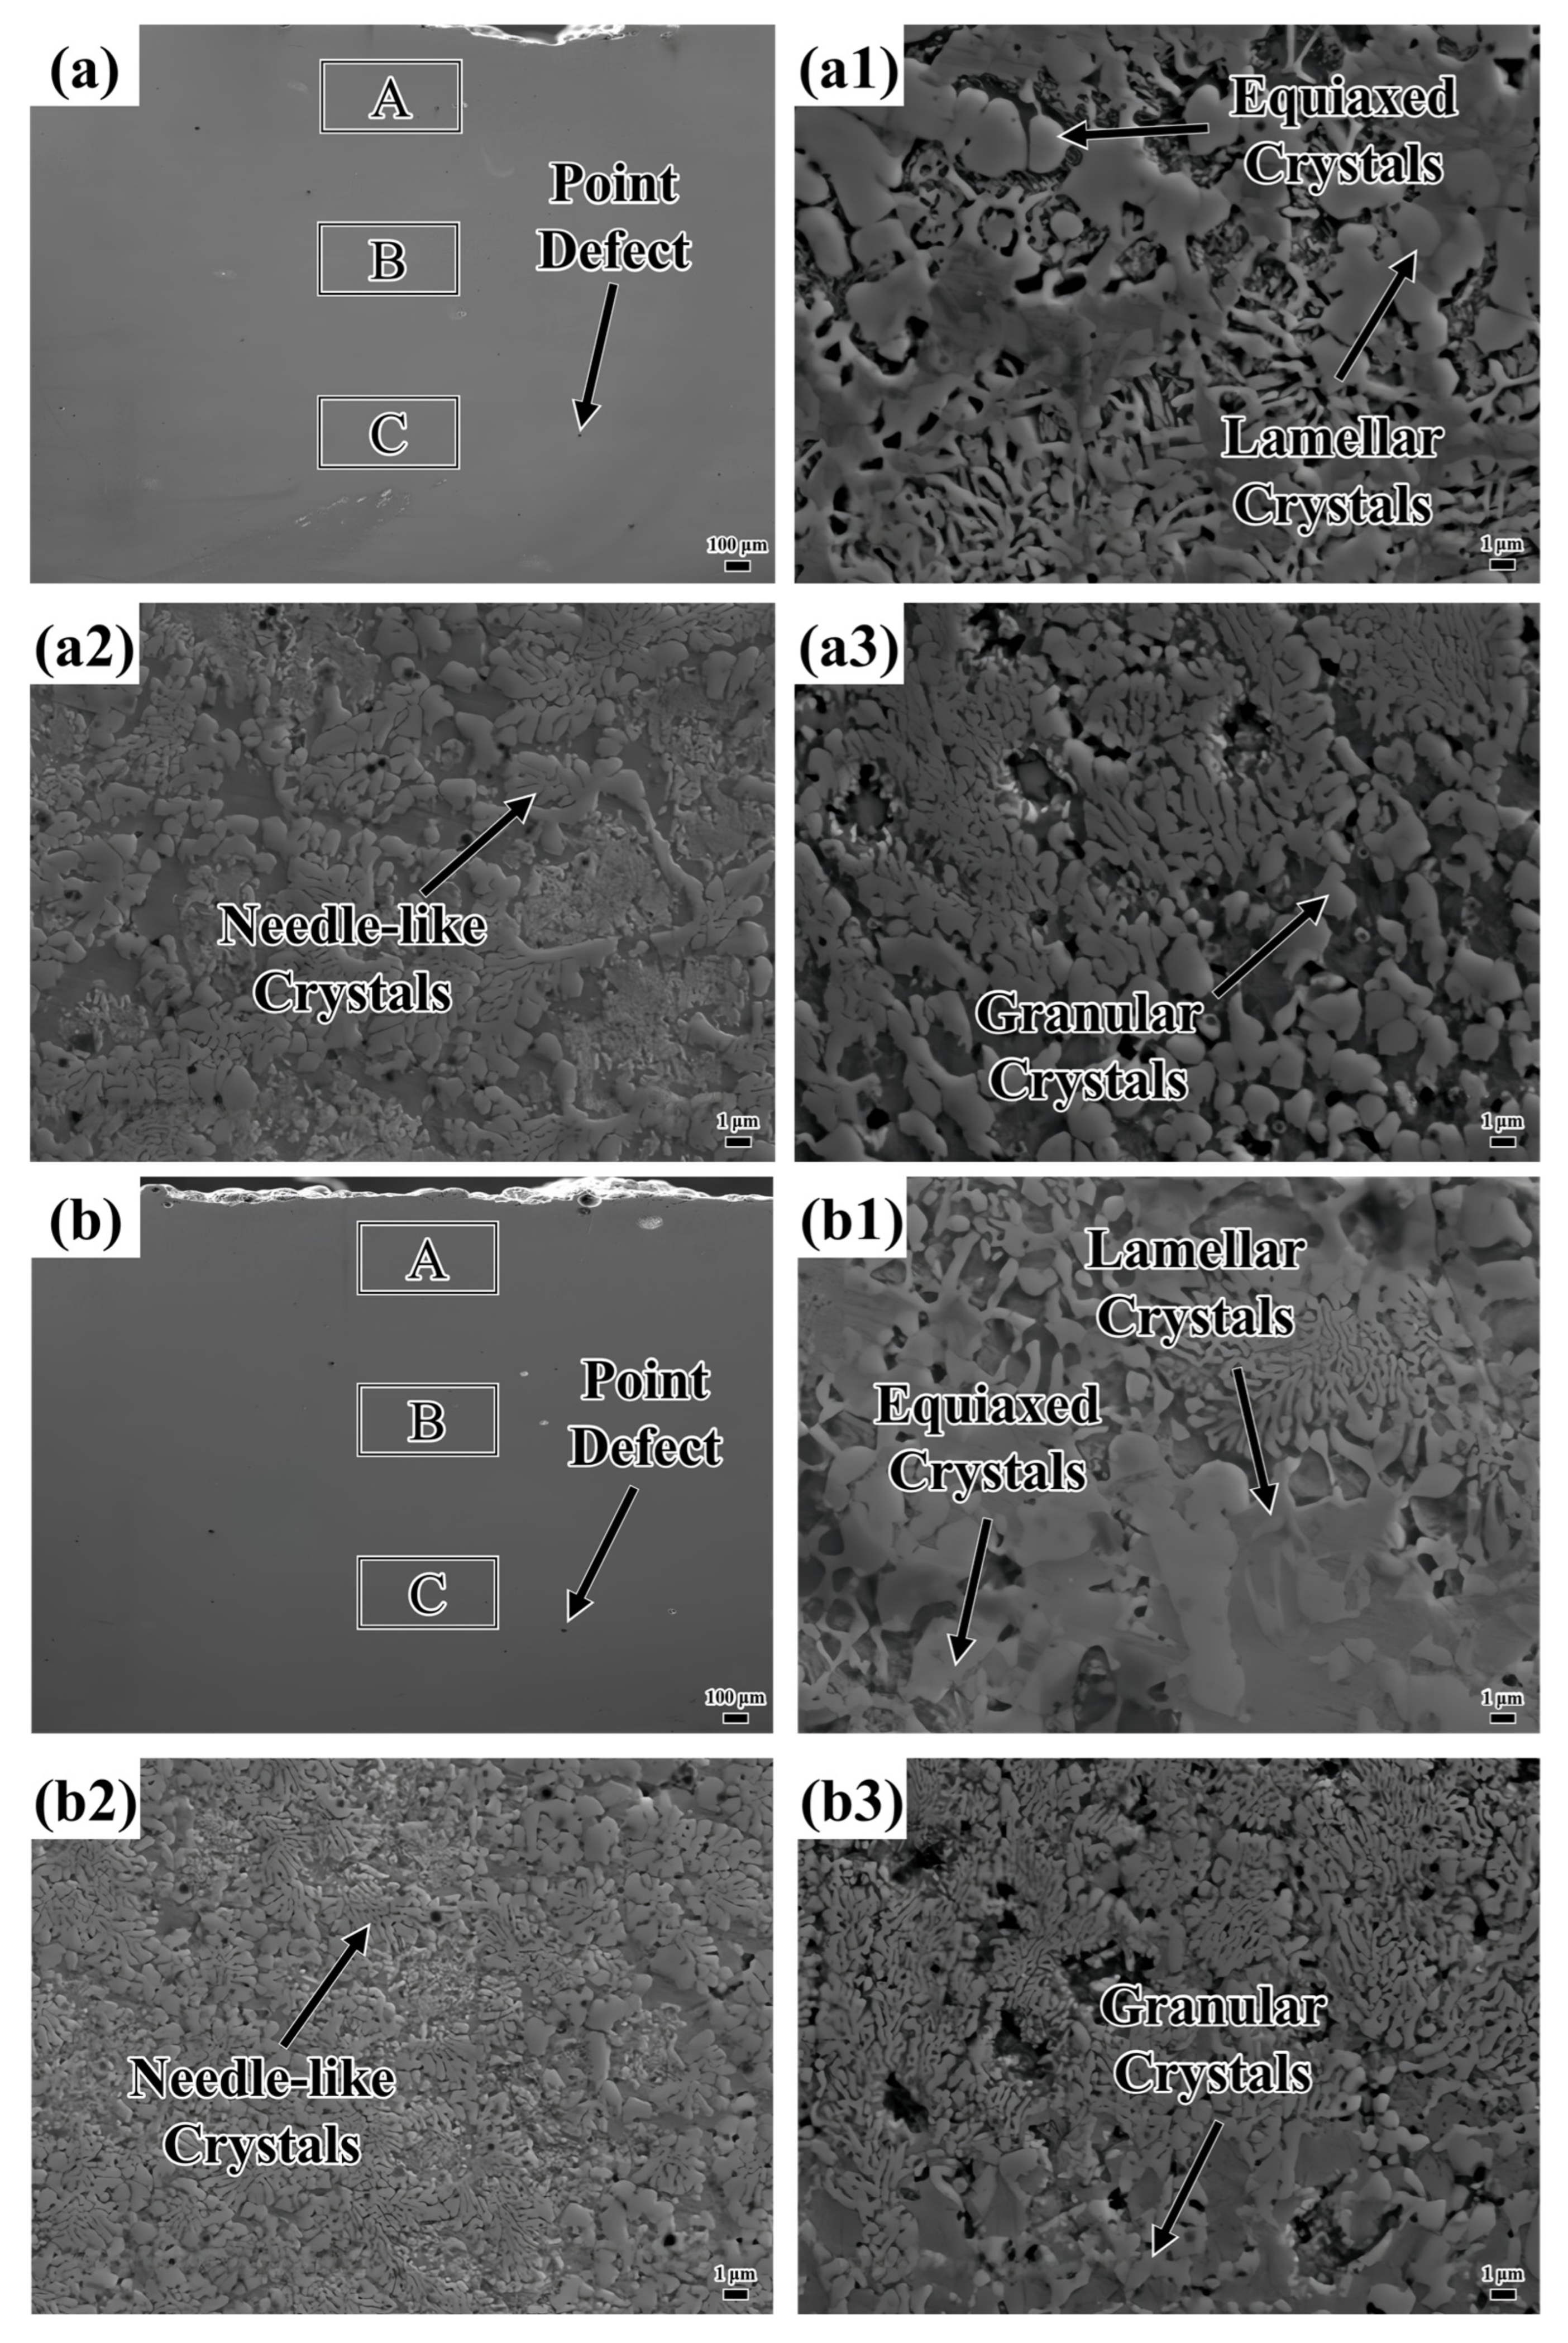
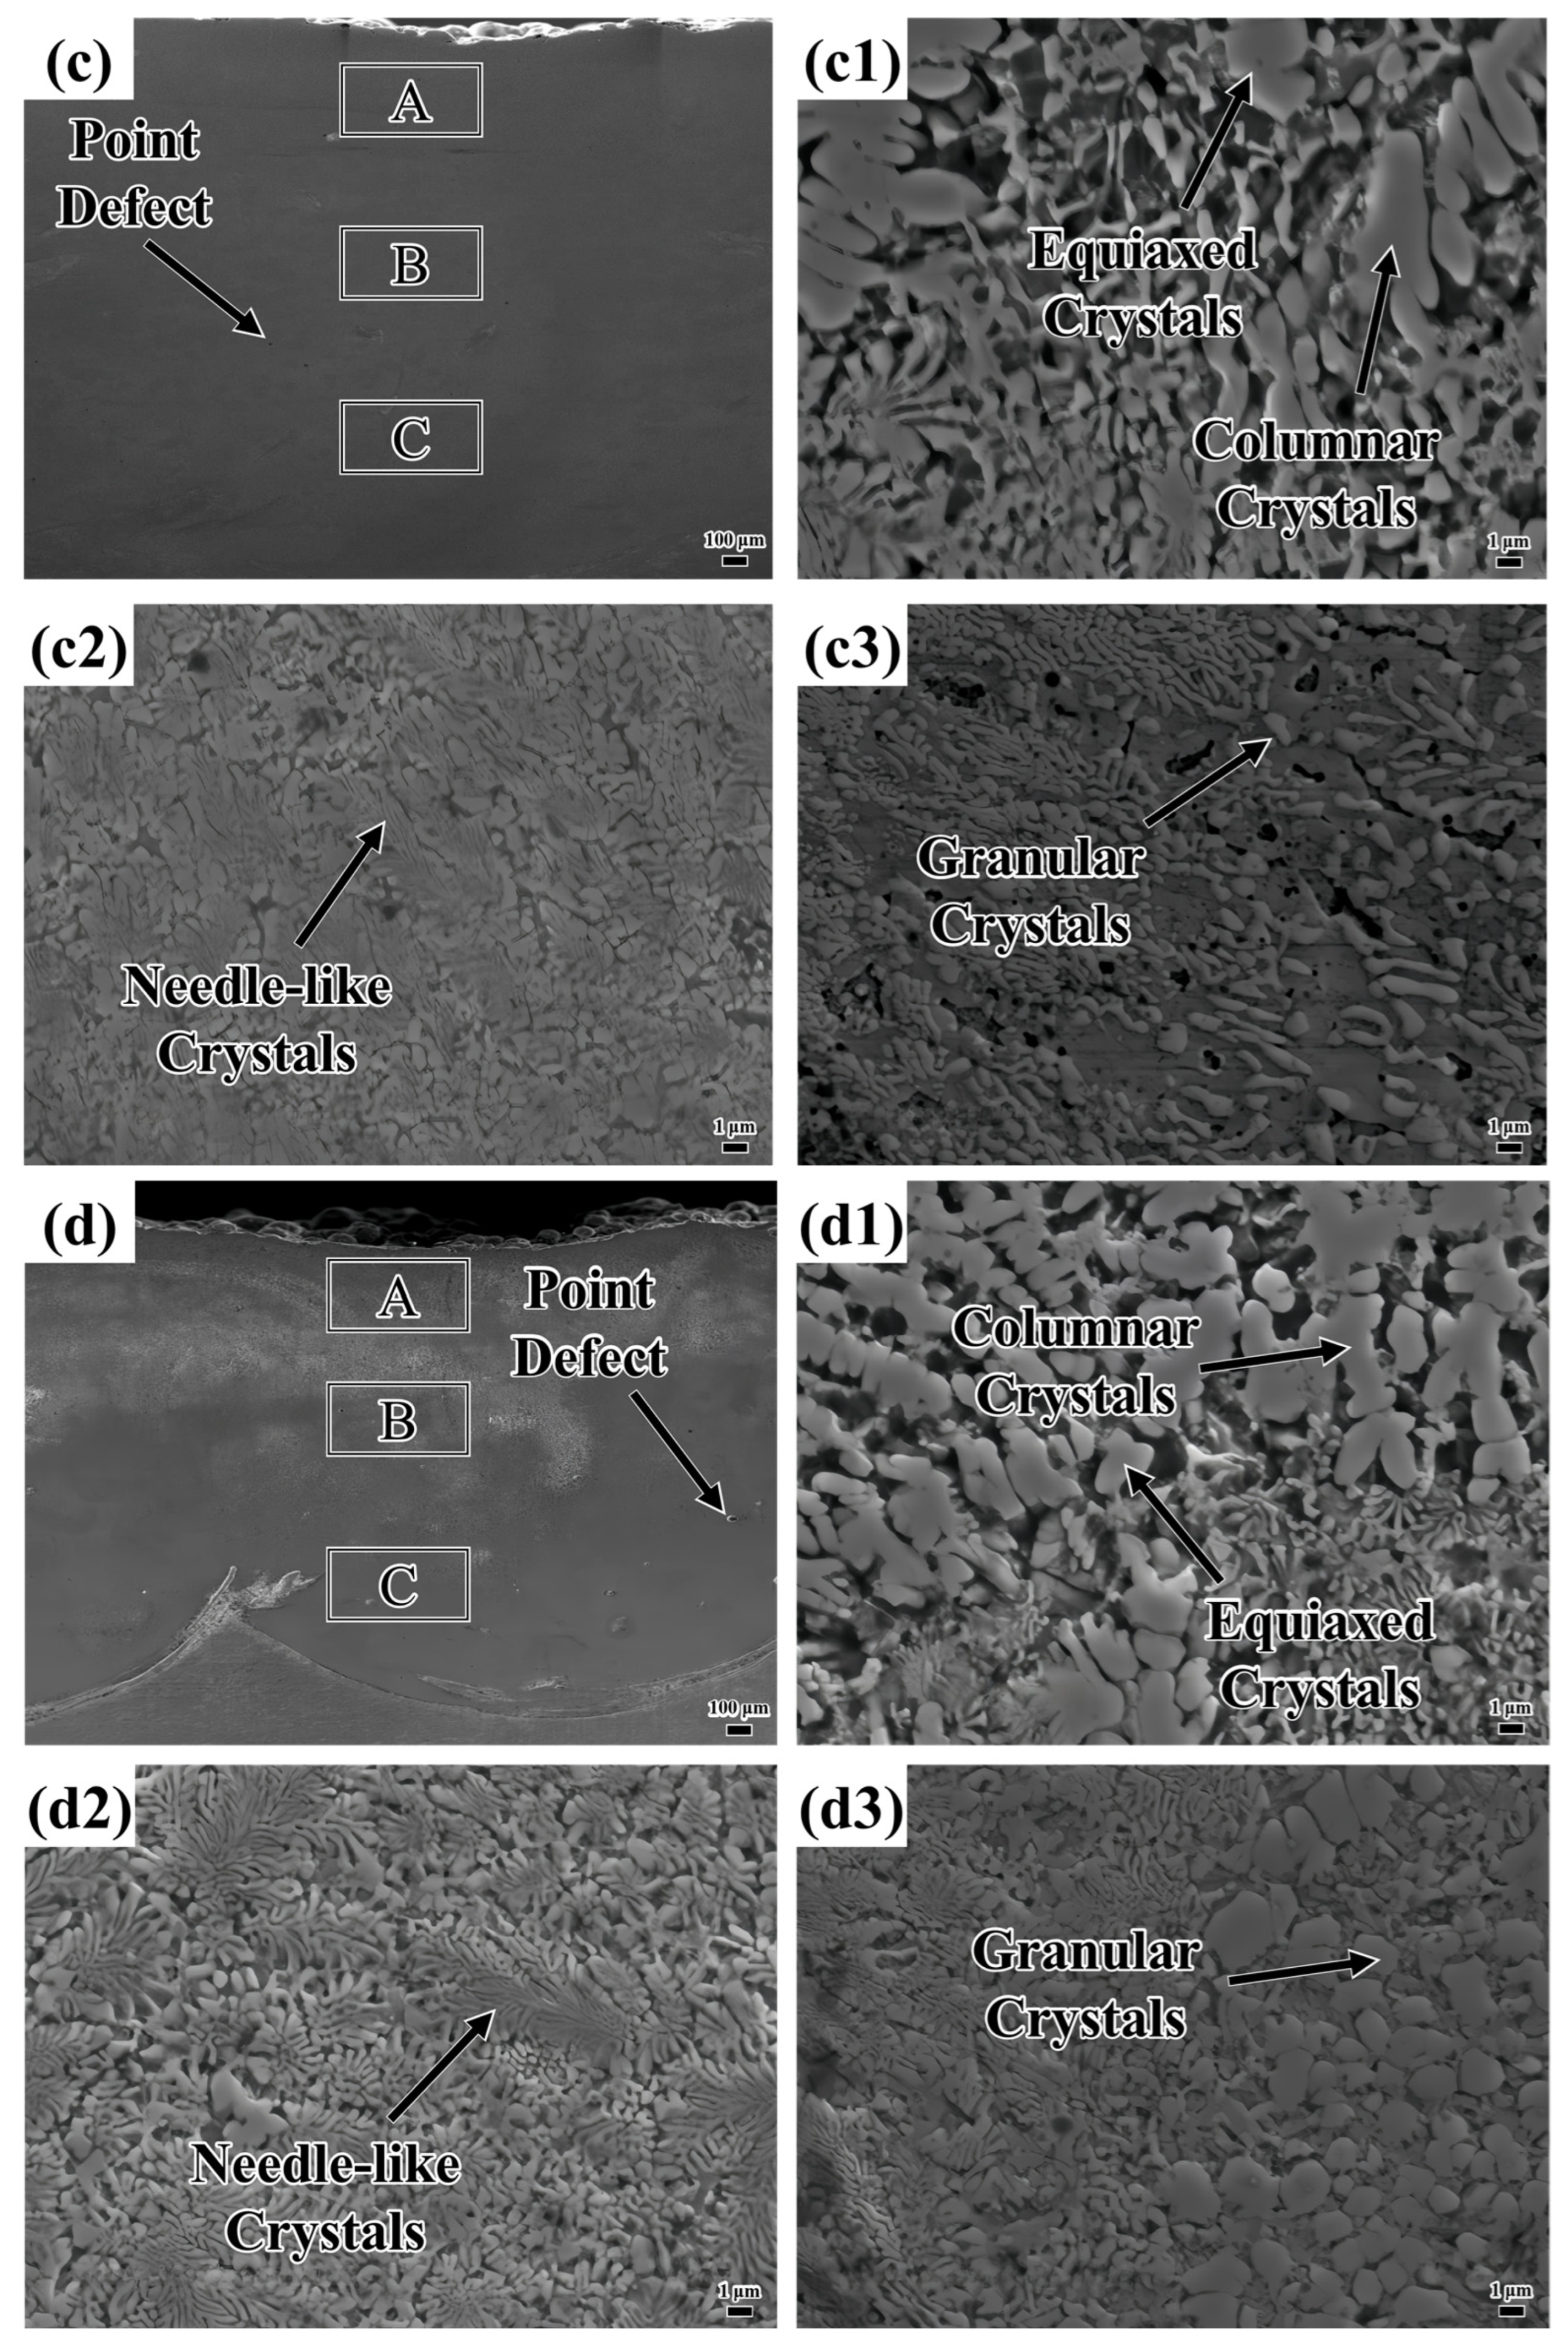
Figure 5 shows the microstructure of the coating. The defects existing in the layers are marked in
Figure 5a–d. The formation of these defects is attributed to the decrease in energy density as the laser scanning speed increases, resulting in insufficient melting of the powder. The powder’s small particle size enhances its adsorption properties, making it prone to attracting substances like nitrogen from the laser processing protective gas [
40]. During laser processing, these adsorbed gases are released, leading to pore formation. This is because NiAlNbTiV powder (100–300 μm), due to its fine particle size and active elements, is prone to adsorbing gases and has a very high surface adsorption capacity. In contrast, the defects in other HEAs (for example, WC-enhanced coatings [
25]) result from gas capture during the melting process rather than powder adsorption.
Table 2 shows the number of coating point defects within 1 mm
2; the point defects in the coating increase with rising laser scanning speeds.
Illustrated in
Figure 5(a1–a3), the top layer of the coating predominantly features lamellar and needle-like crystalline structures. The middle section is primarily characterized by needle-like crystals, interspersed with a modest quantity of granular crystals. In the lower area, needle-like and granular crystals coexist, with the granular crystals progressively evolving into needle-like crystals as the distance from the heat source increases. The uppermost region of the coating is directly subjected to laser energy, with the molten pool surface interfacing with the surrounding protective gas. This interaction leads to an exceptionally high cooling rate. Such rapid solidification restricts solute diffusion (for example, Nb), thereby generating an unbalanced eutectic structure. Eutectics are organized into regular lamellar or fibrous arrangements, creating a pronounced temperature gradient perpendicular to the molten pool surface. This gradient encourages crystal growth in the direction of heat flow. In the central area, which is distant from the molten pool surface, the cooling rate diminishes, allowing for substantial solute diffusion. The decrease in the temperature gradient and the more scattered direction of heat flow result in disordered crystal growth, with local solute enrichment giving rise to needle-like crystals. In proximity to the substrate, heat is rapidly conducted, which further increases the cooling rate. Subsequent laser scanning has a thermal impact on the bottom area, partially melting the crystal structure. A slower cooling rate permits sufficient solute diffusion, leading to the formation of coarse granular crystals. As temperature fluctuations occur, granular crystals partially dissolve in the ensuing thermal cycle. The redistribution and diffusion of the solute gradually erase the regular boundaries, resulting in finer needle-like crystals.
Upon inspection of
Figure 5(a1,b1), it is evident that plate-like crystals are present at the top of both layers. However, when the sweep speed was elevated to 1000 mm/min, a small quantity of columnar crystals emerged at the top of the coating, as illustrated in
Figure 5(c1). At a sweep speed of 1100 mm/min, the area occupied by the columnar crystals at the top of the coating increased substantially, as shown in
Figure 5(d1). Moreover, it is noteworthy that the needle-like crystals in the middle of the coating become more evenly distributed and refined with increasing scanning speed. As the scanning speed goes up, granular crystals tend to transform into needle-like crystals, as depicted in
Figure 5(a2–d2). In
Figure 5(a3), both granular and needle-like crystals are relatively large in size. As the scanning speed is increased, the sizes of these crystals diminish and their distribution becomes more uniform, as illustrated in
Figure 5(b3). Further increasing the scanning speed causes the sizes of the granular and needle-like crystals to decrease even more. However, at this point, their distribution becomes loose and non-uniform, as shown in
Figure 5(c3). When the scanning speed reaches 1100 mm/min, the granular and needle-like crystals are uniformly distributed and have a high density, but the size of the granular crystals increases.
Since this alloy does not contain Fe or Cr elements, we tested the mass fractions of different elements on the surface of the coating to reflect from the side the dilution degree of the base material in the coating. The specific results are shown in
Table 3. When the sweeping speed increased from 800 mm/min to 1100 mm/min, the Fe and Cr elements in the coating surface also decreased from 34.84 wt.% and 12.25 wt.% to 8.05 wt.% and 2.01 wt.%, respectively.
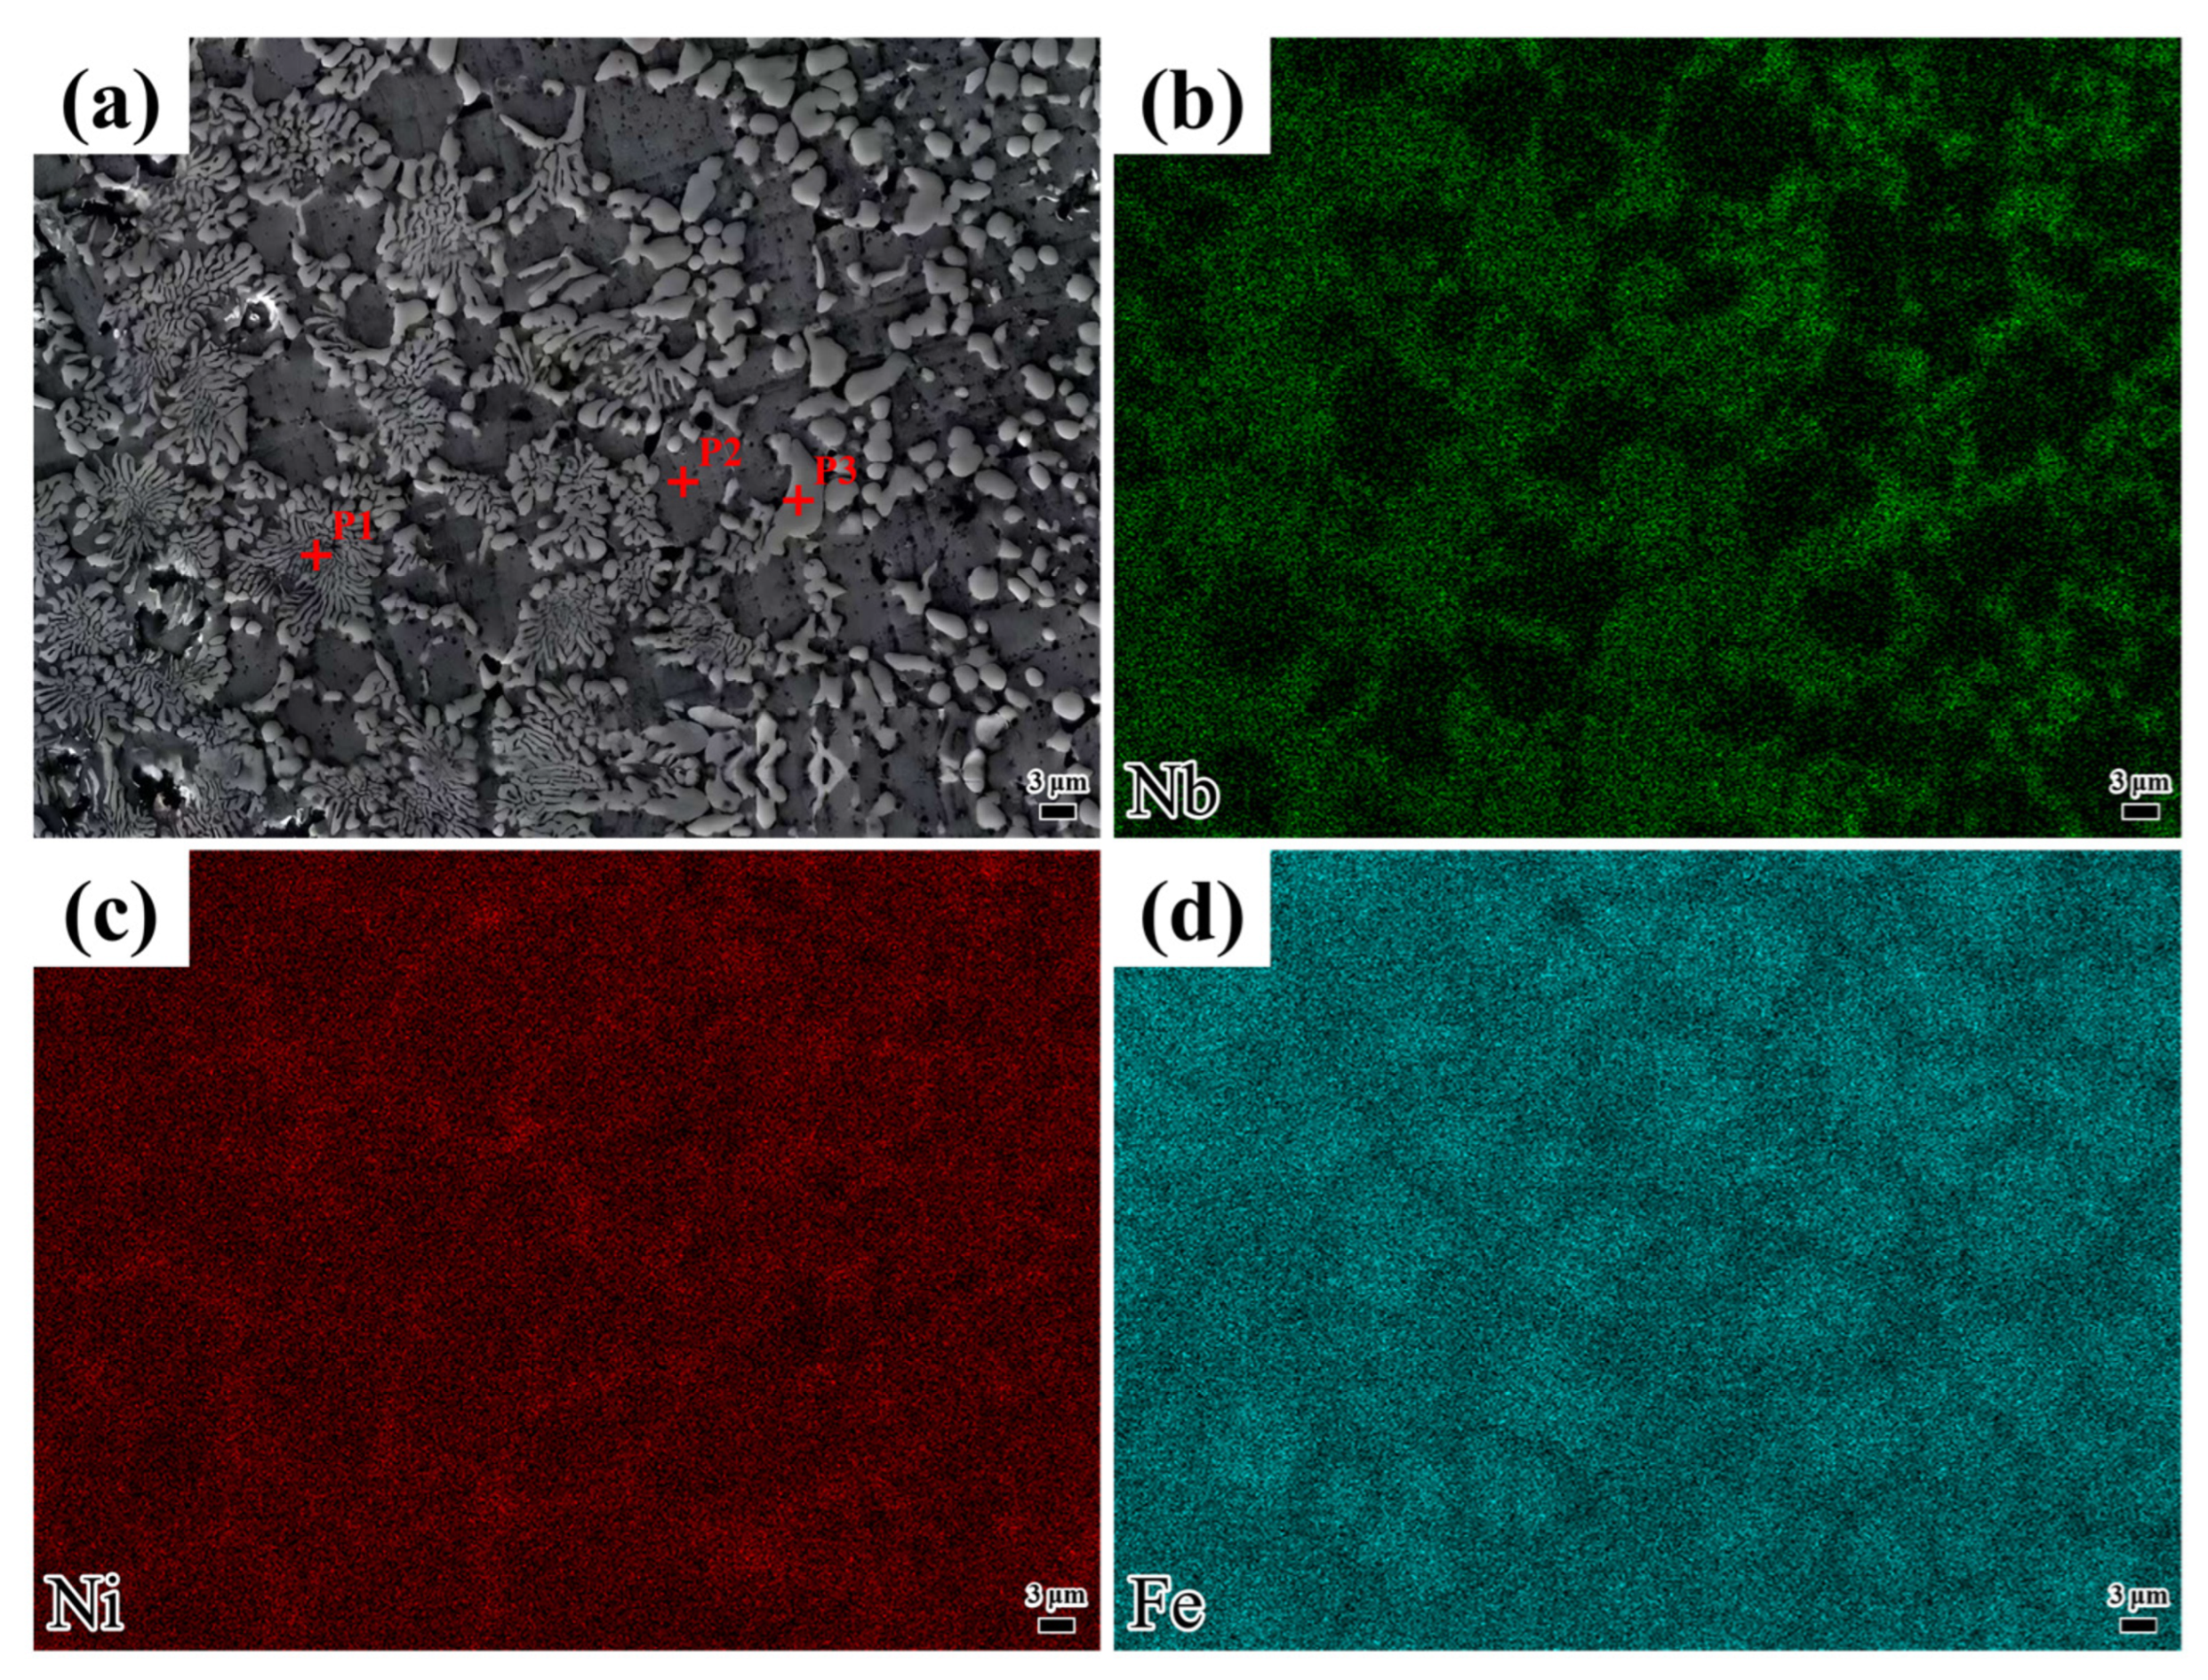
Figure 6 displays the microstructure of the coating deposited at a laser scanning speed of 1000 mm/min, along with the distribution of elements in different morphologies. As shown in
Table 4, the Ni content is higher than that of Nb. However,
Table 4 shows that the P1 position corresponds to a Nb-rich region. Based on XRD analysis, the phase at point P1 is identified as Ni
3Nb. Point P1 exhibits the highest Fe content, suggesting the potential formation of a γ-Fe solid solution. Point P2 shows very high Fe and Ni contents with very low Nb contents, indicating the possible presence of a γ-(Ni Fe) solid solution. A small amount of unreacted Ni may exist in solid solution form. Point P3, with a high Nb content, may form Nb-rich intermetallic compounds. By integrating the Ni and Nb content data with the XRD results, it can be concluded that the phase may contain Ni
3Nb. Additionally, the combination of Fe and Nb content data suggests the possible presence of an Fe
2Nb phase. The Cr contents at P1, P2, and P3 are also relatively significant and may combine with C to form hard, wear-resistant phases.
As depicted in
Figure 6c,d, the elements Ni and Nb are predominantly concentrated in the non-eutectic structural regions. Based on the above analysis, the eutectic structure at position P1 is attributed to a non-equilibrium eutectic reaction induced by the rapid solidification characteristic inherent in laser cladding, resulting in a lamellar structure composed of alternating Ni-Nb intermetallic compounds and a γ-(Ni Fe) solid solution. The rapid solidification inherent in laser cladding restricts the full diffusion of solute atoms (e.g., Nb), trapping them at the solidification front and facilitating the development of a non-equilibrium eutectic structure. Additionally, high-melting-point elements like Nb are expelled to interdendritic or grain-boundary regions during solidification, where they combine with elements such as Ni to initiate eutectic reactions. The sufficiently high cooling rate suppresses long-range atomic diffusion, causing the liquid phase to directly transform into a eutectic two-phase structure. The formation mechanism is governed by solute retention, elemental segregation, and rapid cooling.
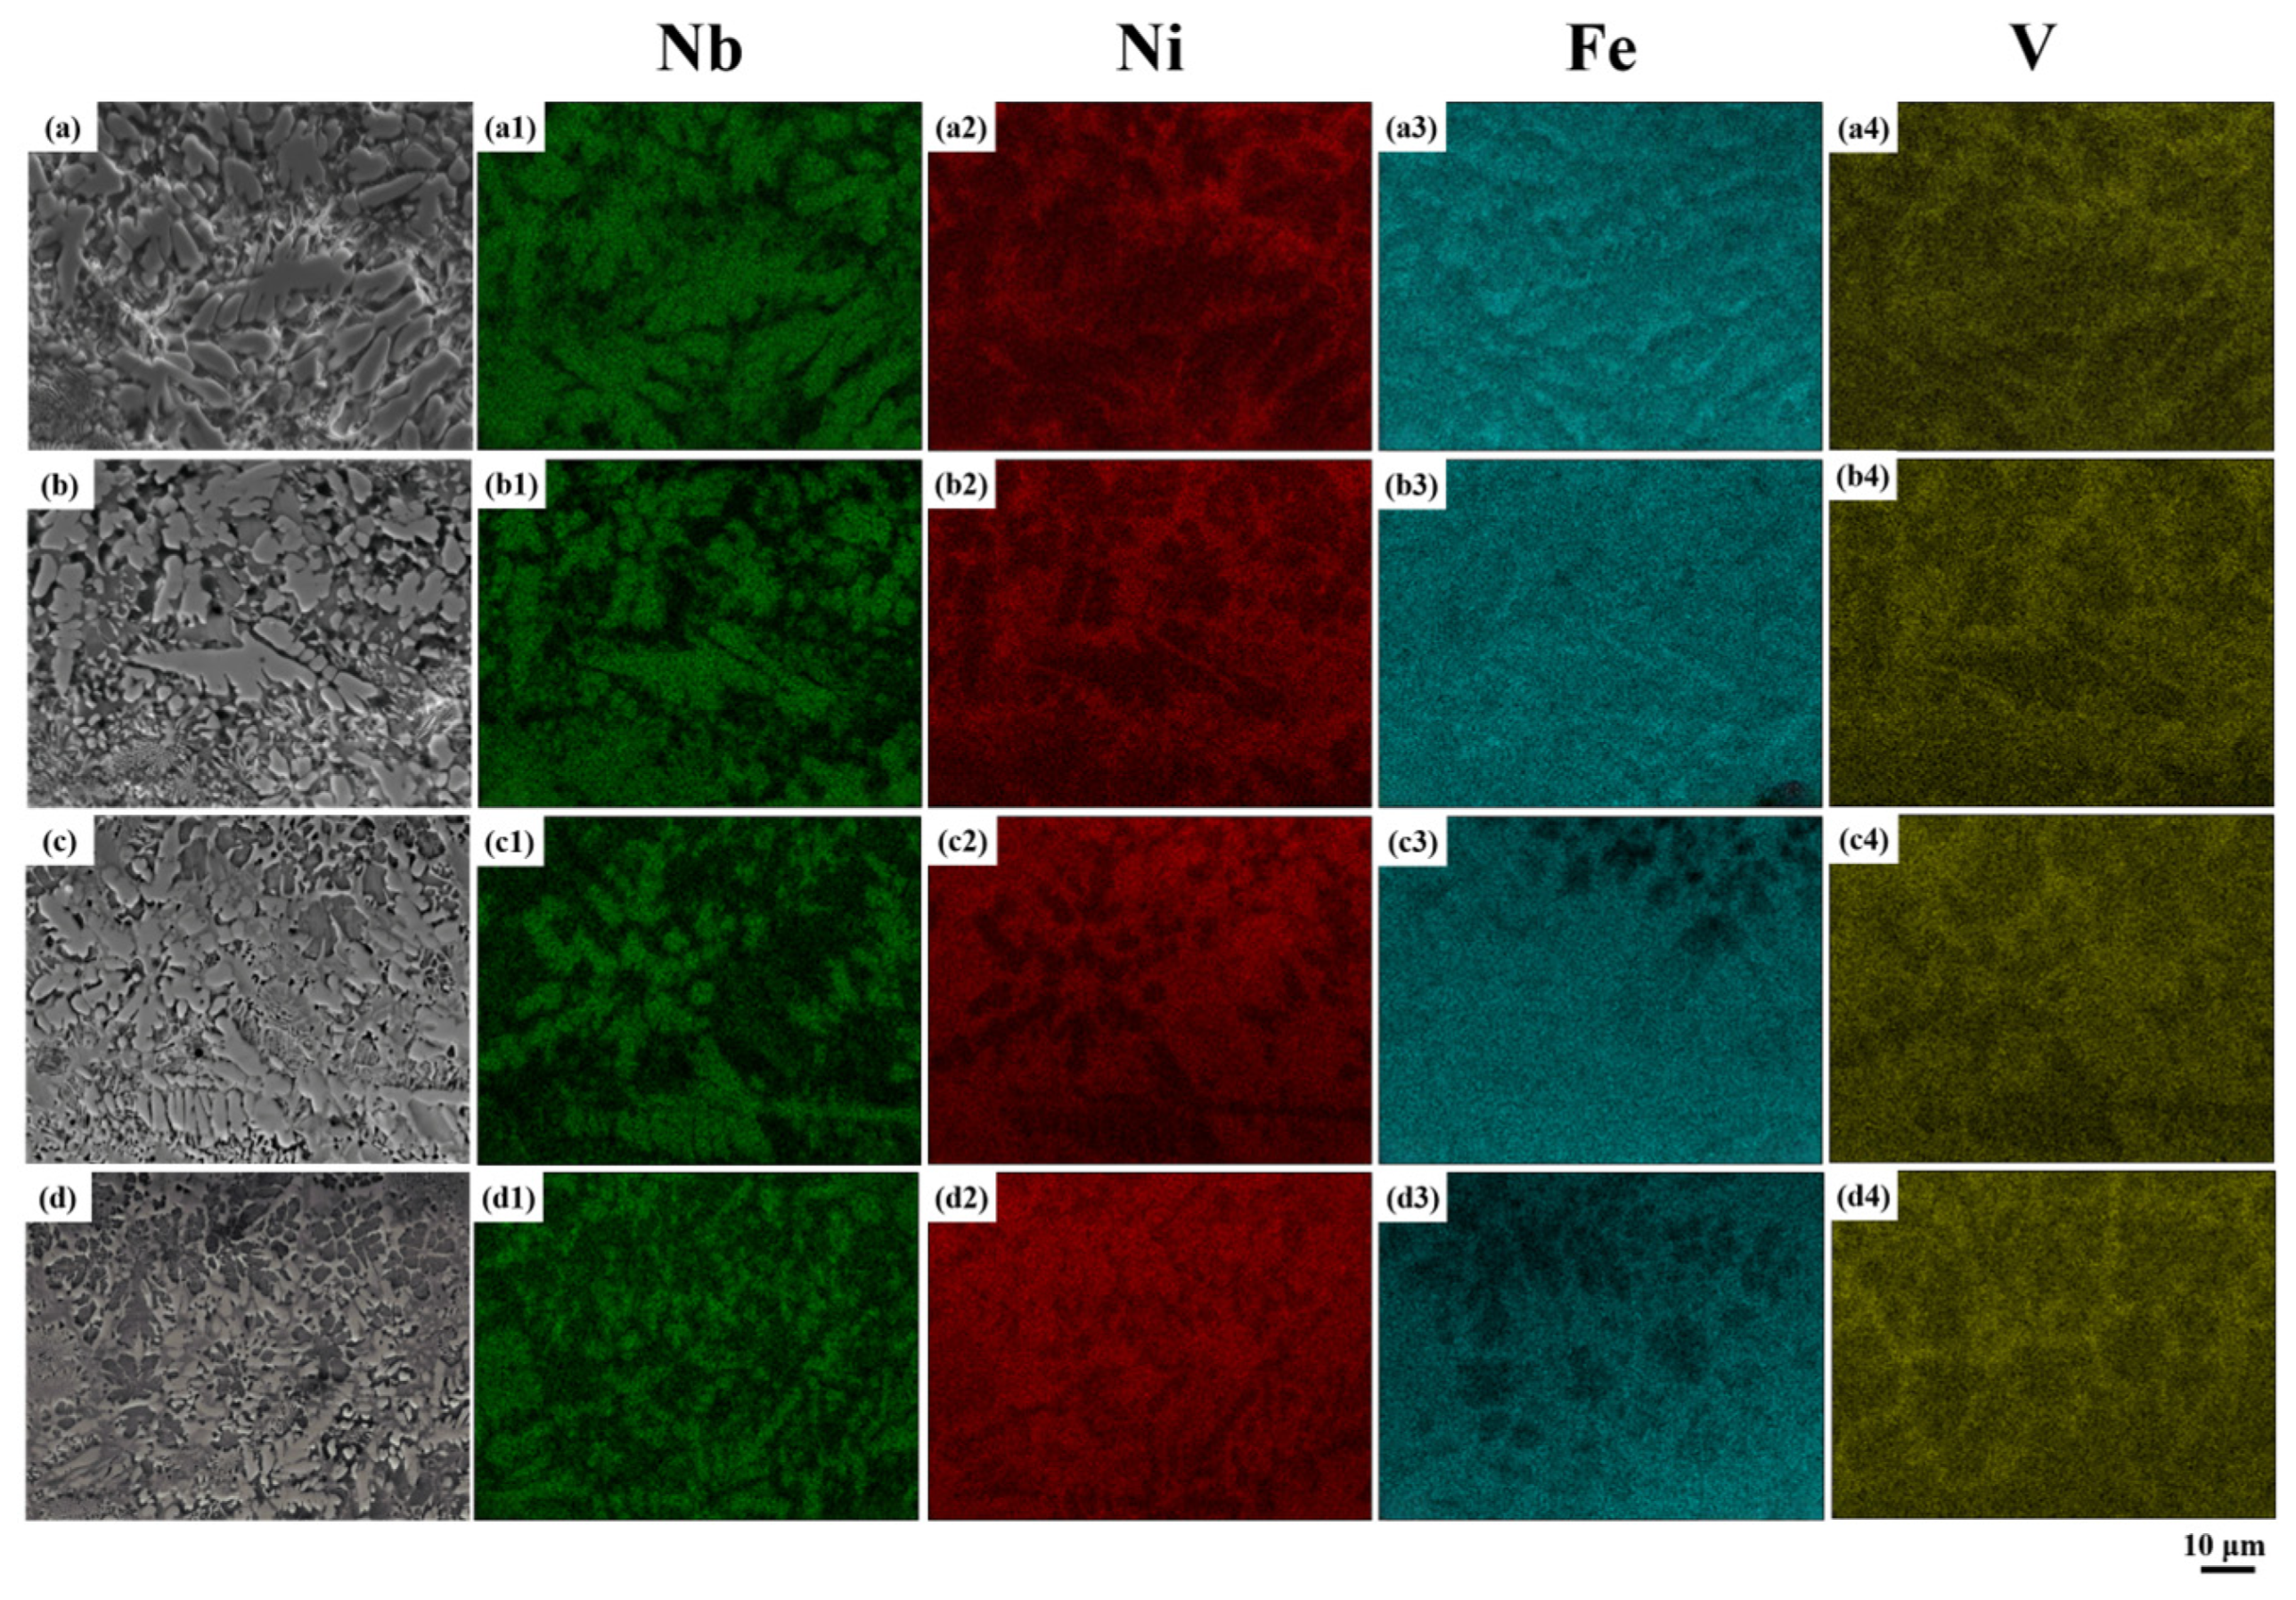
As depicted in
Figure 7(a1–a4), Nb and Fe are primarily concentrated in the eutectic structure, while Ni and V display an opposing distribution. An increase in laser scanning speed enhances the cooling rate, leading to a gradual rise in supercooling, as illustrated in
Figure 7a–d. This results in the progressive refinement of the eutectic structure in the coating and an increase in Ni content, as observed in
Figure 7(a2–d2). Moreover, as the laser scanning speed increases, the interaction time of the laser energy decreases, resulting in a reduced molten pool height. The diminished thermal diffusion between the deposition layer and substrate leads to decreased molten pool depth with increasing scanning speed. The Fe content decreases in non-eutectic regions but remains in eutectic regions, albeit at lower concentrations. Fe preferentially reacts with Nb to form the Fe-Nb intermetallic phase. As shown in
Figure 7(a4–d4), with increasing laser scanning speed, pronounced V-rich regions that exhibit an overall network morphology are formed. The V segregation observed is unique to NiAlNbTiV, as V has limited solubility in most HEAs, such as Ni60-based composites [
33] or CoCrFeNiW [
26], and rarely forms this network structure. This phenomenon arises from the high mobility of V in the alloy during rapid cooling, a behavior that has not been documented in prior studies.
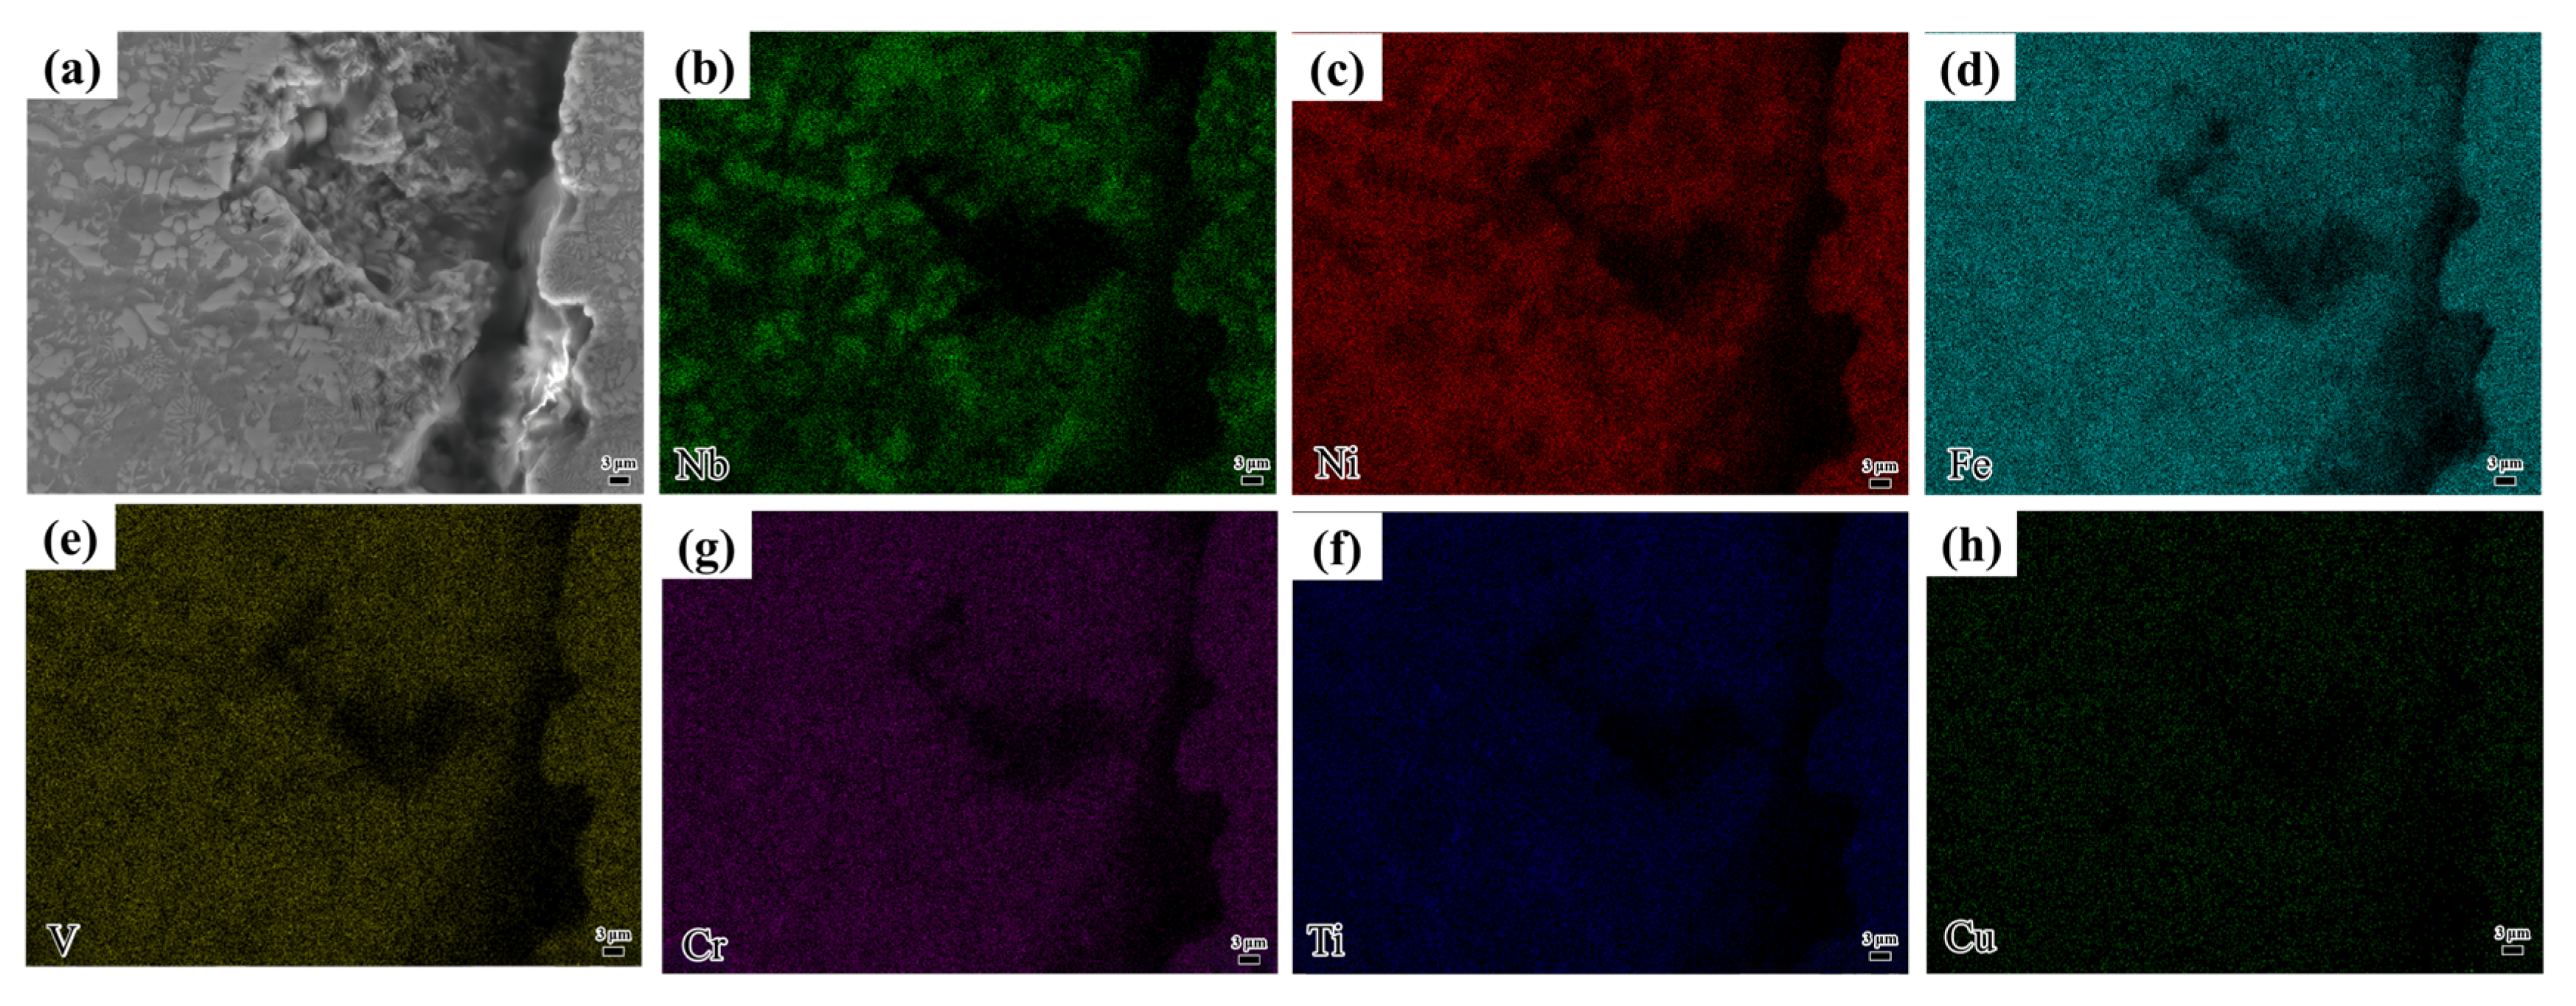
At a laser scanning speed of 1100 mm/min, cracks were observed in the coating, as depicted in
Figure 8. As the laser scanning speed increases, the heat input per unit area decreases, resulting in a reduced molten pool temperature and shorter existence time. The rapid cooling increases the temperature gradient between the coating and substrate, weakening the metallurgical bond and causing residual stresses due to differences in thermal expansion coefficients. These stresses exceed the material’s strength, leading to crack formation. Notably, no elemental enrichment was observed at the crack, as shown in
Figure 8b–d. This is in stark contrast to Al-rich HEAs [
18], where the segregation of Al at grain boundaries tends to facilitate crack initiation. The superior crack resistance of NiAlNbTiV against segregation-induced failure can be attributed to its uniform Ni matrix and well-balanced elemental diffusion, which are unique material-specific advantages.
3.3. Microhardness
Figure 9 presents the microhardness of coatings at varying laser scanning speeds. The coating hardness depicted in
Figure 6 exhibits notable fluctuations, primarily due to the varying hardness values associated with the eutectic structure and the solid solution. As illustrated in
Table 5, the coating hardness diminishes as the laser scanning speed increases. Specifically, the average hardness for the coating produced at 800 mm/min is 606.2 HV, whereas the average hardness for the coating produced at 1100 mm/min is 522.4 HV.
At lower laser scanning speeds (e.g., 800 mm/min), extended solute diffusion time promotes the nucleation and growth of a significant volume fraction of hard phases. Intermetallic compounds (e.g., Fe2Nb, FeNb, and Ni3Nb) play a crucial role in enhancing the material’s macrohardness. However, as the laser scanning speed increases, the solute diffusion time decreases, which could inhibit the precipitation of hard phases and lead to a gradual reduction in macrohardness. At higher scanning speeds, the γ-FeNi solid solution content reaches near saturation, and this will diminish the impact of hard-phase depletion on hardness degradation. Below a critical volume fraction of hard phases, the solid solution strengthening mechanism becomes dominant, stabilizing the macrohardness and mitigating further decreases. Simultaneously, grain refinement approaches a saturation point at higher scanning speeds, enhancing its compensatory effect on hardness retention and reducing the extent of hardness loss. Additionally, elevated residual stresses and dislocation densities generated at high scanning speeds partially offset the negative effects of hard-phase depletion on macrohardness.
3.4. Analysis of Friction–Wear Properties
Figure 10 shows the COF of the coating at different laser scanning speeds. As shown in
Figure 10, the COF rises steadily with an increase in scanning speed. This trend is closely linked to the microhardness of the coating. At a scanning speed of 800 mm/min, the coating demonstrates the highest microhardness (606.2 HV). This elevated hardness enhances the coating’s resistance to plastic deformation when subjected to sliding friction pairs (Si
3N
4), thereby reducing the actual contact area between the coating and the substrate. The decreased contact area, in turn, diminishes frictional resistance, leading to the lowest COF. Conversely, when the scanning speed is increased to 1100 mm/min, the microhardness drops to 522.4 HV. The lower hardness makes the coating more susceptible to plastic deformation during sliding, which enlarges the actual contact area and consequently raises the COF, as shown in
Figure 11a–d. As the scanning speed increases, the gradual rise in defect density further exacerbates the coefficient of friction (COF). The coating, characterized by minimal porosity and the absence of cracks, exhibits a dense microstructure that effectively resists the ingress of abrasive particles. This dense configuration mitigates localized stress concentrations during the sliding process, thereby restricting material removal and helping to sustain a lower COF.
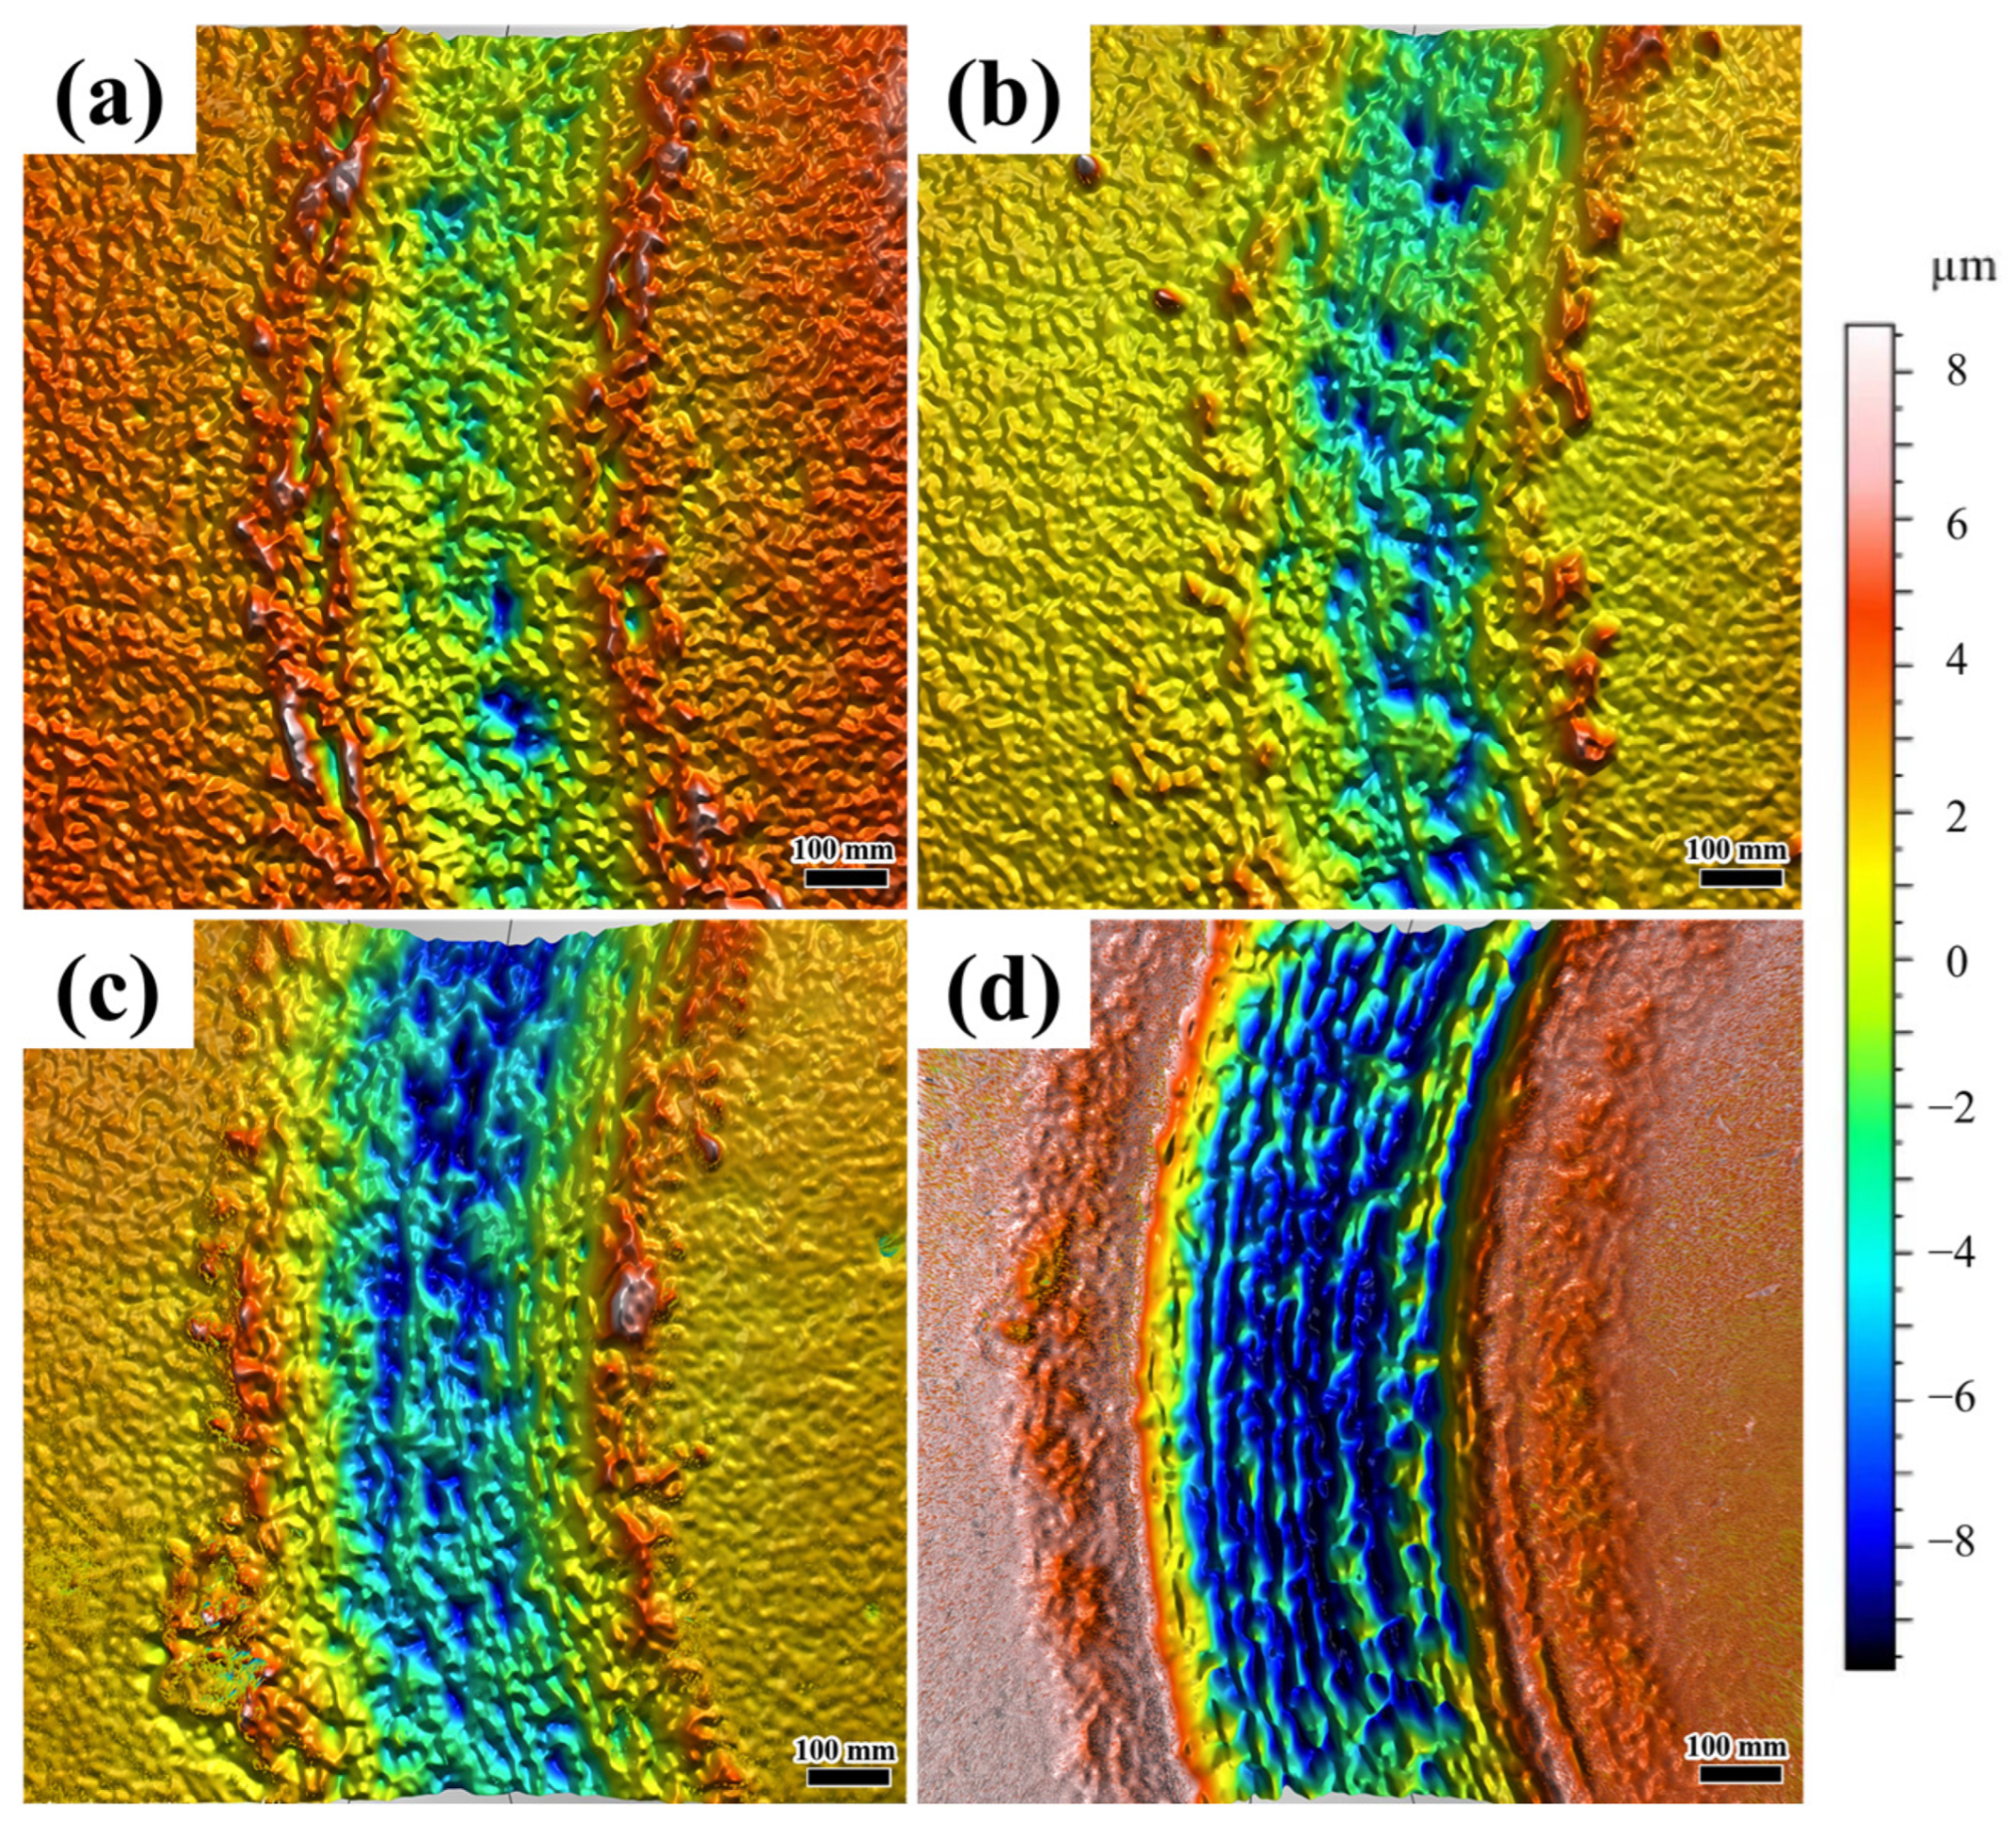
Figure 12 presents the 3D morphology of friction–wear behavior in coatings under different laser scanning speeds. At a scanning speed of 800 mm/min, the coating wear trajectory displays a relatively smooth three-dimensional profile with shallow and small grooves. This corresponds to mild abrasive wear (
Figure 12a), where the dense eutectic hard phase (Ni
3Nb and Fe
2Nb) resists severe material removal, resulting in minimal wear depth and uniform surface damage. In
Figure 12b, localized shallow pits are observed, signaling the initiation of adhesive wear. However, the overall surface still maintains a relatively continuous profile. In contrast to the coating produced at 900 mm/min, as shown in
Figure 12c, the wear trajectory of the coating deposited at 1000 mm/min demonstrates pronounced deepening and widening, giving rise to distinct deep pits and irregular grooves. This suggests that the increased defect density and the brittle Fe-Nb phase exacerbate fatigue wear. As depicted in
Figure 12d, the wear trajectory sustains the most severe damage, with a maximum depth of approximately −8 μm. The surface is characterized by extensive deep pits and interconnected grooves. This observation aligns with the characteristics of severe adhesive wear. The high defect density (28 holes/mm
2) and the presence of cracks serve as stress concentrators, which expedite material spalling. As indicated in
Table 6, the coating produced at a scanning speed of 800 mm/min demonstrates the smallest wear volume (0.0117 mm
3) and mass loss (0.5089 g), which confirms its superior wear resistance. Conversely, the coating deposited at 1100 mm/min exhibits the largest wear volume (0.0319 mm
3) and mass loss (1.3895 g).
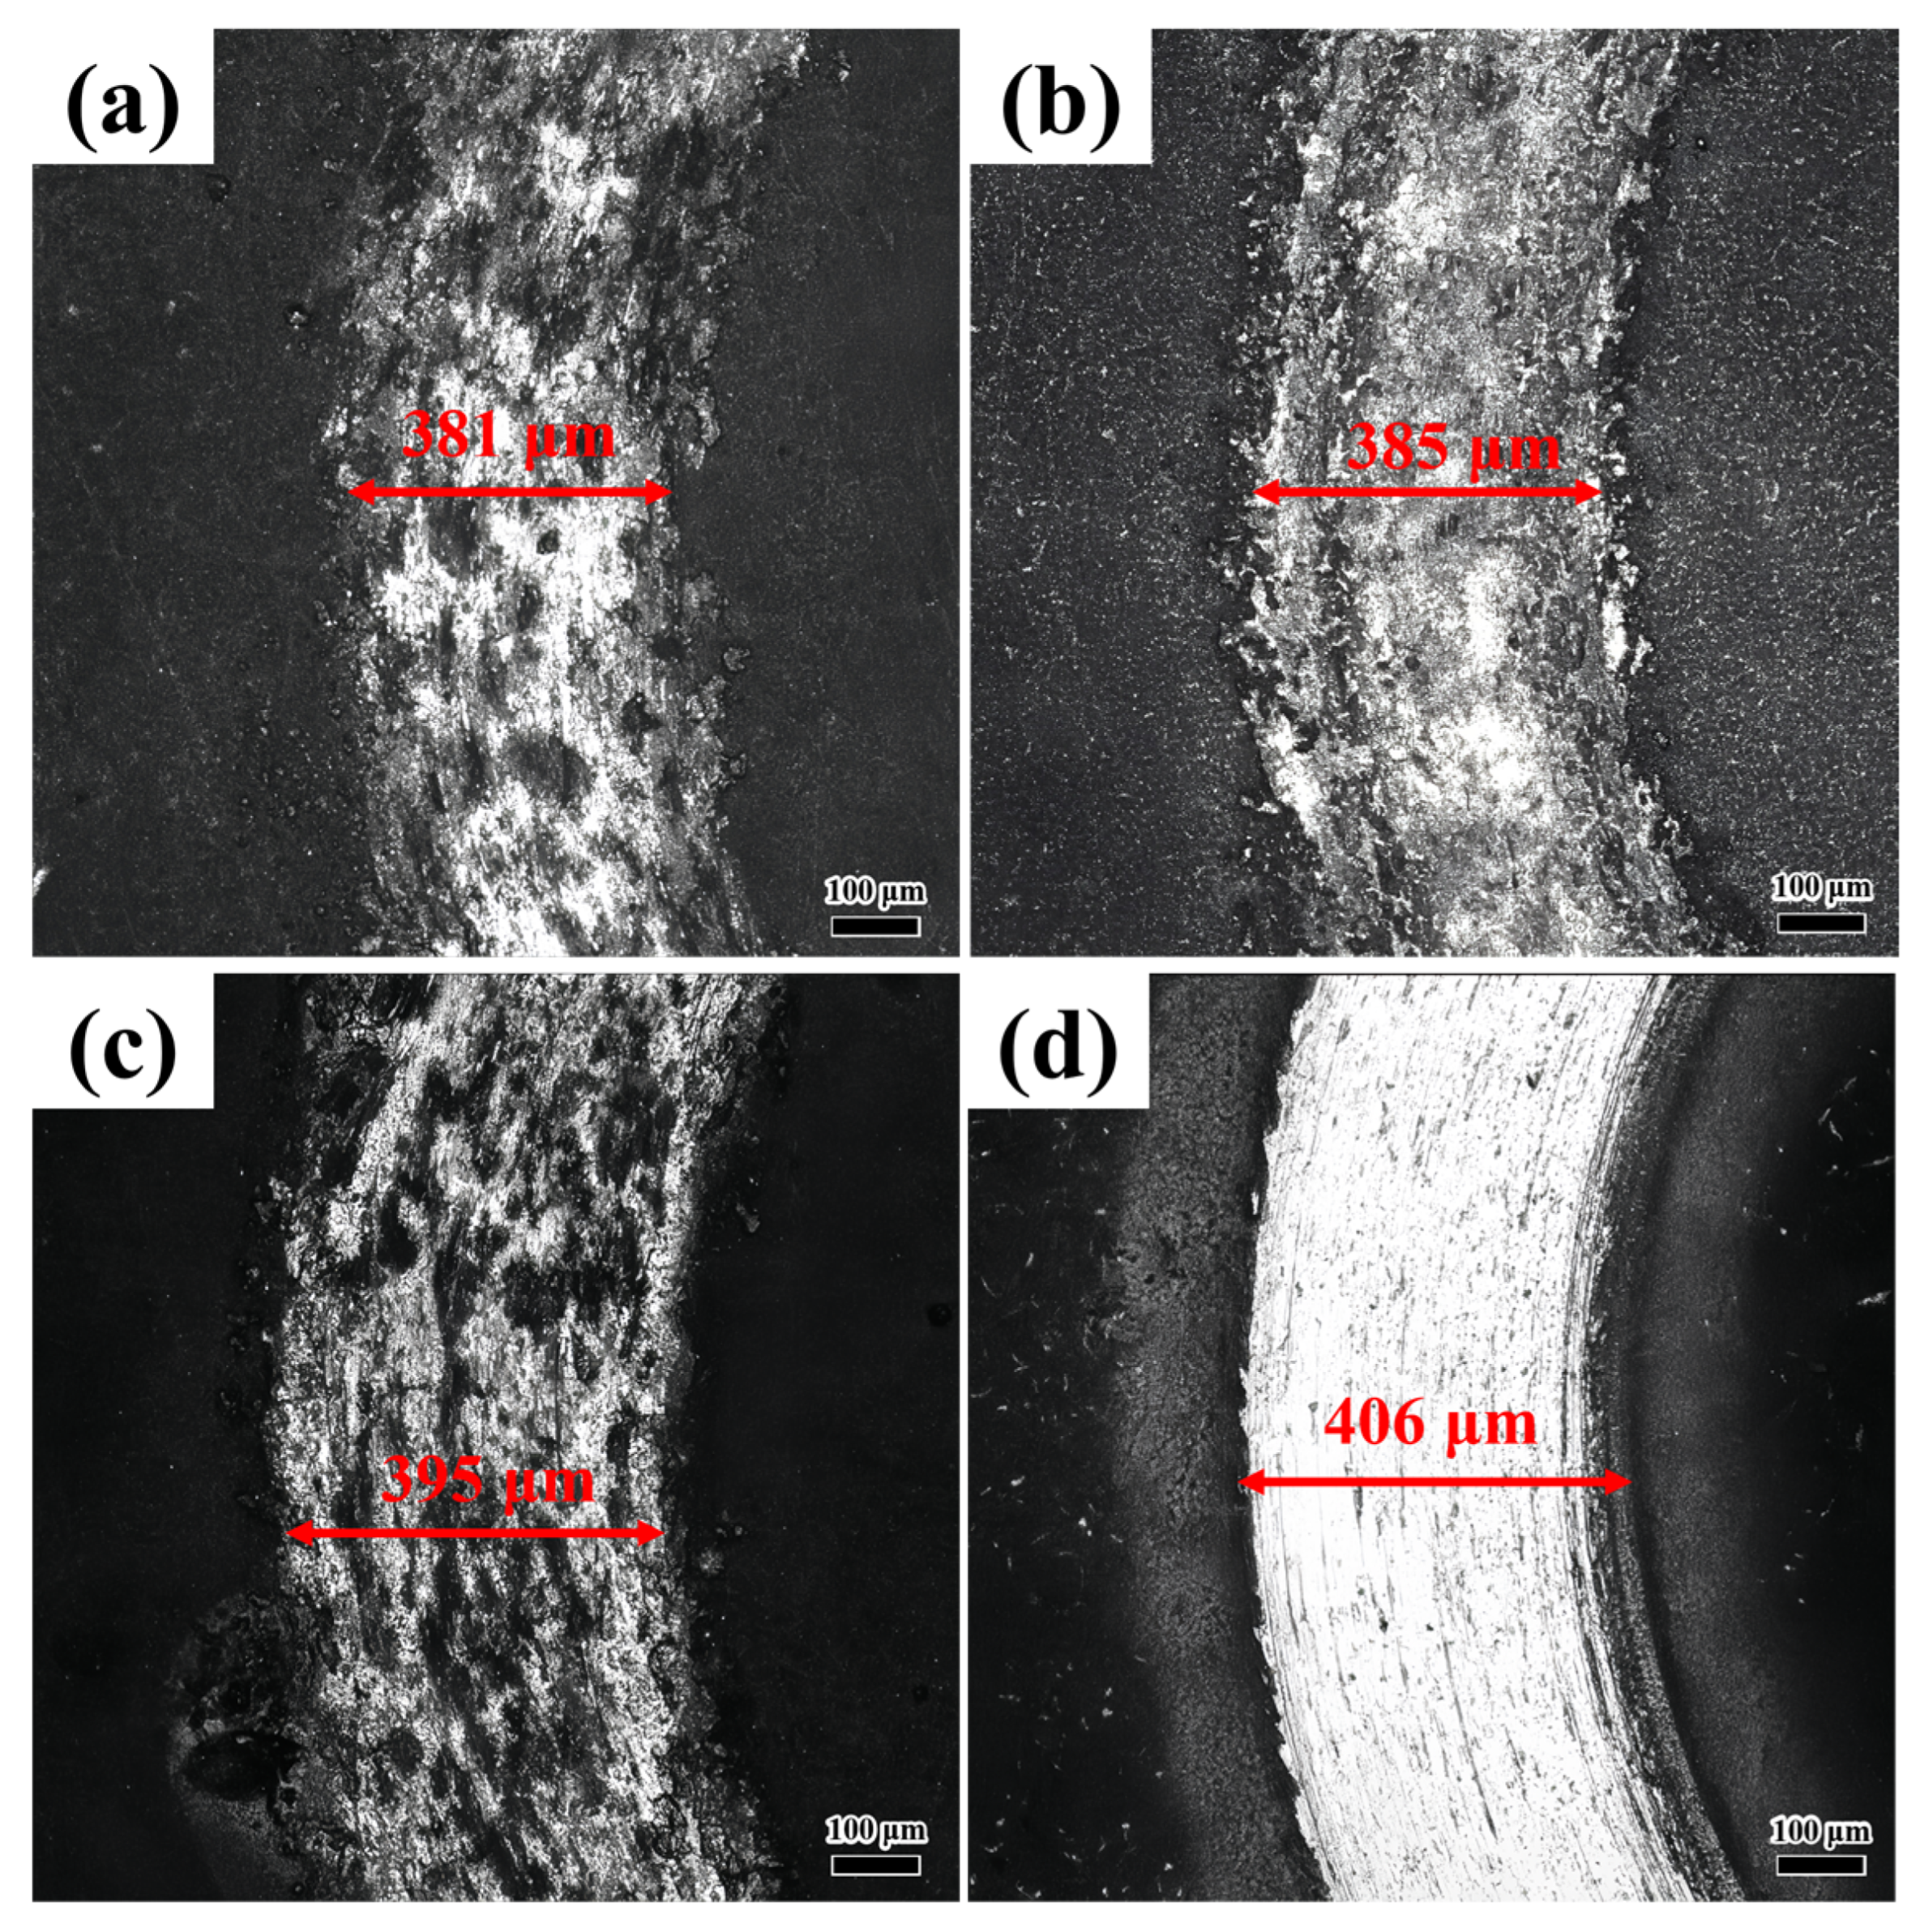
Figure 13 shows the friction and wear morphology of the coating with different laser scanning speeds and the elemental composition of different morphologies. Since this friction and wear test was performed in a non-vacuum environment, the oxygen distribution is illustrated in
Table 7. The oxygen content in the dark region is substantially higher than in the bright region, suggesting that the dark area may correspond to a metal oxide film. As shown in
Figure 13a, the worn surface of the coating exhibits deep grooves and spalling pits, indicating that abrasive wear is the primary wear mechanism, accompanied by localized adhesive wear. The oxygen content is relatively low, and the oxide layer is thin, such that it cannot effectively prevent direct metal contact. At elevated temperatures, solute diffusion increases, and the non-uniform distribution of hard phases, such as intermetallic compounds, causes the coating to be more susceptible to cutting by abrasive grains, resulting in furrow formation. Local adhesion results in material transfer and peeling. As shown in
Figure 13b, the worn coating surface exhibits fine scratches and scattered oxide spots, indicating the coexistence of abrasive and oxidative wear mechanisms. Examining the elemental composition at points P3 and P4 in
Table 7 shows that the Ni-to-Fe ratio is similar, and the γ-FeNi solid solution content is relatively high, enhancing toughness. The relatively high oxygen content promotes metal oxide formation. While the oxide layer offers partial protection, the carbon content is lower compared to the 800 mm/min coating. The non-uniform distribution of hard phases, such as metal carbides, continues to cause localized abrasive wear. As shown in
Figure 13c, the worn coating surface is smooth, exhibiting microcracks and spalling, indicative of synergistic fatigue and oxidative wear mechanisms. Nb is highly enriched, tending to form brittle phases such as Fe
2Nb, which can lead to cracking. The oxygen content is moderate, with the oxide film providing localized protection; however, the presence of the brittle phase disrupts the continuity of the oxide layer. This disruption accelerates localized wear once the oxide film is compromised.
Figure 13d reveals uniform scratches and a continuous oxide film on the coating surface after friction and wear testing; oxidative wear is dominant, accompanied by adhesive wear simultaneously. The oxygen content increases substantially, potentially forming a continuous oxide film (e.g., Fe
3O
4 and Cr
2O
3). The oxide film isolates the friction pair, reducing abrasive particle wear. This transition is specific to NiAlNbTiV, as its eutectics are harder than those of CoCrFeMnNi [
35] but more brittle than those of TiC-reinforced composites [
33], creating a distinct wear behavior spectrum.
3.5. Corrosion Performance
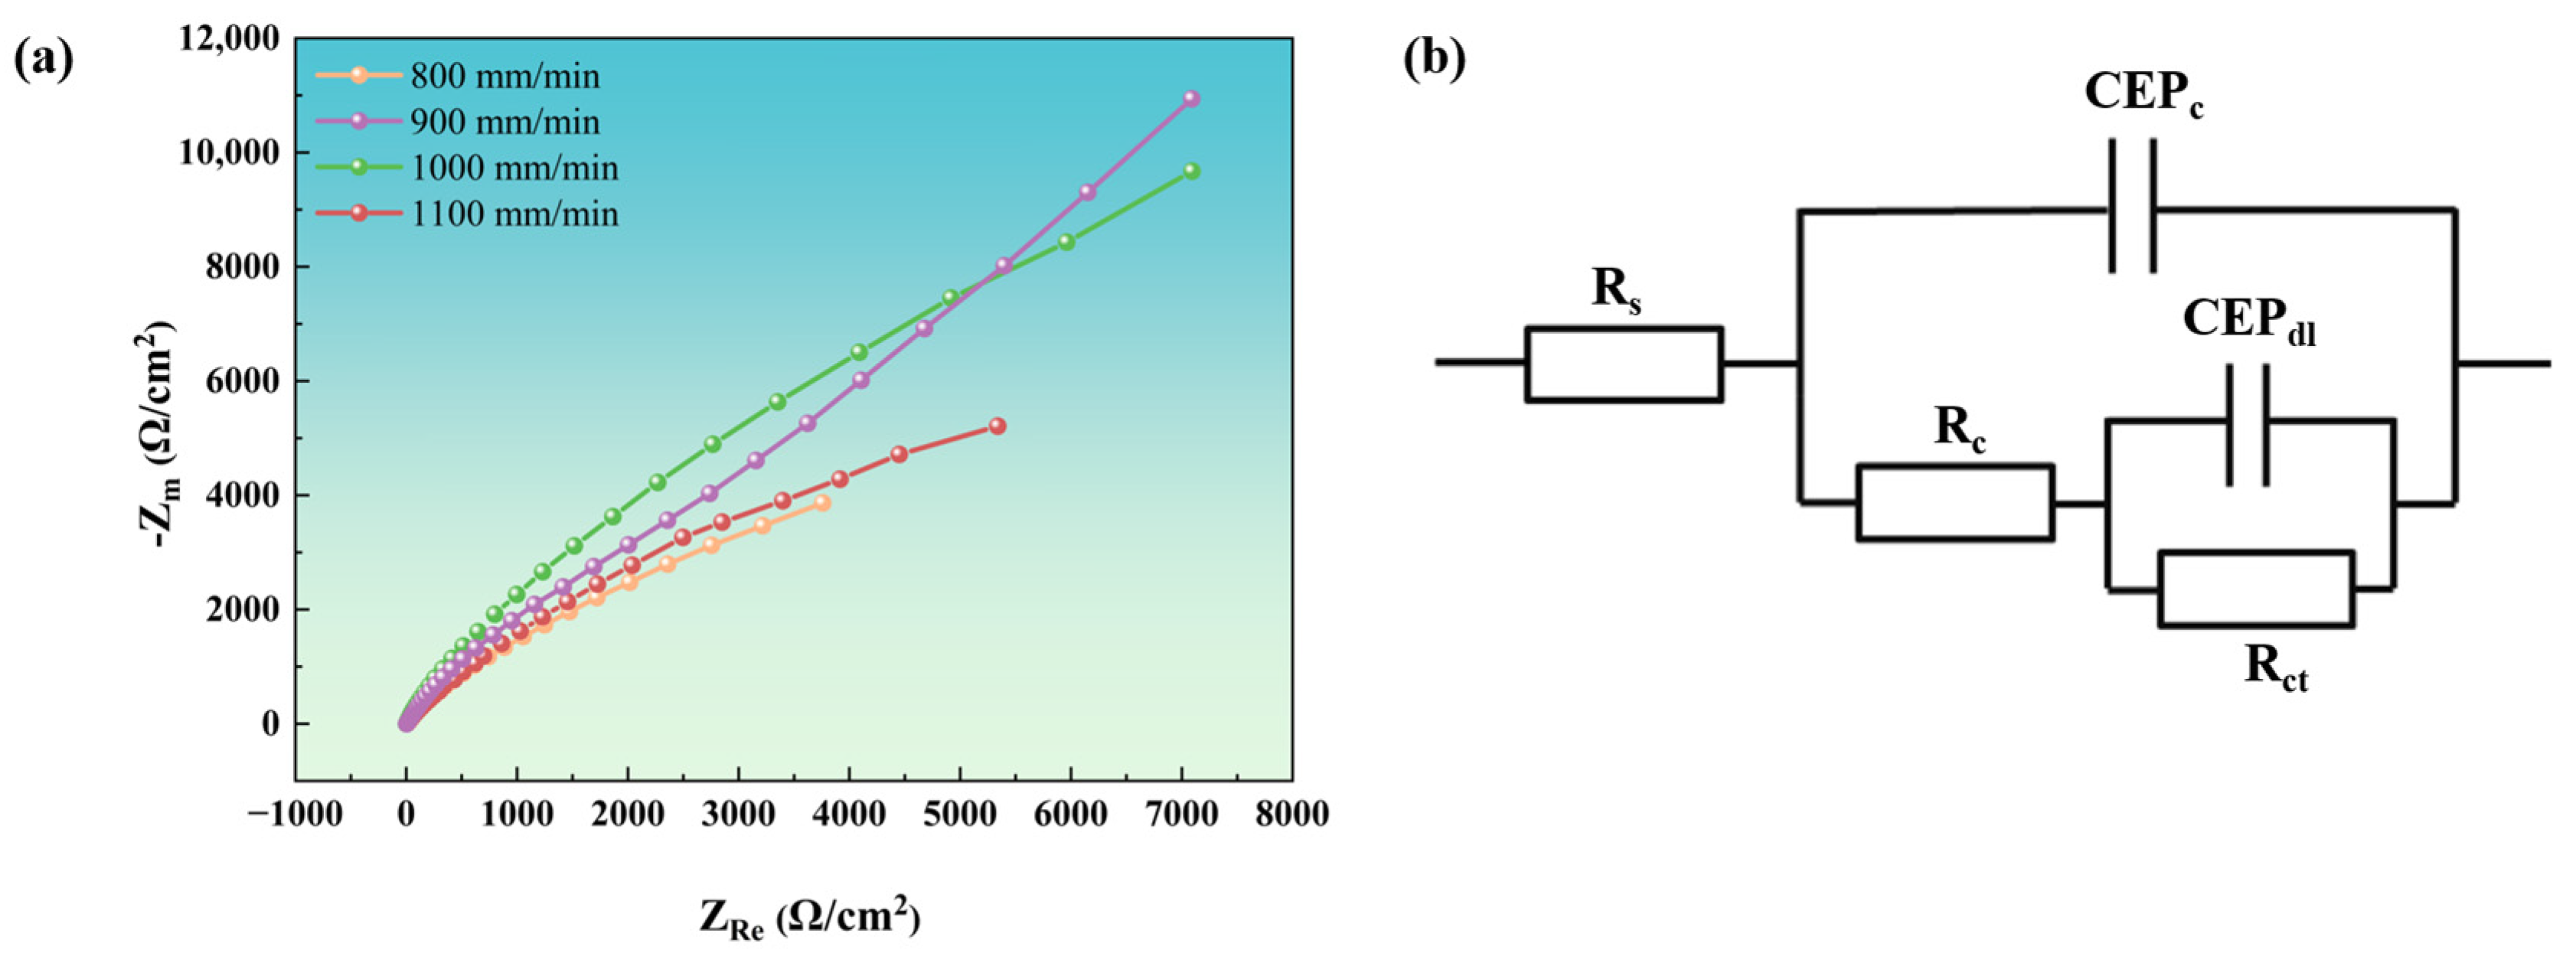
The diameter of the capacitive arc in the Nyquist diagram reflects variations in corrosion resistance among materials, with a larger diameter indicating superior corrosion resistance [
41]. As shown in
Figure 14a, the Nyquist plots of coatings deposited at different scanning rates exhibit incomplete impedance arcs, making direct determination of the arc diameter challenging. By fitting an equivalent circuit model and analyzing the raw data, the results in
Figure 14b were obtained, enabling intuitive interpretation and analysis.
In
Figure 14b,
Rs represents the solution resistance, reflecting the conductivity of the electrolyte. Higher values indicate poorer solution conductivity, which has a minimal impact on corrosion resistance [
42]. The CEP, which stands for Constant Phase Element (CPE), is utilized to characterize non-ideal capacitive behavior.
Cc is the double-layer admittance constant. Smaller values indicate a more stable double layer, smoother electrode surface, and enhanced corrosion resistance.
n1 is the non-ideal index of the double layer. Values closer to 1 indicate a more uniform surface and better corrosion resistance [
43].
Rc is the coating resistance. Higher values indicate a denser or more complete coating, enhancing resistance to corrosion [
44].
Cdl is the admittance constant of the coating film. Smaller values indicate a denser or thicker film with superior corrosion resistance.
n2 is the non-ideal index of the coating. Values closer to 1 indicate better coating uniformity and corrosion resistance [
45].
Rct is the charge transfer resistance. Higher values indicate greater kinetic resistance to corrosion reactions, resulting in significantly enhanced corrosion resistance.
As shown in the fitting data in
Table 8, the NiAlNbTiV coating exhibits optimal corrosion resistance at a laser scanning speed of 900 mm/min, followed by 1100 mm/min, 800 mm/min, and 1000 mm/min. This indicates that the relationship between laser cladding parameters and the corrosion resistance of the NiAlNbTiV coating is nonlinear. The coating produced at 900 mm/min exhibits the most superior corrosion resistance, attributed to its fine grain structure (which reduces intergranular corrosion) and minimal defects (that prevent electrolyte penetration). This optimal balance is contingent upon NiAlNbTiV’s capacity to form a stable Nb/Cr oxide film. In contrast, iron-rich HEAs [
8] generally exhibit weaker protective effects from iron oxides.
The electrochemical impedance spectroscopy (EIS) testing results indicate that the coating produced at a scanning speed of 800 mm/min has a lower polarization resistance (Rc). This can be attributed to the presence of coarse eutectic structures within the coating, which reduce its density, thereby diminishing its corrosion resistance. For the coating fabricated at a scanning speed of 1000 mm/min, the charge transfer resistance (Rct) reaches its lowest value. Rapid solidification during the laser cladding process results in a high grain-boundary density, which significantly increases the likelihood of grain-boundary corrosion. Notably, when the scanning speed increases to 1100 mm/min, the Rct of the coating relatively increases, while the Rc decreases. This indicates that the formation of a nanostructure within the coating enhances the interfacial resistance at the interfaces. However, the increased density of cracks introduces additional pathways for medium penetration, ultimately reducing the overall corrosion resistance of the coating.
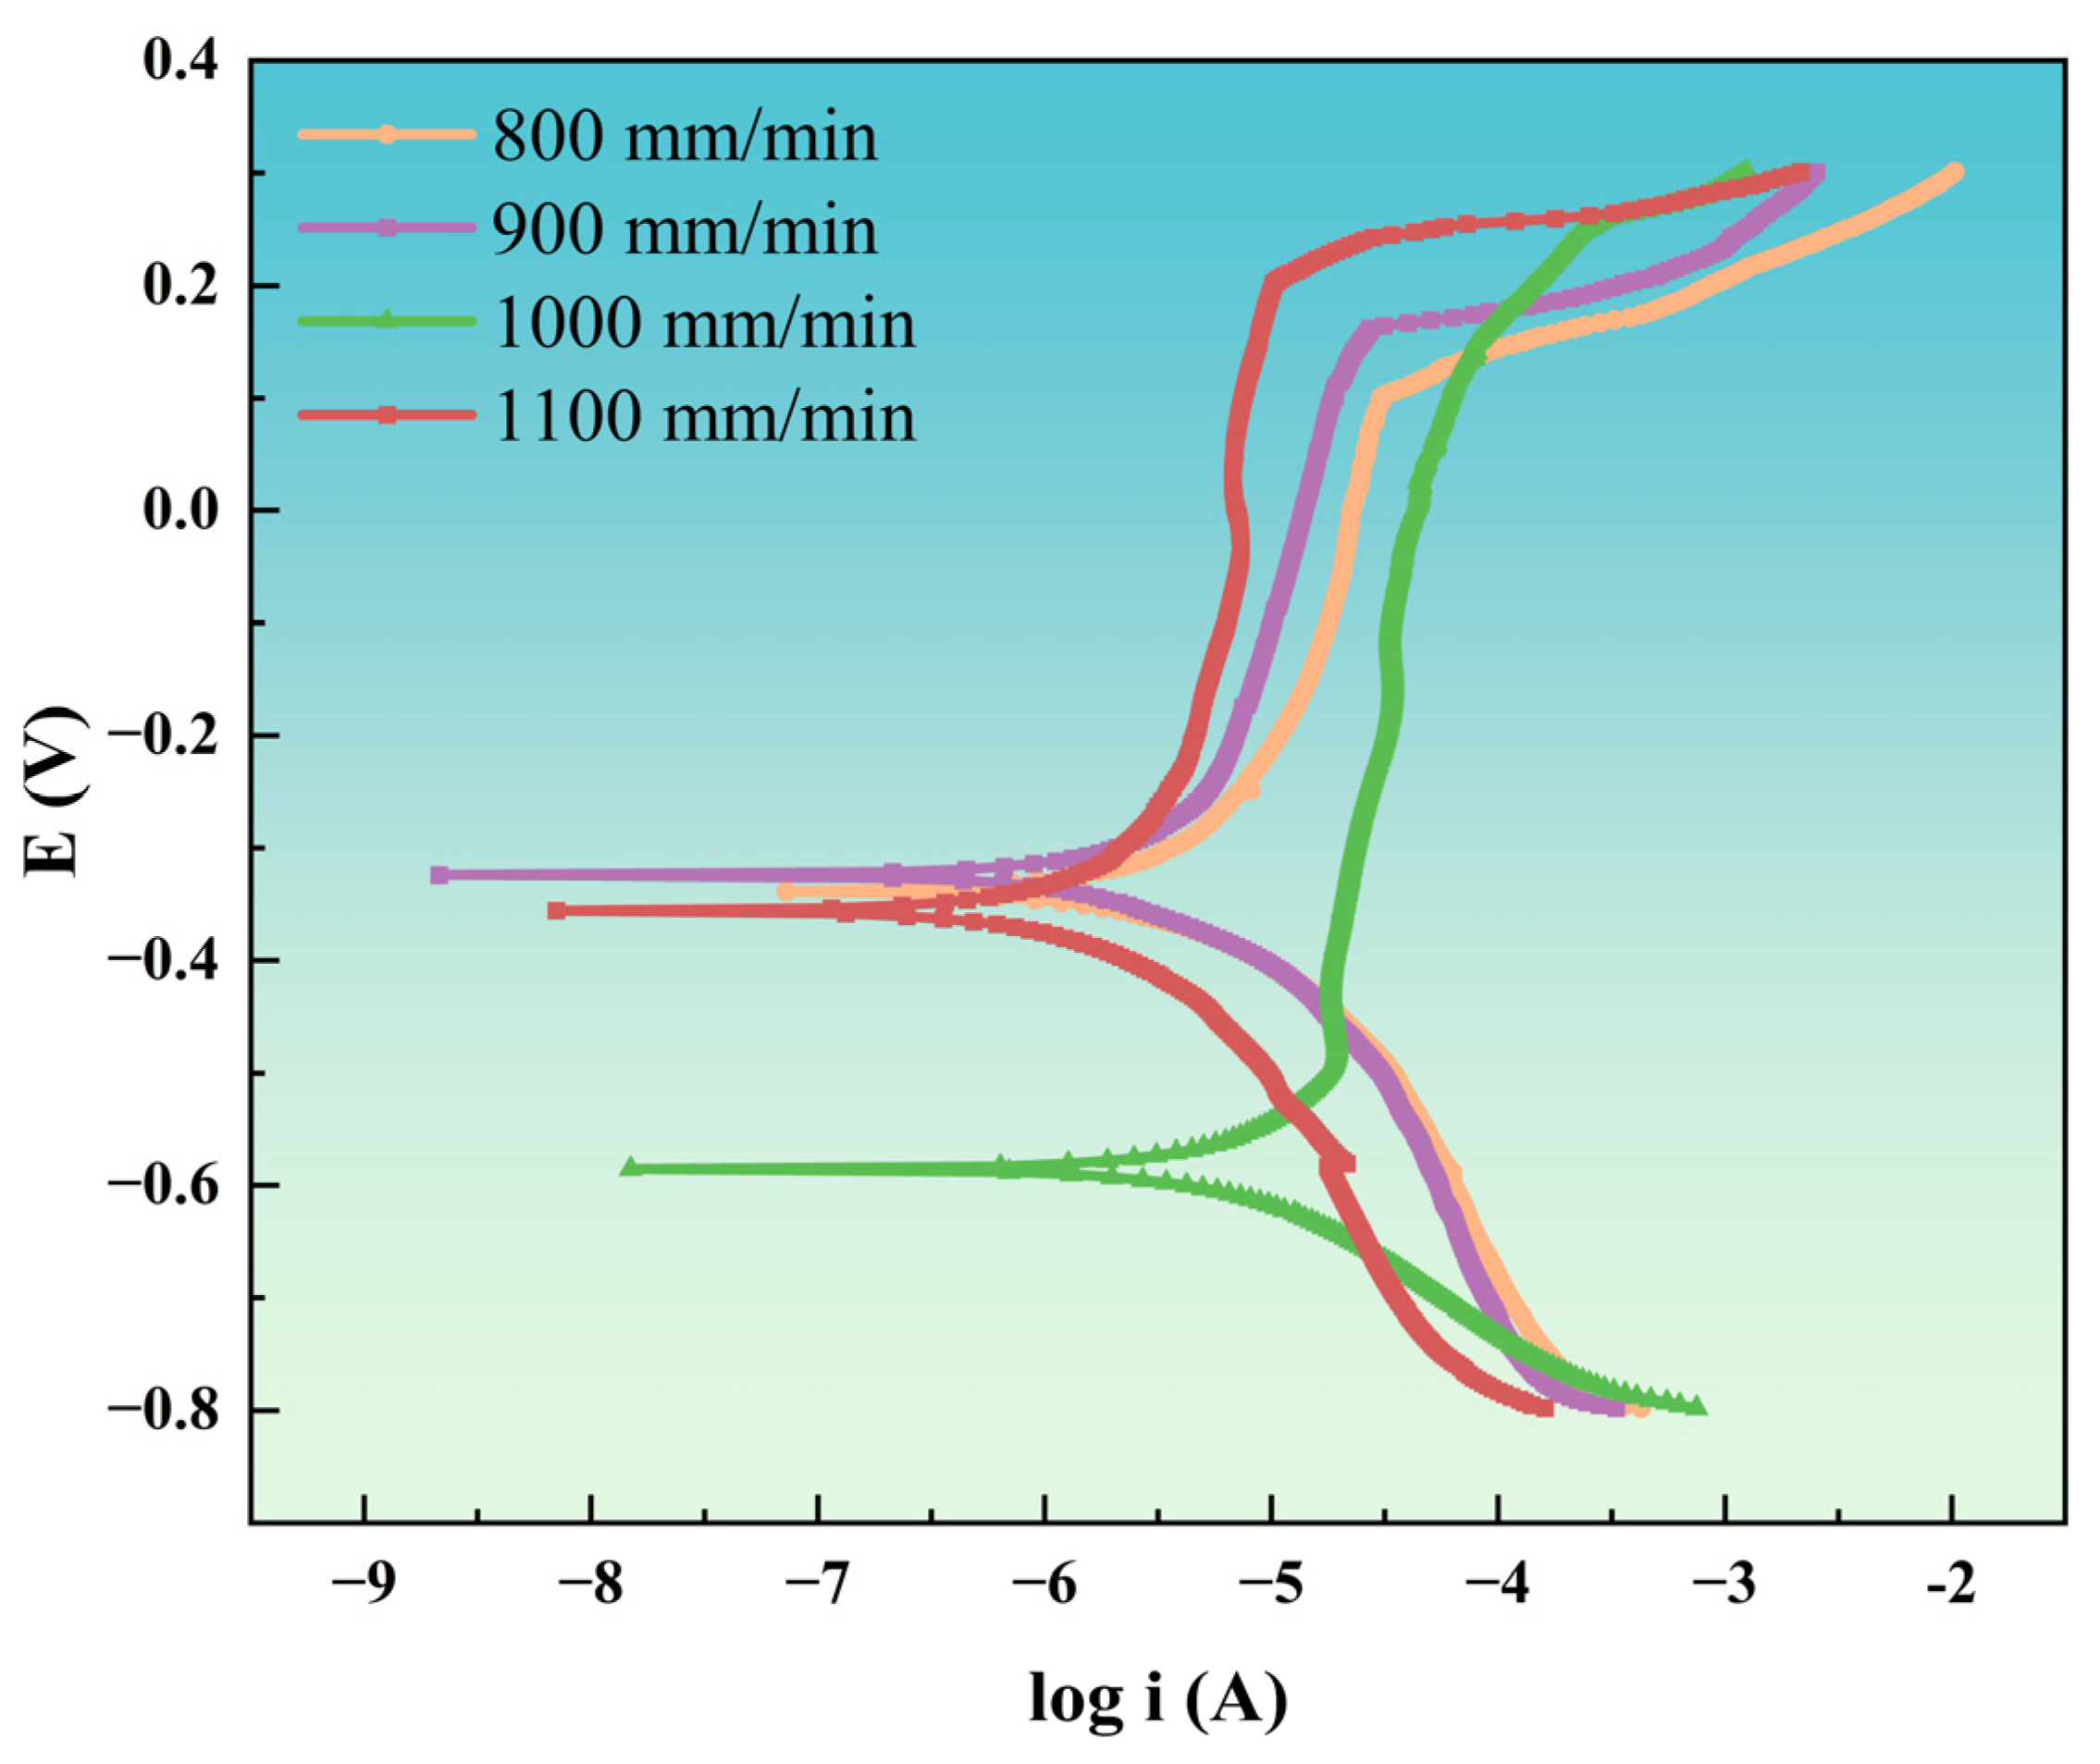
To ensure experimental accuracy, polarization curve measurements were conducted. Coatings exhibiting a lower corrosion current density (
Icorr) and a more positive corrosion potential (
Ecorr) demonstrate superior corrosion protection [
46].
Figure 15 presents the polarization curves of coatings deposited at various laser scanning speeds, while
Table 9 lists the corresponding fitting parameters for coatings immersed in 3.5 wt.% NaCl solution. As shown in
Figure 15, the corrosion behavior of NiAlNbTiV coatings at different laser scanning speeds exhibits a similar trend: the corrosion current initially decreases to a minimum before increasing with further increases in corrosion potential. All coatings exhibit passivation behavior; however, coatings deposited at a laser scanning speed of 900 mm/min demonstrate a higher passivation-break potential and lower passivation current. Analysis of the polarization curve fitting data in
Table 9 indicates that the coating deposited at 900 mm/min exhibits a lower
Icorr and a more positive
Ecorr. This phenomenon can be ascribed to several factors: the reduction in microgalvanic corrosion in fine-grained structures; the uniform oxide film, which helps to lower the corrosion rate; and the formation of a stable passivation film on the surface. These factors collectively contribute to effectively inhibiting anodic dissolution.

