Synergistic Enhancement of Li-O2 Battery Capacity and Cycle Life Using Carbon Nanochain/Multiwall Carbon Nanotube Composites
Abstract
1. Introduction
2. Experimental Section
2.1. Materials
2.2. CNC Preparation
2.3. CNC/MWCNT Cathode Preparation
2.4. Characterization
2.5. Electrochemical Cell Assembly and Testing
3. Results and Discussion
3.1. MWCNT Cathodes
3.2. CNC/MWCNT Cathode Pore Structure
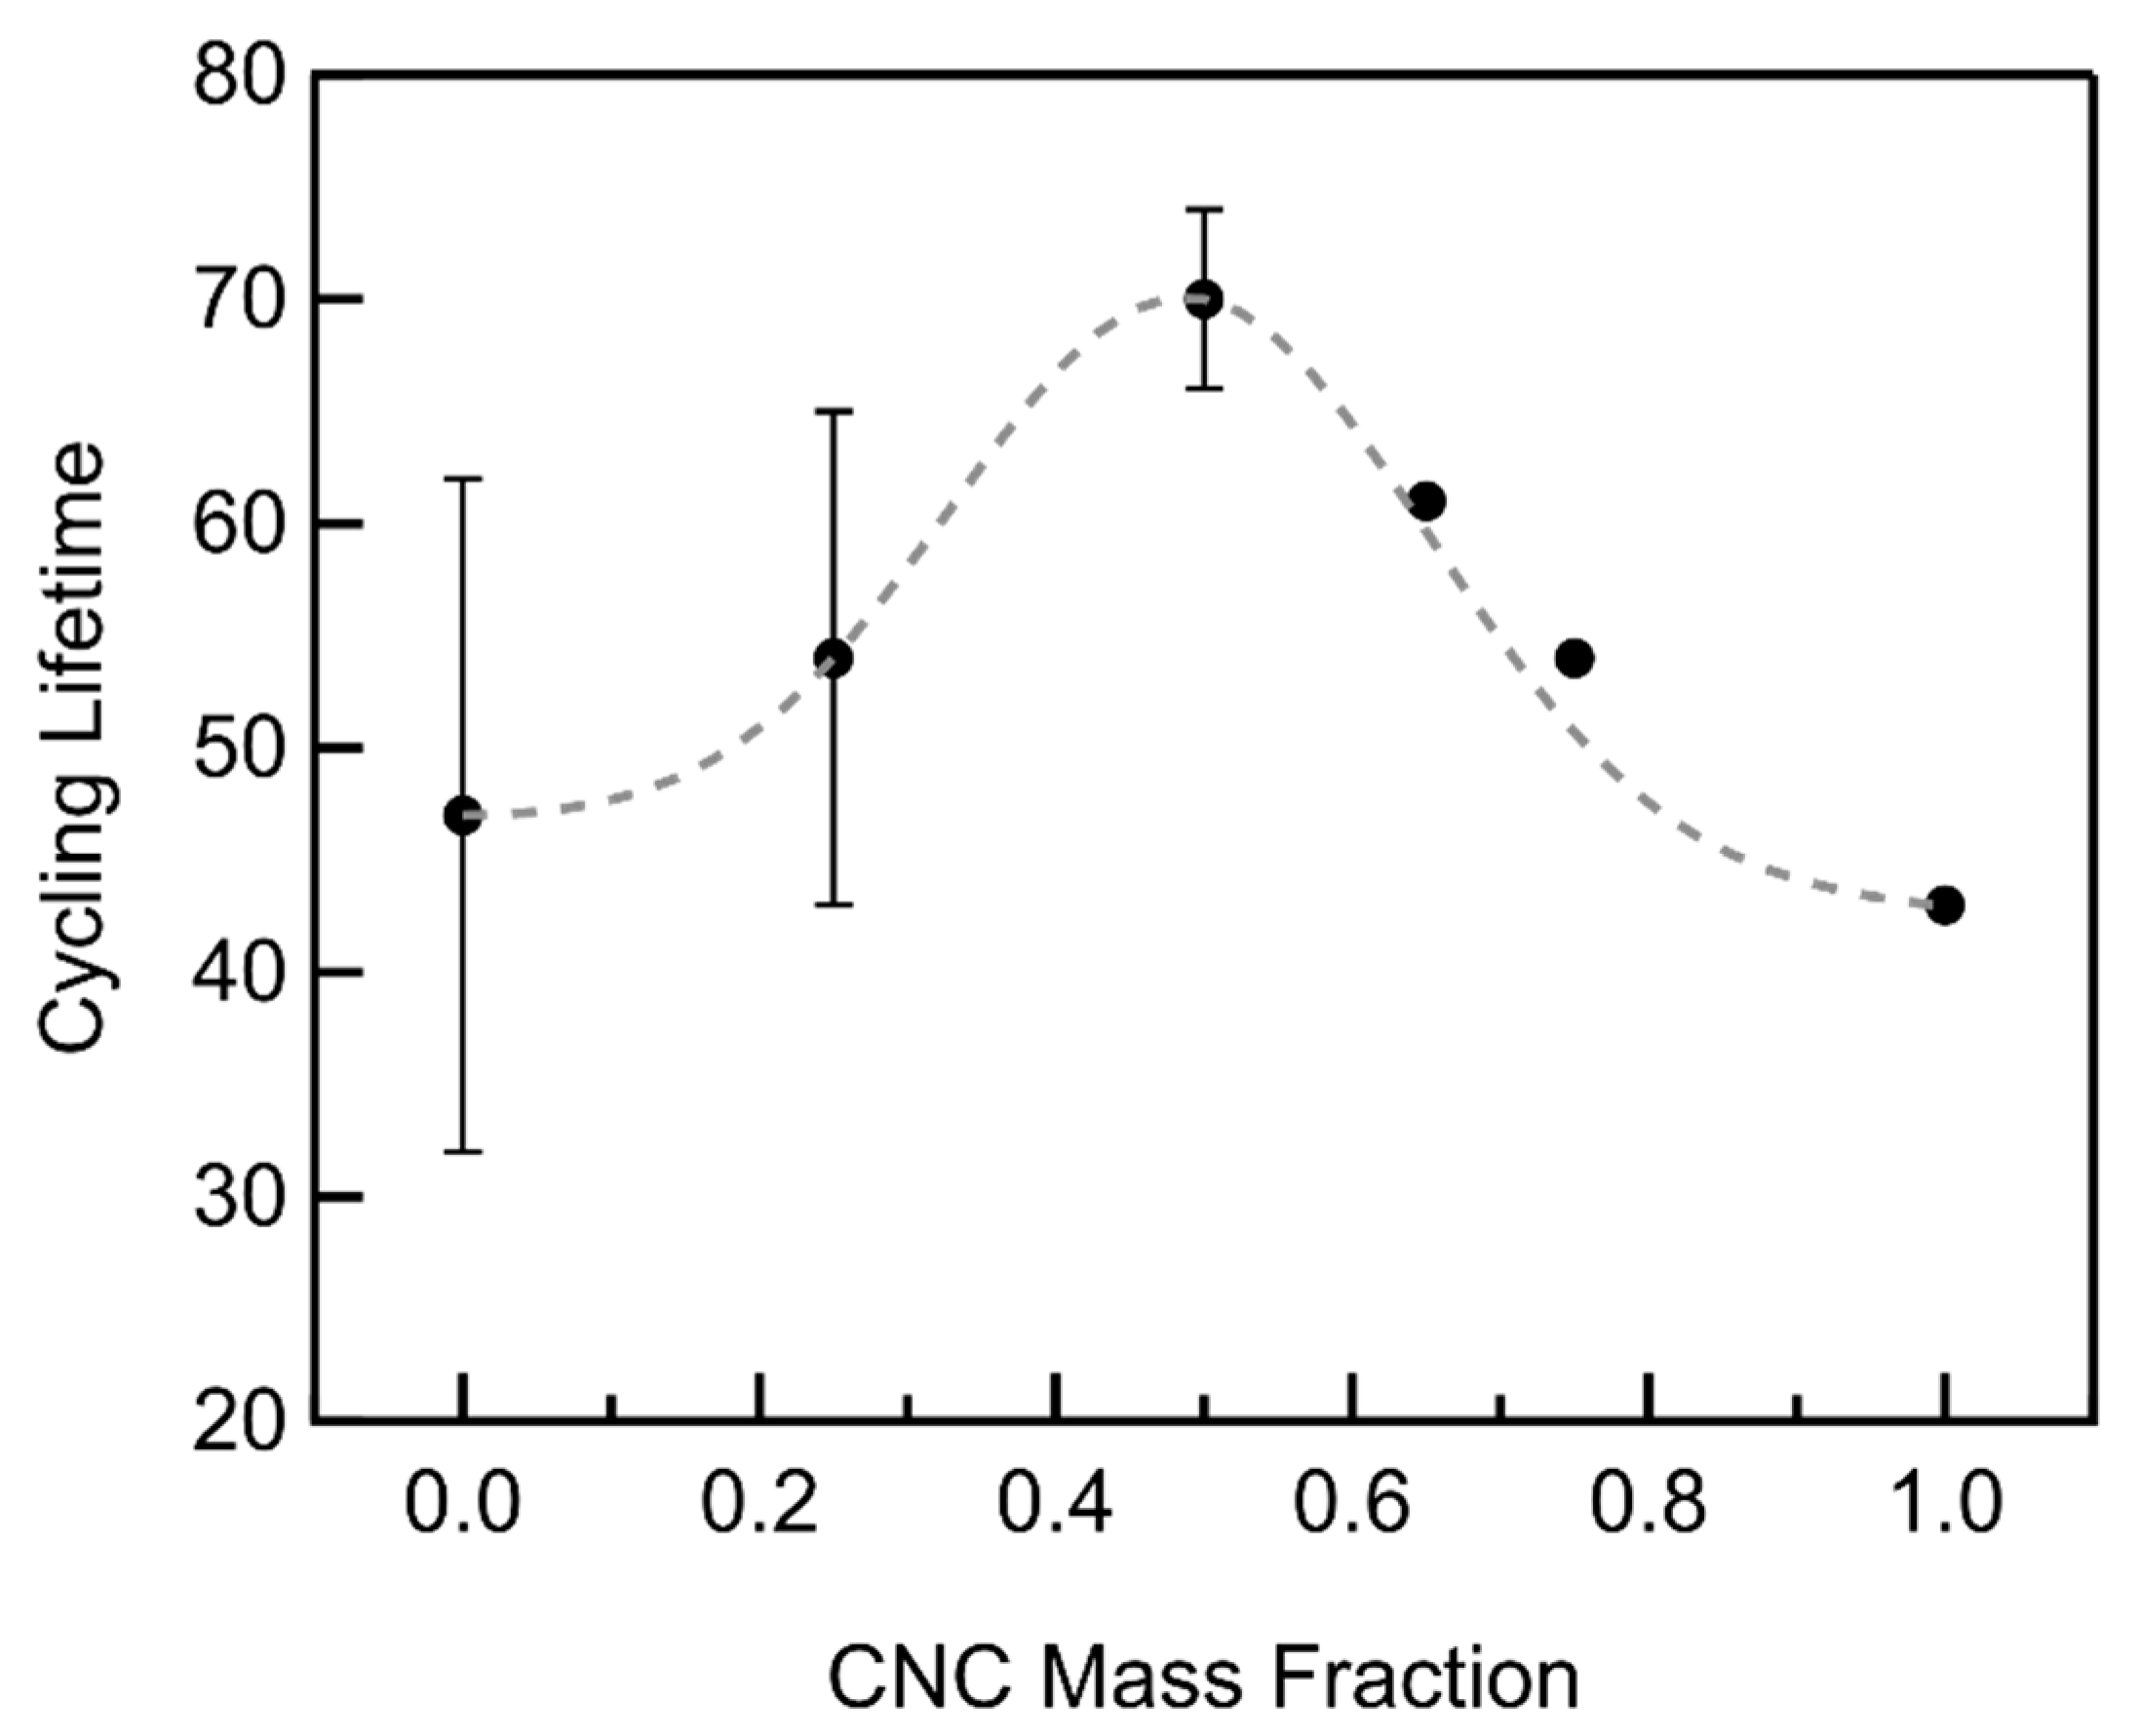
3.3. CNC/MWCNT Cathode Performance
4. Conclusions
Supplementary Materials
Author Contributions
Funding
Data Availability Statement
Conflicts of Interest
Correction Statement
References
- Bruce, P.G.; Freunberger, S.A.; Hardwick, L.J.; Tarascon, J.-M. Li–O2 and Li–S batteries with high energy storage. Nat. Mater. 2012, 11, 19–29. [Google Scholar] [CrossRef] [PubMed]
- Tan, P.; Jiang, H.R.; Zhu, X.B.; An, L.; Jung, C.Y.; Wu, M.C.; Shi, L.; Shyy, W.; Zhao, T.S. Advances and challenges in lithium-air batteries. Appl. Energy 2017, 204, 780–806. [Google Scholar] [CrossRef]
- Aurbach, D.; McCloskey, B.D.; Nazar, L.F.; Bruce, P.G. Advances in understanding mechanisms underpinning lithium–air batteries. Nat. Energy 2016, 1, 16128. [Google Scholar] [CrossRef]
- Cao, D.; Bai, Y.; Zhang, J.; Tan, G.; Wu, C. Irreplaceable Carbon Boosts LiO2 Batteries: From Mechanism Research to Practical Application. Nano Energy 2021, 89, 106464. [Google Scholar] [CrossRef]
- Karabelli, D.; Birke, K.P. Feasible Energy Density Pushes of Li-Metal vs. Li-Ion Cells. Appl. Sci. 2021, 11, 7592. [Google Scholar] [CrossRef]
- Global EV Outlook 2021; International Energy Agency: Paris, France, 2021.
- Bae, Y.; Yun, Y.S.; Lim, H.-D.; Lee, H.; Kim, Y.-J.; Kim, J.; Park, H.; Ko, Y.; Lee, S.; Kwon, H.J.; et al. Tuning the Carbon Crystallinity for Highly Stable Li–O2 Batteries. Chem. Mater. 2016, 28, 8160–8169. [Google Scholar] [CrossRef]
- Lim, H.D.; Park, K.Y.; Song, H.; Jang, E.Y.; Gwon, H.; Kim, J.; Kim, Y.H.; Lima, M.D.; Robles, R.O.; Lepró, X.; et al. Enhanced Power and Rechargeability of a Li−O2 Battery Based on a Hierarchical-Fibril CNT Electrode. Adv. Mater. 2013, 25, 1348–1352. [Google Scholar] [CrossRef]
- Jian, Z.; Liu, P.; Li, F.; He, P.; Guo, X.; Chen, M.; Zhou, H. Core-shell-structured CNT@RuO2 composite as a high-performance cathode catalyst for rechargeable Li-O2 batteries. Angew. Chem. Int. Ed. Engl. 2014, 53, 442–446. [Google Scholar] [CrossRef]
- Kim, H.; Lee, H.; Kim, M.; Bae, Y.; Baek, W.; Park, K.; Park, S.; Kim, T.; Kwon, H.; Choi, W.; et al. Flexible free-standing air electrode with bimodal pore architecture for long-cycling Li-O2 batteries. Carbon 2017, 117, 454–461. [Google Scholar] [CrossRef]
- Lee, H.; Lee, D.J.; Kim, M.; Kim, H.; Cho, Y.S.; Kwon, H.J.; Lee, H.C.; Park, C.R.; Im, D. High-Energy Density Li–O2 Battery with a Polymer Electrolyte-Coated CNT Electrode via the Layer-by-Layer Method. ACS Appl. Mater. Interfaces 2020, 12, 17385–17395. [Google Scholar] [CrossRef] [PubMed]
- Wang, Y.; Bai, F.; Wang, A.; Cui, Z.; Wang, D.; Shi, S.; Zhang, T. Perfluorinated organics regulating Li2O2 formation and improving stability for Li–oxygen batteries. Chem. Commun. 2021, 57, 3030–3033. [Google Scholar] [CrossRef]
- Huang, S.; Fan, W.; Guo, X.; Meng, F.; Liu, X. Positive Role of Surface Defects on Carbon Nanotube Cathodes in Overpotential and Capacity Retention of Rechargeable Lithium–Oxygen Batteries. ACS Appl. Mater. Interfaces 2014, 6, 21567–21575. [Google Scholar] [CrossRef]
- Huang, Z.; Deng, Z.; Shen, Y.; Chen, W.; Liu, W.; Xie, M.; Li, Y.; Huang, Y. A Li–O2 battery cathode with vertical mass/charge transfer pathways. J. Mater. Chem. A 2019, 7, 3000–3005. [Google Scholar] [CrossRef]
- Yu, R.; Fan, W.; Guo, X.; Dong, S. Highly ordered and ultra-long carbon nanotube arrays as air cathodes for high-energy-efficiency Li-oxygen batteries. J. Power Sources 2016, 306, 402–407. [Google Scholar] [CrossRef]
- Womble, M.D.; McKenzie, K.R.; Wagner, M.J. Thick film formation on Li-O2 cathodes—Breaking the true capacity barrier. Sci. Rep. 2025, 15, 5868. [Google Scholar] [CrossRef]
- Wagner, M.J.; Banek, N.A.; Abele, D.T.; McKenzie, K.R. Production of Carbon Nanochains and Nanotubes from Biomass. US Patent 11975970B2, 7 May 2024. [Google Scholar]
- Mahne, N.; Fontaine, O.; Thotiyl, M.O.; Wilkening, M.; Freunberger, S.A. Mechanism and performance of lithium–oxygen batteries—A perspective. Chem. Sci. 2017, 8, 6716–6729. [Google Scholar] [CrossRef] [PubMed]
- Ding, N.; Chien, S.W.; Hor, T.S.A.; Lum, R.; Zong, Y.; Liu, Z. Influence of carbon pore size on the discharge capacity of Li–O2 batteries. J. Mater. Chem. A 2014, 2, 12433–12441. [Google Scholar] [CrossRef]
- Torquato, S. Modeling of physical properties of composite materials. Int. J. Solids Struct. 2000, 37, 411–422. [Google Scholar] [CrossRef]
- Itkis, D.M.; Semenenko, D.A.; Kataev, E.Y.; Belova, A.I.; Neudachina, V.S.; Sirotina, A.P.; Hävecker, M.; Teschner, D.; Knop-Gericke, A.; Dudin, P.; et al. Reactivity of Carbon in Lithium–Oxygen Battery Positive Electrodes. Nano Lett. 2013, 13, 4697–4701. [Google Scholar] [CrossRef]
- Olivares-Marín, M.; Aklalouch, M.; Tonti, D. Combined Influence of Meso- and Macroporosity of Soft-Hard Templated Carbon Electrodes on the Performance of Li-O2 Cells with Different Configurations. Nanomaterials 2019, 9, 810. [Google Scholar] [CrossRef]
- Kim, Y.; Yun, J.; Shin, H.-S.; Jung, K.-N.; Lee, J.-W. Synergistic nanoarchitecture of mesoporous carbon and carbon nanotubes for lithium–oxygen batteries. Nano Converg. 2021, 8, 17. [Google Scholar] [CrossRef]
- Chawla, N.; Chamaani, A.; Safa, M.; El-Zahab, B. Palladium-Filled Carbon Nanotubes Cathode for Improved Electrolyte Stability and Cyclability Performance of Li-O2 Batteries. J. Electrochem. Soc. 2017, 164, A6303. [Google Scholar] [CrossRef]
- Cho, Y.S.; Kim, H.; Byeon, M.; Kim, D.Y.; Park, H.; Jung, Y.; Bae, Y.; Kim, M.; Lee, D.; Park, J.; et al. Enhancing the cycle stability of Li–O2 batteries via functionalized carbon nanotube-based electrodes. J. Mater. Chem. A 2020, 8, 4263–4273. [Google Scholar] [CrossRef]
- Nitta, N.; Wu, F.; Lee, J.T.; Yushin, G. Li-ion battery materials: Present and future. Mater. Today 2015, 18, 252–264. [Google Scholar] [CrossRef]







Disclaimer/Publisher’s Note: The statements, opinions and data contained in all publications are solely those of the individual author(s) and contributor(s) and not of MDPI and/or the editor(s). MDPI and/or the editor(s) disclaim responsibility for any injury to people or property resulting from any ideas, methods, instructions or products referred to in the content. |
© 2025 by the authors. Licensee MDPI, Basel, Switzerland. This article is an open access article distributed under the terms and conditions of the Creative Commons Attribution (CC BY) license (https://creativecommons.org/licenses/by/4.0/).
Share and Cite
Womble, M.D.; Adebayo, C.; Cascio, S.; Wagner, M.J. Synergistic Enhancement of Li-O2 Battery Capacity and Cycle Life Using Carbon Nanochain/Multiwall Carbon Nanotube Composites. Materials 2025, 18, 3897. https://doi.org/10.3390/ma18163897
Womble MD, Adebayo C, Cascio S, Wagner MJ. Synergistic Enhancement of Li-O2 Battery Capacity and Cycle Life Using Carbon Nanochain/Multiwall Carbon Nanotube Composites. Materials. 2025; 18(16):3897. https://doi.org/10.3390/ma18163897
Chicago/Turabian StyleWomble, Michael D., Cynthia Adebayo, Silas Cascio, and Michael J. Wagner. 2025. "Synergistic Enhancement of Li-O2 Battery Capacity and Cycle Life Using Carbon Nanochain/Multiwall Carbon Nanotube Composites" Materials 18, no. 16: 3897. https://doi.org/10.3390/ma18163897
APA StyleWomble, M. D., Adebayo, C., Cascio, S., & Wagner, M. J. (2025). Synergistic Enhancement of Li-O2 Battery Capacity and Cycle Life Using Carbon Nanochain/Multiwall Carbon Nanotube Composites. Materials, 18(16), 3897. https://doi.org/10.3390/ma18163897


