Figure 1.
Schematic diagram of permanent magnet direct-drive wheelset.
Figure 1.
Schematic diagram of permanent magnet direct-drive wheelset.
Figure 2.
Schematic diagram of cracking locations of failure axles: (a) axle 1#: broken after 3 million fatigue tests, and red marked line indicates failure area; (b) axle 2#: cracks detected (blue line mark) after 3.5 million fatigue tests; (c) axle 3#: cracks detected (blue line mark) after 1.6 million fatigue tests.
Figure 3.
Macro-morphology of the failed axle 1# (axle diameter is 220 mm; axle shoulder diameter is 250 mm).
Figure 3.
Macro-morphology of the failed axle 1# (axle diameter is 220 mm; axle shoulder diameter is 250 mm).
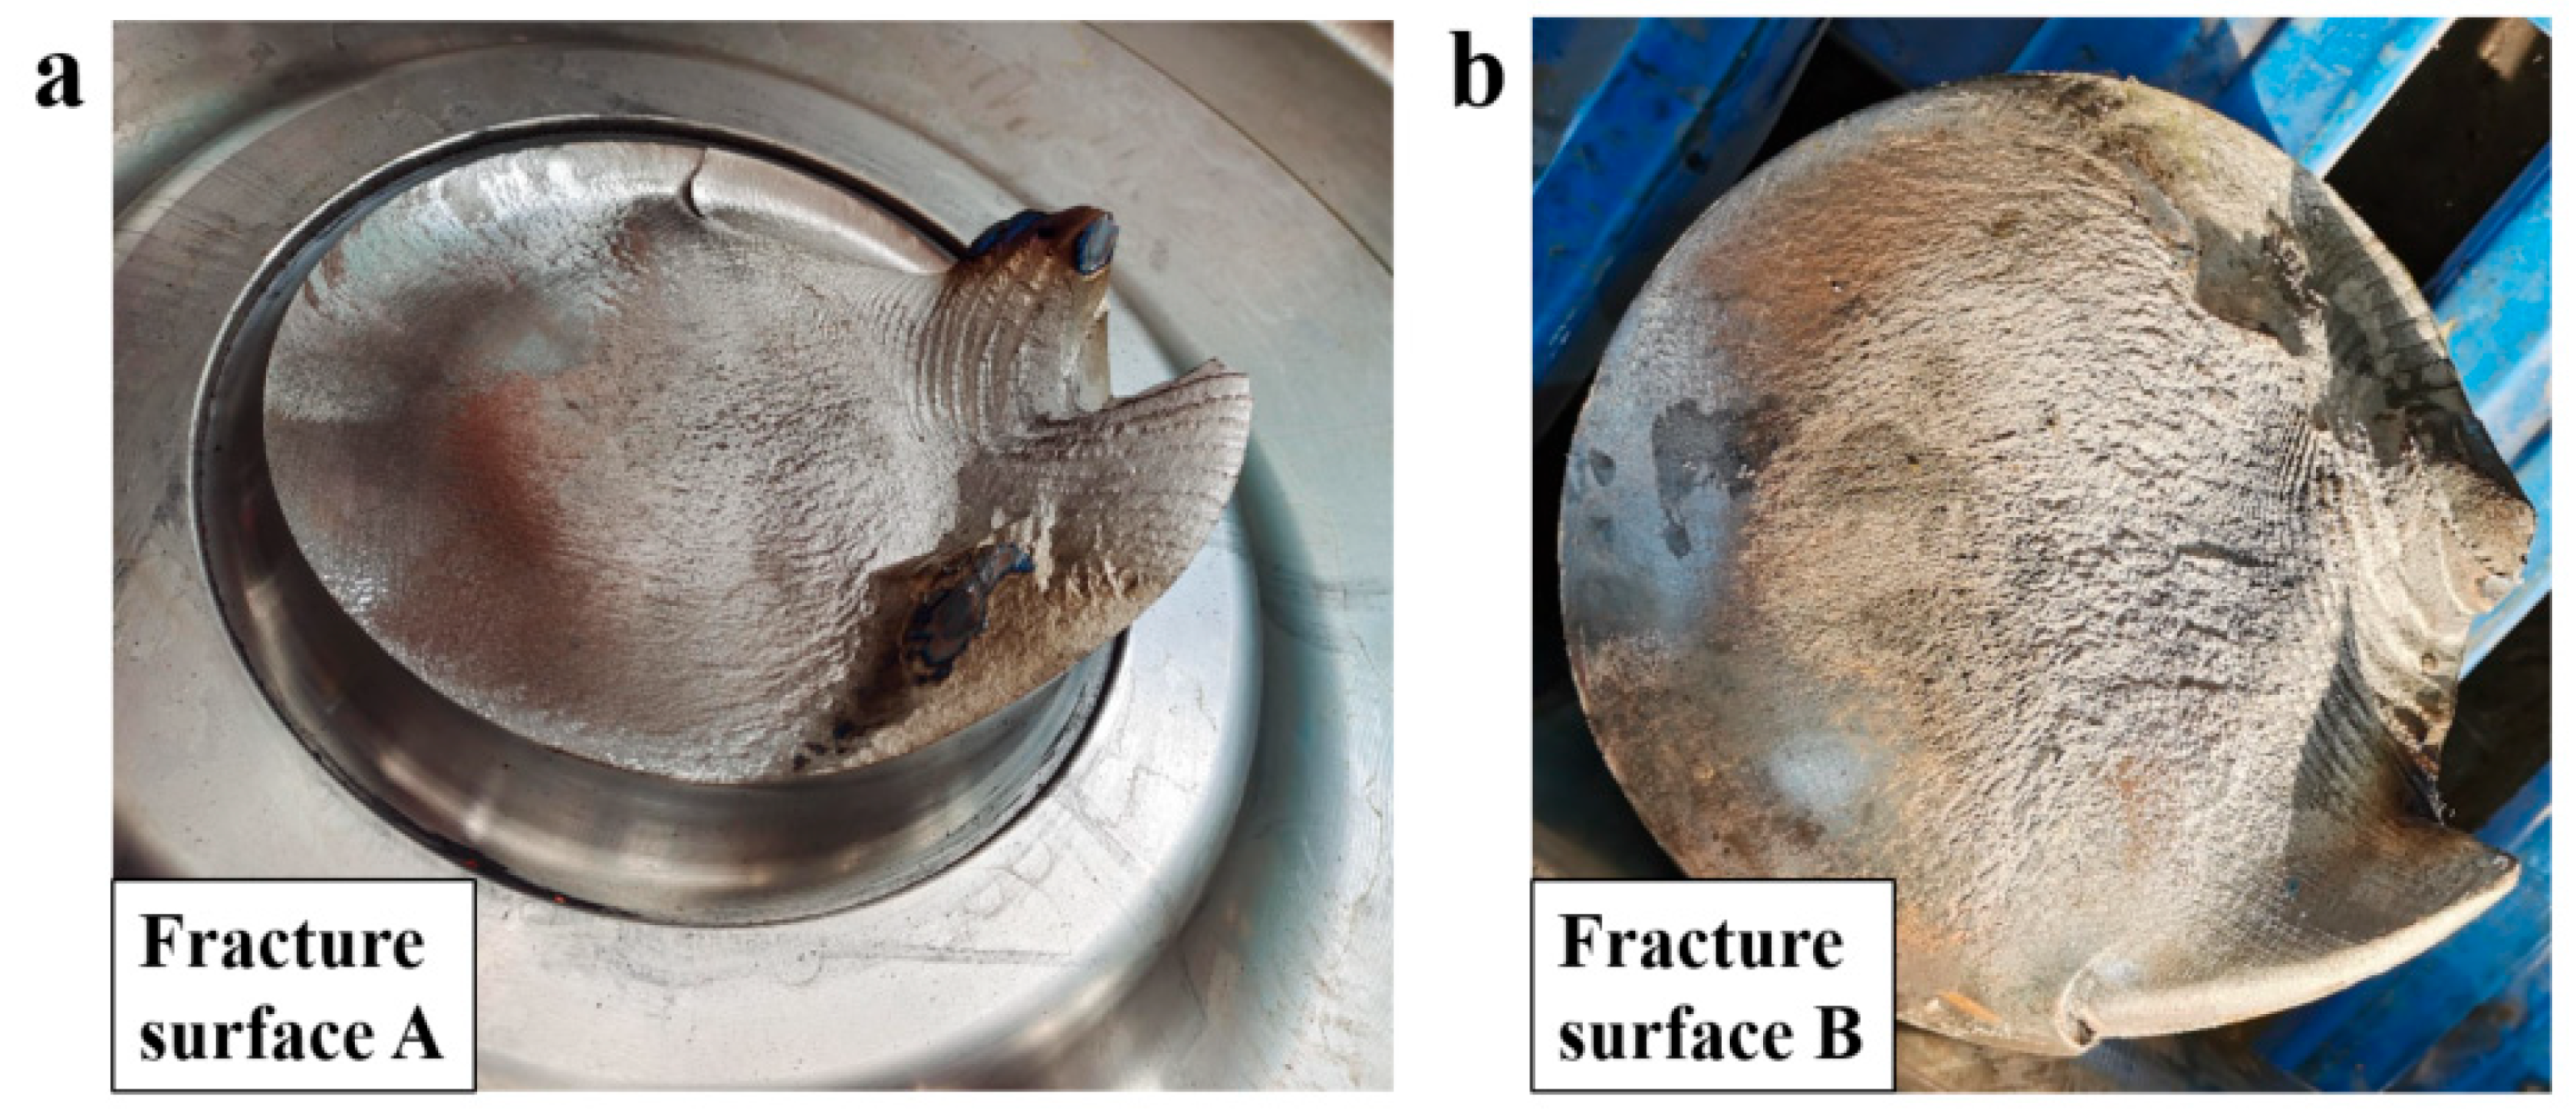
Figure 4.
Two matching surfaces of the broken axle 1#: (a) surface A; (b) surface B.
Figure 4.
Two matching surfaces of the broken axle 1#: (a) surface A; (b) surface B.
Figure 5.
(a) Side view of the fracture surface A. (b) Fatigue propagation and fast fracture zones in fracture surface B.
Figure 5.
(a) Side view of the fracture surface A. (b) Fatigue propagation and fast fracture zones in fracture surface B.
Figure 6.
SEM morphologies near the fatigue crack initiation zone of axle 1#. (a,b) Microstructural features and fatigue striations; (c,d) parallel machining marks near the crack nucleation site.
Figure 6.
SEM morphologies near the fatigue crack initiation zone of axle 1#. (a,b) Microstructural features and fatigue striations; (c,d) parallel machining marks near the crack nucleation site.
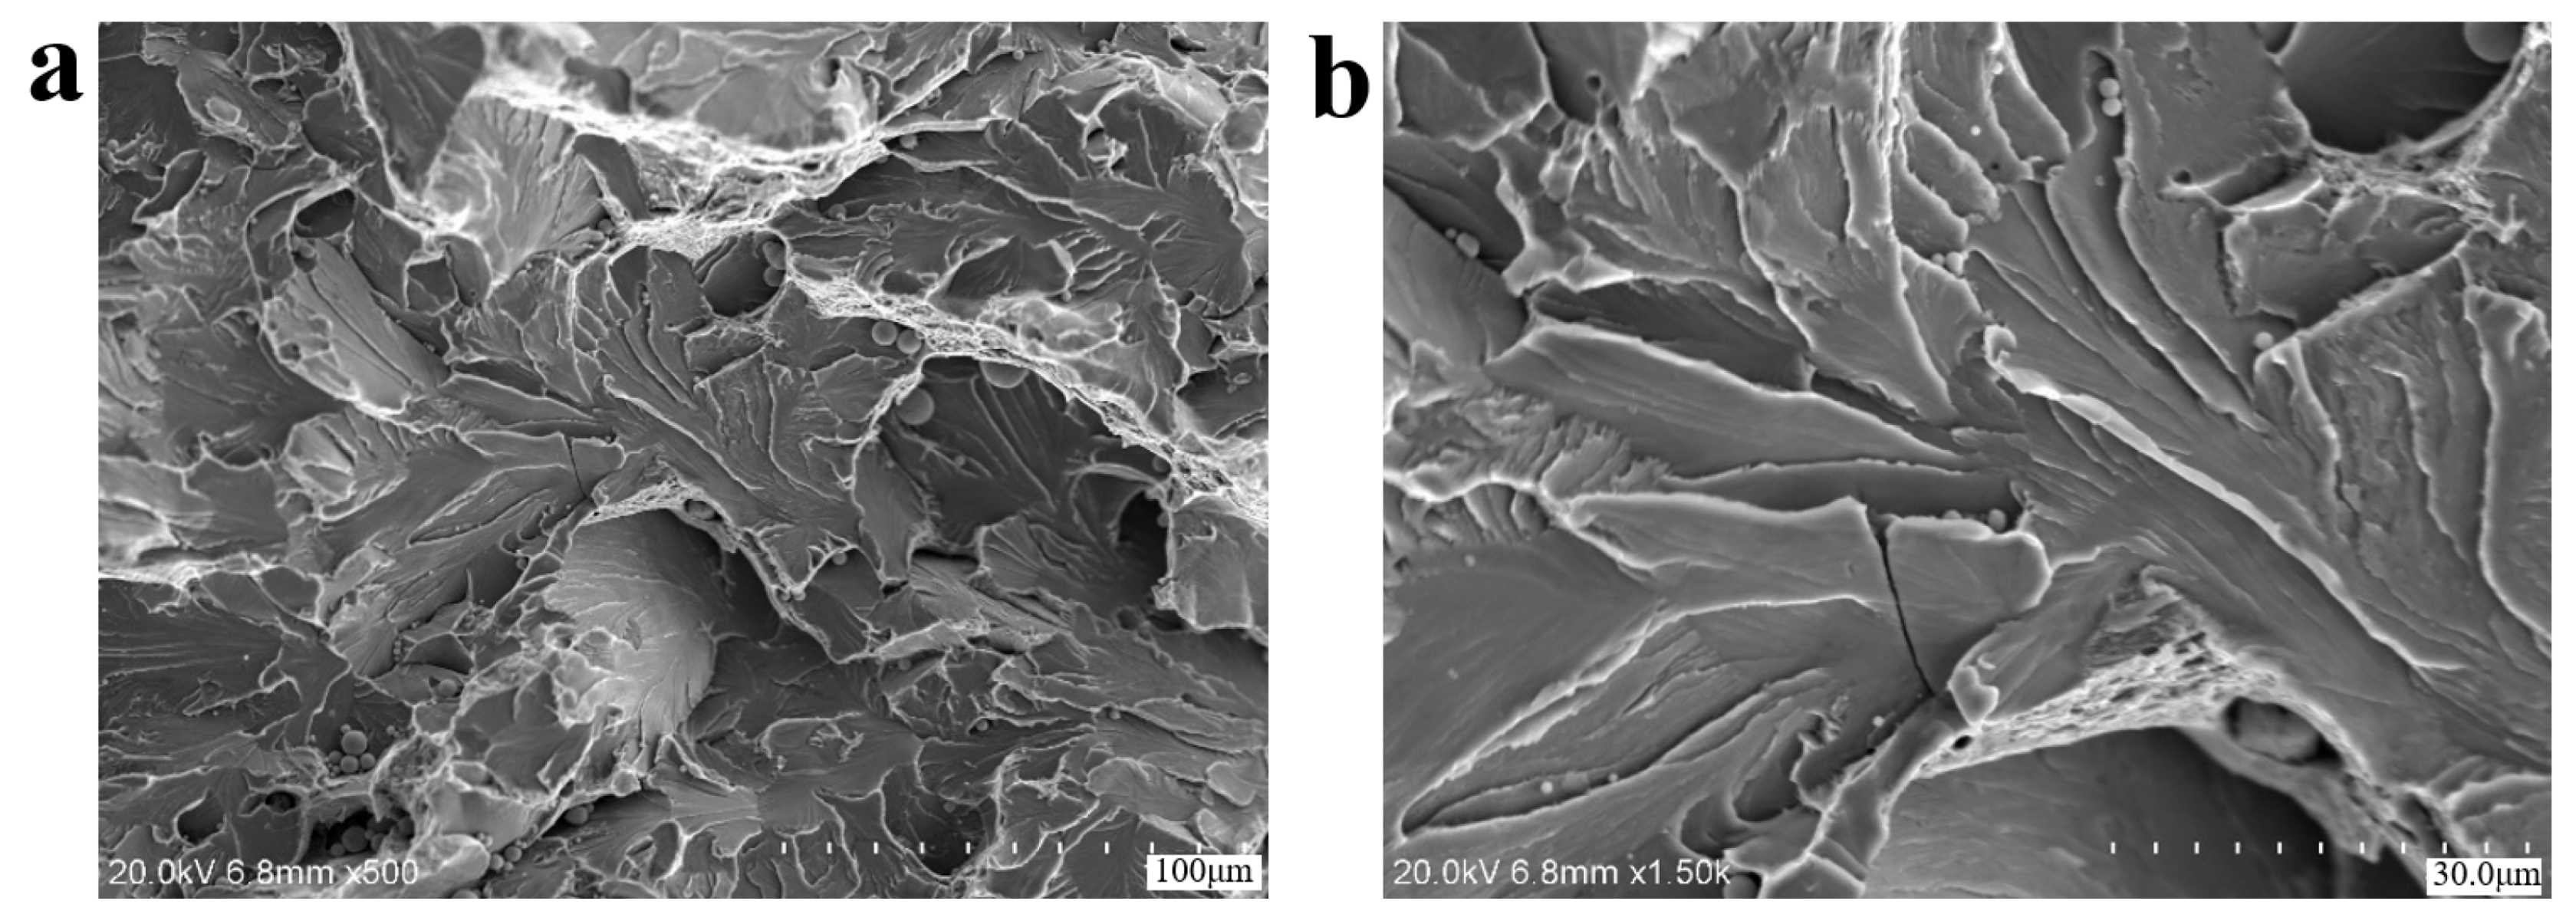
Figure 7.
SEM morphologies of the final fracture zone of axle 1#: (a,b) cleavage facets, indicating high-stress brittle fractures.
Figure 7.
SEM morphologies of the final fracture zone of axle 1#: (a,b) cleavage facets, indicating high-stress brittle fractures.
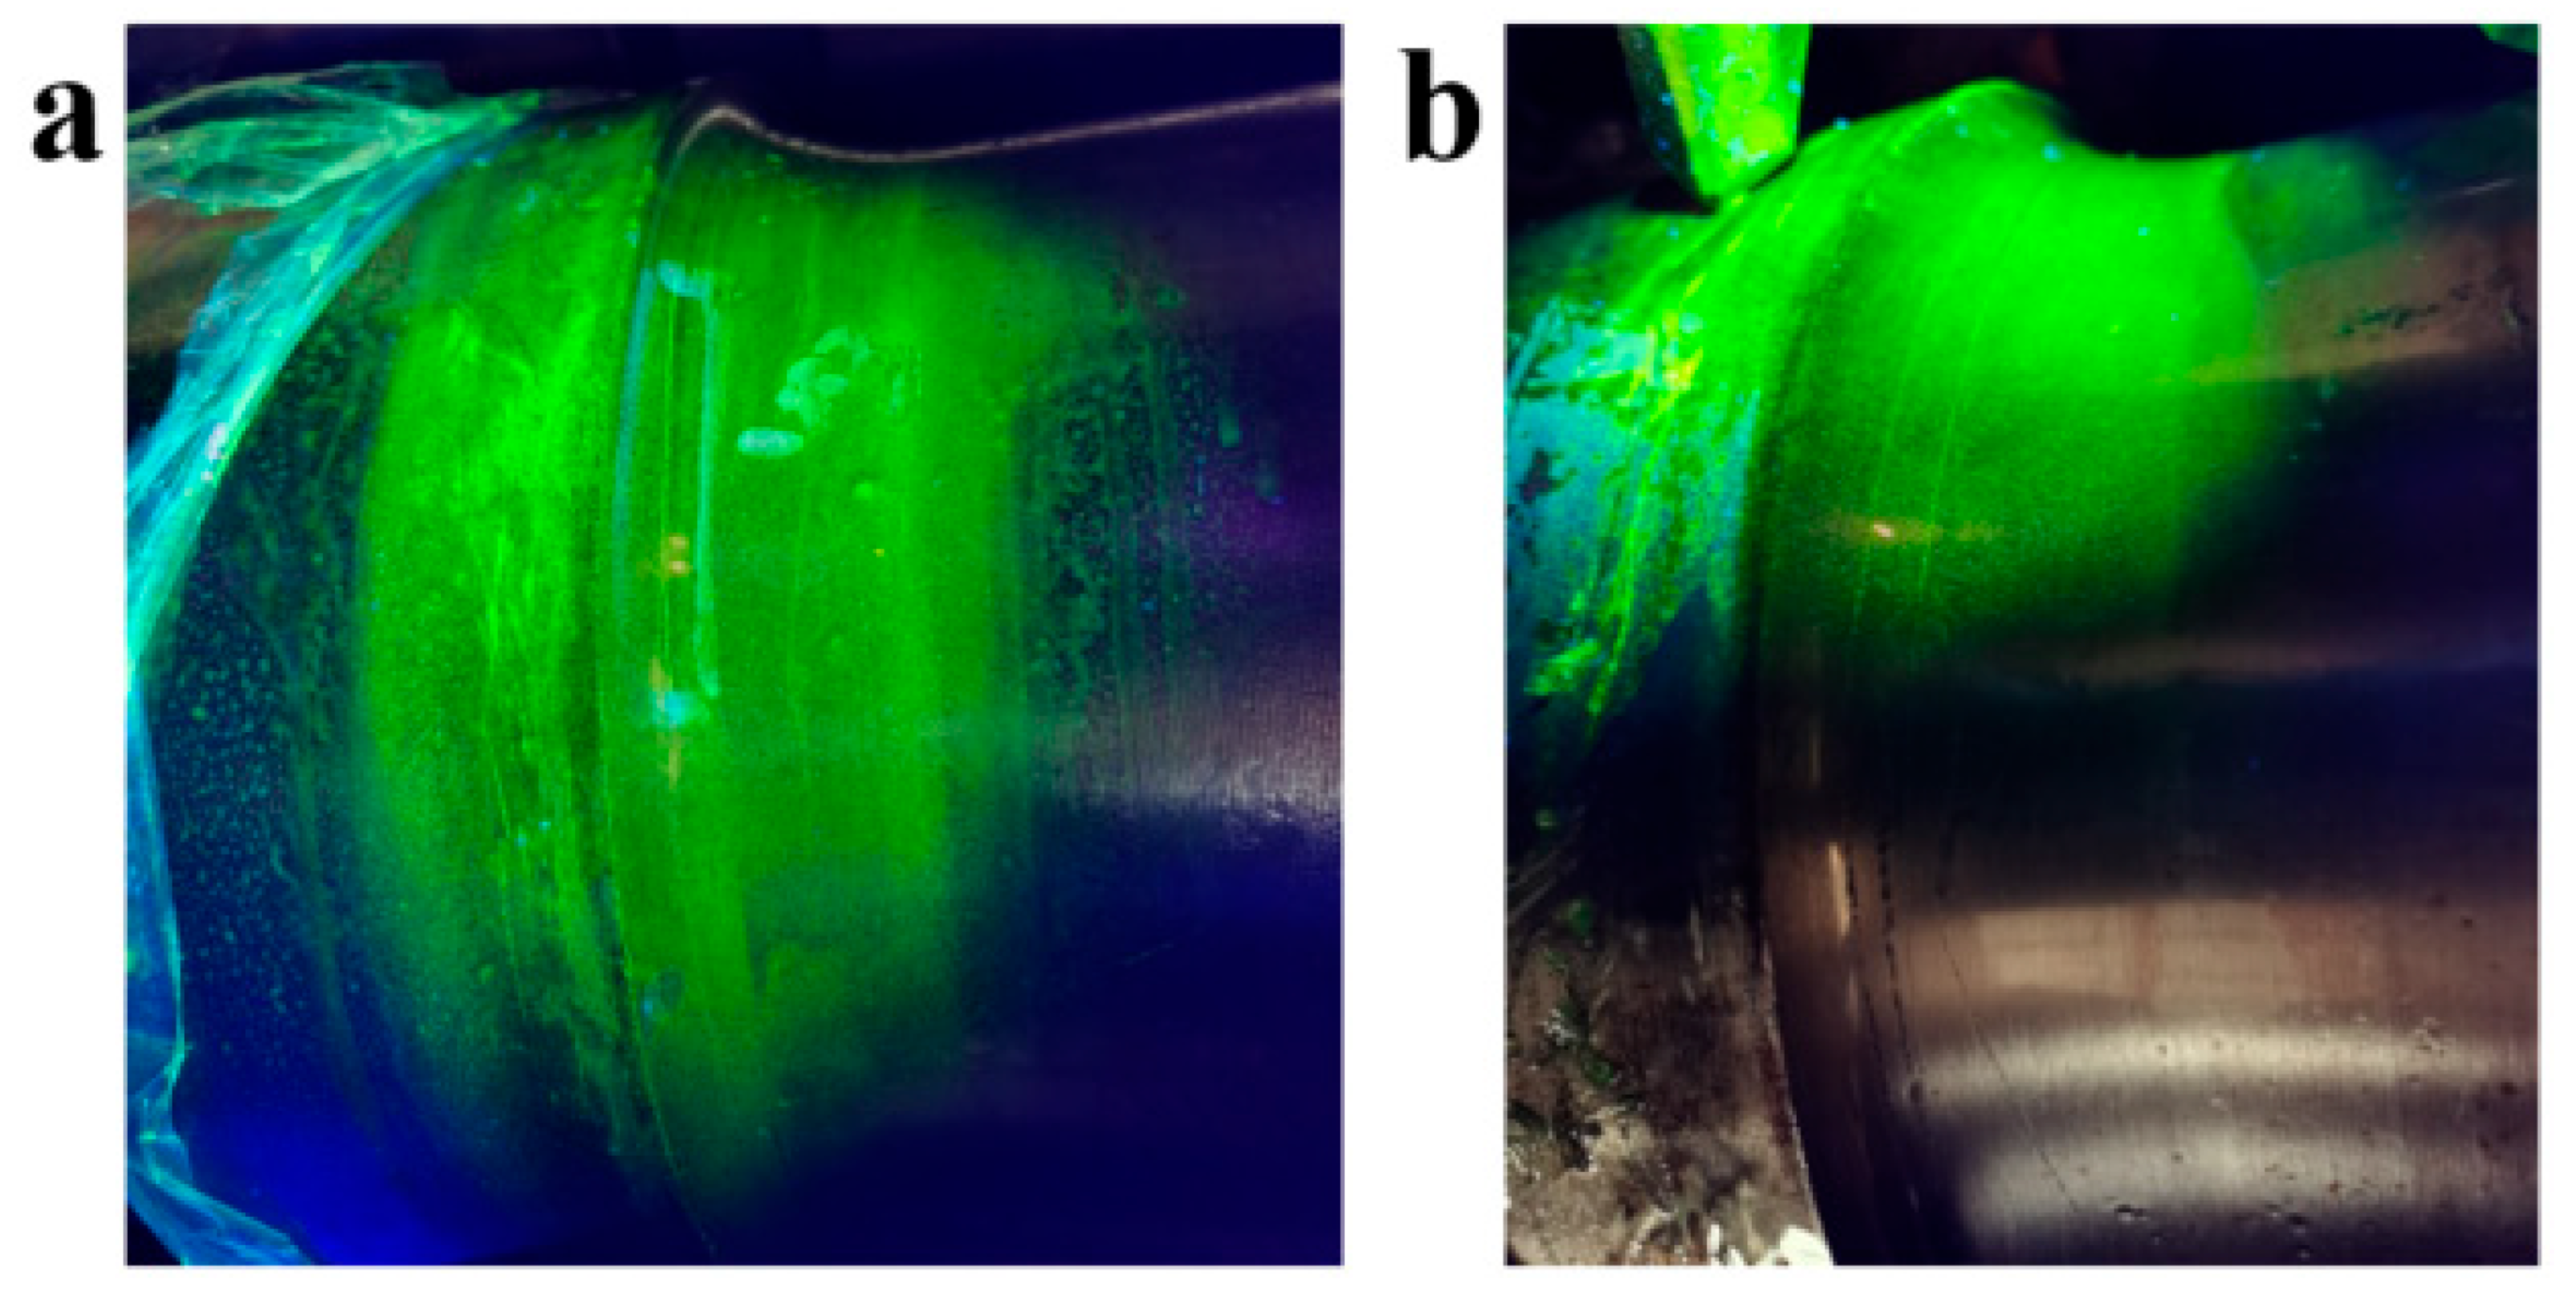
Figure 8.
Magnetic particle detection results (a) showing magnetic marks distributed along the circular direction of axle 2#: (b,c) local enlarged views.
Figure 8.
Magnetic particle detection results (a) showing magnetic marks distributed along the circular direction of axle 2#: (b,c) local enlarged views.
Figure 9.
Magnetic particle detection results: (a) showing magnetic marks distributed along the circular direction of axle 3#, which are similar to axle 2#. (b) local enlarged view.
Figure 9.
Magnetic particle detection results: (a) showing magnetic marks distributed along the circular direction of axle 3#, which are similar to axle 2#. (b) local enlarged view.
Figure 10.
The appearance of a manually broken part at the crack initiation site of axle 2#.
Figure 10.
The appearance of a manually broken part at the crack initiation site of axle 2#.
Figure 11.
(a) Overall and (b,c) enlarged views of fracture sources A and B of axle 2#.
Figure 11.
(a) Overall and (b,c) enlarged views of fracture sources A and B of axle 2#.
Figure 12.
SEM morphologies of the arc transition region in axle 2# (side view): (a,b) showing microscopic morphology of the machining marks. (c,d) enlarged views.
Figure 12.
SEM morphologies of the arc transition region in axle 2# (side view): (a,b) showing microscopic morphology of the machining marks. (c,d) enlarged views.
Figure 13.
Three-dimensional morphology of the side view of region B in axle 2#.
Figure 13.
Three-dimensional morphology of the side view of region B in axle 2#.
Figure 14.
SEM morphologies of the region at the crack initiation site of axle 2#: (a) overall view (b) enlarged view of extrusion scratch.
Figure 14.
SEM morphologies of the region at the crack initiation site of axle 2#: (a) overall view (b) enlarged view of extrusion scratch.
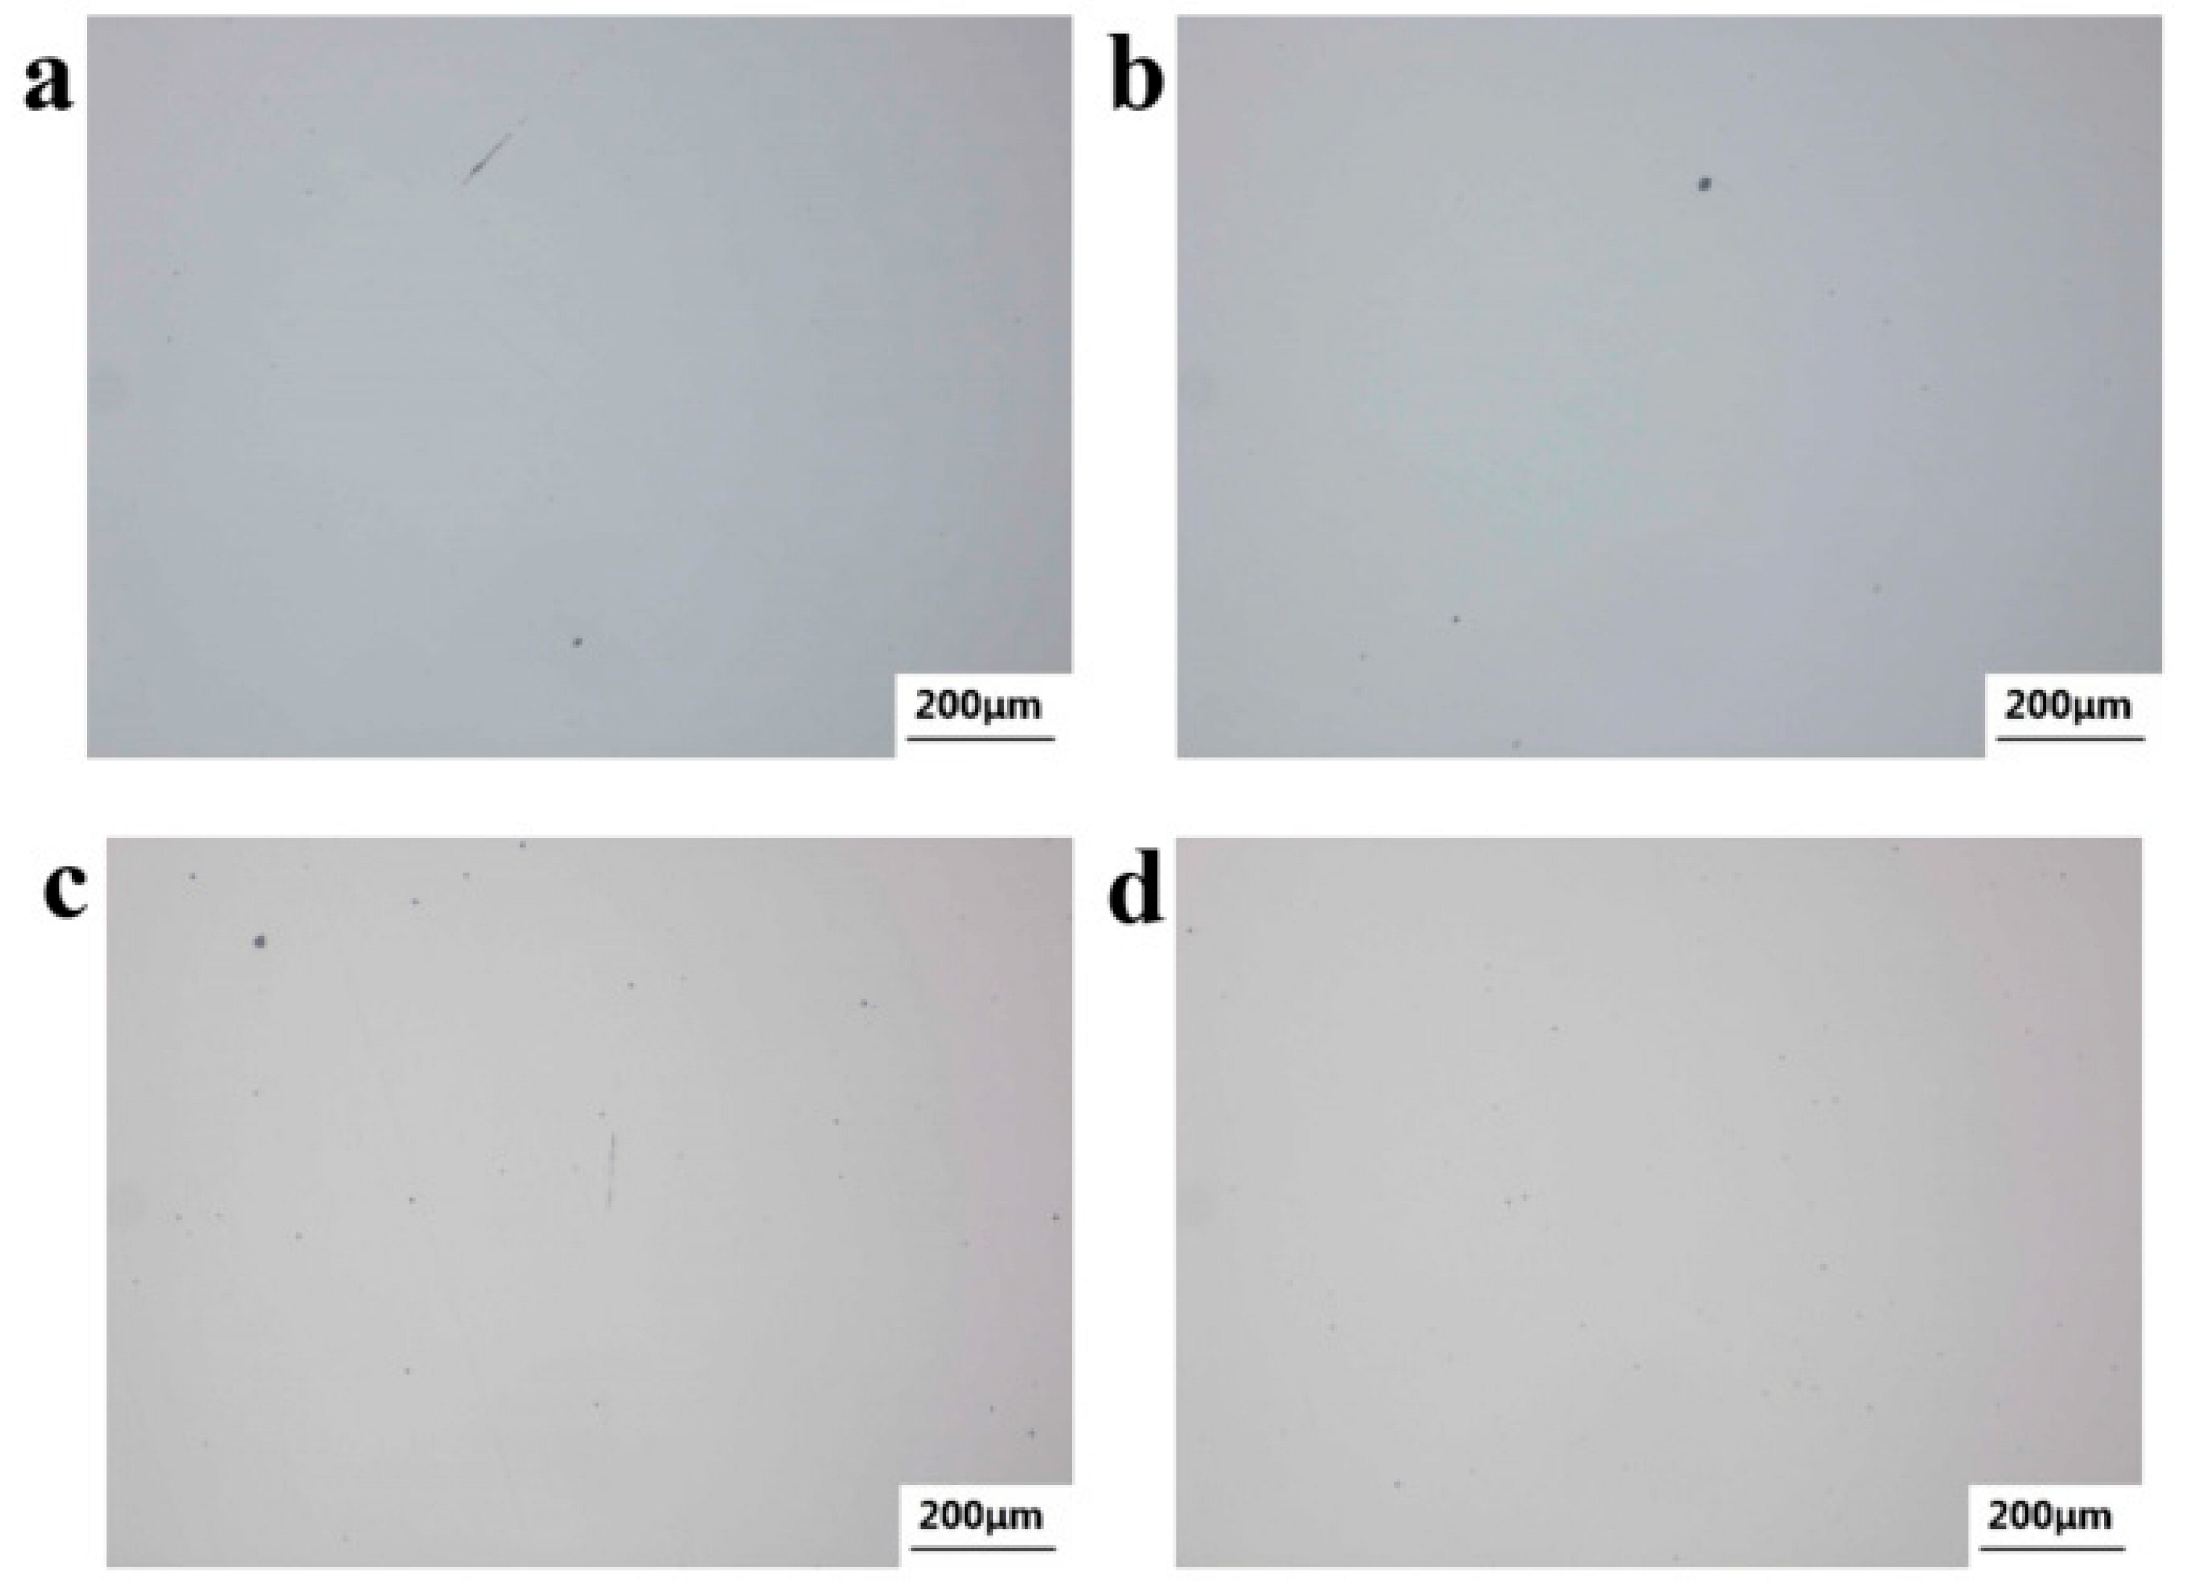
Figure 15.
Nonmetallic inclusions distribution: (a,b) axle 1# and (c,d) axle 2#.
Figure 15.
Nonmetallic inclusions distribution: (a,b) axle 1# and (c,d) axle 2#.
Figure 16.
Micro-morphology and metallographic structure of the cross-section of axle 1#’s fracture source: (a,b) uneroded morphology and (c–f) metallographic structure.
Figure 16.
Micro-morphology and metallographic structure of the cross-section of axle 1#’s fracture source: (a,b) uneroded morphology and (c–f) metallographic structure.
Figure 17.
Morphology of the cross-section of axle 2#.
Figure 17.
Morphology of the cross-section of axle 2#.
Figure 18.
Microstructure of the substrate at 1/2R: (a,b) axle 1# and (c,d) axle 2#.
Figure 18.
Microstructure of the substrate at 1/2R: (a,b) axle 1# and (c,d) axle 2#.
Figure 19.
Macro-erosion morphology of the cross-section of axle 2#.
Figure 19.
Macro-erosion morphology of the cross-section of axle 2#.
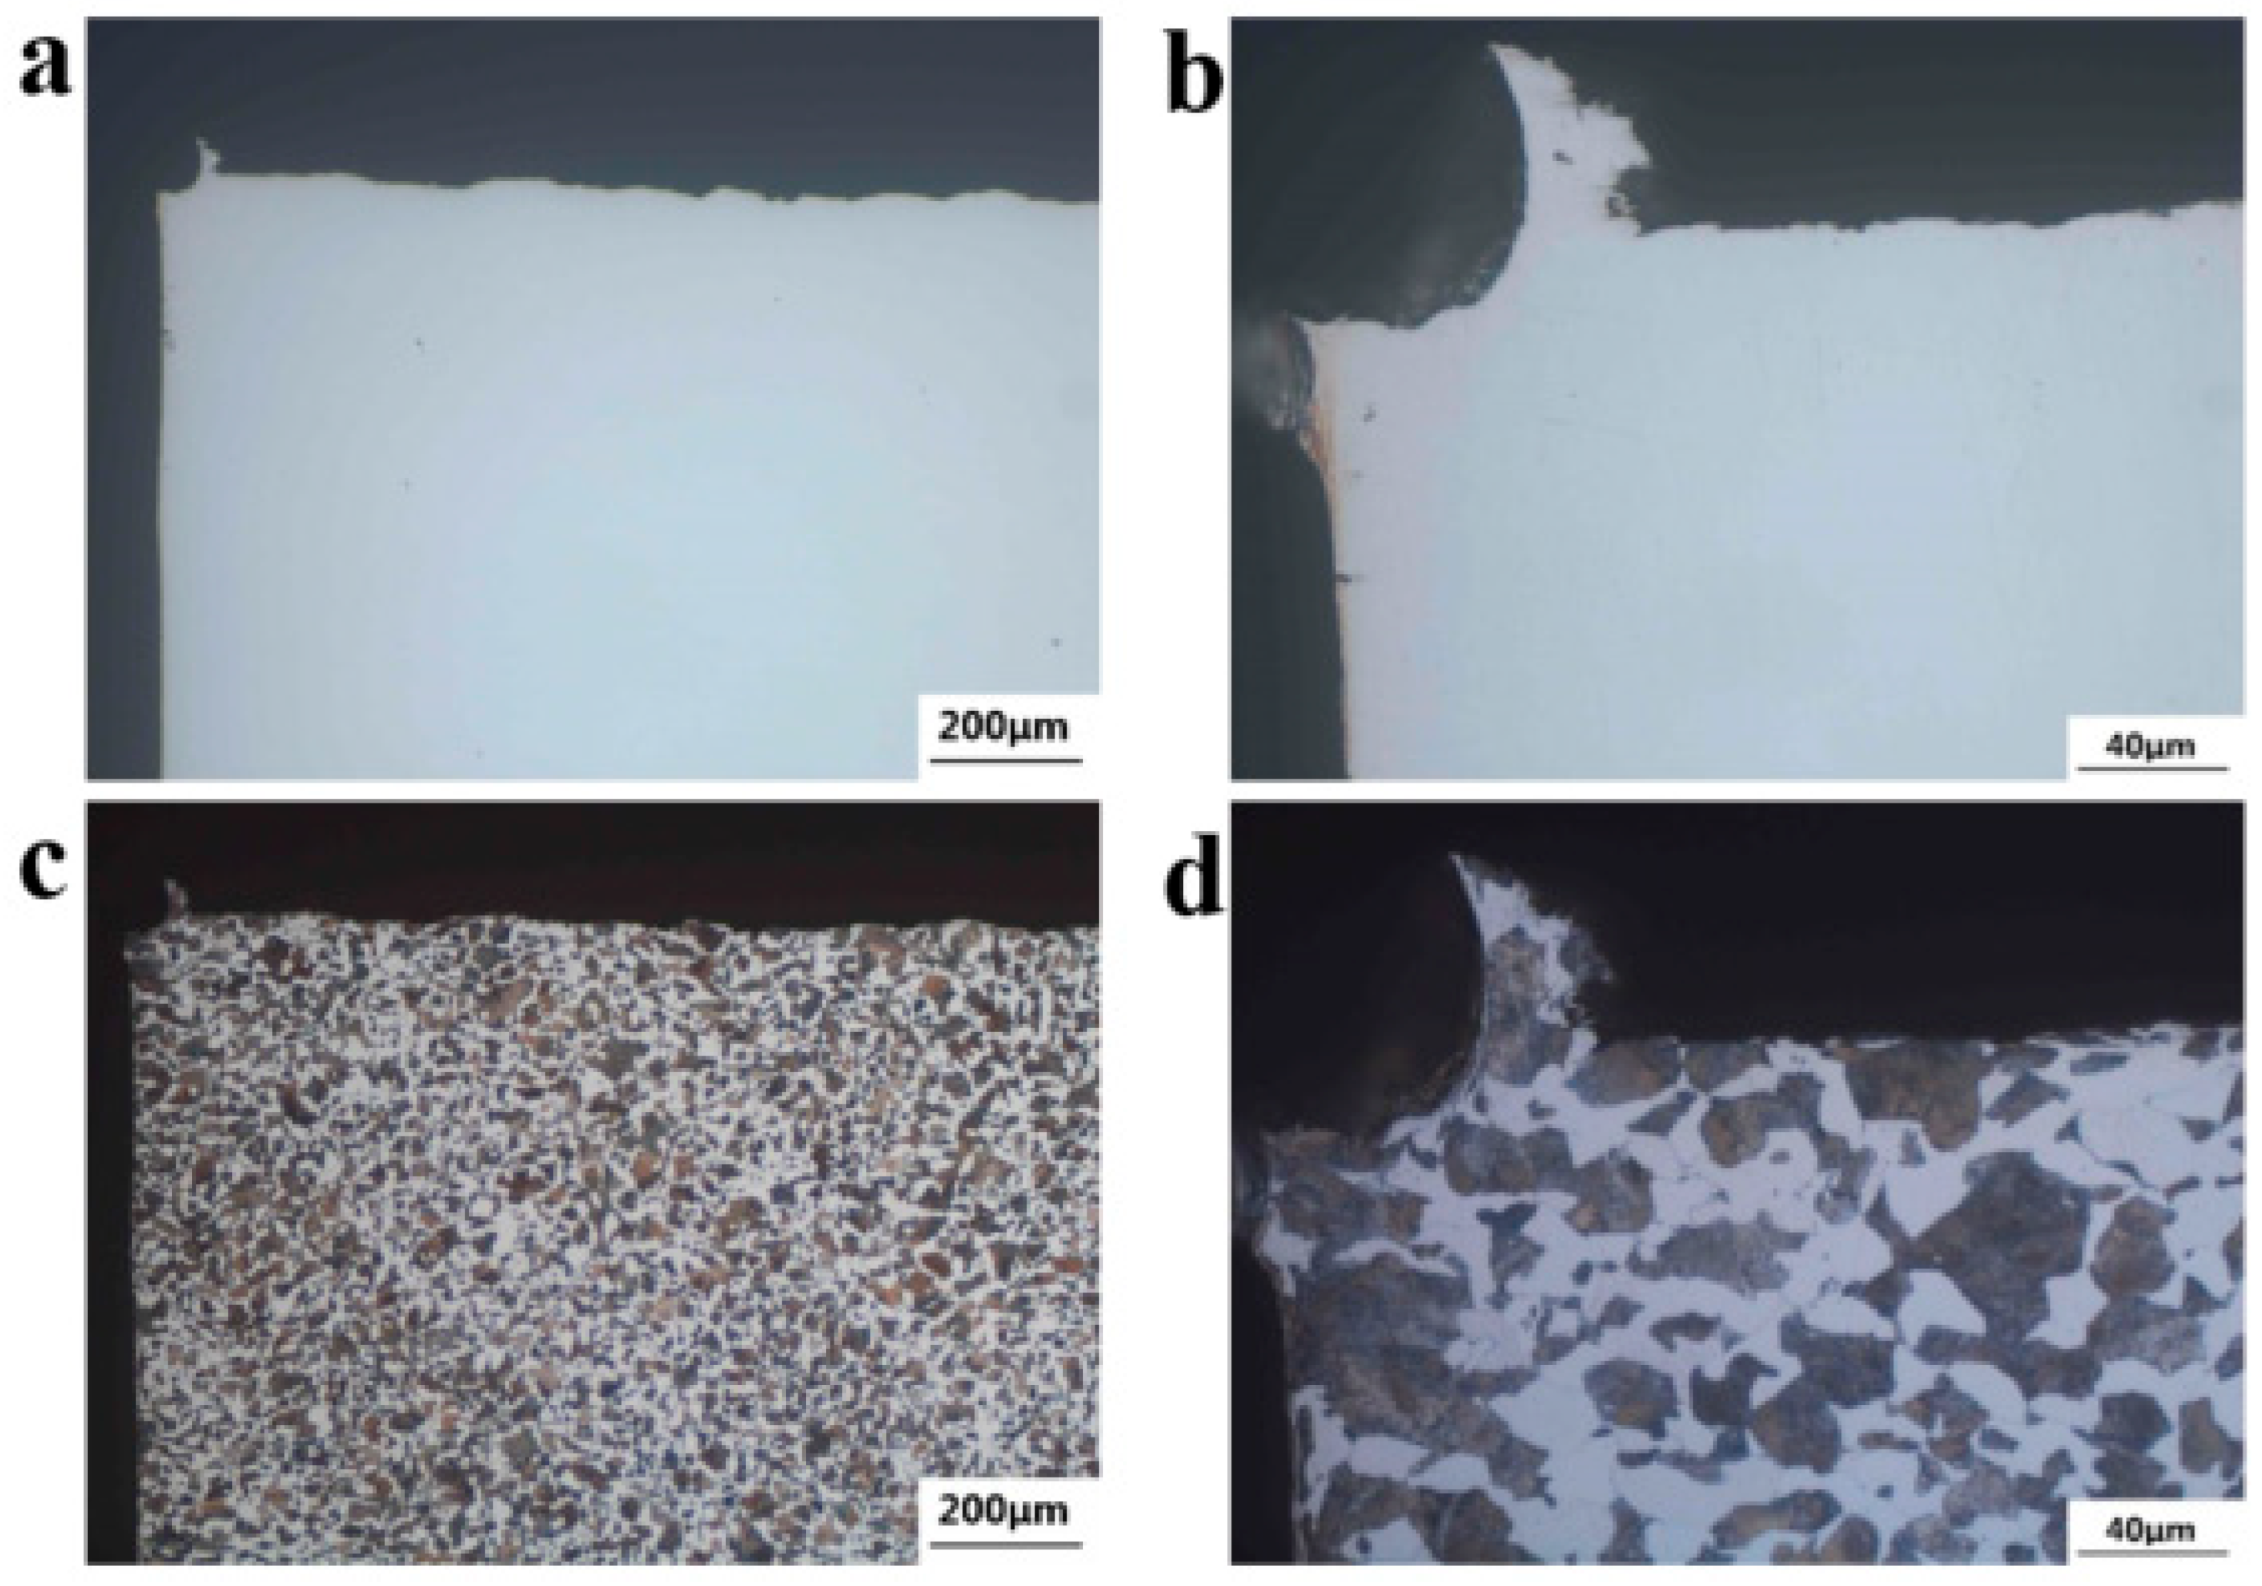
Figure 20.
Micro-morphology of the cross-section of axle 2#’s transition zone: (a–d) uneroded morphology (there are small V-shaped notches at the section, as marked by arrows in (c,d)); (e,f) metallographic structure.
Figure 20.
Micro-morphology of the cross-section of axle 2#’s transition zone: (a–d) uneroded morphology (there are small V-shaped notches at the section, as marked by arrows in (c,d)); (e,f) metallographic structure.
Figure 21.
Micro-morphology near crack source section of axle 2#: (a,b) uneroded morphology and (c,d) metallographic structure.
Figure 21.
Micro-morphology near crack source section of axle 2#: (a,b) uneroded morphology and (c,d) metallographic structure.
Figure 22.
Diagram of sampling locations of the tensile and impact specimens.
Figure 22.
Diagram of sampling locations of the tensile and impact specimens.
Figure 23.
(a) Sampling locations and (b) smooth and (c) notched fatigue specimens.
Figure 23.
(a) Sampling locations and (b) smooth and (c) notched fatigue specimens.
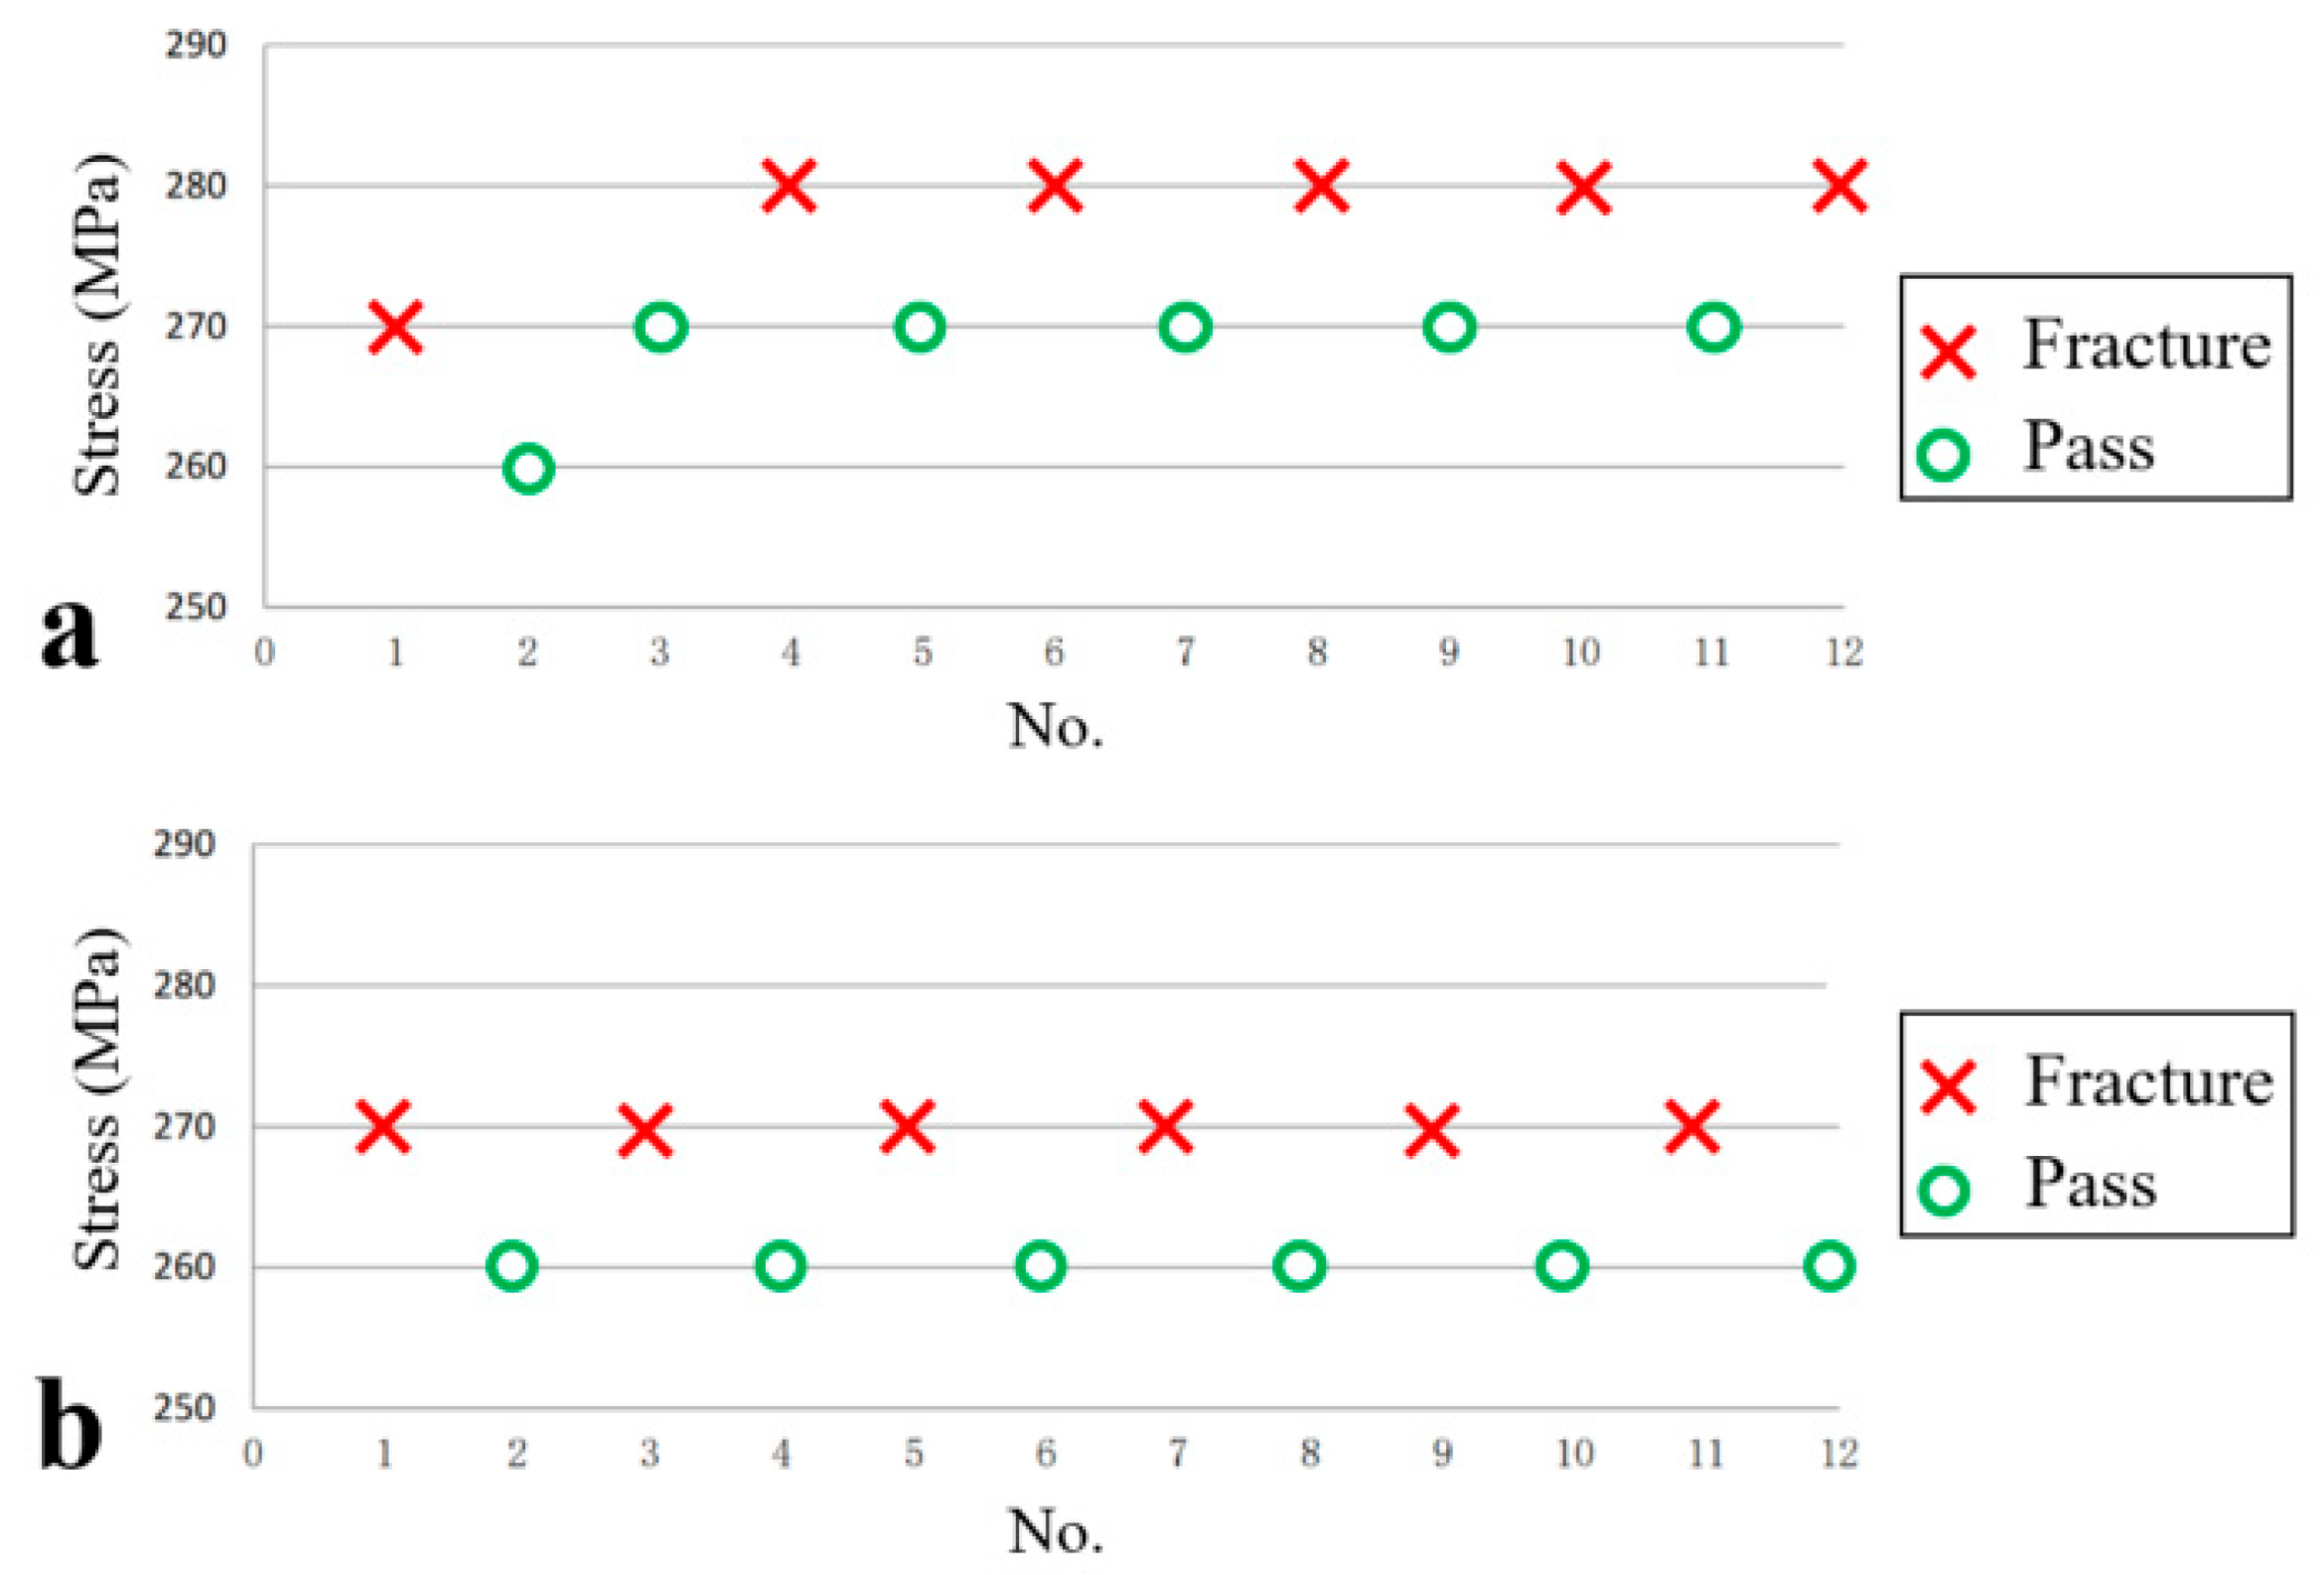
Figure 24.
Fatigue rise and fall diagram tested at room temperature: (a) smooth sample and (b) notched sample.
Figure 24.
Fatigue rise and fall diagram tested at room temperature: (a) smooth sample and (b) notched sample.
Figure 25.
Three-dimensional model and mesh details of axle–wheel (a) geometry of the axle–wheel assembly model and (b) finite element mesh details.
Figure 25.
Three-dimensional model and mesh details of axle–wheel (a) geometry of the axle–wheel assembly model and (b) finite element mesh details.
Figure 26.
Boundary conditions of the finite element model: (a) fixed constraint at test bench flange; (b) applied actuator load and gravitational field to simulate dynamic wheel-seat bending.
Figure 26.
Boundary conditions of the finite element model: (a) fixed constraint at test bench flange; (b) applied actuator load and gravitational field to simulate dynamic wheel-seat bending.
Figure 27.
Contour plots of equivalent stress under different interference conditions: (a) no interference, (b) 0.353 mm interference, and (c) 0.417 mm interference.
Figure 27.
Contour plots of equivalent stress under different interference conditions: (a) no interference, (b) 0.353 mm interference, and (c) 0.417 mm interference.
Figure 28.
Relationship between the maximum equivalent stress and interference at the arc of the axle and wheel seat.
Figure 28.
Relationship between the maximum equivalent stress and interference at the arc of the axle and wheel seat.
Figure 29.
Contour plots of the local stress distribution at the junction between the straight section of the axle and arc of the wheel seat under different interference conditions: (a) no interference, (b) 0.353 mm interference, and (c) 0.417 mm interference.
Figure 29.
Contour plots of the local stress distribution at the junction between the straight section of the axle and arc of the wheel seat under different interference conditions: (a) no interference, (b) 0.353 mm interference, and (c) 0.417 mm interference.
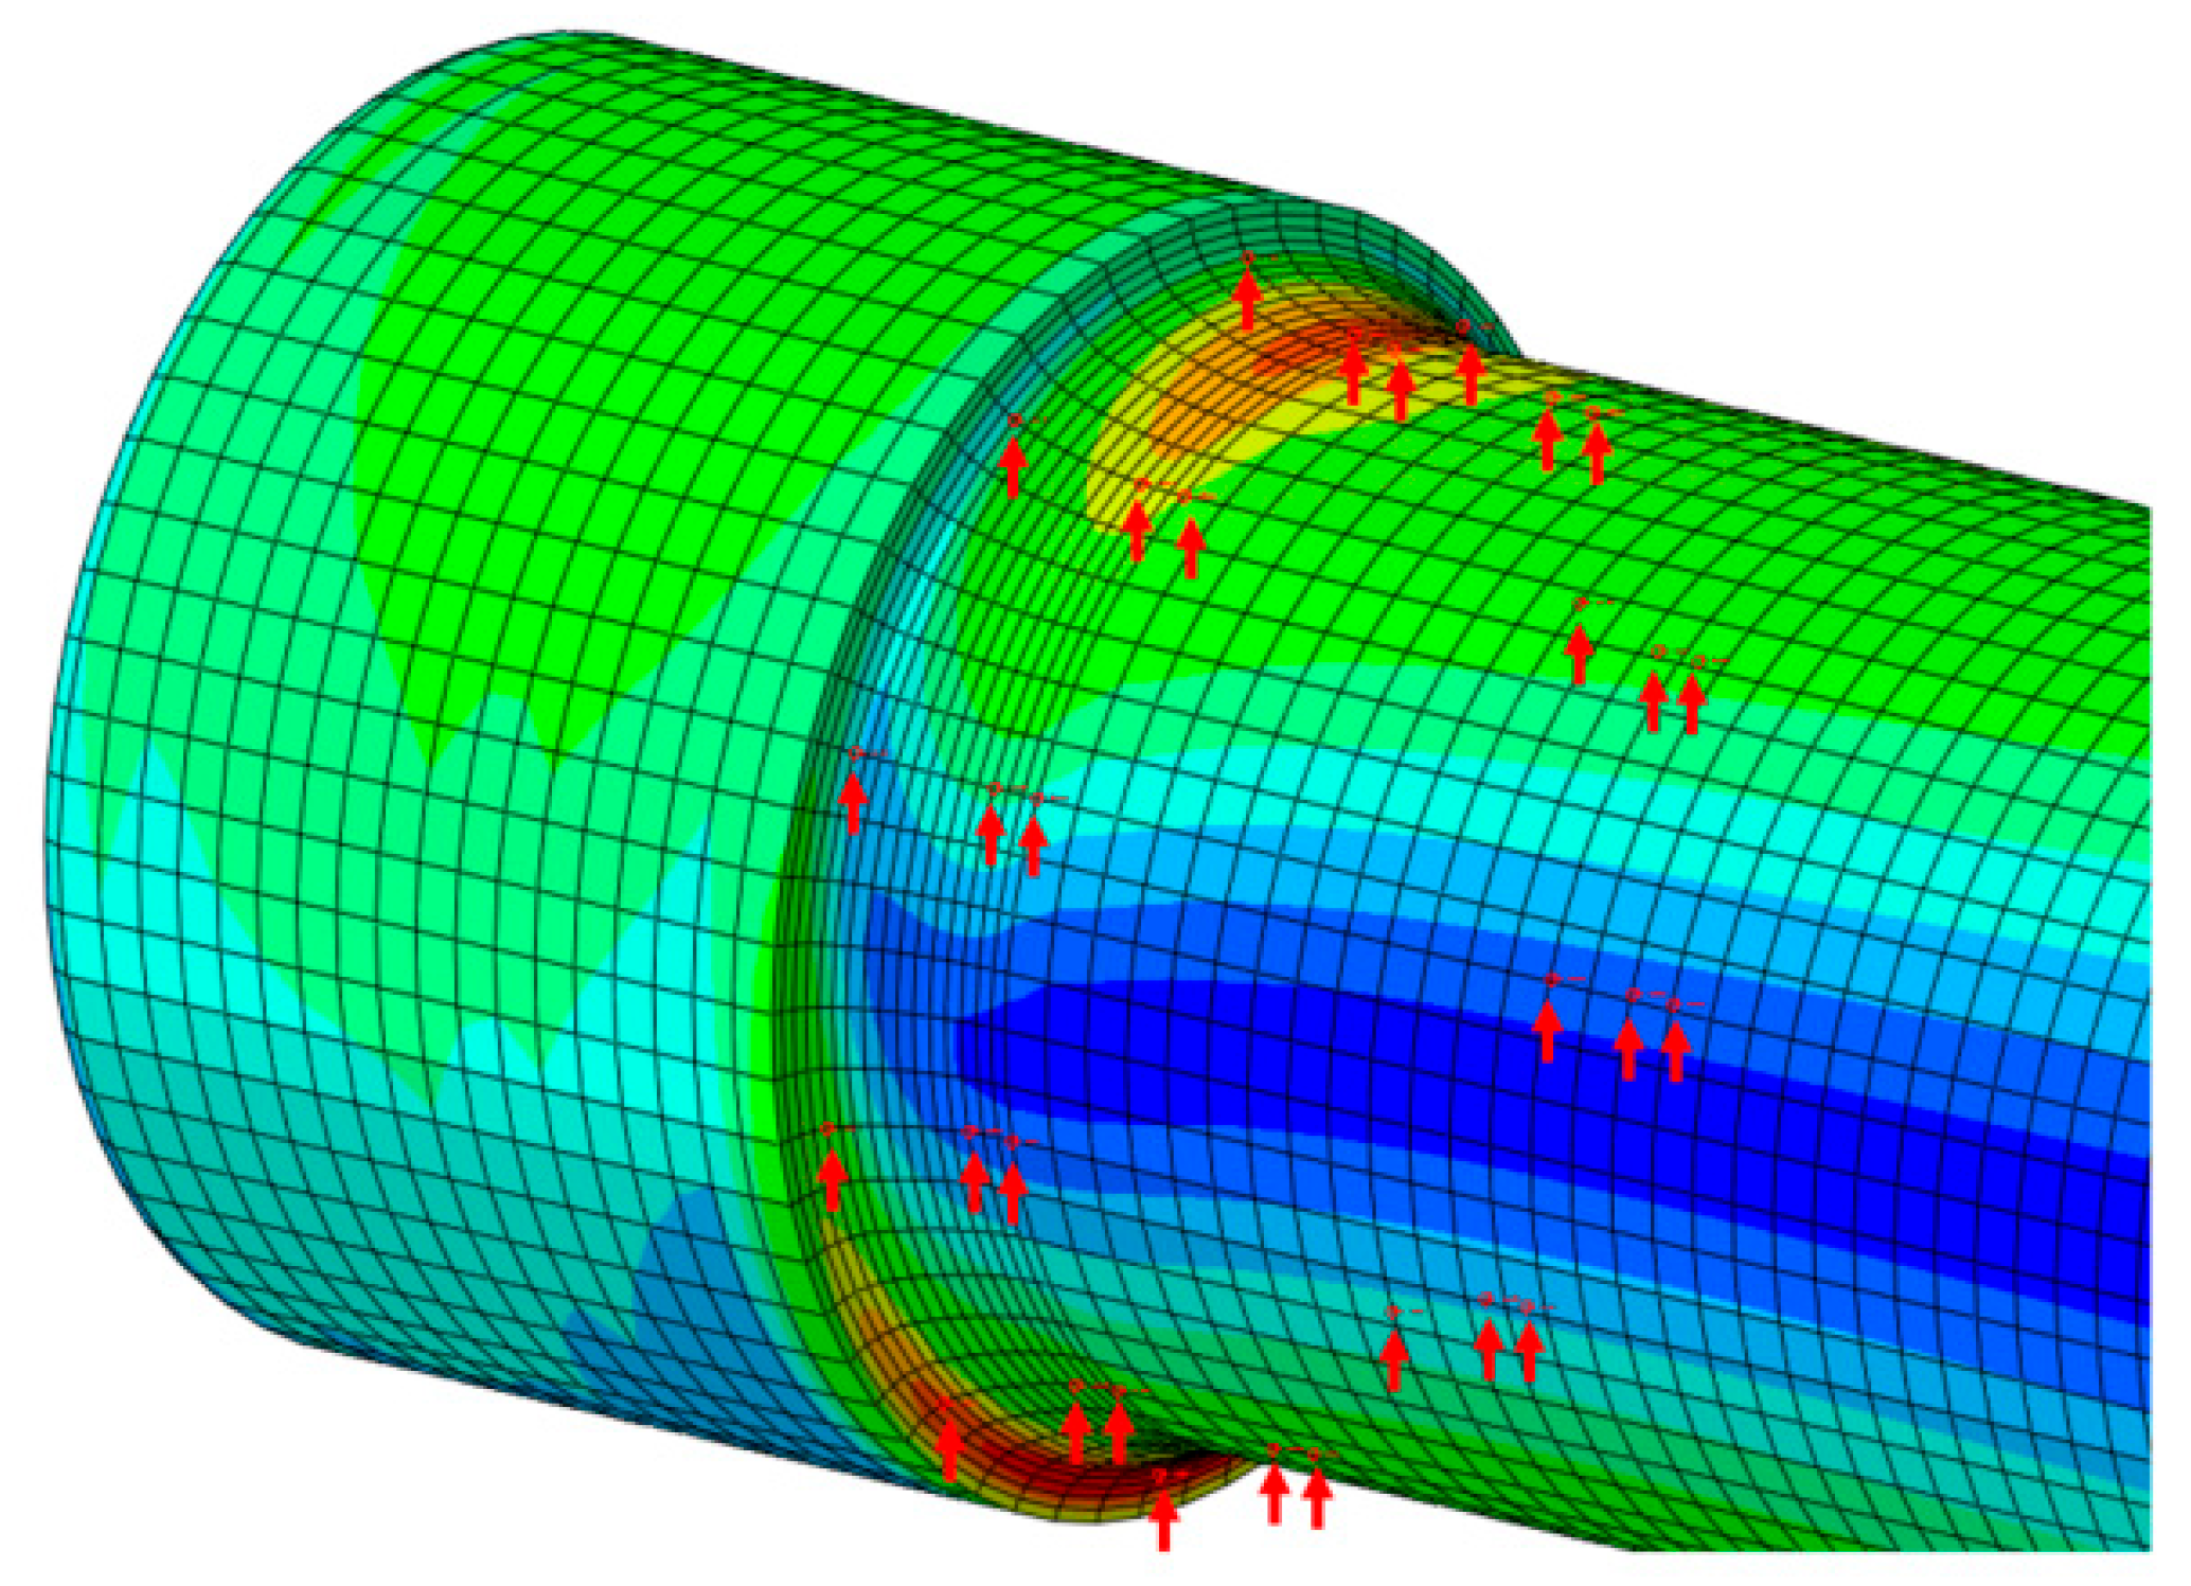
Figure 30.
Diagram of fatigue strength evaluation nodes (marked with red arrows).
Figure 30.
Diagram of fatigue strength evaluation nodes (marked with red arrows).
Figure 31.
Fatigue evaluation diagram based on the Goodman diagram of each axle node.
Figure 31.
Fatigue evaluation diagram based on the Goodman diagram of each axle node.
Table 1.
Chemical composition of axles 1# and 2# (wt%).
Table 1.
Chemical composition of axles 1# and 2# (wt%).
| Element | C | Si | Mn | P | S | Cr | Ni | Mo | Cu | V | Al |
|---|
| 1#-Axle | 0.38 | 0.31 | 1.00 | 0.016 | 0.002 | 0.11 | <0.01 | <0.01 | <0.01 | <0.01 | 0.03 |
| 2#-Axle | 0.33 | 0.30 | 0.97 | 0.012 | 0.002 | 0.09 | <0.01 | 0.01 | 0.01 | <0.01 | 0.03 |
| Standard value | ≤0.37 | ≤0.46 | ≤1.12 | ≤0.040 | ≤0.040 | ≤0.30 | ≤0.30 | ≤0.05 | ≤0.30 | ≤0.05 | - |
Table 2.
Low-power rating results of axle 2#.
Table 2.
Low-power rating results of axle 2#.
| No. | Center Loose | Generally Loose | Ingot Segregation | Spot Segregation |
|---|
| Axle 2# | 0.5 | 0.5 | Not observed | Not observed |
Table 3.
Results of tensile properties of axles 1# and 2#.
Table 3.
Results of tensile properties of axles 1# and 2#.
| Specimen No. | Re (MPa) | Rm (MPa) | A (%) |
|---|
| 1#-surface-1 | 355 | 642 | 22.0 |
| 1#-surface-2 | 371 | 635 | 28.5 |
| 1#-surface-3 | 361 | 631 | 28.0 |
| 1#-1/2R-1 | 366 | 646 | 27.5 |
| 1#-1/2R-2 | 377 | 647 | 26.5 |
| 1#-1/2R-3 | 370 | 639 | 26.5 |
| 1#-middle-1 | 362 | 629 | 26.5 |
| 1#-middle-2 | 346 | 601 | 22.0 |
| 1#-middle-3 | 361 | 617 | 29.0 |
| 2#-surface-1 | 366 | 607 | 24.0 |
| 2#-surface-2 | 373 | 611 | 26.5 |
| 2#-surface-3 | 359 | 610 | 26.0 |
| 2#-1/2R-1 | 358 | 594 | 29.0 |
| 2#-1/2R-2 | 348 | 585 | 30.0 |
| 2#-1/2R-3 | 357 | 596 | 28.0 |
| 2#-middle-1 | 358 | 577 | 27.5 |
| 2#-middle-2 | 349 | 573 | 29.5 |
| 2#-middle-3 | 361 | 591 | 25.0 |
| Requirements | ≥320 | 550~650 | ≥22 |
Table 4.
Results of impact properties of axles 1# and 2#.
Table 4.
Results of impact properties of axles 1# and 2#.
| Specimen No. | Direction | Temperature (°C) | KV2 (J) |
|---|
| No. 1 | No. 2 | No. 3 | Average Value | Requirements |
|---|
| 1#-surface | Transverse | Room temperature | 81 | 71 | 80 | 77.3 | ≥25 |
| 1#-1/2R | 70 | 67 | 64 | 67.0 |
| 1#-middle | 68 | 72 | 73 | 71.0 |
| 1#-surface | Transverse | −20 | 22 | 13 | 29 | 21.3 | ≥10 |
| 1#-1/2R | 12 | 17 | 9.6 | 12.9 |
| 1#-middle | 21 | 21 | 23 | 21.7 |
| 1#-surface | Longitudinal | 24 | 27 | 26 | 25.7 | ≥17 |
| 1#-1/2R | 25 | 21 | 23 | 23.0 |
| 1#-middle | 12 | 11 | 26 | 16.3 |
| 1#-surface | Transverse | −40 | 14 | 10 | 11 | 11.7 | - |
| 1#-1/2R | 11 | 12 | 9.2 | 10.7 |
| 1#-middle | 14 | 8.4 | 10 | 10.8 |
| 1#-surface | Longitudinal | 14 | 15 | 23 | 17.3 |
| 1#-1/2R | 10 | 9.8 | 11 | 10.3 |
| 1#-middle | 16 | 11 | 16 | 14.3 |
| 2#-surface | Transverse | Room temperature | 75 | 82 | 70 | 75.7 | ≥25 |
| 2#-1/2R | 85 | 85 | 88 | 86.0 |
| 2#-middle | 82 | 92 | 90 | 88.0 |
| 2#-surface | Transverse | −20 | 20 | 21 | 18 | 19.7 | ≥10 |
| 2#-1/2R | 20 | 22 | 12 | 18.0 |
| 2#-middle | 29 | 18 | 15 | 20.7 |
| 2#-surface | Longitudinal | 26 | 15 | 22 | 21.0 | ≥17 |
| 2#-1/2R | 16 | 15 | 23 | 18.0 |
| 2#-middle | 21 | 11 | 14 | 15.3 |
| 2#-surface | Transverse | −40 | 10 | 16 | 8.2 | 11.4 | - |
| 2#-1/2R | 9.0 | 11 | 9.9 | 10.0 |
| 2#-middle | 11 | 11 | 12 | 11.3 |
| 2#-surface | Longitudinal | 17 | 7.7 | 15 | 13.2 |
| 2#-1/2R | 12 | 15 | 11 | 12.7 |
| 2#-middle | 6.7 | 9.9 | 9.2 | 8.6 |
Table 5.
Testing results of residual stress.
Table 5.
Testing results of residual stress.
| Test Zones | Direction | Test Values (MPa) |
|---|
| 1 | 2 | 3 | 4 |
|---|
| Arc transition region | Circumferential | 94 | 99 | 72 | 82 |
| Axial | 89 | 92 | 71 | 78 |
Table 6.
Material parameters of EA1N steel used in modeling [
1,
2,
18].
Table 6.
Material parameters of EA1N steel used in modeling [
1,
2,
18].
| Parameters | Values |
|---|
| Modulus of elasticity (GPa) | 210 |
| Poisson’s ratio | 0.3 |
| Density (kg/m3) | 7800 |
| Tensile strength (MPa) | 550–650 |
| Yield strength (MPa) | ≥320 |
| Fatigue strength (MPa) | ≥200 |
Table 7.
Stress distribution in each node of axle.
Table 7.
Stress distribution in each node of axle.
| Nodes | Average Stress (MPa) | Stress Amplitude (MPa) | Principal Stress (MPa) |
|---|
| Maximum | Minimum |
|---|
| 40 | 27.68 | 211.95 | 239.63 | −184.27 |
| 73 | 27.40 | 212.24 | 239.65 | −184.84 |
| 1027 | 27.82 | 201.77 | 229.59 | −173.95 |
| 1033 | 28.34 | 171.76 | 200.09 | −143.42 |
| 1188 | −115.37 | 213.16 | 97.79 | −328.53 |
| 1196 | 28.21 | 235.32 | 263.52 | −207.11 |
| 1417 | 28.40 | 171.82 | 200.21 | −143.42 |
| 1423 | 27.75 | 201.86 | 229.60 | −174.11 |
| 2014 | 28.4 | 171.74 | 200.17 | −143.30 |
| 2020 | 27.77 | 201.90 | 229.67 | −174.13 |
| 2476 | 28.31 | 235.24 | 263.55 | −206.93 |
| 2484 | −117.89 | 215.66 | 97.766 | −333.55 |
| 2594 | 27.87 | 201.72 | 229.59 | −173.85 |
| 2600 | 28.379 | 171.78 | 200.16 | −143.41 |
| 11,393 | 28.63 | 223.95 | 252.58 | −195.32 |
| 11,447 | 29.50 | 190.76 | 220.26 | −161.25 |
| 11,510 | −112.27 | 202.18 | 89.91 | −314.44 |
| 11,540 | −102.34 | 168.53 | 66.19 | −270.86 |
| 14,512 | 29.61 | 190.85 | 220.45 | −161.24 |
| 14,566 | 28.47 | 224.14 | 252.61 | −195.67 |
| 14,617 | −102.24 | 168.77 | 66.52 | −271.01 |
| 14,647 | −113.74 | 203.76 | 90.02 | −317.50 |
| 18,198 | −113.77 | 203.91 | 90.14 | −317.68 |
| 18,228 | −101.99 | 168.38 | 66.39 | −270.37 |
| 18,277 | 28.50 | 224.20 | 252.71 | −195.70 |
| 18,331 | 29.6749 | 190.71 | 220.38 | −161.03 |
| 23,043 | −102.12 | 168.42 | 66.30 | −270.54 |
| 23,073 | −112.10 | 201.98 | 89.87 | −314.08 |
| 23,134 | 29.583 | 190.78 | 220.36 | −161.19 |
| 23,188 | 28.71 | 223.87 | 252.58 | −195.16 |


