Article

Evaluation of Printability, Color Difference, Translucency, and Surface Roughness over Time in a 3D-Printed TiO2-Containing Denture Base Resin: A Pilot Study

Department of Adult Restorative Dentistry, College of Dentistry, University of Nebraska Medical Center, Lincoln, NE 68583, USA
*
Author to whom correspondence should be addressed.
Materials 2025, 18(15), 3683; https://doi.org/10.3390/ma18153683
Submission received: 1 June 2025 / Revised: 17 July 2025 / Accepted: 28 July 2025 / Published: 5 August 2025

Abstract

Recent evidence suggests that nano-TiO2 particles improve antimicrobial and physical properties when incorporated into dental prosthetic materials. However, there exists a paucity of information regarding their impact on material properties when the prosthetic materials are 3D-printed over time. The purpose of this study was to evaluate the time-dependent printability and surface property changes occurring in a 3D-printed denture base resin containing nano-titanium dioxide (TiO2) particles. A 0.4 wt% concentration of 30 nm rutile TiO2 nanoparticles was ultrasonically dispersed into a denture base resin. Disks were printed weekly using a Form 2 SLA printer until printing failed. Printability, surface roughness (Ra), color difference (ΔEab), and translucency parameters were measured across timepoints. Surface roughness was assessed via profilometry, while color and translucency were evaluated using a spectrophotometer under standardized conditions. Print failure occurred at week 8, beyond which the resin could no longer reliably produce full specimens. Ra roughness decreased from 3.83 µm to 0.48 µm, which denoted a significant time-dependent decrease (ρ = −0.733, p = 0.016). Color difference with the unmodified control declined from 26.32 to 17.13 ΔEab units (ρ = −0.976, p < 0.001). All printed samples exceeded the clinically acceptable thresholds for both Ra (0.2 µm) and ΔEab (<3.7). Although the printability of the resin–TiO2 mixture was maintained for 7 weeks, mixture homogeneity declined over time. TiO2 additions to a denture polymer produced significant changes in surface roughness and color that were not clinically acceptable. Results from this study illustrate the time dependence required for retaining surface properties in 3D-printed dentures containing nano-TiO2.

1. Introduction

More than 36 million North Americans live without teeth [1], and approximately 90 percent of them rely on dentures to provide esthetics and function on a daily basis. A recent publication suggested that by 2030, over 19% of China’s population will exceed 60 years of age, thereby leading to a substantial economic burden caused by tooth loss [2]. Edentulism has been associated with a wide range of conditions, such as type 2 diabetes, cardiovascular disease, and sleep disordered breathing [3]. The economic burden that underlies denture construction can be minimized through 3D printing, as it is more time efficient and less costly than traditional methods, while achieving similar levels of patient satisfaction [4,5].
Dental prostheses are exposed to a high microbial load, as up to 70% of denture wearers experience fungal overgrowth caused by Candida species [6]. This leads to denture stomatitis [7,8]. Numerous attempts towards developing an antimicrobial denture base material have been reported using traditional fabrication methods [9,10,11,12,13,14,15] as well as 3D printing [16,17,18,19,20,21,22,23,24]. Although results from various studies have shown initial success, the effectiveness of incorporating antimicrobial agents into denture base resins has not been demonstrated conclusively [14]. Various additives have been evaluated for improving mechanical and antimicrobial properties including metal nanoparticles (Ti, Zr, Ag) and quaternary ammonium compounds [17,18,20,21,22,23]. TiO2 nanoparticles were chosen for this study due to their demonstrated biocompatibility and antimicrobial activity at 0.4% concentration [18,25].
Published research has either omitted reporting the mixing method [17,23], or engaged a variety of techniques that include mixing, stirring, ultrasonic dispersion, and a combination of methods [18,20,21,22,24]. The omission of mixing method may indicate that it is a proprietary process.
Considering the variety of mixing options available, it is important to know whether a mixed resin remains printable over time. This is a necessary feature for point-of-care printing by the dental professional. Therefore, the primary aim of this pilot study was to evaluate the time-dependent printability and surface property changes in a 3D-printed denture base resin containing TiO2 nanoparticles. The null hypothesis was that no significant difference in surface roughness or optical properties would occur across print cycles (α = 0.05).

2. Materials and Methods

This in vitro pilot study evaluated the effects of incorporating titanium dioxide (TiO2) nanoparticles on the surface roughness, color difference, and translucency of a 3D-printed denture base resin over time. The aim was to assess the stability of a hybrid resin formulation, stored without additional intervention, thereby mimicking the commercial point-of-care use of printed nanocomposite resins.

2.1. Preparation of TiO2-Modified Denture Base Resin

A 0.4 wt% mixture of 30 nm rutile titanium dioxide (TiO2) nanoparticles (US Research Nanomaterials, Houston, TX, USA) was prepared by dispersing the nanoparticles into a denture base resin (Denture Base Resin OP, Formlabs Inc., Somerville, MA, USA). Agglomerates were broken and particles dispersed using an ultrasonic processor equipped with a S3 sonotrode at amplitude 460 W/cm2 for 10 min (UP200S, Hielscher Ultrasonics GmbH, Teltow, Germany). An ice bath simultaneously cooled the mixture to prevent overheating of the monomer.
The TiO2-modified resin was loaded into a stereolithography (SLA) 3D printer equipped with a heated resin tank and mixing paddle (Form 2, Formlabs Inc., Somerville, MA, USA). A 35 mm diameter × 5 mm thickness disk design was created in Meshmixer (Autodesk Inc., San Rafael, CA, USA) and exported as an STL file for printing. Disks were printed flat on the build tray (0-degree orientation) with a layer height of 0.05 mm without support structures, with four specimens produced per print cycle.
Post-processing followed manufacturer-recommended protocols [26]. Printed specimens were washed in 91% isopropyl alcohol (IPA) for 30 min using a Form Wash unit (Formlabs Inc., Somerville, MA, USA), then air dried and post-cured in a glycerin bath at 60 °C for 60 min using a Form Cure unit at 405 nm wavelength (Formlabs Inc., Somerville, MA, USA).
Disks were printed with the unmodified resin to act as a control (T0) and then at multiple timepoints: immediately after mixing (T1), at day 3 (T2), and weekly thereafter until printing failure occurred (T3–T10). Failure was defined as the printer’s inability to fabricate all disks to full specifications. This occurred at week 8, when only one full disk and one incomplete (≤0.5 mm thickness) specimen were produced. Printed disks were stored dry in an airtight, dark container until testing. Due to incomplete printing at T10, only one disk was available per timepoint for analysis. In total, 11 disks (1 control and 10 experimental samples) were tested.

2.2. Surface Roughness Measurement

Surface roughness was measured using a Mitutoyo Surface Roughness Tester (model SJ-210, Mitutoyo Corp., Kanagawa, Japan). The instrument was placed on a flat, stable surface and connected to a power source. It was mounted to a stage using a custom fixture to prevent movement of both the instrument and the drive unit during testing.
Each disk (n = 11; 10 experimental and 1 control) was secured to the measurement platform using double-sided tape to avoid slippage. Care was taken to ensure the disk surface was level and in direct, parallel contact with the detector.
Measurement parameters followed the ISO 4287:1997 [27] Surface Texture: Profile Method standard with profile R, parameter 3 and Gauss filter. Cutoff lengths were 0.8 mm and 2.5 mm, the evaluation length was set at N = 5, pre/post-scan was ON, measuring speed was 0.5 mm/s, and auto range was turned on. The 2.5 mm cutoff was selected to match the specimen size, and measurements were repeated using the 0.8 mm cutoff to compare values. The measurement was repeated 3 times for each sample to create an average Ra roughness value. Data were recorded and exported to a spreadsheet for analysis.

2.3. Color and Translucency Measurements

Color and translucency were measured using a Konica Minolta CM-16d spectrophotometer (Konica Minolta Sensing, Osaka, Japan). This non-destructive test was performed on 11 specimens (10 experimental and 1 control), each 35 mm in diameter and 5 mm in thickness. Specimens were labeled with unique ID numbers on the side to avoid surface discoloration.
The spectrophotometer was connected to a laptop running SpectraMagic NX2 software (version 1.30.0006). After initializing the software, a dedicated folder was created for data collection. Calibration was performed using a zero-calibration box (CM-A182) (Konica Minolta Sensing, Osaka, Japan) and a white calibration cap, in accordance with manufacturer protocols. All calibrations were performed at room temperature to ensure consistent measurement conditions.
Specimens were positioned over the instrument port using a vertical leveling jig (CM-A304) (Konica Minolta Sensing, Osaka, Japan). Measurement settings included the following: observer angle 10°, illuminants D65 and F11, color space CIE L*a*b*, color difference equation ΔE*ab, automatic and manual averaging, and both SCI (specular component included) and SCE (specular component excluded) modes.
Color measurements as outlined in SO/TR 28642:2016 [28] Guidance on Color Measurement, were performed first, followed by translucency tests using the translucency parameter as defined by Johnston et al. [29]. Reflectance was compared over white and black backgrounds. A fully opaque sample yielded the same reflectance under both conditions, corresponding to 100% opacity, or 0% translucency. Each specimen’s CIE L*a*b* values were recorded. The color difference values from the baseline (control) sample were calculated using the following equation:
Δ E a b =   L 2 *       L 1 * 2   +     a 2 *       a 1 * 2   +     b 2 *       b 1 * 2
where
L*1 is the L* value at T0
L*2 is the L* values at T1–10
a*1 is the a* value at T0
a*2 is the a* values at T1–10
b*1 is the b* value at T0
b*2 is the b* values at T1–10
Translucency parameter was measured as the difference between the CIE L* a* b* values with a white and black background using this formula:
T P =   L w *       L b * 2   +     a w *       a b * 2   +     b w *       b b * 2
where
L*w is the L* value measured on a white background
L*b is the L* measured on a black background
a*w is the a* measured on a white background
a*b is the a* measured on a black background
b*w is the b* measured on a white background
b*b is the b* measured on a black background

2.4. Statistical Analysis

Statistical analysis was completed using statistical software (SPSS v29, IBM, Armonk, NY, USA). Descriptive statistics, including the minimum, maximum, means and standard deviation were calculated. Spearman’s ρ was calculated due to the small sample size and ordinal nature of the time data. A significance level of α = 0.05 was chosen.

3. Results

The addition of TiO2 to the denture base resin led to unacceptable increases in surface roughness, as well as color differences that were well outside of the accepted range of ΔEab < 3.7 [30]. Testing was performed on a surface distant to the print bed. This limited the effects of specimen damage that were produced during removal from the print bed, or from a defect such as “elephant’s foot” (Figure 1). Descriptive statistics are displayed in Table 1.

3.1. Printability of TiO2-Modified Denture Base Resin

The resin printed successfully at timepoints T1–T9, with all specimens achieving the proper dimensions. At T10, 8 weeks after mixing, one disk achieved the proper dimensions and one was approximately 0.5 mm thick. The remaining samples could not be printed.

3.2. Surface Roughness

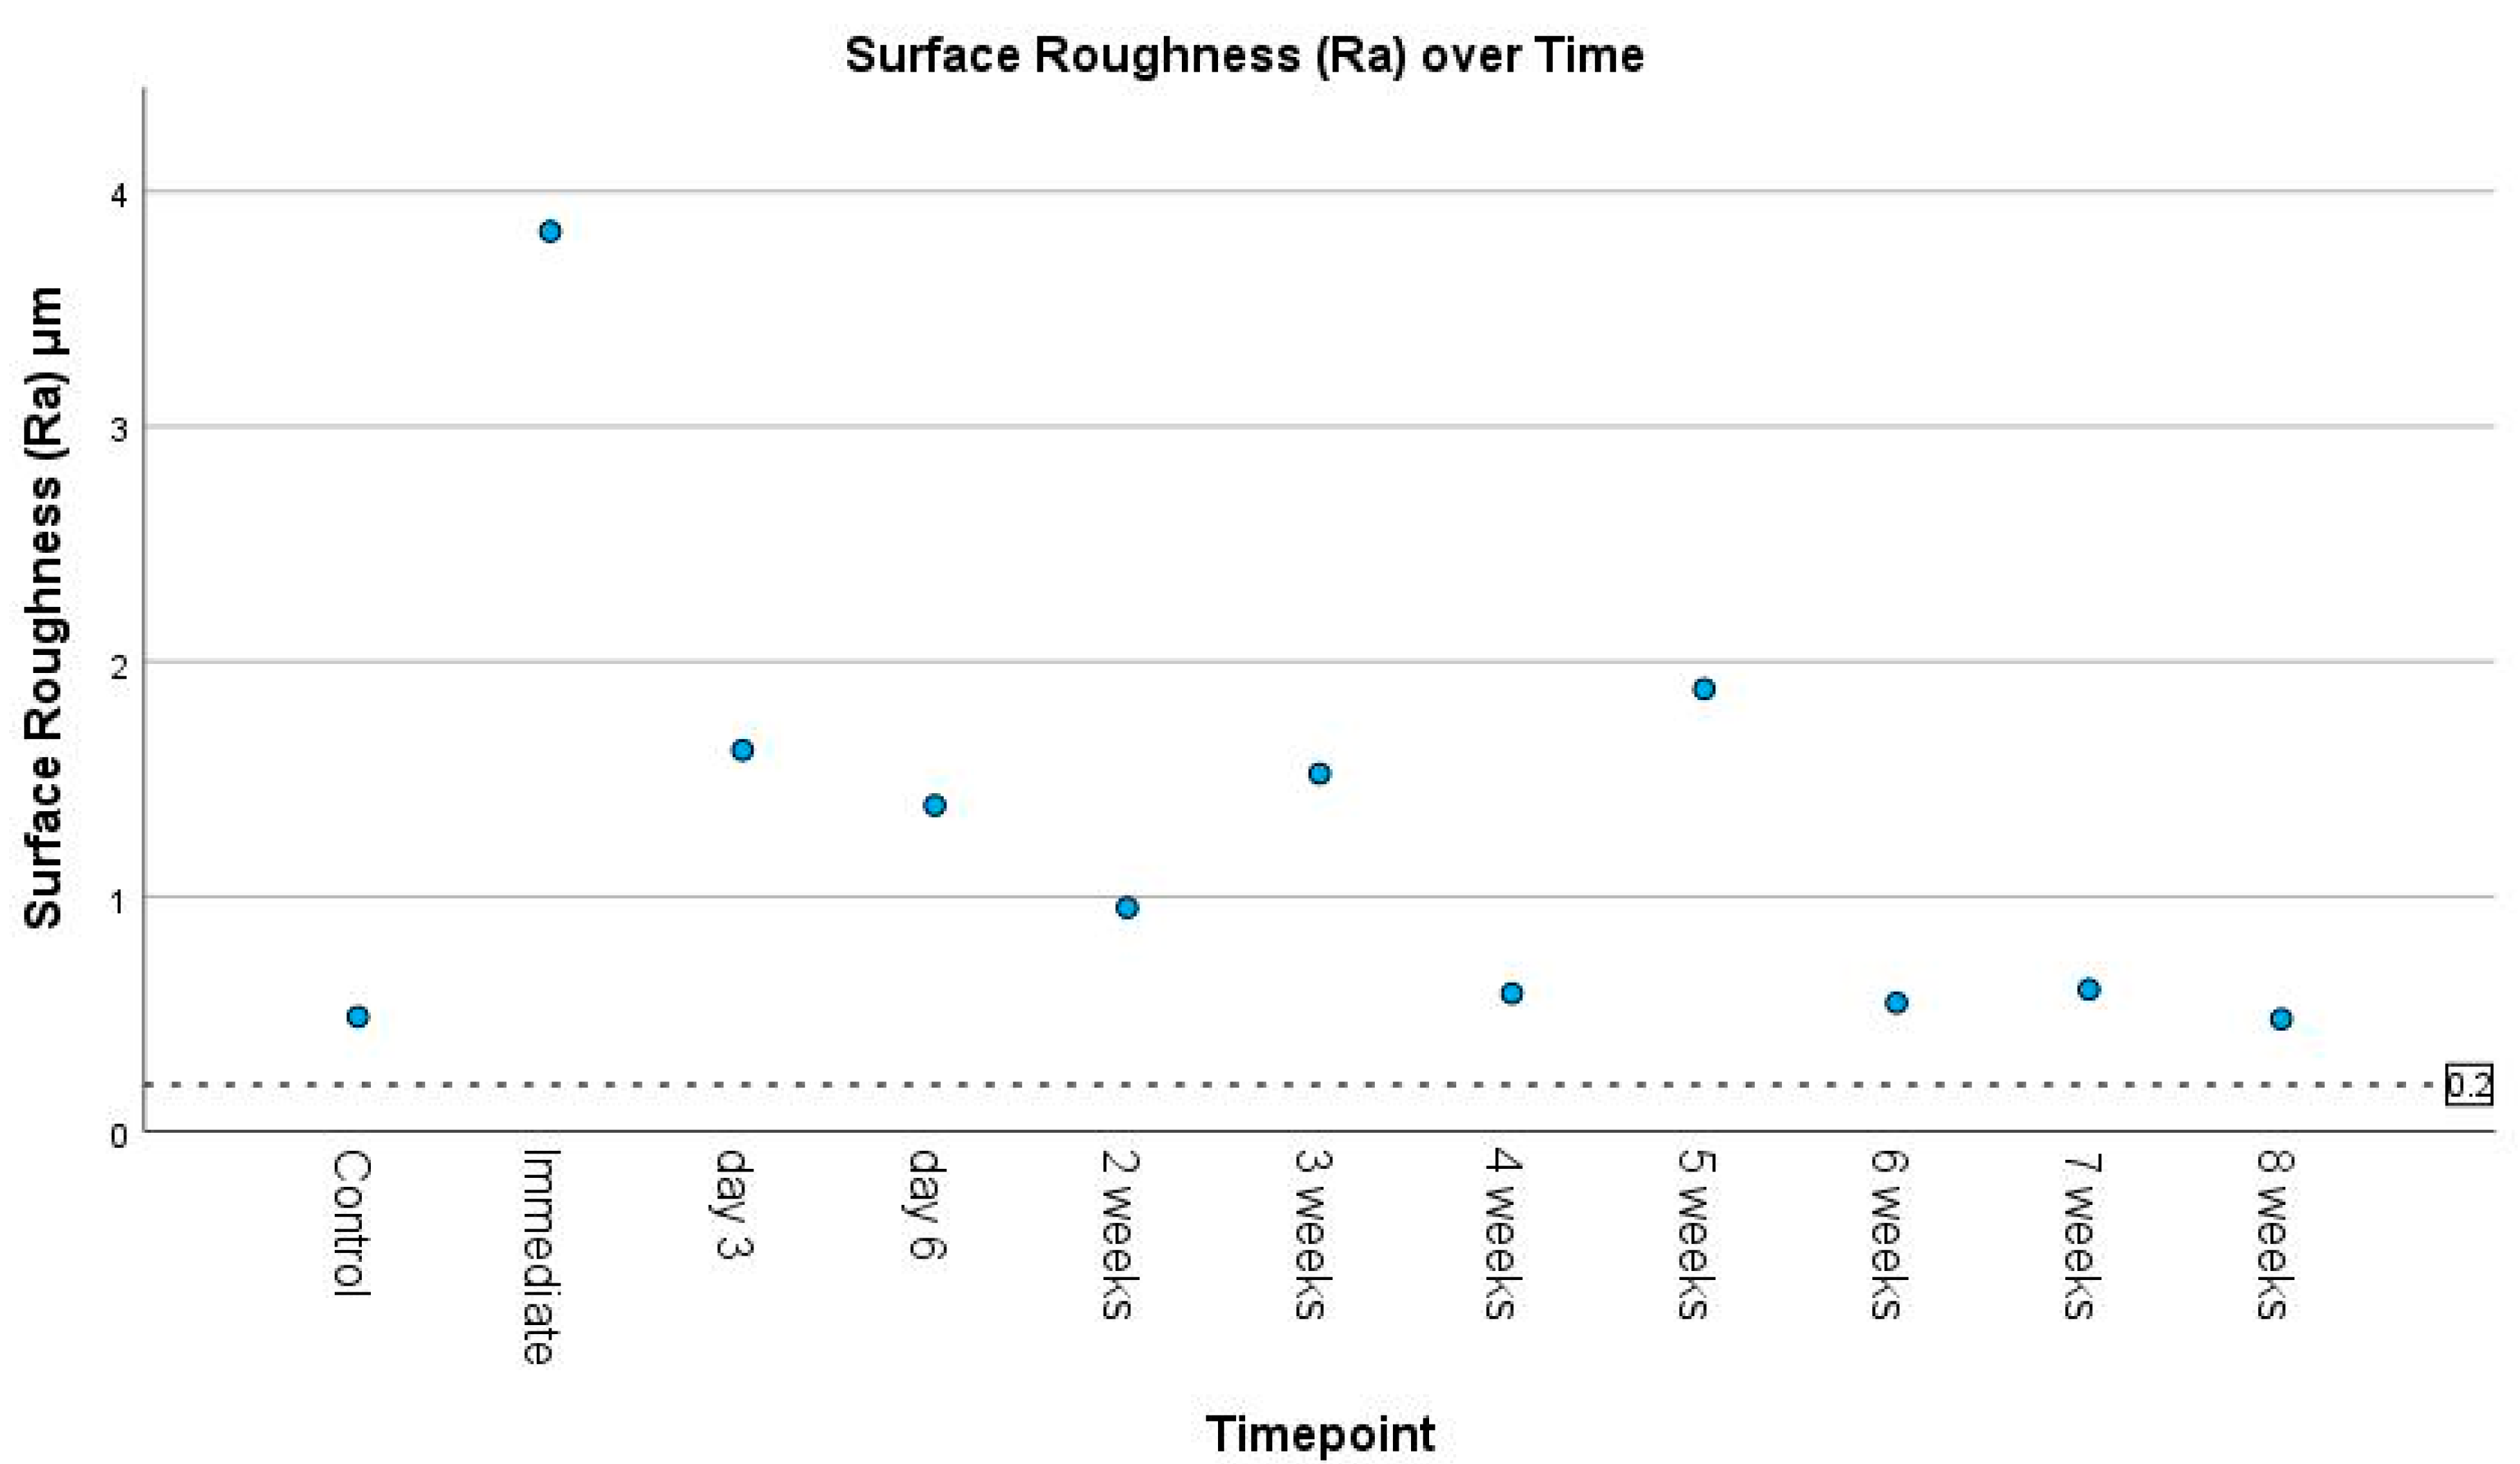
Surface roughness was variable, as Ra ranged from a maximum value of 3.83 μm at T1, to a minimum value of 0.479 μm at T10. The mean surface roughness at T10 was similar to the control sample that was printed prior to adding TiO2 (Ra = 0.489, Figure 2).

3.3. Color Difference and Translucency

Translucency parameter (TP), ΔEab color difference, SCI L*, SCI a*, and SCI b* showed inconsistent decreases between time T0 and T10.
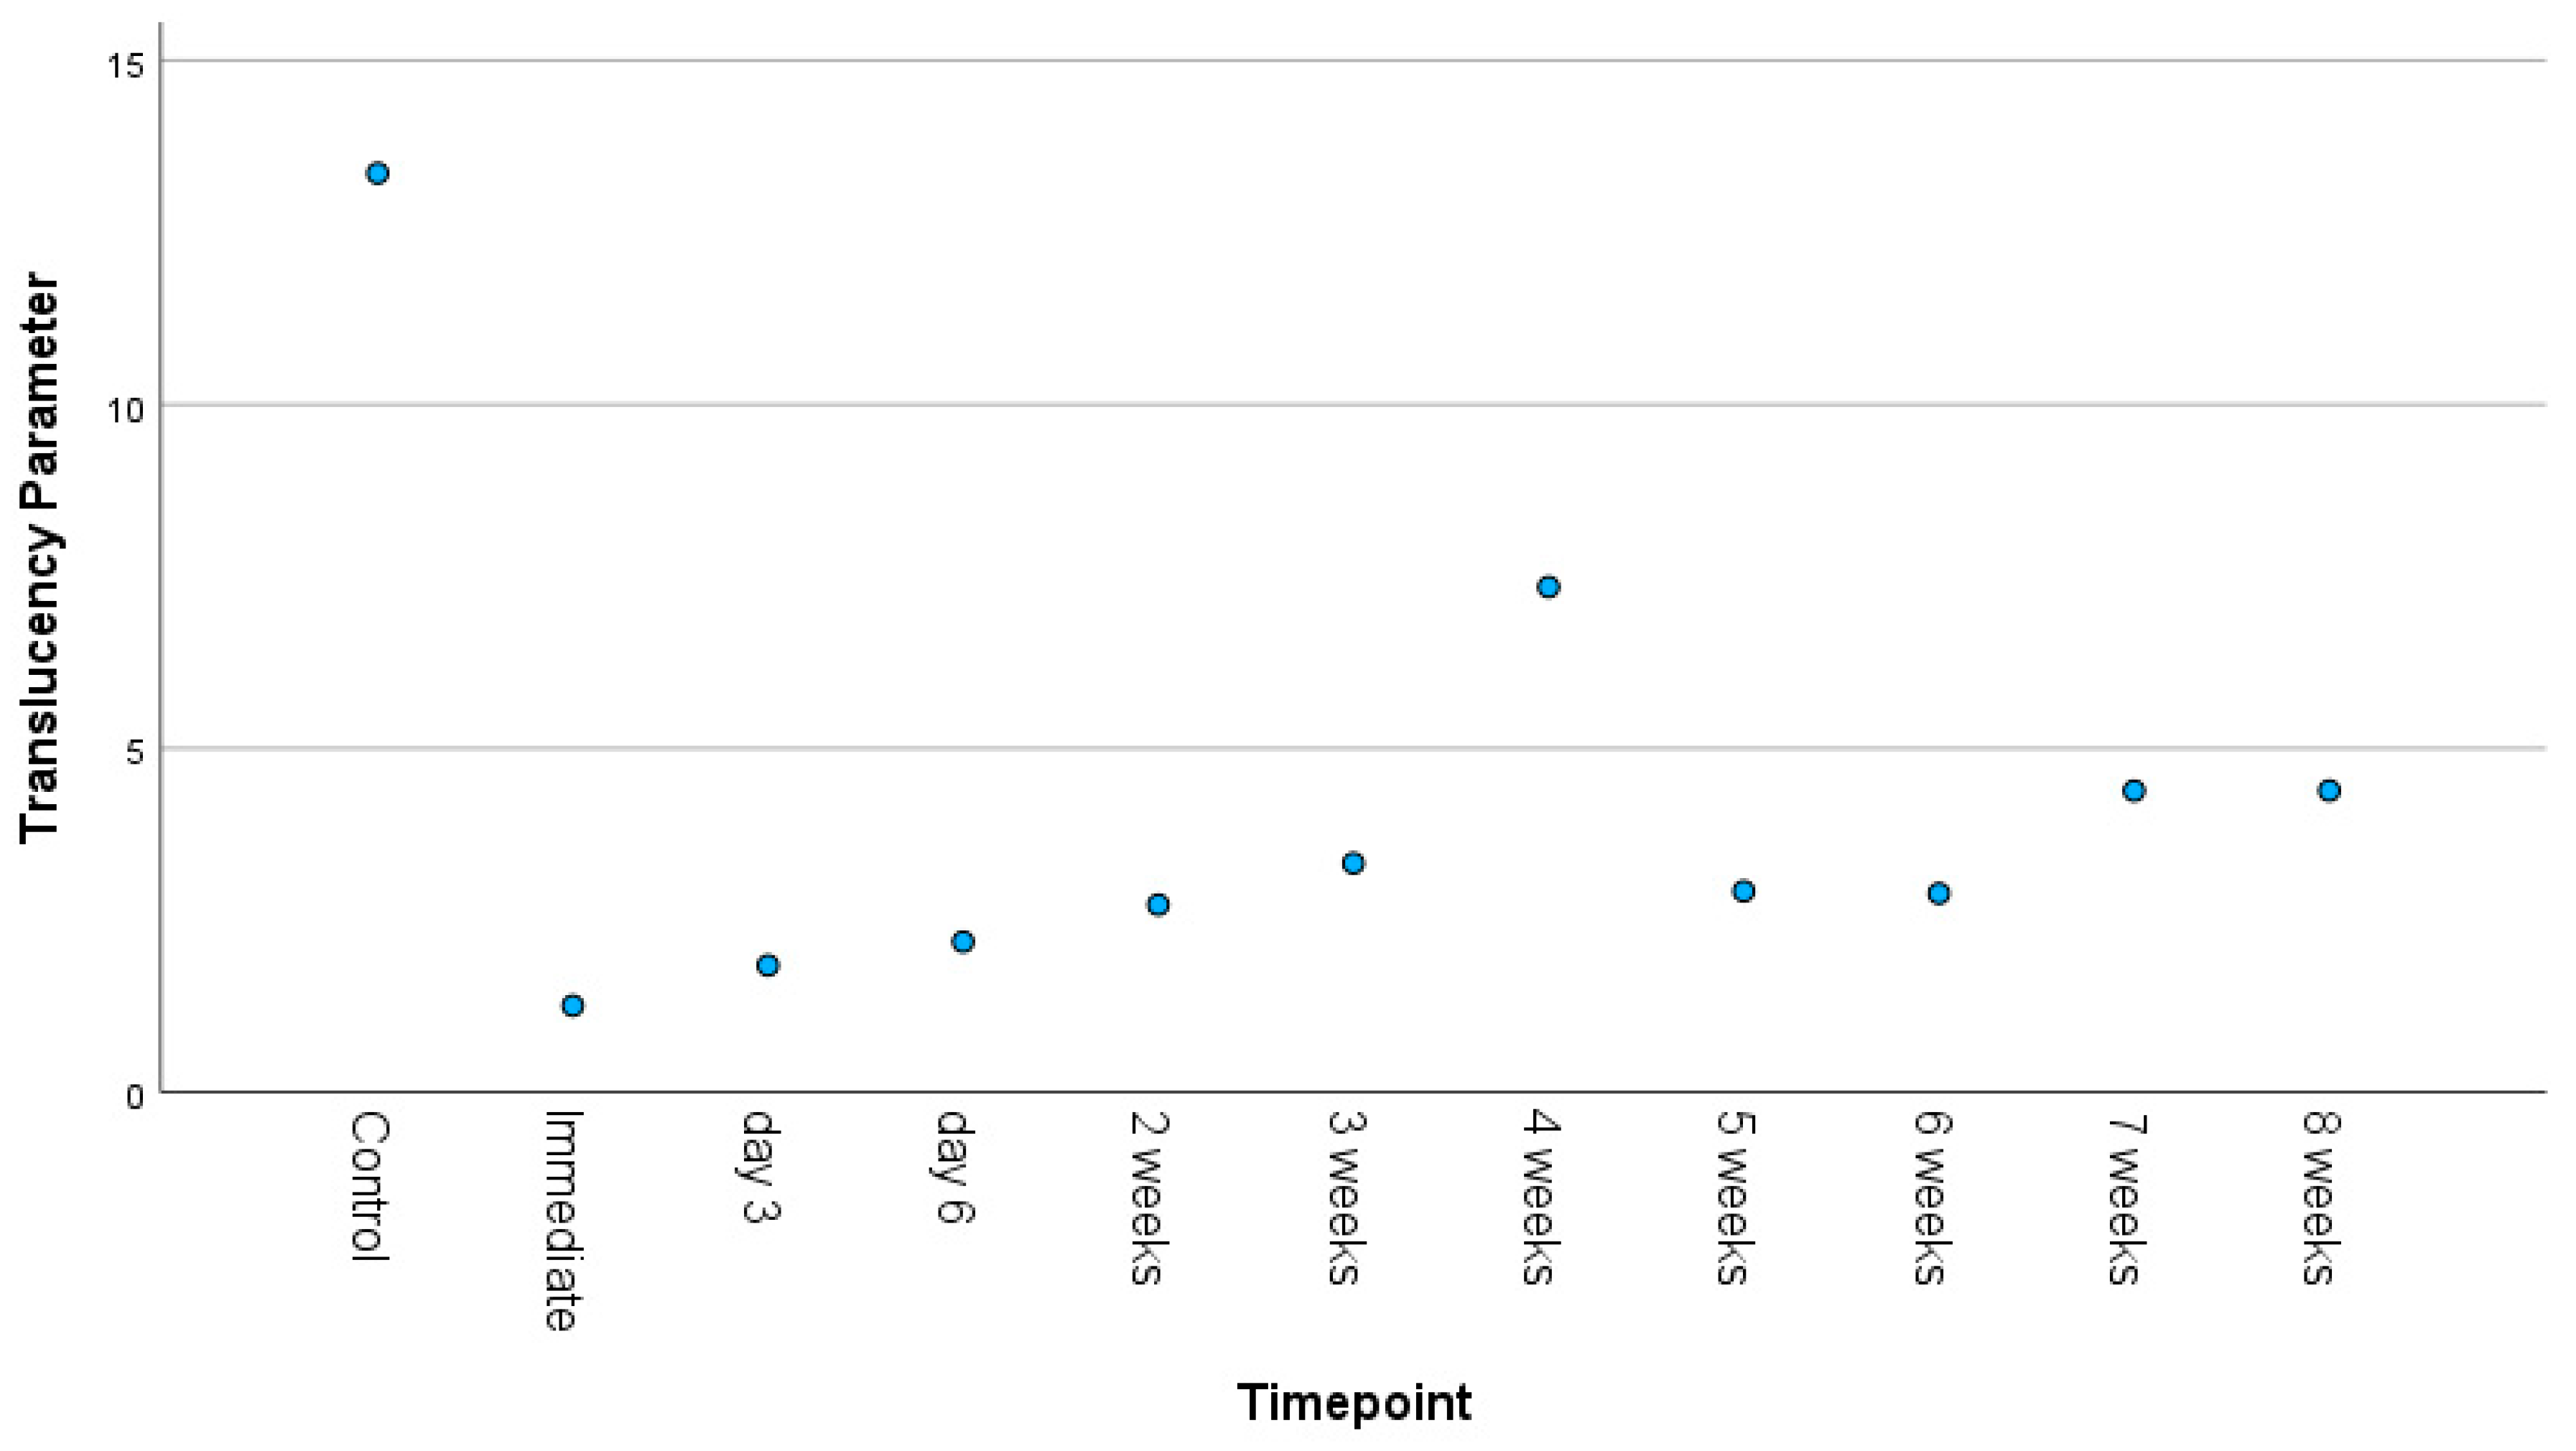
The translucency parameter calculates the difference in light transmission for specimens measured on white and black backgrounds. A higher value indicates more translucency, or less opacity. Figure 3 presents translucency parameter values across time. Translucency was highest for the control samples (TP = 13.36) and lowest at T0 (TP = 1.26). Translucency gradually increased over time, except for a spike observed at week 4.
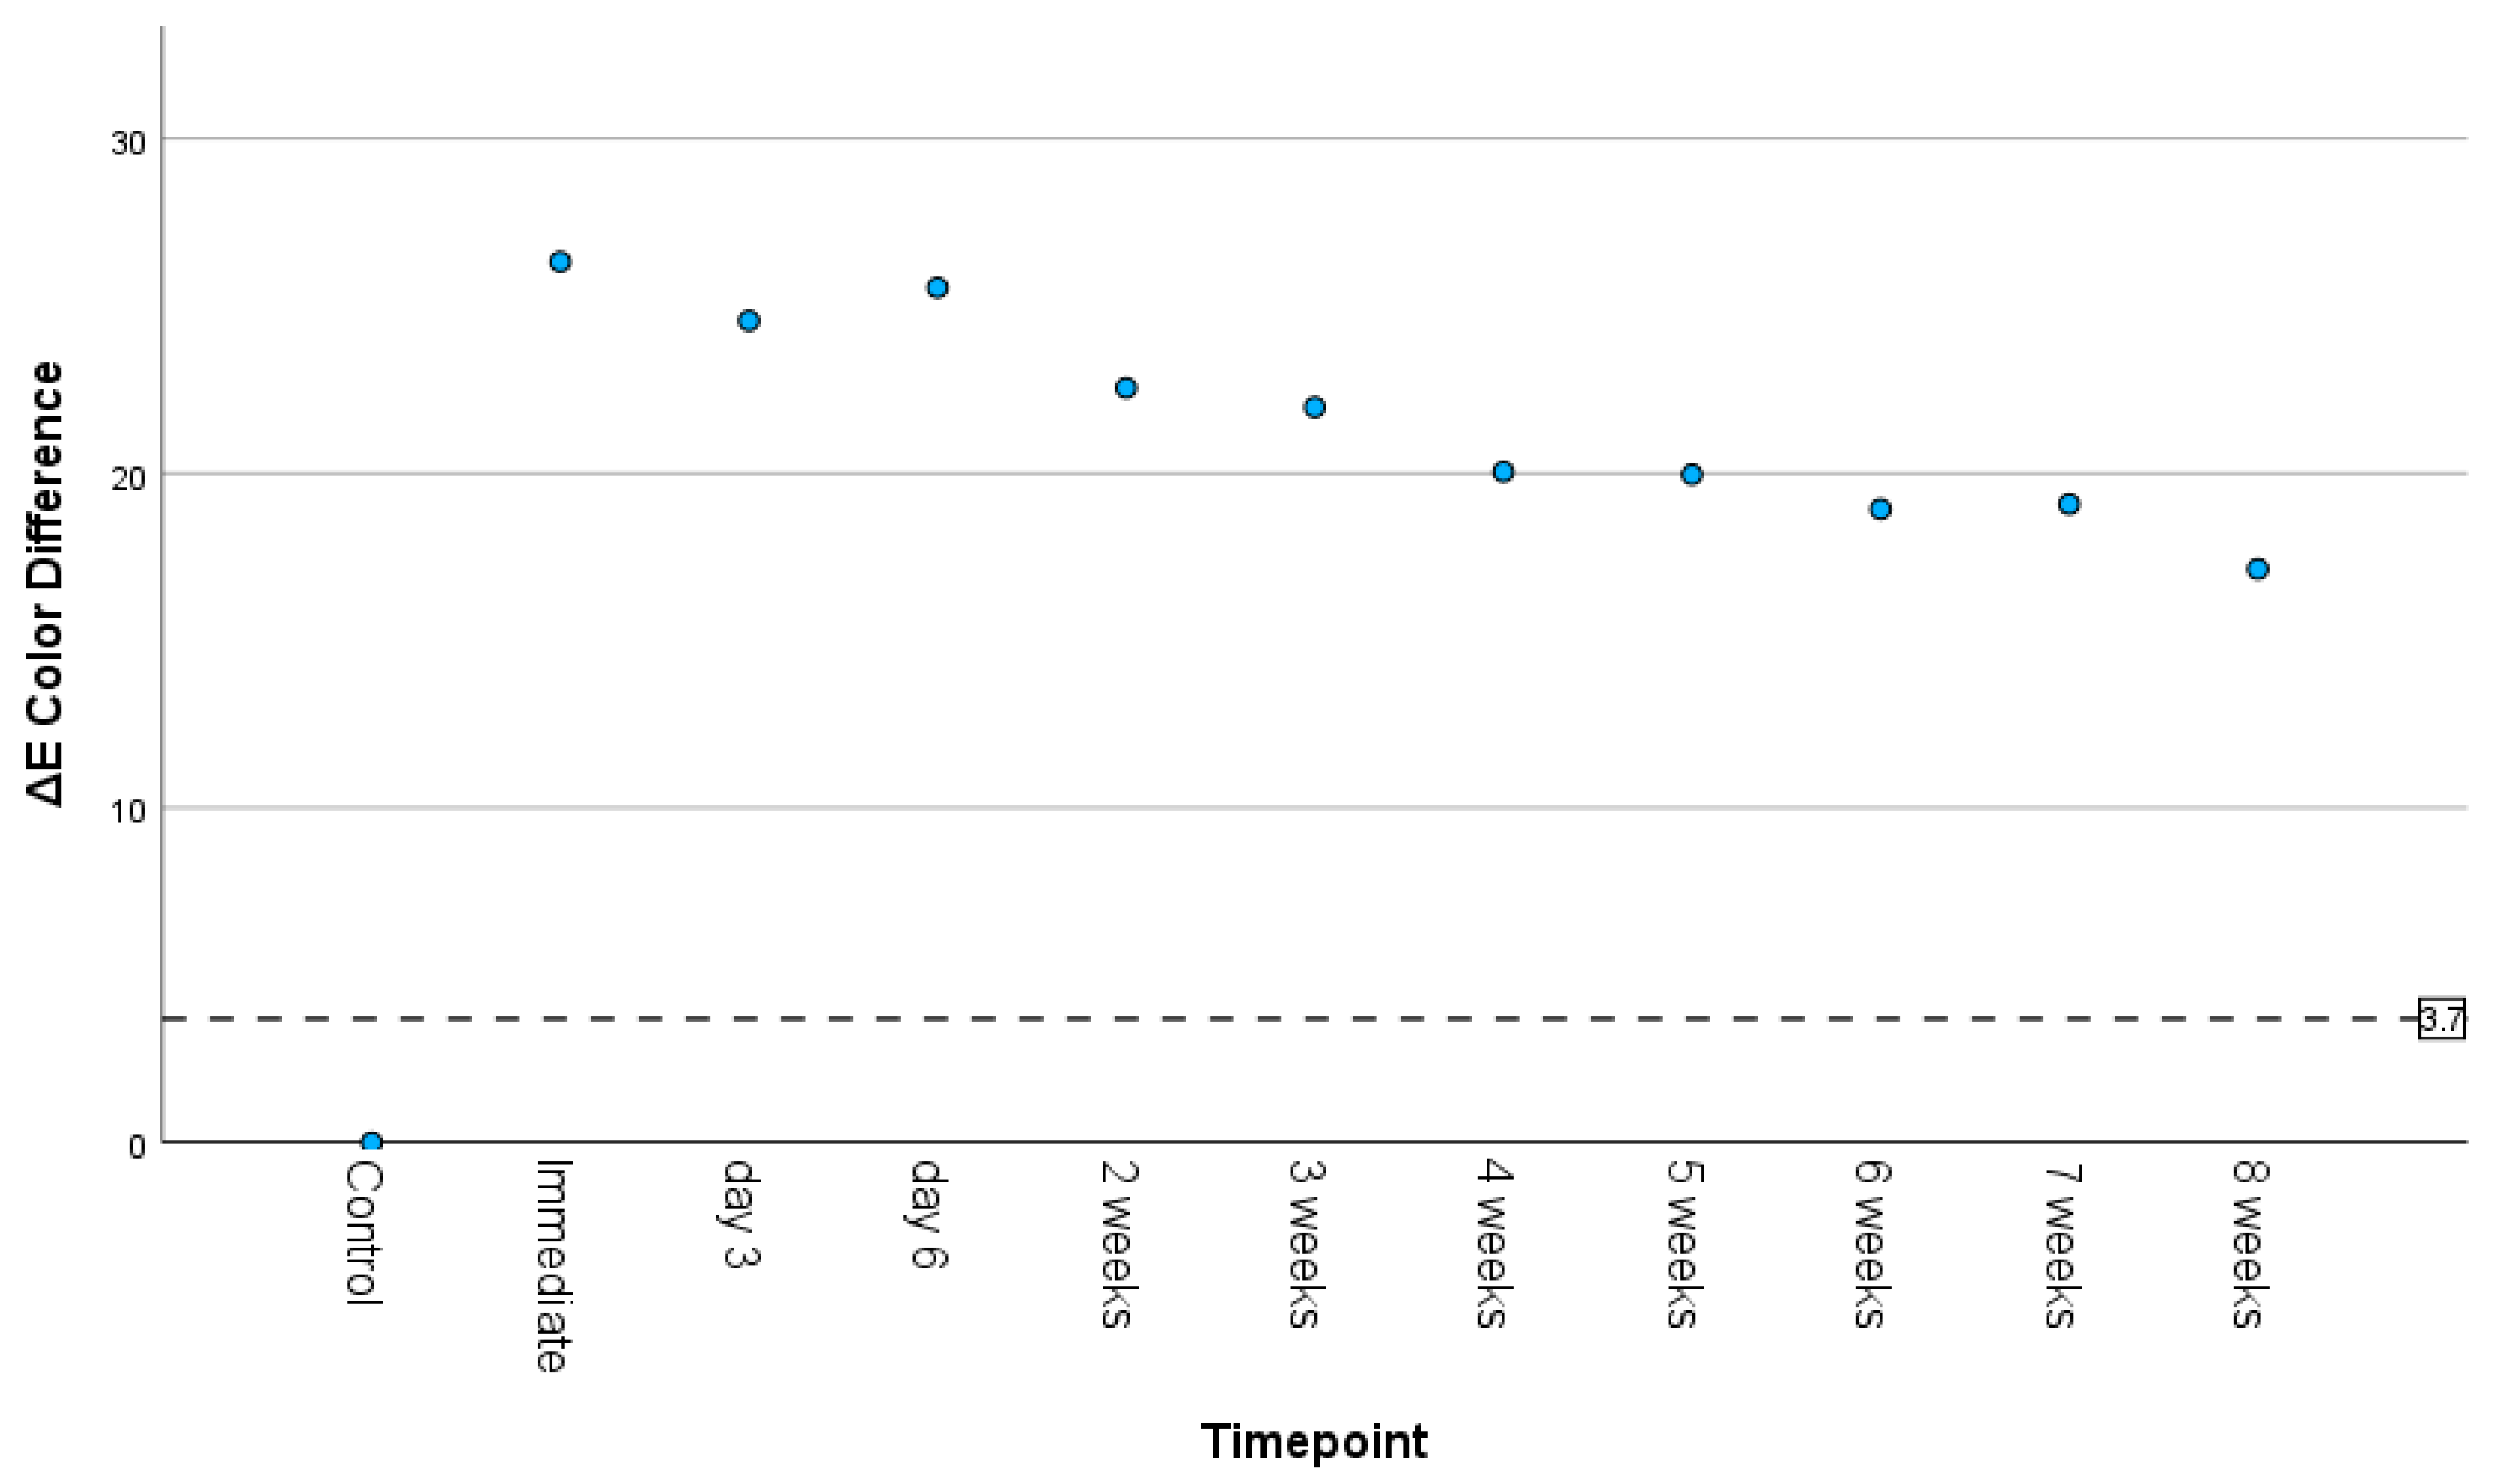
ΔEab color differences compared the experimental samples with the unmodified resin. Figure 4 displays color differences ranging from ΔEab = 0 for the control group to ΔEab = 26.32 for timepoint T1. ΔE* steadily drops to a low of ΔEab = 17.13 at T10. The reference line at ΔEab = 3.7 is the upper end of the reported acceptable value reported by Khashayar [30].
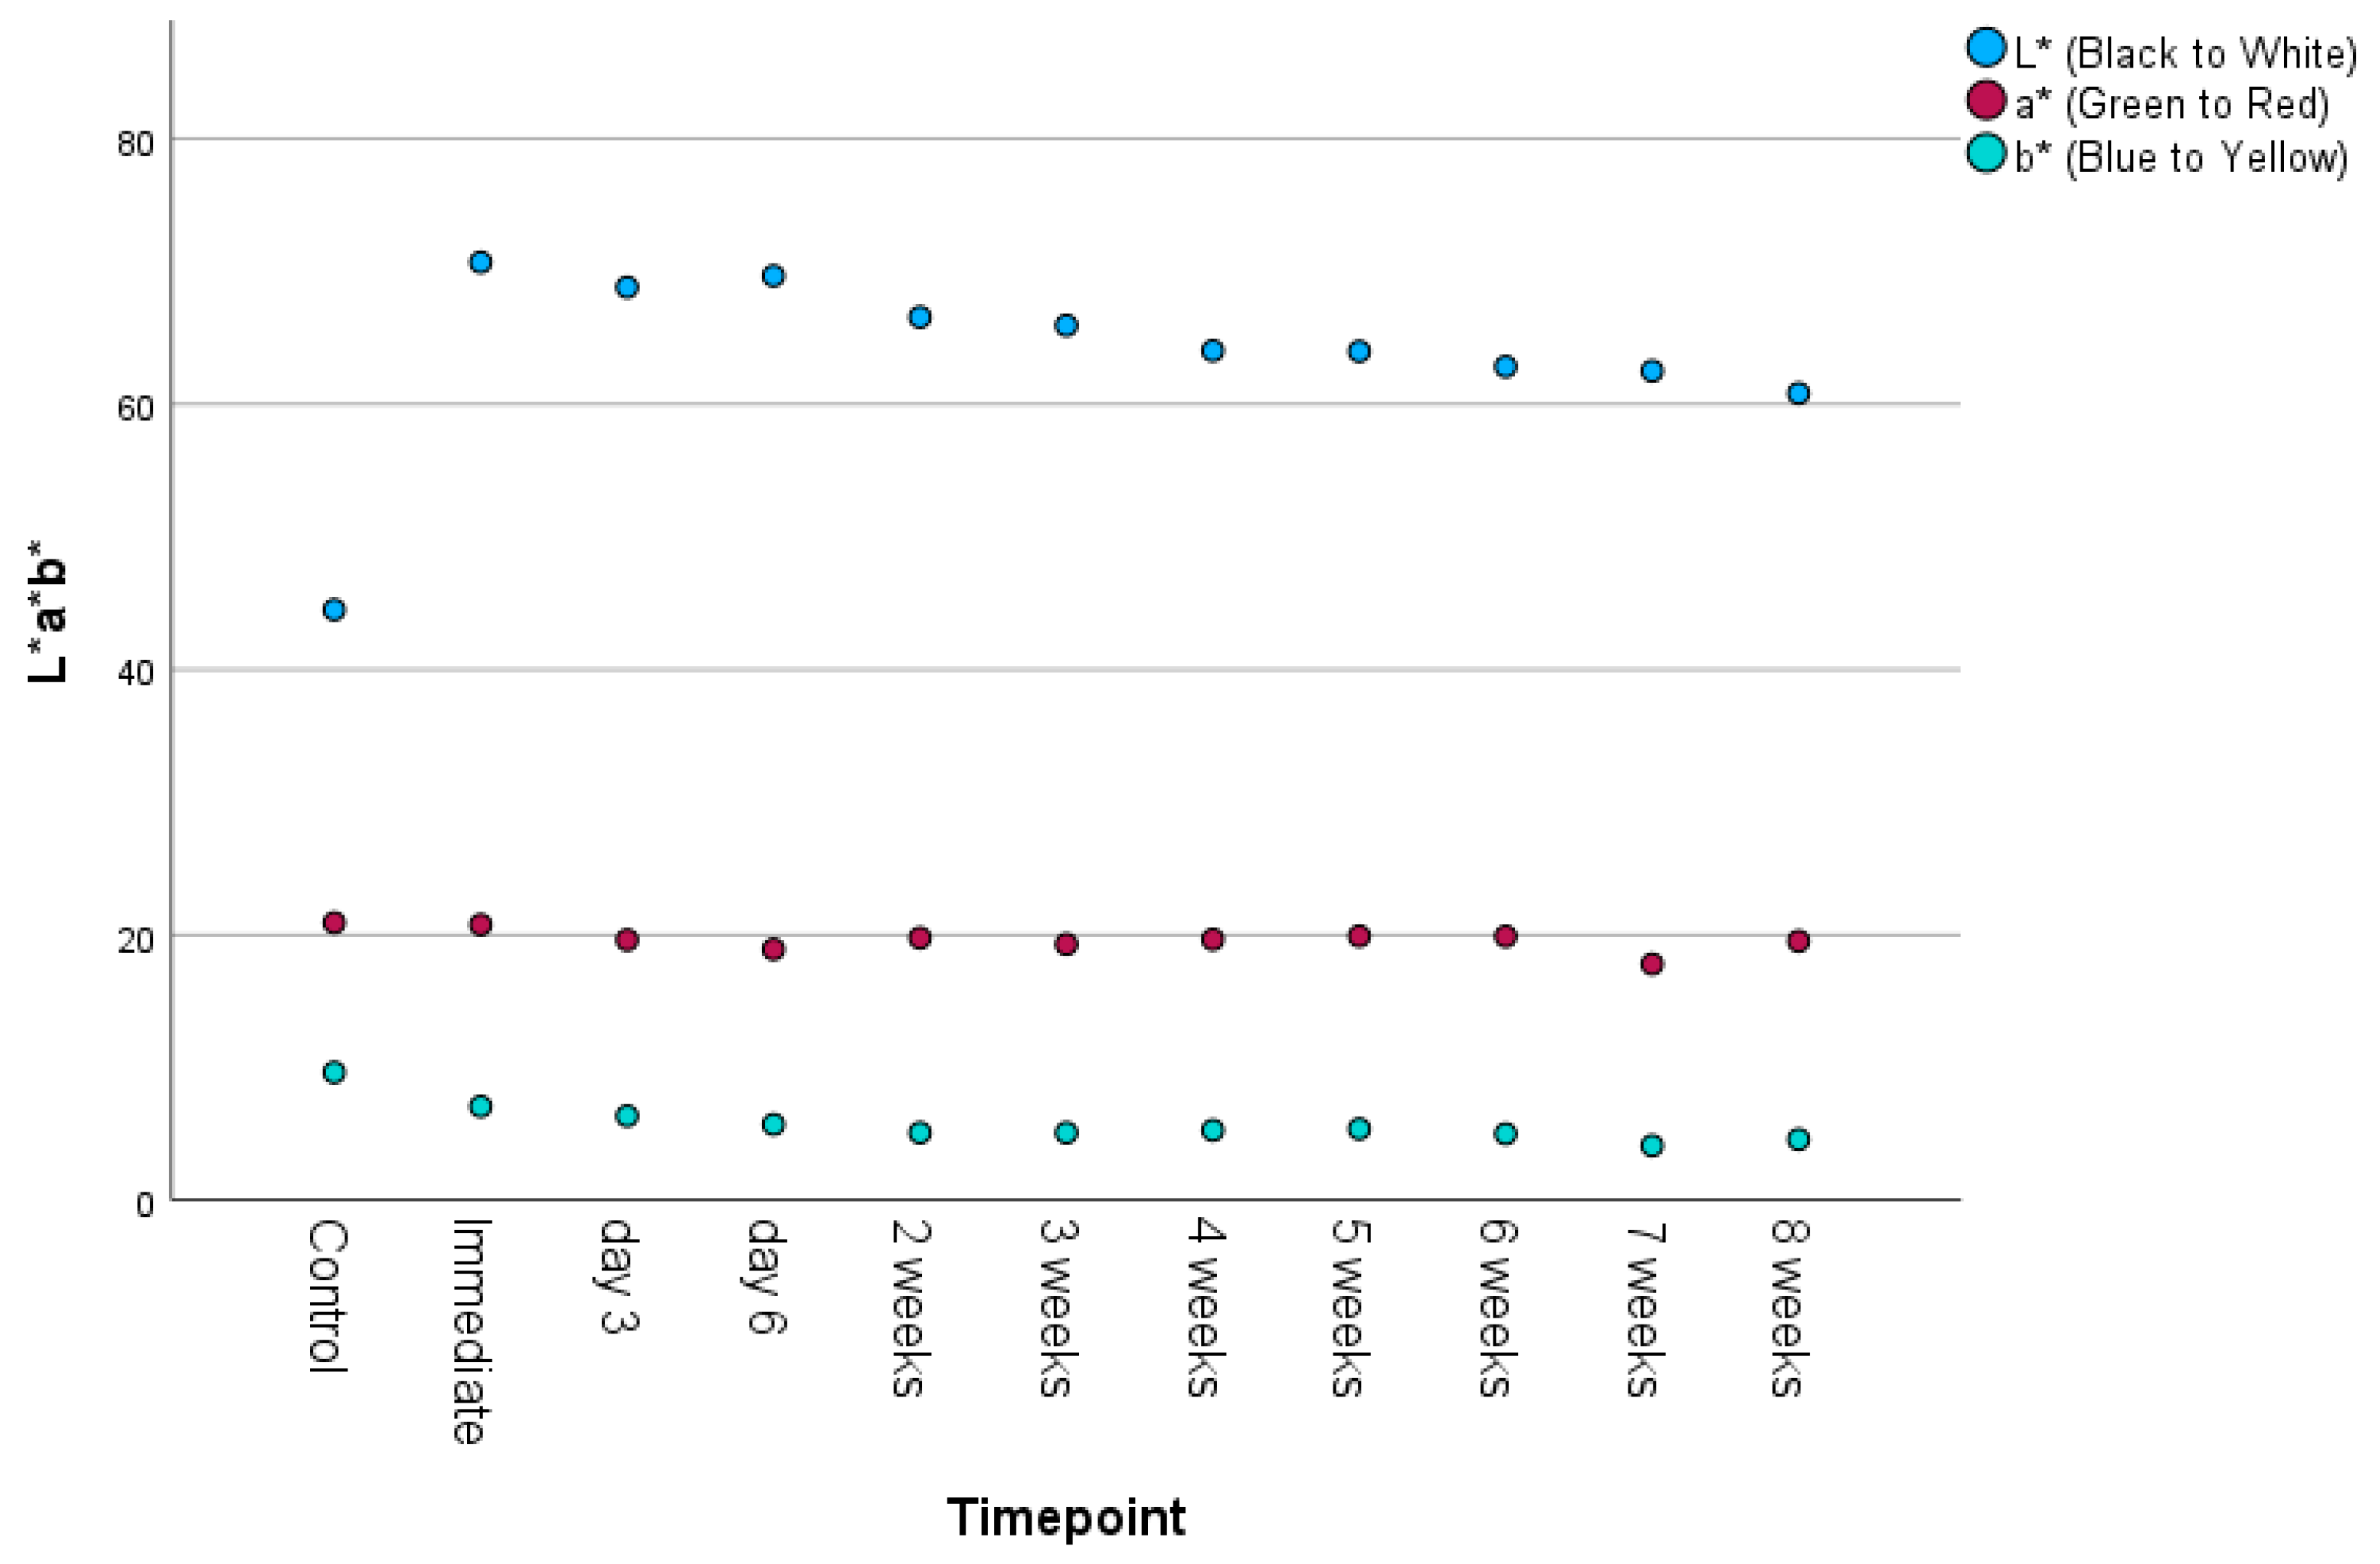
Of the individual color parameters SCI L*, SCI a*, and SCI b*, only SCI L* showed remarkable color change over time (Figure 5). When added to the unmodified resin, the L* value increased nearly 30 units. Since the L* parameter is a measure of black to white, and the chosen additive was white in color, this change was expected. Over time L* gradually decreased, with the value being nearly 10 units lower at 8 weeks, which indicated specimen darkening. For SCI a*, the red-green parameter, little, if any change was noted following nanoparticle addition or across time. SCI b*, the blue-yellow parameter, decreased 2.7 units following TiO2 addition, indicating a slight loss of yellowness. However, little change was noted at subsequent timepoints.

3.4. Correlations Between Timepoint and Surface Roughness, Color Difference, and Translucency

Spearman’s ρ was calculated to determine the correlation between the time of printing and the tested properties. Table 2 contains the correlation coefficient and significance level for each correlation. SCI a* was not significant (ρ = −0.261 p = 0.467). All remaining correlations were significant at the α = 0.05 level.

3.5. Correlations Between Surface Roughness and Color Difference, and Translucency

Spearman’s ρ was calculated to determine the correlation between surface roughness and the optical properties. Table 3 shows correlation coefficients and significance levels for each correlation. Except for SCI a* (ρ = 0.073, p = 0.832) and SCI b* (ρ = −0.419, p = 0.199), correlations were significant at the α = 0.05 level.

3.6. Limitations

This study was limited by its small sample size. A single sample from each timepoint was chosen for analysis due to only a single sample surviving at the final timepoint. The choice of one size of TiO2 nanoparticles (30 nm) limits the generalizability of this data, as multiple sizes of these nanoparticles are commercially available. No mechanical properties were tested, which would be required before a formulation could be approved for clinical use. The failures noted with this formulation may not apply to other formulations. Future research of different nanoparticle mixtures across time is warranted, and comparisons with prior research are needed.

4. Discussion

The aim of this study was to assess the printability and maintenance of surface properties over time in nano-TiO2-filled denture polymers. The null hypothesis, that surface roughness and optical properties would not change over time, was partially rejected. Surface roughness, translucency parameter, ΔEab color change and color parameter SCI L* underwent significant changes over an eight-week period. Color parameters SCI a* and SCI b* remained stable, without demonstrating significant change.
Color and translucency stability are important for a denture because it must maintain an adequate color range to match biological tissues. TiO2 was added because of its potential for reducing microbial activity that may occur when the denture contacts surrounding soft tissues. Here its addition significantly whitened the denture polymer, raising ΔEab values nearly 27 units. Denture color is influenced by pigment color, nanoparticle size and quantity, and the differences in refractive indices between polymer and nanoparticle. PMMA has a refractive index of 1.49, whereas TiO2 is more than 2.6. For materials with higher refractive indices, light travels shorter paths because it is bent more, and consequently penetrates less deeply. TiO2 effectively prevents light transmission and hence its scattering effect gives the material a whiter appearance. This explains higher SCI L* values, which in turn raise ΔEab values.
With later printings, this color discrepancy was partly recovered, with the ΔEab color change from baseline being reduced from 27 to 17 units. These results have two implications. The first is that printing may need to occur in two stages. The intaglio surfaces, where denture color is not visible, would benefit from TiO2 additions and hence require one printing stage. The remaining structure would be printed without TiO2 to preserve appropriate color matching with soft tissues. A second implication is that TiO2 particles likely migrate downward over time, accumulating near the bottom of the polymer. Although this offers better translucency, color matching and roughness properties at the top surface, it also implies that particle dispersion is non-uniform. This in turn may reduce any advantage rendered by the nanoparticles for improving bulk physical properties. Bulk properties were not measured in this study.
Denture smoothness is important because it offers both patient comfort and reduces plaque accumulation during wear. In traditional denture construction, the tissue surface is not polished, to maintain acceptable smoothness. The accepted roughness value to mitigate plaque accumulation is Ra < 0.2 μm [31]. The reference line shown near the bottom of Figure 3 is at this value. It is noteworthy that none of the printed samples were below this level. This suggests that for 3D-printed dentures, an alternative strategy is needed. The application of a coating or glaze would overcome the inherent roughness, since polishing the intaglio surface of a denture is normally avoided to prevent altering prosthesis fit. Compared to milled or traditionally manufactured materials, 3D-printed denture bases have been shown to possess higher surface roughness [32,33,34]. Glazes have been shown to improve color stability by decreasing surface roughness and covering surface defects that undergo staining, albeit temporarily [35,36].
All prints were performed at 0 degrees, which has been shown by Shim et al. to yield lower surface roughness than either 45 degree or 90 degree print angles [37]. However, the same study also reported that more than twice as many samples printed at 0 degrees showed C. albicans overgrowth, as compared to those printed at 45 degrees or 90 degrees. This was attributed to pores being present across the surface of the 0° samples. Presumably this provided a substrate for fungal adherence. Porosity was not observed on the surfaces of the printed specimens in this study, as can be seen in Figure 6.
Recent studies have highlighted the variable impact nanoparticle incorporation renders on the surface properties of denture base resins. Alshaikh et al. [21] observed a small, statistically insignificant, increase in surface roughness with the addition of ZrO2 nanoparticles to a 3D-printed resin. AlGhamdi et al. [38] found that the effects of titanium nanoparticle incorporation were highly resin-dependent, with one formulation demonstrating a significant increase in surface roughness and unacceptable color change, while another resin showed minimal effects. A systematic review by Kaurani et al. [25] addresses the influence of nanoparticle size, reporting greater roughness with TiO2 particles smaller than 50 nm. This is attributed to the greater propensity for smaller particles to agglomerate, thereby creating greater surface area with irregularity. Collectively these findings align with those reported here, where incorporation of 30 nm TiO2 nanoparticles resulted in significantly elevated surface roughness and color difference with unmodified resin.
This preliminary study presents initial information on how the surface and optical properties of a TiO2-modified 3D-printed resin change over time, from initial mixing through print failure. Notably, surface roughness, translucency, and color difference were highest at T0 (immediately after mixing) and declined variably across eight weeks. A pronounced spike in translucency at week 4 (T5), paired with a drop in surface roughness, suggests uneven sedimentation or perhaps excessive agglomeration of nanoparticles occurred at this time period, which was possibly overcome during mixing at later periods. Although not measured here, it is expected that a non-uniform particle distribution would contribute to inconsistencies in optical and surface roughness properties. The printer used in this study included a built-in heater and mechanical mixing paddle to maintain resin homogeneity. However, these features may have been insufficient to prevent nanoparticle settling over time. Future printer designs should consider optimizing paddle geometry, mixing frequency, and thermal control to improve nanoparticle dispersion stability. The observed increase in surface roughness may also have accelerated degradation of the polydimethylsiloxane (PDMS) resin tray liner. This could potentially shorten the functional life of the printer tray, which is a concern for clinical users. This degradation was not noted visually during the trials.
Clinically, these findings highlight the challenges of incorporating TiO2 nanoparticles into printable denture base resins. At present, no commercially available denture base resin is validated for point-of-care 3D printing with embedded nanofillers. Users must strictly adhere to manufacturer instructions and avoid off-label modifications, as these may compromise material performance and device longevity. Furthermore, new surface-finishing strategies should be explored to mitigate roughness. Preliminary evidence supports the use of post-print glaze applications by Hashemzade [36] and Raszerski [35] to improve surface smoothness, although long-term clinical studies are needed to validate their effectiveness and durability.

5. Conclusions

The results of this in vitro study support the following conclusions.
  • TiO2 additions to a denture polymer produced significant changes in surface roughness and color that were not clinically acceptable.
  • Although printability of the resin–TiO2 mixture was maintained for 7 weeks, mixture homogeneity is questioned.
  • Dentures printed with TiO2 nanoparticles may require two-stage printing and a coating application.

Author Contributions

Conceptualization, G.B. and M.W.B.; methodology, G.B. and B.S.; formal analysis, G.B.; writing—original draft preparation, G.B.; writing—review and editing, G.B. and M.W.B. All authors have read and agreed to the published version of the manuscript.

Funding

This research received no external funding.

Institutional Review Board Statement

Not applicable.

Informed Consent Statement

Not applicable.

Data Availability Statement

The raw data supporting the conclusions of this article will be made available by the authors on request.

Acknowledgments

This work forms part of the doctoral dissertation of Gregory W. Bennett at the University of Nebraska Medical Center. The authors used OpenAI’s ChatGPT (GPT-4) to assist with language refinement, editing for clarity and conciseness, and formatting guidance during manuscript preparation. All intellectual content, data analysis, interpretation, and scientific conclusions were developed by the authors. The authors reviewed and approved all AI-assisted edits to ensure accuracy and integrity of the final manuscript.

Conflicts of Interest

The authors declare no conflicts of interest.

Abbreviations

The following abbreviations are used in this manuscript:
TiO2Titanium dioxide
SLAStereolithography
RaRoughness Average
STLStandard Tessellation Language
CIE Lab*Commission Internationale de l’Éclairage color space

References

  1. Dye, B.; Thornton-Evans, G.; Li, X.; Iafolla, T. Dental caries and tooth loss in adults in the United States, 2011–2012. NCHS Data Brief 2015, 2015, 4–8. [Google Scholar]
  2. Qin, X.; He, J.; He, H.; Yuan, X.; Su, X.; Zeng, X. Long-term trends in the burden of edentulism in China over three decades: A Joinpoint regression and age-period-cohort analysis based on the global burden of disease study 2019. Front. Public Health 2023, 11, 1099194. [Google Scholar] [CrossRef]
  3. Emami, E.; de Souza, R.F.; Kabawat, M.; Feine, J.S. The impact of edentulism on oral and general health. Int. J. Dent. 2013, 2013, 498305. [Google Scholar] [CrossRef]
  4. Zandinejad, A.; Floriani, F.; Lin, W.S.; Naimi-Akbar, A. Clinical outcomes of milled, 3D-printed, and conventional complete dentures in edentulous patients: A systematic review and meta-analysis. J. Prosthodont. 2024, 33, 736–747. [Google Scholar] [CrossRef] [PubMed]
  5. Goodacre, B.J. 3D Printing of Complete Dentures: A Narrative Review. Int. J. Prosthodont. 2024, 37, 159–164. [Google Scholar] [CrossRef]
  6. Nett, J.E.; Marchillo, K.; Spiegel, C.A.; Andes, D.R. Development and validation of an in vivo Candida albicans biofilm denture model. Infect. Immun. 2010, 78, 3650–3659. [Google Scholar] [CrossRef] [PubMed]
  7. Hannah, V.E.; O’Donnell, L.; Robertson, D.; Ramage, G. Denture Stomatitis: Causes, Cures and Prevention. Prim. Dent. J. 2017, 6, 46–51. [Google Scholar] [CrossRef] [PubMed]
  8. Iinuma, T.; Arai, Y.; Abe, Y.; Takayama, M.; Fukumoto, M.; Fukui, Y.; Iwase, T.; Takebayashi, T.; Hirose, N.; Gionhaku, N.; et al. Denture wearing during sleep doubles the risk of pneumonia in the very elderly. J. Dent. Res. 2015, 94, 28s–36s. [Google Scholar] [CrossRef]
  9. Monteiro, D.R.; Gorup, L.F.; Takamiya, A.S.; de Camargo, E.R.; Filho, A.C.; Barbosa, D.B. Silver distribution and release from an antimicrobial denture base resin containing silver colloidal nanoparticles. J. Prosthodont. 2012, 21, 7–15. [Google Scholar] [CrossRef]
  10. Souza Neto, F.N.d.; Sala, R.L.; Fernandes, R.A.; Oliveira Xavier, T.P.; Cruz, S.A.; Paranhos, C.M.; Monteiro, D.R.; Barbosa, D.B.; Delbem, A.C.B.; Camargo, E.R.d. Effect of synthetic colloidal nanoparticles in acrylic resin of dental use. Eur. Polym. J. 2019, 112, 531–538. [Google Scholar] [CrossRef]
  11. Kassaee, M.Z.; Akhavan, A.; Sheikh, N.; Sodagar, A. Antibacterial effects of a new dental acrylic resin containing silver nanoparticles. J. Appl. Polym. Sci. 2008, 110, 1699–1703. [Google Scholar] [CrossRef]
  12. Henn, S.; Nedel, F.; de Carvalho, R.V.; Lund, R.G.; Cenci, M.S.; Pereira-Cenci, T.; Demarco, F.F.; Piva, E. Characterization of an antimicrobial dental resin adhesive containing zinc methacrylate. J. Mater. Sci. Mater. Med. 2011, 22, 1797–1802. [Google Scholar] [CrossRef] [PubMed]
  13. Fan, C.; Chu, L.; Rawls, H.R.; Norling, B.K.; Cardenas, H.L.; Whang, K. Development of an antimicrobial resin—A pilot study. Dent. Mater. 2011, 27, 322–328. [Google Scholar] [CrossRef] [PubMed]
  14. An, S.; Evans, J.L.; Hamlet, S.; Love, R.M. Incorporation of antimicrobial agents in denture base resin: A systematic review. J. Prosthet. Dent. 2021, 126, 188–195. [Google Scholar] [CrossRef]
  15. Beyth, N.; Houri-Haddad, Y.; Baraness-Hadar, L.; Yudovin-Farber, I.; Domb, A.J.; Weiss, E.I. Surface antimicrobial activity and biocompatibility of incorporated polyethylenimine nanoparticles. Biomaterials 2008, 29, 4157–4163. [Google Scholar] [CrossRef]
  16. Jeon, S.; Jo, Y.H.; Yoon, H.I.; Han, J.S. Antifungal effect, surface roughness, and cytotoxicity of three-dimensionally printed denture base with phytoncide-filled microcapsules: An in-vitro study. J. Dent. 2022, 120, 104098. [Google Scholar] [CrossRef]
  17. Kwon, J.S.; Kim, J.Y.; Mangal, U.; Seo, J.Y.; Lee, M.J.; Jin, J.; Yu, J.H.; Choi, S.H. Durable Oral Biofilm Resistance of 3D-Printed Dental Base Polymers Containing Zwitterionic Materials. Int. J. Mol. Sci. 2021, 22, 417. [Google Scholar] [CrossRef]
  18. Totu, E.E.; Nechifor, A.C.; Nechifor, G.; Aboul-Enein, H.Y.; Cristache, C.M. Poly(methyl methacrylate) with TiO2 nanoparticles inclusion for stereolitographic complete denture manufacturing—The fututre in dental care for elderly edentulous patients? J. Dent. 2017, 59, 68–77. [Google Scholar] [CrossRef]
  19. Taormina, G.; Sciancalepore, C.; Bondioli, F.; Messori, M. Special Resins for Stereolithography: In Situ Generation of Silver Nanoparticles. Polymers 2018, 10, 212. [Google Scholar] [CrossRef]
  20. Chen, S.-G.; Yang, J.; Jia, Y.-G.; Lu, B.; Ren, L. TiO2 and PEEK Reinforced 3D Printing PMMA Composite Resin for Dental Denture Base Applications. Nanomaterials 2019, 9, 1049. [Google Scholar] [CrossRef]
  21. Alshaikh, A.A.; Khattar, A.; Almindil, I.A.; Alsaif, M.H.; Akhtar, S.; Khan, S.Q.; Gad, M.M. 3D-Printed Nanocomposite Denture-Base Resins: Effect of ZrO2 Nanoparticles on the Mechanical and Surface Properties In Vitro. Nanomaterials 2022, 12, 2451. [Google Scholar] [CrossRef]
  22. Cristache, C.M.; Totu, E.E.; Iorgulescu, G.; Pantazi, A.; Dorobantu, D.; Nechifor, A.C.; Isildak, I.; Burlibasa, M.; Nechifor, G.; Enachescu, M. Eighteen Months Follow-Up with Patient-Centered Outcomes Assessment of Complete Dentures Manufactured Using a Hybrid Nanocomposite and Additive CAD/CAM Protocol. J. Clin. Med. 2020, 9, 324. [Google Scholar] [CrossRef] [PubMed]
  23. Patel, M.; Barrera, L.; Chu, L.; Whang, K. Development of an antimicrobial, 3D printable denture base material with K18 quaternary ammonium silane-functionalized methyl methacrylate and filler. J. Prosthet. Dent. 2024, 131, 1251.e1251–1251.e1258. [Google Scholar] [CrossRef] [PubMed]
  24. Altarazi, A.; Jadaan, L.; McBain, A.J.; Haider, J.; Kushnerev, E.; Yates, J.M.; Alhotan, A.; Silikas, N.; Devlin, H. 3D-printed nanocomposite denture base resin: The effect of incorporating TiO2 nanoparticles on the growth of Candida albicans. J. Prosthodont. 2024, 33, 25–34. [Google Scholar] [CrossRef] [PubMed]
  25. Kaurani, P.; Hindocha, A.D.; Jayasinghe, R.M.; Pai, U.Y.; Batra, K.; Price, C. Effect of addition of titanium dioxide nanoparticles on the antimicrobial properties, surface roughness and surface hardness of polymethyl methacrylate: A Systematic Review. F1000Research 2023, 12, 577. [Google Scholar] [CrossRef]
  26. Zguris, Z. How mechanical properties of stereolithography 3D prints are affected by UV curing. In Formlabs White Paper; Formlabs Inc.: Somerville, MA, USA, 2016; pp. 1–11. [Google Scholar]
  27. ISO EN. 4287; Geometrical Product Specifications (GPS)–Surface Texture: Profile Method–Terms, Definitions and Surface Texture Parameters. International Organization for Standardization: Geneva, Switzerland, 1997.
  28. ISO D. TR 28642: 2016; Dentistry—Guidance on Colour Measurement. International Organization for Standardization: Geneva, Switzerland, 2016.
  29. Johnston, W.M.; Ma, T.; Kienle, B.H. Translucency parameter of colorants for maxillofacial prostheses. Int. J. Prosthodont. 1995, 8, 79–86. [Google Scholar]
  30. Khashayar, G.; Bain, P.A.; Salari, S.; Dozic, A.; Kleverlaan, C.J.; Feilzer, A.J. Perceptibility and acceptability thresholds for colour differences in dentistry. J. Dent. 2014, 42, 637–644. [Google Scholar] [CrossRef]
  31. Bollenl, C.M.L.; Lambrechts, P.; Quirynen, M. Comparison of surface roughness of oral hard materials to the threshold surface roughness for bacterial plaque retention: A review of the literature. Dent. Mater. 1997, 13, 258–269. [Google Scholar] [CrossRef]
  32. Kraemer Fernandez, P.; Unkovskiy, A.; Benkendorff, V.; Klink, A.; Spintzyk, S. Surface Characteristics of Milled and 3D Printed Denture Base Materials Following Polishing and Coating: An In-Vitro Study. Materials 2020, 13, 3305. [Google Scholar] [CrossRef]
  33. Gad, M.M.; Fouda, S.M.; Abualsaud, R.; Alshahrani, F.A.; Al-Thobity, A.M.; Khan, S.Q.; Akhtar, S.; Ateeq, I.S.; Helal, M.A.; Al-Harbi, F.A. Strength and Surface Properties of a 3D-Printed Denture Base Polymer. J. Prosthodont. 2022, 31, 412–418. [Google Scholar] [CrossRef]
  34. Anderson, L.N.; Alsahafi, T.; Clark, W.A.; Felton, D.; Sulaiman, T.A. Evaluation of surface roughness of differently manufactured denture base materials. J. Prosthet. Dent. 2025, 133, 1586–1591. [Google Scholar] [CrossRef]
  35. Raszewski, Z.; Chojnacka, K.; Mikulewicz, M. Effects of Surface Preparation Methods on the Color Stability of 3D-Printed Dental Restorations. J. Funct. Biomater. 2023, 14, 257. [Google Scholar] [CrossRef]
  36. Hashemzade, Z.; Alihemmati, M.; Hakimaneh, S.M.R.; Shayegh, S.S.; Bafandeh, M.A.; Mohammadi, Z. Comparison of Color Stability and Surface Roughness of Interim Crowns Fabricated by Conventional, Milling and 3D Printing Methods. Clin. Exp. Dent. Res. 2025, 11, e70119. [Google Scholar] [CrossRef]
  37. Shim, J.S.; Kim, J.-E.; Jeong, S.H.; Choi, Y.J.; Ryu, J.J. Printing accuracy, mechanical properties, surface characteristics, and microbial adhesion of 3D-printed resins with various printing orientations. J. Prosthet. Dent. 2020, 124, 468–475. [Google Scholar] [CrossRef]
  38. AlGhamdi, M.A.; Fouda, S.M.; Al-Dulaijan, Y.A.; Khan, S.Q.; El Zayat, M.; Al Munif, R.; Albazroun, Z.; Amer, F.H.; Al Ammary, A.T.; Mahrous, A.A.; et al. Nanocomposite 3D printed resins containing titanium dioxide (TiO2) nanoparticles: An in vitro analysis of color, hardness, and surface roughness properties. Front. Dent. Med. 2025, 6, 1581461. [Google Scholar] [CrossRef]
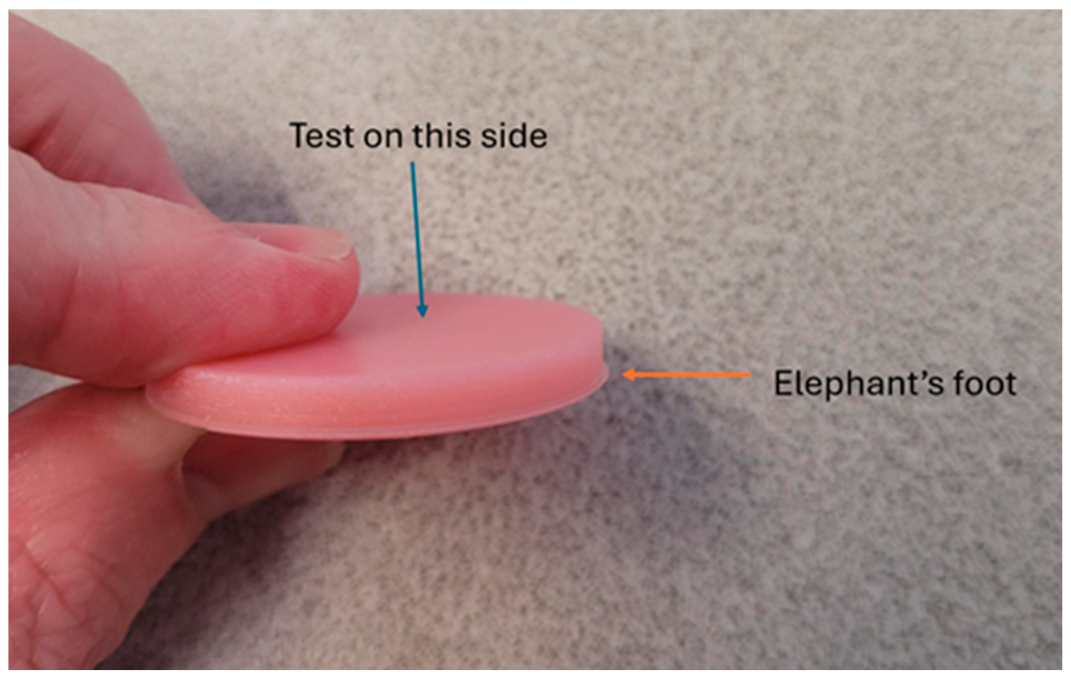
Figure 1. Printed specimen showing an “elephant’s foot” printing defect.
Materials 18 03683 g001
Figure 2. Scatterplot displaying the Surface roughness over time. Ra = 0.2 μm is the clinically acceptable limit, indicated by the dotted line.
Materials 18 03683 g002
Figure 3. Scatterplot displaying translucency parameter over time.
Materials 18 03683 g003
Figure 4. Scatterplot displaying the ΔE color difference over time. ΔE color difference of 3.7 is the clinically acceptable limit for color difference.
Materials 18 03683 g004
Figure 5. Scatterplot displaying the L*a*b* values over time.
Materials 18 03683 g005
Figure 6. Sample at T3, at 30× magnification, showing a non-porous surface.
Materials 18 03683 g006
Table 1. Descriptive statistics for surface roughness (Ra, µm), Translucency parameter, color difference (ΔEab), and CIE Lab* values (SCI Mode) **.
Descriptive StatisticsNMinimumMaximumMeanStd. Deviation
Surface Roughness (Ra, μm)110.4793.831.2640.995
Translucency Parameter111.2613.364.2423.439
ΔEab Color Difference11026.3219.6407.145
SCI L*1144.570.6963.6587.091
SCI a*1117.8120.9219.6460.840
SCI b*114.129.645.761.518
** Note: SCI L*, a* and b* values represent white-black, red-green, and yellow-blue color dimensions, respectively, as measured in specular component included (SCI) mode, using a reflectance spectrophotometer.
Table 2. Correlation to timepoint (Spearman’s rho).
Correlation to TimepointSpearman’s ρSignificance (2-Tailed)
Surface Roughness−0.7330.016 *
Translucency Parameter0.8060.005 *
ΔEab color shift−0.976<0.001 *
SCI L*−0.988<0.001 *
SCI a*−0.2610.467
SCI b*−0.875<0.001 *
* indicates statistical significance.
Table 3. Correlation to surface roughness (Spearman’s rho).
Correlation to RoughnessSpearman’s ρSignificance (2-Tailed)
Translucency Parameter−0.7270.011 *
ΔEab color shift0.7910.004 *
SCI L*0.7730.005 *
SCI a*0.0730.832
SCI b*0.4190.199 *
* indicates statistical significance.
Disclaimer/Publisher’s Note: The statements, opinions and data contained in all publications are solely those of the individual author(s) and contributor(s) and not of MDPI and/or the editor(s). MDPI and/or the editor(s) disclaim responsibility for any injury to people or property resulting from any ideas, methods, instructions or products referred to in the content.