Article

A First-Principles Modeling of the Elastic Properties and Generalized Stacking Fault Energy of Ir-W Solid Solution Alloys

1
School of Materials Science and Engineering, Hebei University of Technology, Tianjin 300401, China
2
Shanghai Advanced Research Institute, Chinese Academy of Sciences, Shanghai 201204, China
*
Authors to whom correspondence should be addressed.
Materials 2025, 18(15), 3629; https://doi.org/10.3390/ma18153629 (registering DOI)
Submission received: 30 June 2025 / Revised: 23 July 2025 / Accepted: 29 July 2025 / Published: 1 August 2025
(This article belongs to the Section Metals and Alloys)

Abstract

Iridium, with its excellent high-temperature chemical inertness, is a preferred cladding material for radioisotope batteries. However, its inherent room-temperature brittleness severely restricts its application. In this research, pure Ir and six Ir-W solid solutions (Ir31W1 to Ir26W6) were modeled. The effects of W on the elastic properties, generalized stacking fault energy, and bonding properties of Ir solid solution alloys were investigated by first-principles simulation, aiming to find a way to overcome the intrinsic brittleness of Ir. With the W concentration increasing from 0 to 18.75 at %, the calculated Cauchy pressure (C12C44) increases from −22 to 5 GPa, Pugh’s ratio (B/G) increases from 1.60 to 1.72, the intrinsic stacking fault energy reduces from 337.80 to 21.16 mJ/m2, and the unstable stacking fault energy reduces from 636.90 to 547.39 mJ/m2. According to these results, it is predicted that the addition of W improves the toughness of iridium alloys. The alloying of W weakens the covalency properties of the Ir-Ir bond (the ICOHP value increases from −0.8512 to −0.7923 eV). These phenomena result in a decrease in the energy barrier for grain slip.

1. Introduction

Iridium (Ir) exhibits a high melting point (2443 °C), excellent high-temperature chemical inertness [1], and good compatibility with PuO2 fuel and external graphitic components at about 1400 °C. Consequently, Ir alloys provide an optimal series of cladding materials for radioisotope batteries [2]. The nuclear fuel cladding of radioisotope thermoelectric generators (RTGs) is also expected to have good strength and toughness properties. This is to prevent nuclear fuel from leaking in the case of an impact with the Earth in the event of a launch failure [3]. However, Ir, unlike other face-centered cubic (FCC) metals (e.g., Cu, Ag, Au, etc.), exhibits inherent brittleness at room temperature (RT) [4]. It is reported that brittle transgranular fracture is the sole fracture mode of high-purity Ir at RT [4]. Research on the inherent brittleness of Ir and strategies to improve its toughness is a longstanding issue.
Doping and alloying efforts have been carried out to improve its mechanical strength and toughness [5,6,7,8]. It is reported that trace doping of Th and Ce (<30 ppm) significantly enhances the fracture toughness of Ir alloys [9]. This fact is closely related to the nanoscale ThIr5 and CeIr5 precipitates at grain boundaries. As early as the 1980s, the Oak Ridge National Laboratory in the United States had already developed DOP-26 (Ir-0.3W-0.006Th-0.005Al, wt%) with excellent mechanical properties and ductility [9,10]. DOP-26 has since become the cladding material of choice for NASA [11].
Theoretical calculations [12,13] suggested that the solid solutions of some elements (3.125 at %), such as Th, La, Ce, and Y, can significantly improve the toughness of Ir. However, the solubility of Th, La, Ce, and Y in Ir is extremely low. For example, the solubility of Th in Ir is about 30 ppm [10]. Though supersaturated solid solutions can be obtained with the rapid quenching technique, it is nearly impossible to improve their solubility in FCC Ir with traditional casting methods. Density functional theory (DFT) calculations suggest that W and Pt may improve the brittleness of Ir [12,13]. The early literature reported that the ductility of Ir alloys was slightly improved by alloying with 0.3% W [10]. Several experimental studies [14,15,16] on Ir-W-Al alloys suggested that alloying with W and Al can improve the high-temperature mechanical properties of iridium alloys. W is likely to be a preferred alloying element to improve the toughness of Ir. Improving the ductility of refractory high-entropy alloys (HEAs) is also a research hotspot because of their high strength and obvious brittleness [17]. It is reported that solid solution alloying [18], second-phase dissolution [19], compositional gradient design [20], valence electron concentration [21], and microstructure design can improve the toughness of HEAs. The primary purpose of this work is to investigate the effect of W solid solution alloying on the mechanical toughness of Ir-based alloys through DFT calculations. Hu et al. [22] predicted that the addition of V shortens the pseudo-energy gap and enhances the interaction force between Mo and W atoms in a NbMoTaW HEA by first-principles calculation. The addition of V improves the mechanical properties of the NbMoTaW HEA but does not improve the toughness.
The reported Pugh’s ratio (B/G) and Poisson’s ratio (ν) of pure Ir, with inherent brittleness, are about 1.61 and 0.24, respectively [23]. Elastic properties are closely related to the toughness of metal materials. When Pugh’s ratio is greater than 1.75 or Poisson’s ratio is greater than 0.26, the material is considered tough [24]. If they are below these values, the material is considered brittle.
The generalized stacking fault energy (GSFE), originally proposed by Vitek [25], is closely related to the slip and dislocation behavior. FCC metals generally exhibit high ductility, attributed to their close-packed atomic arrangement and 12 slip systems. The intrinsic stacking fault energy (γisf) of Ir (about 420 mJ/m2 [26]) is much higher than that of Cu (about 51 mJ/m2), Ag (about 21 mJ/m2 [27], and Au (about 33 mJ/m2 [26]), which have good ductility. These values are closely related to the deformation and plane sliding nature of those metals. Pugh’s ratio (B/G) and stacking fault energy (SFE) are always employed to predict or estimate the toughness evolution of a material after alloying [28,29,30]. Shang et al. [28] reported that alloying elements in diluted Ni-based alloys and increasing the temperature induce a decrease in the SFE, which is linked to easier shear deformation. Tian et al. [29] reported that alloying elements such as Cr and W in FCC Co-based binary alloys can tune the SFE to modulate dislocation behavior. A lower SFE facilitates the dissociation of full dislocations into Shockley partials. This dissociation hinders cross-slips, reduces creep rates, and thus contributes to enhanced ductility.
The Ir-W equilibrium phase diagram shows that W exhibits high solubility in Ir (~19 at.% above 1700 °C, 17.8 at.% at 1400 °C) [31]. Alloying with W may significantly improve the toughness of Ir without reducing the alloy strength. However, the effects of W on the elastic properties, stacking fault energy, and the bonding characteristics are still not exclusively reported. In the present work, Ir-W solid solutions (Ir31W1, Ir30W2, Ir29W3, Ir28W4, Ir27W5, and Ir26W6) cubic atomic models and eight-layer ABCABCAB stacking models were constructed. Their equilibrium lattice constants, formation energies, elastic properties, electronic structures, and GSFE were calculated using first-principles calculations. For the Ir-W solid solutions, the effects of W on lattice distortion and electronic charge distribution within the Ir matrix were analyzed. The elastic properties of three intermetallic compounds (Ir4W, Ir3W, and IrW) were also investigated for comparison. The evolution of Cauchy pressure (C12C44), Pugh’s ratio (B/G), GSFE, and bonding characteristics was discussed to predict the evolution of toughness. These findings will improve the understanding of why W enhances the toughness of Ir-based alloys.

2. Methodology

First-principles calculations were performed using the Vienna ab initio simulation package [32,33] (VASP) based on density functional theory [34] (DFT). The generalized gradient approximation (GGA) with the Perdew–Burke–Ernzerhof [35] (PBE) functional was employed to describe the electron–ion interaction. The electron configurations for Ir and W atoms are [Xe] 4f145d76s2 and [Xe] 4f145d46s2, respectively. The maximum plane-wave basis cutoff energy was 550 eV. The convergence criteria for the electronic and ionic steps were set to 1 × 10⁻⁶ eV/atom and 0.005 eV/Å. The k-point mesh was divided into 8 × 8 × 8 by the Monkhorst–Pack method for pure Ir and Ir-W solid solutions. The electronic density of states (DOS) was calculated using the linear tetrahedron method with Blöchl correction. All the calculations were carried out assuming a non-magnetic state. The crystal orbital Hamilton population (COHP) analysis was performed using the Local Orbital Basis Suite Towards Electronic-Structure Reconstruction (LOBSTER) procedure [36]. COHP partitions the electron density into bonding, non-bonding, and antibonding sections. Negative COHP values indicate bonding states, while positive COHP values indicate antibonding states [37,38,39,40].
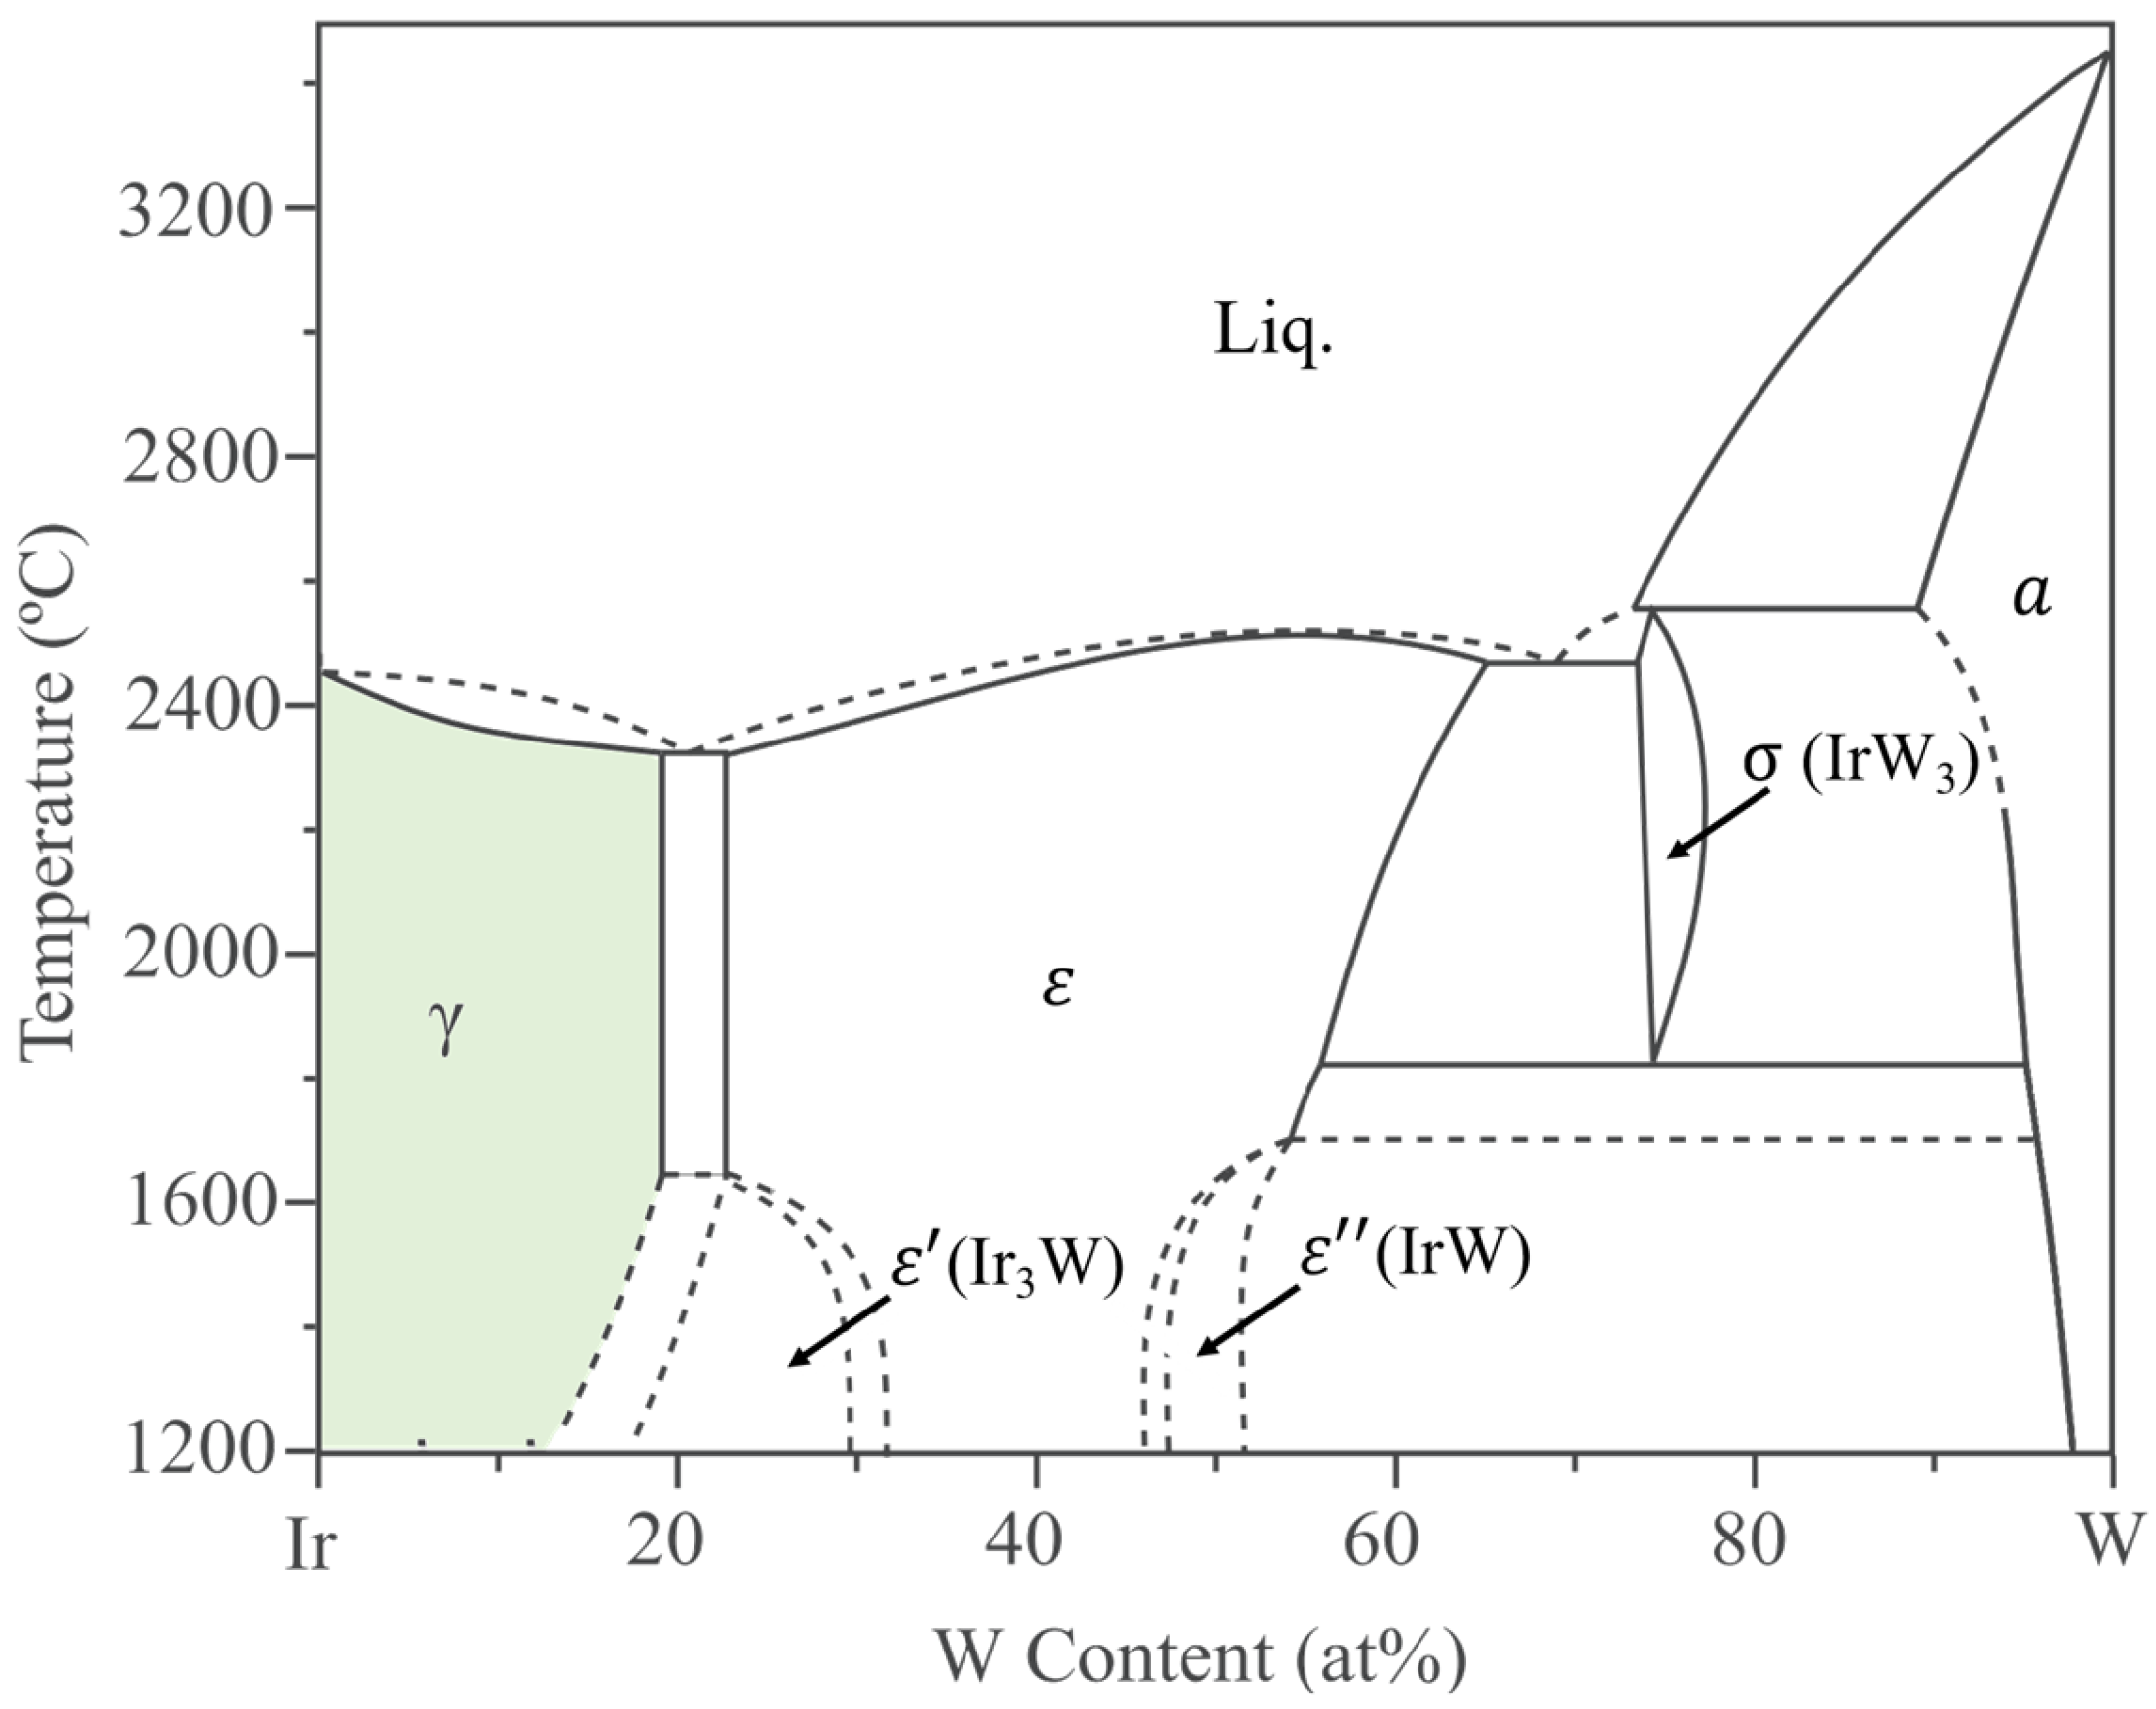
The present research focuses on polycrystalline Ir-W alloys by casting. According to the Ir-W binary phase diagram [31] (Figure 1), the γ-Ir solid solution (with space group Fm 3 ¯ m) has a solubility limit of approximately19 at.% W above 1700 °C.
Pure Ir and six Ir-W solid solutions (Ir31W1, Ir30W2, Ir29W3, Ir28W4, Ir27W5, and Ir26W6) with 2 ×   2 × 2 supercell models containing 32 atoms were constructed in this work. Within those solid solution supercells, Ir atoms were randomly replaced by W atoms. The special quasi-random structure (SQS) was established using the Alloy Theory Automation Toolkit [41,42,43] (ATAT) code. SQS simulates the random state of solute alloys by constructing supercells with special atomic positions that minimize the difference between their atomic correlation functions and that of the absolute random crystal cells. It is possible that the W is not uniformly distributed in a real alloy. There may be W-rich regions or W-regions in a real Ir-W alloy. The non-uniform distribution of W atoms in a real solid solution alloy was not addressed in the present research.
According to the Ir-W binary phase diagram [31] (Figure 1), there are high temperature phases (ε) with W content of 22~66 at.%, stable-phase Ir3W (ε′, with space group P63/mmc) and IrW (ε′′, with space group Pmma) on the Ir-rich side, and high-temperature-phase IrW3 (σ, with space group P42/mnm) on the W-rich side. Diffusion coupling experiments with EPMA confirmed there are γ, ε′, ε, and ε′′ phases on the Ir-rich side with an increase in W content at 1500 °C [15]. Above 1650 °C, there are γ phases and ε phases on the Ir-rich side, with a two-phase region (γ + ε) located at approximately 19~22 at % W. The structure of Ir4W (with space group R 3 ¯ m) was reported by the Materials Project database (mp-1223666) [44]; however, experimental studies on Ir4W are not reported. The 1 × 1 × 1 supercells of Ir4W, Ir3W, and IrW used in this work were derived from the Materials Project database [44]. For Ir4W, Ir3W, and IrW phases, the Brillouin zone was sampled with k-point meshes of 24 × 24 × 1, 12   ×   11   ×   11, and 11   ×   18   ×   10, respectively, generated by the Monkhorst–Pack scheme for geometry optimization and mechanical properties calculations. The high-temperature phases ε and σ (IrW
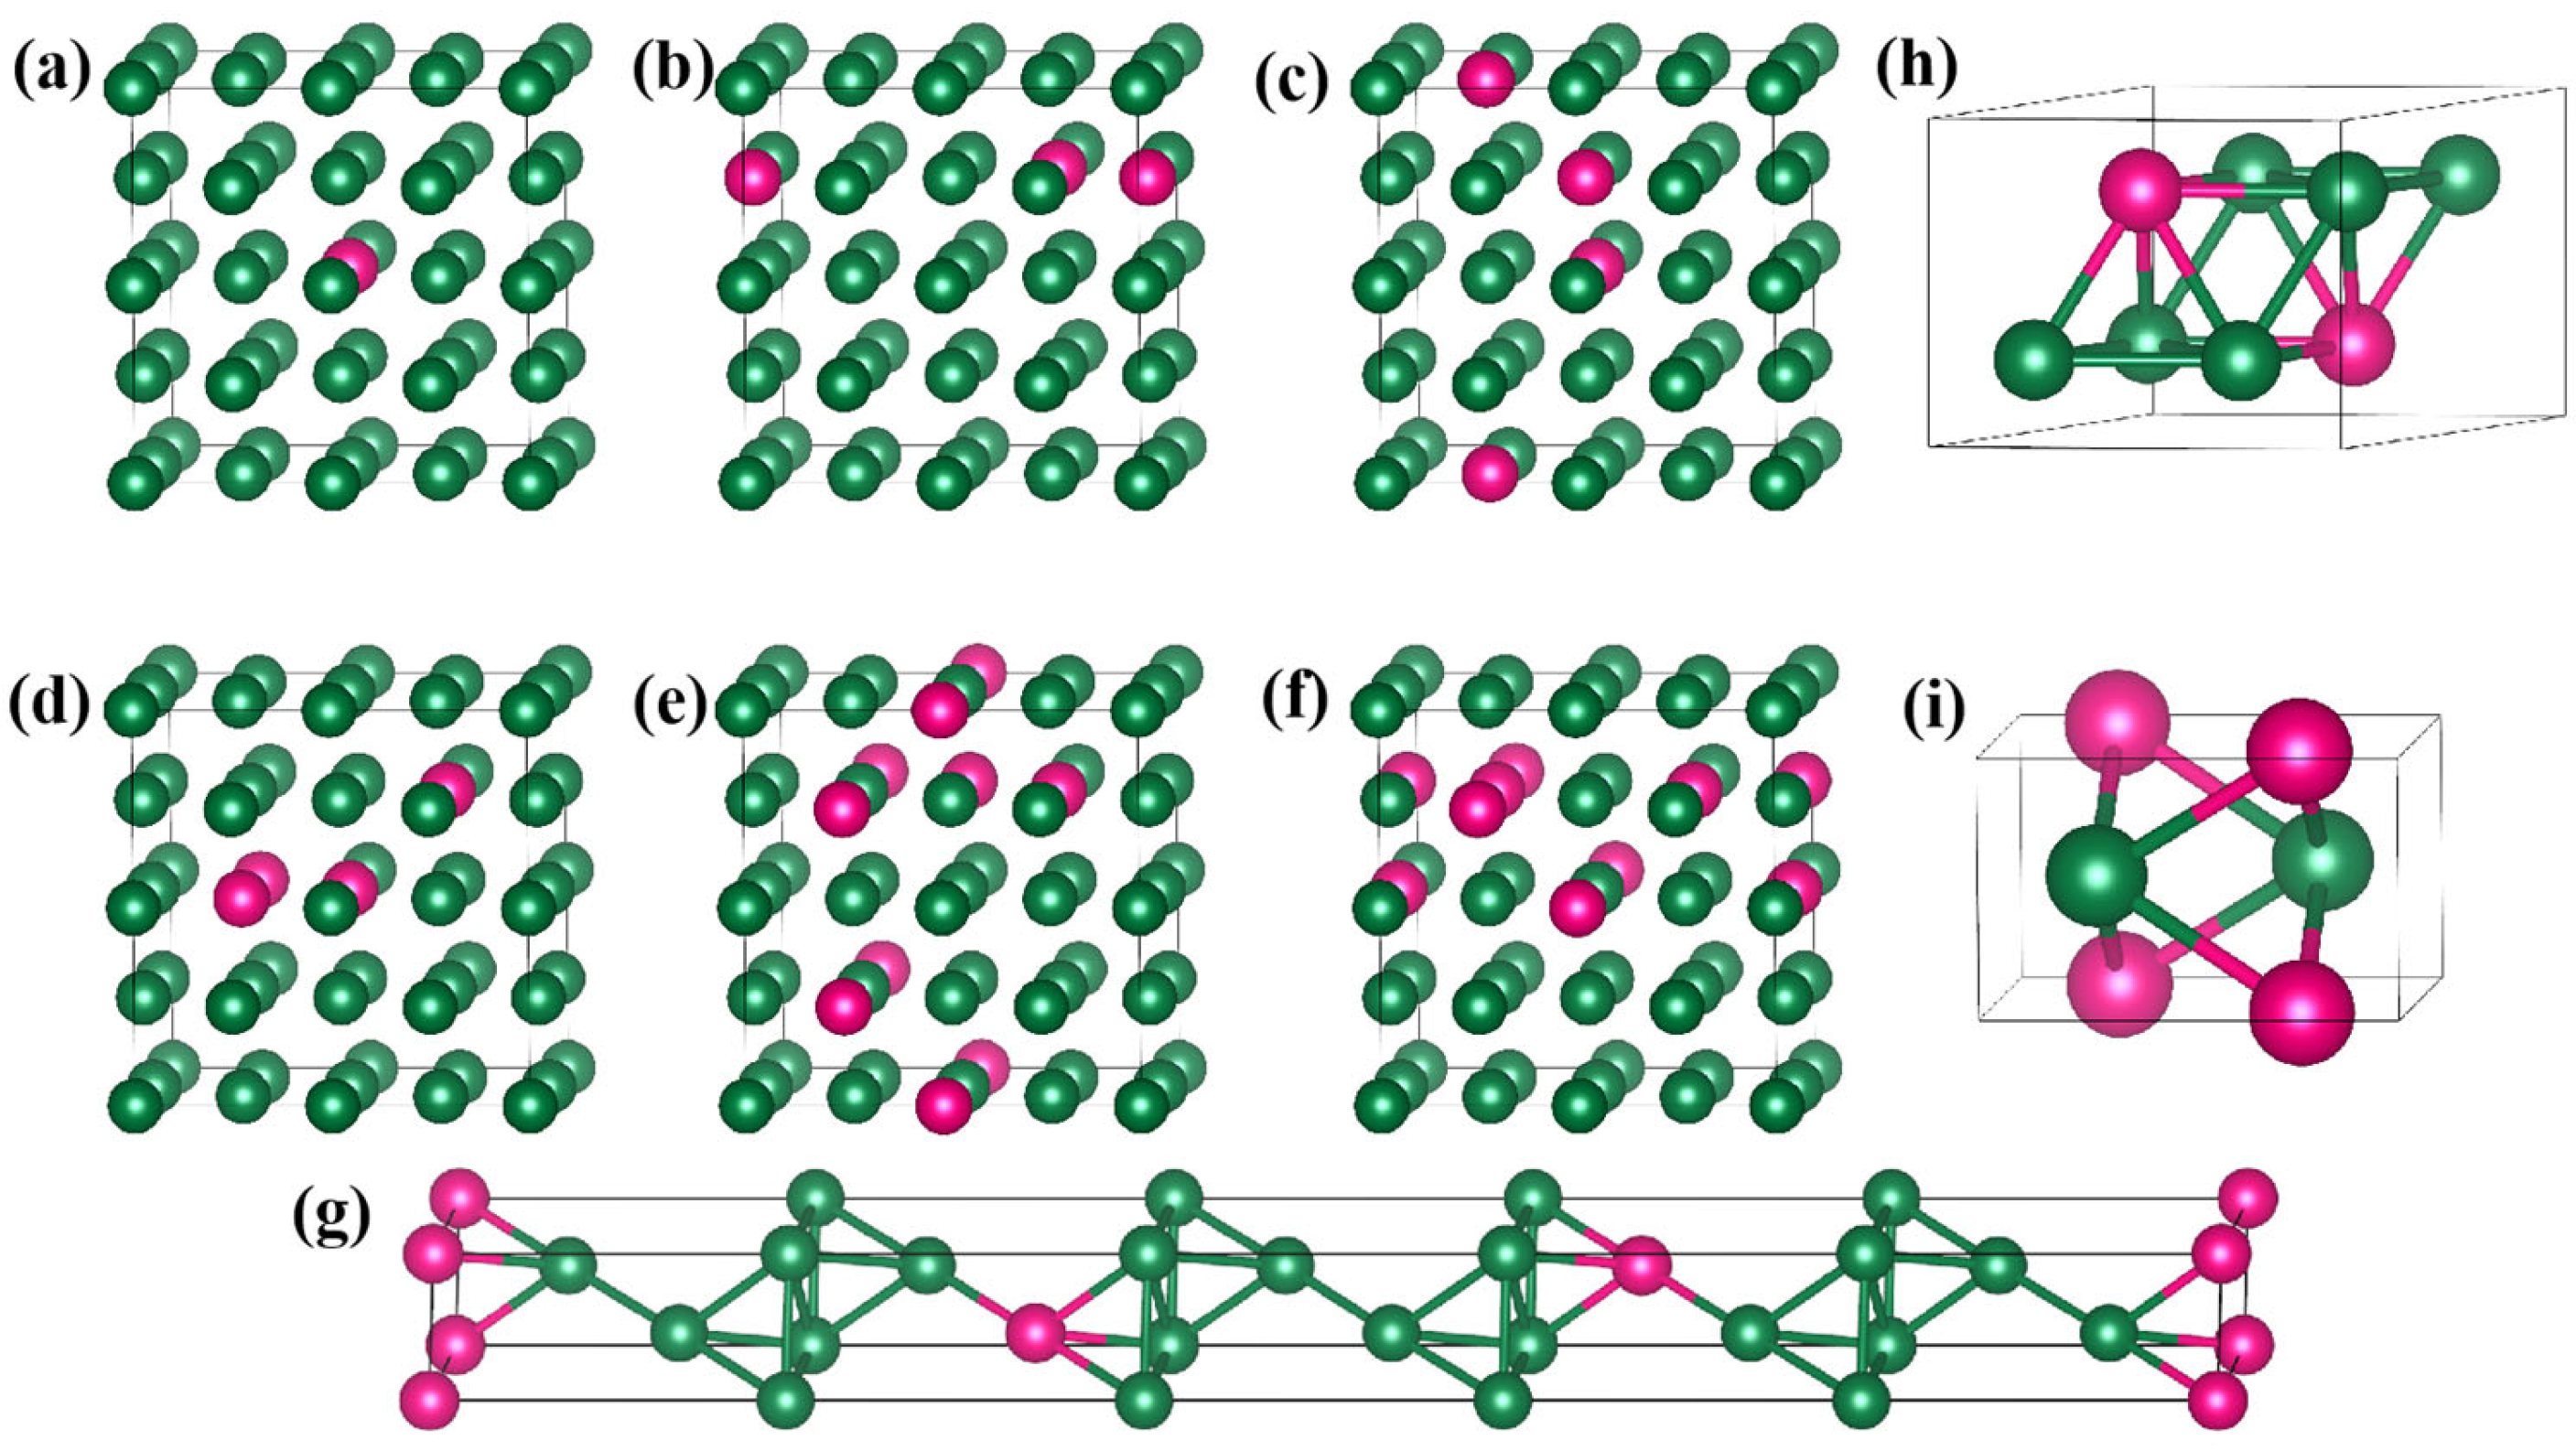
3) were not considered in this work. The details of the Ir-W alloy supercells are illustrated in Figure 2. The key DFT calculation parameters used in the modeling are compared in Table 1.

2.1. Calculation of Lattice Constant and Supercell Length

The Birch–Murnaghan equation of state (EOS) [45] was employed to fit the pressure–volume data points for pure Ir and Ir-W solid solutions to determine their equilibrium volumes. The EOS is expressed as follows:
P V = B 0 B 0 V 0 V B 0 1
where P V , V , V 0 , B 0 , a n d B 0 are the external pressure, volume, equilibrium volume, bulk modulus, and first derivative of bulk modulus to pressure, respectively. The zero-pressure volume V0 is defined as the equilibrium volume. The supercell length is calculated from V 0 3 . The lattice constant of pure Ir is half its supercell length. The lattice constants of Ir4W, Ir3W, and IrW were obtained by the structural relaxation method in VASP with the GGA-PBE functional.

2.2. Calculation of Formation Energy

The formation energy of Ir-W alloy,   Δ E I r x W y , was calculated by the following equation [46]:
Δ E I r x W y = E t o t a l I r x W y x E a t o m I r y E a t o m W x + y
where E t o t a l I r x W y is total energy of the Ir-W alloy supercell. E a t o m I r   and E a t o m ( W ) are the energy of individual atoms of the FCC structure Ir and BCC structure W, respectively. x and y are the number of Ir and W atoms, respectively.

2.3. Calculation of Elastic Properties

The elastic properties were calculated by the stress–strain method [47]. The bulk modulus (B) and shear modulus (G) were obtained by the Voigt–Reuss–Hill approach [48]. For FCC structure alloys,
B v = B R = C 11 + 2 C 12 3
G v = C 11 C 12 + 3 C 44 5
G R = 5 C 11 C 12 C 44 4 C 44 + 3 ( C 11 C 12 )
where B v , B R , G v , and G R are the bulk and shear modulus from Voigt and Reuss models, respectively.
For the FCC system, the elastic constants follow the relationship C11 = C22 = C33, C44 = C55 = C66, C12 = C23 = C13, exhibiting three independent components, namely C11, C12, and C44. However, the addition of W, for example, in Ir31W1, Ir30W2, Ir29W3, Ir28W4, Ir27W5, and Ir26W6, slightly distorts the FCC symmetry of the supercell, resulting in minor differences between these parameters, e.g., C11, C22, and C33. The elastic constants were averaged according to Formulas (6)–(8), and the elastic moduli were subsequently calculated using Formulas (3)–(5).
C 11 ¯ = 1 3 C 11 + C 22 + C 33
C 12 ¯ = 1 3 C 12 + C 23 + C 13
C 44 ¯ = 1 3 C 44 + C 55 + C 66
Formulas for calculating the elastic modulus of trigonal (Ir4W), hexagonal (Ir3W), and orthorhombic (IrW) structured alloys can be found in [49]. The bulk modulus (B) and shear modulus (G) were calculated using the Hill approximation, which is represented by the following formulas [48].
B = B V + B R 2
G = G V + G R 2
The Young’s modulus (E) and Poisson’s ratio ( v ) were derived from B and G.
E = 9 B G 3 B + G
v = 3 B 2 G 6 B + 2 G

2.4. Calculation of Generalized Stacking Fault Energy

The specific formula for calculating GSFE is as follows [50]:
γ ( d ) = E ( d ) E 0 A
where E ( d ) is the energy of the crystal after deformation with a slip displacement d, E0 is the energy of the stacked configuration without slipping, and A is the area of the face defect region.
The close-packed (111) plane was employed as the slipping plane in this work. Supercell models with an 8-layer ABCABCAB stacking sequence, containing 128 atoms, were constructed by cutting along the [ 1 ¯ 1 ¯ 0 ] and [11 2 ¯ ] directions, with a 15 Å vacuum layer along the [111] direction. The supercell top view is shown in Figure 3a. In the FCC Ir structure, full dislocations b1 dissociate into partial dislocations (b2, b3). The slip path for the GSFE calculation was along the [11 2 ¯ ] direction, denoted as b2. The [ 1 ¯ 1 ¯ 0 ] direction view of the supercell without slipping is shown in Figure 3b.
Pure Ir and six Ir-W solid solutions (Ir31W1, Ir30W2, Ir29W3, Ir28W4, Ir27W5, and Ir26W6) with 2 × 2 × 2 supercell models containing 32 atoms were constructed in this work. For these solid solution supercells, Ir atoms were randomly replaced by W atoms. SQS simulates the random state of solute alloys by constructing supercells with special atomic positions, minimizing the difference between their atomic correlation functions and those of absolutely random crystal cells. It is possible that the W is not uniformly distributed in a real alloy. There may be W-rich regions or W-regions in a real Ir-W alloy. The non-uniform distribution of W atoms in a real solid solution alloy was not considered in the present research.
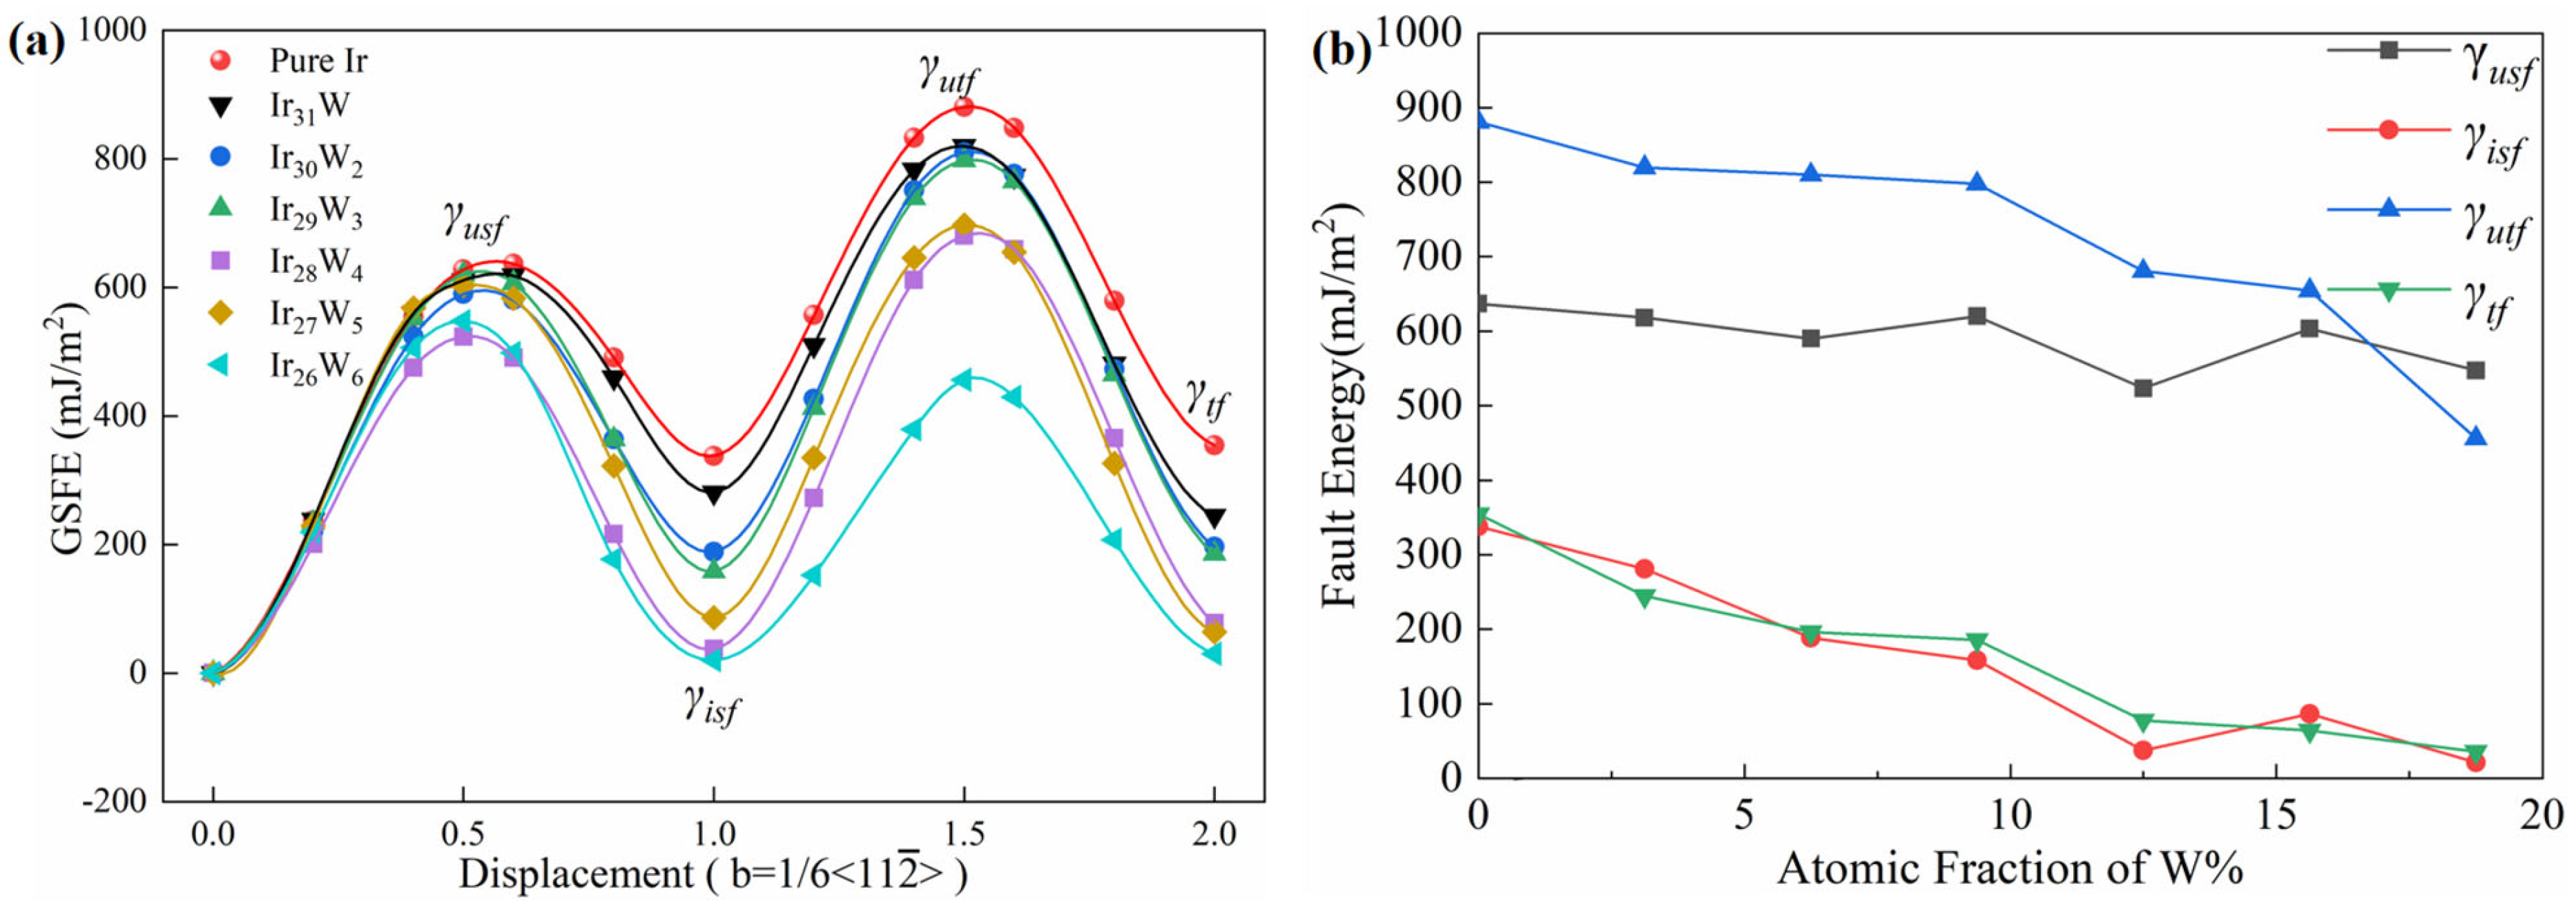
For the GSFE calculations, the total slip displacement (b = a/6 <11 2 ¯ >) along the (111) plane was divided into ten equal increments of 0.1b each. The crystal energies E ( d ) at various slip displacements (0.2b, 0.4b, 0.5b, 0.6b, 0.8b, 1.0b, 1.2b, 1.4b, 1.5b, 1.6b, 1.8b, and 2.0b) were calculated, and the generalized stacking fault energies γ ( d ) of the supercell model in different configurations were derived using Formula (13). All atoms were allowed to relax only in the direction perpendicular to the slip surface for structural optimization after each slip. The maximum plane-wave basis cutoff energy was set to 450 eV for calculating GSFE. The convergence criteria for electronic and ionic steps were set to 1 × 10⁻⁵ eV/atom and 0.01 eV/Å, respectively. The k-point mesh was divided into 4   ×   4   ×   1 using the Monkhorst–Pack method.

3. Results

3.1. Lattice Constant and Supercell Length

The calculated lattice constants of pure Ir, Ir4W, Ir3W, and IrW and supercell lengths for Ir-W solid solution 2 × 2 × 2 supercells, along with previously reported computational and experimental values, are compared in Table 2.
The calculated lattice constant of pure Ir, with space group Fm 3 ¯ m, is 3.873 Å, being in agreement with the reported experimental results of 3.819 Å [51] and 3.840 Å [52] and the computational values [12,13,23,53,54], see Table 2. The lattice parameters of Ir4W, with space group R 3 ¯ m (a = 2.751 Å, c = 33.850 Å), are consistent with the reported values from the Materials Project database (www.materialsproject.org, ID: mp-1223666, accessed on 13 June 2024) [44]. The computed lattice constants of Ir3W (ε′), with space group P63/mmc (a = 5.540 Å, c = 4.421 Å), and IrW (ε′′), with space group Pmma (a = 4.473 Å, b = 2.779 Å, c = 4.848 Å), are also in agreement with the reported computational [46] and experimental data [55]. The supercell length of an Ir 2   ×   2   ×   2 supercell (7.746 Å) is twice that of the lattice constant. The supercell length of Ir-W solid solution 2   ×   2   ×   2 supercells increases linearly with increasing W concentration. When the concentration of W reaches 18.75 at % (Ir26W6), the supercell length of Ir26W6 reaches 7.788 Å (see Table 2). These parameters reach a linear fit of L = 7.74461 + 0.22514x, with adjusted R2 = 0.99535. Here, L is the supercell length of Ir-W solid solution 2   ×   2   ×   2 supercells, x is the W concentration. The mean Ir-Ir bond lengths in Ir-W alloys increased with increasing W content (see Table 2). These phenomena may arise from the larger atomic radius of W (1.41 Å) compared to that of Ir (1.36 Å) [56]. These converged lattice constants and supercell lengths were used as initial geometric parameters for subsequent calculations, e.g., formation energy, elastic properties, stacking fault energy, and electronic structure.

3.2. Formation Energy

The formation energies of the Ir-W solid solutions and Ir4W, Ir3W, and IrW compounds are shown in Figure 4. The calculated formation energies of Ir3W and IrW (−0.353 eV/atom and −0.305 eV/atom) are consistent with the results of previous studies [55]. The formation energies of the solid solutions and Ir4W (−0.058 eV/atom) are all negative, but above the dashed line connecting Ir and Ir3W, indicating that they are metastable relative to Ir3W at zero temperature. This fact indicates that Ir3W is likely to precipitate after appropriate heat treatment, even with low W concentrations. For example, according to the Ir-W phase diagram, when Ir26W6 is annealed at 1200 °C, the Ir3W phase will precipitate from Ir26W6 solid solution. It is strongly suggested that the IrW compound will not precipitate in the Ir-W solid solution. Formation energy of Ir4W (with space group R 3 ¯ m) is much less negative than that of Ir26W6 and Ir3W. This finding does not support Ir4W being a stable phase. The structure of Ir4W (with space group R 3 ¯ m) was obtained from the Materials Project database (mp-1223666) [44]. There are still no experimental reports about Ir4W. To find out whether it is a metastable phase, further research on the Ir4W phase is needed.

3.3. Elastic Properties

The elastic constants of Ir, as well as Ir-W alloys, are presented in Table 3 together with the previously reported calculated values for comparison.
The elastic constants C11 and C44 of Ir-W solid solution alloys decrease significantly with increasing W content, while C12 keeps nearly constant (see Figure 5a–c). These behaviors result in an increase of the Cauchy pressure (C12C44), from −22 GPa to 5 GPa, as shown in Figure 5d. The Cauchy pressure has also been employed to discuss the ductility of materials by Pettifor [59]. A positive value of C12C44 indicates good toughness, whereas a negative value indicates brittleness [60]. The increasing nature of C12C44 with increasing W concentration suggests that the toughness of the Ir-W solid solutions is improved.
Table 4 presents the calculated elastic modulus, Pugh’s ratio (B/G), and Poisson’s ratio v of pure Ir and Ir-W alloys, together with the previously reported values for comparison. For the Ir-W solid solutions, the B/G ratio increases from 1.60 to 1.72 monotonously with increasing W concentration. ν increases from 0.241 to 0.257.
Figure 6a–c depict the elastic modulus (B, G, and E) of Ir-W alloy as a function of W content. The B, G, and E decrease with increasing W content within the Ir-W solid solution range. Figure 6d illustrates the evolution of the B/G ratio as a function of W content. The B/G ratio is commonly used to assess the toughness and brittleness of materials and exhibits a positive correlation with toughness [60,62,63]. As mentioned above, when the B/G ratio is greater than 1.75 or Poisson’s ratio is greater than 0.26, the material is considered tough [24,64] and vice versa. The increasing Cauchy pressure (C12C44), B/G ratio, and Poisson’s ratio indicate that the incorporation of W atoms improves the toughness of Ir-W alloys.
The B/G ratios of intermetallics, i.e., Ir4W, Ir3W, and IrW, are larger than the critical value of 1.75 and larger than those of pure Ir and the Ir-W solid solutions. This fact indicates that these compounds may be tough and that they are tougher than pure Ir and Ir-W solid solutions. It is expected that the Ir4W or Ir3W phase will not deteriorate the toughness of the Ir alloy when they precipitate in the Ir-W solid solution alloy after appropriate heat treatment. The addition of W atoms is expected to weaken the Ir-Ir bond, leading to a decrease in elastic modulus. Further analysis of the electronic structure is stated in Section 3.5.

3.4. Generalized Stacking Fault Energy

Figure 7a depicts the GSFE curves of pure Ir and Ir-W solid solutions. The GSFE curves characterize the energy variation during atomic displacement on the slip plane. The unstable SFE (γusf) is at 0.5b, and the intrinsic SFE is at 1.0b. The former is always considered as the energy barrier for the formation of intrinsic stacking faults. The unstable TFE (γutf) and TFE (γtf) are defined at slip displacements of 1.5b and 2.0b, respectively. The γutf represents the minimum energy required for twinning dislocations to nucleate in a perfect crystal. The evolutions of the γisf, γusf, γtf, and γutf as a function of W concentration are depicted in Figure 7b. It is noticeable that γusf, γisf, γutf, and γtf of Ir-W solid solutions decrease with an increasing W concentration.
Table 5 presents the calculated γusf, γisf, γutf, and γtf of pure Ir and Ir-W solid solution alloys, together with the known calculated and experimental values for comparison. The intrinsic SFE (γisf) of pure Ir and Ir31W was 337.80 mJ/m2 and 280.97 mJ/m2, respectively, being in good agreement with the results of Xu et al. [65] (pure Ir: 349.00 mJ/m2; Ir31W: 277 mJ/m2). The calculated intrinsic SFE of pure Ir is about 20% lower than the experimental one (420 mJ/m2) [26]. The calculated γusf and γisf of Ir are in agreement with the previous research [66,67,68].
SFE studies on Ni, Co, and Mg suggest that the reduction of SFE results in an improvement of these materials’ toughness [28,29,30]. The reduction of unstable SFE is probably related to the lowering of the slip energy barrier [69]. Though the deformation mechanism of Ir is still not well understood, it is reasonable to predict that the reduction of unstable SFE will make slip easier, which results in the improvement in plastic deformation capacity of Ir.
The GSFE is also used to evaluate the twinning propensity. The high unstable TFE γutf of Ir, about 880.83 mJ/m2, in the [11 2 ¯ ] direction hinders mechanical twinning formation. Tadmor et al. [67] proposed a theoretical model based on dislocation nucleation from crack tips, defining the twinning propensity parameter as a function of γisf, γusf, and γutf,
τ a = 1.136 0.151 γ i s f γ u s f γ u s f γ u t f
A larger τa indicates a higher propensity for twinning. Asaro et al. [70] proposed another twinning propensity parameter based on the heterogeneous nucleation mechanism of Shockley dislocations at grain boundaries,
T = 3   γ u s f 2   γ i s f γ u t f
A larger T value signifies easier twinning formation at grain boundaries. Cai et al. [66] proposed intrinsic twinning propensity η for FCC metals based on the homogeneous nucleation mechanism of Shockley dislocations,
η = γ u s f γ i s f γ u t f γ i s f
Table 6 presents the calculated results of the three twinning propensity parameters (τa, T, and η) for Ir and Ir-W solid solutions. With increases in W content, the values of the three twinning criteria consistently increase, suggesting that the addition of W facilitates the heterogeneous nucleation of twins from crack tips and grain boundaries, as well as homogeneous nucleation within grains, thus enhancing the twinning propensity of Ir.

3.5. Electronic Structure Analysis

The electronic density of states (DOS) of pure Ir and Ir-W solid solution alloys is presented in Figure 8. Panels (a), (b), and (c) show the s-, p-, d-orbital partial DOS for pure Ir and Ir atoms bonded with W in Ir30W2, Ir28W4, and Ir26W6. Panels (d), (e), and (f) are those at W sites in Ir30W2, Ir28W4, and Ir26W6. The Fermi level is at 0 eV.
Those Ir-Ir and Ir-W bonds exhibit metallic behavior owing to the absence of a bandgap of density of states near the Fermi level. The d-orbital DOSs of Ir and W are significantly higher than those of s- and p-orbitals, indicating that Ir-Ir and Ir-W bonds are mainly contributed by the d-orbital electrons. As the W content increases, all curves shift towards the positive direction, and the valleys in the d-DOS of Ir near −2.5 eV and −0.6 eV become shallower. The evolution of the valley depth partly reflects changes in the covalent properties of the metallic bonds. The covalent nature of Ir-Ir bonds is weakened with increasing W concentration.
Figure 9a presents the averaged total DOS of Ir and Ir atoms in Ir30W2, Ir28W4, and Ir26W6. As W content increases, the total DOS of Ir shifts toward the positive energy direction which suggests more overlap between bonding and antibonding states. Figure 9b presents the COHP curves of Ir-Ir atom pairs of Ir, Ir30W2, Ir28W4, and Ir26W6. The positive COHP (right) region of COHP plots is mainly contributed by bonding states, and the negative COHP (left) region is mainly contributed by the antibonding states. The integral COHP (ICOHP) value, with integrates COHP from the far negative to the Fermi level, is closely related to bond strength. The more negative the ICOHP value is, the stronger the bond is [36,37]. The ICOHP values for Ir-Ir bonds in pure Ir and Ir30W2, Ir28W4, and Ir26W6 are −0.8512 eV, −0.8355 eV, −0.8139 eV, and −0.7923 eV, respectively. ICOHP of pure Ir is the most negative one. This fact indicates the Ir-Ir bonds in pure Ir are stronger than those in the solid solutions. The absolute value of ICOHP decreases with increasing W content, which indicates that Ir-Ir bond strength is weakened.
Figure 10a,b show the calculated charge density distributions on the (010) plane for pure Ir and Ir26W6. The selected (010) plane contains only Ir atoms. The charge density contour lines for Figure 10a,b are plotted from 0.02 to 0.4 eV/Å3 with a 0.0008 eV/Å3 intervals. Figure 10d,e are enlarged views of regions (I, II) in Figure 10a,b. The charge densities between the neighboring Ir-Ir atoms in the middle region, shown in Figure 10d,e, are approximately 0.0615 eV/Å3 for pure Ir and 0.0592 eV/Å3 for Ir26W6, respectively. This fact indicates that fewer electrons are shared by neighboring Ir-Ir atomic pairs with W addition. The charge density of the Ir26W6, subtracting that of pure Ir, namely charge density difference, is shown in Figure 10c. Figure 10f is an enlarged view of region (III) in Figure 10c, and the black lines are the zero-charge density contours. It is noticeable that most regions between the neighboring Ir-Ir atomic pairs are green with negative values in Figure 10c,f. This is direct evidence of the reduction of shared electrons between neighboring Ir-Ir atomic pairs by W alloying.

4. Discussion

Ir, unlike other metallic elements of the FCC structure, exhibits inherent brittleness at RT. Kontsevoi et al. [71] suggested the brittleness of Ir is a result of the pseudo-covalent bond features of Ir-Ir bonds. Cawkwell et al. [72] suggested that there are two core screw dislocations in iridium, a glissile planar core and a metastable non-planar core. The athermal transformation between the two core structures leads to exceptionally high rates of cross-slip during plastic deformation, associated with an exponential increase in the dislocation density. Cawkwell et al. [72] reported that the mechanism of thermal cross-slip is because of the mixed metallic and covalent interatomic bonding. Kontsevoi et al. [71] suggested the effective way to increase plasticity of Ir-based alloy is to decrease the covalent contribution to chemical bonding by alloying methods.
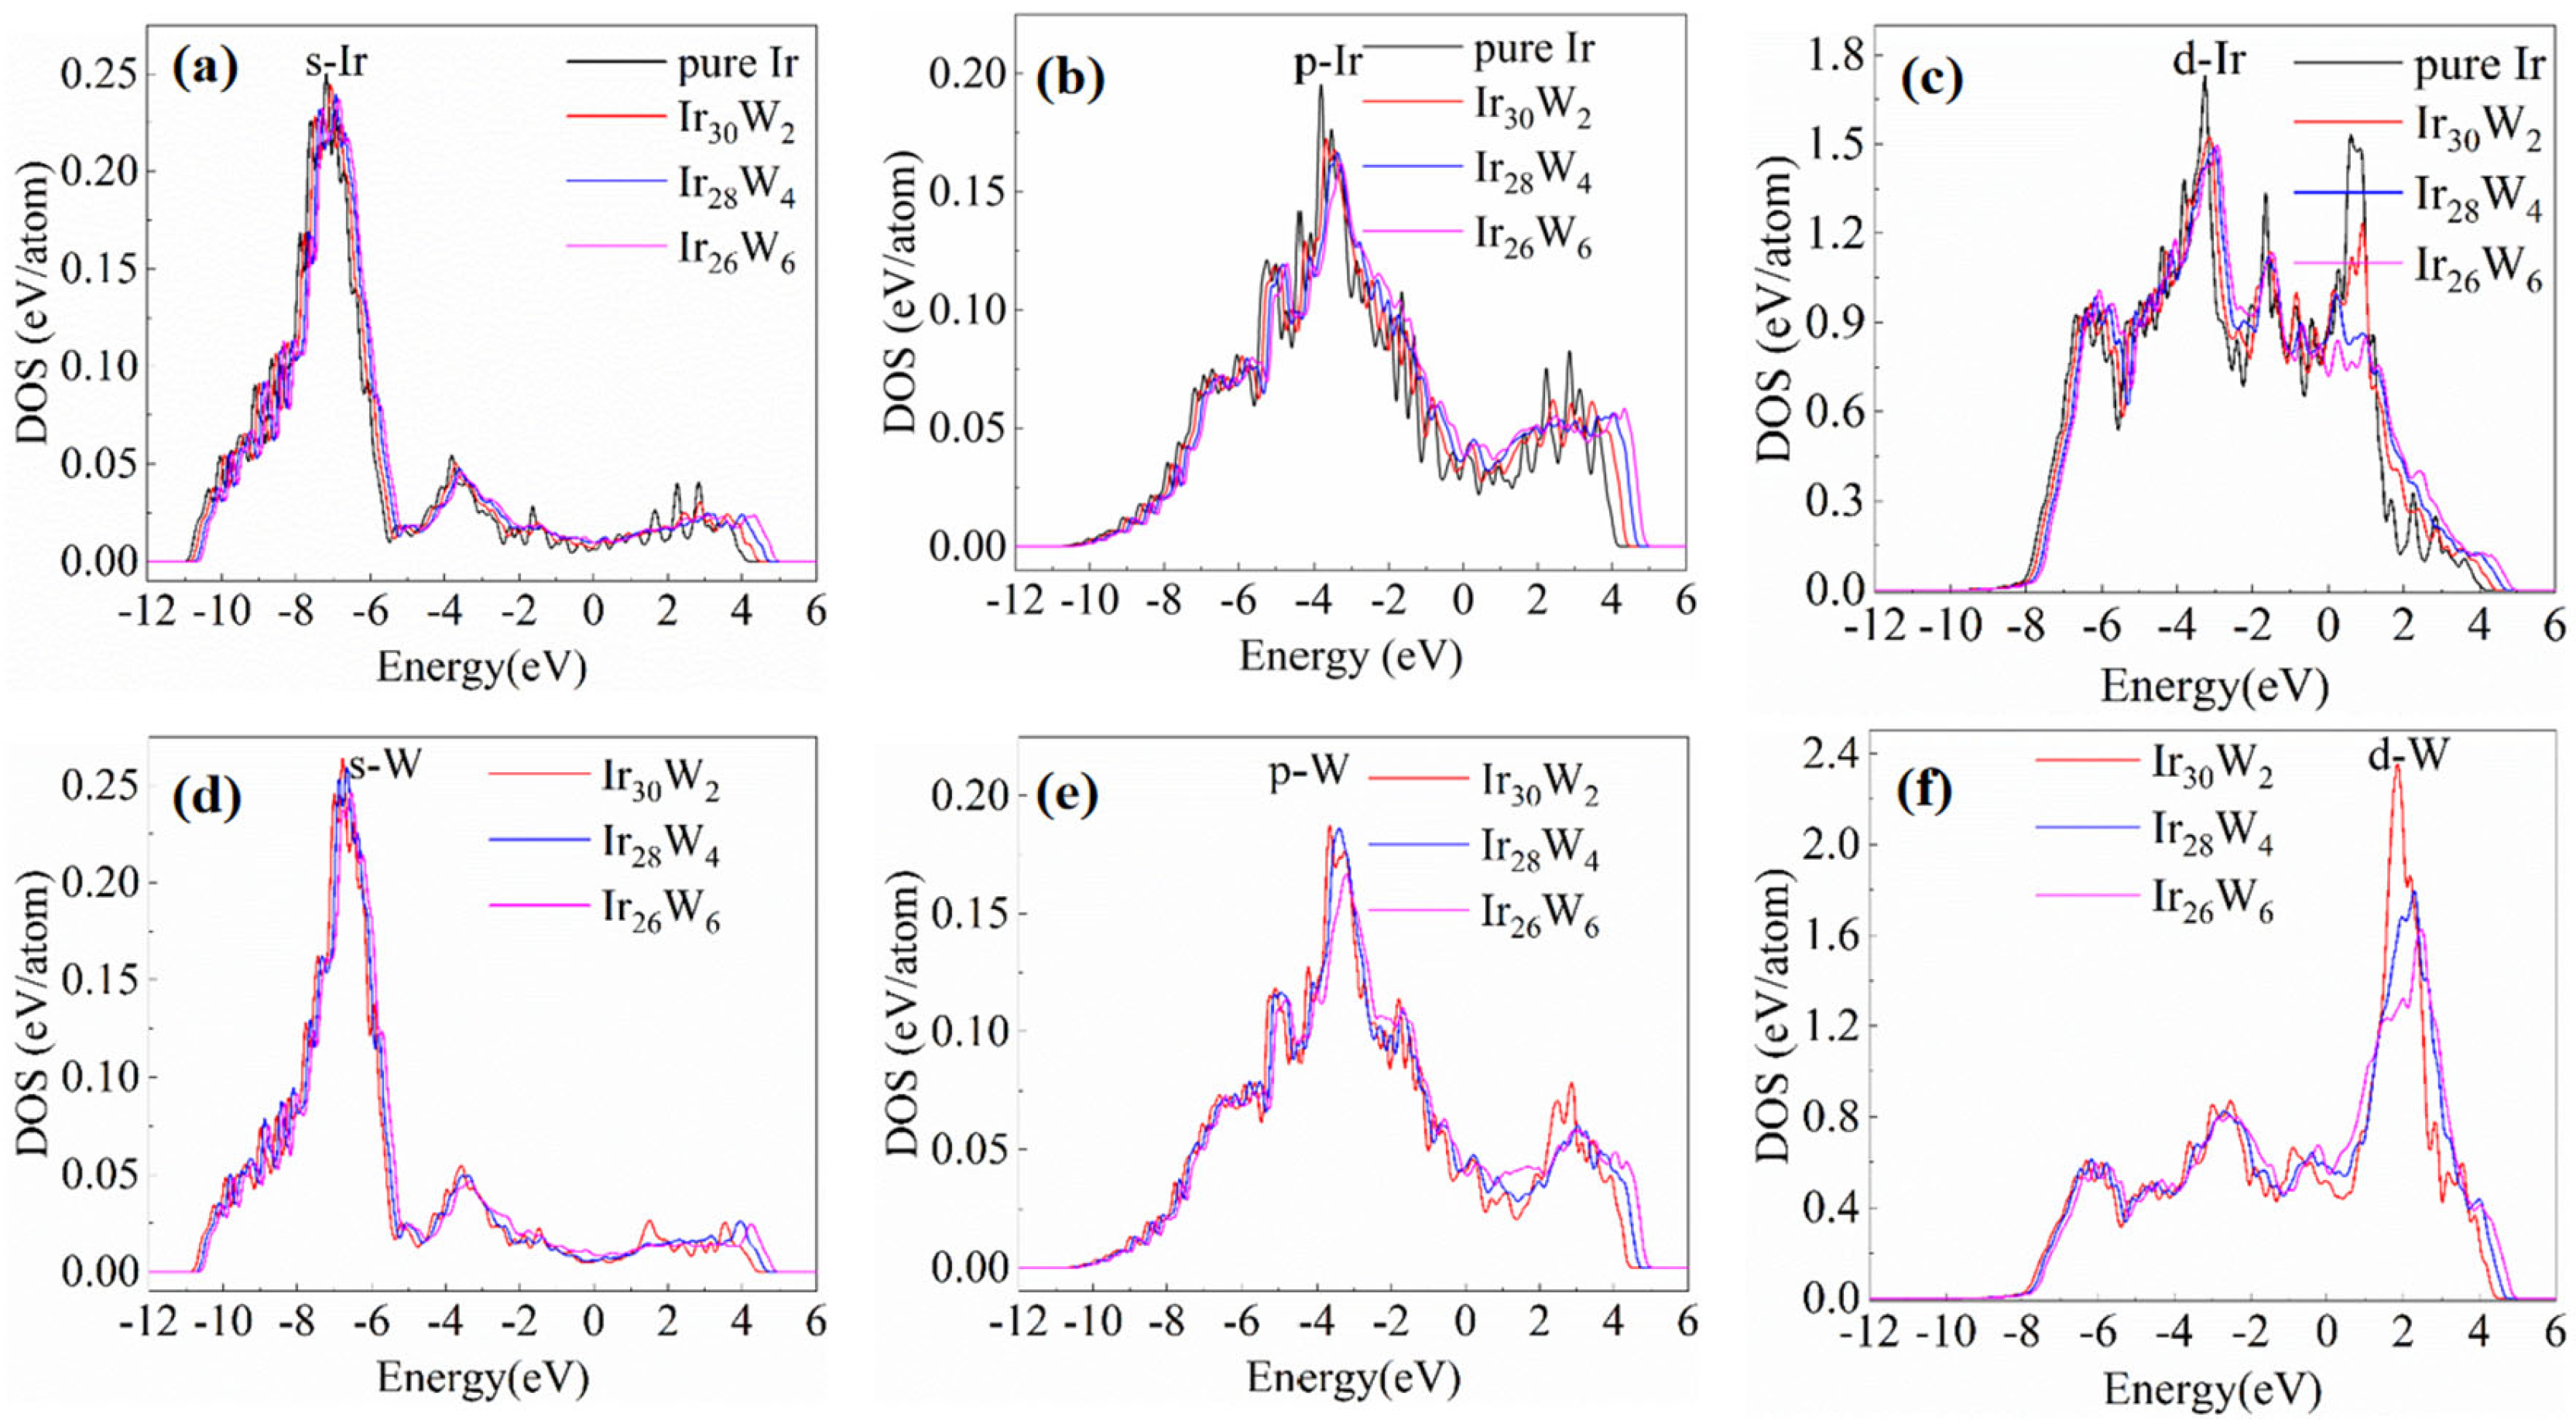
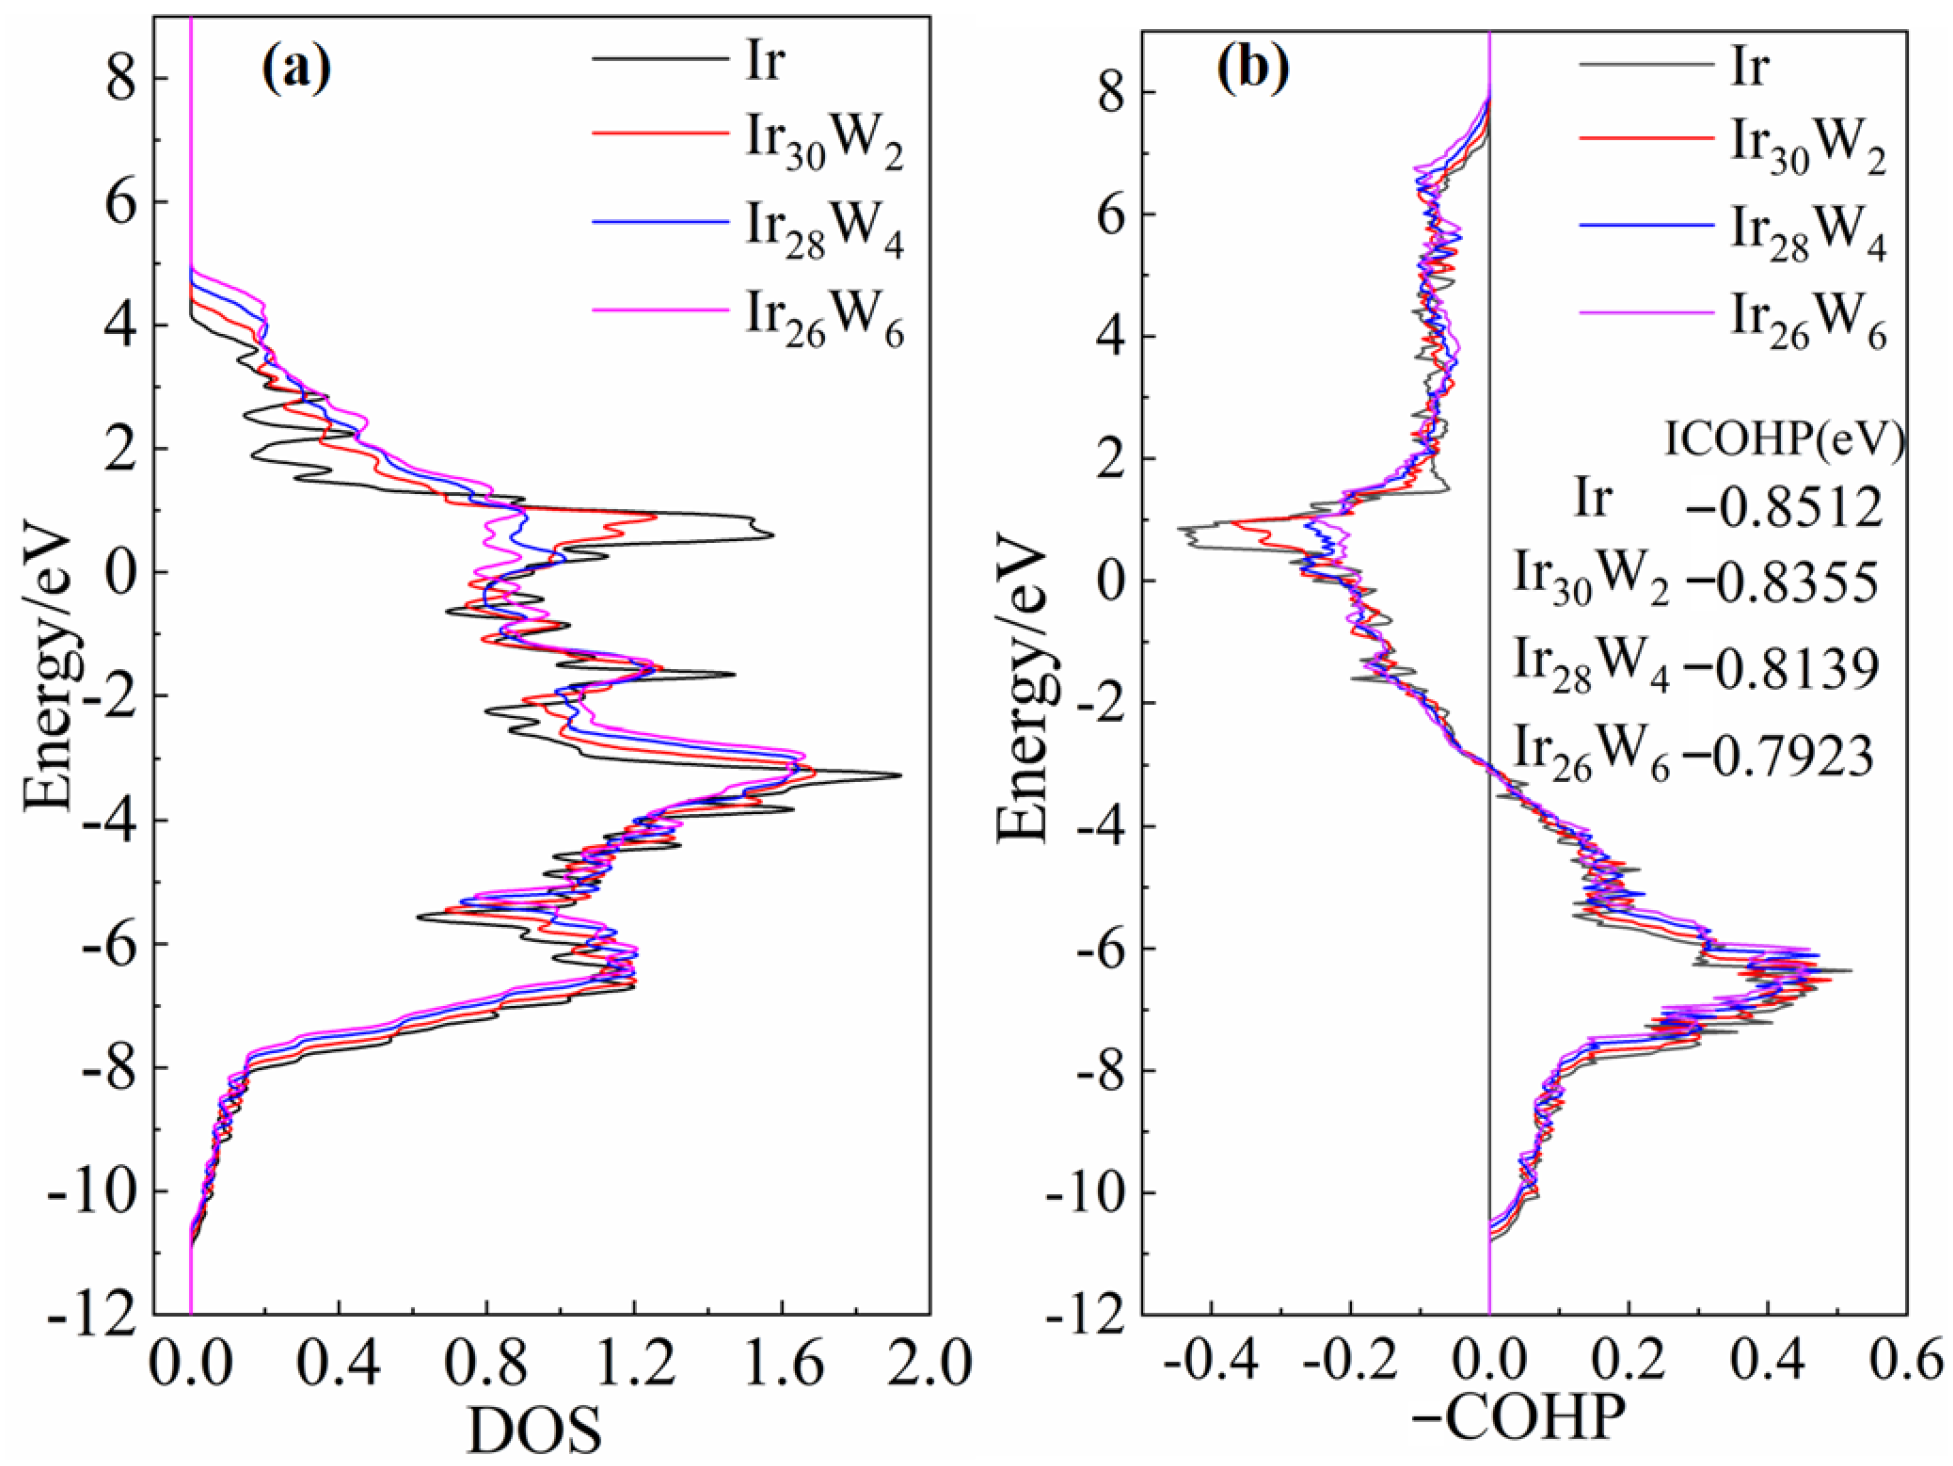
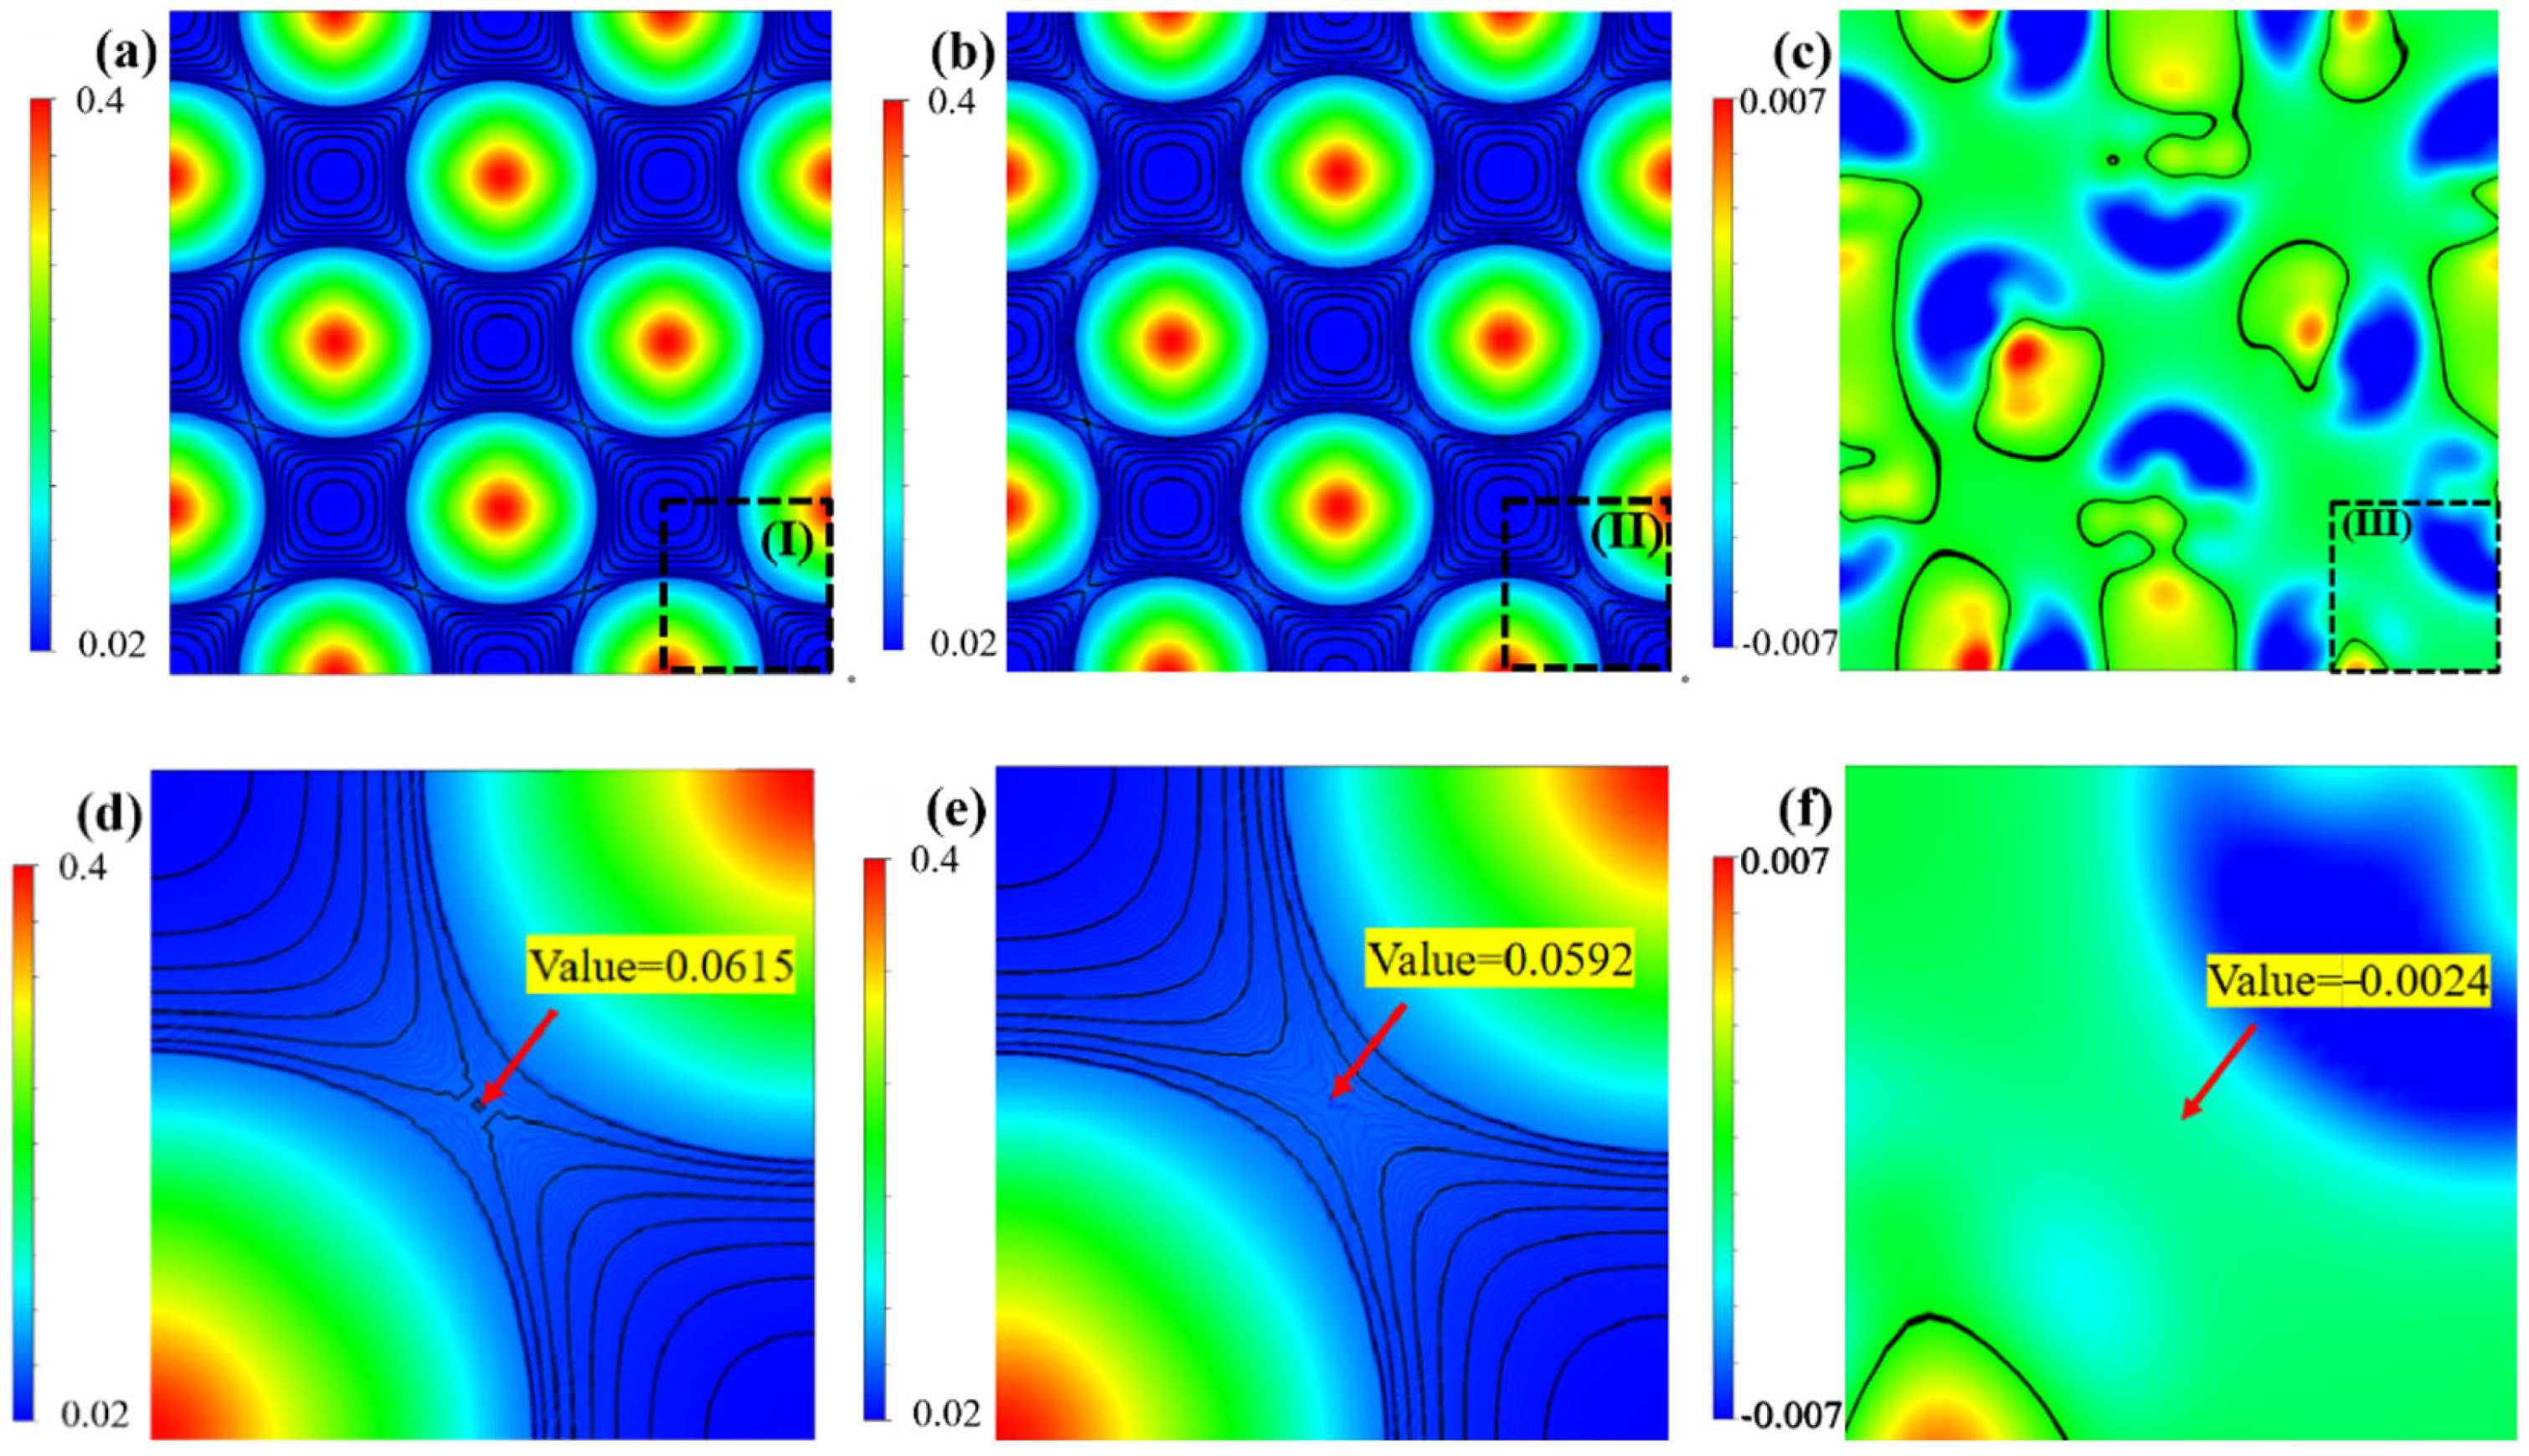
The above DOS and COHP analyses evidence that the chemical bond of Ir-Ir is a combining of metallic and covalent natures. The charge density analyses evidence that the density of the shared electrons by neighboring Ir-Ir atoms decreases with increasing W concentration. The covalent nature of Ir-Ir bonds is gradually weakened. The reduction of ICOHP values with increasing W content also suggests that the Ir-Ir bond strength is weakened. This approach of studying alloying effects through electronic structure (e.g., charge density, bond characteristics) and mechanical property correlations is consistent with DFT studies on other refractory systems. For instance, Hu et al. [22] employed first-principles calculations to reveal how V addition modulates pseudo-energy gaps in NbMoTaW-based high-entropy alloys. It also shows how V addition affects interatomic interactions and mechanical properties.
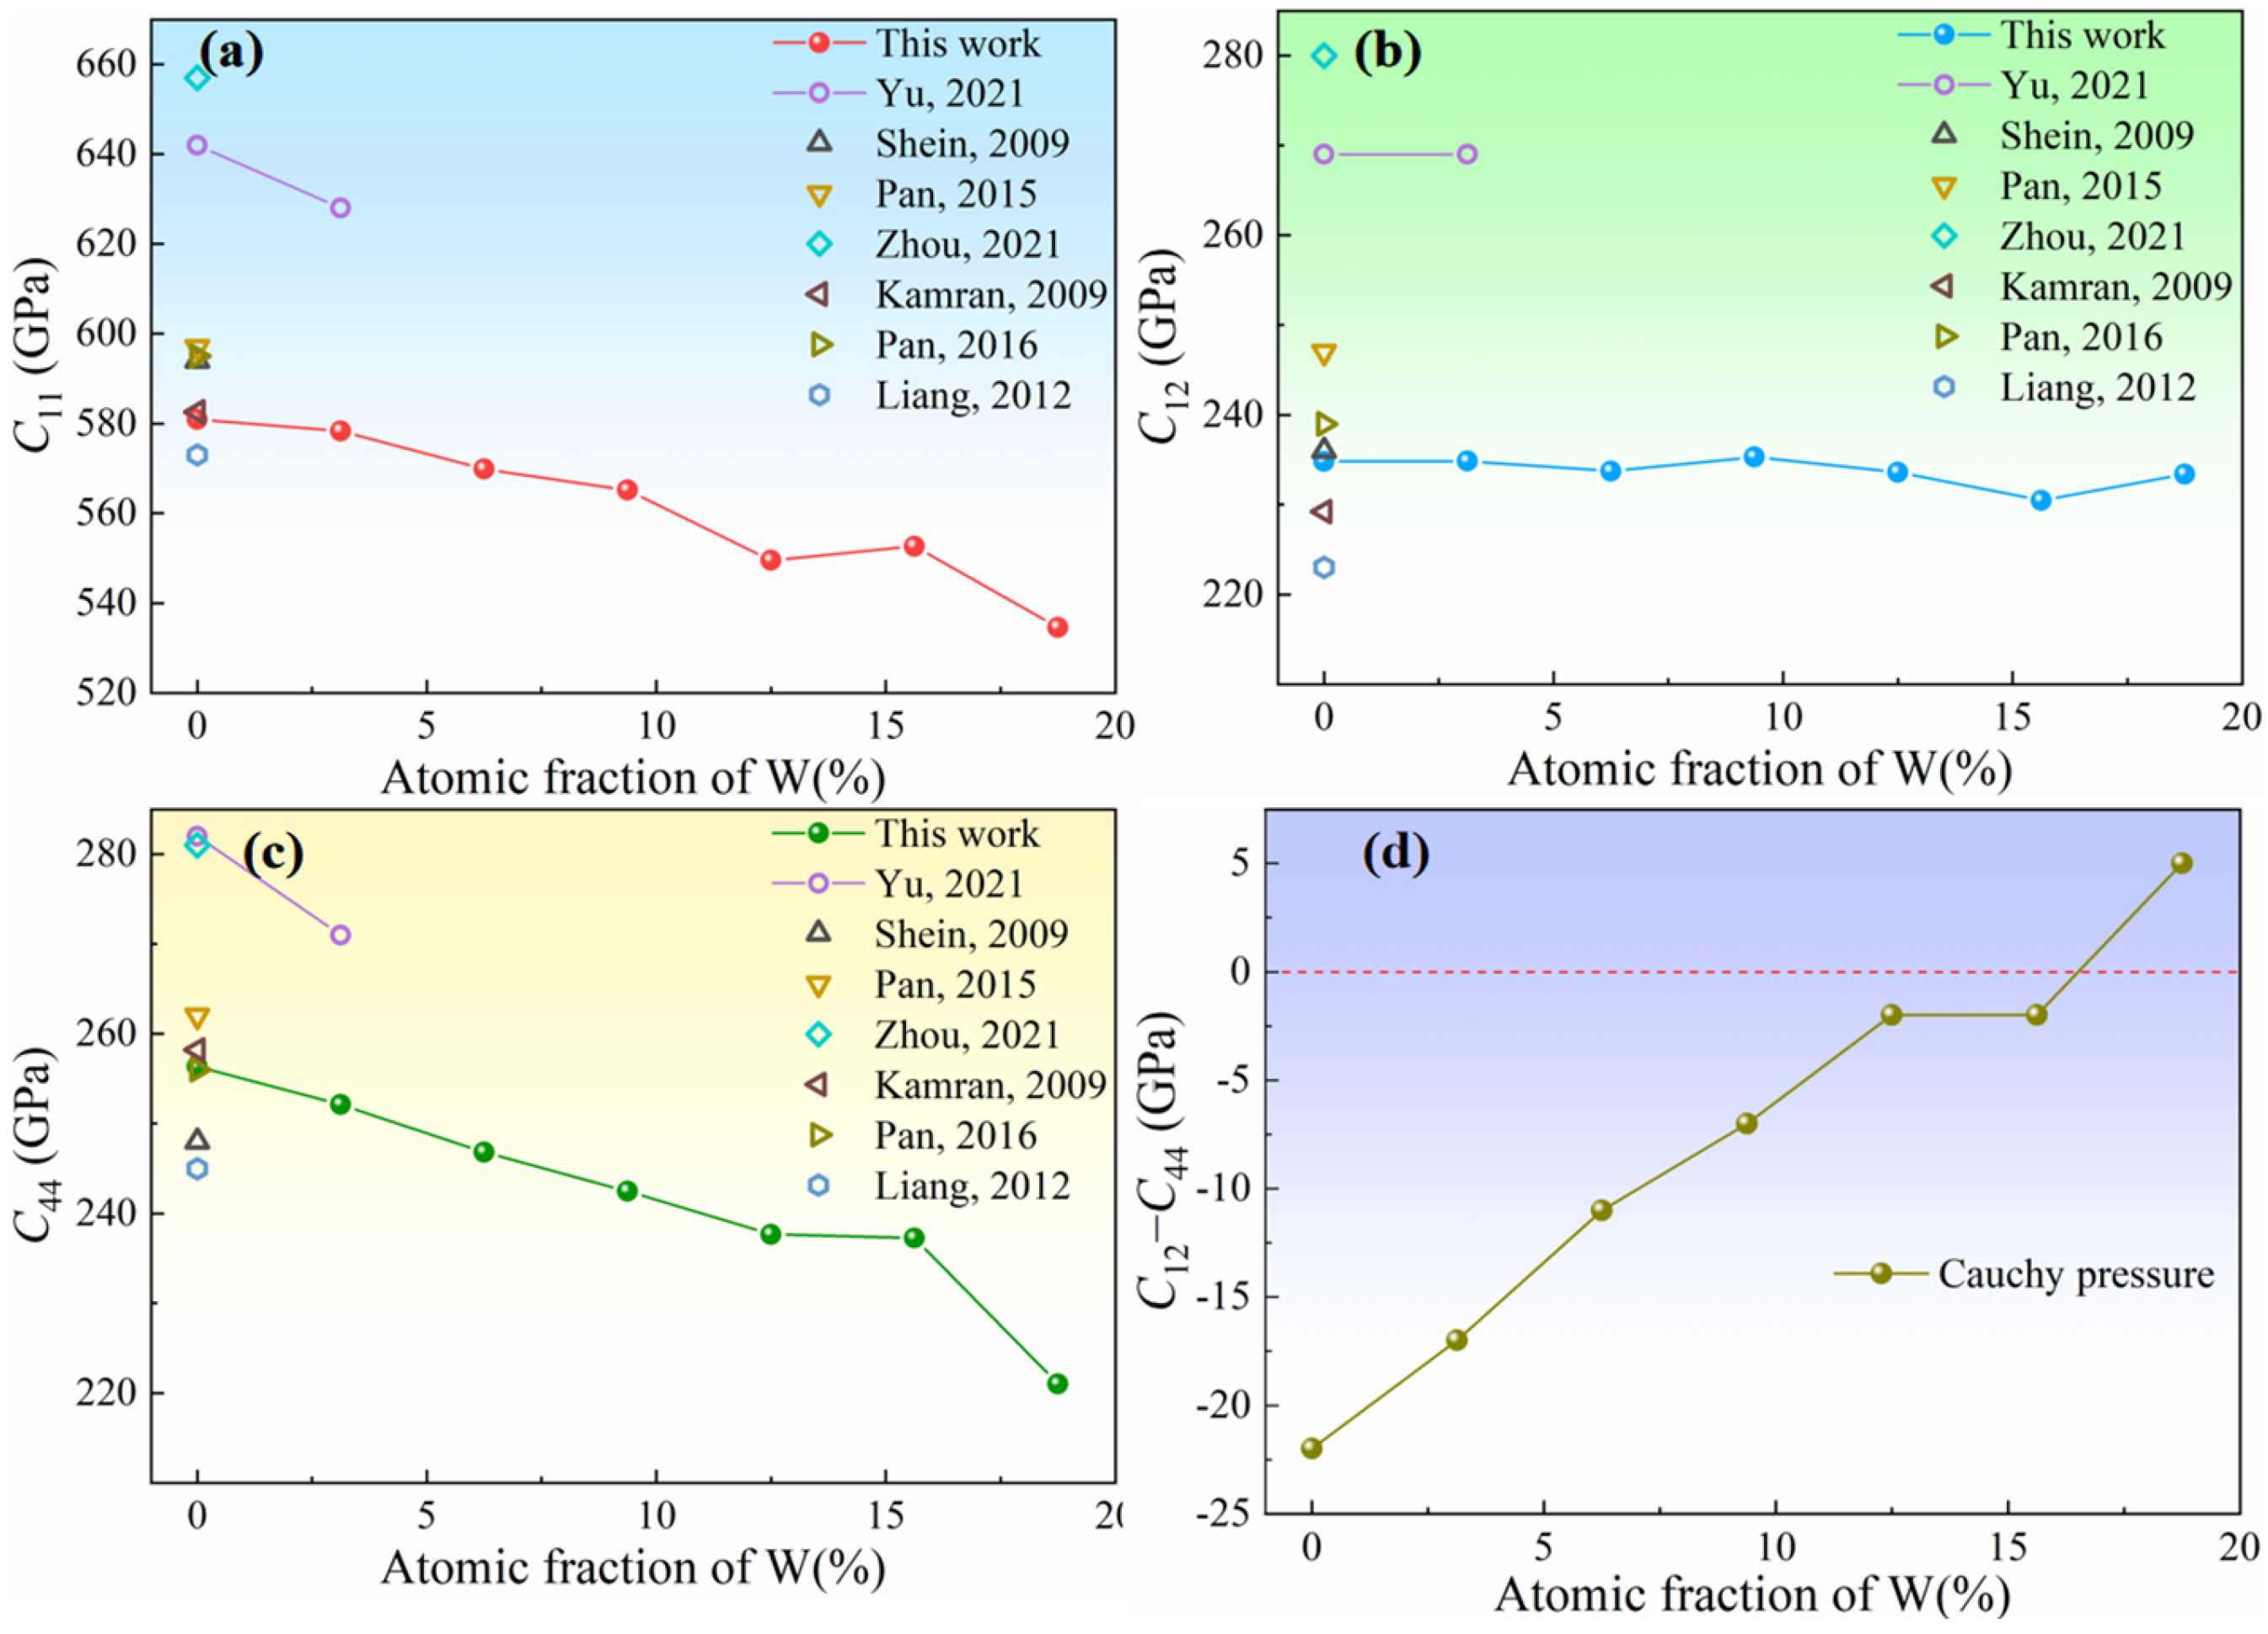
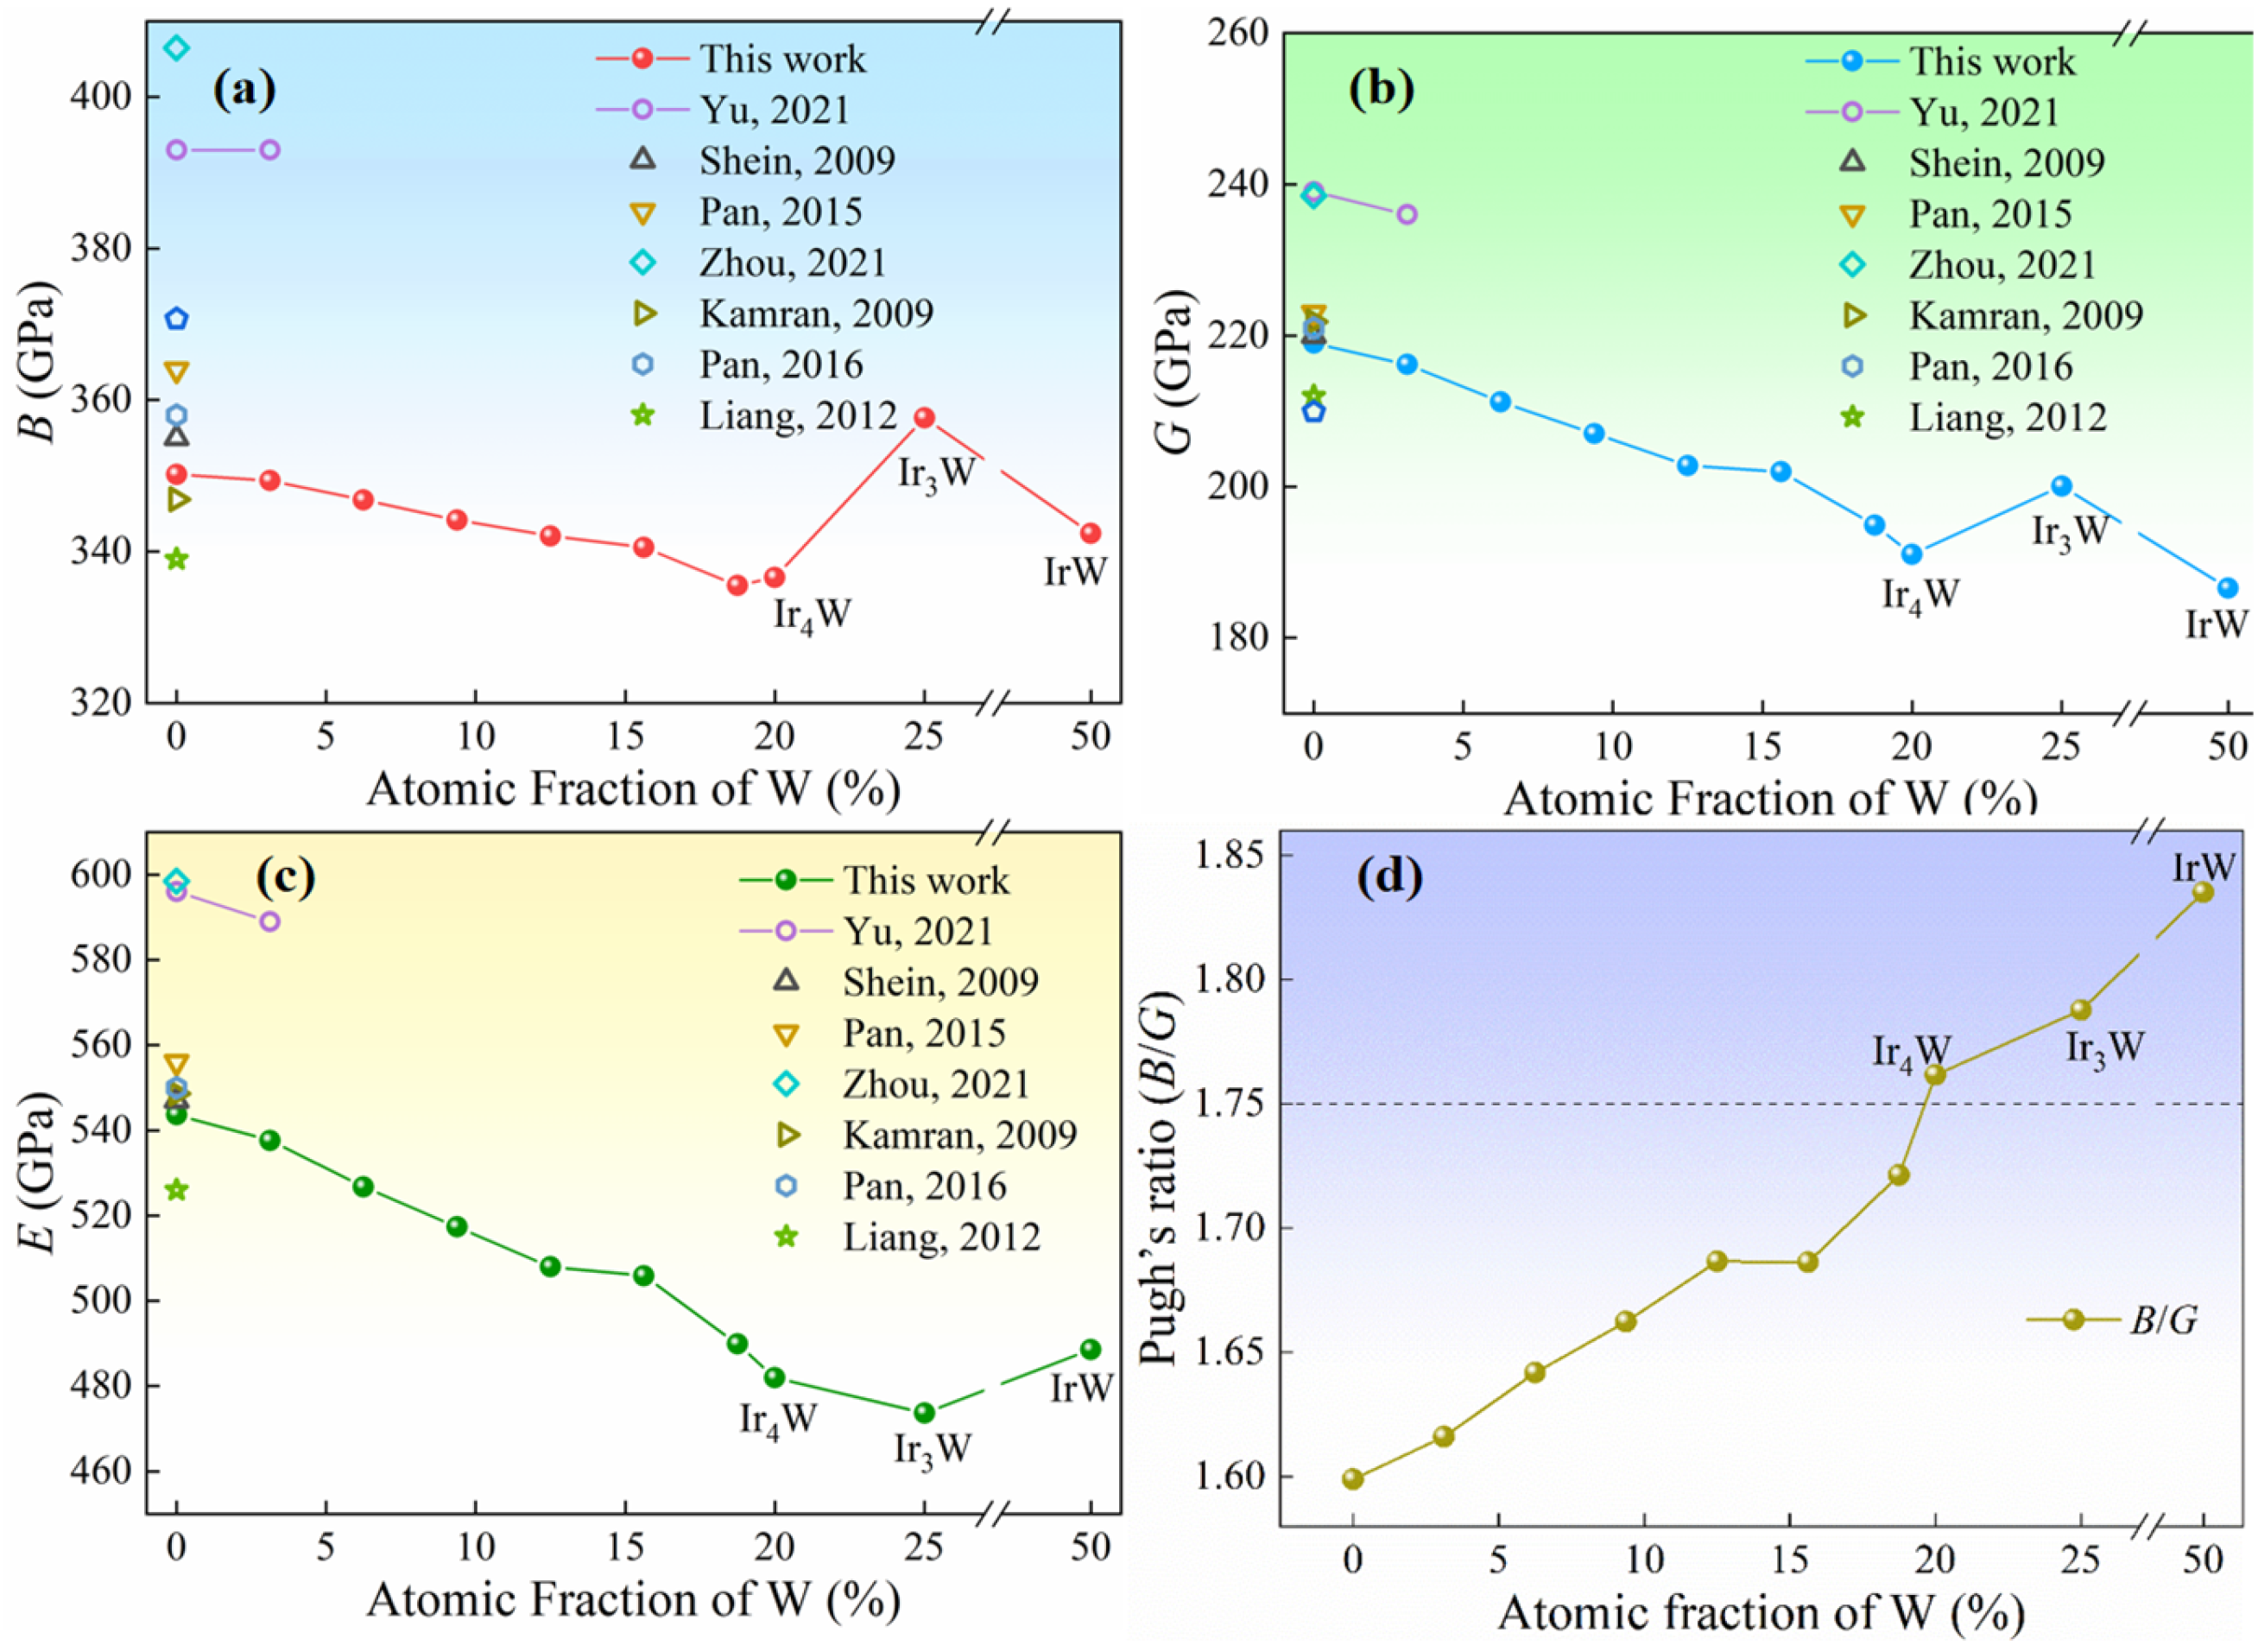
Table 7 summarizes the evolution trends with increasing W concentration from 0 to 18.75 at % for Cauchy pressure, Pugh’s ratio, Poisson’s ratio, stacking fault energy, twinning propensity parameter, and ICOHP values. The above findings, the increasing of Cauchy pressure (C12C44), bulk Pugh’s ratio (B/G), and Poisson’s ratio with increasing W concentration, suggest that the toughness of Ir-W solid solution alloys is improved. The addition of W results in a reduction of intrinsic SFE and unstable SFE of Ir. This evolution trend may promote the full dislocations to extended dislocations. This trend is similar to the findings in Co-based alloys reported by Tian et al. [29]. Alloying of Cr and W leads to a reduction of SFE and facilitates the dissociation of full dislocations into Shockley partials. These behaviors enhance ductility by hindering cross-slip and reducing creep rates. The reduction of unstable SFE also indicates that the energy barrier of slipping decreases [69]. With increasing the concentration of W, both the TFE (γtf) and unstable TFE (γutf) of Ir-W solid solutions decrease, resulting in increasing the twinning propensity parameters (τa, T, and η), thus improving the twinning propensity of Ir.
Efforts to balance the strength and ductility of a material have been ongoing for centuries. Liu et al. [73] designed Ti–Zr–Nb–Ta and Ti–Zr–Nb–Mo refractory HEAs balancing strength and ductility through tailoring valence electron concentration by changing the alloying composition. Chen et al. [74] investigated a CoCuFeNiPd HEA, which undergoes short-range ordering (SRO). The SRO leads to a pseudo-composite microstructure, which surprisingly enhances both the ultimate strength and ductility. Face-center-cubic-preferred clusters enhance strength, while body-center-cubic-preferred clusters improve ductility. Qi et al. [75] developed single-phase ordered B2 aluminum-enriched refractory HEAs demonstrating high strength and ductility. It is reported that valence electron count (VEC) defines domains for alloy ductility and brittleness. Strategically avoiding the VEC valley is advised in designing future ductile alloys.
Pei et al. [76] designed HEAs with enhanced strength and ductility. They highlighted that negative SFE, combined with a k parameter (ratio of short-ranged interactions between closed-packed planes) with |k| close to 1/2, promotes the formation of various nanoscale close-packed structures (such as twins, stacking faults, and nano-sized HCP domains). These structures balance strength and ductility by tailoring SFE and atomic interactions. Ren et al. [77] reported that the alternating FCC and BCC nanolamellae in AlCoCrFeNi eutectic HEAs synergistically enhanced strength and ductility. The present research established that it is theoretically practicable to improve the toughness of Ir by alloying methods with tailoring valence electron concentration to decrease the covalent contribution to chemical bonding. Alloying Ir with W results in the weakening of Ir-Ir covalent properties and the reduction of SFE. The toughening mechanism is consistent with these advanced alloy design concepts.
Shang et al. [28] stated that SFE in Ni-based alloys decreases with increasing temperature, which may further modulate deformation mechanisms under service conditions. Yang et al. [78] reported that the ductile–brittle transition temperature of Ir is in the range of 700–800 °C. They attributed low-temperature brittleness (25–700 °C) to high SFE. High SFE raises the activation barrier for dislocation slip, which hinders screw dislocation migration and causes dense dislocation tangles. The 0 K simulation results elucidate the intrinsic properties for the enhancement of Ir toughness by W alloying (SFE and electronic properties). Thermal effects at finite temperatures may improve the toughness of Ir alloys. These effects include lattice parameter changes caused by thermal expansion and elastic modulus softening due to phonons. The evolution of toughness as a function of temperature may also be affected by W. For example, W may influence toughness and the brittle transition temperature. The evolution of elastic properties and SFE of Ir and Ir-W solid solution alloys as a function of temperature will be investigated in future work.

5. Conclusions

In the present research, first-principles calculations were carried out, focusing on the effect of W on the elastic properties, GSFE, electronic structures, and Ir-Ir chemical bonding properties of Ir-W solid solution alloys. The calculated lattice constants, elastic constants, and elastic modulus of Ir, Ir3W (ε′), and IrW (ε′′) are in good agreement with the reported theory and experimental values. The calculated GSFEs of Ir are in good agreement with the reported values. The evolution of lattice constants, formation energies, elastic constants, elastic modulus, GSFE, and electronic structures of Ir-W solid solutions alloys as a function of W concentration was addressed and compared. The main conclusions are summarized as follows.
(1)
Cauchy pressure (C12−C44) increases from −22 GPa to 5 GPa, and Pugh ratio (B/G) increases from 1.60 to 1.72 with increasing W content from 0 to 18.75 at %. These facts suggest that the toughness of Ir-W alloys is improved.
(2)
The intrinsic SFE and unstable SFE of Ir alloy decrease with increasing W concentration. It is reasonable to predict that the reduction of SFE accompanies the lowering of the slipping barrier, which is responsible for the improvement of the material’s plastic deformation capability.
(3)
The Ir-Ir bonds exhibit both metallic and covalent natures. The covalent nature of Ir-Ir bonds is weakened with the increasing of W concentration, evidenced by the growing ICOHP values from −0.8512 eV to −0.7923 eV and the reduction of common shared electrons between neighboring Ir-Ir atoms.
The weakening covalent character of Ir-Ir bonds through W alloying results in a decrease in stacking fault energy and lowering the energy barrier for sliding. It is a feasible approach to improve the toughness of Ir and mitigate its inherent brittleness by alloying methods. Further research, including both theoretical calculations and experimental studies, is strongly desired to design and develop high-temperature Ir-based alloys with higher toughness and strength.

Author Contributions

Conceptualization, P.S. and J.M.; methodology, F.B. and G.L.; software, P.S.; validation, J.M., F.B., and G.L.; formal analysis, F.B.; investigation, P.S.; resources, P.S. and J.M.; data curation, F.B.; writing—original draft preparation, P.S.; writing—review and editing, P.S. and J.M.; visualization, J.M.; supervision, F.B. and G.L.; project administration, F.B.; funding acquisition, J.M. All authors have read and agreed to the published version of the manuscript.

Funding

This research was funded by the National Key Research and Development Program of China via Award No. 2021YFA1601102 and the National Natural Science Foundation of China (NSFC) via Grant No. 52271044.

Institutional Review Board Statement

Not applicable.

Informed Consent Statement

Not applicable.

Data Availability Statement

The original contributions presented in this study are included in the article. Further inquiries can be directed to the corresponding authors.

Conflicts of Interest

The authors declare no conflicts of interest.

References

  1. Zhao, S.; Xia, J.; Xia, Y.; Chen, J.; Du, D.; Yang, H.; Liu, J. Microstructure and Isothermal Oxidation of Ir–Rh Spark Plug Electrodes. Materials 2019, 12, 3226. [Google Scholar] [CrossRef]
  2. Inouye, H. Platinum Group Alloy Containers for Radioisotopic Heat Sources. Platin. Met. Rev. 1979, 23, 100–108. [Google Scholar] [CrossRef]
  3. Franco-Ferreira, E.A.; Goodwin, G.M.; George, T.G.; Rinehart, G.H. Long Life Radioisotopic Power Sources Encapsulated in Platinum Metal Alloys. Platin. Met. Rev. 1997, 41, 154–163. [Google Scholar] [CrossRef]
  4. Panfilov, P. On the inherent fracture mode of iridium at room temperature. J. Mater. Sci. 2005, 40, 5983–5987. [Google Scholar] [CrossRef]
  5. Gandhi, C.; Ashby, M.F. On fracture mechanisms of iridium and criteria for cleavage. Scr. Metall. 1979, 13, 371–376. [Google Scholar] [CrossRef]
  6. Panfilov, P.; Yermakov, A.; Dmitriev, V.; Timofeev, N.I. The Plastic Flow of Iridium. Platin. Met. Rev. 1991, 35, 196–200. [Google Scholar] [CrossRef]
  7. Panfilov, P.; Yermakov, A. On brittle fracture in polycrystalline iridium. J. Mater. Sci. 2004, 39, 4543–4552. [Google Scholar] [CrossRef]
  8. Peng, W.; Jie, Y.J.; Xiaolong, Z.; Jingchao, C. Research Progress on Brittleness of Iridium. Rare Met. Mater. Eng. 2015, 44, 2363–2367. [Google Scholar] [CrossRef]
  9. George, E.P.; McKamey, C.G.; Ohriner, E.K.; Lee, E.H. Deformation and fracture of iridium: Microalloying effects. Mater. Sci. Eng. A 2001, 319–321, 466–470. [Google Scholar] [CrossRef]
  10. Liu, C.T.; Inouye, H.; Schaffhauser, A.C. Effect of Thorium Additions on Metallurgical and Mechanical Properties of Ir-0.3 pct W Alloys. Metall. Mater. Trans. A-Phys. Metall. Mater. Sci. 1981, 12, 993–1002. [Google Scholar] [CrossRef]
  11. Gubbi, A.N.; George, E.P.; Ohriner, E.K.; Zee, R.H. Segregation of lutetium and yttrium to grain boundaries in iridium alloys. Acta Mater. 1998, 46, 893–902. [Google Scholar] [CrossRef]
  12. Zhou, Y.X.; Chong, X.Y.; Hu, M.Y.; Wei, Y.; Hu, C.Y.; Zhang, A.M.; Feng, J. Probing the mechanical properties of ordered and disordered Pt-Ir alloys by first-principles calculations. Phys. Lett. A 2021, 405, 13. [Google Scholar] [CrossRef]
  13. Yu, W.; Zhou, Y.X.; Chong, X.Y.; Wei, Y.; Hu, C.Y.; Zhang, A.M.; Feng, J. Investigation on elastic properties and electronic structure of dilute Ir-based alloys by first-principles calculations. J. Alloys Compd. 2021, 850, 156548. [Google Scholar] [CrossRef]
  14. Jiang, C.; Du, Y. Thermodynamic and mechanical stabilities of γ′-Ir3(Al,W). J. Appl. Phys. 2011, 109, 17–29. [Google Scholar] [CrossRef]
  15. Omori, T.; Makino, K.; Shinagawa, K.; Ohnuma, I.; Kainuma, R.; Ishida, K. Phase equilibria and mechanical properties of the Ir–W–Al system. Intermetallics 2014, 55, 154–161. [Google Scholar] [CrossRef]
  16. Yang, J.; Fang, X.; Liu, Y.; Gao, Z.; Wen, M.; Hu, R. Microstructure evolution and mechanical properties of a novel γ′ phase-strengthened Ir-W-Al-Th superalloy. Rare Met. 2021, 40, 3588–3597. [Google Scholar] [CrossRef]
  17. Xiong, W.; Guo, A.X.Y.; Zhan, S.; Liu, C.-T.; Cao, S.C. Refractory high-entropy alloys: A focused review of preparation methods and properties. J. Mater. Sci. Technol. 2023, 142, 196–215. [Google Scholar] [CrossRef]
  18. Málek, J.; Zýka, J.; Lukáč, F.; Vilémová, M.; Vlasák, T.; Čížek, J.; Melikhova, O.; Macháčková, A.; Kim, H.-S. The Effect of Processing Route on Properties of HfNbTaTiZr High Entropy Alloy. Materials 2019, 12, 4022. [Google Scholar] [CrossRef]
  19. Senkov, O.N.; Gorsse, S.; Miracle, D.B. High temperature strength of refractory complex concentrated alloys. Acta Mater. 2019, 175, 394–405. [Google Scholar] [CrossRef]
  20. Xiang, L.; Guo, W.; Liu, B.; Fu, A.; Li, J.; Fang, Q.; Liu, Y. Microstructure and Mechanical Properties of TaNbVTiAlx Refractory High-Entropy Alloys. Entropy 2020, 22, 282. [Google Scholar] [CrossRef]
  21. Chang, Z.-C.; Liang, S.-C.; Han, S.; Chen, Y.-K.; Shieu, F.-S. Characteristics of TiVCrAlZr multi-element nitride films prepared by reactive sputtering. Nucl. Instrum. Methods Phys. Res. Sect. B Beam Interact. Mater. At. 2010, 268, 2504–2509. [Google Scholar] [CrossRef]
  22. Hu, Y.L.; Bai, L.H.; Tong, Y.G.; Deng, D.Y.; Liang, X.B.; Zhang, J.; Li, Y.J.; Chen, Y.X. First-principle calculation investigation of NbMoTaW based refractory high entropy alloys. J. Alloys Compd. 2020, 827, 153963. [Google Scholar] [CrossRef]
  23. Shein, I.R.; Ivanovskii, A.L. Hydrogen-induced enhancement of ductility of fcc iridium: A first-principles study. Mater. Lett. 2009, 63, 2413–2415. [Google Scholar] [CrossRef]
  24. Rahman, N.; Husain, M.; Ullah, W.; Azzouz-Rached, A.; Algethami, N.; Al-Khamiseh, B.M.; Abualnaja, K.M.; Alosaimi, G.; Albalawi, H.; Bayhan, Z.; et al. Exploring the Structural, Elastic and Optoelectronic Properties of Stable Sr2XSbO6 (X = Dy, La) Double Perovskites: Ab Initio Calculations. J. Inorg. Organomet. Polym. Mater. 2024, 19, 5102–5112. [Google Scholar] [CrossRef]
  25. Vítek, V. Intrinsic stacking faults in body-centred cubic crystals. Philos. Mag. 1968, 18, 773–786. [Google Scholar] [CrossRef]
  26. Balk, T.J.; Hemker, K.J. High resolution transmission electron microscopy of dislocation core dissociations in gold and iridium. Philos. Mag. A-Phys. Condens. Matter Struct. Defect Mech. Prop. 2001, 81, 1507–1531. [Google Scholar] [CrossRef]
  27. Hartford, J.; von Sydow, B.; Wahnström, G.; Lundqvist, B.I. Peierls barriers and stresses for edge dislocations in Pd and Al calculated from first principles. Phys. Rev. B 1998, 58, 2487–2496. [Google Scholar] [CrossRef]
  28. Shang, S.L.; Zacherl, C.L.; Fang, H.Z.; Wang, Y.; Du, Y.; Liu, Z.K. Effects of alloying element and temperature on the stacking fault energies of dilute Ni-base superalloys. J. Phys. Condens. Matter 2012, 24, 505403. [Google Scholar] [CrossRef]
  29. Tian, L.-Y.; Lizárraga, R.; Larsson, H.; Holmström, E.; Vitos, L. A first principles study of the stacking fault energies for fcc Co-based binary alloys. Acta Mater. 2017, 136, 215–223. [Google Scholar] [CrossRef]
  30. Wang, C.; Zhang, H.-Y.; Wang, H.-Y.; Liu, G.-J.; Jiang, Q.-C. Effects of doping atoms on the generalized stacking-fault energies of Mg alloys from first-principles calculations. Scr. Mater. 2013, 69, 445–448. [Google Scholar] [CrossRef]
  31. Naidu, S.V.N.; Rao, P.R. Phase Diagrams of Binary Tungsten Alloys. Int. J. Mater. Res. 1992, 83, 865. [Google Scholar] [CrossRef]
  32. Kresse, G.; Furthmuller, J. Efficient iterative schemes for ab initio total-energy calculations using a plane-wave basis set. Phys. Rev. B 1996, 54, 11169–11186. [Google Scholar] [CrossRef] [PubMed]
  33. Kresse, G.; Furthmüller, J. Efficiency of ab-initio total energy calculations for metals and semiconductors using a plane-wave basis set. Comput. Mater. Sci. 1996, 6, 15–50. [Google Scholar] [CrossRef]
  34. Kohn, W.; Sham, L.J. Self-Consistent Equations Including Exchange and Correlation Effects. Phys. Rev. 1965, 140, 1133–1138. [Google Scholar] [CrossRef]
  35. Kresse, G.; Joubert, D. From ultrasoft pseudopotentials to the projector augmented-wave method. Phys. Rev. B 1999, 59, 1758–1775. [Google Scholar] [CrossRef]
  36. Maintz, S.; Deringer, V.L.; Tchougréeff, A.L.; Dronskowski, R. LOBSTER: A tool to extract chemical bonding from plane-wave based DFT. J. Comput. Chem. 2016, 37, 1030–1035. [Google Scholar] [CrossRef]
  37. Guo, L.; Tang, G.; Hong, J. Mechanical Properties of Formamidinium Halide Perovskites FABX3 (FA=CH(NH2)2; B=Pb, Sn; X=Br, I) by First-Principles Calculations. Chin. Phys. Lett. 2019, 36, 36–45. [Google Scholar] [CrossRef]
  38. Roy, N.; Kuila, S.K.; Mondal, A.K.; Sikdar, R.H.; Ghanta, S.; Wang, F.; Jana, P.P. Crystal Structure, Electronic Structure and Phase Stability of the Cu2-XMxcd (M=Zn, Ga, Ge, Sn) Pseudo-Binary Laves Phases: Effect of Valence Electron Concentration. SSRN Electron. J. 2022, 313, 22–34. [Google Scholar] [CrossRef]
  39. Lakshan, A.; Petricek, V.; Jana, P.P. Variable Temperature Crystal Structure of Cu4TiTe4. Eur. J. Inorg. Chem. 2023, 26, 20–23. [Google Scholar] [CrossRef]
  40. Smid, S.; Steinberg, S. Probing the Validity of the Zintl-Klemm Concept for Alkaline-Metal Copper Tellurides by Means of Quantum-Chemical Techniques. Materials 2020, 13, 2178. [Google Scholar] [CrossRef]
  41. Walle, A.v.d.; Ceder, G. Automating first-principles phase diagram calculations. J. Phase Equilib. 2002, 23, 348–349. [Google Scholar] [CrossRef]
  42. Walle, A.v.d.; Asta, M. Self-driven lattice-model Monte Carlo simulations of alloy thermodynamic properties and phase diagrams. Model. Simul. Mater. Sci. Eng. 2002, 10, 521–538. [Google Scholar] [CrossRef]
  43. Walle, A.v.d.; Asta, M.; Ceder, G. The Alloy Theoretic Automated Toolkit: A User Guide. Calphad-Comput. Coupling Ph. Diagrams Thermochem. 2002, 26, 539–553. [Google Scholar] [CrossRef]
  44. Jain, A.; Ong, S.P.; Hautier, G.; Chen, W.; Richards, W.D.; Dacek, S.; Cholia, S.; Gunter, D.; Skinner, D.; Ceder, G.; et al. Commentary: The Materials Project: A materials genome approach to accelerating materials innovation. APL Mater. 2013, 1, 011002. [Google Scholar] [CrossRef]
  45. Katsura, T.; Tange, Y. A Simple Derivation of the Birch–Murnaghan Equations of State (EOSs) and Comparison with EOSs Derived from Other Definitions of Finite Strain. Minerals 2019, 9, 745. [Google Scholar] [CrossRef]
  46. Huang, Y.Y.; Wu, B.; Li, F.; Chen, L.; Deng, Z.; Chang, K. First-principles and CALPHAD-type study of the Ir-Mo and Ir-W systems. J. Min. Metall. Sect. B Metall. 2020, 56, 109–118. [Google Scholar] [CrossRef]
  47. Kittel, C.; Masi, J.F. Introduction to Solid State Physics. Phys. Today 1954, 7, 18–19. [Google Scholar] [CrossRef]
  48. Chung, D.H.; Buessem, W.R. The Voigt-Reuss-Hill (VRH) Approximation and the Elastic Moduli of Polycrystalline ZnO, TiO2 (Rutile), and α-Al2O3. J. Appl. Phys. 1968, 39, 2777–2782. [Google Scholar] [CrossRef]
  49. Wu, Z.; Zhao, E.; Xiang, H.; Hao, X.; Liu, X.; Meng, J. Crystal structures and elastic properties of superhard IrN2 and IrN3 from first principles. Phys. Rev. B 2007, 76, 4–11. [Google Scholar] [CrossRef]
  50. Achmad, T.L.; Fu, W.; Chen, H.; Zhang, C.; Yang, Z.-G. First-principles calculations of generalized-stacking-fault-energy of Co-based alloys. Comput. Mater. Sci. 2016, 121, 86–96. [Google Scholar] [CrossRef]
  51. Yamabe-Mitarai, Y.; Maruko, T.; Miyazawa, T.; Morino, T. Solid Solution Hardening Effect of Ir. Mater. Sci. Forum 2005, 475–479, 703–706. [Google Scholar] [CrossRef]
  52. Singh, H. Determination of thermal expansion of germanium, rhodium and iridium by X-rays. Acta Crystallogr. Sect. A 1968, 24, 469–471. [Google Scholar] [CrossRef]
  53. Pan, Y.; Wen, M.; Wang, L.; Wang, X.; Lin, Y.H.; Guan, W.M. Iridium concentration driving the mechanical properties of iridium-aluminum compounds. J. Alloys Compd. 2015, 648, 771–777. [Google Scholar] [CrossRef]
  54. Pan, Y.; Lin, Y.H. Influence of vacancy on the mechanical and thermodynamic properties of IrAl3 compound: A first-principles calculations. J. Alloys Compd. 2016, 684, 171–176. [Google Scholar] [CrossRef]
  55. Giessen, B.C.; Jaehnigen, U.; Grant, N.J. Ordered AB and AB3 phases in T6-T9 alloy systems and a modified Mo-lr phase diagram. J. Less Common Met. 1966, 10, 147–150. [Google Scholar] [CrossRef]
  56. Li, H.; Tao, Q.; Dong, J.; Gong, Y.; Guo, Z.; Liao, J.; Hao, X.; Zhu, P.; Liu, J.; Chen, D. Anomalous lattice stiffening in tungsten tetraboride solid solutions with manganese under compression. J. Phys. Condens. Matter 2020, 32, 165702. [Google Scholar] [CrossRef]
  57. Kamran, S.; Chen, K.; Chen, L. Ab initio examination of ductility features of fcc metals. Phys. Rev. B 2009, 79, 24–106. [Google Scholar] [CrossRef]
  58. Liang, C.; Li, G.; Gong, H. Concerning the brittleness of iridium: An elastic and electronic view. Mater. Chem. Phys. 2012, 133, 140–143. [Google Scholar] [CrossRef]
  59. Pettifor, D.G. Theoretical predictions of structure and related properties of intermetallics. Mater. Sci. Technol. 1992, 8, 345–349. [Google Scholar] [CrossRef]
  60. Thompson, R.P.; Clegg, W.J. Predicting whether a material is ductile or brittle. Curr. Opin. Solid State Mater. Sci. 2018, 22, 100–108. [Google Scholar] [CrossRef]
  61. Hecker, S.S.; Rohr, D.L.; Stein, D.F. Brittle fracture in iridium. Metall. Mater. Trans. A-Phys. Metall. Mater. Sci. 1978, 9, 481–488. [Google Scholar] [CrossRef]
  62. Pugh, S.F. XCII. Relations between the elastic moduli and the plastic properties of polycrystalline pure metals. Philos. Mag. 1954, 45, 823–843. [Google Scholar] [CrossRef]
  63. Senkov, O.N.; Miracle, D.B. Generalization of intrinsic ductile-to-brittle criteria by Pugh and Pettifor for materials with a cubic crystal structure. Sci. Rep. 2021, 11, 31–45. [Google Scholar] [CrossRef] [PubMed]
  64. Wen, Y.; Zeng, X.; Ye, Y.; Gou, Q.; Liu, B.; Lai, Z.; Jiang, D.; Sun, X.; Wu, M. Theoretical Study on the Structural, Elastic, Electronic and Thermodynamic Properties of Long-Period Superstructures h- and r-Al2Ti under High Pressure. Materials 2022, 15, 4236. [Google Scholar] [CrossRef] [PubMed]
  65. Xu, G.; Chong, X.; Zhou, Y.; Wei, Y.; Hu, C.; Zhang, A.; Zhou, R.; Feng, J. Effects of the alloying element on the stacking fault energies of dilute Ir-based superalloys: A comprehensive first-principles study. J. Mater. Res. 2020, 35, 2718–2725. [Google Scholar] [CrossRef]
  66. Cai, T.; Zhang, Z.J.; Zhang, P.; Yang, J.B.; Zhang, Z.F. Competition between slip and twinning in face-centered cubic metals. J. Appl. Phys. 2014, 116, 173507. [Google Scholar] [CrossRef]
  67. Tadmor, E.B.; Bernstein, N. A first-principles measure for the twinnability of FCC metals. J. Mech. Phys. Solids 2004, 52, 2507–2519. [Google Scholar] [CrossRef]
  68. Jin, Z.H.; Dunham, S.T.; Gleiter, H.; Hahn, H.; Gumbsch, P. A universal scaling of planar fault energy barriers in face-centered cubic metals. Scr. Mater. 2011, 64, 605–608. [Google Scholar] [CrossRef]
  69. Qiu, S.; Zhang, X.-C.; Zhou, J.; Cao, S.; Yu, H.; Hu, Q.-M.; Sun, Z. Influence of lattice distortion on stacking fault energies of CoCrFeNi and Al-CoCrFeNi high entropy alloys. J. Alloys Compd. 2020, 846, 156321. [Google Scholar] [CrossRef]
  70. Asaro, R.J.; Suresh, S. Mechanistic models for the activation volume and rate sensitivity in metals with nanocrystalline grains and nano-scale twins. Acta Mater. 2005, 53, 3369–3382. [Google Scholar] [CrossRef]
  71. Kontsevoi, O.Y.; Gornostyrev, Y.N.; Freeman, A.J. Modeling the dislocation properties and mechanical behavior of Ir, Rh, and their refractory alloys. JOM 2005, 57, 43–47. [Google Scholar] [CrossRef]
  72. Cawkwell, M.J.; Nguyen-Manh, D.; Woodward, C.; Pettifor, D.G.; Vitek, V. Origin of Brittle Cleavage in Iridium. Science 2005, 309, 1059–1062. [Google Scholar] [CrossRef]
  73. Liu, P.; Zhang, H.; Hu, Q.; Ding, X.; Sun, J. First-principles design of high strength refractory high-entropy alloys. J. Mater. Res. Technol. 2024, 29, 3420–3436. [Google Scholar] [CrossRef]
  74. Chen, S.; Aitken, Z.H.; Pattamatta, S.; Wu, Z.; Yu, Z.G.; Srolovitz, D.J.; Liaw, P.K.; Zhang, Y.-W. Simultaneously enhancing the ultimate strength and ductility of high-entropy alloys via short-range ordering. Nat. Commun. 2021, 12, 4953. [Google Scholar] [CrossRef] [PubMed]
  75. Qi, J.; Fan, X.; Hoyos, D.I.; Widom, M.; Liaw, P.K.; Poon, J. Integrated design of aluminum-enriched high-entropy refractory B2 alloys with synergy of high strength and ductility. Sci. Adv. 2024, 10, eadq0083. [Google Scholar] [CrossRef] [PubMed]
  76. Pei, Z.; Zhao, S.; Detrois, M.; Jablonski, P.D.; Hawk, J.A.; Alman, D.E.; Asta, M.; Minor, A.M.; Gao, M.C. Theory-guided design of high-entropy alloys with enhanced strength-ductility synergy. Nat. Commun. 2023, 14, 2519. [Google Scholar] [CrossRef]
  77. Ren, J.; Zhang, Y.; Zhao, D.; Chen, Y.; Guan, S.; Liu, Y.; Liu, L.; Peng, S.; Kong, F.; Poplawsky, J.D.; et al. Strong yet ductile nanolamellar high-entropy alloys by additive manufacturing. Nature 2022, 608, 62–68. [Google Scholar] [CrossRef]
  78. Yang, J.; Wang, H.; Hu, R.; Li, S.; Liu, Y.; Luo, X. Anomalous Tensile Strength and Fracture Behavior of Polycrystalline Iridium from Room Temperature to 1600 °C. Adv. Eng. Mater. 2018, 20, 1701114. [Google Scholar] [CrossRef]
Figure 1. Phase diagram of Ir-W binary alloy [15,31].
Materials 18 03629 g001
Figure 2. Structures of Ir-W alloys: (a) Ir31W1; (b) Ir30W2; (c) Ir29W3; (d) Ir28W4; (e) Ir27W5; (f) Ir26W6; (g) Ir4W; (h) Ir3W; (i) IrW. Green and red spheres denote Ir and W atoms, respectively.
Materials 18 03629 g002
Figure 3. (a) Top view geometry of a (111) plane, where yellow arrows denote dislocations: full dislocation b1 and partial dislocations (b2, b3); (b) stacking model without slipping; (c) layered fault model after slipping 1.0b; (d) twinning fault model after further slipping 1.0b based on the layered fault model.
Materials 18 03629 g003
Figure 4. The formation energy of Ir31W1, Ir30W2, Ir29W3, Ir28W4, Ir27W5 and Ir26W6, Ir4W, Ir3W, and IrW [13,55].
Materials 18 03629 g004
Figure 5. The elastic constants of Ir-W solid solution alloys (a) C11; (b) C12; (c) C14; and (d) C12C44 and previously reported values [12,13,23,53,54,57,58].
Materials 18 03629 g005
Figure 6. Elastic modulus parameters of Ir-W alloys, including (a) bulk modulus B, (b) shear modulus G, (c) Young’s modulus E, and (d) Pugh’s ratio (B/G) and previously reported values [12,13,23,53,54,57,58].
Materials 18 03629 g006
Figure 7. (a) GSFE curves of pure Ir and Ir-W solid solutions; (b) the evolution of intrinsic stacking fault energy (γisf), unstable stacking fault energy (γusf), twinning fault energy (γtf), and unstable twinning fault energy (γutf) as a function of W atomic fraction.
Materials 18 03629 g007
Figure 8. The s-, p-, d-orbital partial DOS of Ir atoms bonded with W of pure Ir, Ir30W2, Ir28W4, and Ir26W6 (a), (b), and (c), respectively, the s-, p-, d-orbital partial DOS of W sites of Ir30W2, Ir28W4, and Ir26W6 (d), (e), and (f), respectively.
Materials 18 03629 g008
Figure 9. (a) The averaged total DOS of Ir and Ir atoms in pure Ir, Ir30W2, Ir28W4, and Ir26W6, (b) The projected crystal orbital Hamilton population (COHP) of Ir−Ir pairs in Ir, Ir30W2, Ir28W4, and Ir26W6.
Materials 18 03629 g009
Figure 10. Charge density of pure Ir (a) and Ir26W6 (b) on the (010) plane; (c) depicts the charge density difference between Ir26W6 and Ir; (df) present the enlarged view of regions I, II, III in (ac). The charge density contour lines for (a,b,d,e) are plotted from 0.02 to 0.4 eV/Å3 with a 0.0008 eV/Å3 intervals. The black lines in (c,f) are the zero-charge density contours.
Materials 18 03629 g010
Table 1. Key DFT calculation parameters used in the modeling.
Pure IrIr32−xWxIr4WIr3WIrWGSFE
plane-wave basis cutoff energy550 eV550 eV
convergence criterion for electronic steps1 × 10−6 eV/atom1 × 10−4 eV/atom
convergence criterion for ionic steps0.005 eV/Å0.01 eV/Å
magnetic moment not addressednot addressed
k-point mesh8 ×   8 × 824 × 24 × 112 × 11 × 1111 × 18 × 104 × 4 × 1
Table 2. Experimental (Exp.) and calculational (Cal.) lattice constant of pure Ir, Ir4W, Ir3W, and IrW and supercell length of Ir-W solid solution 2   ×   2   ×   2 supercells (a, b, c), and mean bond length of Ir-Ir and Ir-W.
ElementCrystal TypeLattice Constant or Supercell Length (Å)Mean Bond Lengths (Å)Reference
abcIr-IrIr-W
IrCubic3.873 2.738 This work
Cubic3.902 Cal. [12]
Cubic3.876 Cal. [13]
Cubic3.874 Cal. [23]
Cubic3.819 Exp. [51]
Cubic3.840 Exp. [52]
Cubic3.903 Cal. [53]
Cubic3.912 Cal. [54]
Ir31W1Cubic7.751 2.7412.728This work
Cubic7.768 Cal. [13]
Ir30W2Cubic7.758 2.7452.719This work
Ir29W3Cubic7.765 2.7492.720This work
Ir28W4Cubic7.773 2.7552.721This work
Ir27W5Cubic7.779 2.7572.725This work
Ir26W6Cubic7.788 2.7622.724This work
Ir4WTrigonal2.7512.75133.850 This work
Trigonal2.7602.76033.930 [44]
Ir3W (ε′)Hexagonal5.5405.5404.421 This work
Hexagonal5.5515.5514.390 Cal. [46]
Hexagonal5.5155.5154.409 Exp. [55]
IrW (ε′′)Orthorhombic4.4732.7794.848 This work
Orthorhombic4.4862.7884.866 Cal. [46]
Orthorhombic4.4692.7734.825 Exp. [55]
Table 3. Elastic constants of IrW alloy (GPa).
C11C12C13C14C22C23C33C44C55C66Reference
Ir581235 257 This work
657280 281 Cal. [12]
642269 282 Cal. [13]
594236 248 Cal. [23]
597247 262 Cal. [53]
595239 256 Cal. [54]
583229 258 Cal. [57]
573223 245 Cal. [58]
Ir31W1578235 252 This work
628269 271 Cal. [13]
Ir30W2571235 246 This work
Ir29W3563235 242 This work
Ir28W4555236 238 This work
Ir27W5552235 237 This work
Ir26W6542232 227 This work
Ir4W61322417335 662172 194This work
Ir3W636205214 684175 216This work
622200214 661171 211Exp. [55]
IrW635228196 592174662155184173This work
618223194 583171632158186173Exp. [55]
Table 4. Elastic modulus (B, G, and E), Pugh’s ratio (B/G), and Poisson’s ratio ( ν ) of Ir-W alloy (GPa).
ElementBGEB/G ν Reference
Ir350.18219.00543.661.600.241This work
360.00220.00 1.64 Exp. [5]
406.49238.50598.451.700.254Cal. [12]
393.00239.00596.001.650.248Cal. [13]
355.00220.00547.001.610.240Cal. [23]
364.00223.00556.001.630.246Cal. [53]
358.00221.00550.001.620.244Cal. [54]
346.90221.84548.611.560.236Cal. [57]
339.00212.00526.001.600.241Cal. [58]
370.70209.90 1.77 Exp. [61]
Ir31W1349.34216.18537.631.620.244This work
393.00236.00589.001.670.250Cal. [13]
Ir30W2346.80211.22526.731.620.247This work
Ir29W3344.16207.03517.341.660.249This work
Ir28W4342.04202.80507.991.690.252This work
Ir27W5340.55201.95505.861.690.252This work
Ir26W6335.51194.91489.871.720.257This work
Ir4W336.57191.05481.961.760.261This work
Ir3W357.65200.06505.871.790.264This work
351.00194.00 1.810.270Exp. [55]
IrW342.38186.57473.671.840.269This work
334.00184.00 0.270Exp. [55]
Table 5. The γusf, γisf, γutf, and γtf of pure Ir and Ir-W solid solutions.
γusf (mJ/m2)γisf (mJ/m2)γutf (mJ/m2)γtf (mJ/m2)Reference
Pure Ir636.90337.80880.83354.56This work
420.00 Exp. [26]
349.00 Cal. [65]
740.90282.60 Cal. [66]
679.00305.00 Cal. [67]
625.00334.00 Cal. [68]
Ir31W618.25280.97819.7244.84This Work
277.00 Cal. [65]
Ir30W2589.90188.65810.03196.28This Work
Ir29W3620.19158.17797.53185.6This Work
Ir28W4523.3937.37680.7477.72This Work
Ir27W5603.5186.29654.7864.17This Work
Ir26W6547.3921.16456.335.64This Work
Table 6. Twinning propensity parameter for Ir and Ir-W solid solutions.
τ a T η
Pure Ir0.8981.1840.551
Ir31W0.9351.2700.645
Ir30W20.9281.3110.646
Ir29W30.9681.3910.723
Ir28W40.9871.4820.755
Ir27W51.0701.5820.910
Ir26W61.2381.8741.209
Table 7. Summary of the evolution trend with increasing W concentration from 0 to 18.75 at % for Cauchy pressure, Pugh’s ratio, Poisson’s ratio, stacking fault energy, twinning propensity parameter, and ICOHP values.
Properties of Ir-W Solid SolutionEvolution Trend with Increasing W Concentration from 0 to 18.75%
Cauchy pressure (C12C44)become larger
Pugh’s ratio (B/G)become larger
Poisson’s ratio ( ν )become larger
intrinsic stacking fault energy (γisf)decrease
unstable stacking fault energy (γusf)decrease
twinning fault energy (γtf)decrease
unstable twinning fault energy (γutf)decrease
twinning propensity parameter ( τ a , T, η)increase
shared electrons by neighboring Ir-Ir atomsdecrease
ICOHP valuesreduction
covalent properties of Ir-Ir bondweakened
toughnessimproved
Disclaimer/Publisher’s Note: The statements, opinions and data contained in all publications are solely those of the individual author(s) and contributor(s) and not of MDPI and/or the editor(s). MDPI and/or the editor(s) disclaim responsibility for any injury to people or property resulting from any ideas, methods, instructions or products referred to in the content.

