Article

Study on Stability and Fluidity of HPMC-Modified Gangue Slurry with Industrial Validation

1
College of Coal Engineering, Shanxi Datong University, Datong 037009, China
2
The Cultivation Base of Shanxi Key Laboratory of Coal Mine Water Jet Technology and Equipment, Shanxi Datong University, Datong 037009, China
*
Author to whom correspondence should be addressed.
Materials 2025, 18(15), 3461; https://doi.org/10.3390/ma18153461
Submission received: 3 June 2025 / Revised: 7 July 2025 / Accepted: 19 July 2025 / Published: 23 July 2025
(This article belongs to the Section Construction and Building Materials)

Abstract

HPMC, regulating slurry properties, is widely used in cement-based materials. Research on the application of HPMC in gangue slurry is still in its early stages. Moreover, the interactive effects of various factors on gangue slurry performance have not been thoroughly investigated. The work examined the effects of slurry concentration (X1), maximum gangue particle size (X2), and HPMC dosage (X3) on slurry performance using response surface methodology (RSM). The microstructure of the slurry was characterized via scanning electron microscopy (SEM) and polarized light microscopy (PLM), while low-field nuclear magnetic resonance (LF-NMR) was employed to analyze water distribution. Additionally, industrial field tests were conducted. The results are presented below. (1) X1 and X3 exhibited a negative correlation with layering degree and slump flow, while X2 showed a positive correlation. Slurry concentration had the greatest impact on slurry performance, followed by maximum particle size and HPMC dosage. HPMC significantly improved slurry stability, imposing the minimum negative influence on fluidity. Interaction terms X1X2 and X1X3 significantly affected layering degree and slump flow, while X2X3 significantly affected layering degree instead of slump flow. (2) Derived from the RSM, the statistical models for layering degree and slump flow define the optimal slurry mix proportions. The gangue gradation index ranged from 0.40 to 0.428, with different gradations requiring specific slurry concentration and HPMC dosages. (3) HPMC promoted the formation of a 3D floc network structure of fine particles through adsorption-bridging effects. The spatial supporting effect of the floc network inhibited the sedimentation of coarse particles, which enhanced the stability of the slurry. Meanwhile, HPMC only converted a small amount of free water into floc water, which had a minimal impact on fluidity. HPMC addition achieved the synergistic optimization of slurry stability and fluidity. (4) Field industrial trials confirmed that HPMC-optimized gangue slurry demonstrated significant improvements in both stability and flowability. The optimized slurry achieved blockage-free pipeline transportation, with a maximum spreading radius exceeding 60 m in the goaf and a maximum single-borehole backfilling volume of 2200 m3.

1. Introduction

Coal gangue is a solid waste generated during coal mining and dressing by washing, accounting for approximately 10–20% of coal production [1]. Based on data from the International Energy Agency (IEA) and BigMint, global coal production in 2024 reached 9.068 billion tons (with China, India, and Indonesia contributing 52.5, 11.5, and 9.2%, respectively), corresponding to an estimated coal gangue production of 1.2–1.8 billion tons. Current comprehensive utilization methods for coal gangue include power generation (practiced in the United States and China), alumina extraction (Germany and Japan), building material manufacturing (China and the United States), as well as land reclamation and underground backfilling (China and Indonesia) [2,3,4,5,6,7]. Developed countries have achieved a comprehensive utilization rate of coal gangue exceeding 90%. However, developing nations such as China, India, and Indonesia exhibit relatively lower utilization rates, still relying primarily on stockpiling [8,9].
As the world’s largest coal producer, China has accumulated 7 billion tons of coal gangue, with an annual increase of 700 million tons [10,11,12,13]. The stockpiling of coal gangue occupies vast amounts of land and pollutes the atmospheric environment [14,15,16]. Efficient treatment of coal gangue has become an inevitable requirement for promoting the construction of a low-carbon and environmentally friendly society in China under the current dual carbon strategy [17,18,19].
Gangue slurry backfilling, as an effective method for coal gangue disposal, operates on the following technical principles [20,21,22,23,24]. Coal gangue is mixed with water at a predetermined ratio after crushing to a specific particle size to prepare a non-cemented high-concentration slurry with a solids content of approximately 75%. This slurry is then transported via pipelines to the goaf for backfilling. Since this technology allows backfilling to proceed without interfering with coal mining processes and requires no cementitious materials, it achieves high backfilling efficiency and low operational costs [25,26,27,28]. However, this technology faces a critical challenge—the difficulty in simultaneously optimizing slurry stability and fluidity in practical engineering applications. Specifically, improved slurry stability increases flow resistance, which negatively impacts pipeline transport distance. Enhanced slurry fluidity reduces stability, raising the risk of sedimentation and pipeline blockage [29,30].
HPMC, as a polymeric additive demonstrating notable advantages in modifying slurry performance, has been widely used in cement-based materials such as mortar and concrete. Wang et al. [31] discovered that HPMC addition strengthens the flocculated network structure within the paste slurry, which enhances its stability with only a slight effect on fluidity. Zhao et al. [32] observed that an appropriate amount of HPMC maintains high fluidity while improving viscosity and segregation resistance. Yang et al. [33] concluded that HPMC enhances the homogeneity and integrity of cemented coal-mine backfill slurry with only a minor impact on pipeline flow resistance. HPMC increases slurry viscosity but has little influence on its yield stress. (Yin et al. [34]; Ebru et al. [35]; Parham et al. [36]) demonstrated that the incorporation of HPMC exerts a positive impact on 3D printing materials, primarily manifested in the enhancement of slurry extrudability, shape stability, and buildability.
Based on the application of HPMC in cement-based materials, some researchers have explored its effects on the performance of coal gangue slurry. Wang et al. [37] investigated the influence of compound additives on coal gangue slurry properties. Approximately 0.5% water reducer and 0.06% HPMC can reduce bleeding while maintaining fine fluidity. Ma et al. [38] discovered that a mixture of 0.06% HPMC and 0.08% air-entraining agent can achieve the optimal balance between slurry stability and fluidity.
In summary, adding an appropriate amount of HPMC to coal gangue slurry significantly improves stability while having only a minor negative impact on fluidity. These research findings have advanced the application of gangue slurry backfill technology. However, existing studies exhibit notable limitations: (1) They primarily focus on single-factor influences on gangue slurry performance, neglecting interactive effects between factors. (2) There is a lack of systematic analysis regarding HPMC’s action mechanism in gangue slurry systems.
RSM enables comprehensive consideration of systematic errors and multi-factor interactions through systematic experimental design, multivariate quadratic equation fitting, and model analysis. Response values are predicted, which provides a holistic evaluation of slurry performance evolution [39]. In light of this, the work employed RSM to investigate the influence of slurry concentration, maximum gangue particle size, and HPMC dosage on the stability and fluidity of gangue slurry. Response surface regression models for layering degree and slump flow concerning these factors were established, with an optimal slurry mix ratio proposed. The microstructure of the slurry was characterized by SEM and PLM, while LF-NMR quantified its water distribution, collectively elucidating the mechanism by which HPMC enhances gangue slurry properties. Industrial trials were conducted to validate the regulatory effect of HPMC on gangue slurry performance, providing both theoretical foundations and practical support for engineering applications. This work systematically evaluates HPMC’s role in gangue slurry for the first time, combining RSM optimization with microstructural analysis to bridge lab-to-field scalability gaps.

2. Materials and Methods
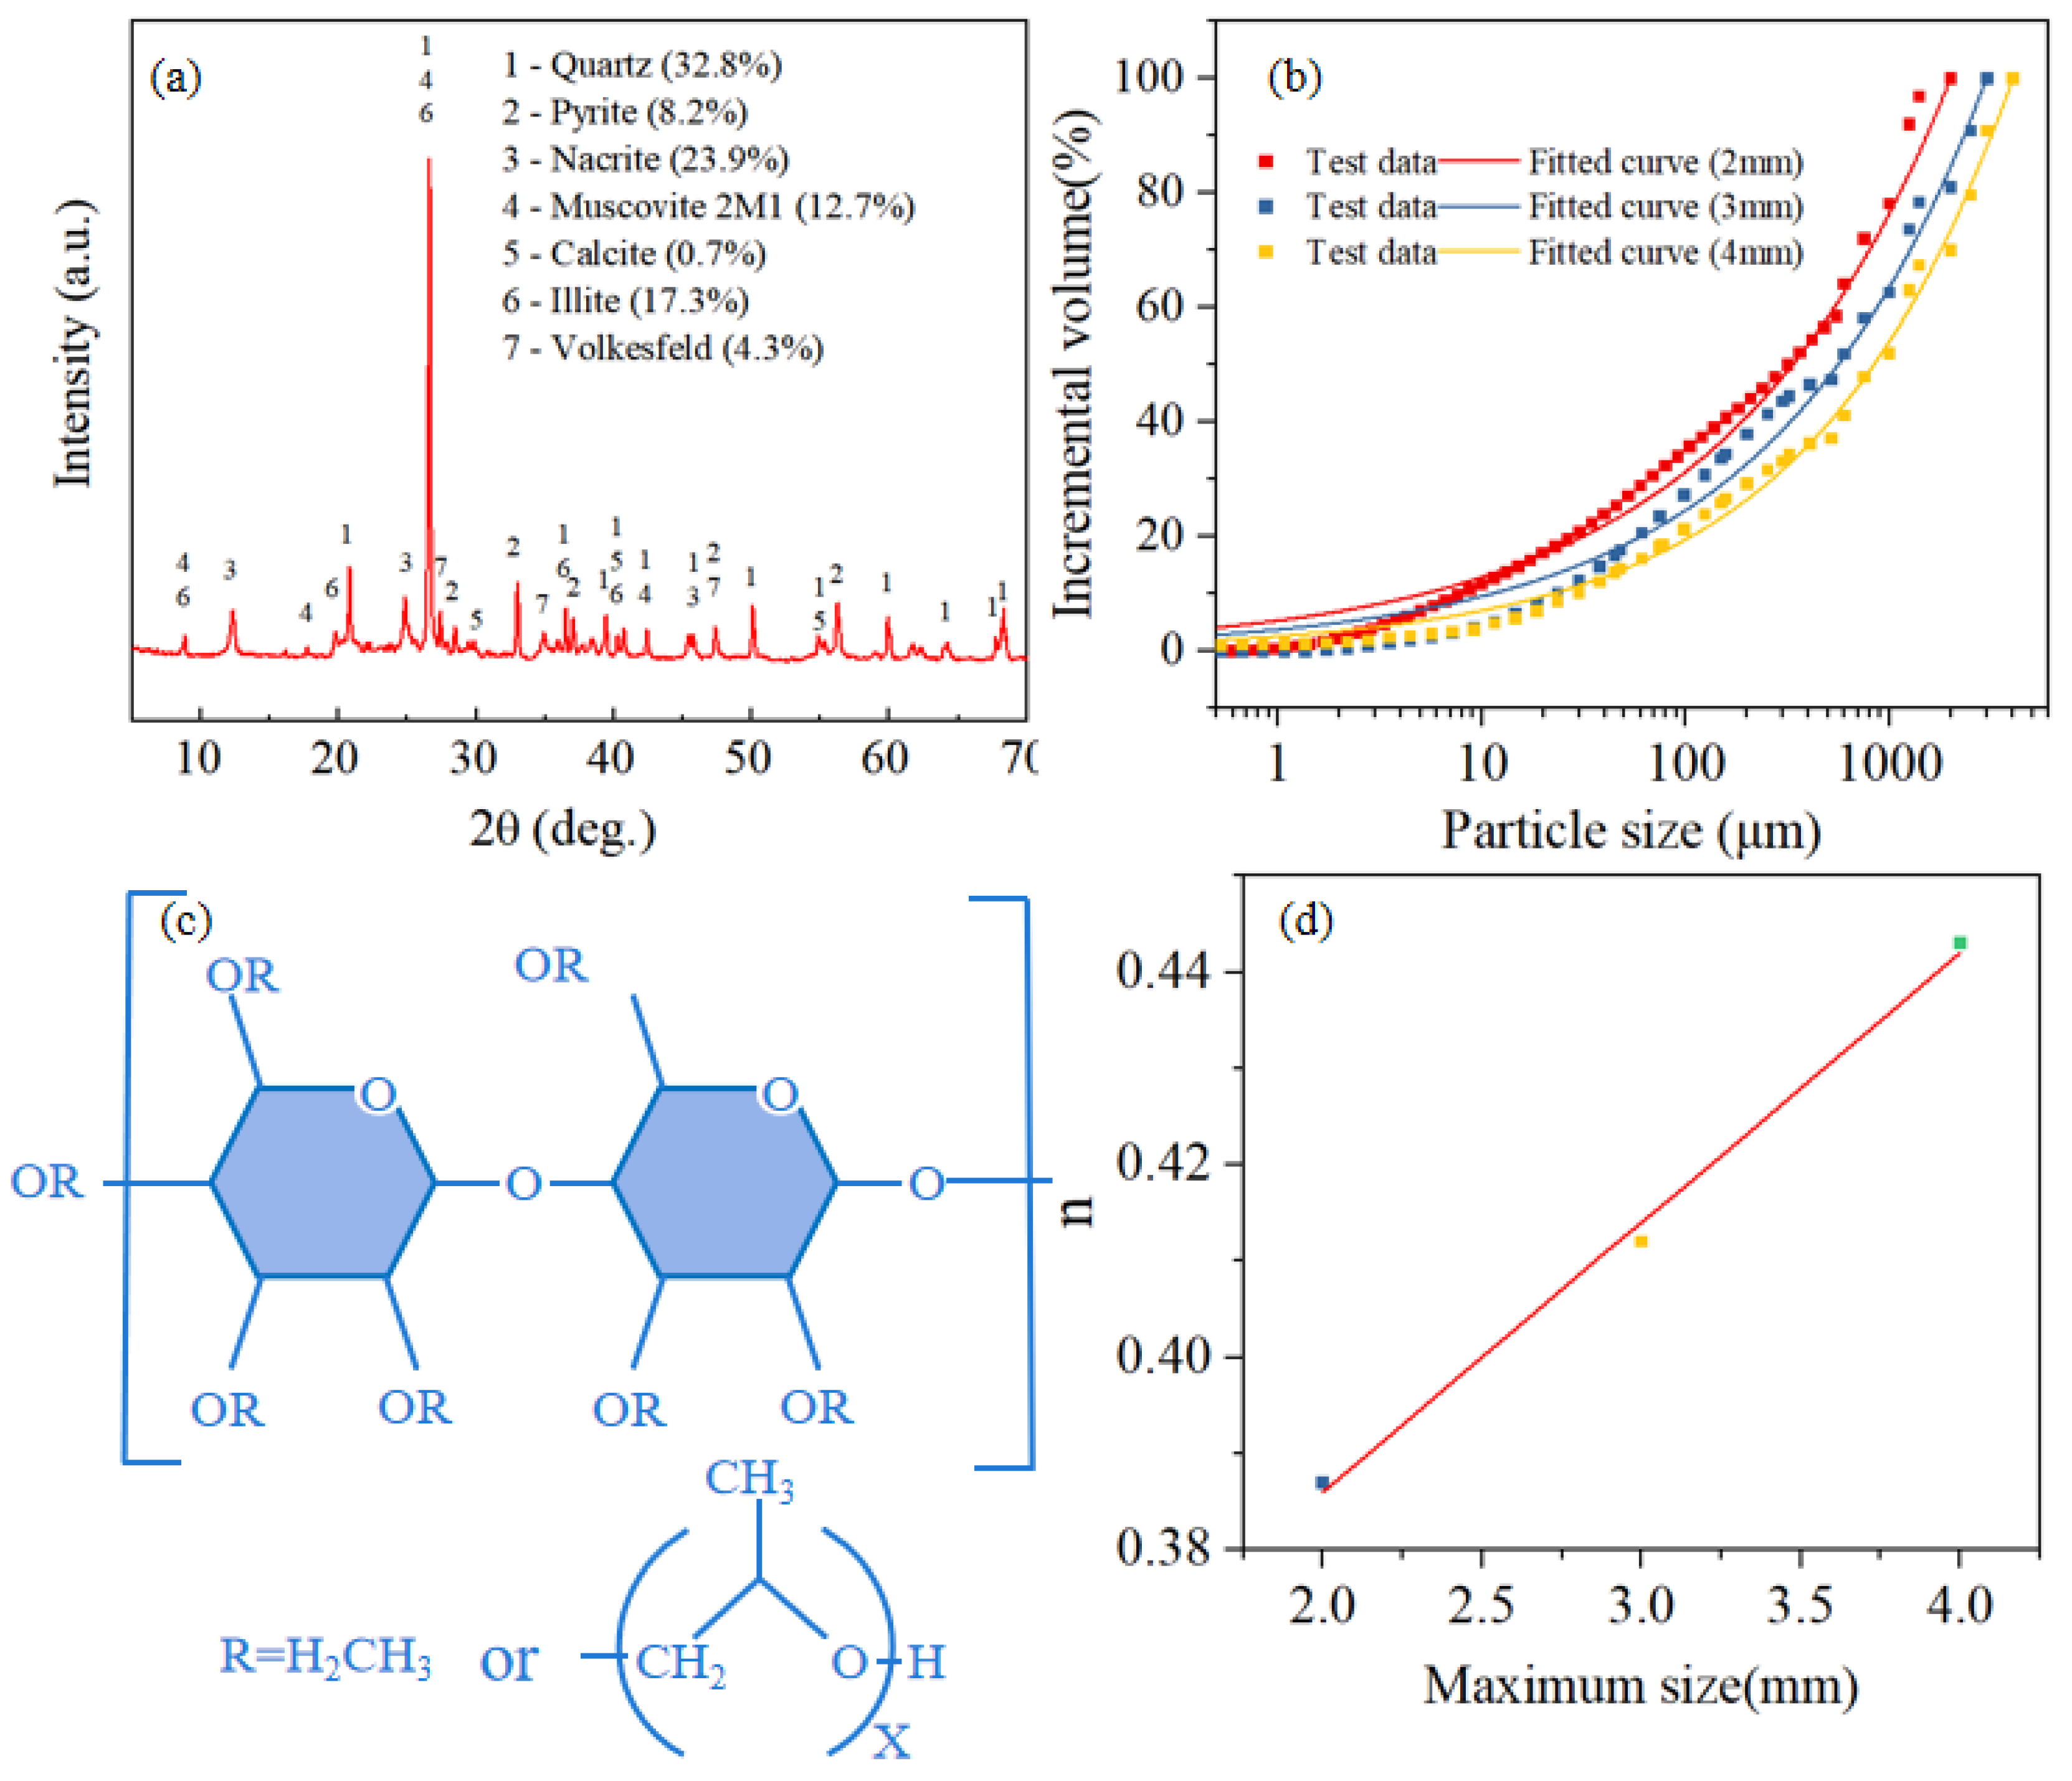
2.1. Materials

Raw materials used in the experiments included coal gangue (CG), additives, and water. Coal gangue was sourced from Wangjiata Mine in Ordos City, Inner Mongolia, China. XRD analysis reveals that its primary mineral composition consisted of quartz, paragonite, and illite, with these three minerals accounting for ≥70% of the total content (Figure 1a). Gangue was crushed using a hammer crusher into three maximum particle sizes of 2, 3, and 4 mm. The particle size distribution (PSD) curves (Figure 1b) are accurately fitted (R2 > 0.98) using the Talbol gradation formula (Equation (1)), with corresponding gradation index n of 0.443, 0.412, and 0.387, respectively. Taking the maximum particle size of gangue as the horizontal axis and n as the vertical axis, a graph is plotted (Figure 1d). The relationship between the two is established through fitting (Equation (2)). The additive selected is HPMC, whose non-ionic aqueous solution exhibits thickening, suspending, and stabilizing effects [25]. Figure 1c presents its molecular structure (MS) formula. The experimental water used is municipal tap water compliant with the GB 5749-2022 standard [40], with pH of 7.2 ± 0.3, which meets the experimental requirements.
y = 100 d i d max n
where d i represents different particle sizes; d m a x represents the maximum particle size in the material; y represents the percentage of particles smaller than size d i .
y = 0.33 + 0.028 × x   ( R 2 = 0.996 )

2.2. Experimental Design and Sample Preparation

Slurry performance is influenced by multiple factors, including main effects and interaction effects. Traditional single-factor analysis neglects interactions between factors, which makes it difficult to systematically reveal the variation of slurry performance. In contrast, RSM can simultaneously analyze multi-factor interactions and enable continuous prediction and optimization of response values [39].
The work employed the Box-Behnken Design (BBD) to construct a three-factor, three-level experiment, investigating the effects of X1 (76–78%), X2 (2–4 mm), and X3 (0–0.06%) on layering degree (Y1) and slump flow (Y2). Table 1 lists the experimental factor levels and coding scheme.
During sample preparation, HPMC was first dissolved in water at 1% concentration and left to stand for 24 h to ensure complete dissolution. According to the experimental design scheme, coal gangue and water were sequentially added into a mixer and stirred until homogeneous. Subsequently, the HPMC solution was incorporated and mixed again to ensure uniformity. A portion of the prepared slurry was taken for slurry stability and fluidity tests, while the remaining slurry was poured into standard Φ50 × 100 mm molds. The samples were cured at room temperature for 7 days before demolding, followed by continued curing for 28 days for microstructural analysis of the hardened filling material.

2.3. Experimental Methods

2.3.1. Slurry Stability Test

Slurry stability was evaluated using the layering degree test, which combined a layering degree cylinder and a consistency meter. The layering degree cylinder consisted of an upper section (200 × Φ200 mm) and a lower section (100 × Φ200 mm). The consistency meter included a test cone (H145 × Φ75 mm), a graduated scale, and a container cylinder (H180 × Φ150 mm). Freshly mixed slurry was poured into the layering degree cylinder and allowed to stand for 2 h. Following the JGJ/T 70-2009 standard [41], slurry consistency in the upper and lower sections was measured separately. The difference in consistency between the two sections was recorded as the layering degree.

2.3.2. Slurry Fluidity Test

Slurry fluidity was characterized by slump flow. The test apparatus included a mini slump cone with an upper diameter of 50 mm, a lower diameter of 100 mm, and a height of 150 mm. The test procedure followed the GB/T 2419-2005 standard [42]. Each slurry mixture was tested three times, and the average was taken to minimize experimental error.

2.3.3. Determining Water Distribution in Slurry

Hydrogen protons in water molecules possess nuclear spin characteristics. Low-Field Nuclear Magnetic Resonance (LF-NMR) applies radiofrequency pulses to induce energy level transitions in hydrogen protons. Relaxation time T2, characterizing the distribution of water molecules in the material, was recorded as the high-energy-state protons return to the low-energy state after pulse termination. The relaxation time corresponding to the peak value in the T2 curve reflects the water freedom degree—longer relaxation time indicates a higher water freedom degree. The peak area quantitatively represents the relative volume content of water in different states. The tests were conducted using a MesoMR23-060H-I NMR analyzer (Suzhou Niumag Corporation, Suzhou, China) with the magnetic field strength of 0.3 ± 0.03 T, an operating frequency of 12 MHz, and 60 mm probe coils. Data were obtained based on the Carr-Purcell-Meiboom-Gill (CPMG) sequence.

2.3.4. Microscopic Morphology Observation of Materials

The microscopic morphology of naturally hardened slurry was observed using a Scanning Electron Microscope (SEM, Model JSM-6700F). Hardened slurry samples were polished into a 1 cm3 cube, and then observed under vacuum conditions after coating with conductive film. A Murzider 9224 Polarized Light Microscopy (PLM) (Mashidi (Dongguan) Technology Co., Ltd., Dongguan, China) was employed to examine the microscopic morphology of fine particles in the diluted slurry state and complement SEM observations. Dilute the slurry with water at a ratio of 1:200. Allow the mixture to stand for 2 min. Extract the upper suspension and place a droplet on a glass slide. Position the slide on the PLM stage and adjust the magnification for observation.

3. Results and Discussion

3.1. Experimental Results and Response Surface Regression Model

Table 2 lists the measured Y1 and Y2 of slurries with different ratios. A multivariate quadratic nonlinear model (Equation (3)) is employed to fit the 15 sets of experimental data from Table 2. Equations (4) and (5) show the established response surface model between the response values of Y1 and Y2 and the influencing factors of X1, X2, and X3, respectively. The response surface regression analysis demonstrates high model accuracy, with R2 of 0.9981 and 9978 for the layering degree model and slump flow models, respectively.
Y = β 0 + i = 1 k β i X i + i = 1 k β i i X i 2 + i = 1 k β i j X i X j + ε   ( i = 1 , 2 , , n 1 )
Y 1 = 913.0 + 30.9 X 1 20.3 X 2 + 620.1 X 3 + 0.35 X 1 X 2 10.0 X 1 X 3 + 7.5 X 2 X 3 0.25 X 1 2 0.42 X 2 2 189.8 X 3 2
Y 2 = 132476 + 3525.2 X 1 964.0 X 2 + 3419.4 X 3 + 13.5 X 1 X 2 50.0 X 1 X 3 + 100.0 X 2 X 3 23.42 X 1 2 7.92 X 2 2 6574.1 X 3 2

3.2. Variance Analysis of the Response Surface Regression Model

A significance test is conducted on the model through variance analysis (Table 3) to verify the reliability of the response surface regression model. F-values of the layering degree and slump flow models are 3537.4 and 1331.97, respectively, both significantly greater than F0.05(9, 5) ≈ 4.77, with p-value for both models were far below 0.0001, which indicates that the models are highly reliable.
Scatter plots are generated to compare the predicted values (y-axis) and actual values (x-axis) of the laying degree and slump flow (Figure 2). Scatter points are evenly distributed near the Y = X line, exhibiting an approximately linear relationship. High consistency between the model’s predicted values and the actual values demonstrates that both models possess high reliability for predicting slurry performance.

3.3. Influence of Single Factors on Slurry Performance

In Table 3, the p-values of X1, X2, and X3 are all less than 0.0001, demonstrating significant effects of these factors on both slurry layering degree and slump flow. The relationship F(X1) > F(X2) > F(X3) indicates that the primary-to-secondary order of influence on the layering degree and slump flow is: slurry concentration > maximum gangue particle size > HPMC dosage.
Figure 3a (X2 = 3 mm and X3 = 0%), Figure 3b (X1 = 77% and X3 = 0%), and Figure 3c (X1 = 77% and X2 = 3 mm) illustrate the effects of slurry concentration (X1), maximum gangue particle size (X2), and HPMC dosage (X3) on slurry performance. Increased slurry concentration, reduced maximum gangue particle size, or increased HPMC dosage enhance slurry stability but reduce its fluidity. Fluidity loss rate L is defined as the ratio of the slump flow range to the layering degree range under the same factor (L = Δslump flow/Δlayering degree), providing a quantitative assessment of the combined impact of each factor on slurry stability and fluidity. Based on data in Figure 3, L(X1) = 6.84, L(X2) = 6.74, and L(X3) = 3.76. Improved slurry stability by increasing slurry concentration, reducing maximum gangue particle size, or adding HPMC dosage negatively affects fluidity in the following order: slurry concentration > maximum gangue particle size > HPMC dosage. Notably, incorporating small HPMC dosage significantly enhances slurry stability and maintains acceptable fluidity, demonstrating a superior comprehensive regulatory advantage.

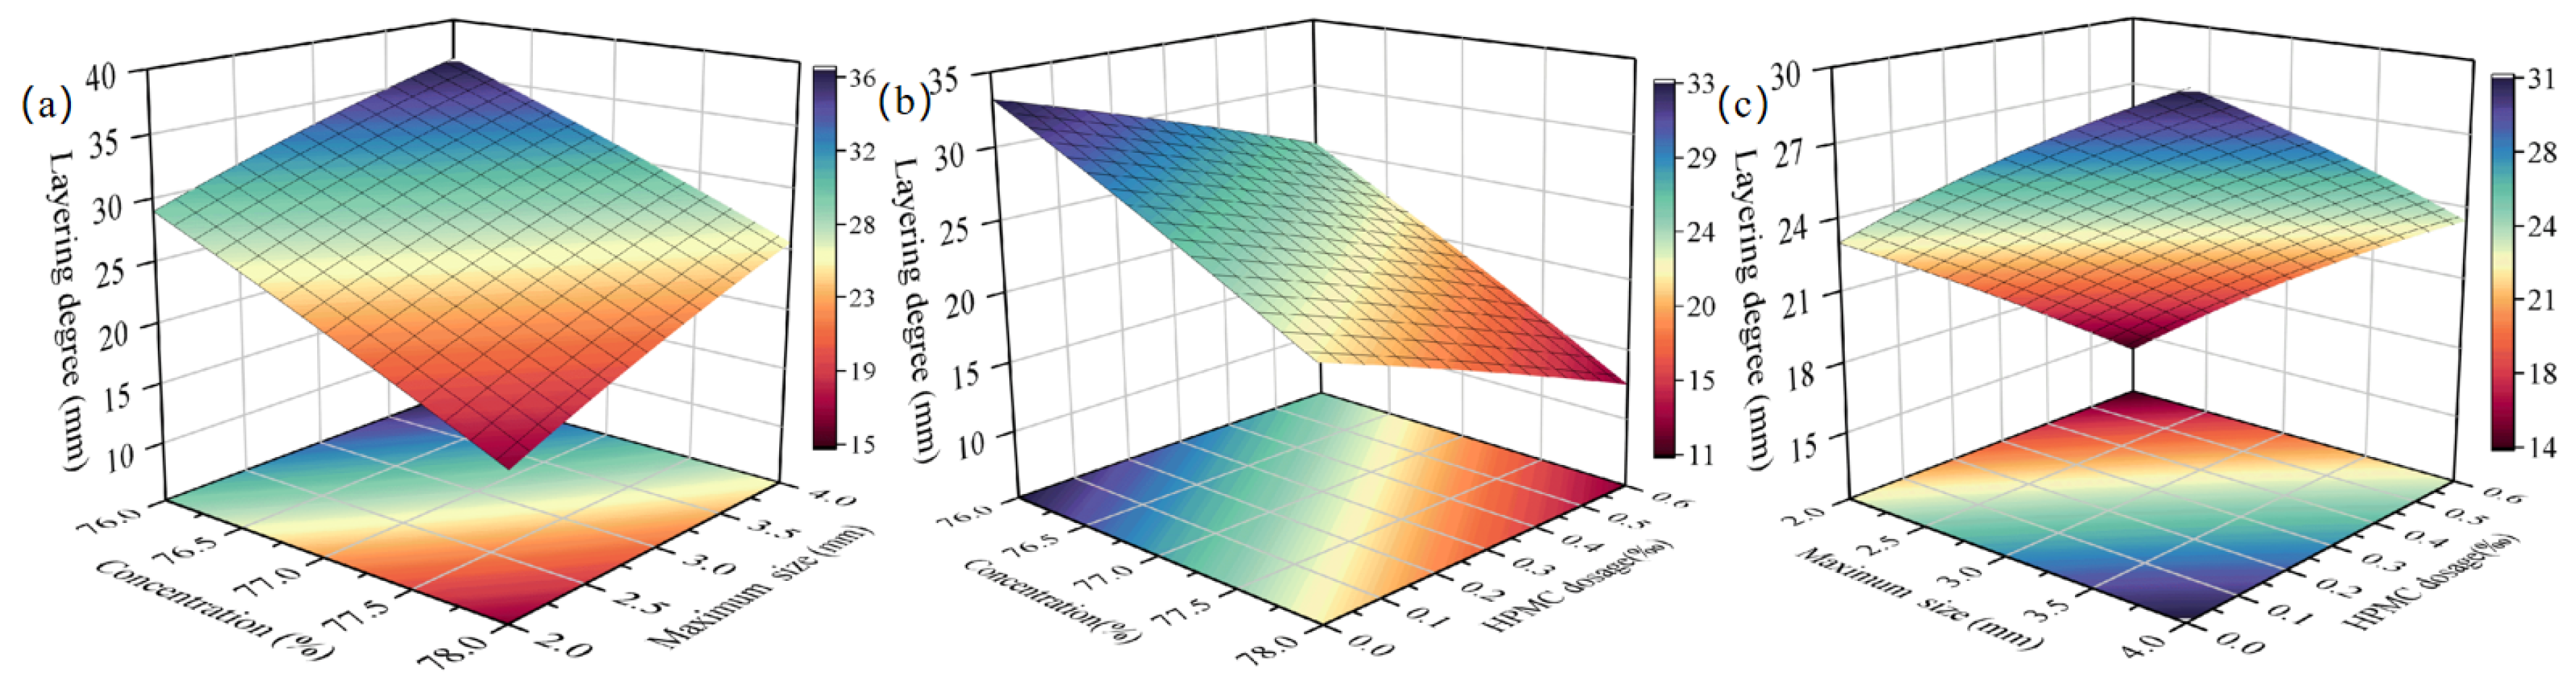
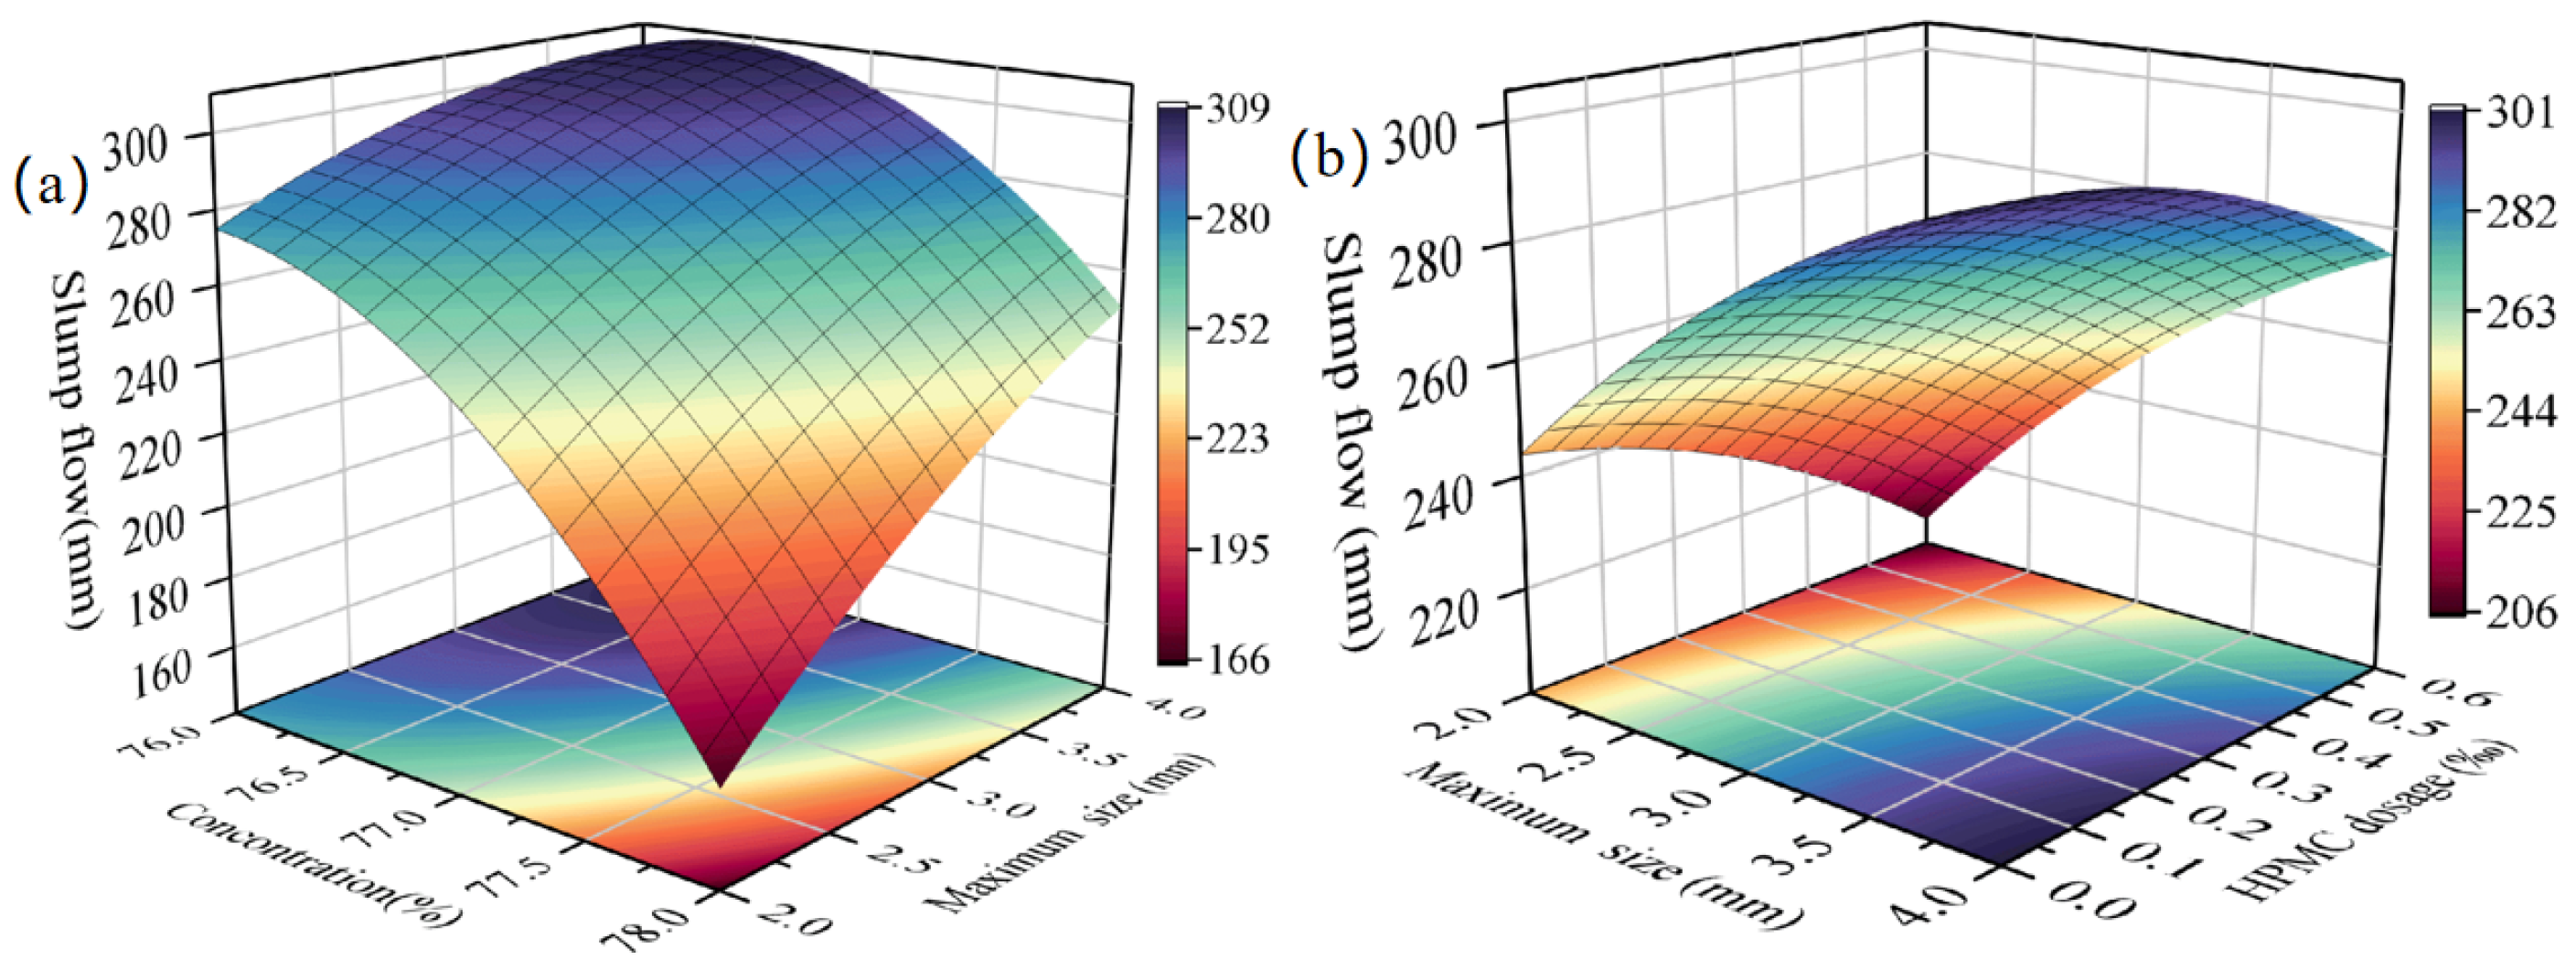
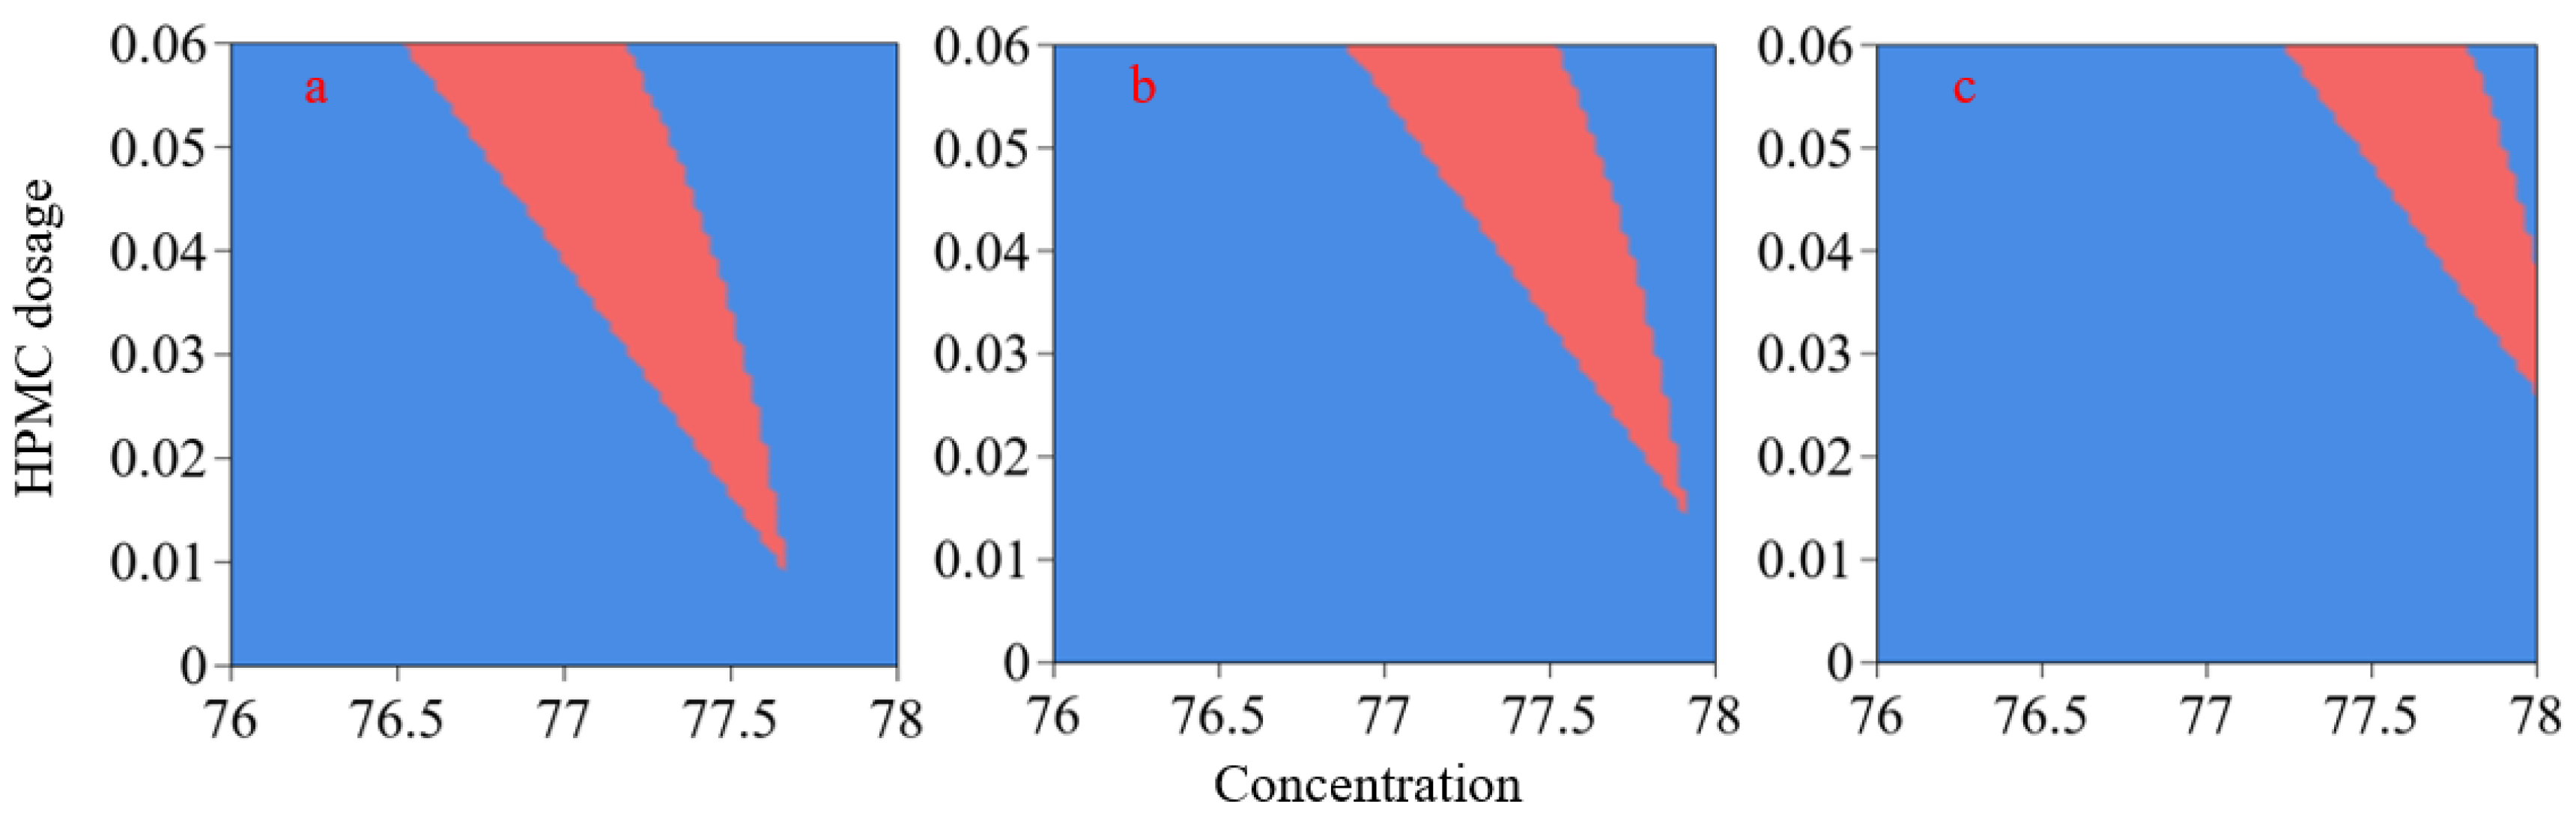
3.4. Multi-Factor Interaction Effects

3.4.1. Slurry’s Layering Degree

In Table 3, the p-values of X1X2, X1X3, and X2X3 in layering degree models are less than 0.05, indicating a highly significant effect on layering degree. Figure 4a–c show the relationships between the interaction terms—X1X2 (X3 = 0%), X1X3 (X2 = 3 mm), and X2X3 (X1 = 77%)—and layering degree, respectively.
In Figure 4a, with X3 = 0%, as X1 increases from 76 to 78%, the layering degree decreases from 29.0 to 16.5 mm (a reduction of 12.5 mm) at X2 = 2 mm and from 36.6 to 25.5 mm (a reduction of 11.1 mm) at X2 = 4 mm. The influence of X1 on the layering degree becomes stronger as X2 decreases. In Figure 4b, with X2 = 3 mm, as X1 increases from 76 to 78%, the layering degree decreases by 11.8 mm at X3 = 0% and by 10 mm at X3 = 0.06%. The lower the X3, the more sensitive the layering degree is to changes in X1. In Figure 4c, with X1 = 77%, as X3 increases from 0 to 0.06%, the layering degree decreases by 7.9 mm at X2 = 4 mm and by 8.8 mm at X2 = 2 mm. The smaller the X2, the greater the impact of X3 on the layering degree.

3.4.2. Slurry Fluidity

Table 3 shows that X1X2 and X2X3 (p < 0.05) significantly affect the slurry’s slump flow, while X1X3 (p > 0.05) does not. Figure 5a (X3 = 0%) and Figure 5b (X1 = 77%) illustrate the influences of X1X2 and X2X3 on layering degree, respectively.
In Figure 5a, with X3 = 0%, as X1 increases from 76 to 78%, slump flow decreases by 54 mm at X2 = 4 mm and by 108 mm at X2 = 2 mm. The smaller the X2, the more sensitive the slump flow is to changes in X1. In Figure 5b, with X1 = 77%, as X2 decreases from 4 to 2 mm, slump flow decreases by 56 mm at X3 = 0% and by 68 mm at X3 = 0.06%. Higher X3 enhances the influence of X2 on slump flow.

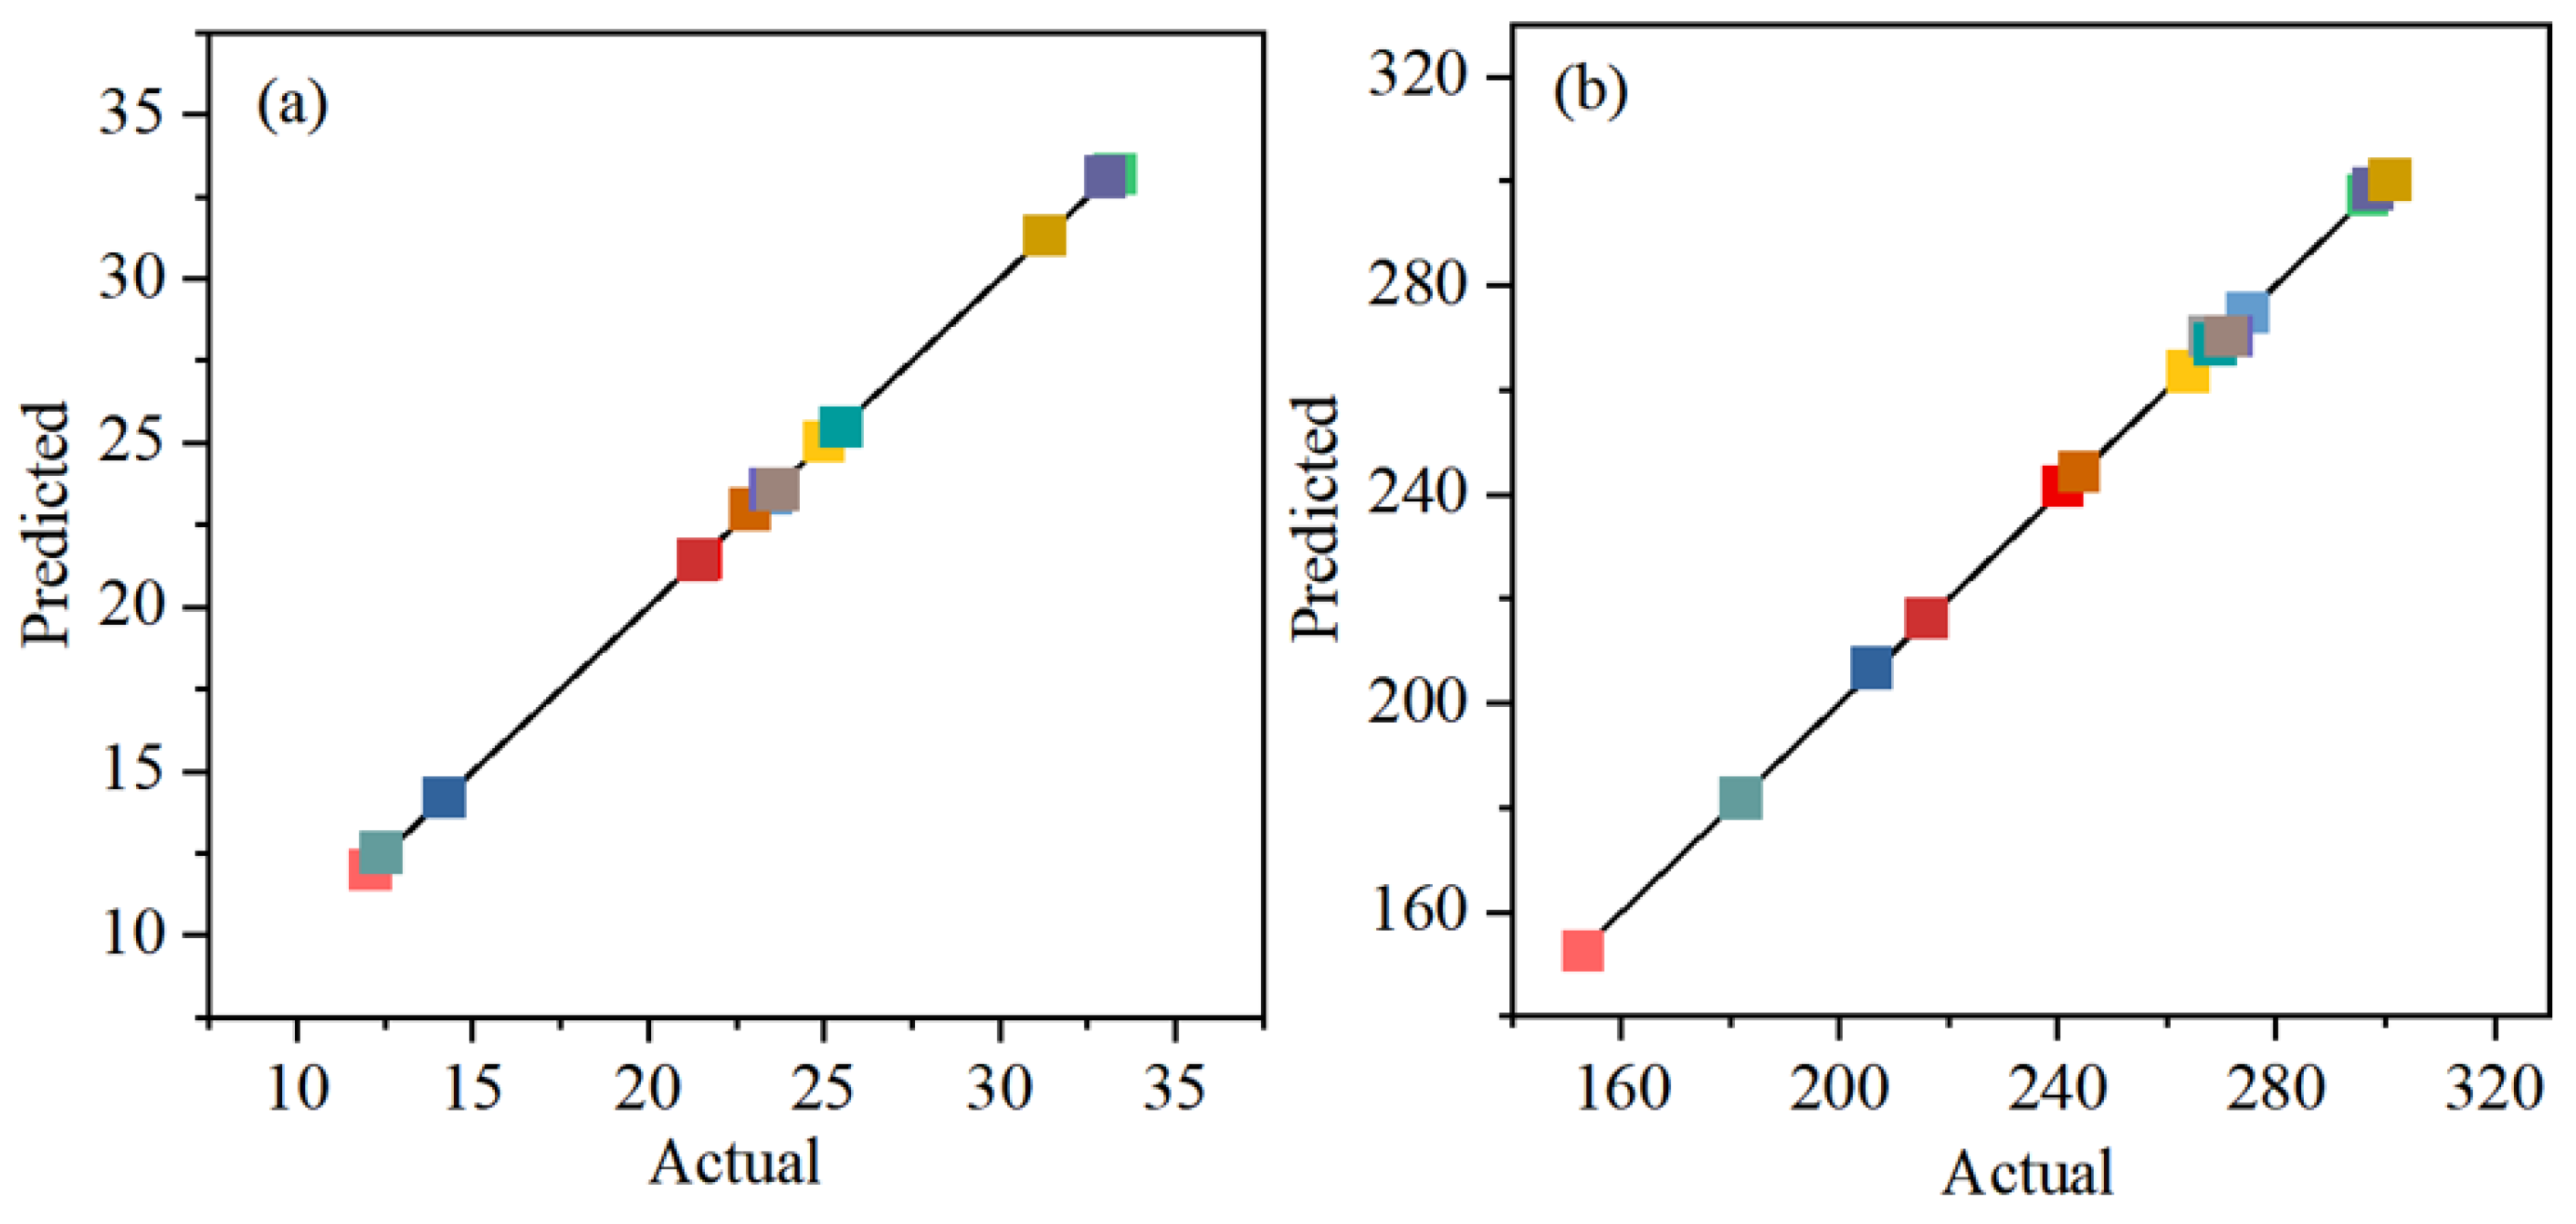
3.5. Mix Proportion Validation of Gangue Slurry

Fine fluidity and stability are a prerequisite for ensuring normal backfilling of gangue slurry. Slurry segregation can be avoided when the layering degree is ≤ 20 mm. When slump flow > 220 mm, the slurry meets the required flowability. Based on these constraints, the optimal mix proportion of gangue slurry was determined using the optimization module in Design-Expert 13. The results demonstrate that when the maximum gangue particle size exceeds 3.5 mm, the feasible slurry range becomes narrow, which makes it impractical for actual slurry preparation. Additionally, current equipment exhibits low efficiency and excessive wear when gangue is crushed to a maximum particle size of 2 mm. Therefore, the maximum particle size should be controlled within 2.5–3.5 mm. Based on Equation (2), the corresponding gradation index (n) is 0.40–0.428. Figure 6 illustrates reasonable slurry concentration and HPMC dosage for the maximum particle sizes of 2.5, 3, and 3.5 mm. The red regions represent feasible solutions that satisfy the layering degree (≤20 mm) and slump flow (>220 mm).
Four ratios within the red region are selected for laboratory testing (Table 4) to verify the accuracy of model predictions. The prediction errors for both layering degree and slump flow of the four slurries are less than 5%, confirming the reliability of the response surface model.

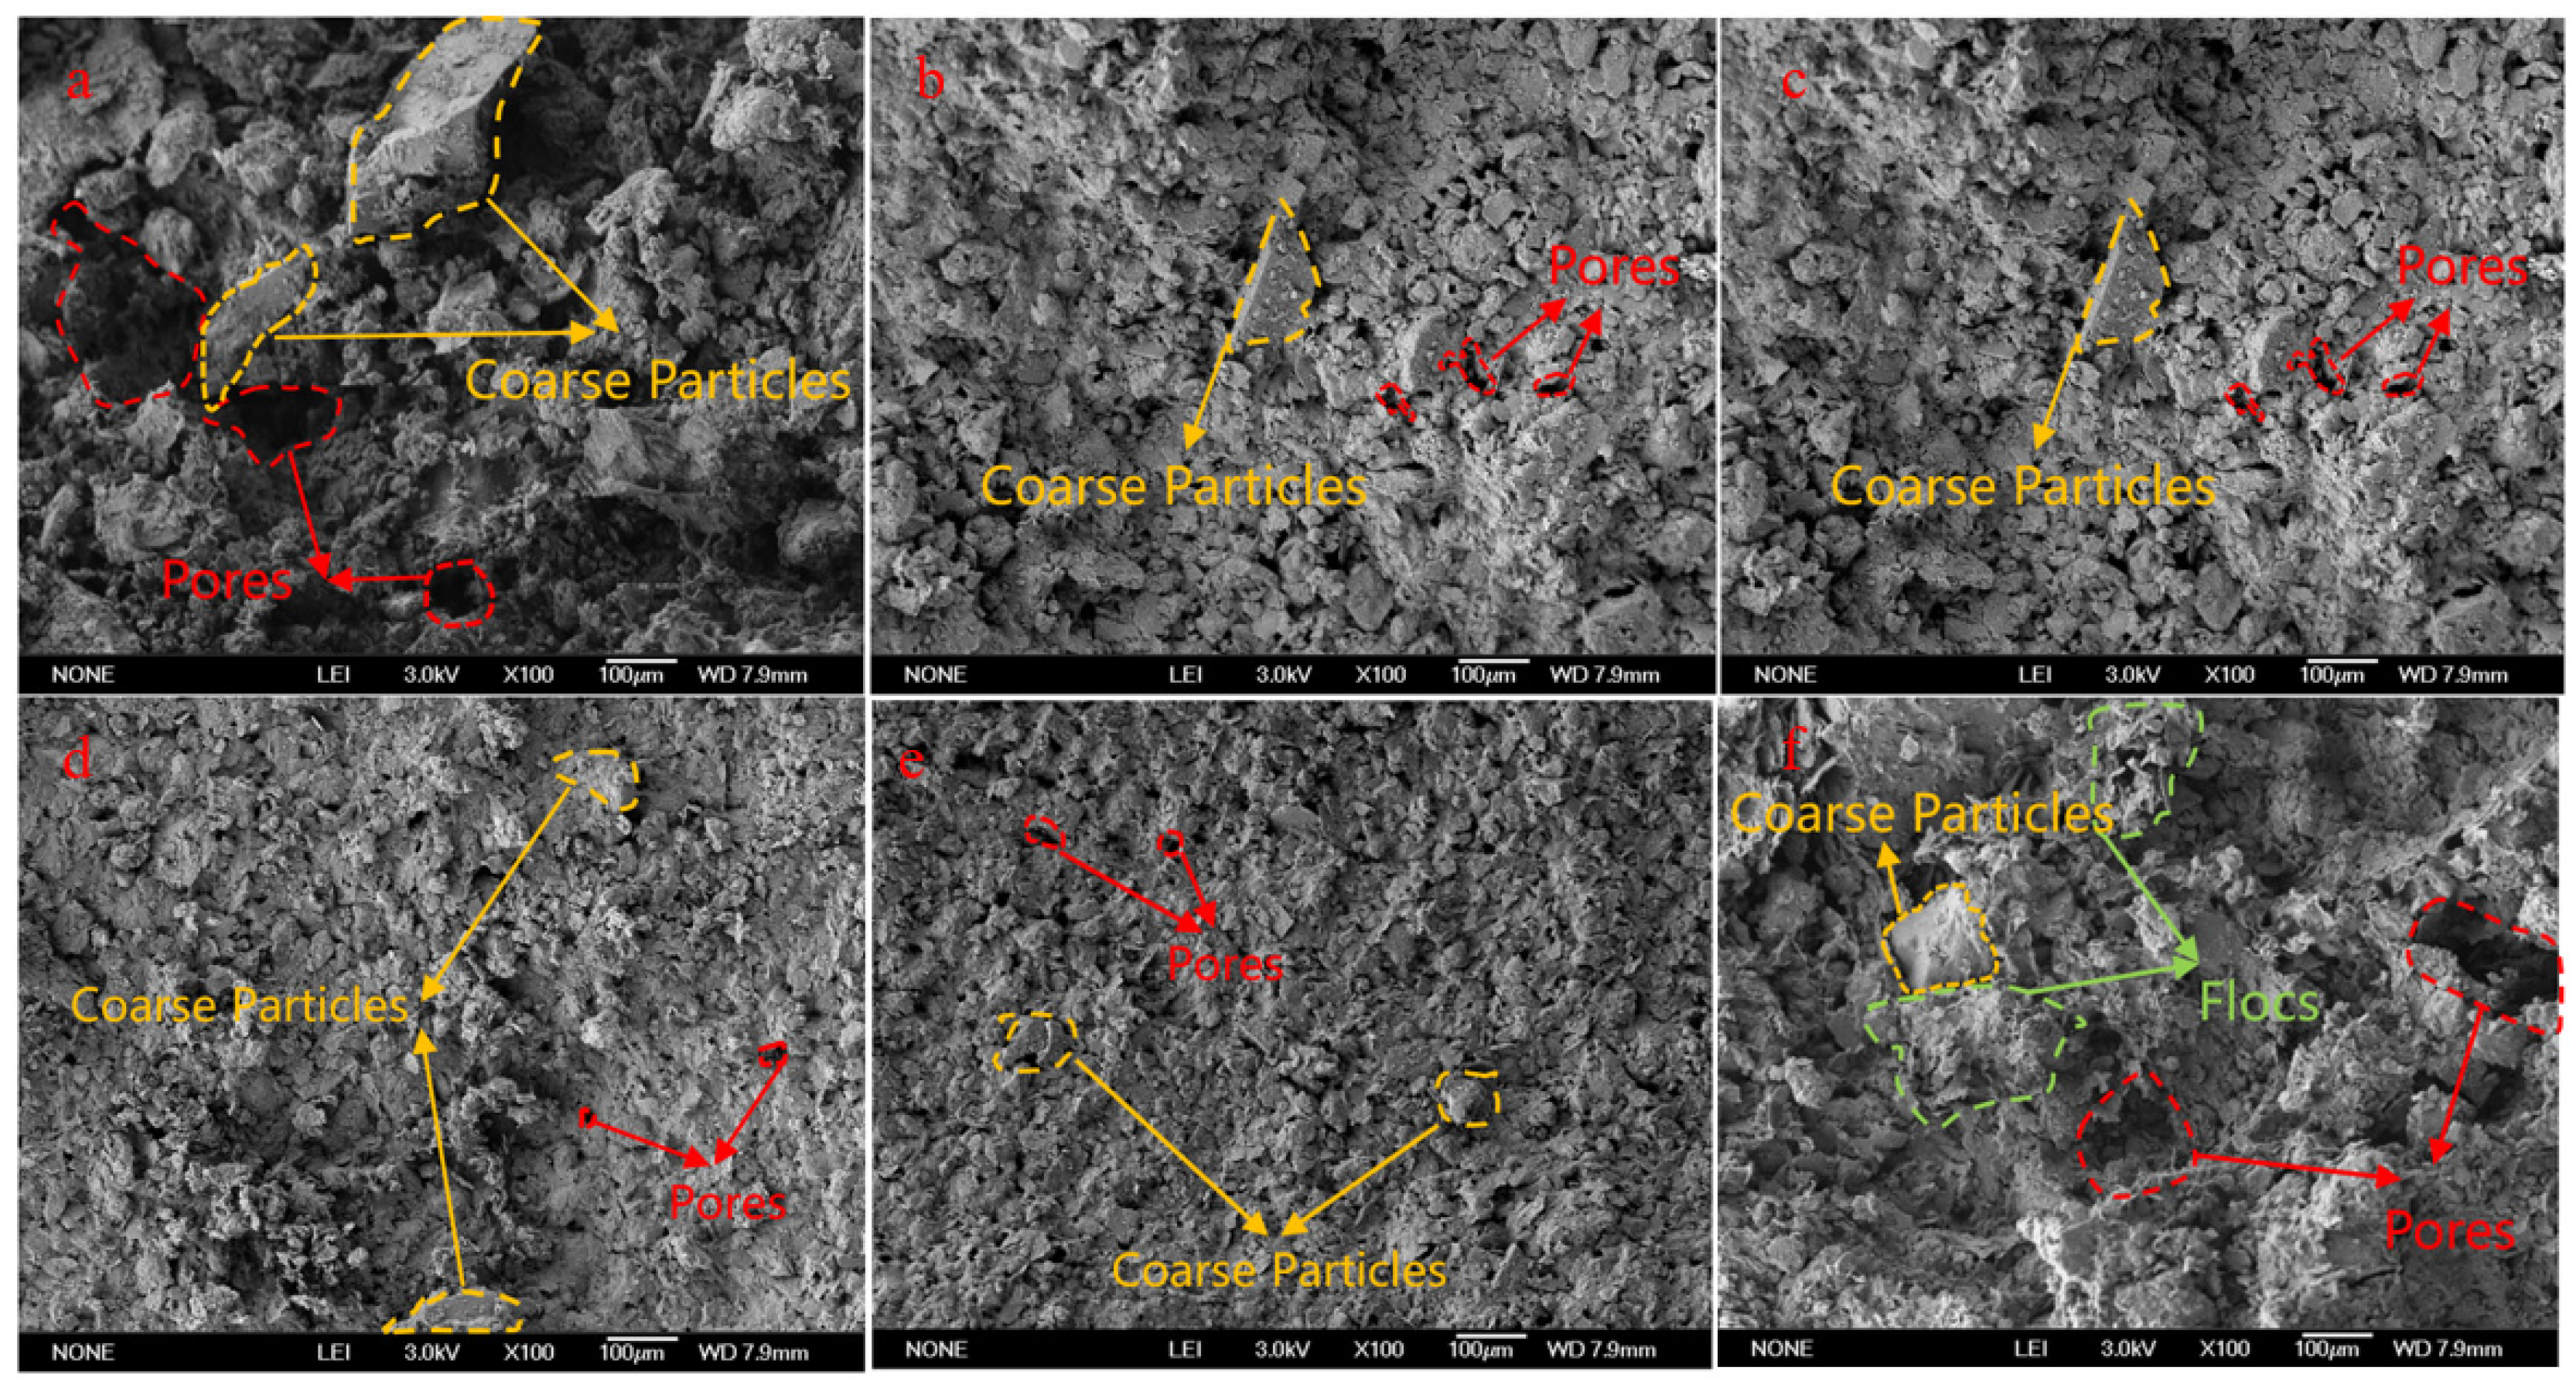
3.6. Microscopic Morphology Analysis of Slurry

3.6.1. SEM Observation

SEM is used to investigate the effects of slurry concentration, maximum gangue particle size, and HPMC dosage on the microstructure of consolidated slurry (Figure 7). As slurry concentration increases, slurry density increases (Figure 7b,d,e). This is attributed to the increased solid content, promoting a tighter packing of gangue particles, which compresses pore sizes. The reduction in the maximum gangue particle size (Figure 7a–c) induces a transformation in the slurry structure. Specifically, the structure evolves from a loose configuration characterized by large pores and dominated by coarse particles to a denser arrangement featuring smaller pores and composed of finer particles. This transition is due to the decrease in the maximum particle size, which increases the number of particles and shortens the average distance between particles.
HPMC addition significantly alters the slurry structure (Figure 7b,f). Fine particles are dispersed independently with clear contours without HPMC. However, fine particles adhere to each other after HPMC addition, which forms a flocculent network structure permeating the slurry system. The multi-point active groups on the HPMC polymer chains can simultaneously bind to unsaturated bonds on the surfaces of different gangue particles, acting as an adsorption bridge. This promotes the connection between particles and the formation of a network structure [43].

3.6.2. PLM Observations

A PLM is used to observe the slurry diluted 200 times (Figure 8), which can be used to intuitively obtain the floc (network) structure in the slurry. Only a small number of small flocs exist in the slurry without HPMC. Moreover, the size and quantity of these flocs slightly increase with the decreased maximum gangue particle size or increased slurry concentration. Reduced maximum gangue particle size increases the fine particle content with high surface activity, while increased slurry concentration shortens the interparticle distance. Both factors promote the interaction between fine particles, which increases the number and size of flocs. However, the limited self-flocculation ability of gangue particles underdevelops the floc structure.
Multi-scale large flocs are formed in the slurry after HPMC addition, which highly corresponds to the floc network structure observed by SEM. HPMC molecules significantly enhance the interparticle interaction through the adsorption-bridging effect.

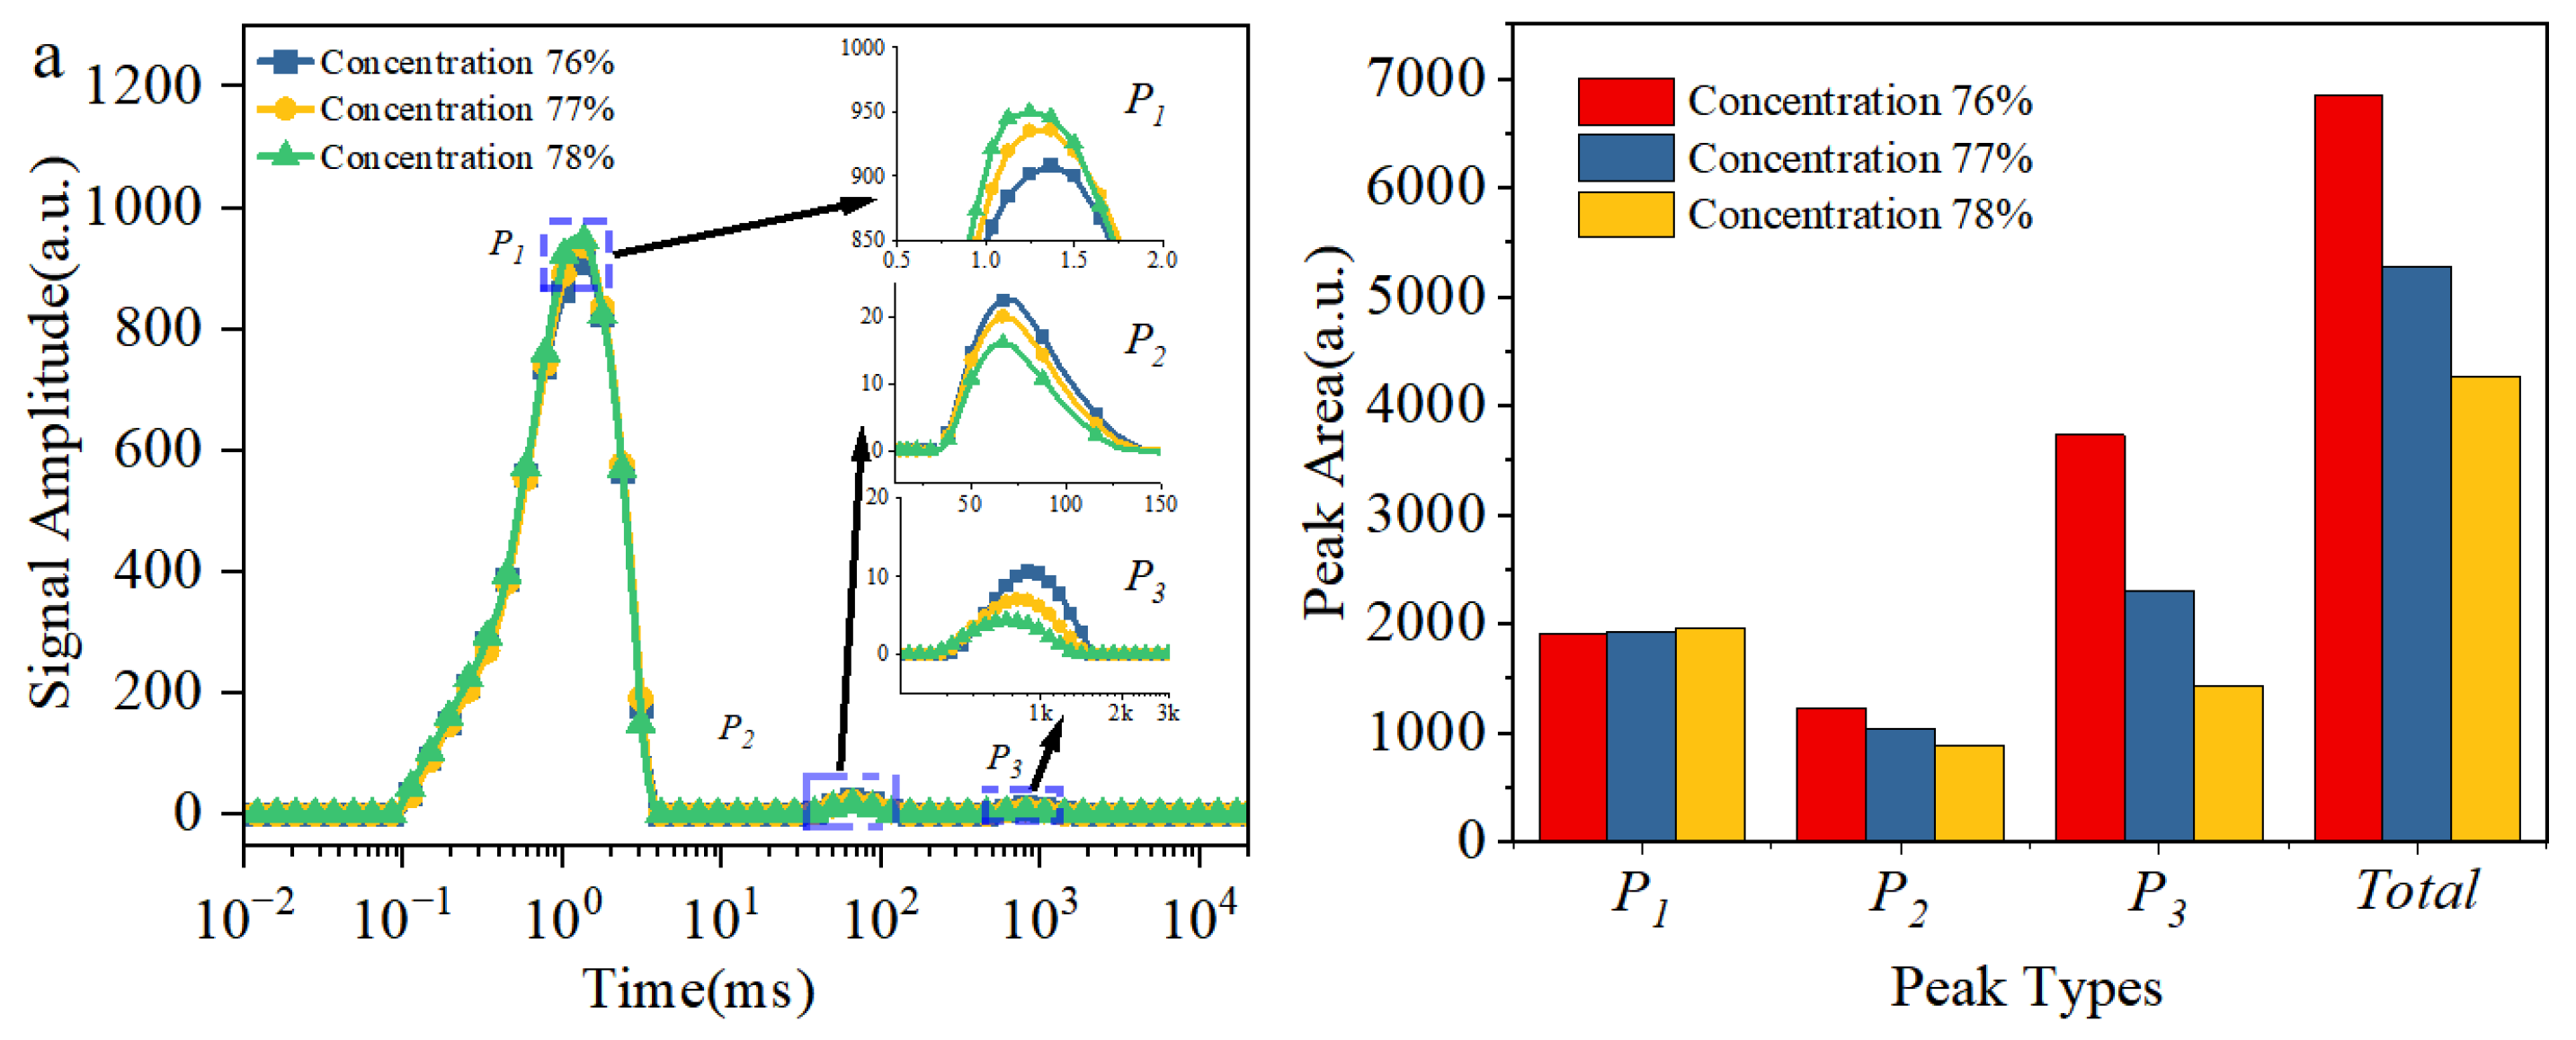
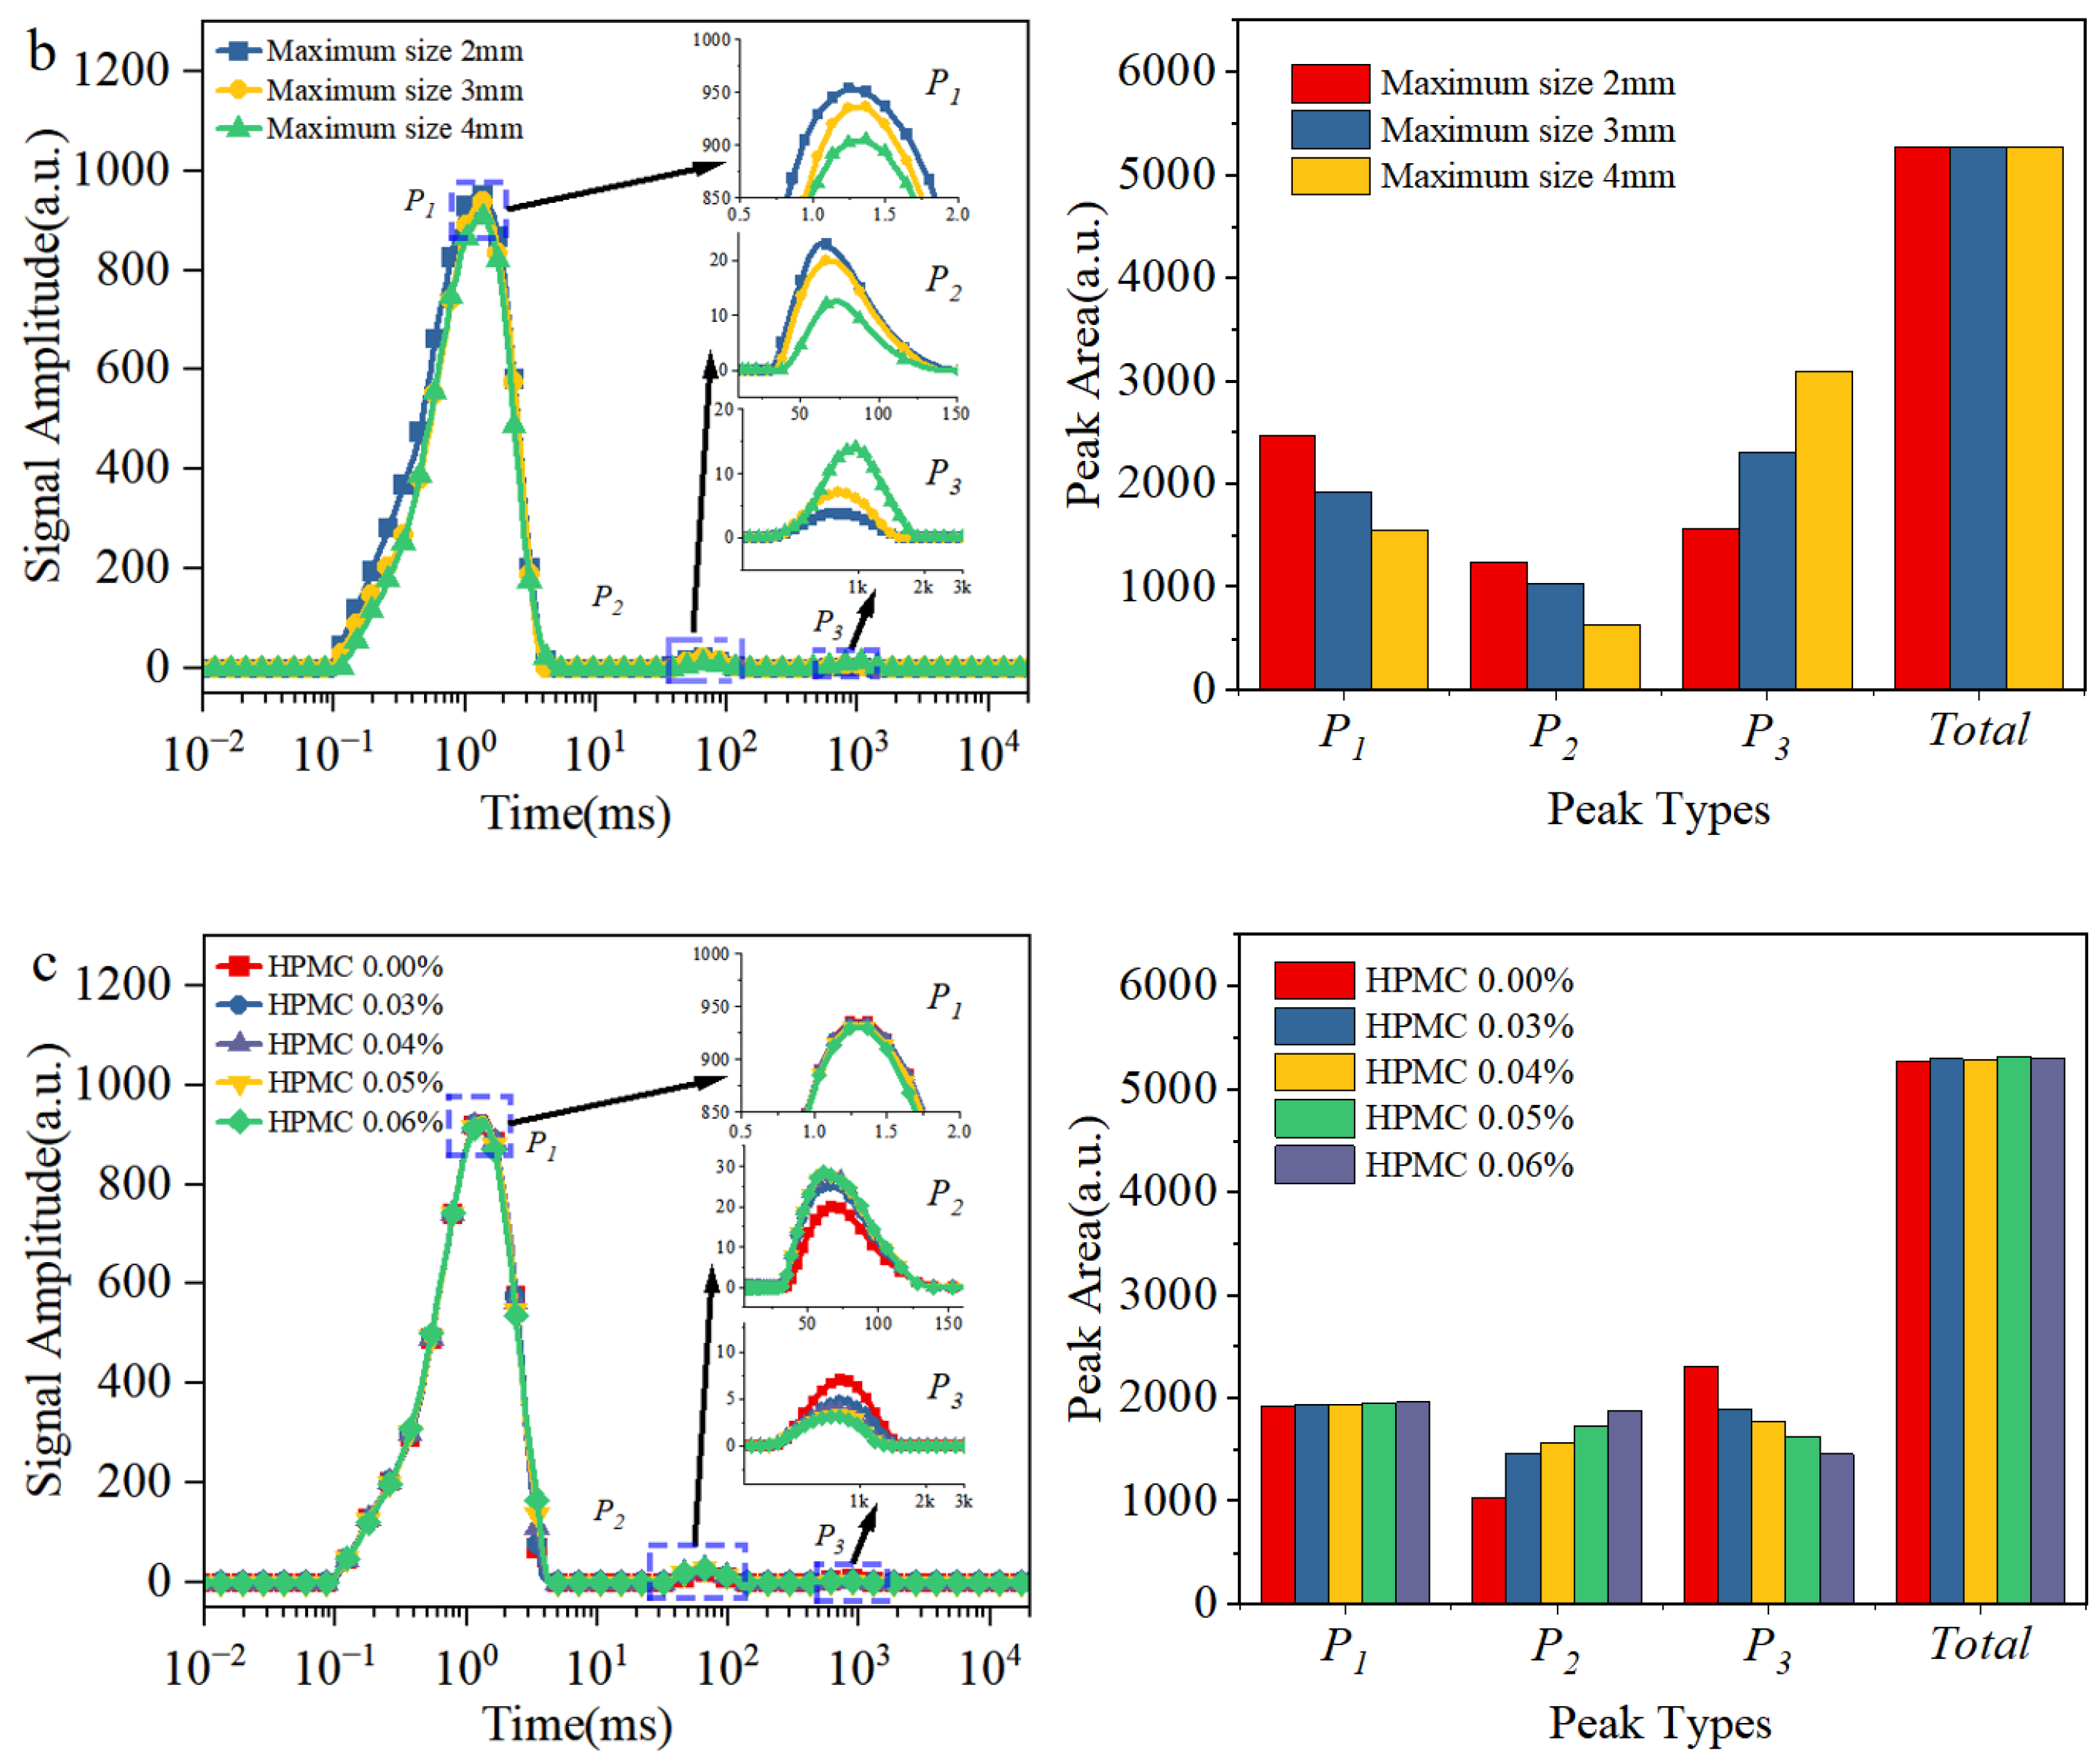
3.7. Water Distribution by LF-NMR

Figure 9 shows the T2 relaxation spectra of slurries with different ratios and the calculated areas of each relaxation peak. The T2 spectra of all slurry groups exhibit three distinct peaks, which are sequentially labeled from left to right as P1, P2, and P3. These peaks correspond to water molecules in different states of occurrence. P1 (0.1–5 ms) represents adsorbed water, referring to water molecules tightly adsorbed on particle surfaces due to the electrostatic effects of the electrical double layer. Adsorbed water exhibits quasi-solid characteristics macroscopically under strong surface confinement, with almost no flowability. P2 (10–200 ms) denotes floc water, referring to moisture trapped inside floc structures. Its mobility lies between that of free water and adsorbed water. P3 (500–2000 ms) corresponds to free water, which is distributed in the gaps between particles or flocs. This interconnected water contributes to optimal flowability [43].
For the slurry without HPMC, as slurry concentration increases from 76 to 78%, the relaxation peaks of P1, P2, and P3 in the T2 spectrum all shift to the left (Figure 9a left). The pore structure of the slurry becomes more compact with increasing concentration, which significantly restricts water mobility. Quantitative analysis of the relaxation peaks (Figure 9a right) reveals a sharp decrease in free water by 2298 a.u., indicating substantial loss due to higher concentration. Floc water decreased by 335 a.u., reflecting that reduced interparticle spacing leads to compression of the intra-floc void space. Adsorbed water shows a slight increase of 57 a.u., suggesting that double-layer adsorbed water is less affected by concentration changes. The increase in concentration primarily reduces the free water content by compressing pore space, while its impact on surface-adsorbed water and floc water is relatively limited. When the maximum gangue particle size is reduced from 4 to 2 mm, the three relaxation peaks in the T2 spectrum shift leftward (Figure 9b left). However, the moisture migration characteristics differ significantly from those influenced by concentration control. Free water decreases by 1520 a.u., with 60.1% (914 a.u.) transforming into adsorbed water and 39.9% (606 a.u.) converting into floc water, in Figure 9b right. The reduction in maximum particle size increases the fine particle content, which expands the total solid surface area and enhances the particle surface’s binding effect on water molecules. Simultaneously, the higher fine particle content promotes floc development, which strengthens the encapsulation of free water and causes partial conversion into floc water. Particle size regulation achieves moisture redistribution through a synergistic surface binding–floc encapsulation mechanism.
When the HPMC content increases from 0 to 0.6%, the range and area of P1 in the T2 relaxation spectrum remain largely unchanged, in Figure 9c. HPMC has minimal influence on adsorbed water, which exists in a stable state within the slurry. The formation of adsorbed water primarily relies on the electrical double-layer effect on the surface of gangue particles. This effect mainly depends on the physicochemical properties of the particle surface and the inherent volume of the liquid phase. The ranges of the P2 and P3 peaks show little variation. However, the P2 peak area increases by 840 a.u., while the P3 peak area decreases by 851 a.u., HPMC does not significantly change the mobility of floc water or free water; however, it facilitates the conversion of part of the free water into floc water. HPMC addition enhances interparticle interactions, which promotes the development of floc structures within the slurry. More free water is transformed into floc water after encapsulation.

3.8. HPMC Action Mechanism

Gangue slurry, as a mixed system of multi-scale particles and water (Figure 10a), initially exhibits a typical unstable structure. Gangue particles are randomly distributed, with their surfaces enveloped by an adsorbed water film stabilized by the electrical double layer. Some fine particles form flocs through mutual interactions, with floc water trapped inside these structures. A significant amount of free water occupies the gaps between flocs and particles. Coarse particles are prone to sedimentation under gravity, which results in poor slurry stability.
Traditional approaches enhance slurry stability by increasing slurry concentration or reducing the maximum particle size, yet both exhibit significant drawbacks. Their common mechanism relies on decreasing interparticle spacing to amplify the frictional force between gangue particles, which improves stability. However, this process drastically reduces the free water content, severely compromising slurry fluidity, in Figure 10b,c.
The slurry system undergoes remarkable structural refinement after HPMC addition (Figure 10d). HPMC connects fine particles through an adsorption-bridging effect to form a 3D floc network. This network acts as a mechanical framework supporting coarse particles, which inhibits sedimentation and improves slurry stability. Crucially, HPMC converts only a minimal portion of free water into floc water, preserving overall fluidity. Slurry stability and fluidity are synergistically optimized.
The effectiveness of HPMC is constrained by the inherent properties of the slurry, and its efficacy depends on appropriate slurry concentration and reasonable particle gradation. (1) The slurry should maintain a critical concentration to ensure the continuity of the flocculated network structure. (2) The fine particle content ought to meet the minimum carrier requirement for HPMC’s bridging effect. If slurry concentration is insufficient or the proportion of fine particles is too low, blindly increasing HPMC dosage will yield limited improvement and significantly raise backfilling costs. Therefore, slurry concentration, maximum gangue particle size, and HPMC dosage need to be considered to optimize slurry performance in practical applications.

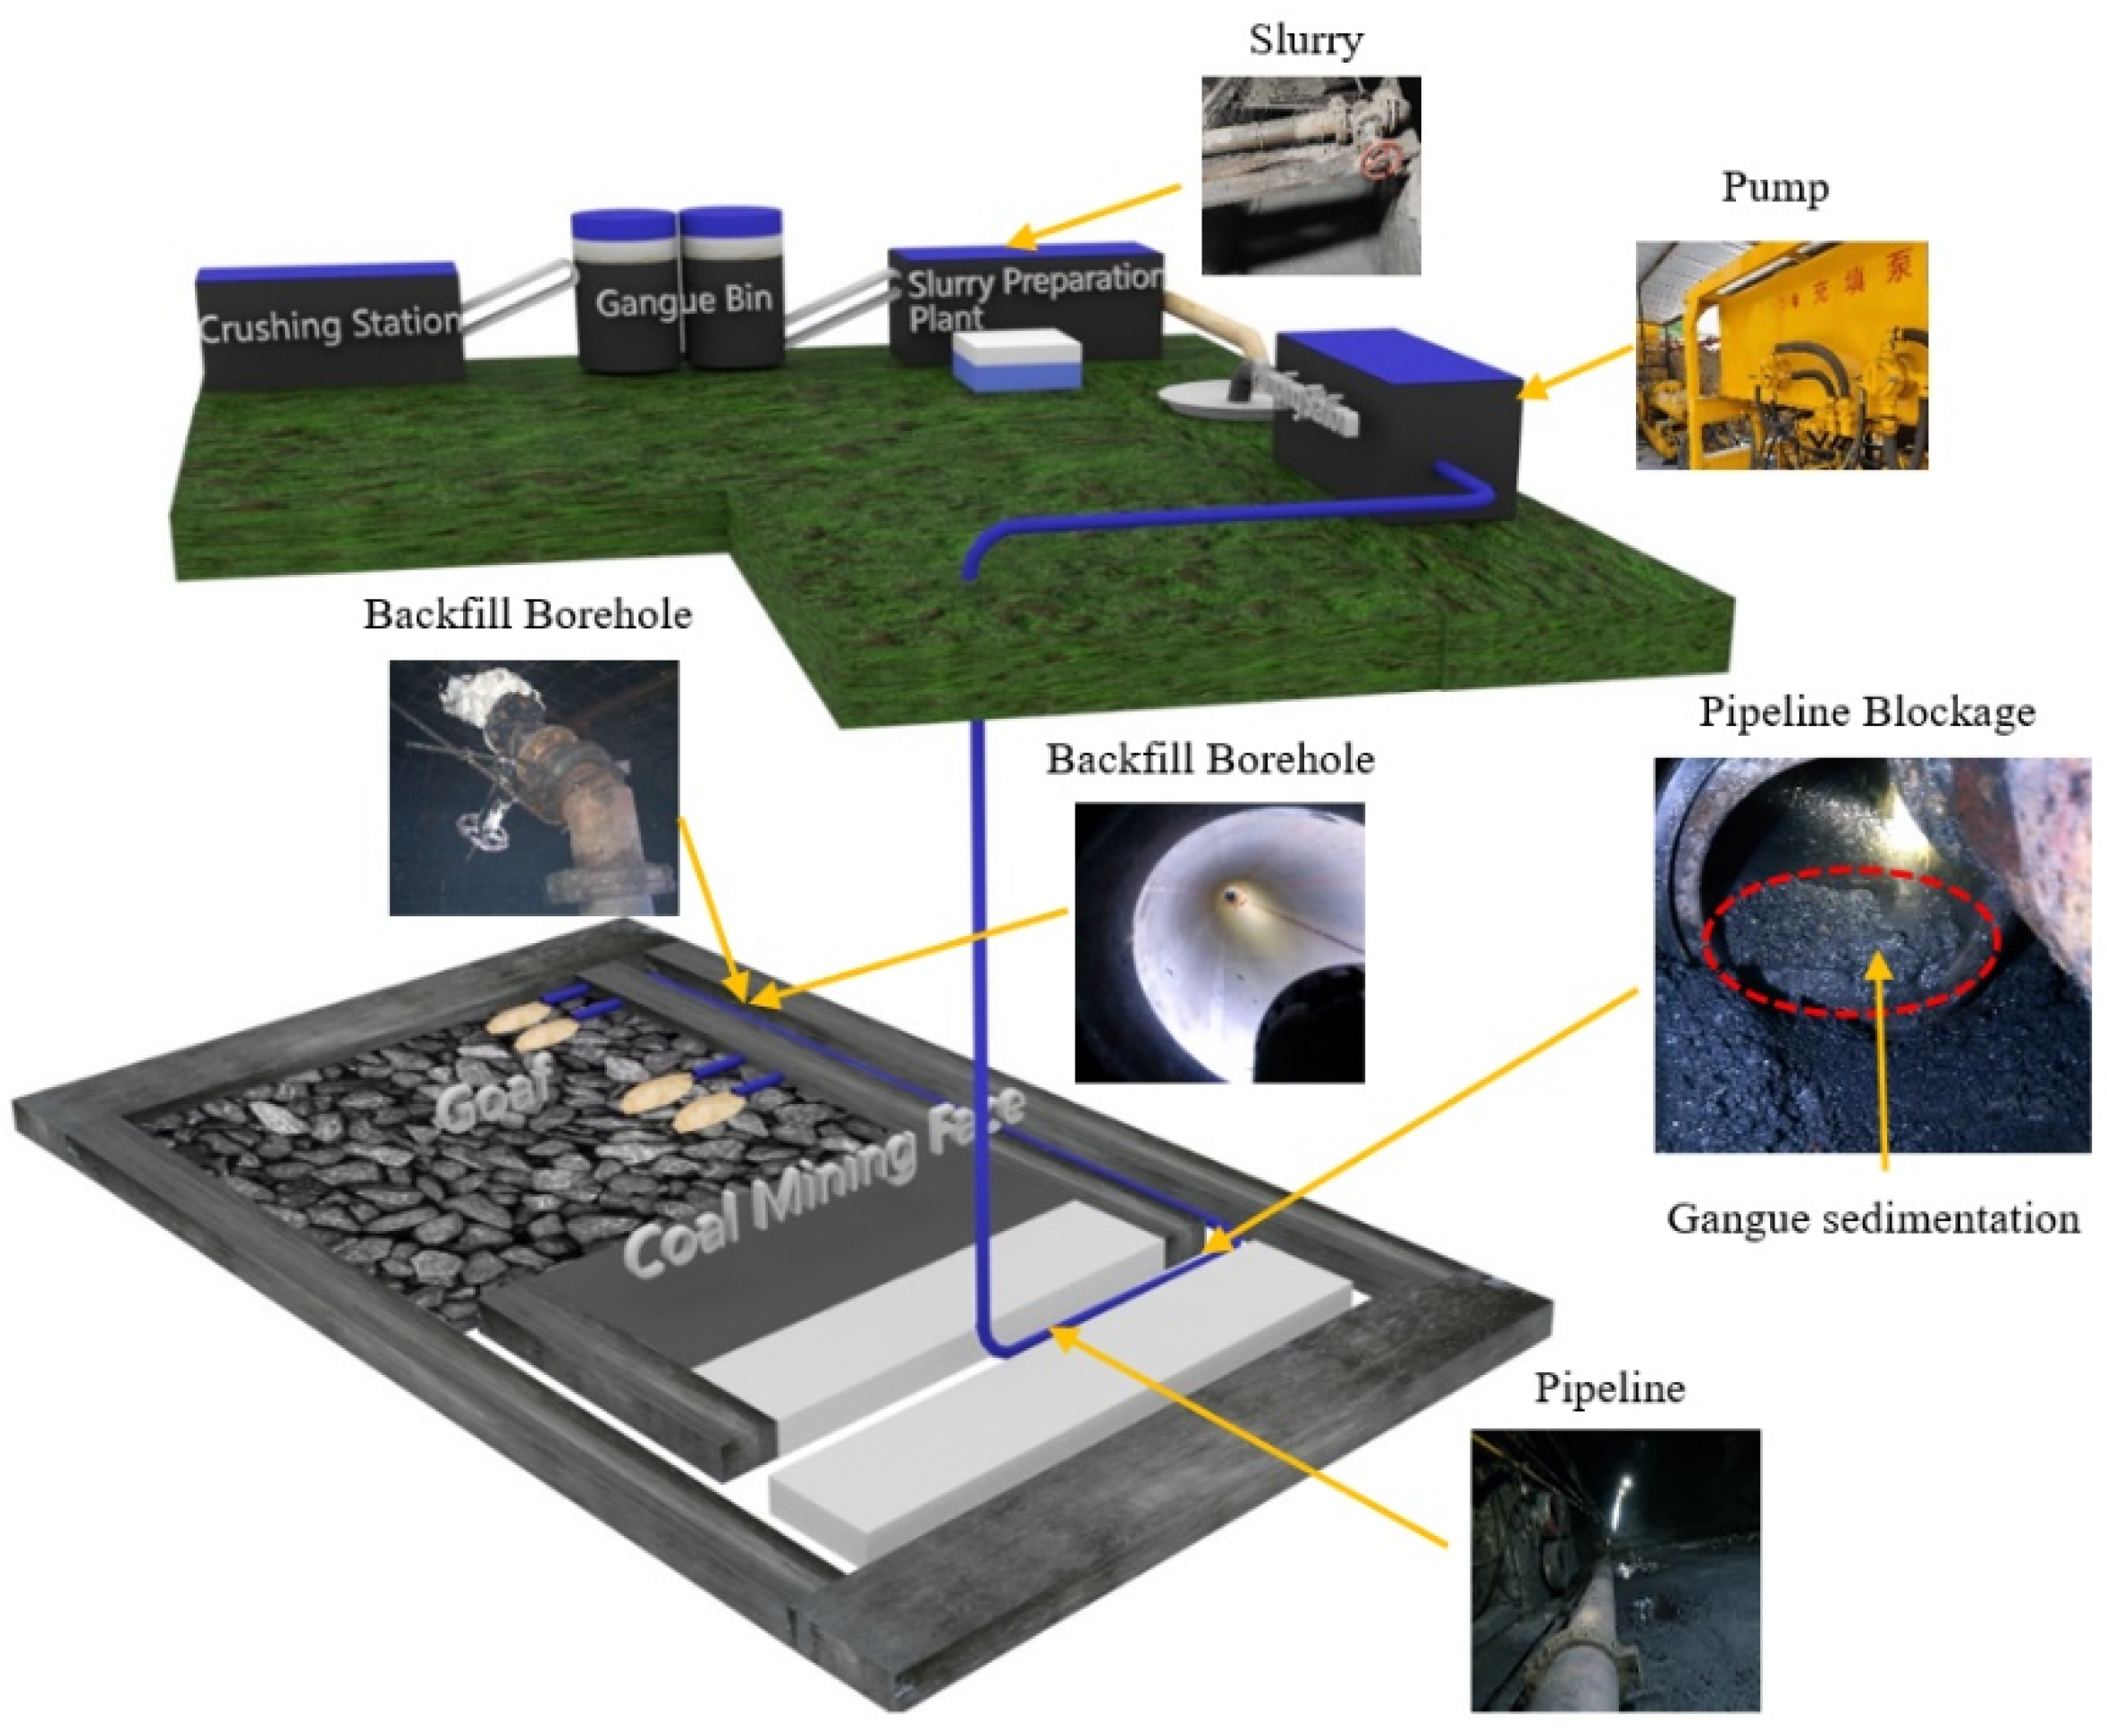
4. Engineering Application

4.1. Project Background

The annual discharge of gangue amounts to approximately 2 million tons in mine A located in Ordos City, Inner Mongolia Autonomous Region. The government-approved dumping gully for gangue is nearing full capacity. Consequently, the mine has planned to adopt adjacent backfilling technology for gangue disposal. Boreholes are drilled through coal pillars from the adjacent mining face’s haulage roadway to backfill the goaf.
Figure 11 shows the system layout. This scheme utilizes gangue slurry with a maximum crushed particle size of 3 mm and 78% concentration. The control panel shows a sudden pipeline pressure surge 1 h after initiating the first backfilling operation, alongside a sharp increase in pump pressure. On-site inspection reveals a pipeline blockage in the section between the central haulage roadway and the intake airway, with the blocked section extending approximately 200 m. Upon dismantling the pipeline, the slurry in the blocked section has segregated, with a large amount of coarse particles settling at the bottom of the pipe.

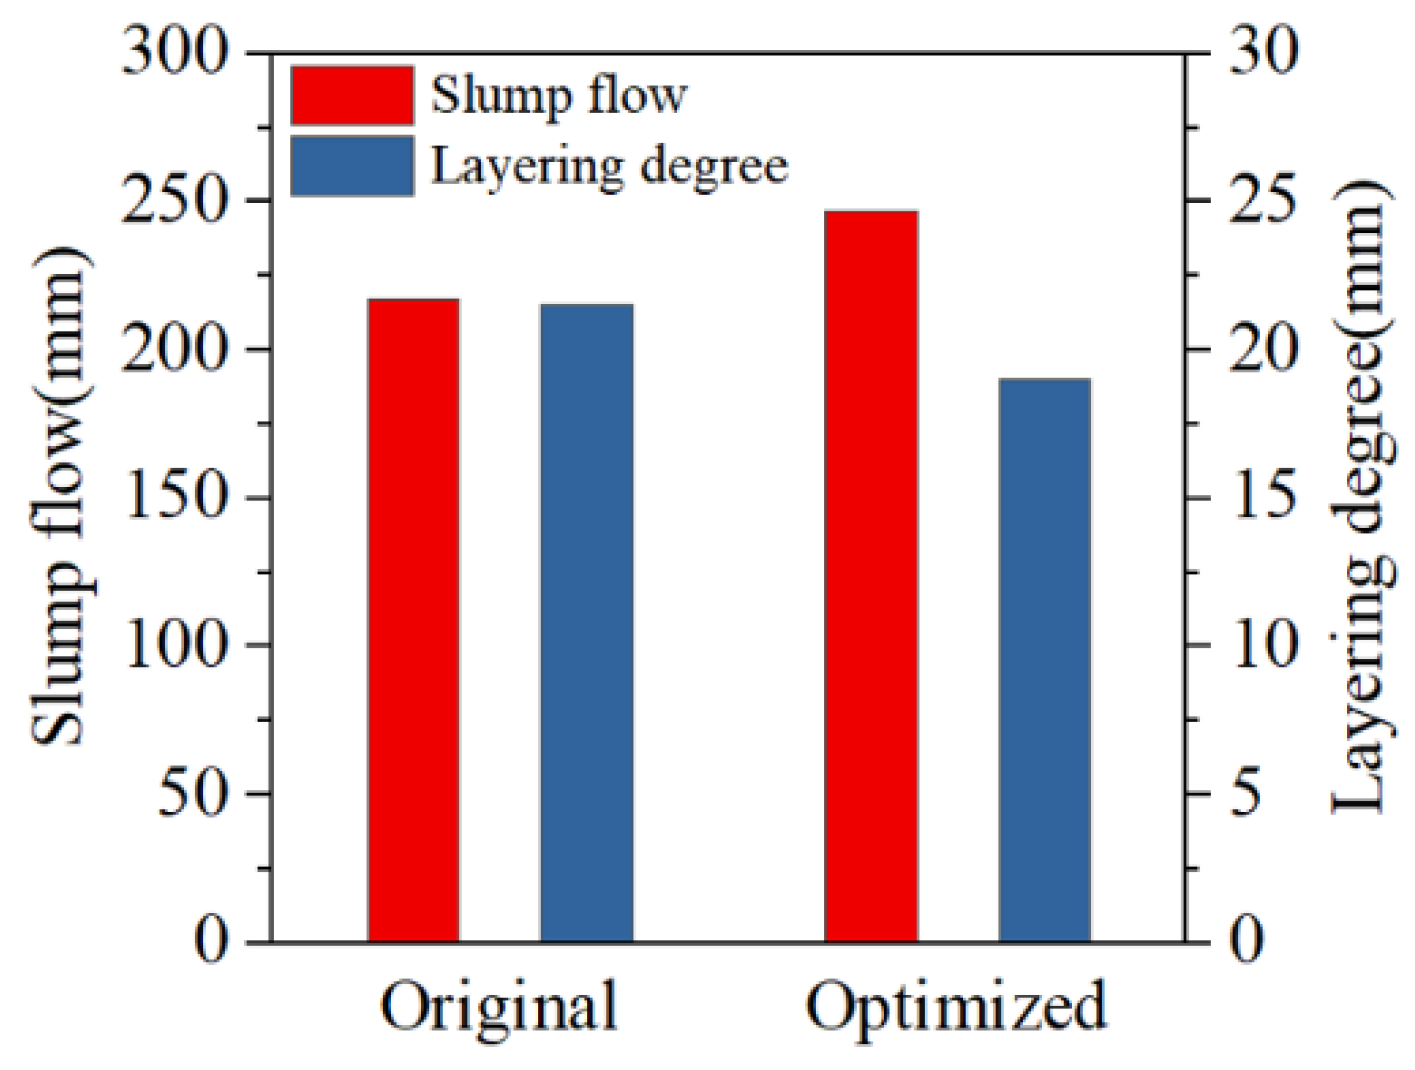
4.2. Slurry Ratio Optimization

Pipeline blockage is caused by slurry segregation, which necessitates an optimization of the slurry ratio. Based on the Talbol gradation formula (Equation (1)), the particle size distribution curve of the crushed gangue (with a maximum particle size of 3 mm) is fitted. n is 0.414, indicating that the gradation meets the requirements. Referring to the slurry ratio range established in Section 3.5, the optimized slurry ratio is determined as follows: a maximum gangue particle size of 3 mm, 0.045% HPMC dosage, and 77.5% slurry concentration. Performance tests of the optimized slurry (Figure 12) show an increase in slump flow by approximately 30 mm from 247 to 217 mm and a reduction in layering degree from 21.5 to 19.0 mm. Slurry stability improves significantly, with slurry segregation resolved.

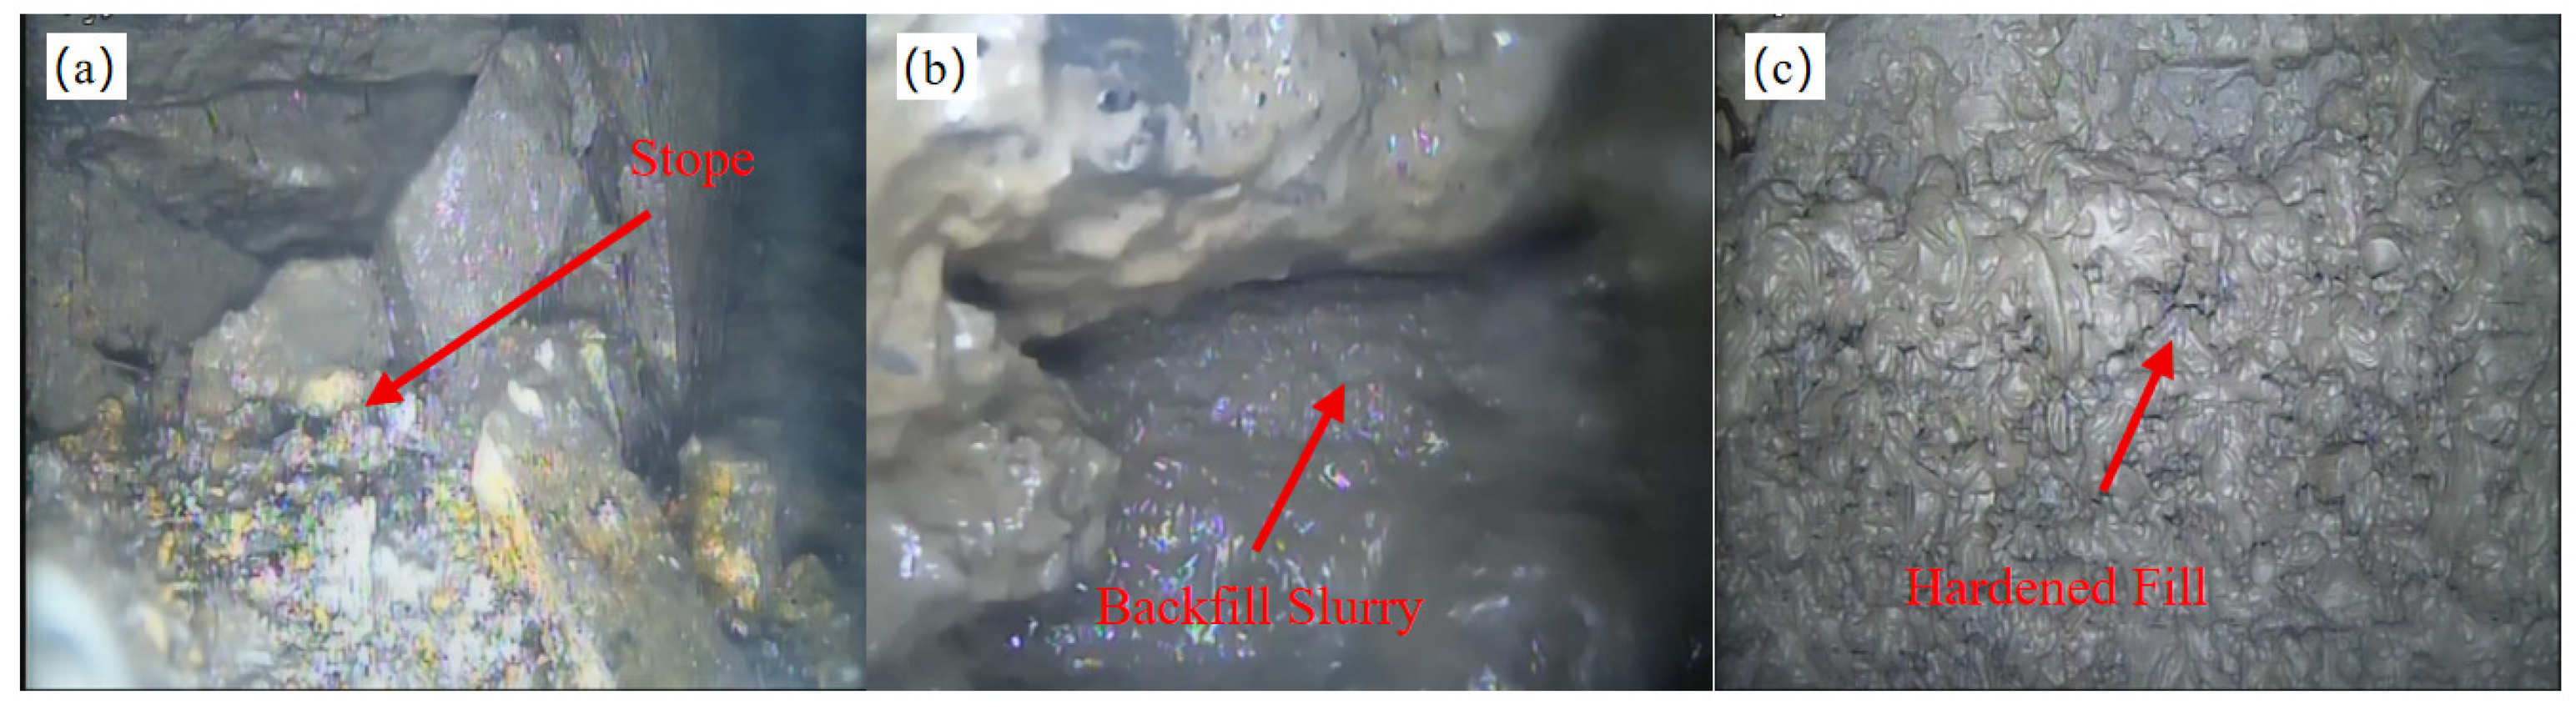
4.3. Backfilling Effectiveness Inspection

The slurry exhibits excellent stability with no sedimentation of coarse gangue particles during the backfilling process. The pipeline remains unobstructed without any blockage. The slurry demonstrates outstanding fluidity in the goaf, with a maximum single-hole grouting volume of 2200 m3. Observations are performed using a borehole inspection camera (Jining Huakuang Machinery Equipment Co., Ltd., Jining City, China) at a location 60 m from the grouting hole (Figure 13). The borehole wall consists of fractured and loose rock fragments, and voids are filled with the backfill material, which demonstrates that the maximum diffusion radius of the slurry exceeds 60 m.

5. Conclusions

The work investigated the effects of X1, X2, and X3 on gangue slurry stability and fluidity using RSM. Response surface regression models were established to correlate stability/fluidity with these factors, which could obtain an optimal gangue slurry ratio. Water distribution and microstructural characteristics of the slurry were analyzed using LF-NMR, SEM, and PLM, elucidating the HPMC action mechanism. Industrial field tests validated HPMC’s effectiveness in regulating gangue slurry performance. The main conclusions are as follows.
(1)
Slurry’s layering degree and slump flow decreased with increased X1 and X3; they decreased with reduced X2. Concentration exhibited the most significant influence, followed by maximum particle size and HPMC dosage. HPMC enhanced slurry stability while minimally compromising fluidity. X1X2 and X1X3 demonstrated significant effects on layering degree and slump flow. X2X3 significantly affected the layering degree but showed negligible influence on slump flow.
(2)
The response surface regression models for slump flow and layering degree demonstrated excellent reliability (R2 > 0.99; p < 0.0001). The response surface regression model yielded an optimal gangue slurry ratio, with a gradation index of 0.40–0.428. Different gangue gradations corresponded to specific concentrations and HPMC dosages.
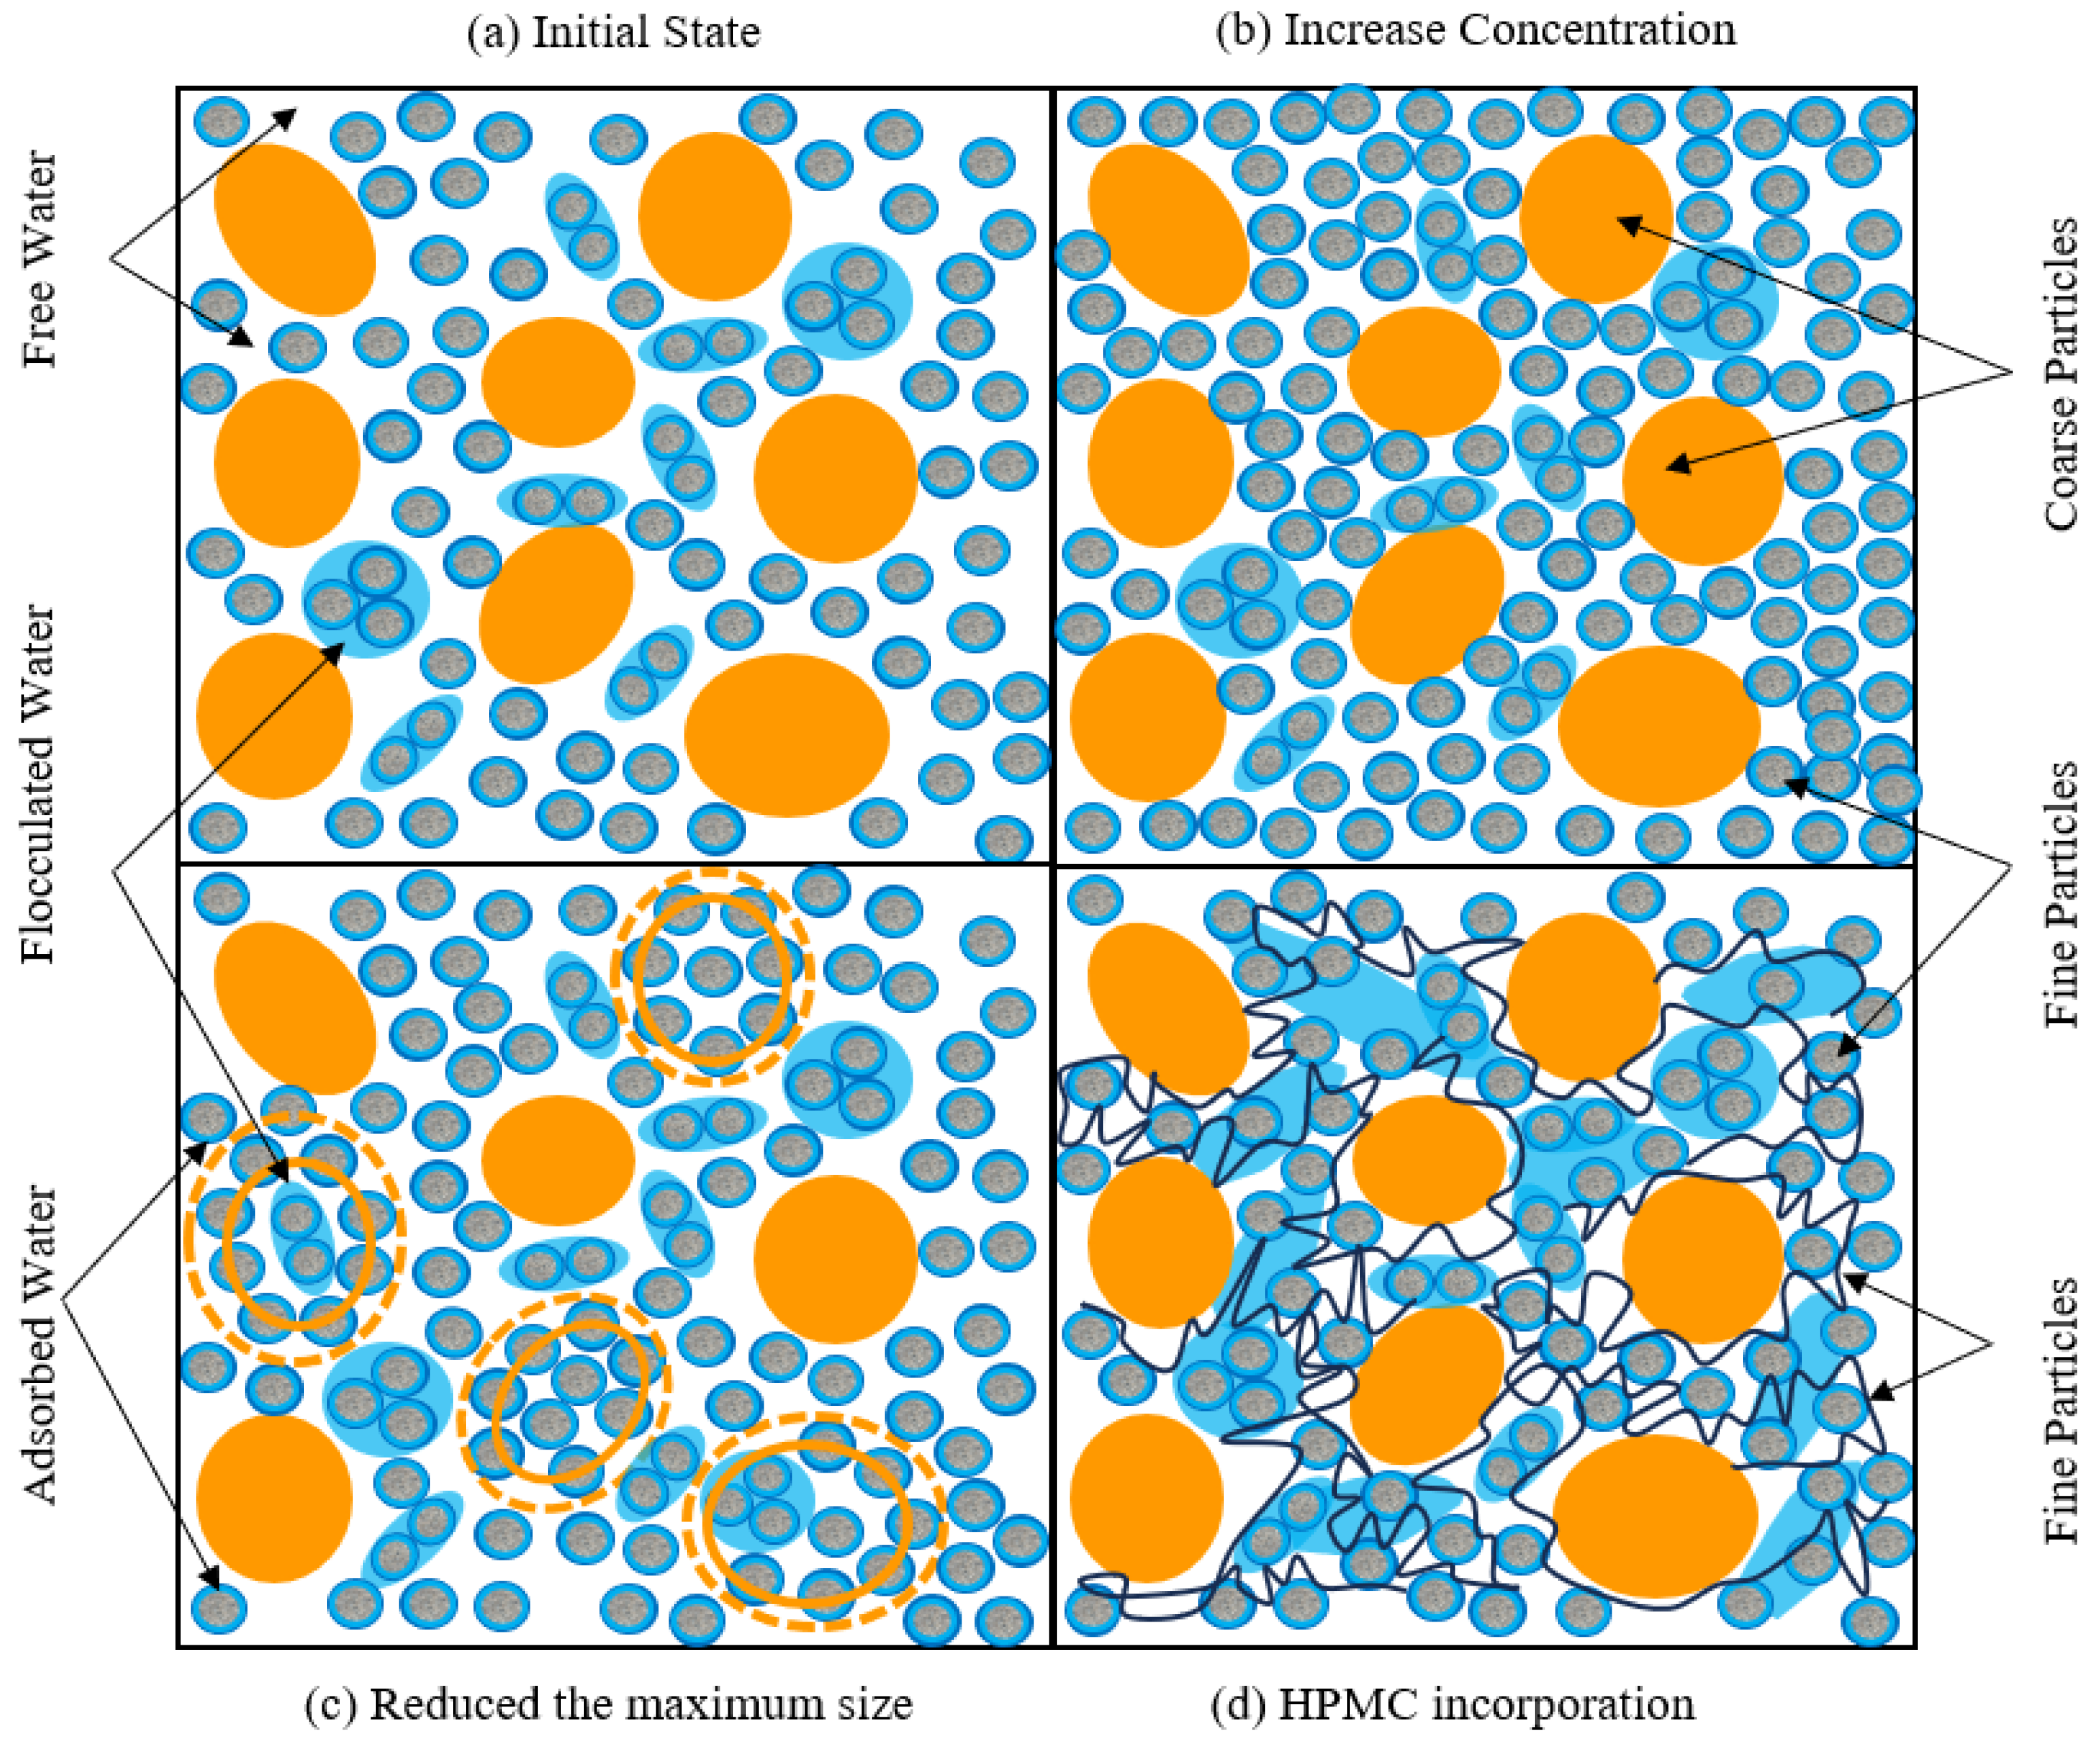
(3)
Increased slurry concentration or reduced maximum gangue particle size significantly decreased interparticle spacing. Slurry stability was enhanced by intensifying the interparticle friction force. However, this process reduced free water content, which substantially impaired slurry fluidity. Upon HPMC addition, its molecular chains facilitated the formation of a 3D flocculation network through adsorption-bridging effects with fine particles. This mechanism inhibited coarse particle sedimentation and improved slurry stability. Meanwhile, HPMC addition converted only a minimal amount of free water to floc water, which exerted a limited negative impact on fluidity.
(4)
Based on the response surface regression model, the gangue slurry ratio for mine A was optimized. The improved slurry demonstrated remarkable performance enhancement, with an increase of 30 mm in slump flow and a reduction of 2.5 mm in layering degree. The slurry filling process was free of pipe blockage, achieving a maximum spread radius of over 60 m and a maximum single-borehole filling volume of 2200 m3. This confirmed the effectiveness of HPMC in controlling gangue slurry performance.

Author Contributions

J.J.: Conceptualization, Methodology, Formal analysis, Supervision; X.J.: Software, Writing-Original draft; Y.W.: Validation; F.Q.: Investigation. All authors have read and agreed to the published version of the manuscript.

Funding

The Science and Technology Innovation Project of Higher Education Institutions in Shanxi Province (No: 2023L282), The Science and Technology Plan Project of Datong (No: 2024002, No: 2024013). Moreover, the authors would like to thank Shiyanjia Lab (www.shiyanjia.com) for the support of microstructural tests.

Institutional Review Board Statement

Not applicable.

Informed Consent Statement

All the participants in this study were recruited with available informed consent.

Data Availability Statement

The original contributions presented in this study are included in the article. Further inquiries can be directed to the corresponding author.

Conflicts of Interest

The authors declare no conflicts of interest.

Abbreviations

CG, Coal gangue; HPMC, Hydroxypropyl methyl cellulose; MS, molecular structural; PSD, particle size distribution; XRD, X-ray Diffraction; BBD, Box-Behnken Design; LF-NMR, Low-Field Nuclear Magnetic Resonance; SEM, Scanning Electron Microscope; PLM, Polarized Light Microscopy

References

  1. Li, J.; Wang, J. Comprehensive utilization and environmental risks of coal gangue: A review. J. Clean. Prod. 2019, 239, 117946. [Google Scholar] [CrossRef]
  2. Li, L.; Shao, X.; Ling, T.-C. Life cycle assessment of coal gangue composite cements: From sole OPC towards low-carbon quaternary binder. J. Clean. Prod. 2023, 414, 137674. [Google Scholar] [CrossRef]
  3. Liu, X. Low-carbon utilization of coal gangue under the carbon neutralization strategy: A short review. J. Mater. Cycles Waste Manag. 2023, 25, 1978–1987. [Google Scholar] [CrossRef]
  4. Long, G.; Li, L.; Li, W.; Ma, K.; Dong, W.; Bai, C.; Zhou, J.L. Enhanced mechanical properties and durability of coal gangue reinforced cement-soil mixture for foundation treatments. J. Clean. Prod. 2019, 231, 468–482. [Google Scholar] [CrossRef]
  5. Guo, Y.; Yan, K.; Cui, L.; Cheng, F. Improved extraction of alumina from coal gangue by surface mechanically grinding modification. Powder Technol. 2016, 302, 33–41. [Google Scholar] [CrossRef]
  6. Wang, J.; Qin, Q.; Hu, S.; Wu, K. A concrete material with waste coal gangue and fly ash used for farmland drainage in high groundwater level areas. J. Clean. Prod. 2016, 112, 631–638. [Google Scholar] [CrossRef]
  7. Zhang, L.Y.; Zhang, H.Y.; Guo, W.; Tian, Y.L. Sorption characteristics and mechanisms of ammonium by coal by-products: Slag, honeycomb-cinder and coal gangue. Int. J. Environ. Sci. Technol. 2013, 10, 1309–1318. [Google Scholar] [CrossRef]
  8. Zheng, Q.; Zhou, Y.; Liu, X.; Liu, M.; Liao, L.; Lv, G. Environmental hazards and comprehensive utilization of solid waste coal gangue. Prog. Nat. Sci. Mater. Int. 2024, 34, 223–239. [Google Scholar] [CrossRef]
  9. Zhang, Y.; Ling, T. Reactivity activation of waste coal gangue and its impact on the properties of cement-based materials—A review. Constr. Build. Mater. 2020, 234, 117424. [Google Scholar] [CrossRef]
  10. Lin, Y.; Si, M.; Han, H.; Jin, H.; Long, Y.; Deng, L.; Gong, Z.; Feng, W.; Nie, T.; Xu, X.; et al. Advances in studies investigating the comprehensive utilization of coal gangue: A visualization analysis based on CiteSpace. Discov. Appl. Sci. 2024, 7, 38. [Google Scholar] [CrossRef]
  11. Jin, J.; Liu, T.; Li, M.; Lv, T.; Zhang, S.; Zuo, S. Mechanical properties and compression damage characteristics of coal gangue-filled backfill cemented by fly ash modified self-consolidating grouts. Case Stud. Constr. Mater. 2025, 22, e04687. [Google Scholar] [CrossRef]
  12. Liu, L.; Xia, L.; Fang, Z.; Jia, Q.; Gao, Y.; He, W.; Liu, Z. Performance study of modified magnesium-coal based solid waste negative carbon backfill material: Strength characteristics and carbon fixation efficiency. J. Environ. Chem. Eng. 2024, 12, 113281. [Google Scholar] [CrossRef]
  13. Feng, L.; Chen, L.; Li, Y.; Zhu, Y.; Bai, Y.; Sha, X. Status and progress of coal gangue resource utilization under dual carbon background in China. Multipurp. Util. Min. Resour. 2023, 1–14. Available online: https://link.cnki.net/urlid/51.1251.TD.20231120.1215.010 (accessed on 18 July 2025).
  14. Xu, Z.; Qian, Y.; Hong, X.; Luo, Z.; Gao, X.; Liang, H. Contamination characteristics of polycyclic aromatic compounds from coal sources in typical coal mining areas in Huaibei area, China. Sci. Total Environ. 2023, 873, 162311. [Google Scholar] [CrossRef]
  15. Nádudvari, Á.; Kozielska, B.; Abramowicz, A.; Fabiańska, M.; Ciesielczuk, J.; Cabała, J.; Krzykawski, T. Heavy metal- and organic-matter pollution due to self-heating coal-waste dumps in the Upper Silesian Coal Basin (Poland). J. Hazard. Mater. 2021, 412, 125244. [Google Scholar] [CrossRef]
  16. Gao, S.; Zhao, G.; Guo, L.; Zhou, L.; Yuan, K. Utilization of coal gangue as coarse aggregates in structural concrete. Constr. Build. Mater. 2020, 268, 121212. [Google Scholar] [CrossRef]
  17. Zhou, N.; Yao, Y.; Song, W.; He, Z.; Meng, G.; Liu, Y. Present situation and prospect of coal gangue treatment technology. J. Min. Saf. Eng. 2020, 37, 136–146. [Google Scholar]
  18. Song, W.; Zhang, J.; Li, M.; Hao, Y.; Zhou, N.; Yao, Y.; Guo, Y. Underground disposal of coal gangue backfill in China. Appl. Sci. 2022, 12, 12060. [Google Scholar] [CrossRef]
  19. Hao, Y.; Guo, X.; Yao, X.; Han, R.; Li, L.; Zhang, M. Using Chinese coal gangue as an ecological aggregate and its modification: A review. Materials 2022, 15, 4495. [Google Scholar] [CrossRef]
  20. Lu, G.; Mamadou, F.; Cui, L. A multiphysics-viscoplastic cap model for simulating the blast response of cemented tailings backfill. J. Rock Mech. Geotech. Eng. 2017, 9, 551–564. [Google Scholar] [CrossRef]
  21. Yang, F.; Wu, F.; Yang, B.; Li, L.; Gao, Q. Preparation and performance of composite activated slag-based binder for cemented paste backfill. Chemosphere 2022, 309, 136649. [Google Scholar] [CrossRef] [PubMed]
  22. Zhao, H.; Ren, T.; Remennikov, A.; Yu, B. Mechanical behaviour of lump-grout backfill material for underground spaces. Geotech. Geol. Eng. 2023, 41, 4807–4819. [Google Scholar] [CrossRef]
  23. Roy, R.; Chakraborty, S.; Bisai, R.; Pal, S.K.; Mishra, S. Gravity blind backfilling of abandoned underground mine voids using suitablemix proportion of fill materials and method of filling. Geotech. Geol. Eng. 2023, 41, 1801–1819. [Google Scholar] [CrossRef]
  24. Lu, G.; Fall, M.; Yang, Z. An evolutive bounding surface plasticity model for early-age cemented tailings backfill under cyclic loading. Soil Dyn. Earthq. Eng. 2019, 117, 339–356. [Google Scholar] [CrossRef]
  25. Gu, W.; Yang, B.; Gu, C. Study on adjacent grouting filling technology of gangue slurry. Coal Technol. 2023, 42, 75–79. [Google Scholar]
  26. Zhu, L.; Gu, W.; Song, T.; Pan, H.; Liu, Z.; Zhang, P.; He, Z. Research progress and prospect of coal gangue slurry backfilling technology in goaf. Coal Sci. Technol. 2023, 51, 143–154. [Google Scholar]
  27. Zhu, L.; Li, Z.; Wu, Y.; Liu, C. CFD numerical simulation of slurry flow characteristics under the clogged form of coal gangue slurry transportation pipeline. Appl. Sci. 2025, 15, 1957. [Google Scholar] [CrossRef]
  28. Zhu, L.; Pan, H.; Gu, W.; Zhao, M.; Zhang, X.; Xu, K. Experimental study on flow and diffusion law of gangue filling slurry in caving zone. J. China Coal Soc. 2021, 46, 629–638. [Google Scholar]
  29. Yang, J.; Yang, B.; Li, T.; Yu, M. Fluidity study on chemical behavior of Bingham materials in pipe transportation. Chem. Eng. Trans. 2018, 71, 1051–1056. [Google Scholar]
  30. Jin, J.; Yang, F.; Gu, C.; Zhou, Y.; Wang, X. Study on rheological characteristics of uncemented coal gangue-fly ash backfill (UCGFB) slurry based on fractal theory. Adv. Mater. Sci. Eng. 2022, 2022, 7634951. [Google Scholar] [CrossRef]
  31. Wang, Z.; Shi, J.; Wang, X.; Wu, R.; Wang, S. Effect of thickeners on the flow characteristics of paste filling slurry and its engineering application. Nonferrous Met. Sci. Eng. 2024, 15, 97–104. [Google Scholar]
  32. Zhao, H.; Zhao, X.; Guo, M.; Cao, F.; Wu, J. Rheological properties of mortar and concrete with low binder content. Concrete 2012, 2012, 30–33. [Google Scholar]
  33. Yang, J. Coal Gangue Particle Suspension Study with High-Concentration Cemented Backfilling on Coal Mine. Ph.D. Thesis, China University of Mining and Technology-Beijing, Beijing, China, 2019. [Google Scholar]
  34. Yin, Y.; Huang, J.; Wang, T.; Yang, R.; Hu, H.; Manuka, M.; Zhou, F.; Min, J.; Wan, H.; Yuan, D.; et al. Effect of Hydroxypropyl methyl cellulose (HPMC) on rheology and printability of the first printed layer of cement activated slag-based 3D printing concrete. Constr. Build. Mater. 2023, 405, 133347. [Google Scholar] [CrossRef]
  35. Ebru, K.; Baraka, C.; Çağlar, Y.; Burak, F.; Halit, Y.; Oğuzhan, Ç. Effect of hydroxypropyl methylcellulose and aggregate volume on fresh and hardened properties of 3D printable concrete. Constr. Build. Mater. 2024, 456, 139253. [Google Scholar] [CrossRef]
  36. Parham, S.; Harrison, G.; Victormartínez, P.; Ramón, P.; Annalena, K.; Shima, P. Comparative analysis of 3D printing of Portland cement mortars with hydroxypropyl methylcellulose and microfibrillated cellulose as viscosity modifying agents. Mater. Des. 2024, 244, 113124. [Google Scholar] [CrossRef]
  37. Wang, B.; Shi, K.; Ma, X. Influence of different raw material ratios on the workability of gangue slurry. Shaanxi Coal 2025, 44, 47–51+103. [Google Scholar]
  38. Ma, X.; Wang, Y.; Wei, Y. Research on influence of additives on stability and flowability of coal gangue slurry materials. Coal Technol. 2025, 44, 72–76. [Google Scholar]
  39. Gao, Q.; Yang, X.; Wen, Z.; Chen, D.; He, J. Optimization of Proportioning of Mixed Aggregate Filling Slurry Based on BBD Response Surface Method. J. Hunan Univ. Nat. Sci. 2019, 46, 47–55. [Google Scholar]
  40. GB 5749-2022; Standards for Drinking Water Quality. China Quality and Standards Publishing House: Beijing, China, 2022.
  41. JGJ/T 70-2009; Standard for Test Methods of Basic Performance of Building Mortar. China Architecture & Building Press: Beijing, China, 2009.
  42. GB/T 2419-2005; Test Method for Fluidity of Cement Mortar. China Standards Press: Beijing, China, 2005.
  43. Liu, C.; Cheng, Y.; Xiong, Y.; Jia, L.; Ma, L.; Wang, X.; Cheng, C.; Banthia, N.; Zhang, Y. Influence of HPMC and SF on buildability of 3D printing foam concrete: From water state and flocculation point of view. Compos. Part B 2022, 242, 110075. [Google Scholar] [CrossRef]
Figure 1. Characteristics of raw materials (a) XRD-CG, (b) PSD-CG, (c) MS-HPMC, (d) Fitting curves of maximum particle size and n.
Materials 18 03461 g001
Figure 2. Predicted and actual values (a) Layering degree, (b) Slump flow.
Materials 18 03461 g002
Figure 3. Influence of single factors on slurry performance (a) concentration, (b) maximum size, (c) HPMC dosage.
Materials 18 03461 g003
Figure 4. Effect of interaction terms on layering degree (a) X1X2 (X3 = 0%) (b) X1X3 (X2 = 3 mm) (c) X2X3 (X1 = 77%).
Materials 18 03461 g004
Figure 5. Effect of interaction terms on fluidity (a) X1X2 (X3 = 0%) (b) X2X3 (X1 = 77%).
Materials 18 03461 g005
Figure 6. Reasonable concentration and HPMC dosages under different maximum particle sizes: (a) 2.5 mm; (b) 3.0 mm; (c) 3.5 mm.
Materials 18 03461 g006
Figure 7. Microscopic morphology of slurries under SEM: (a) X1 = 77%, X2 = 4 mm, (b) X1 = 77%, X2 = 3 mm, (c) X1 = 77%, X2 = 2 mm, (d) X1 = 78%, X2 = 3 mm, (e) X1 = 79%, X2 = 3 mm, (f) X1 = 77%, X2 = 3 mm, and ((ae) X3 = 0%, (f) X3 = 0.05%).
Materials 18 03461 g007
Figure 8. Microscopic morphology of slurries under the orthogonal PLM: (a) X1 = 77%, X2 = 4 mm, (b) X1 = 77%, X2 = 3 mm, (c) X1 = 77%, X2 = 2 mm, (d) X1 = 78%, X2 = 3 mm, (e) X1 = 79%, X2 = 3 mm, (f) X1 = 77%, X2 = 3 mm, and((ae) X3 = 0%, (f) X3 = 0.05%).
Materials 18 03461 g008
Figure 9. Influences of different factors on the water distribution (a) X1 (X2 = 3 mm and X3 = 0%), (b) X2 (X1 = 77% and X3 = 0%), (c) X3 (X1 = 77% and X2 = 3 mm).
Materials 18 03461 g009aMaterials 18 03461 g009b
Figure 10. Internal structure of gangue slurry (a) Initial state, (b) Increased concentration, (c) Reduced maximum gangue particle size, (d) HPMC incorporation.
Materials 18 03461 g010
Figure 11. Layout of the backfilling system.
Materials 18 03461 g011
Figure 12. Performance comparison of the slurry before and after optimization.
Materials 18 03461 g012
Figure 13. Borehole endoscopic observation: (a) Before backfilling, (b) During backfilling, (c) After backfilling.
Materials 18 03461 g013
Table 1. Experimental design scheme.
Independent VariableHorizontal Encoding
−101
X1767778
X2234
X30.00.030.06
Table 2. Experimental results.
Serial No.Concentration/%Maximum Gangue Particle Size/mmHPMC Dosage/%Layering Degree/mmSlump Flow/mm
17840.0324121.5
27720.0620614.2
37620.0326425
4763029733.3
57640.0329833
67730.0326823.5
77820.0315312.1
87740.0627523.5
9772024422.9
107630.0626925.5
117730.0327223.5
127730.0327123.7
13783021621.4
147830.0618212.4
15774030131.3
Table 3. Variance analysis of the response surface regression model.
SourceLayering DegreeSlump Flow
FpFp
Model3537.4<0.00011331.97<0.0001
X1-X116,197.08<0.00016318.81<0.0001
X2-X28177.06<0.00013442.39<0.0001
X3-X37359.89<0.0001888.58<0.0001
X1X226.020.0038326.42<0.0001
X1X319.120.00724.030.101
X2X310.750.02216.120.0102
X1211.850.0184906.56<0.0001
X2234.720.002103.620.0002
X325.720.062257.880.0006
Note: p < 0.05 indicates a significant factor effect, while p > 0.05 suggests a non-significant effect.
Table 4. Slurry ratio validation.
Group No.Slurry Concentration/%Maximum Size/mmHPMC Dosage/%Measured Slump Flow/mmPredicted Slump Flow/mmMeasured Layering Degree/mmPredicted Layering Degree/mm
S177.252.50.045217.7228.916.817.4
S277.503.00.045238.3233.819.118.2
S377.253.00.050237.8245.018.319.1
S477.803.50.045241.4231.518.918.5
Disclaimer/Publisher’s Note: The statements, opinions and data contained in all publications are solely those of the individual author(s) and contributor(s) and not of MDPI and/or the editor(s). MDPI and/or the editor(s) disclaim responsibility for any injury to people or property resulting from any ideas, methods, instructions or products referred to in the content.

