
Discrete Element Modeling of Concrete Under Dynamic Tensile Loading


Abstract
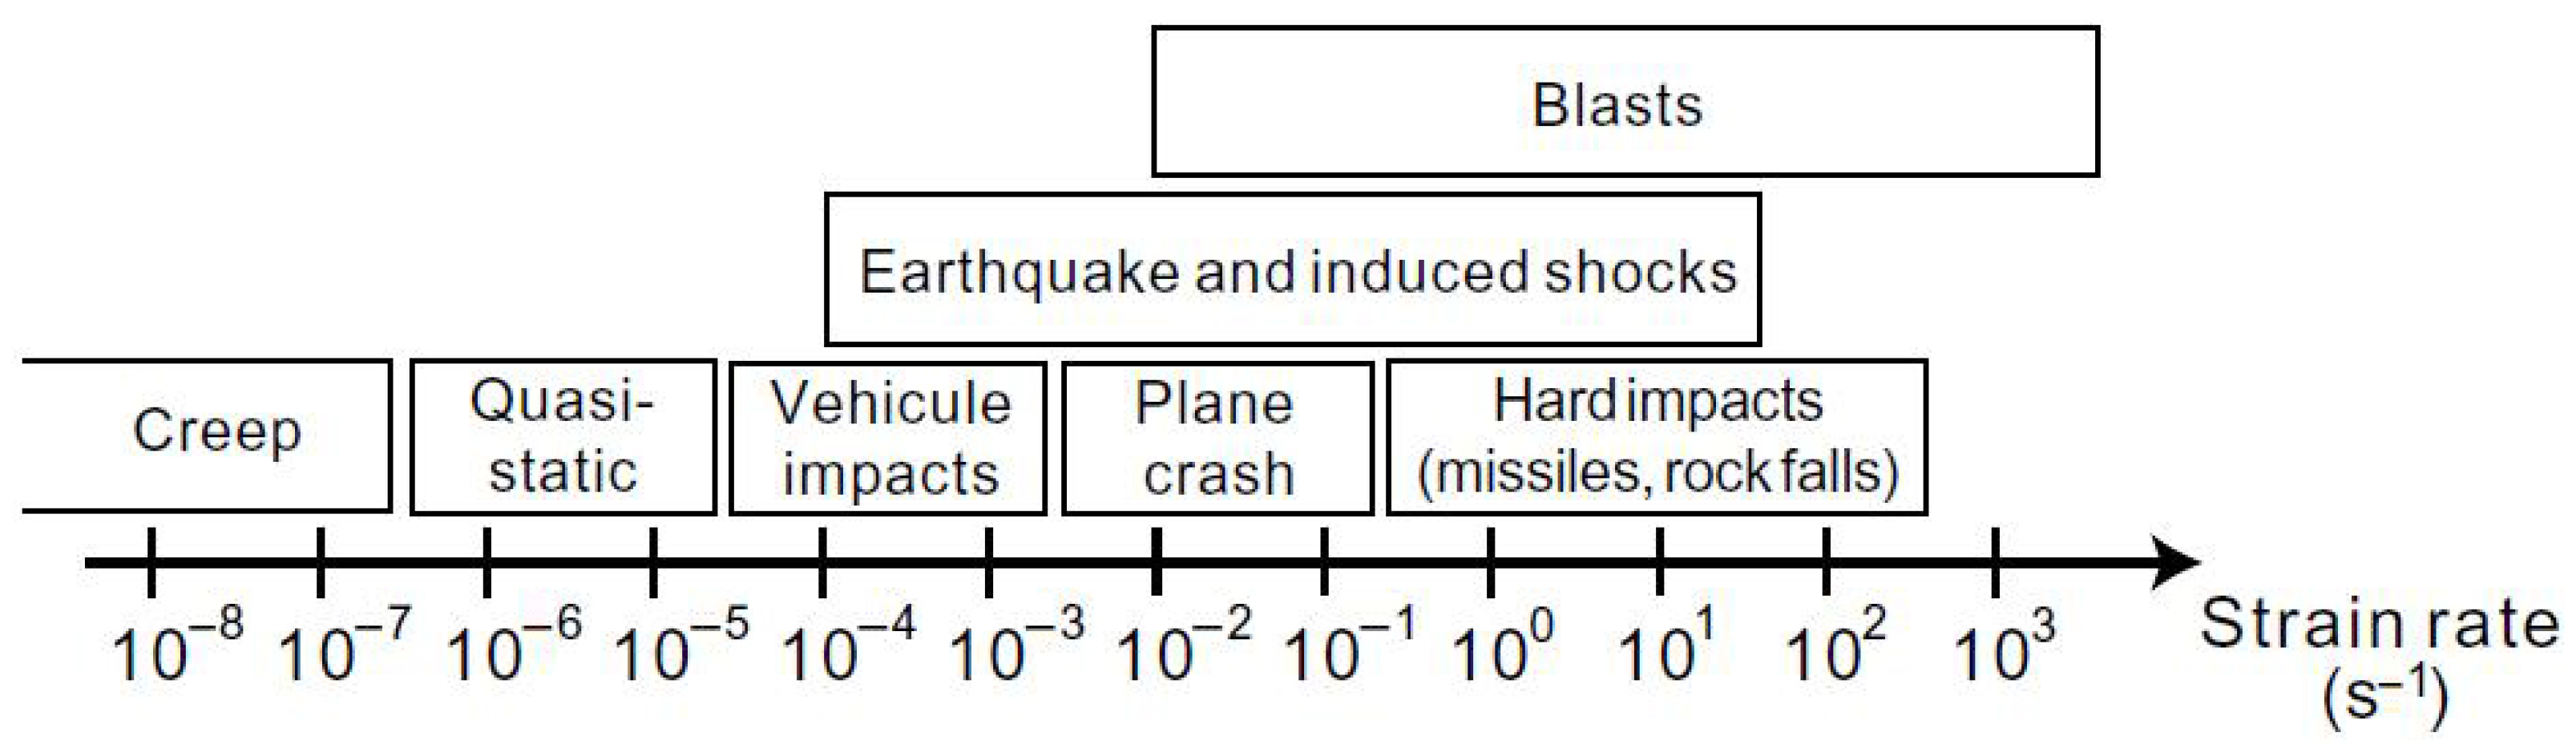
1. Introduction
2. Experimental Analysis of the Dynamical Tensile Behavior of Concrete
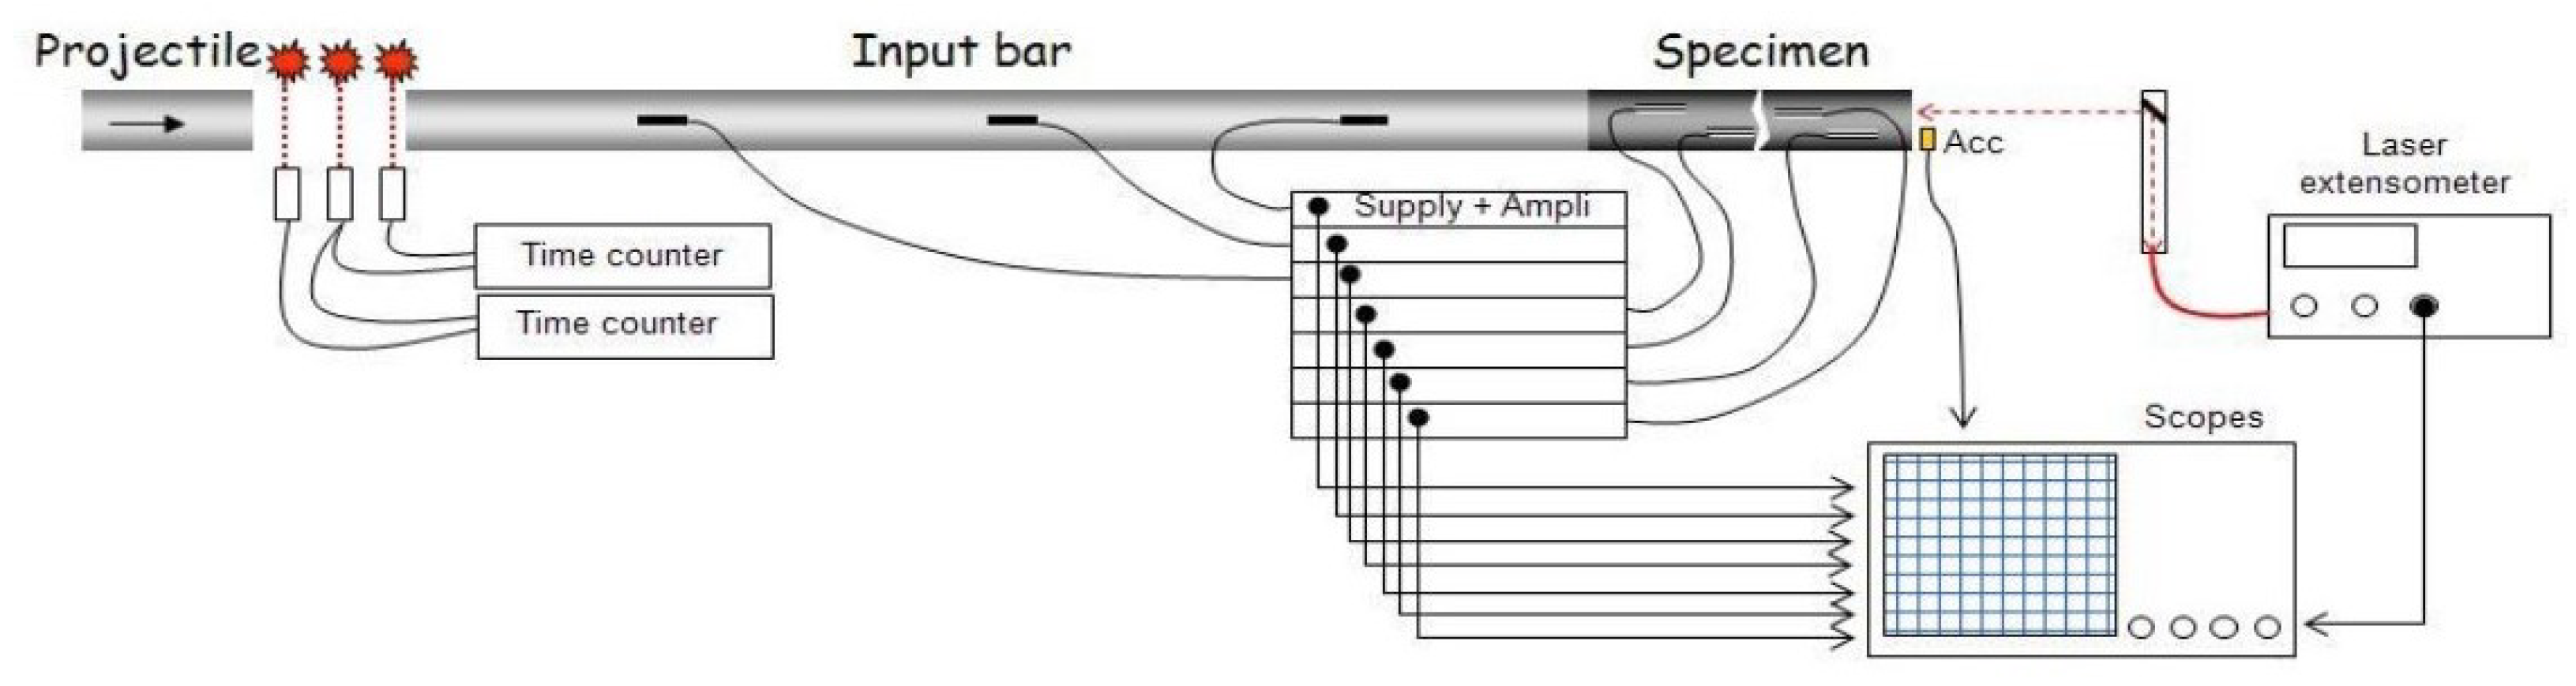
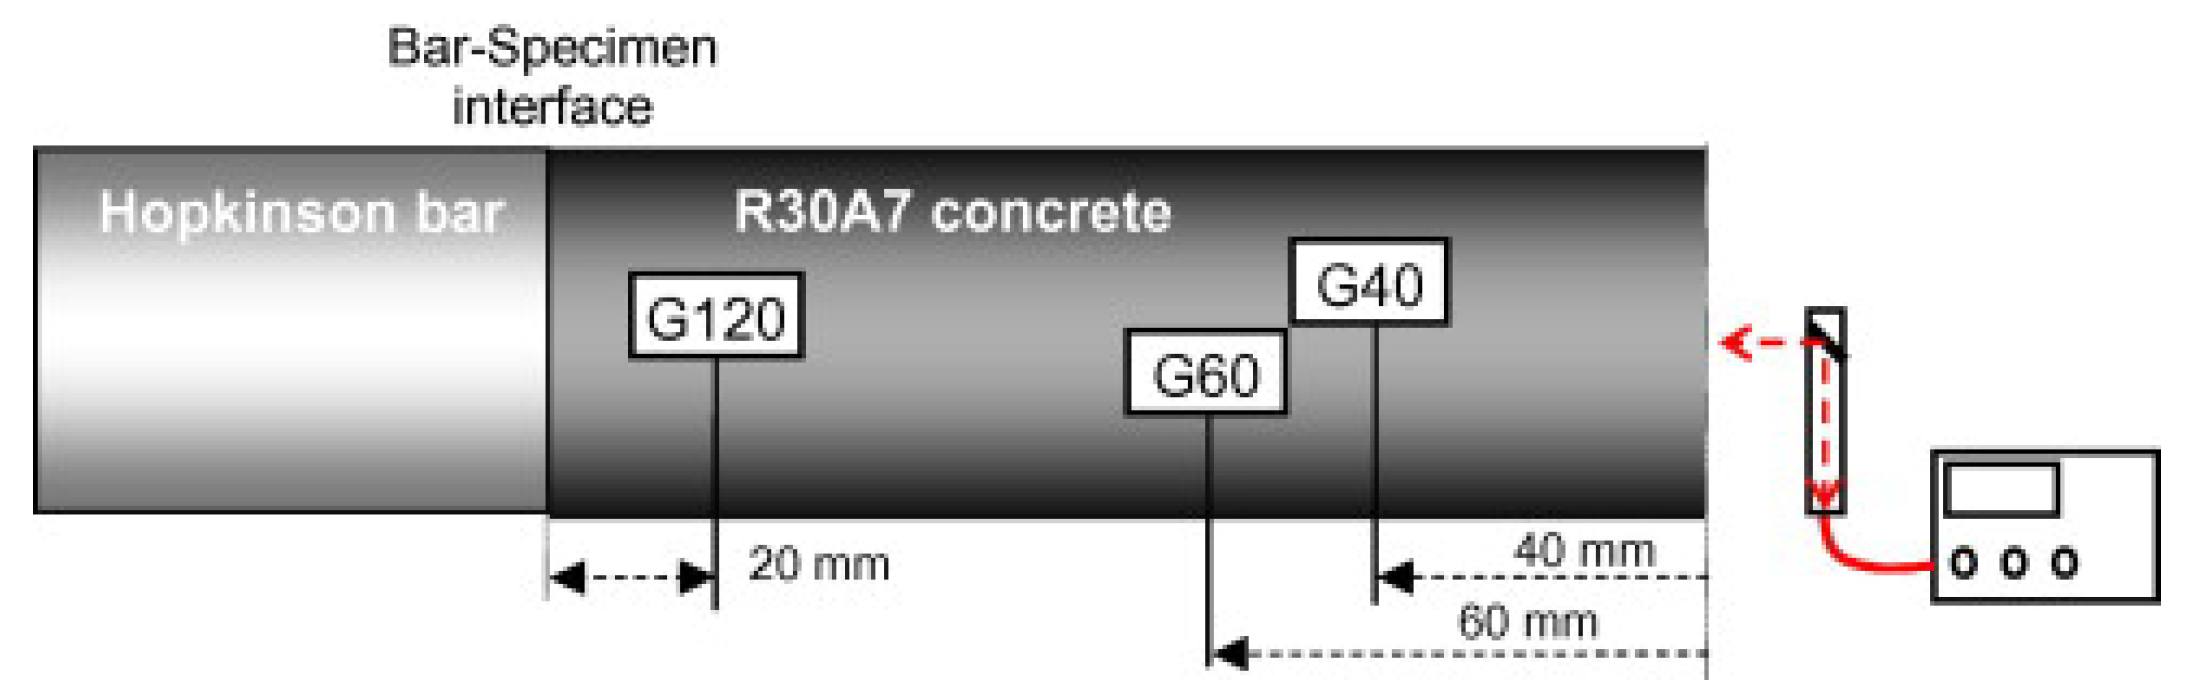
2.1. Testing Devices
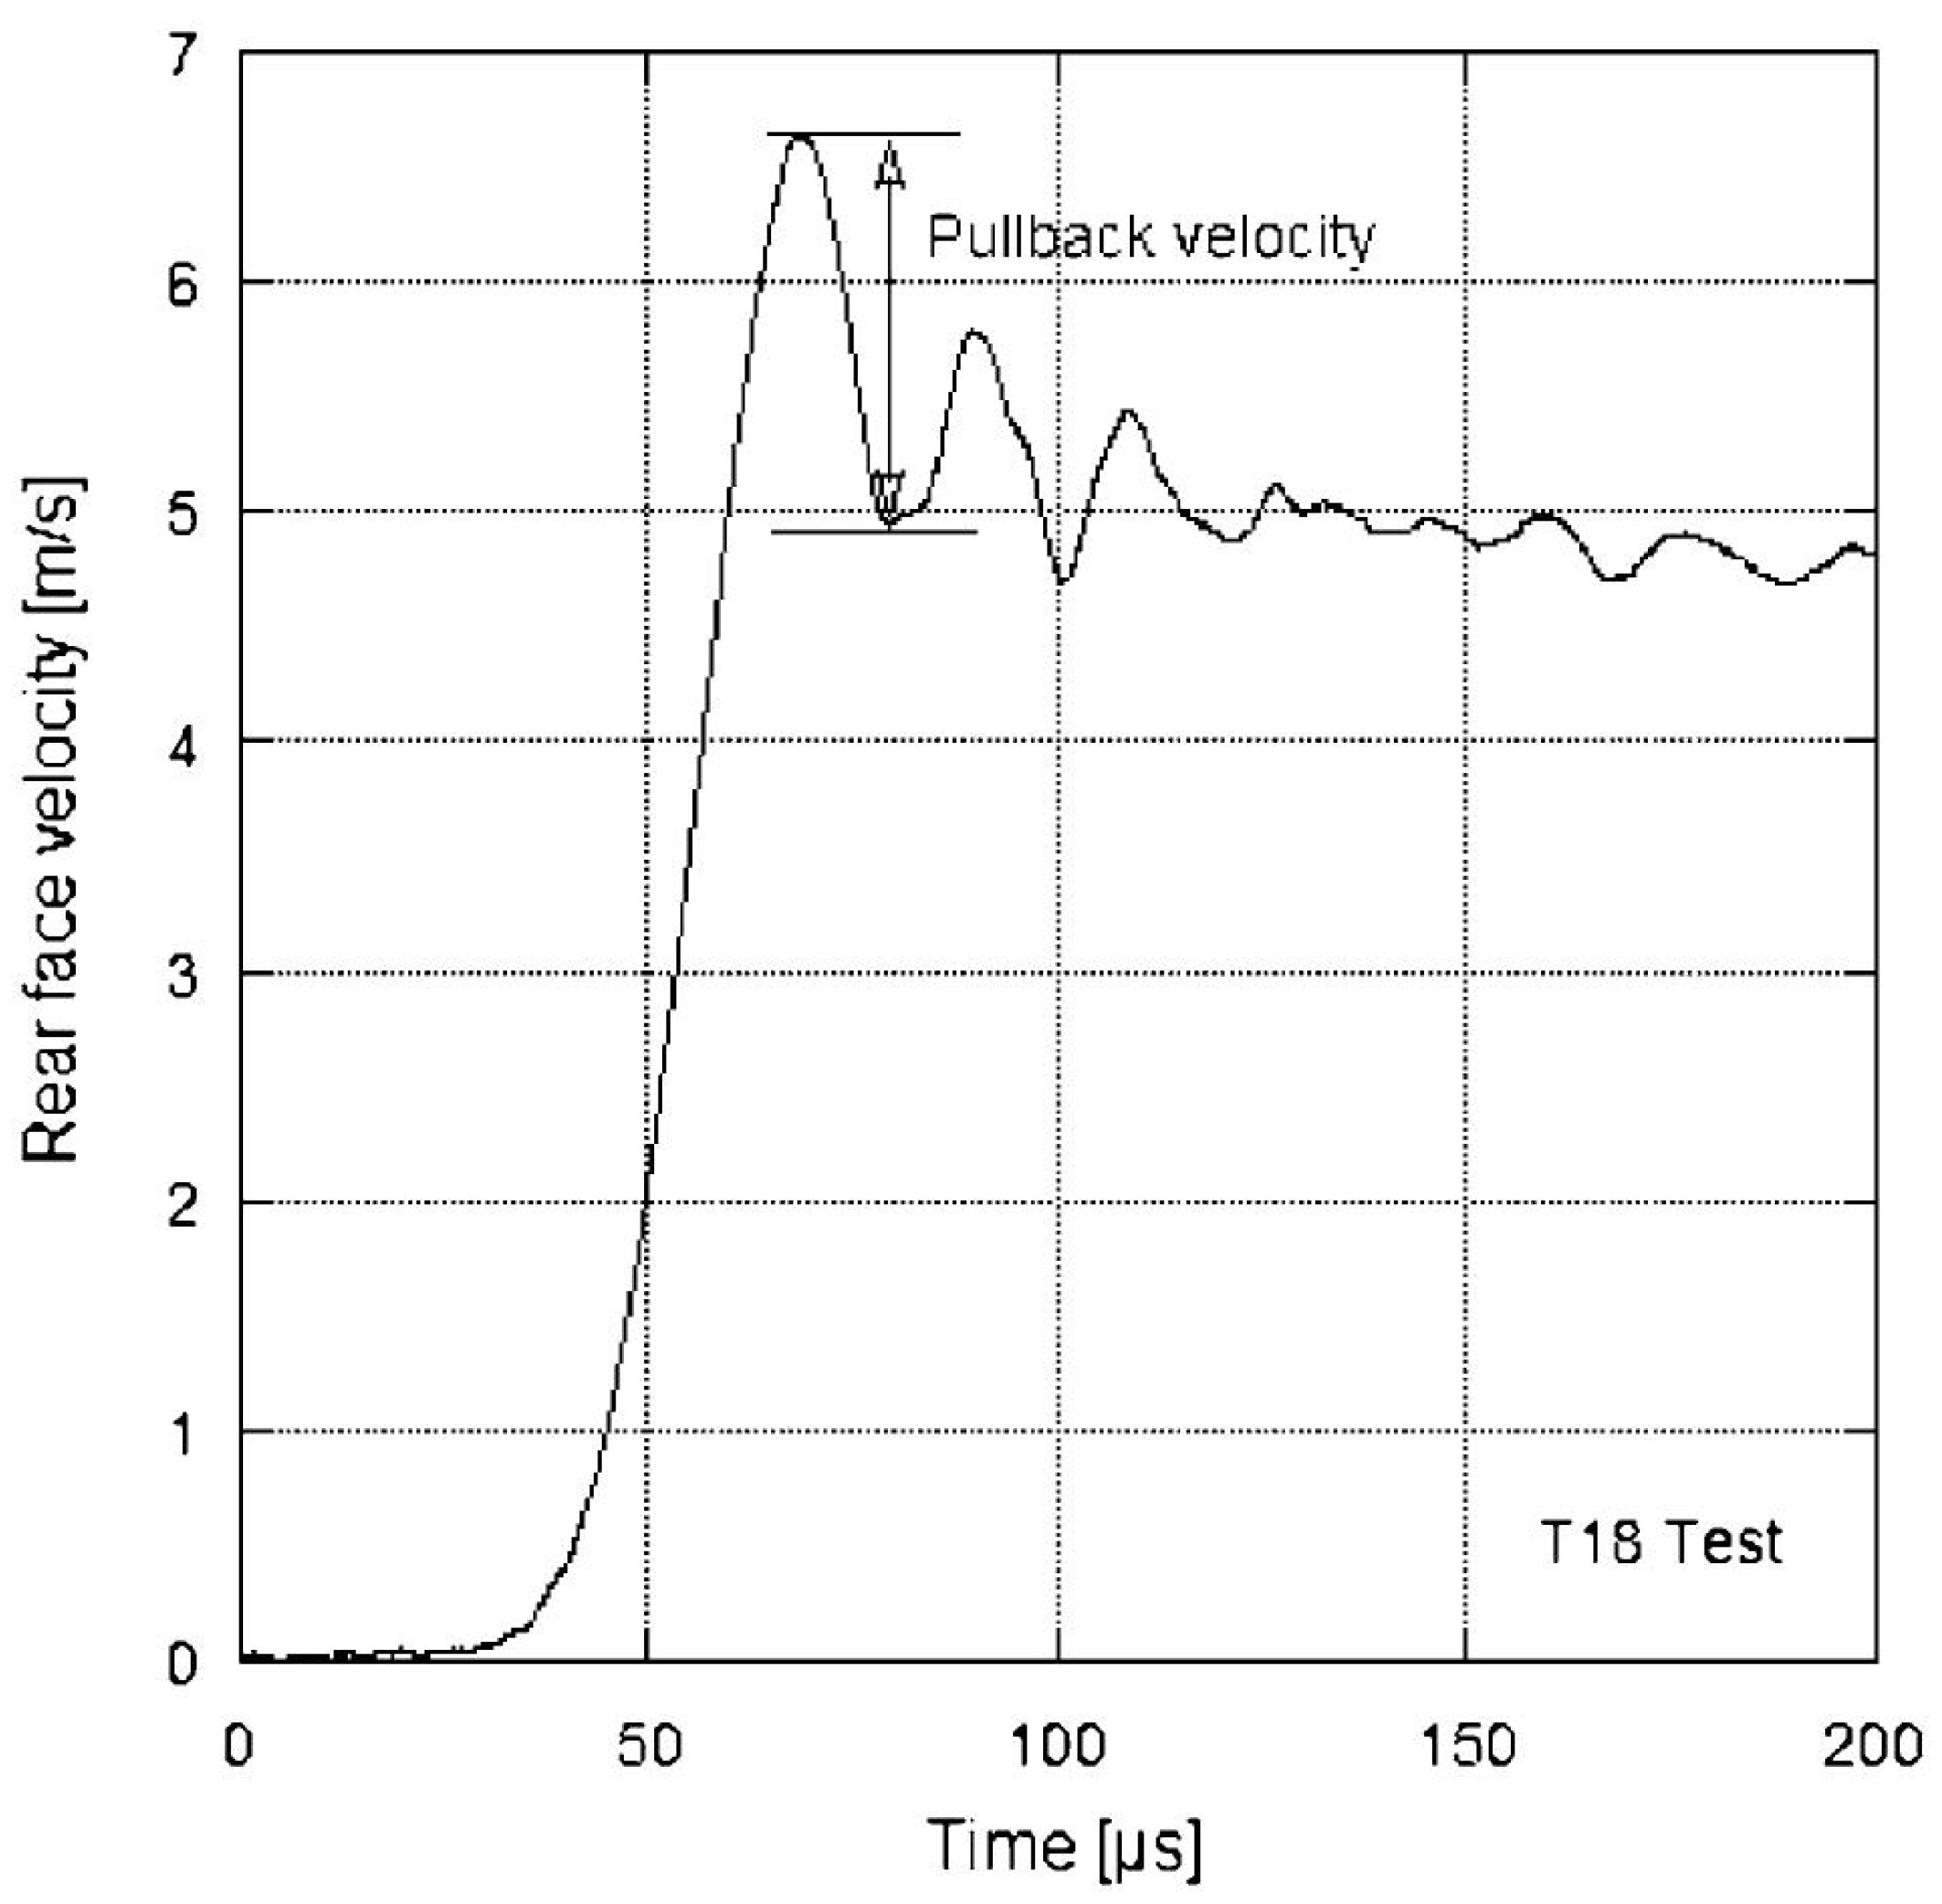
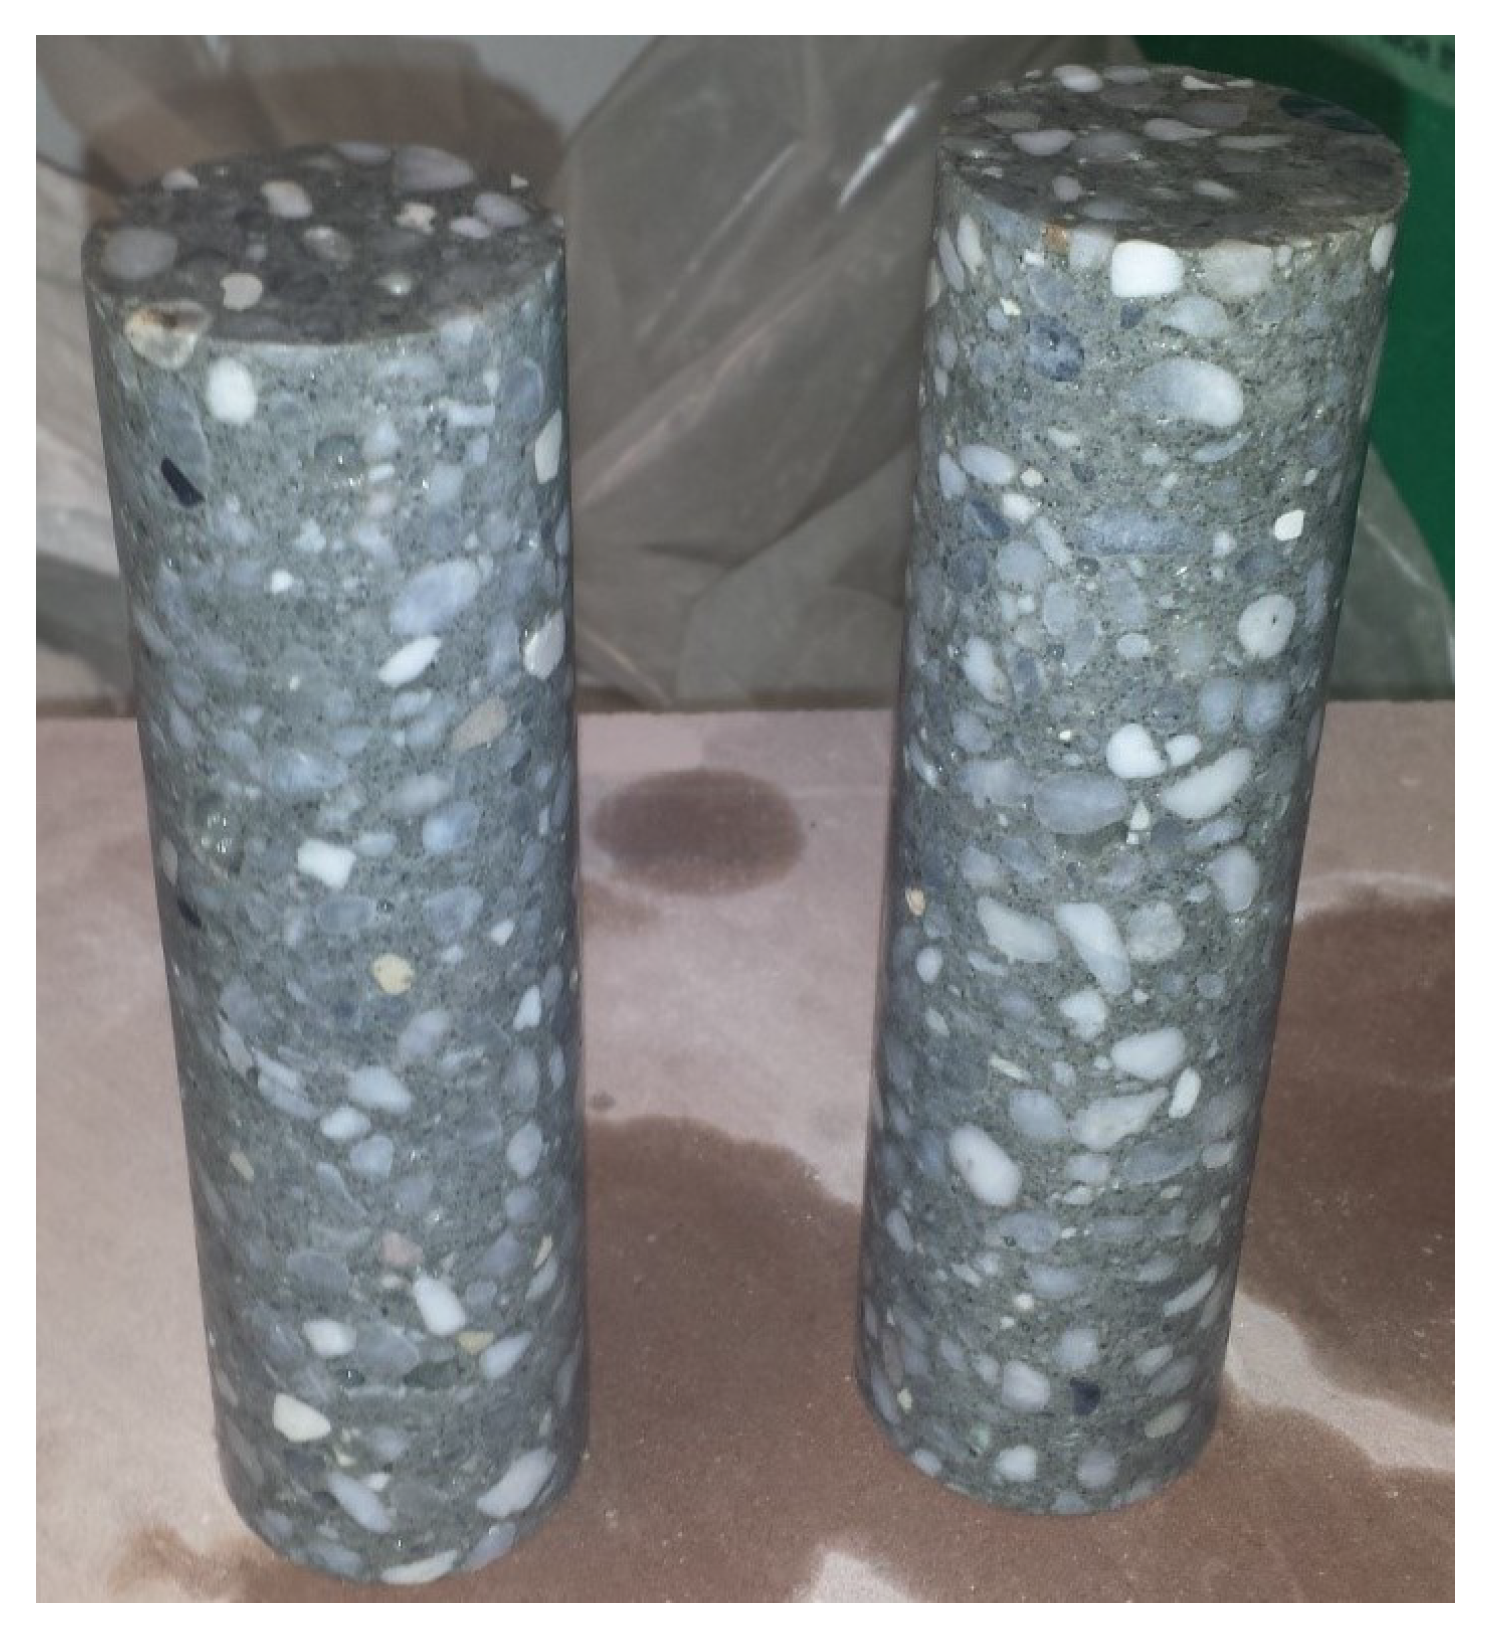
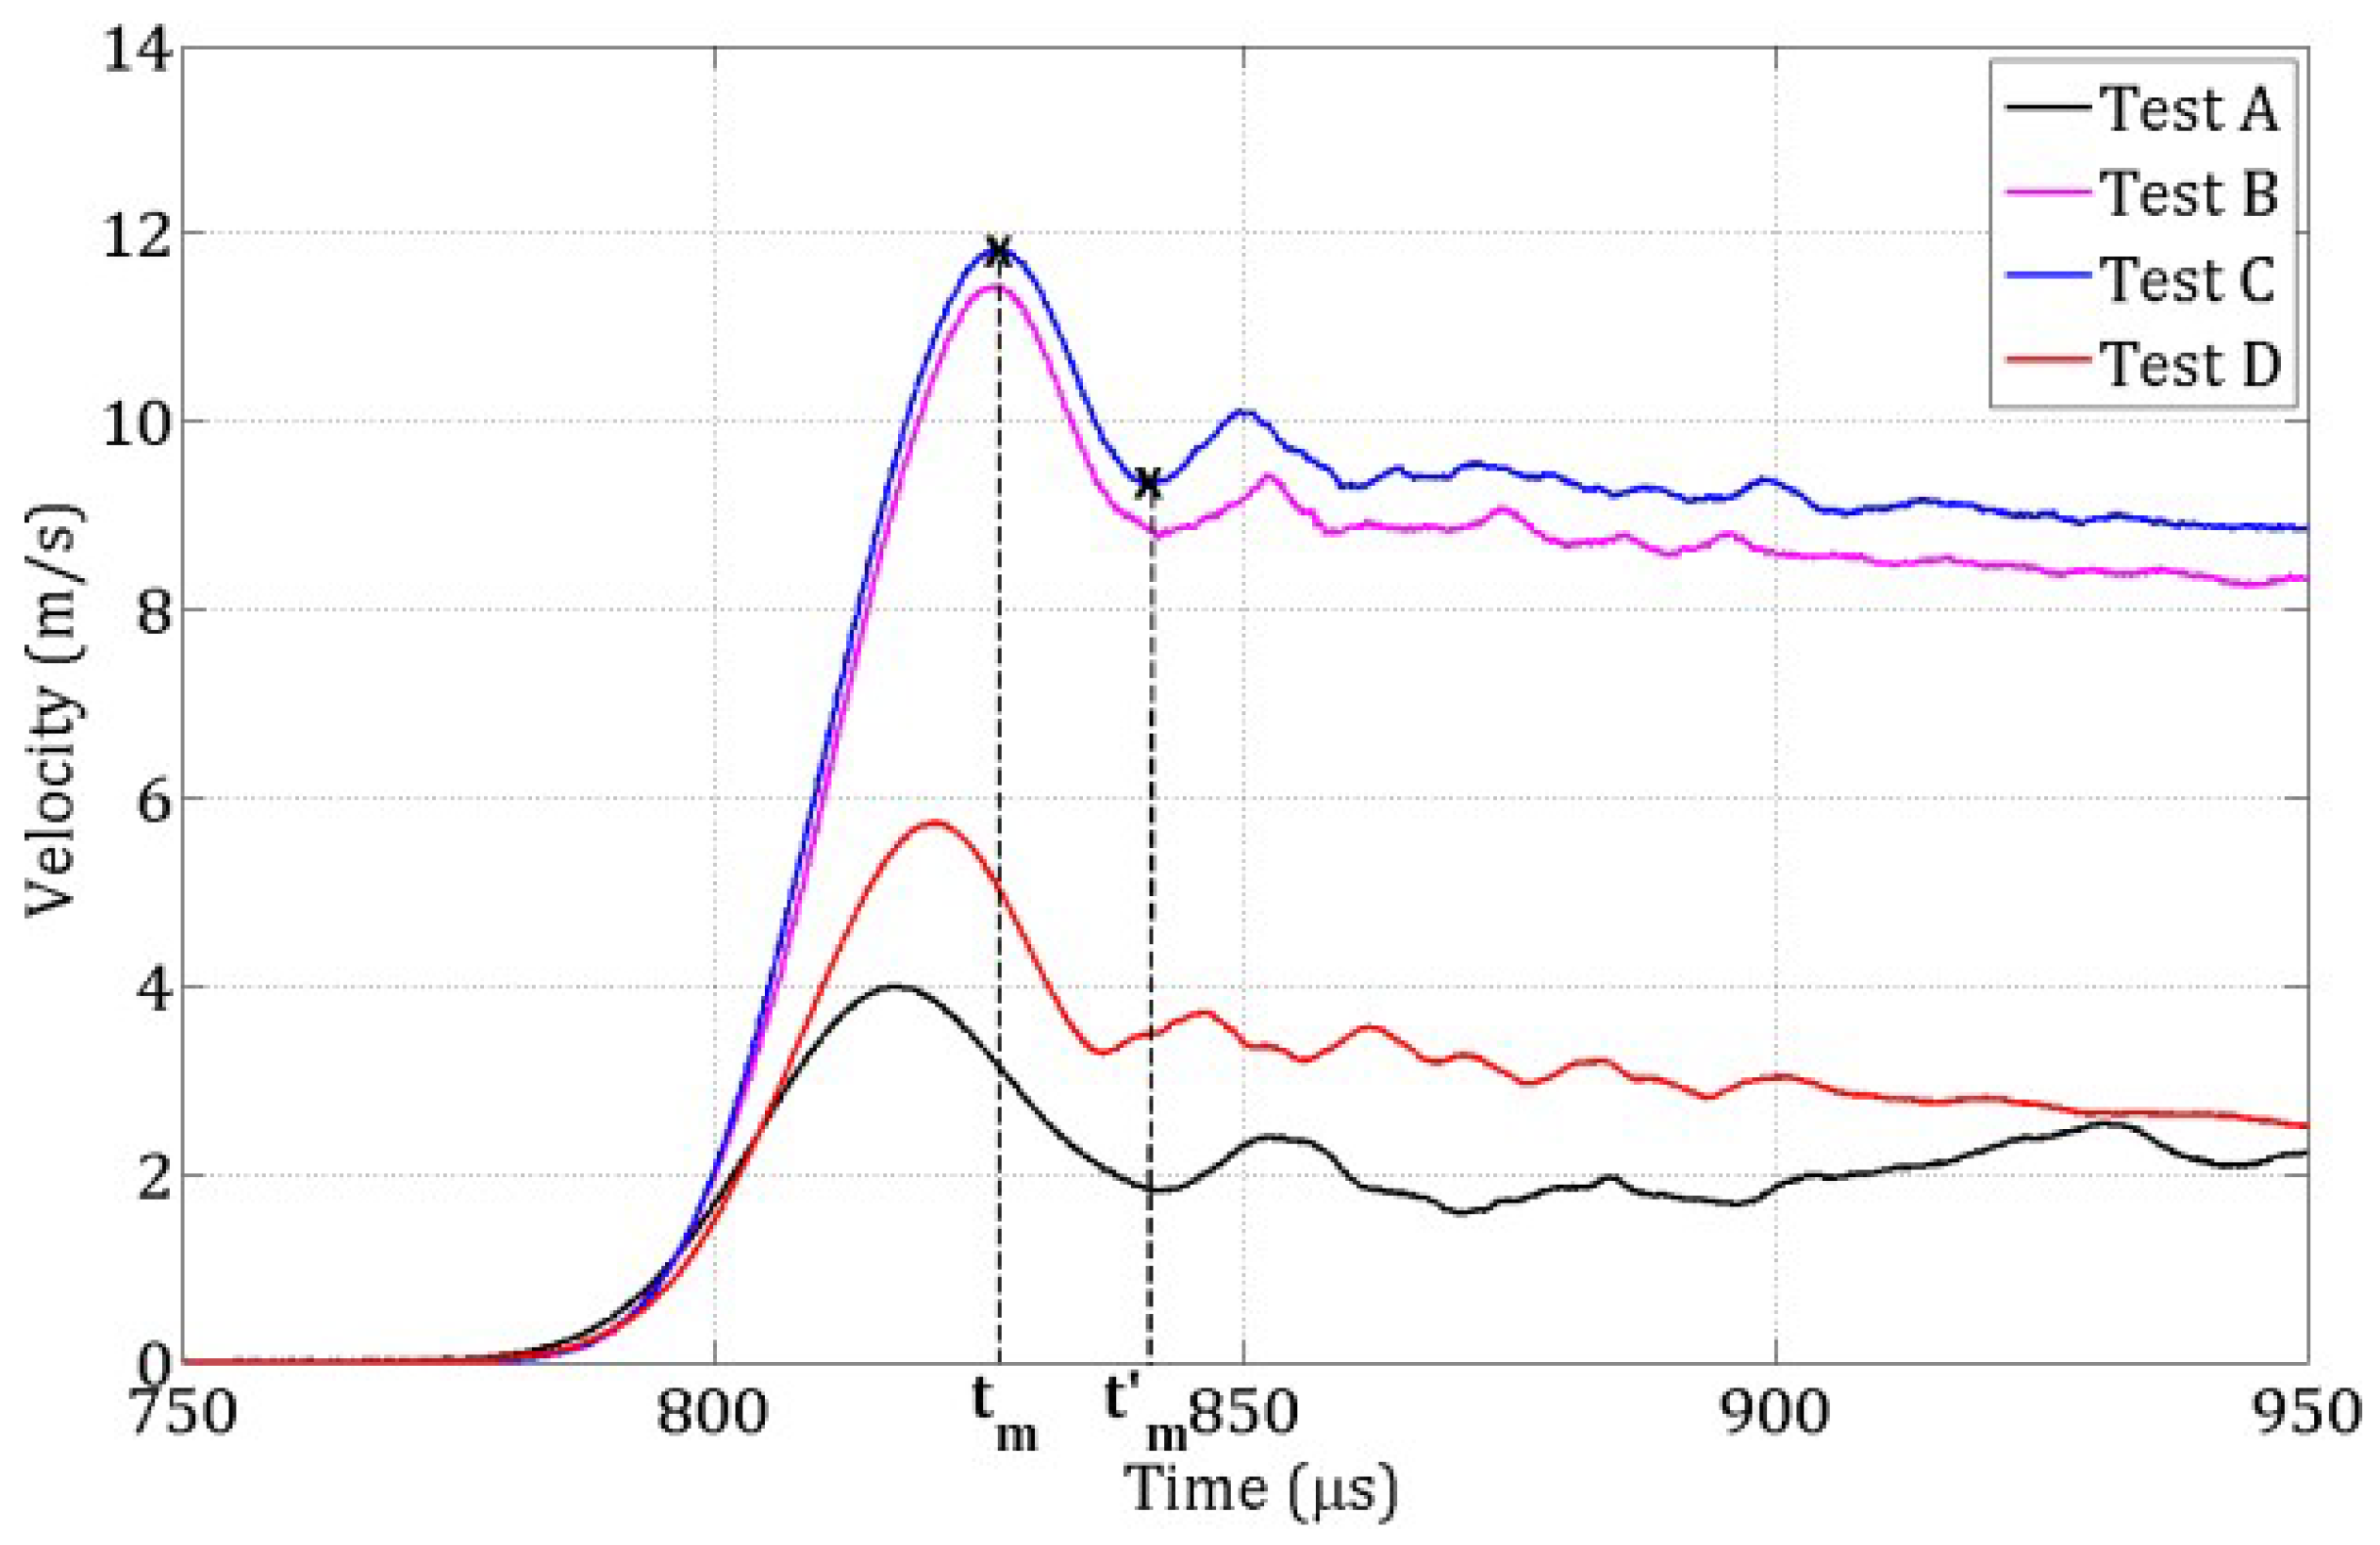
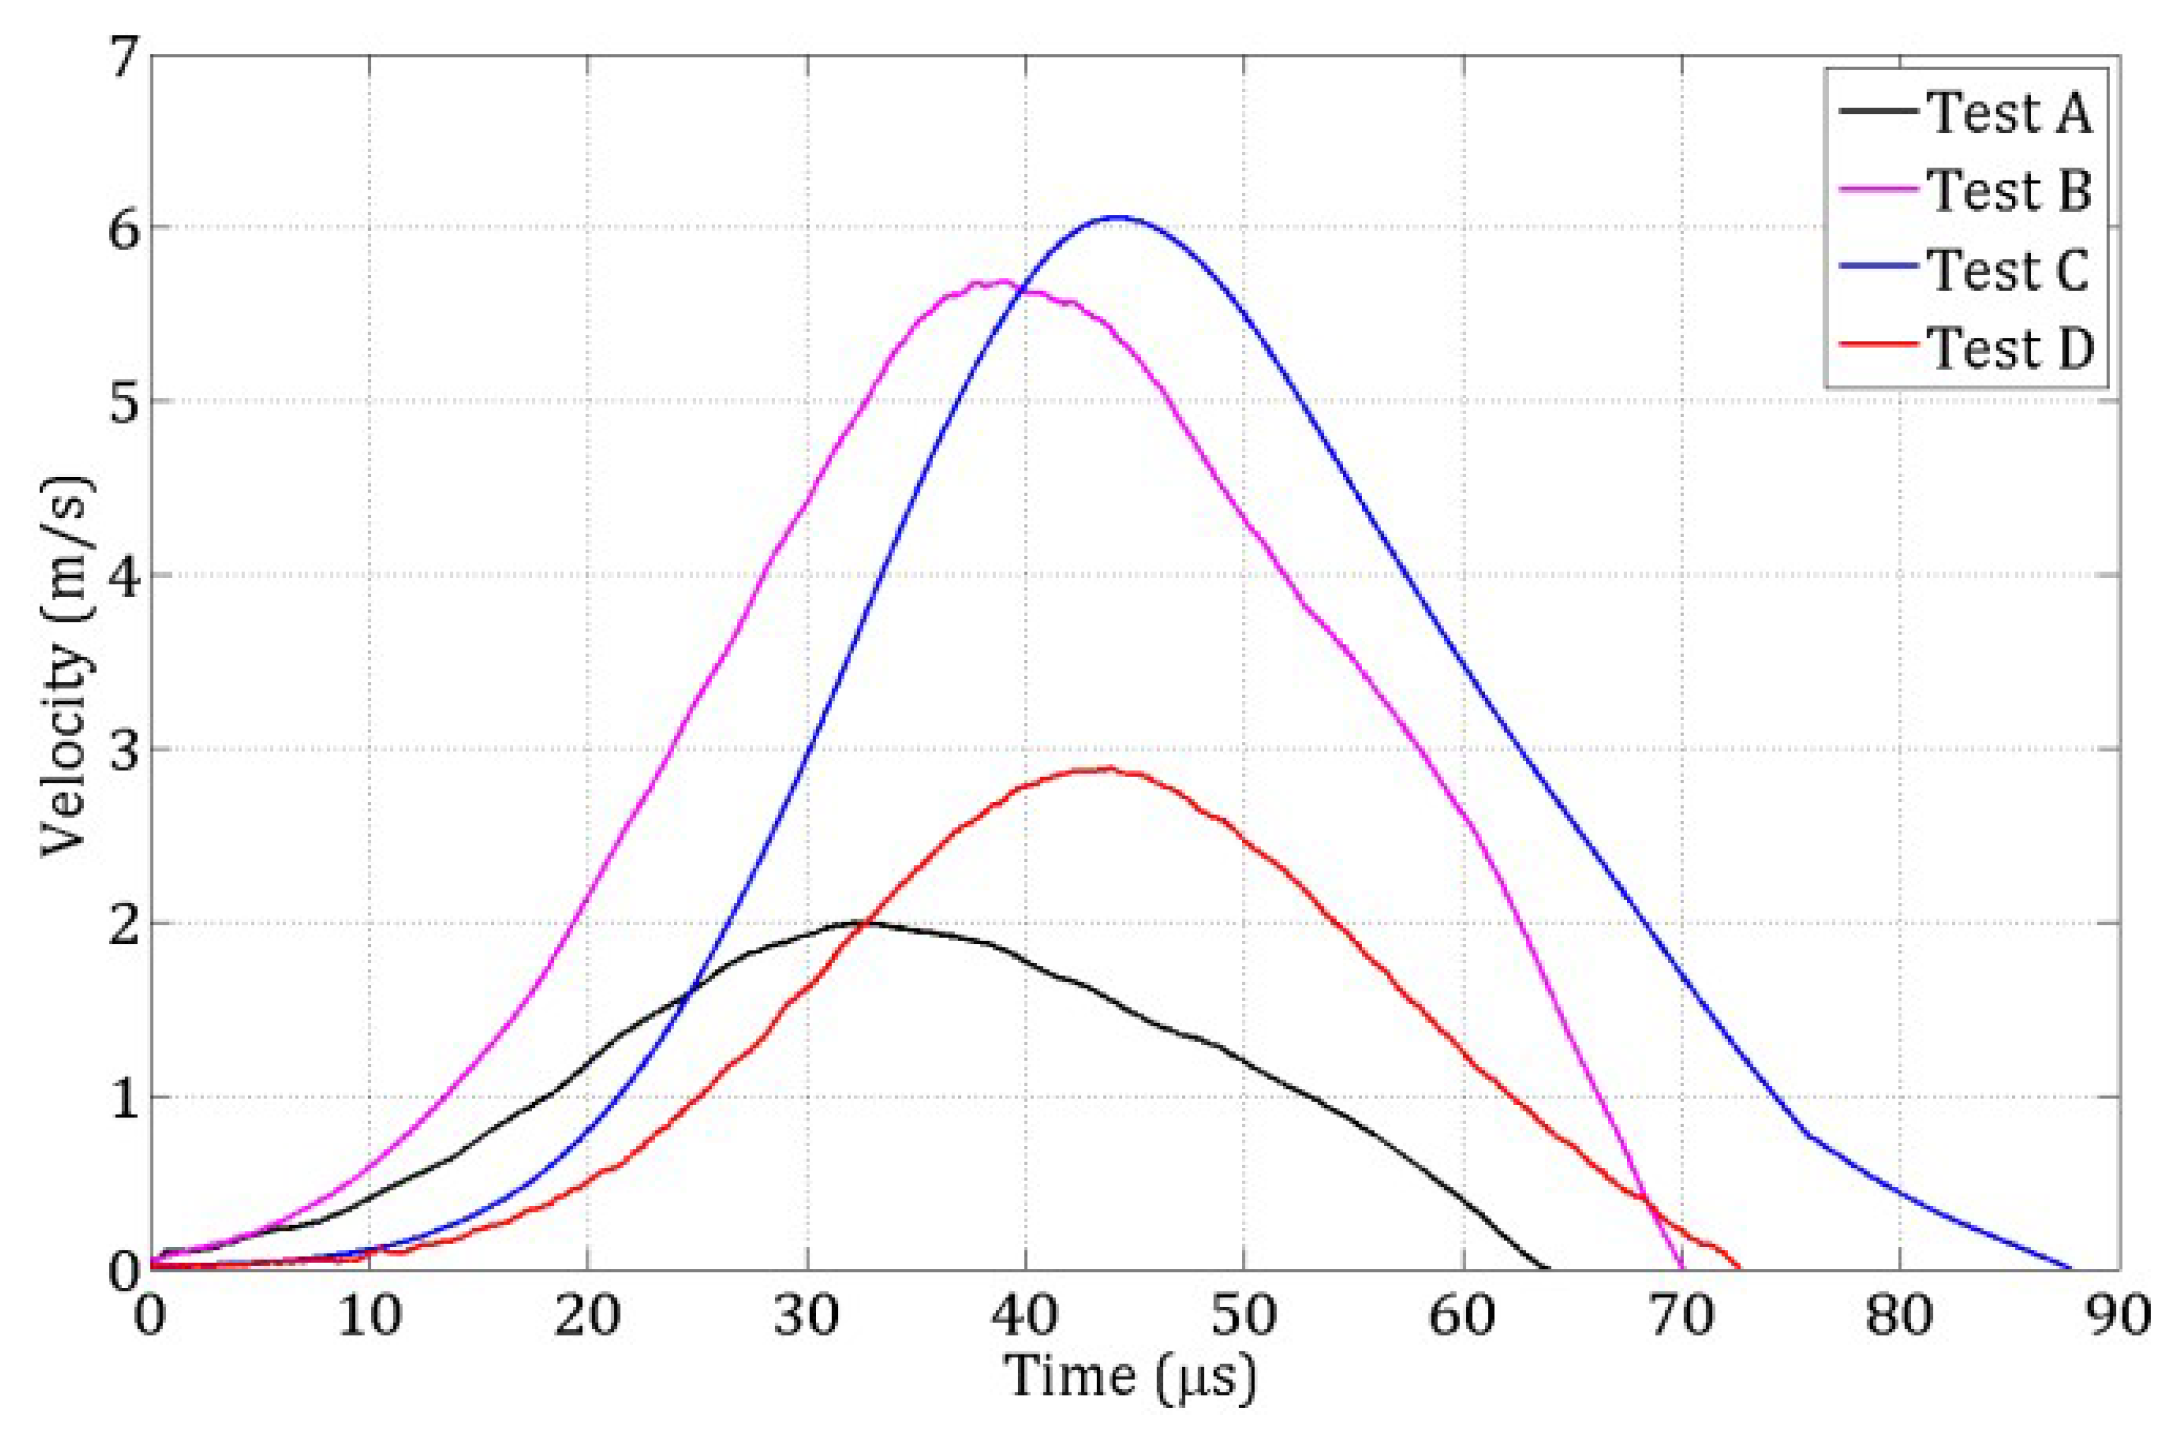
2.2. Spalling Tests Performed on Normal Strength Concrete
3. DEM Model for Concrete
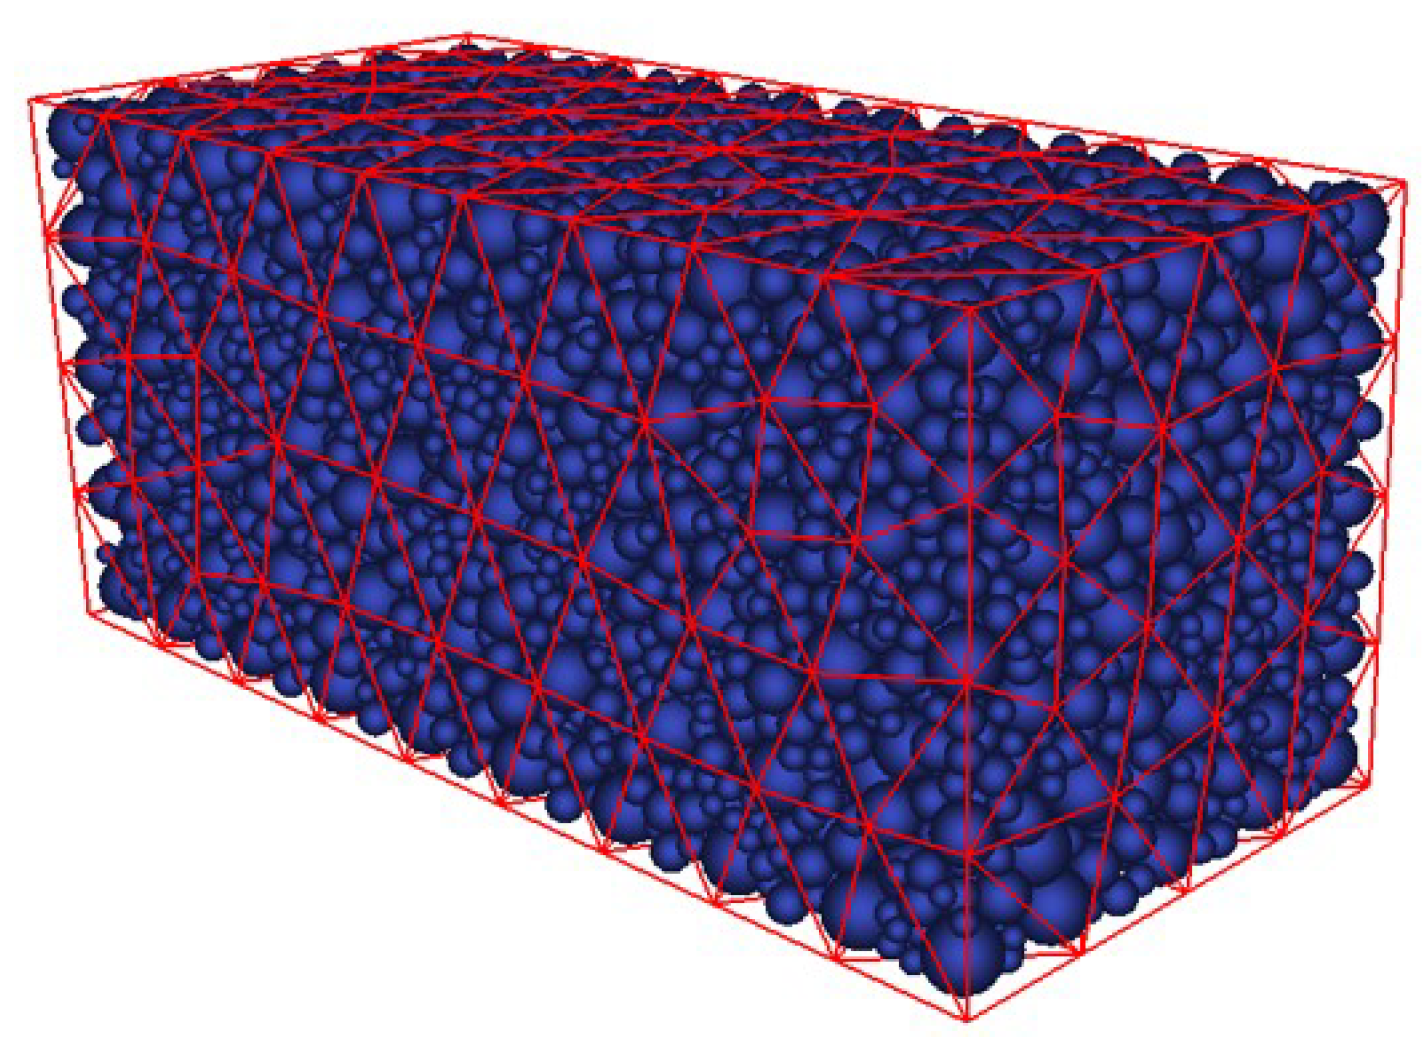
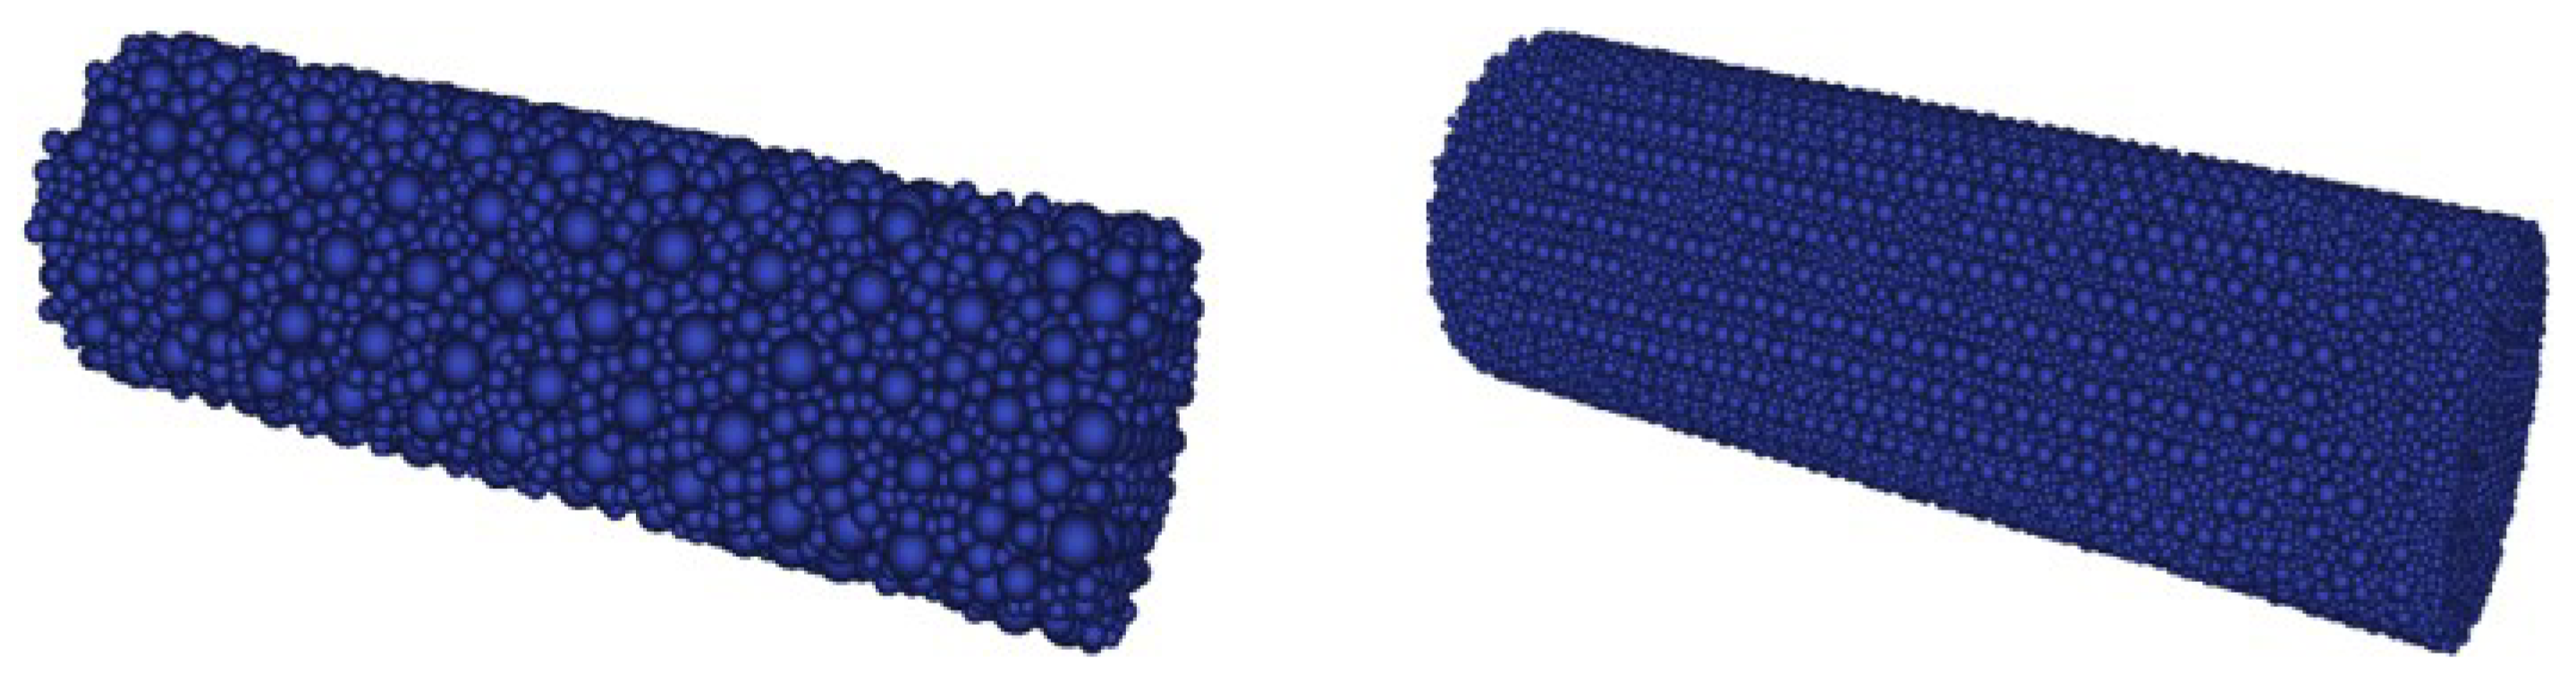
3.1. Discrete Element Generation and Packing Strategy
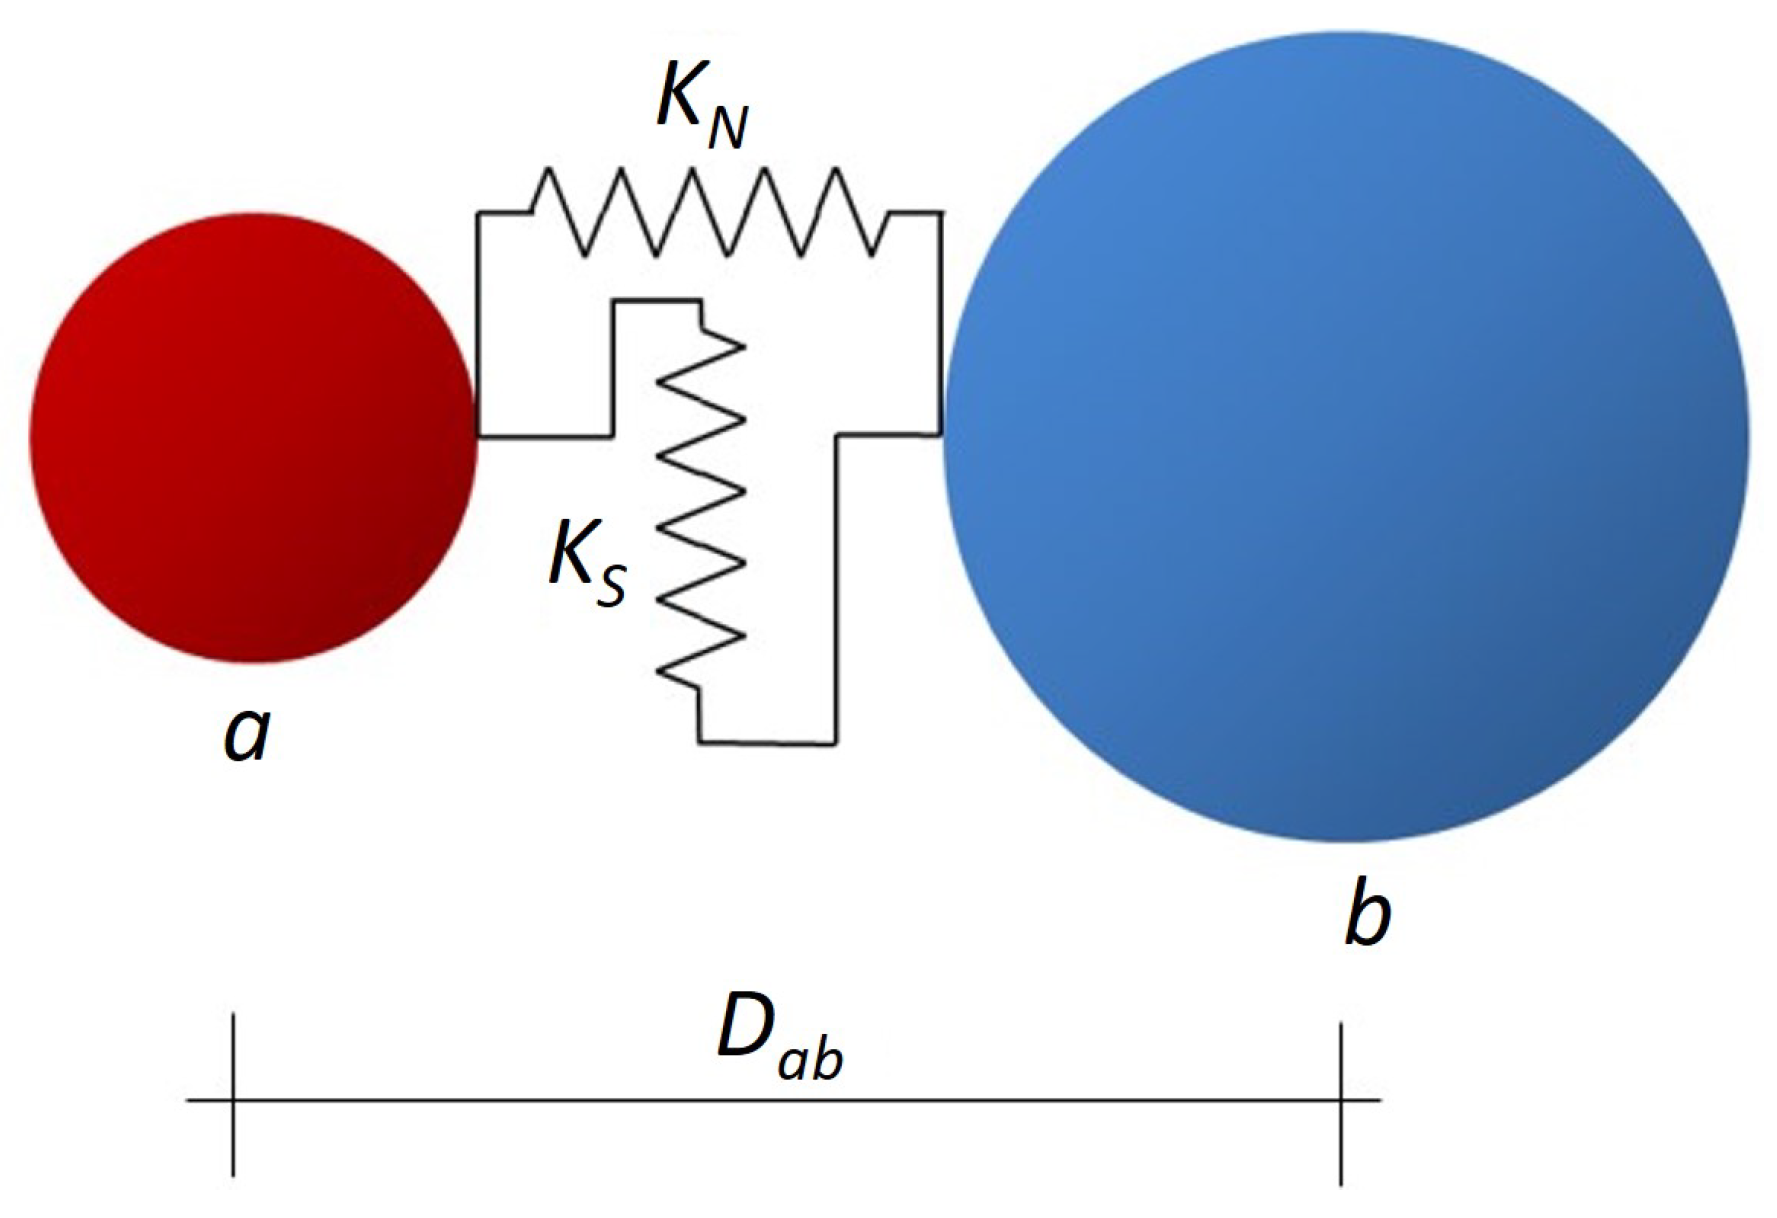
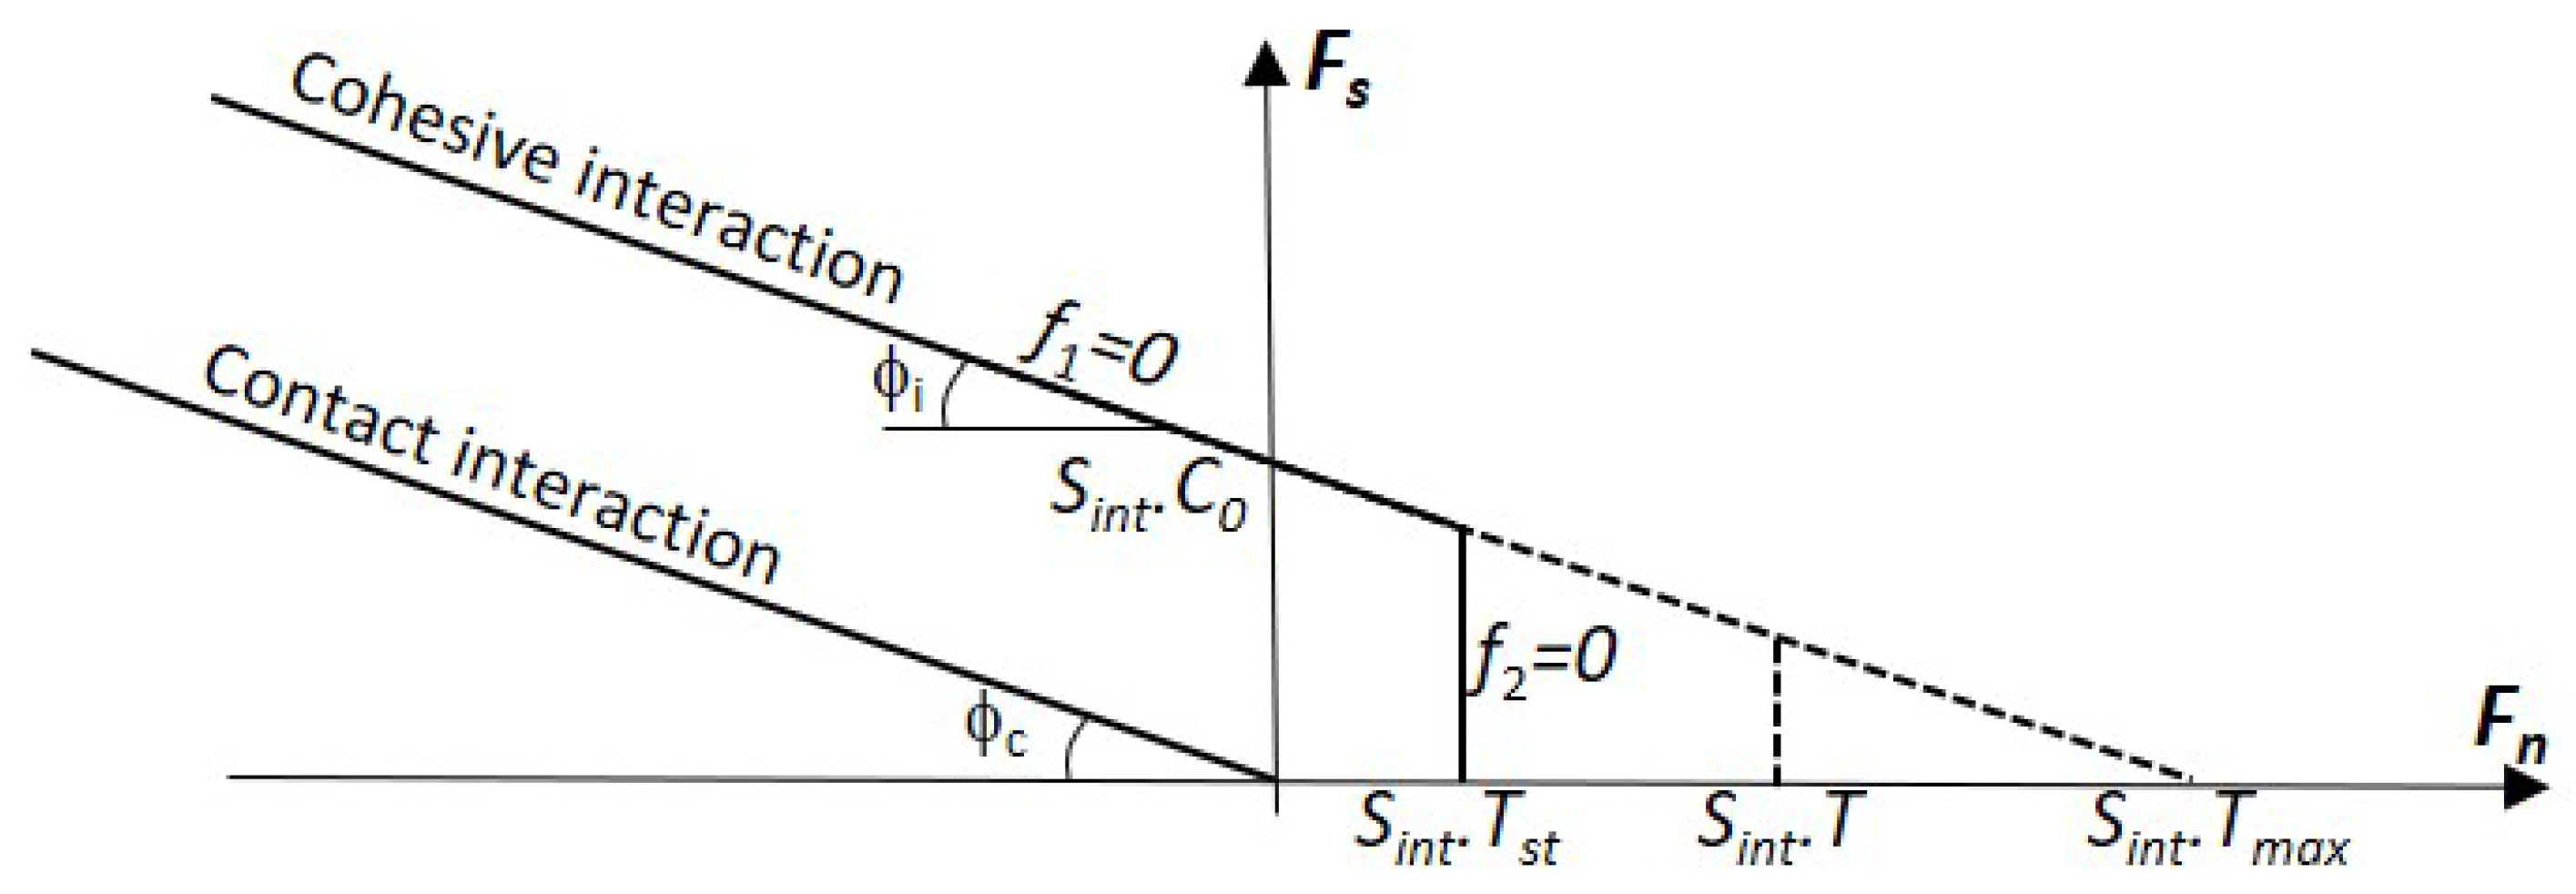
3.2. Cohesive and Contact Interactions Between Elements
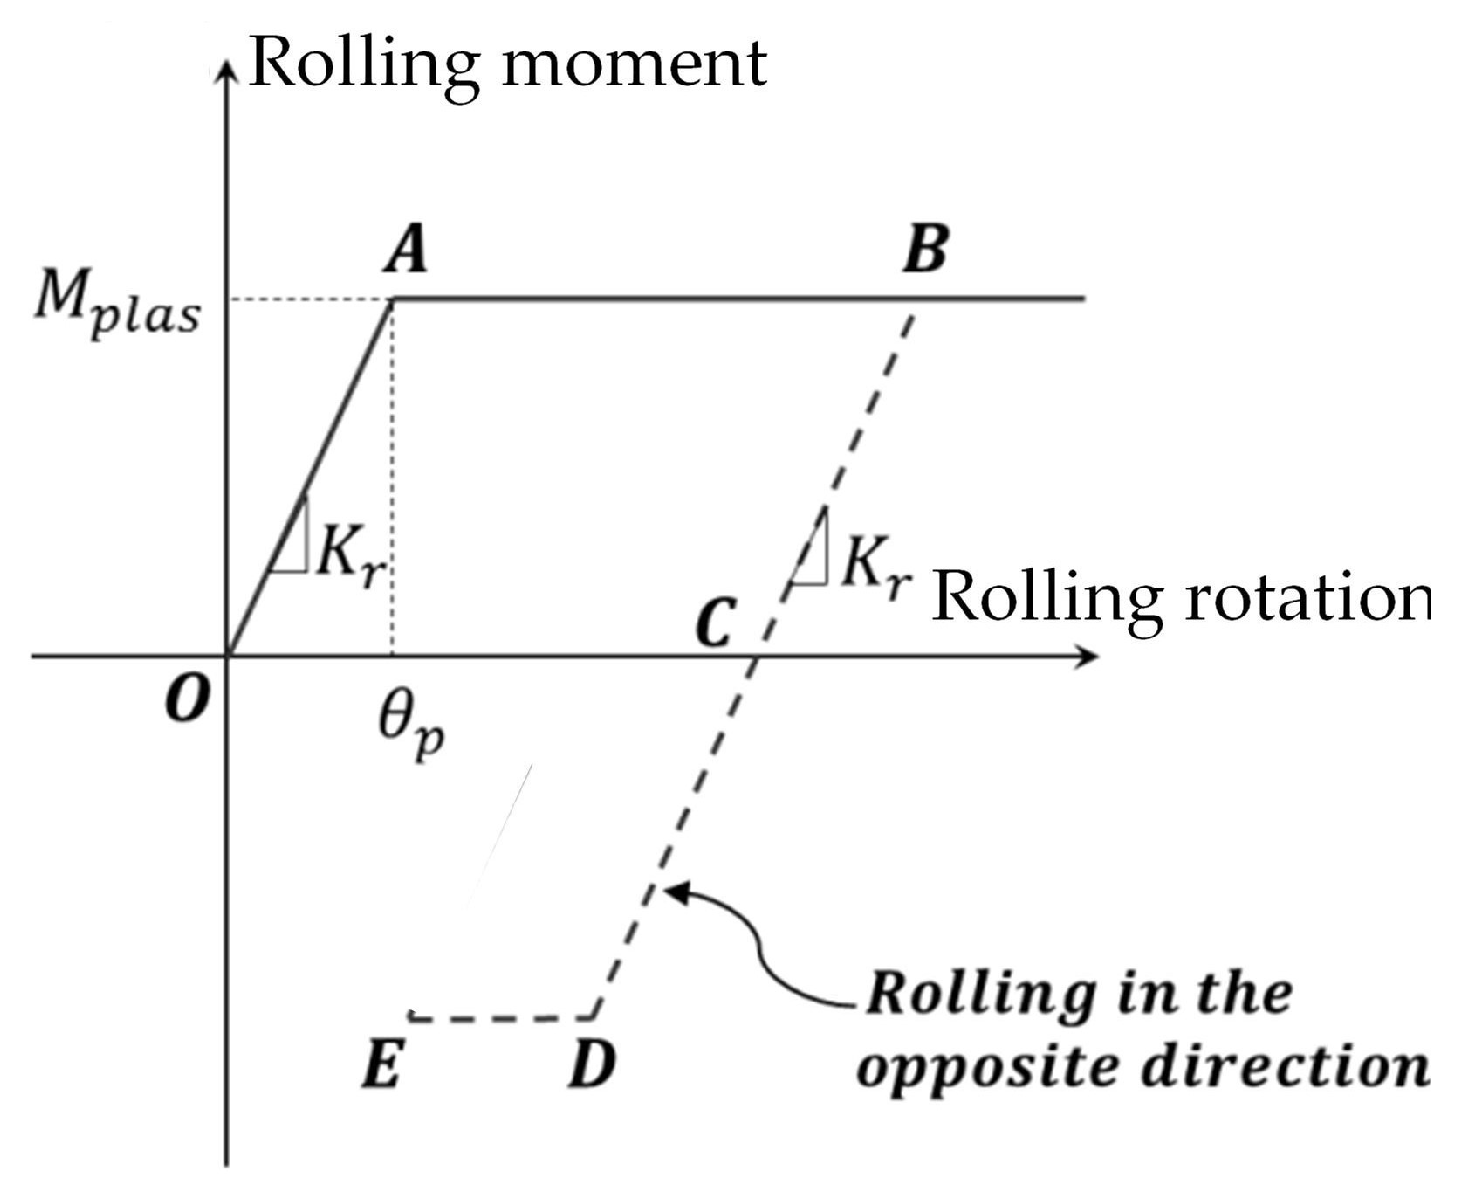
3.3. Elastic Behavior and Rolling Resistance
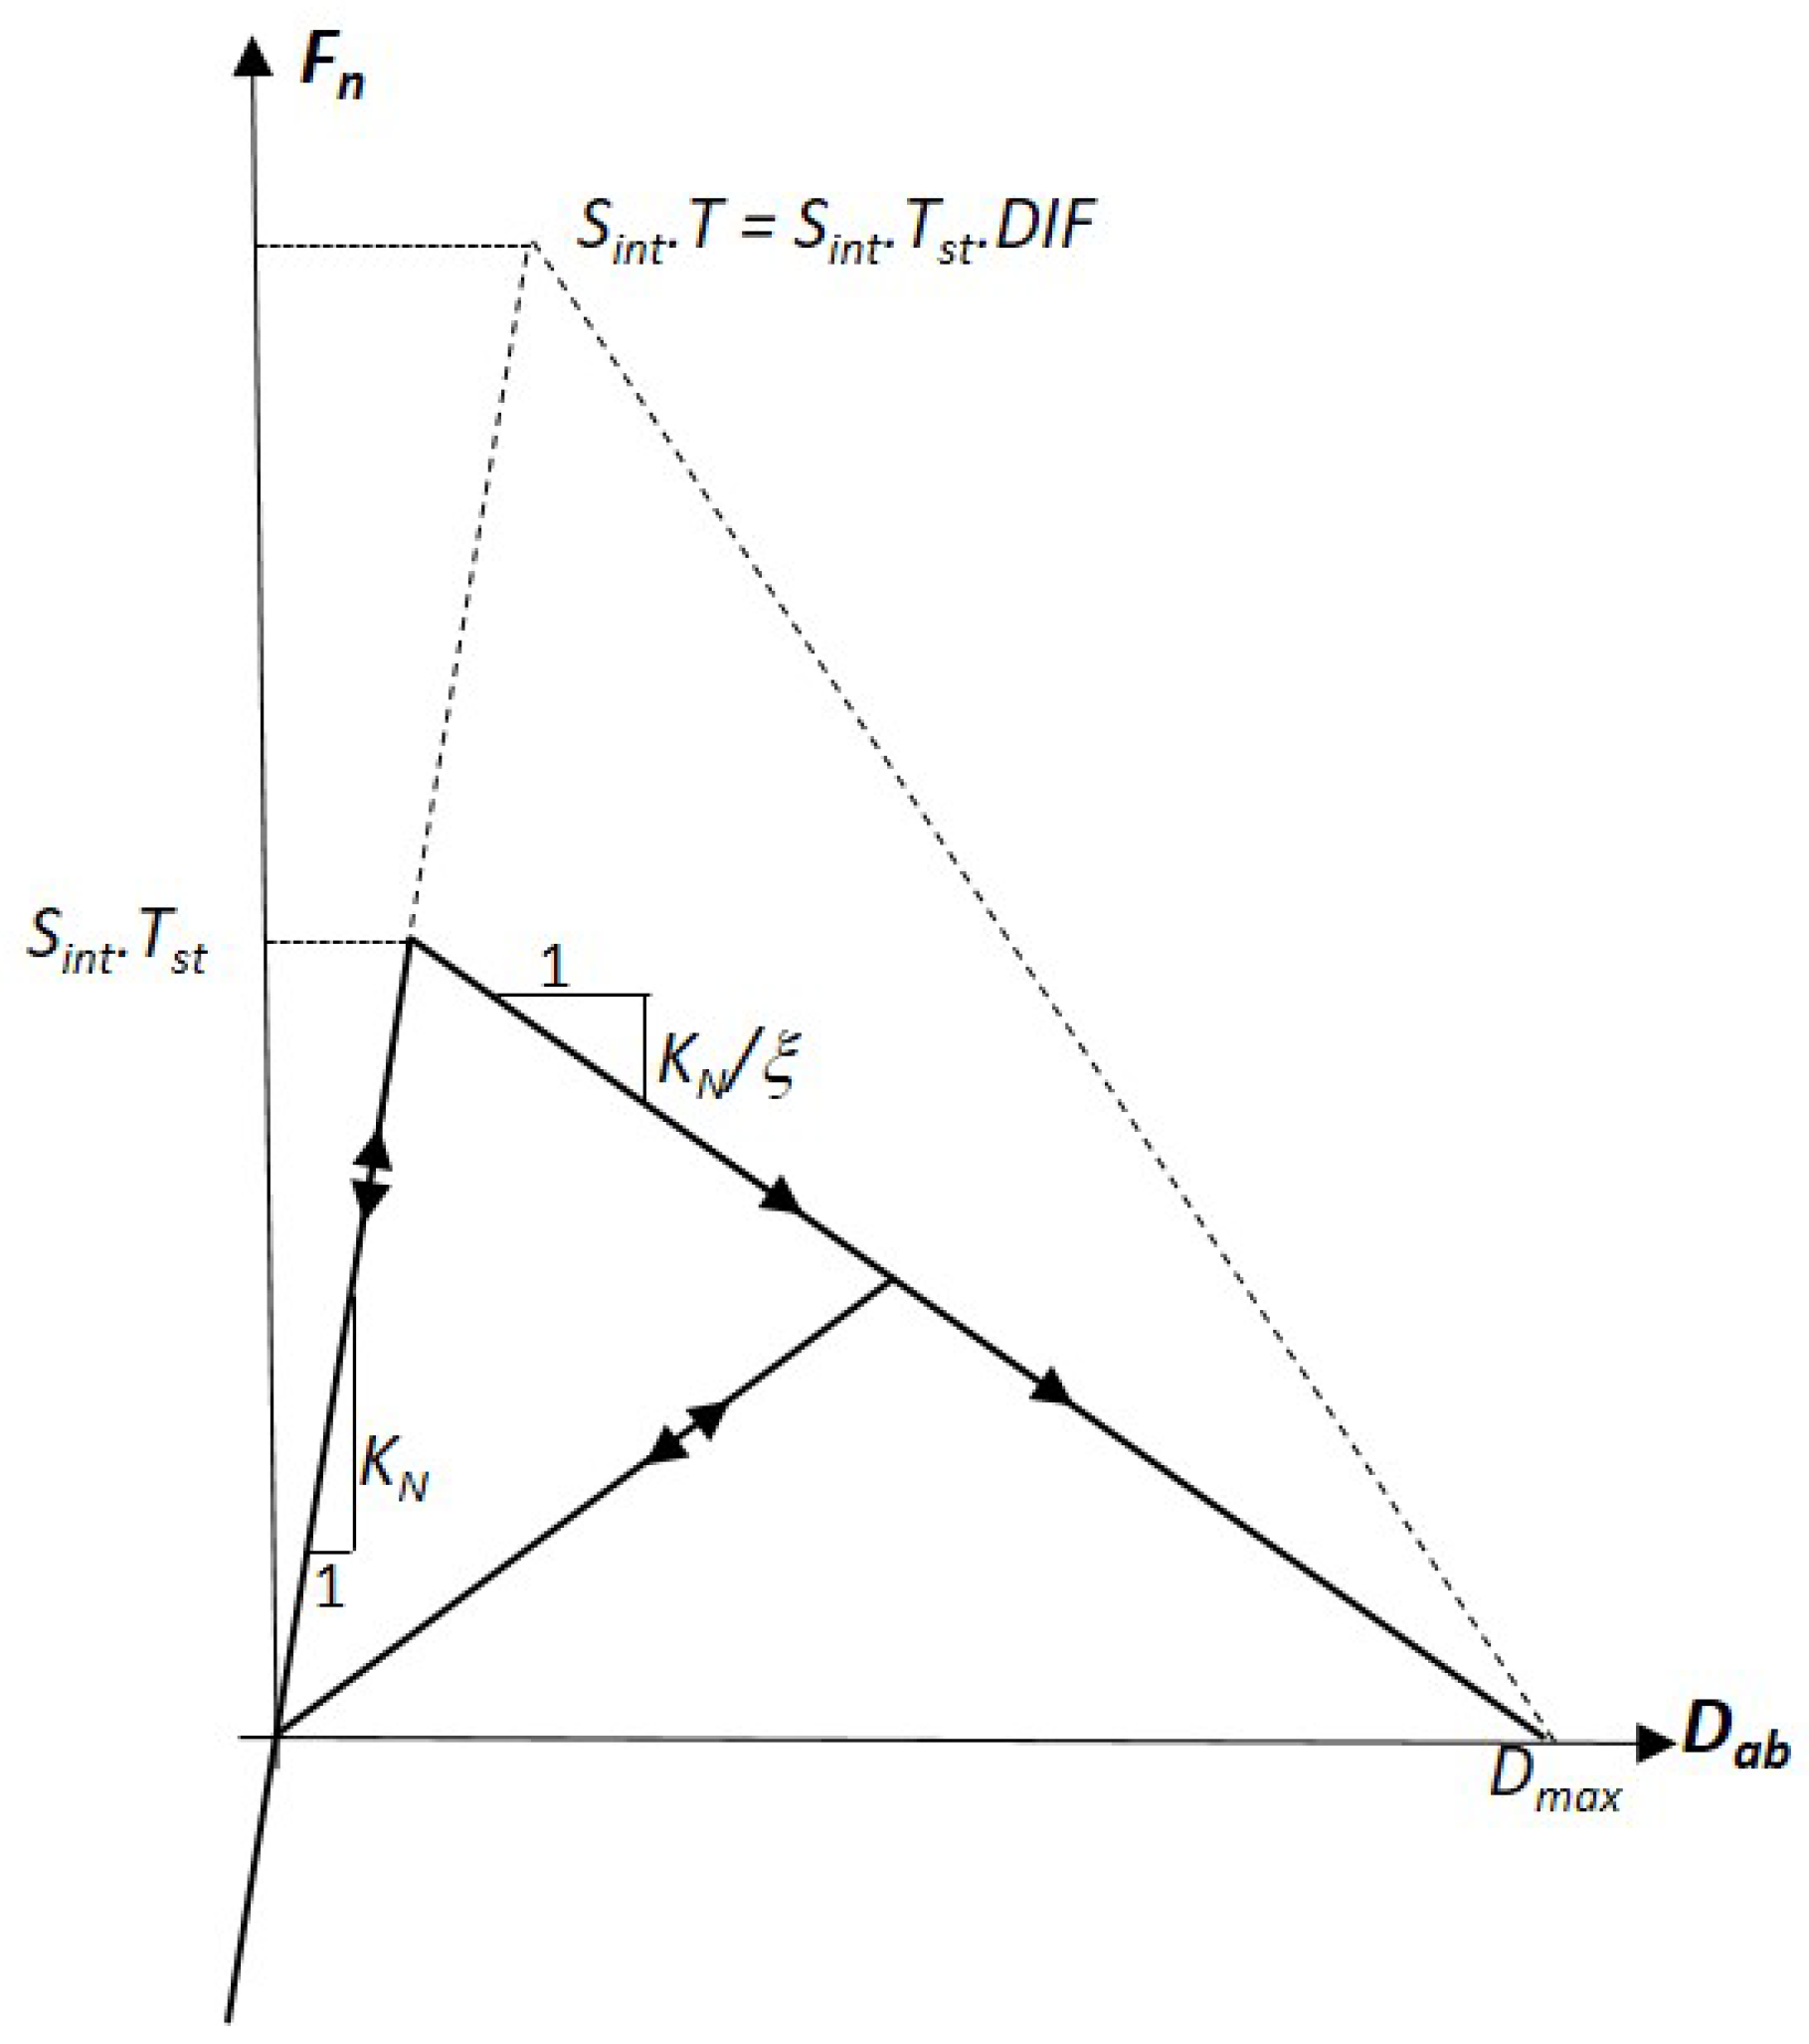
3.4. Failure Criterion
4. Identification of the DEM Model Constitutive Behavior
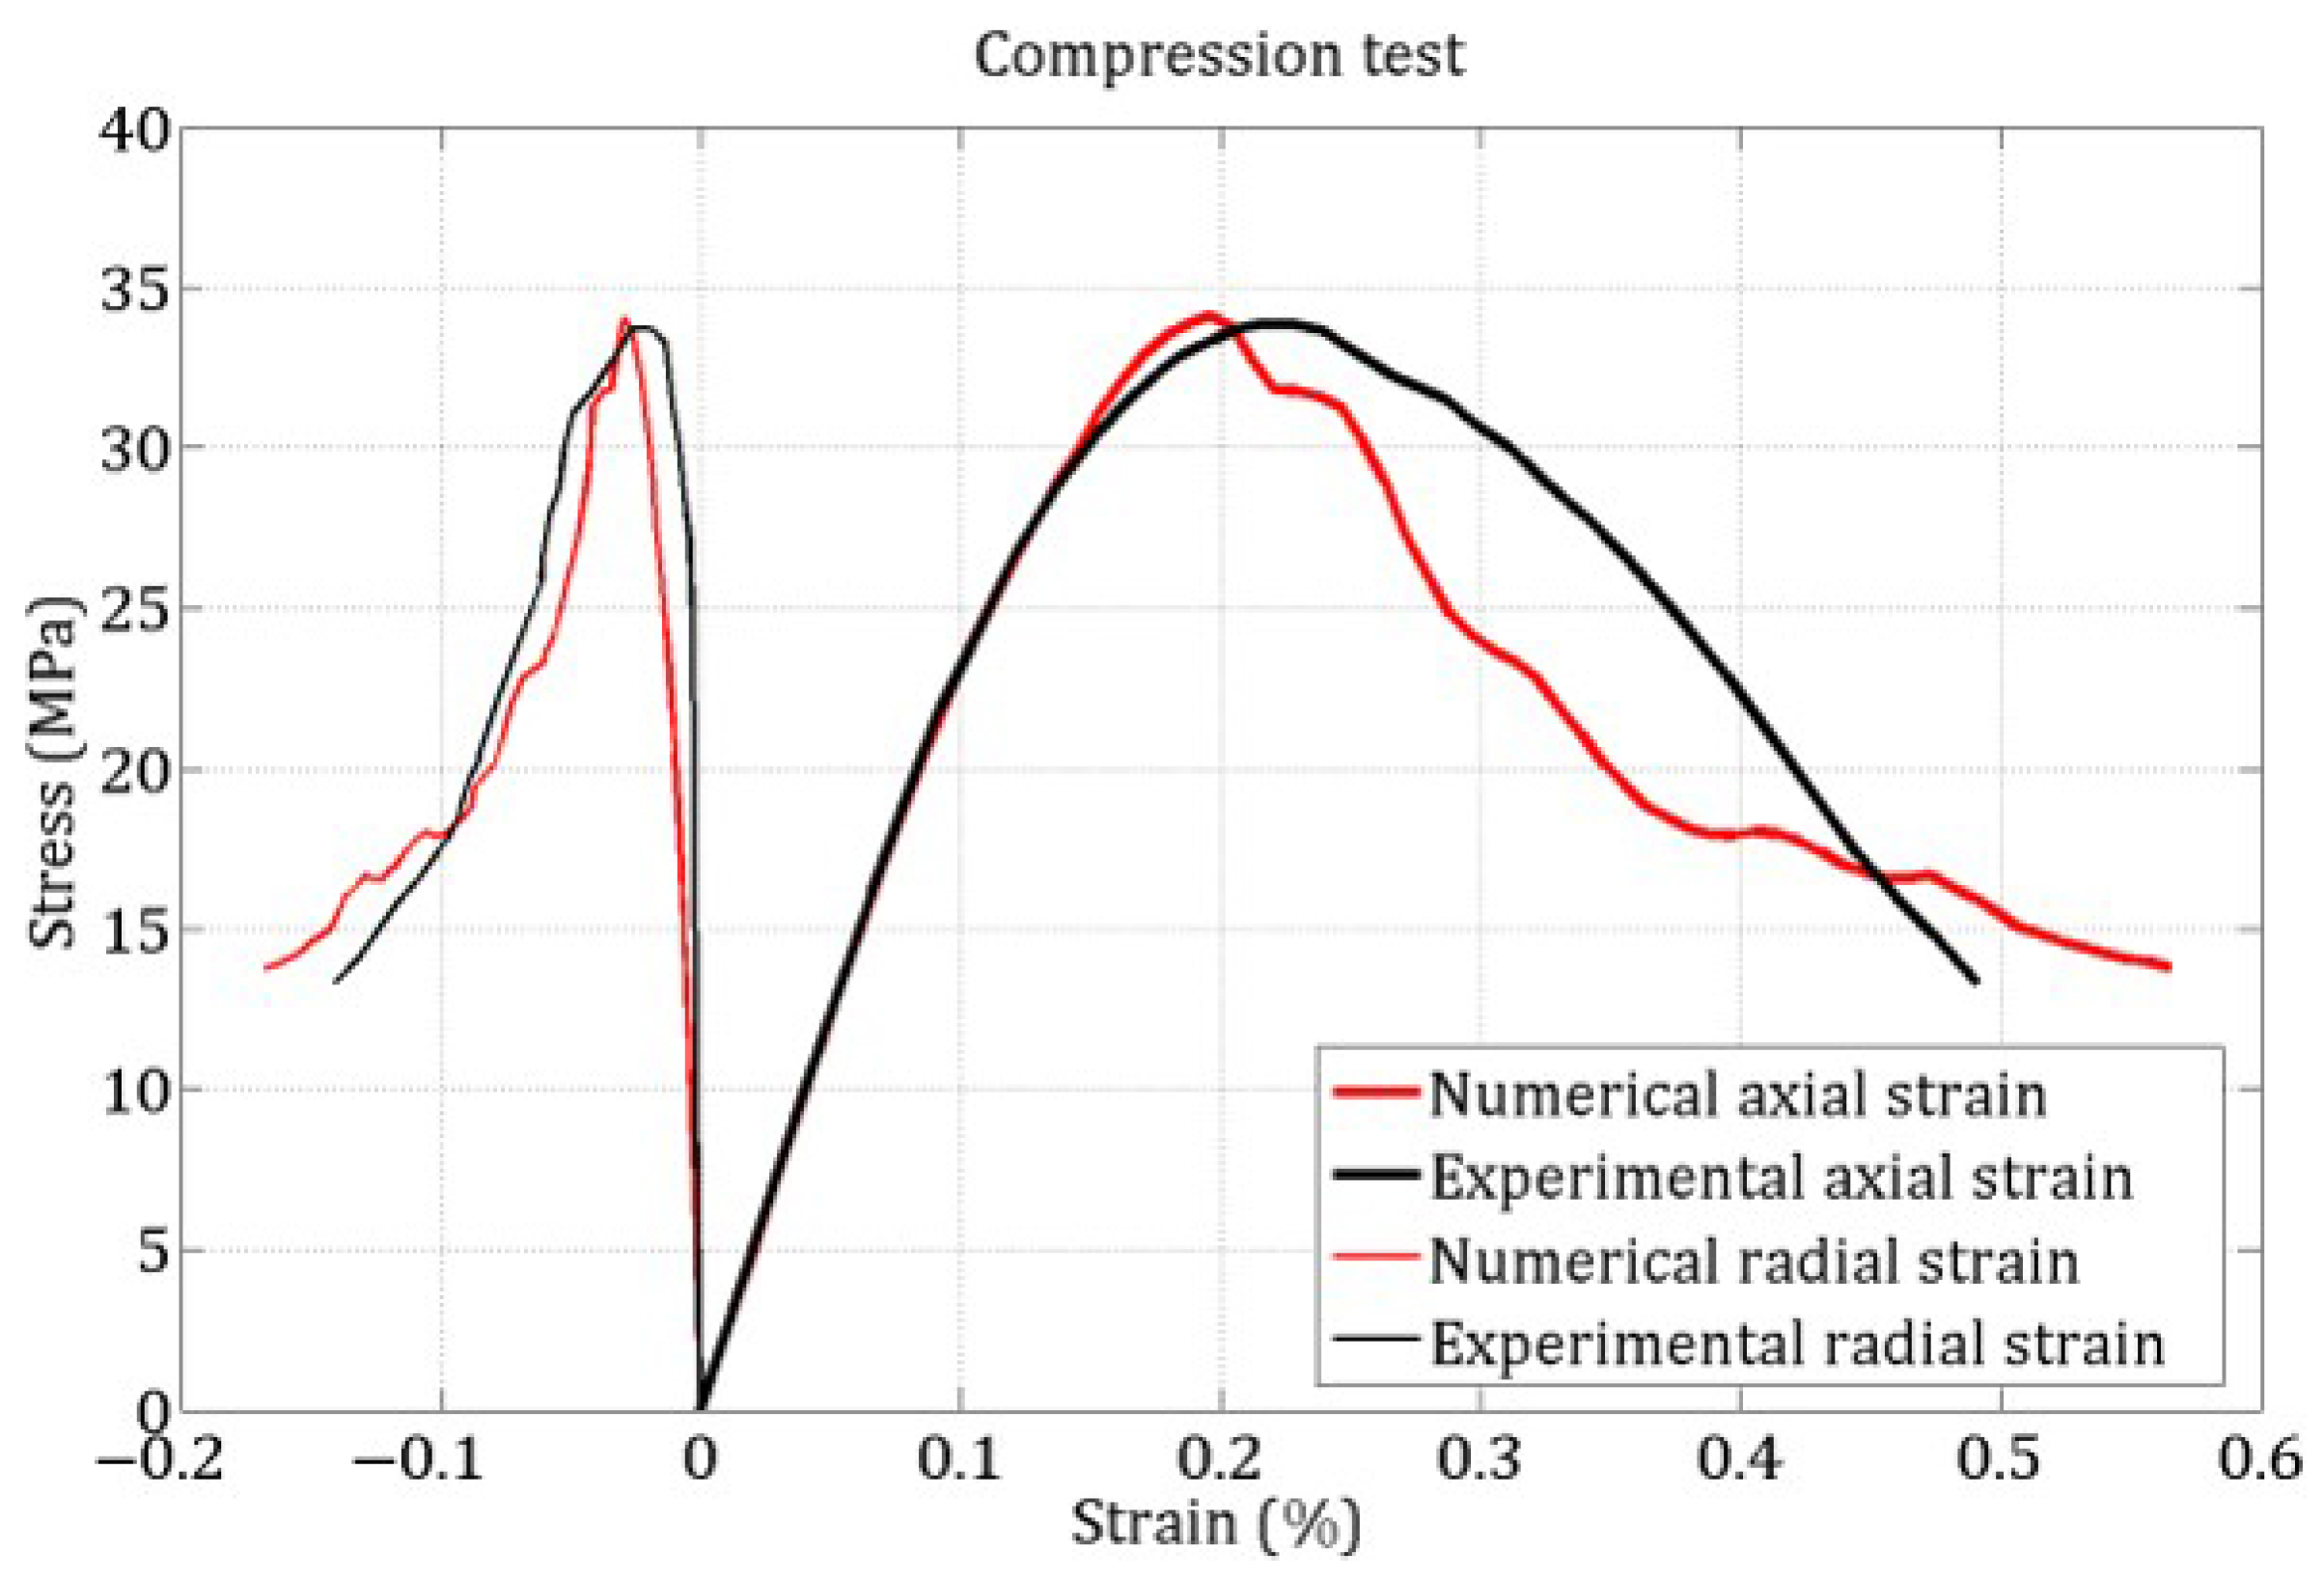
4.1. Identification of Model Parameters for the R30A7 Concrete Under Quasi-Static Loading
4.2. Identification of Model Parameters for the R30A7 Concrete Under Tensile Dynamic Loading
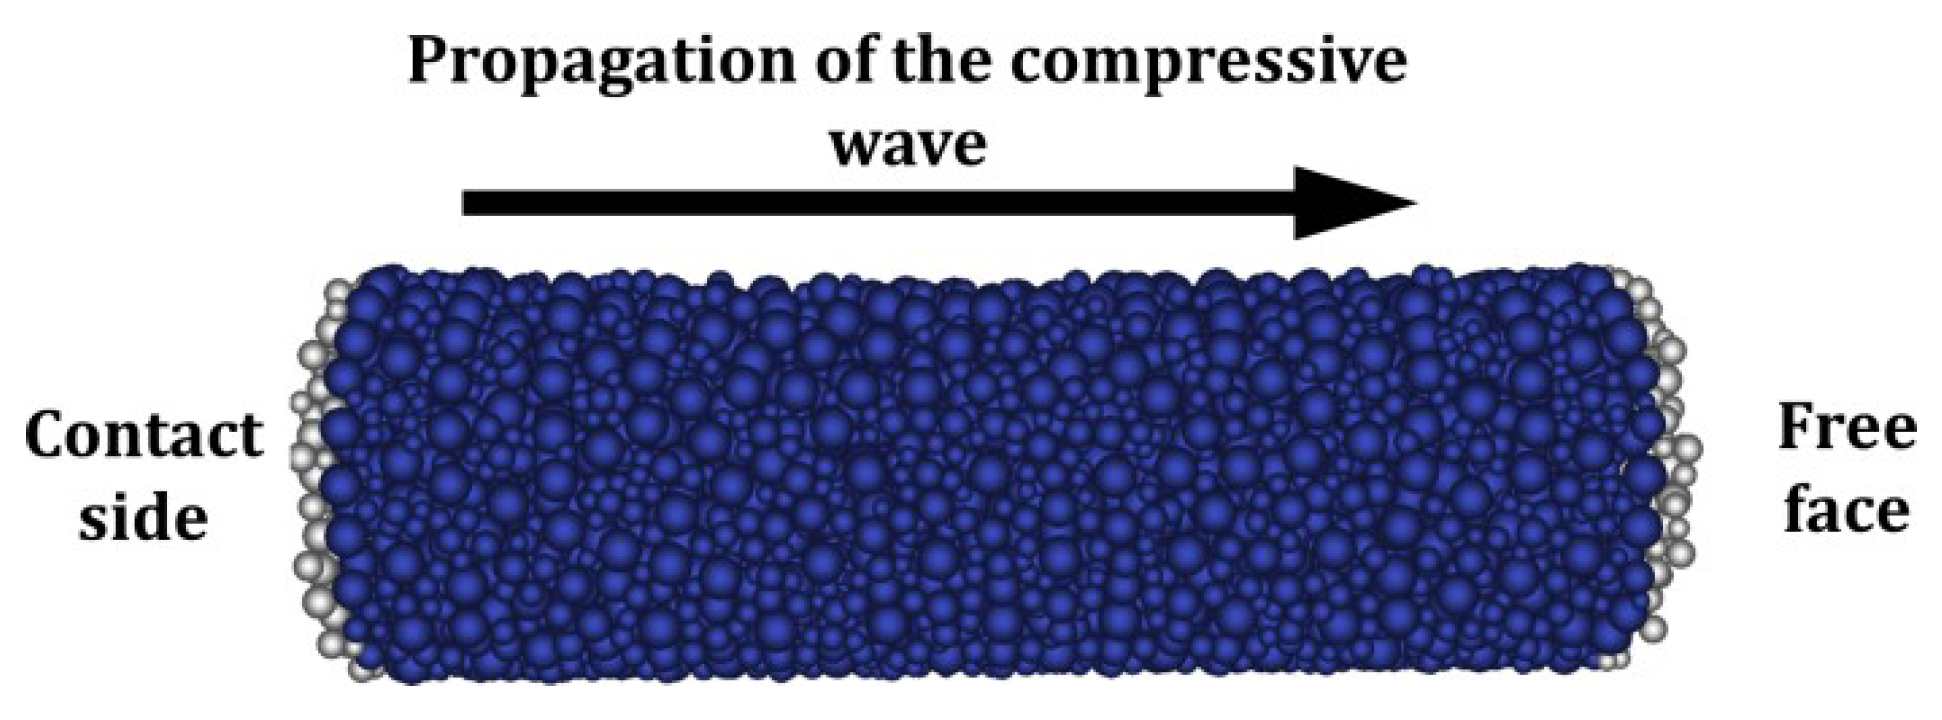
4.2.1. Numerical Setup
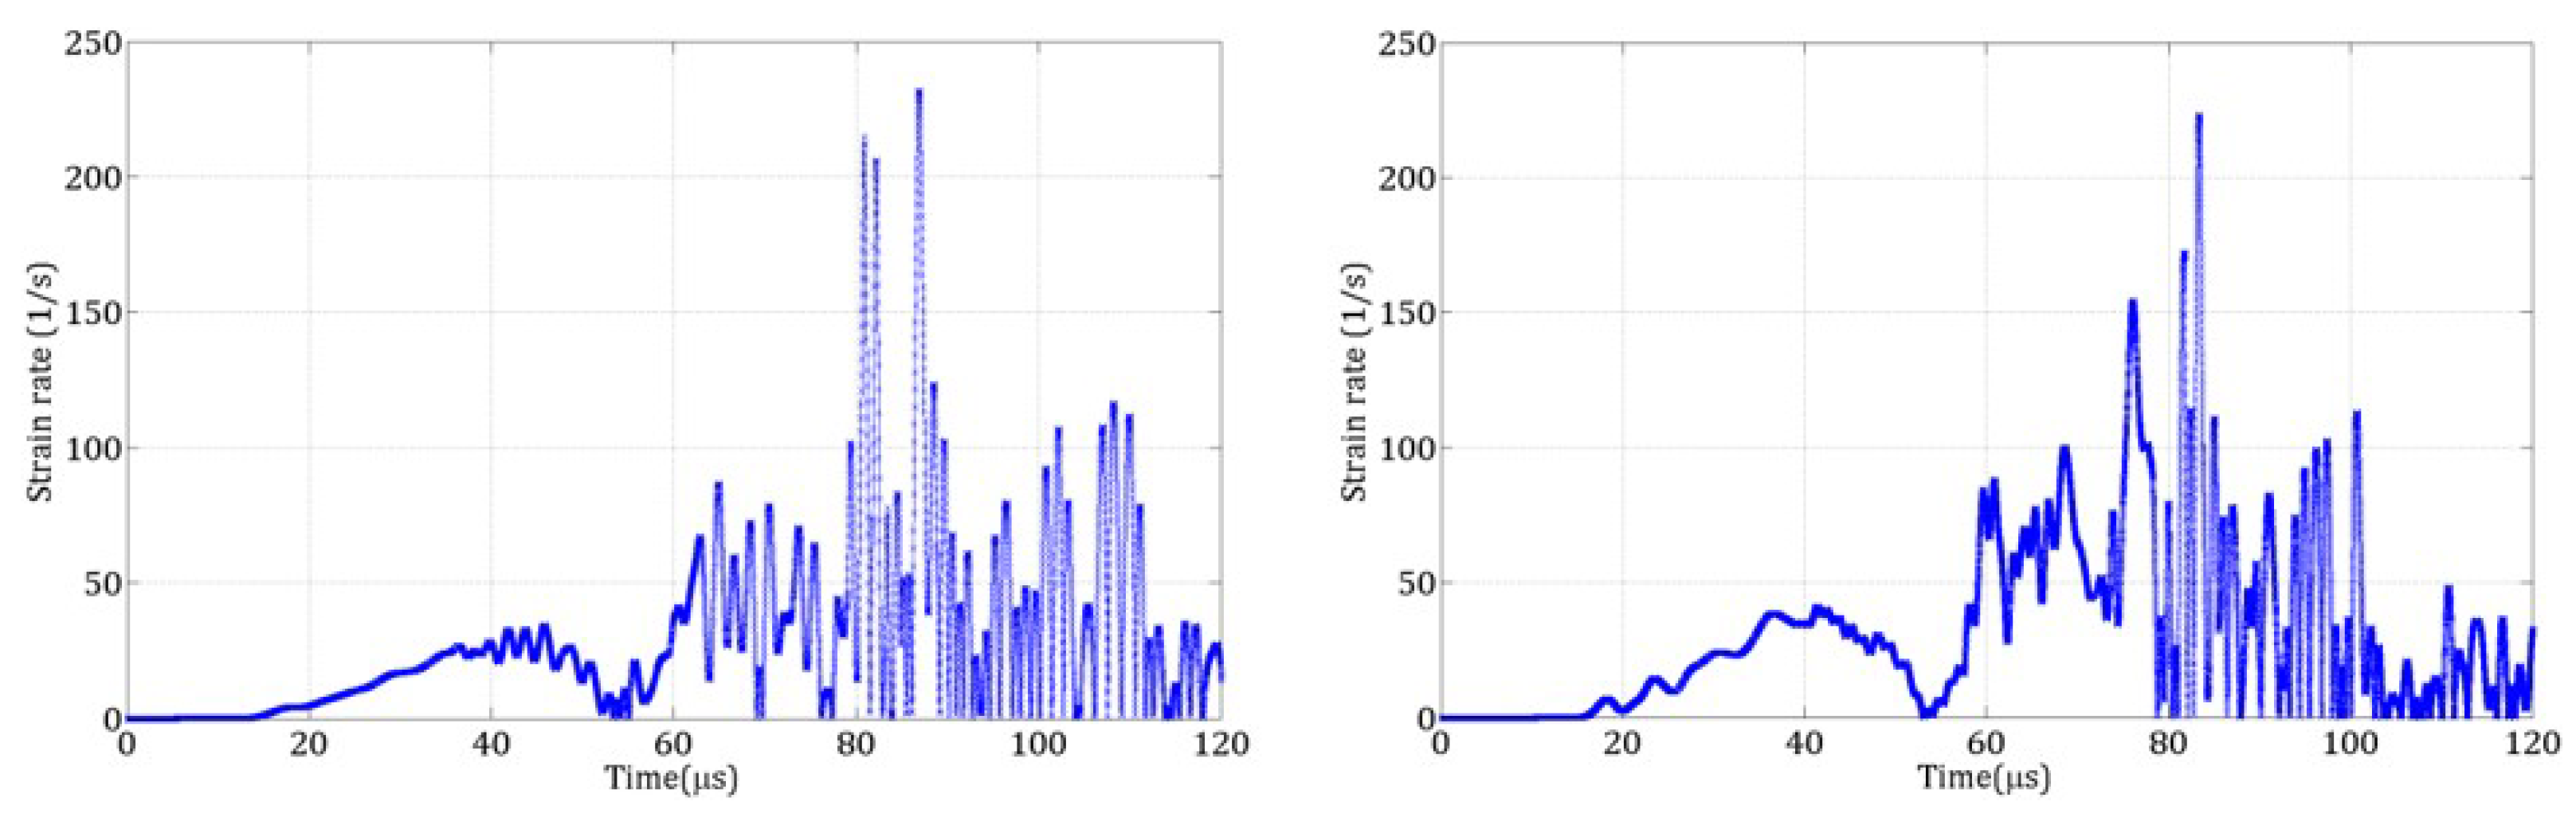
4.2.2. Calculation of the Strain Rate
4.2.3. Strain Rate Filtering
4.2.4. Simulations Without Strain-Rate-Dependent Tensile Strength
4.2.5. Strain Rate Dependency in Tension
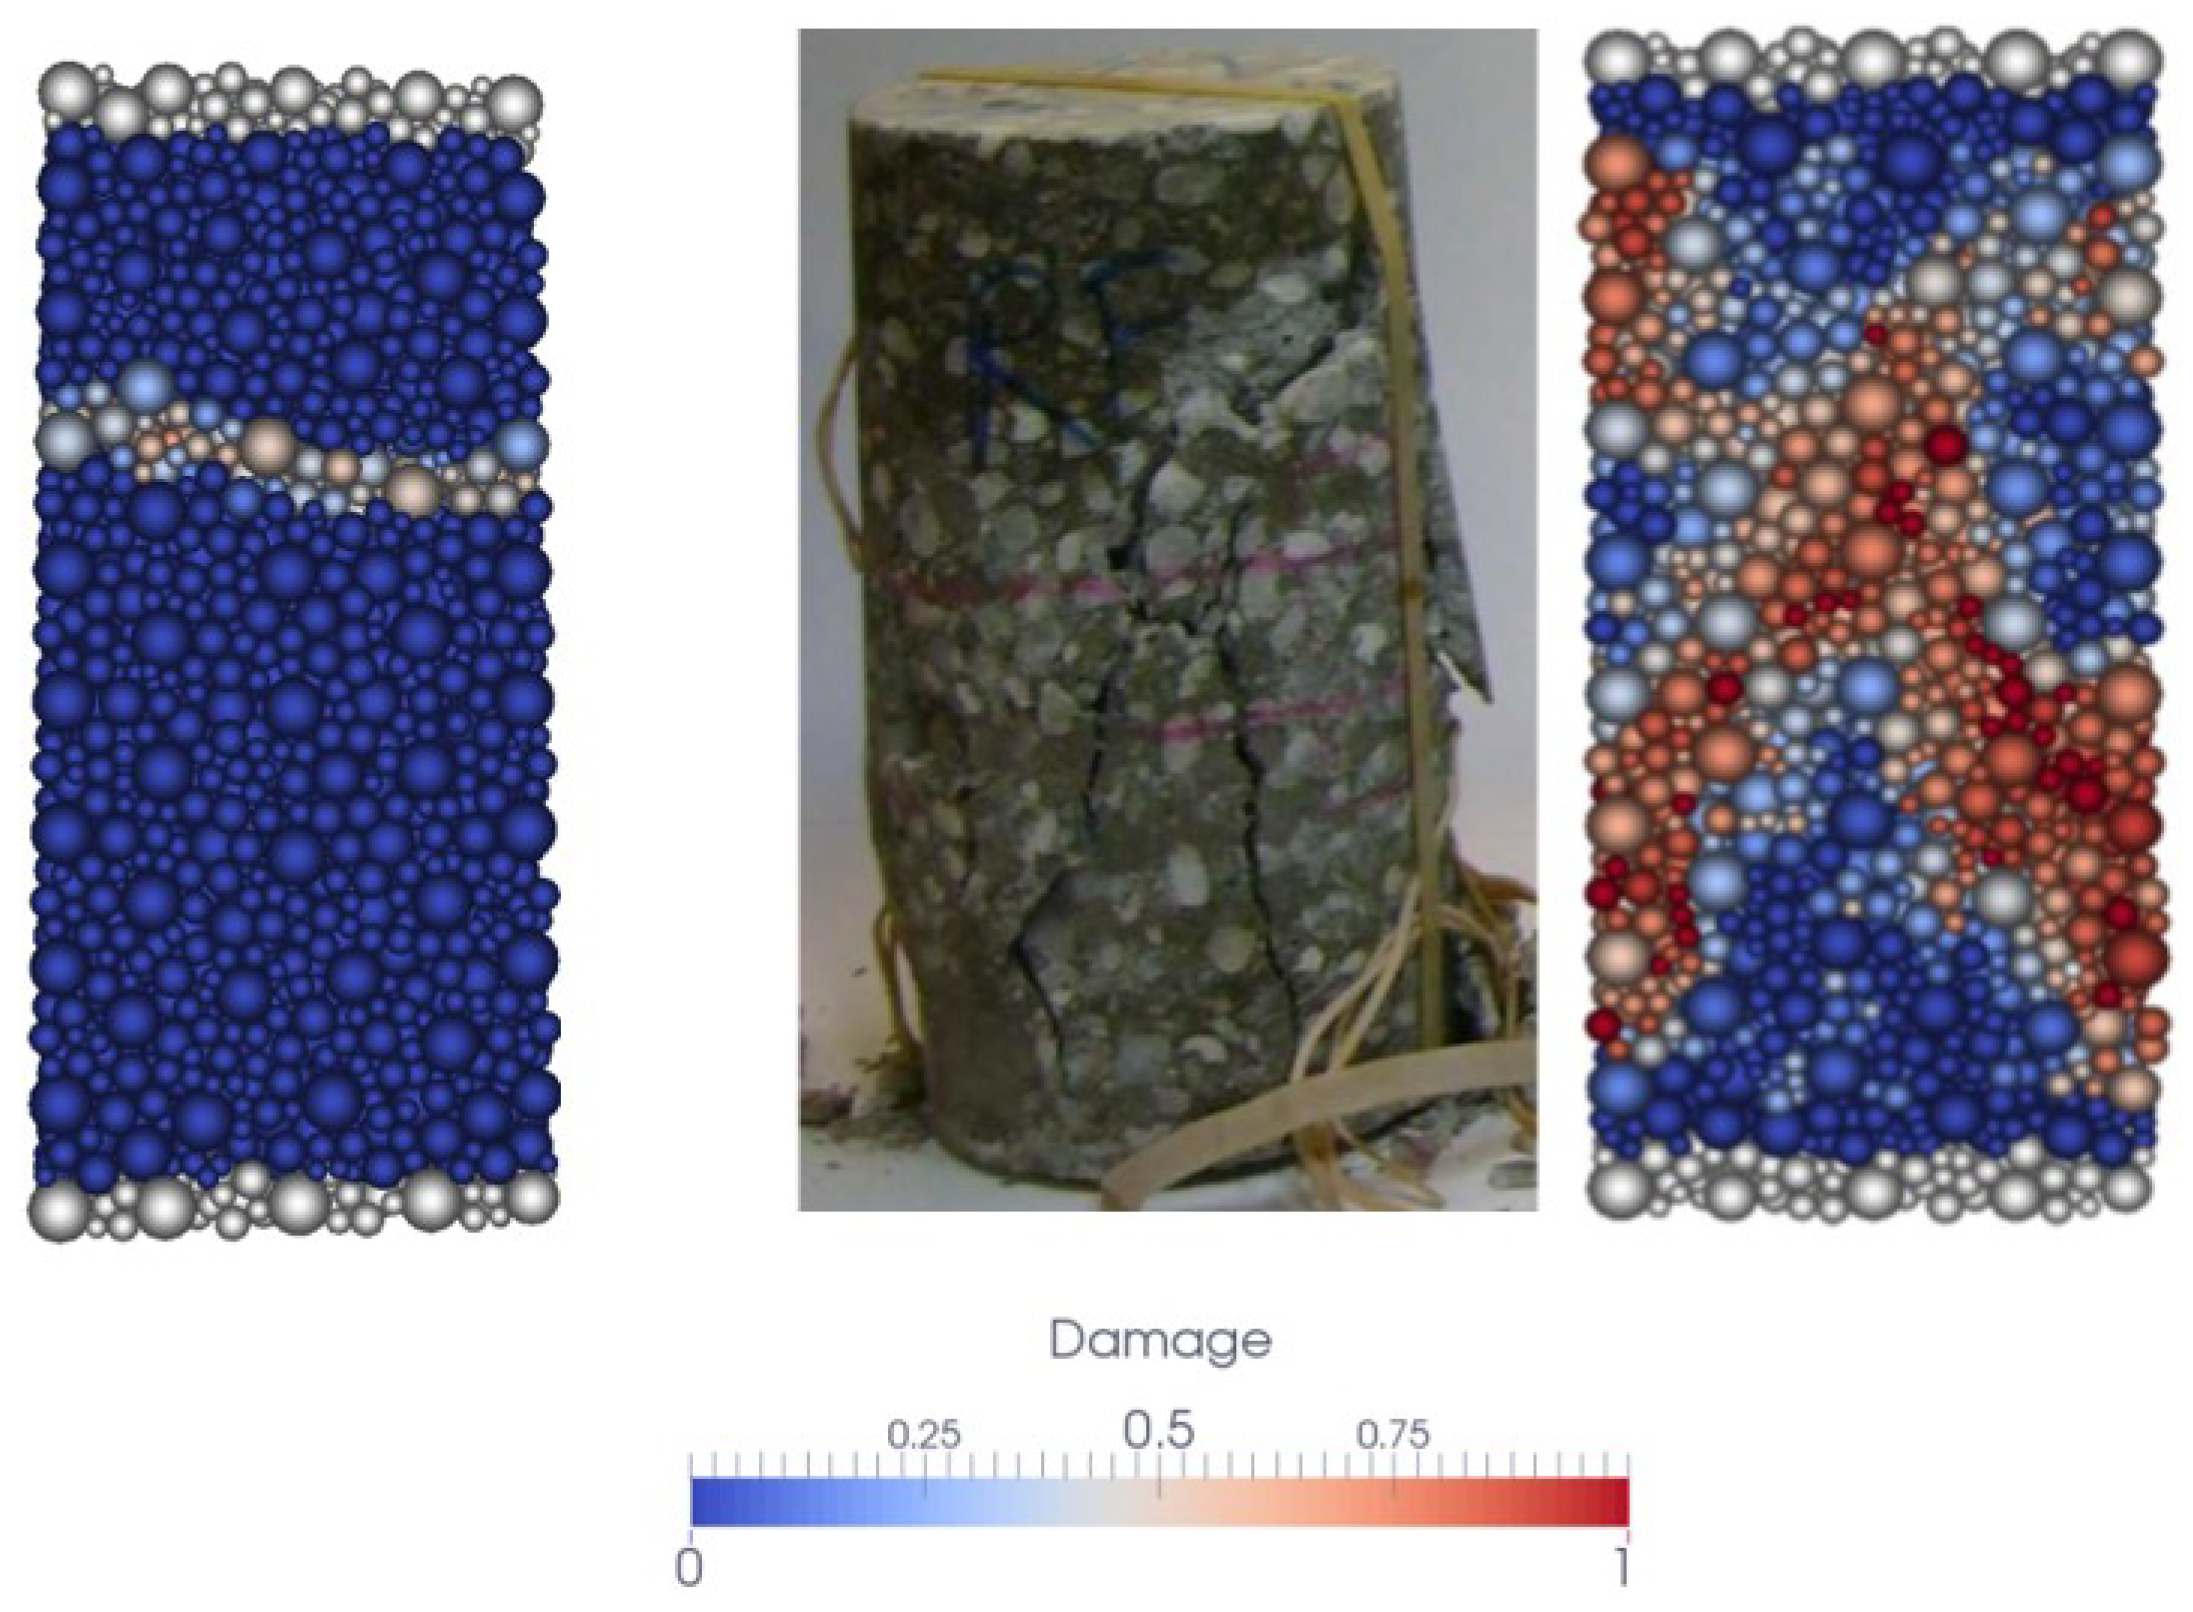
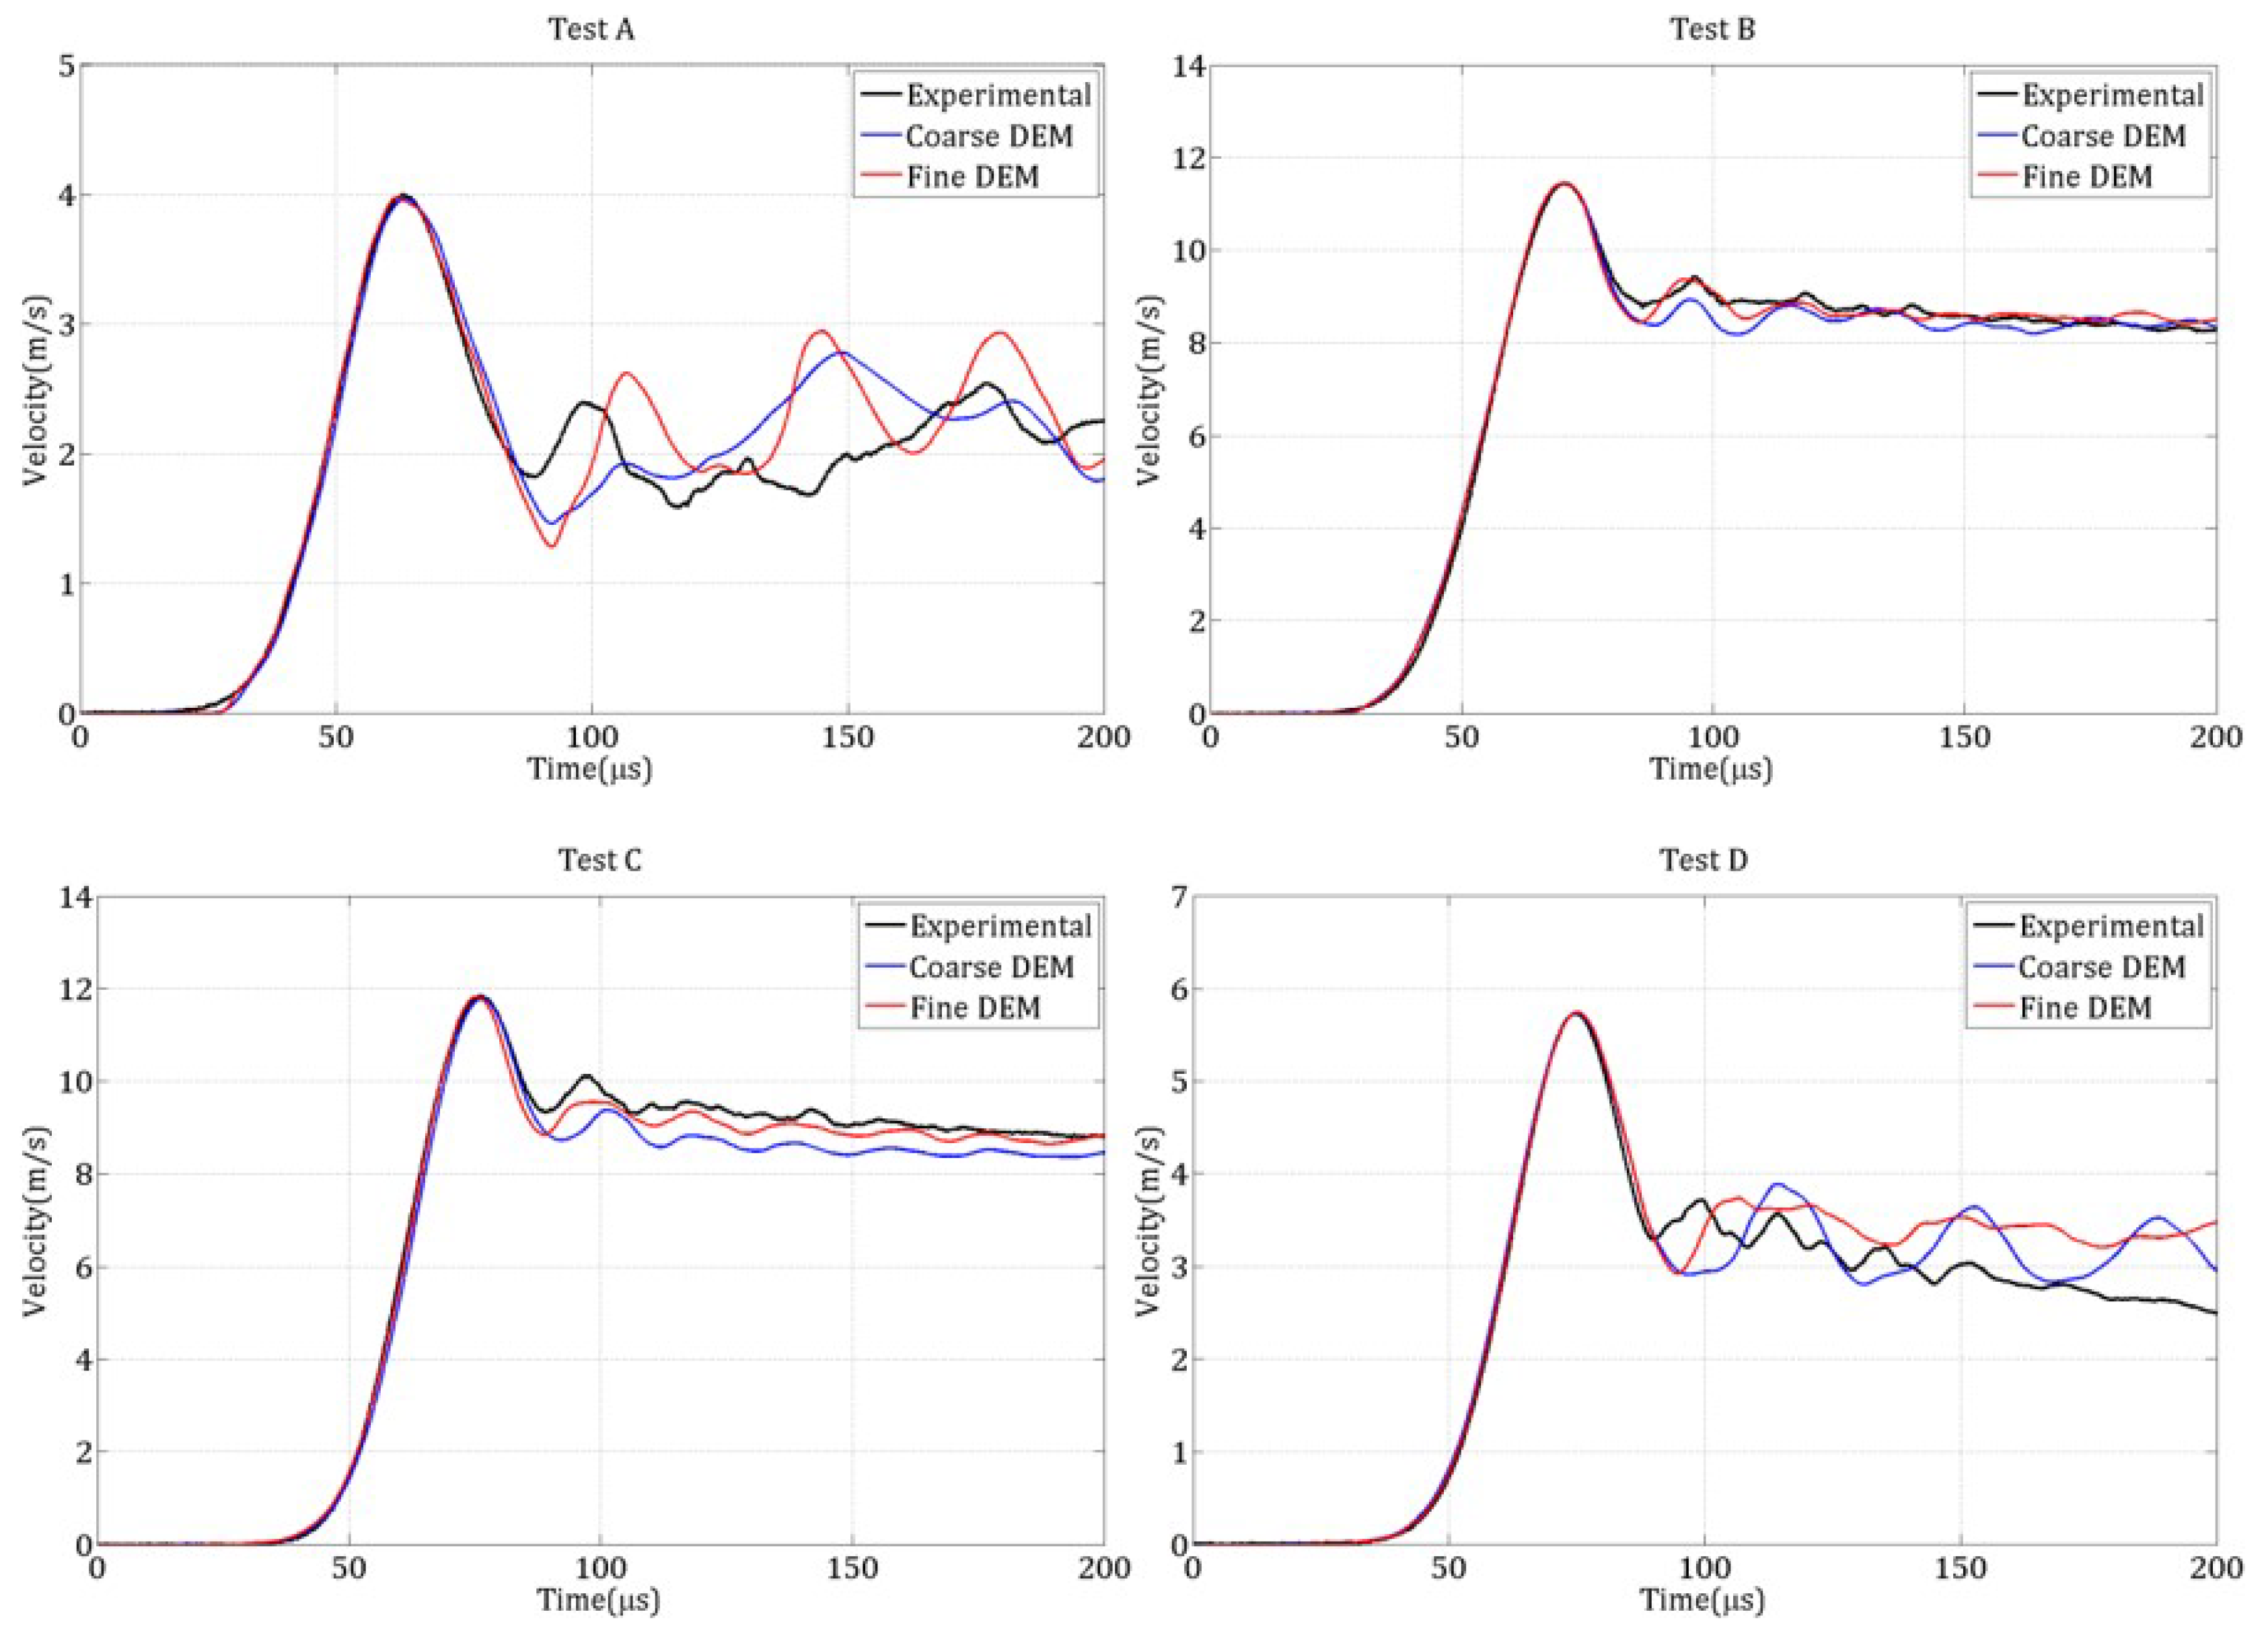
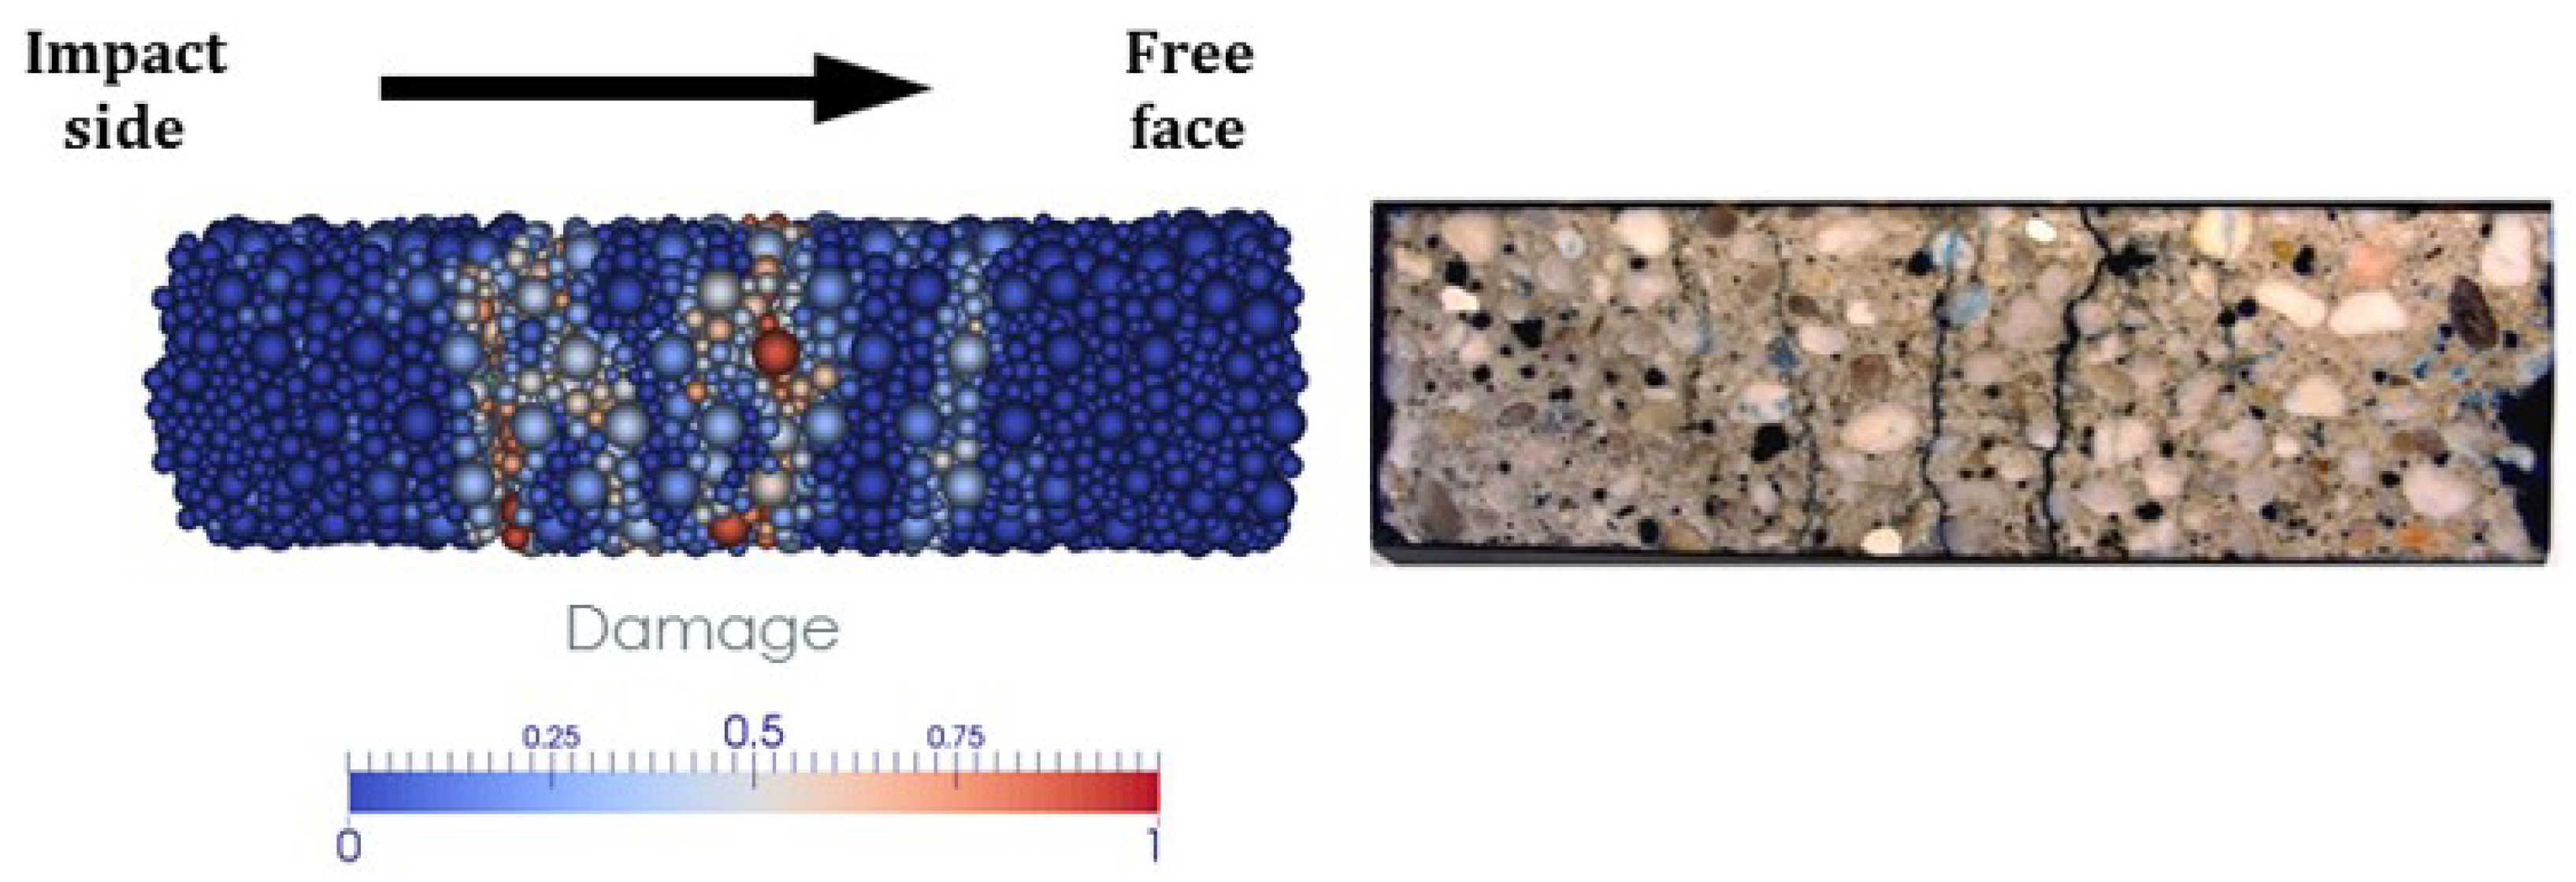
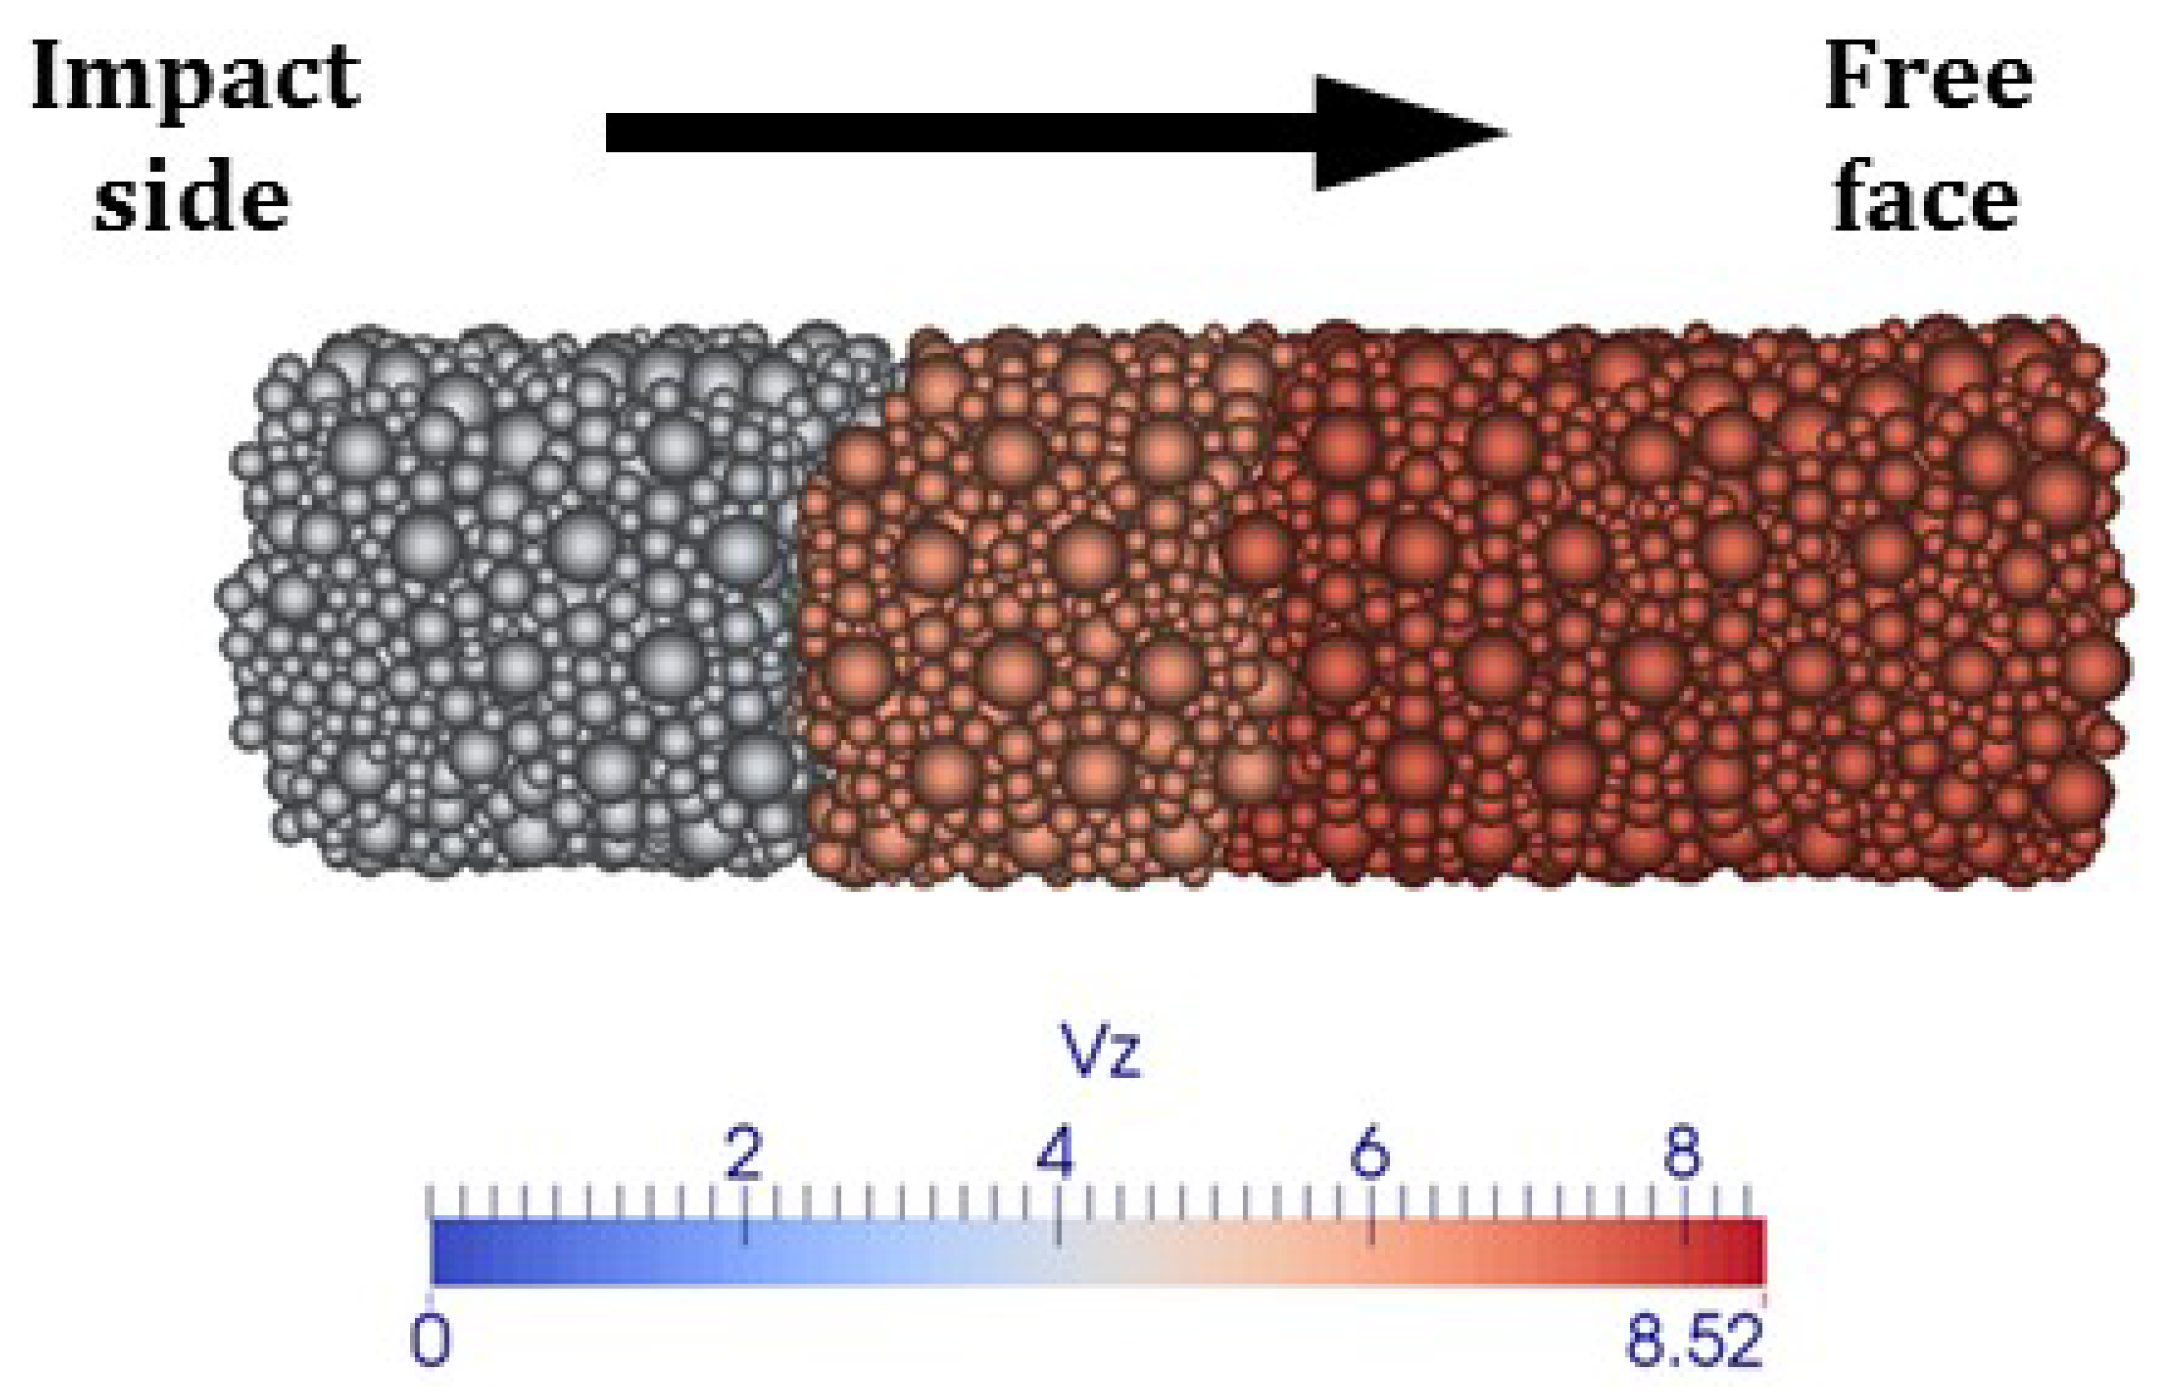
5. Discussion on the Simulations of the Four Spalling Tests with the Updated DEM
6. Conclusions
Author Contributions
Funding
Institutional Review Board Statement
Informed Consent Statement
Data Availability Statement
Acknowledgments
Conflicts of Interest
Abbreviations
| 1D | One-dimensional |
| 3D | Three-dimensional |
| DE | Discrete element |
| DEM | Discrete element method |
| DIF | Dynamic increase factor |
| FE | Finite element |
| FEM | Finite element method |
| SHPB | split-Hopkinson pressure bar |
References
- Kennedy, R.P. A review of procedures for the analysis and design of concrete structures to resist missile impact effects. Nucl. Eng. Des. 1976, 37, 183–203. [Google Scholar] [CrossRef]
- Berriaud, C.; Sokolovsky, A.; Gueraud, R.; Dulac, J.; Labrot, R. Comportement local des enceintes en beton sous l’impact d’un projectile rigide: Local behaviour of reinforced concrete walls under missile impact. Nucl. Eng. Des. 1978, 45, 457–469. [Google Scholar] [CrossRef]
- Adeli, H.; Amin, A.M. Local effects of impactors on concrete structures. Nucl. Eng. Des. 1985, 88, 301–317. [Google Scholar] [CrossRef]
- Li, Q.; Reid, S.; Wen, H.; Telford, A. Local impact effects of hard missiles on concrete targets. Int. J. Impact Eng. 2005, 32, 224–284. [Google Scholar] [CrossRef]
- Bian, H.; Jia, Y.; Pontiroli, C.; Shao, J.F. Numerical modeling of the elastoplastic damage behavior of dry and saturated concrete targets subjected to rigid projectile penetration. Int. J. Numer. Anal. Methods Geomechics 2018, 42, 312–338. [Google Scholar] [CrossRef]
- Kristoffersen, M.; Toreskås, O.L.; Dey, S.; Børvik, T. Ballistic perforation resistance of thin concrete slabs impacted by ogive-nose steel projectiles. Int. J. Impact Eng. 2021, 156, 103957. [Google Scholar] [CrossRef]
- Cundall, P.A.; Strack, O.D. A discrete numerical model for granular assemblies. Geotechnique 1979, 29, 47–65. [Google Scholar] [CrossRef]
- Fakhimi, A.; Villegas, T. Application of dimensional analysis in calibration of a discrete element model for rock deformation and fracture. Rock Mech. Rock Eng. 2007, 40, 193–211. [Google Scholar] [CrossRef]
- Liu, S.; Cheng, Z.; Wang, H.; Li, W. Discrete element analysis of jointed rock mass impact on rigid baffle structure. Comput. Part. Mech. 2025, 12, 277–287. [Google Scholar] [CrossRef]
- Chen, Y.; Yu, D.; Wang, Y.; Zhao, Y.; Lin, H.; Meng, J.; Wu, H. Fracture evolution in steel fiber reinforced concrete (SFRC) of tunnel under static and dynamic loading based on DEM-FDM coupling model. Int. J. Coal Sci. Technol. 2025, 12, 9. [Google Scholar] [CrossRef]
- Liu, K.; Chen, Z.; Tao, Q.; Wu, D.; Wu, Q.; Zou, P.; Wang, M.; Li, Y. Dynamic mechanical properties and damage morphology analysis of concrete with different aggregates based on FDM-DEM coupling. Materials 2024, 17, 5804. [Google Scholar] [CrossRef] [PubMed]
- Wang, Z.; Ma, D.; Suo, T.; Li, Y.; Manes, A. Investigation into different numerical methods in predicting the response of aluminosilicate glass under quasi-static and impact loading conditions. Int. J. Mech. Sci. 2021, 196, 106286. [Google Scholar] [CrossRef]
- Antoniou, A.; Daudeville, L.; Marin, P.; Potapov, S. Extending the discrete element method to account for dynamic confinement and strain-rate effects for simulating hard impacts on concrete targets. J. Dyn. Behav. Mater. 2025, 11, 119–135. [Google Scholar] [CrossRef]
- Frangin, E.; Marin, P.; Daudeville, L. On the use of combined finite/discrete element method for impacted concrete structures. J. Phys. IV 2006, 134, 461–466. [Google Scholar] [CrossRef]
- Shiu, W.; Donze, F.V.; Daudeville, L. Influence of the reinforcement on penetration and perforation of concrete targets. Eng. Comput. 2009, 26, 29–45. [Google Scholar] [CrossRef]
- Potapov, S.; Mazurel, A.; Marin, P.; Daudeville, L. Mixed DEM/FEM modeling of advanced damage in reinforced concrete structures. J. Eng. Mech. 2017, 143, 04016110. [Google Scholar] [CrossRef]
- Benniou, H.; Accary, A.; Malecot, Y.; Briffaut, M.; Daudeville, L. Discrete element modeling of concrete under high stress level: Influence of saturation ratio. Comput. Part. Mech. 2021, 8, 157–167. [Google Scholar] [CrossRef]
- Europlexus, a Computer Program for Analysis of Fast Transient Phenomena Involving Structures and Fluids in Interaction. Available online: http://www-epx.cea.fr (accessed on 10 July 2025).
- Malvar, L.; Ross, C. Review of strain rate effects for concrete in tension. Mater. J. 1998, 95, 735–739. [Google Scholar]
- Schuler, H.; Mayrhofer, C.; Thoma, K. Spall experiments for the measurement of the tensile strength and fracture energy of concrete at high strain rates. Int. J. Impact Eng. 2006, 32, 1635–1650. [Google Scholar] [CrossRef]
- Weerheijm, J.; Forquin, P. Response mechanisms of concrete under impulsive tensile loading. In Understanding the Tensile Properties of Concrete, 2nd ed.; Woodhead Publishing Limited: Sawston, UK, 2024; pp. 177–217. [Google Scholar]
- Bischoff, P.H.; Perry, S.H. Compressive behavior of concrete at high strain rates. Mater. Struct. 1991, 24, 425–450. [Google Scholar] [CrossRef]
- Cusatis, G. Strain-rate effects on concrete behavior. Int. J. Impact Eng. 2011, 38, 162–170. [Google Scholar] [CrossRef]
- Erzar, B. Ecaillage, Cratérisation et Comportement en Traction Dynamique de Bétons sous Impact: Approches Expérimentales et Modélisation. Ph.D. Thesis, Université de Metz, Metz, France, 2010. (In French). [Google Scholar]
- Erzar, B.; Forquin, P. Experiments and mesoscopic modelling of dynamic testing of concrete. Mech. Mater. 2011, 43, 505–527. [Google Scholar] [CrossRef]
- Forquin, P.; Riedel, W.; Weerheijm, J. Dynamic testing devices. In Understanding the Tensile Properties of Concrete, 2nd ed.; Woodhead Publishing Limited: Sawston, UK, 2024; pp. 133–176. [Google Scholar]
- Cadoni, E.; Caldentey, A.P.; Colombo, M.; Dancygier, A.N.; di Prisco, M.; Grisaro, H.; Martinelli, P.; Ožbolt, J.; Pająk, M.; Weerheijm, J. State-of-the-art on impact and explosion behaviour of concrete structures: Report of RILEM TC 288-IEC. Mater. Struct. 2025, 58, 62. [Google Scholar] [CrossRef]
- Technical Committee RILEM-IEC. Report on Experimental Devices Harvest for Impact and Explosion Testing of Materials and Structures. 2020. Available online: https://www.rilem.net/global/gene/link.php?doc_id=6000 (accessed on 10 July 2025).
- Hao, Y.; Hao, H.; Jiang, G.; Zhou, Y. Experimental confirmation of some factors influencing dynamic concrete compressive strengths in high-speed impact tests. Cem. Concr. Res. 2013, 52, 63–70. [Google Scholar] [CrossRef]
- Wang, Z.; Yang, D. Study on dynamic behavior and tensile strength of concrete using 1D wave propagation characteristics. Mech. Adv. Mater. Struct. 2015, 22, 184–191. [Google Scholar] [CrossRef]
- Wang, Y.; Wang, X.; Liu, G.; Tan, Y.; Zheng, Q.; Zhao, Y.; Zhang, Y. Experiments on the one-dimensional spall strength of SFRC. Constr. Build. Mater. 2021, 280, 122110. [Google Scholar] [CrossRef]
- Khosravani, M.R.; Weinberg, K. A review on split Hopkinson bar experiments on the dynamic characterisation of concrete. Constr. Build. Mater. 2018, 190, 1264–1283. [Google Scholar] [CrossRef]
- Khosravani, M.R.; Wagner, P.; Fröhlich, D.; Weinberg, K. Dynamic fracture investigations of ultra-high performance concrete by spalling tests. Eng. Struct. 2019, 201, 109844. [Google Scholar] [CrossRef]
- Zhang, L.; Hu, S.S.; Chen, D.X.; Yu, Z.Q.; Liu, F. An experimental technique for spalling of concrete. Exp. Mech. 2009, 49, 523–532. [Google Scholar] [CrossRef]
- Zhang, J.Y.; Ren, H.Q.; Han, F.; Sun, G.J.; Wang, X.; Zhao, Q.; Zhang, L. Spall strength of steel-fiber-reinforced concrete under one-dimensional stress state. Mech. Mater. 2020, 141, 103273. [Google Scholar] [CrossRef]
- Ma, J.; Huo, Y.; Wang, N.; Sun, Z.; Bian, L.; Huang, R. Experimental study of dynamic tensile strength of steel-fiber-reinforced self-compacting concrete using modified Hopkinson bar. Materials 2023, 16, 5707. [Google Scholar] [CrossRef] [PubMed]
- Neel, C. Compaction and spall of UHPC concrete under shock conditions. J. Dyn. Behav. Mater. 2018, 4, 505–528. [Google Scholar] [CrossRef]
- Klepaczko, J.R.; Brara, A. An experimental method for dynamic tensile testing of concrete by spalling. Int. J. Impact Eng. 2001, 25, 387–409. [Google Scholar] [CrossRef]
- Erzar, B.; Forquin, P. An Experimental method to determine the tensile strength of concrete at high rates of strain. Exp. Mech. 2010, 50, 941–955. [Google Scholar] [CrossRef]
- Novikov, S.A.; Divnov, I.I.; Ivanov, A.G. The study of fracture of steel, aluminium and copper under explosive loading. Fiz. Met. Metalloved. 1966, 21, 608–615. [Google Scholar]
- Gabet, T.; Vu, X.H.; Malecot, Y.; Daudeville, L. A new experimental technique for the analysis of concrete under high triaxial loading. J. Phys. IV 2006, 134, 635–640. [Google Scholar] [CrossRef]
- Dupray, F.; Malecot, Y.; Daudeville, L. Experimental behaviour of high-performance concrete in confined tension. Mater. Struct. 2010, 43, 699–707. [Google Scholar] [CrossRef]
- Erzar, B.; Forquin, P. Free water influence on the dynamic tensile behaviour of concrete. Appl. Mech. Mater. 2011, 82, 45–50. [Google Scholar] [CrossRef]
- Jerier, J.F.; Imbault, D.; Donzé, F.V.; Doremus, P. A geometric algorithm based on tetrahedral meshes to generate a dense polydisperse sphere packing. Granul. Matter 2009, 11, 43–52. [Google Scholar] [CrossRef]
- Omar, A. Développement et Validation d’un Modèle aux Éléments Discrets de Comportement du Béton sous Chargement Dynamique. Ph.D. Thesis, Univ Grenoble Alpes, Grenoble, France, 2015. [Google Scholar]
- Altair Radioss. 2025. Available online: https://help.altair.com/hwsolvers/rad/index.htm (accessed on 10 July 2025).
- Bulla, M.; Kolling, S.; Sahraei, E. A Material model for the orthotropic and viscous behavior of separators in lithium-ion batteries under high mechanical loads. Energies 2021, 14, 4585. [Google Scholar] [CrossRef]
- Gatuingt, F.; Snozzi, L.; Molinari, J.F. Numerical determination of the tensile response and the dissipated fracture energy of concrete: Role of the mesostructure and influence of the loading rate. Int. J. Numer. Anal. Methods Geomechics 2013, 37, 3112–3130. [Google Scholar] [CrossRef]
- Comité Euro-International du Béton. CEB-FIP Model Code 1990; Redwood Books: Wiltshire, UK, 1993. [Google Scholar]


| Composition | Mechanical Properties | ||
|---|---|---|---|
| Cement CEM I 52.5N | 263 | Porosity | 12% |
| Sand 0–1.8 mm | 838 | Slump | 7 cm |
| Gravel 0.5–8 mm | 1008 | Young modulus E | 25 GPa |
| Water | 169 | Poisson ratio | 0.16 |
| W/C ratio | 0.64 | Compressive strength | 34 MPa |
| Density | 2280 | Tensile strength | 3.0 MPa |
| Saturation degree | 42% |
| Test | A | B | C | D |
|---|---|---|---|---|
| () | 30 | 105 | 115 | 50 |
| Characteristics | Coarse Discretization | Refined Discretization |
|---|---|---|
| Number of DE | 6744 | 60,323 |
| Mean radius (mm) | 1.5 | 0.7 |
| Compactness | 0.58 | 0.62 |
| Test | A | B | C | D |
|---|---|---|---|---|
| Experimental () | 30 | 105 | 115 | 50 |
| Numerical () | 120 | 260 | 280 | 140 |
| (kHz) | Coarse Discretization () | Refined Discretization () |
|---|---|---|
| 10 | 24 | 28 |
| 20 | 29 | 33 |
| 50 | 34 | 43 |
Disclaimer/Publisher’s Note: The statements, opinions and data contained in all publications are solely those of the individual author(s) and contributor(s) and not of MDPI and/or the editor(s). MDPI and/or the editor(s) disclaim responsibility for any injury to people or property resulting from any ideas, methods, instructions or products referred to in the content. |
© 2025 by the authors. Licensee MDPI, Basel, Switzerland. This article is an open access article distributed under the terms and conditions of the Creative Commons Attribution (CC BY) license (https://creativecommons.org/licenses/by/4.0/).
Share and Cite
Omar, A.; Daudeville, L. Discrete Element Modeling of Concrete Under Dynamic Tensile Loading. Materials 2025, 18, 3347. https://doi.org/10.3390/ma18143347
Omar A, Daudeville L. Discrete Element Modeling of Concrete Under Dynamic Tensile Loading. Materials. 2025; 18(14):3347. https://doi.org/10.3390/ma18143347
Chicago/Turabian StyleOmar, Ahmad, and Laurent Daudeville. 2025. "Discrete Element Modeling of Concrete Under Dynamic Tensile Loading" Materials 18, no. 14: 3347. https://doi.org/10.3390/ma18143347
APA StyleOmar, A., & Daudeville, L. (2025). Discrete Element Modeling of Concrete Under Dynamic Tensile Loading. Materials, 18(14), 3347. https://doi.org/10.3390/ma18143347