Article

Shrinkage Behavior of Strength-Gradient Multilayered Zirconia Materials

Department of Prosthetic Dentistry, University Hospital, LMU Munich, 80336 Munich, Germany
*
Author to whom correspondence should be addressed.
Materials 2025, 18(14), 3217; https://doi.org/10.3390/ma18143217
Submission received: 21 May 2025 / Revised: 1 July 2025 / Accepted: 4 July 2025 / Published: 8 July 2025

Abstract

To investigate the sintering shrinkage behavior of multigeneration, multilayer zirconia materials using geometrical measurements. Seven zirconia CAD/CAM materials were analyzed, comprising two mono-generation zirconia (HTML: Katana Zr, HTML Plus, 3Y-TZP; UTML: Katana Zr, UTML, 5Y-TZP) and five strength-gradient multilayer zirconia (AIDI: optimill 3D PRO Zir; PRIT: Priti multidisc ZrO2 multicolor; UPCE: Explore Esthetic; ZCPC: IPS e.max ZirCAD Prime; ZYML: Katana YML) materials. Cubes (10 × 10 × 10 mm3) were milled in varying positions within the disks. Geometrical measurements were applied before and after dense sintering using a micrometer screw gauge, light microscopy, as well as surface scans and shrinkages were calculated. Data were analyzed using Kolmogorov–Smirnov, five-way ANOVA followed by the Scheffé post hoc test, and partial eta squared, as well as the Kruskal–Wallis test, including Bonferroni correction (p < 0.05). The highest influence on the shrinkage was exerted by the zirconia material (ηP2 = 0.893, p < 0.001), followed by the test method (ηP2 = 0.175, p < 0.001), while the vertical and horizontal position and measurement point showed no impact on the shrinkage results (p = 0.195–0.763) in the global analysis. Depending on the test method, the pooled shrinkage values of all tested zirconia materials varied between 17.7 and 20.2% for micrometer screw gauge, 17.7 and 20.1% for light microscopy, and 17.8 and 21.1% for surface scan measurements. The shrinkage values measured in the upper, middle, and lower multilayered vertical direction did not differ significantly in the global analysis for the multilayer materials. Therefore, a uniform shrinkage of these strength-gradient multilayer zirconia materials within clinically relevant restorations can be assumed.

1. Introduction

Pure zirconia lacks the mechanical properties required for reliable use in dental restorations. Through the incorporation of dopants such as alumina, yttria, magnesia, cerium, and ytterbia [1], and by applying specific sintering temperatures and procedures [2], zirconia can be stabilized in the tetragonal, tetragonal/cubic, or cubic phase. In dentistry, these modified materials are referred to as yttria-stabilized tetragonal zirconia polycrystals (Y-TZP). The most widely used variants include 3Y-TZP, 4Y-TZP, and 5Y-TZP. The 3Y-TZP contains 3 mol% Y2O3 and 0.05–0.25% Al2O3 and is partially stabilized in the metastable tetragonal phase. Under mechanical stress, it is capable of transforming into the monoclinic phase, contributing to transformation toughening [3]. By contrast, 4Y-TZP (4 mol% Y2O3, 0.05% Al2O3) is predominantly tetragonal with a minor cubic phase content, while 5Y-TZP contains up to 50% cubic phase (5 mol% Y2O3, 0.05% Al2O3) [4,5]. The precise composition of these additives plays a crucial role, as it directly impacts both the mechanical strength and optical properties, particularly translucency [6,7,8].
Y-TZP zirconia is widely applied in restorative dentistry, with indications ranging from single crowns to full-arch restorations [9,10]. The different Y-TZP types (3Y, 4Y, 5Y) are commercially available and tailored to balance strength and aesthetics [5,11,12]. While 3Y-TZP tends to be more opaque, newer generations such as 4Y-TZP and 5Y-TZP are specifically engineered for higher translucency [13]. However, this increased translucency is accompanied by a reduction in mechanical properties such as flexural strength and fracture toughness [12,14,15].
To broaden clinical indications and meet mechanical and esthetic demands, manufacturers have developed multilayered zirconia materials that combine different Y-TZP types. These multilayered blanks featured gradients in both mechanical strength and optical properties across the disk [11]. Depending on the manufacturer, these strength-gradient multilayered zirconia materials may contain various mixtures and layers within CAD/CAM milling disks, leading to differences in colors, varying levels of translucency, and diverse mechanical properties [14]. While multilayered zirconia materials are increasingly common, a comprehensive understanding of their shrinkage behavior across different material generations and fabrication directions is lacking. This study aims to address this gap using sintering shrinkage analysis.
Manufacturing of zirconia CAD/CAM blanks typically involves uniaxial pressing, cold isostatic pressing (CIP), or hot isostatic pressing (HIP) [11,16,17]. The different variations and mixtures of zirconia powder are filled layer-wise into molds and compressed using above mentioned techniques. After pressing, the “green bodies” are pre-sintered to create porous “white bodies.” This step is crucial to produce stable, millable disks.
To mill restorations from strength-gradient multilayered zirconia using CAD/CAM systems, the shrinkage factor must be considered. It is important to enter the exact batch-specific linear shrinkage into the CAM software. Manufacturers typically measure the linear shrinkage of zirconia for each batch using geometric samples like cubes. This is performed in both the white body and fully sintered states [18]. The shrinkage is calculated as a percentage, and the shrinkage factor is determined by the formula ([volume porous specimen/volume dense sintered specimen] 1/3) [19]. The shrinkage factor is then used during CAD/CAM milling to compensate for the sintering shrinkage. Typical length/linear shrinkages for Y-TZP materials fall in the range of 19–21% for 3-YTZP, with slightly lower values for 4-YTZP and 5-YTZP (approximately 18–19%) [9].
When working with strength-gradient multilayered zirconia, it is important to check whether the shrinkage of 3Y-TZP, 4Y-TZP, and 5Y-TZP within a single disk is consistent. Any variation may affect the fit and clinical outcome of the final restorations. A detailed understanding of these shrinkage properties is essential to ensure dimensional accuracy and long-term success [20,21].
The aim of this in vitro study was to analyze the sintering shrinkage behavior of strength-gradient multilayered zirconia materials and their implications for clinically relevant restorations. Geometrical changes were assessed before and after dense sintering using micrometer screw gauge measurements, digital surface scans, and light microscopy. The null hypotheses tested were that (i) the measurement method, (ii) the vertical position, (iii) the horizontal position within the zirconia disk, and (iv) the type of multilayered zirconia material would have no effect on the shrinkage behavior.

2. Materials and Methods

In total, seven zirconia materials were investigated: five strength-gradient multilayered materials composed of 3Y-TZP and 5Y-TZP, and two monolayer single-generation materials (3Y-TZP and 5Y-TZP) serving as control groups. An overview of all materials, including their manufacturers, zirconia type, geometry, color, and batch number, is provided in Table 1.

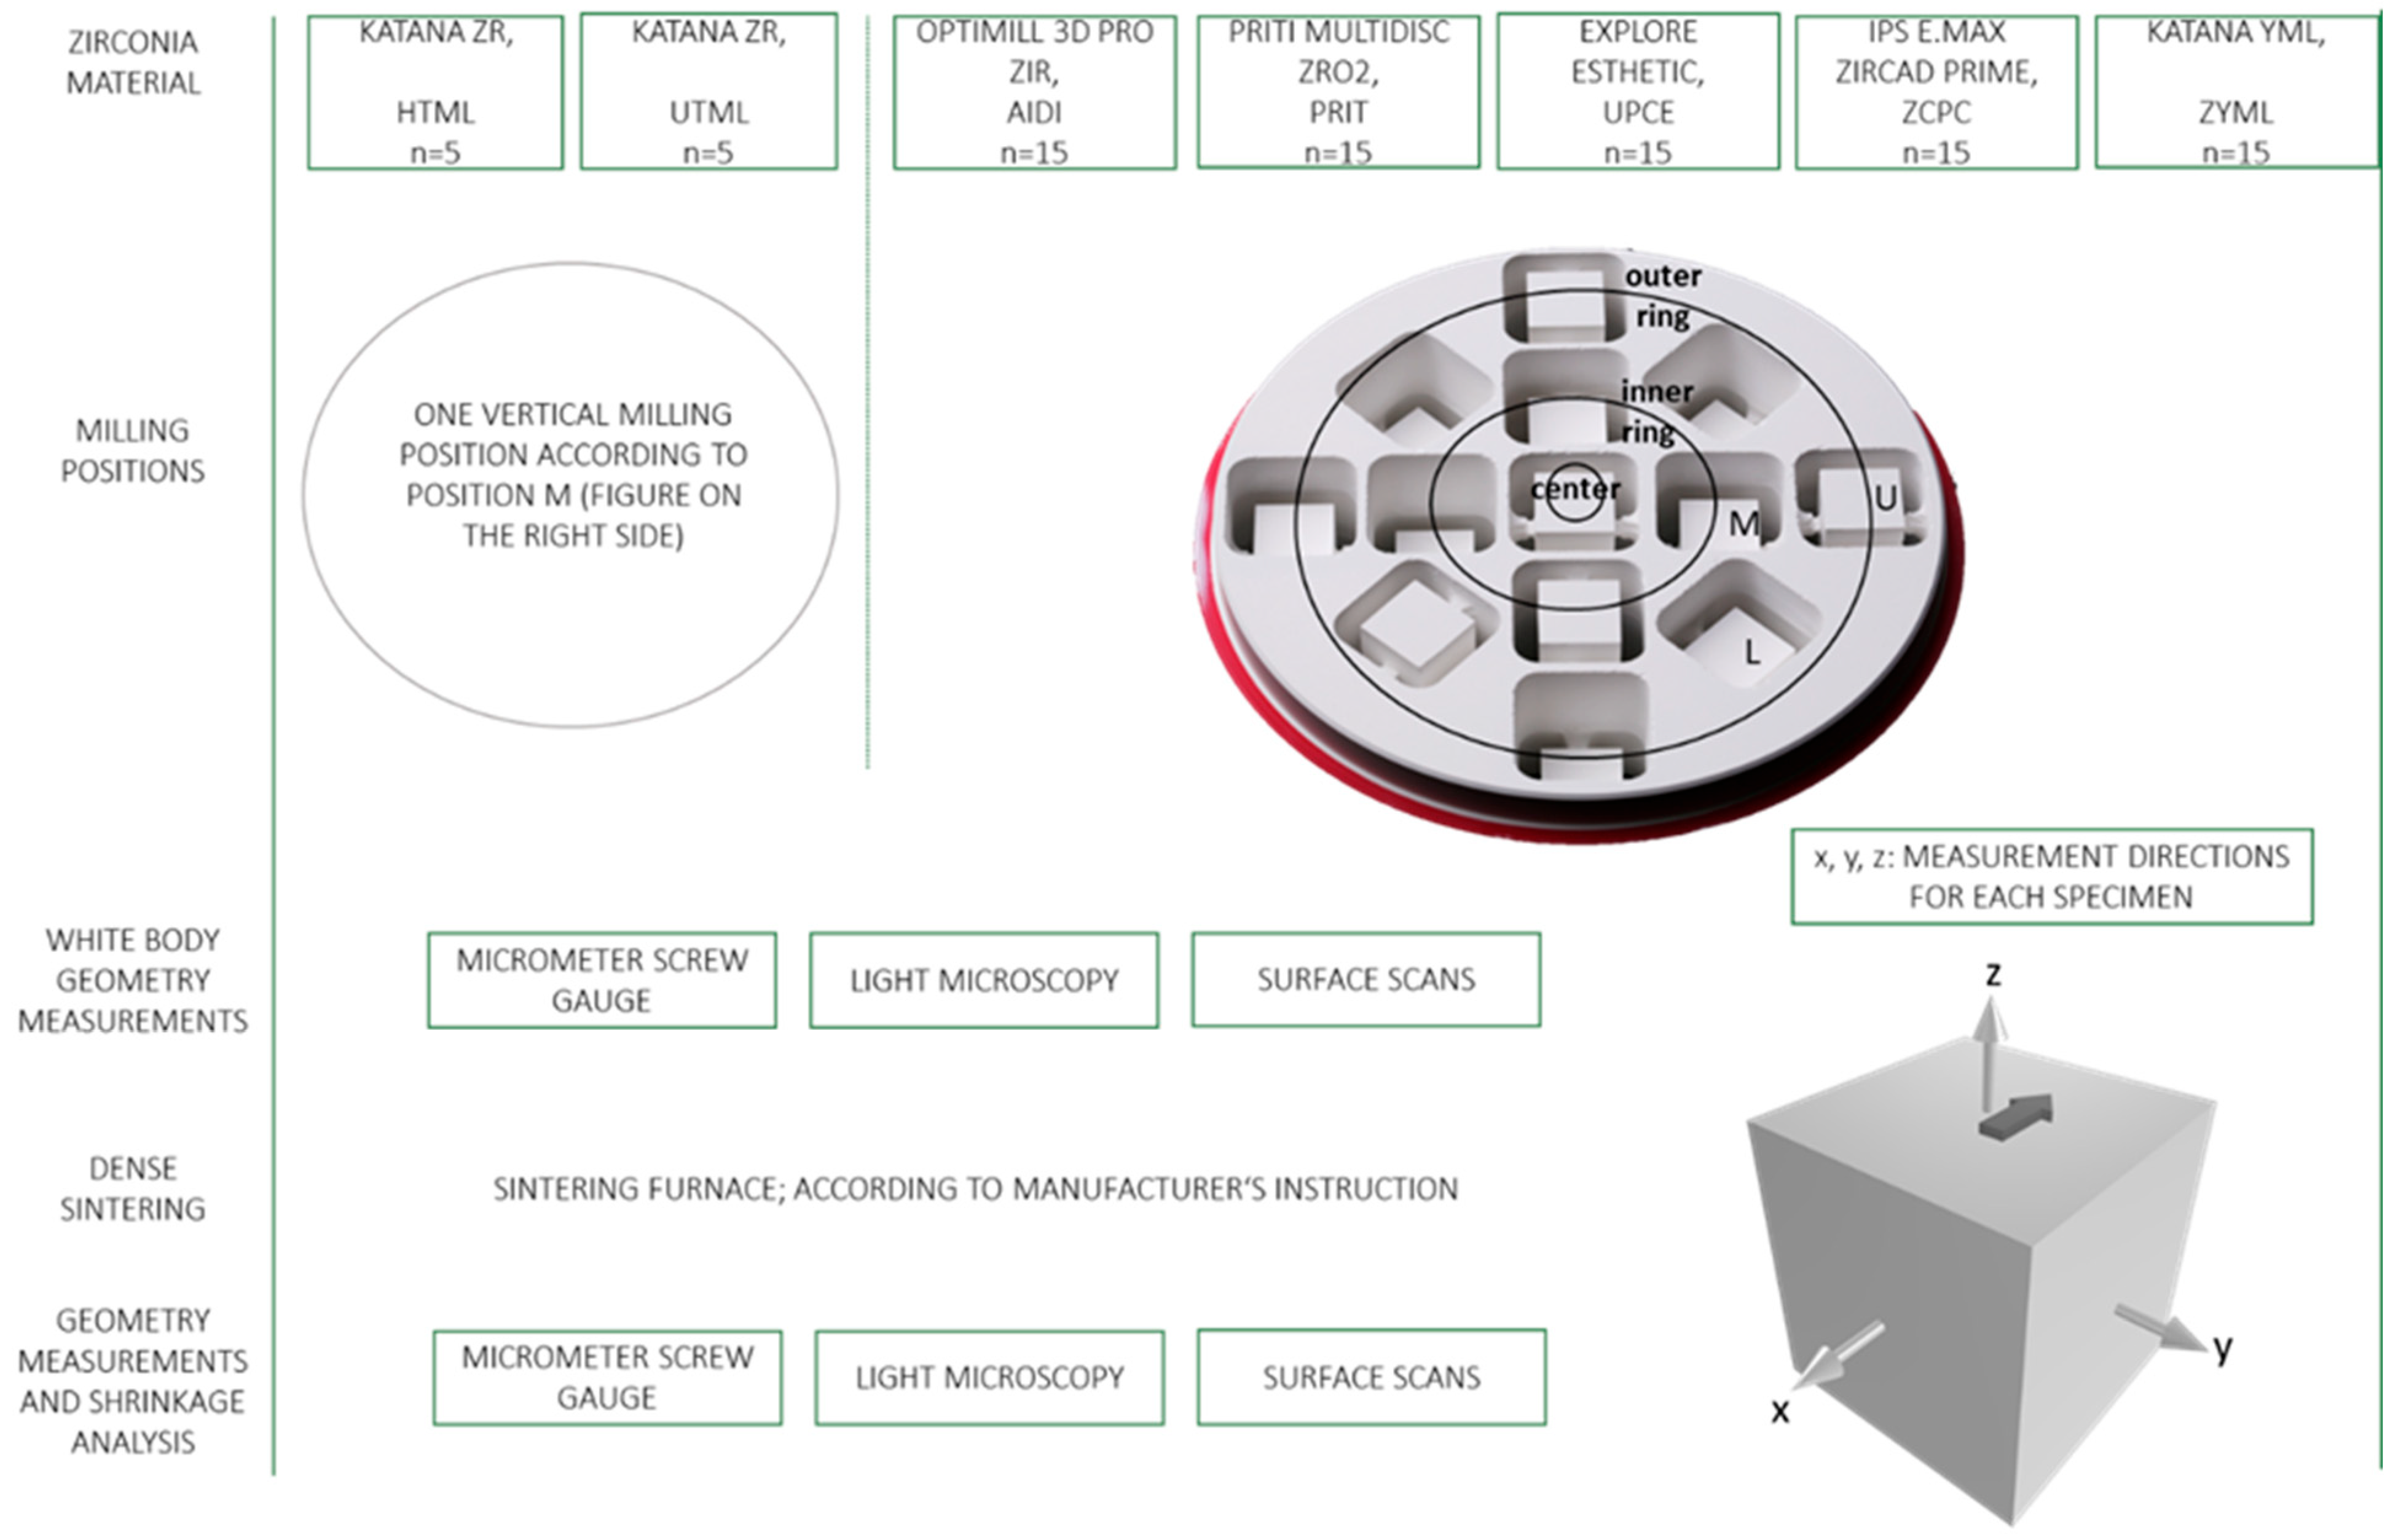
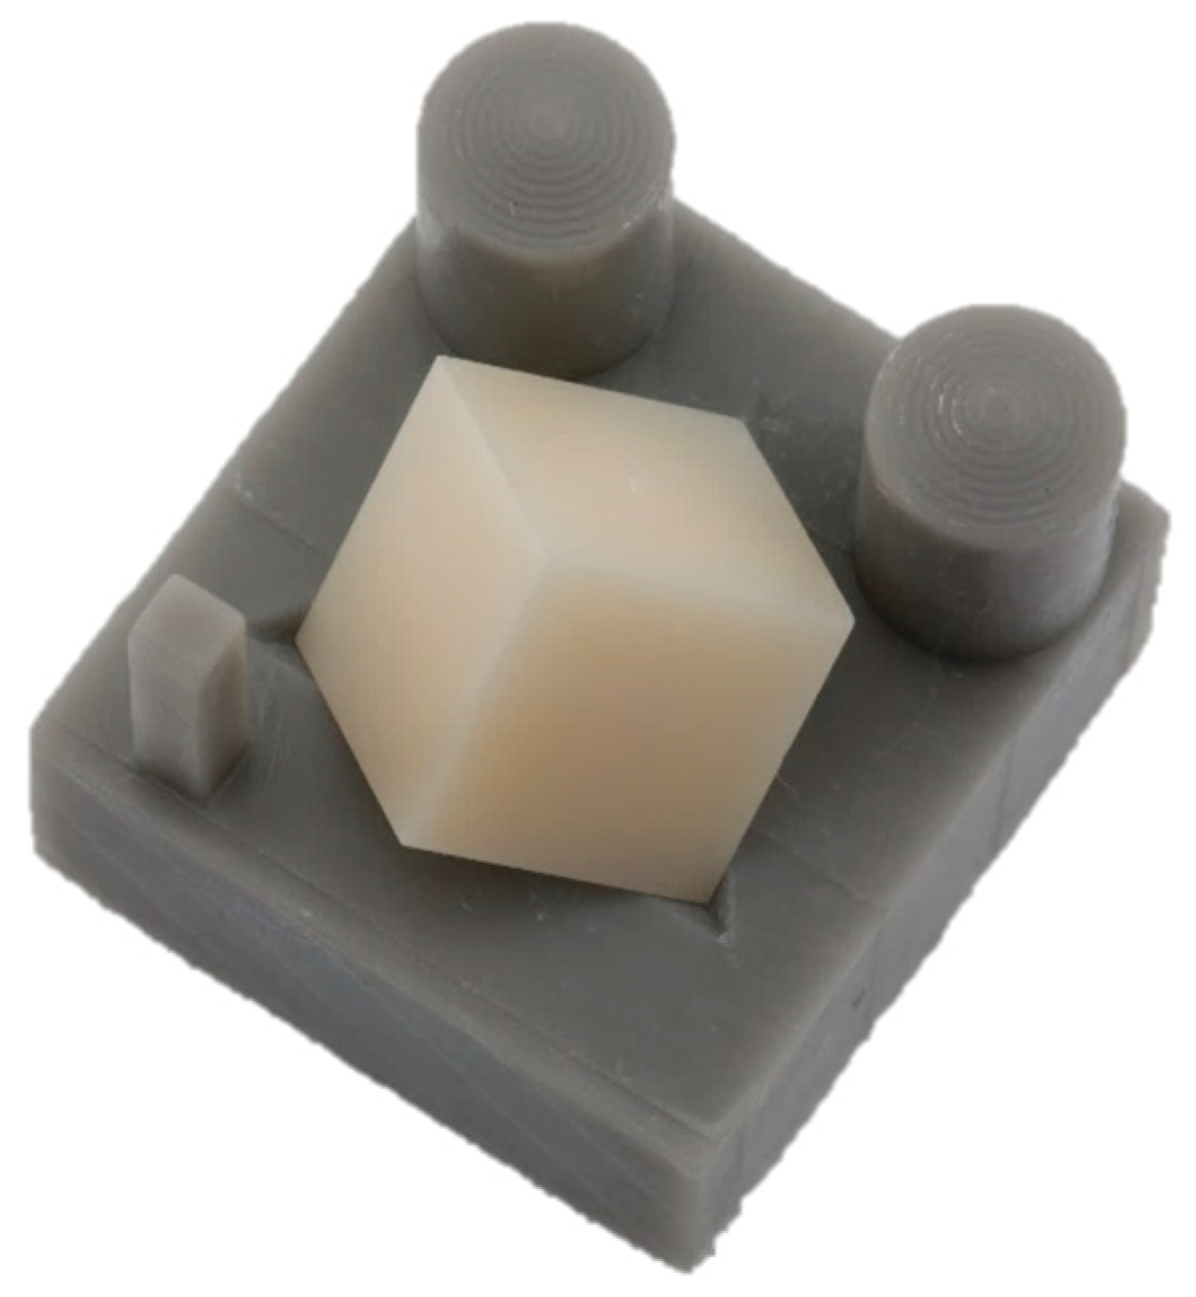
2.1. Specimen Preparation

In total, 85 cube-shaped specimens were milled from the seven different zirconia materials (Figure 1). Using CAD software (Ceramill Mind, Version v3.2-9041/64, Amann Girrbach, Koblach, Austria), STL files of a cube of 10 × 10 × 10 mm were positioned within the virtual disk space. For the monolayer control materials (HTML and UTML), specimens were located in the middle vertical position (M, Figure 1). For the multilayer materials, cubes were assigned to three different vertical positions (M = middle; U = upper; L = lower) and three horizontal positions (center; inner ring; outer ring) within the disks. An arrow was positioned on every single cube pointing at the outer rim (see schematic cube in Figure 1), indicating the orientation within the disk. The specimens were milled using a 5-axis CAM unit (Ceramill Motion 2, Amann Girrbach, Koblach, Austria), with one disk used per monolayer material and three disks used per multilayer material per manufacturer. Connecting bars were removed with a laboratory handpiece and rotary instruments. Three varying geometry measurement techniques, described below, were applied for each white body specimen according to three defined measurement directions (x-, y-, z-axis; see schematic cube in Figure 1). The white body specimens were subsequently sintered to a dense state according to the material-specific manufacturer’s instructions in a sintering oven (Mod. LHT 02/16, Nabertherm, Lilienthal, Germany). All specimens were consistently placed at the same height and position within the firing chamber. Moreover, process temperature control rings (Type PTCR-MTH and PTCR-HTH, M.E. Schupp Industriekeramik, Aachen, Germany) were used for each firing to ensure that correct firing parameters are achieved during sintering. The same measurement methods applied for the white body specimens were used for the dense sintered specimens, and the respective length shrinkages were calculated.

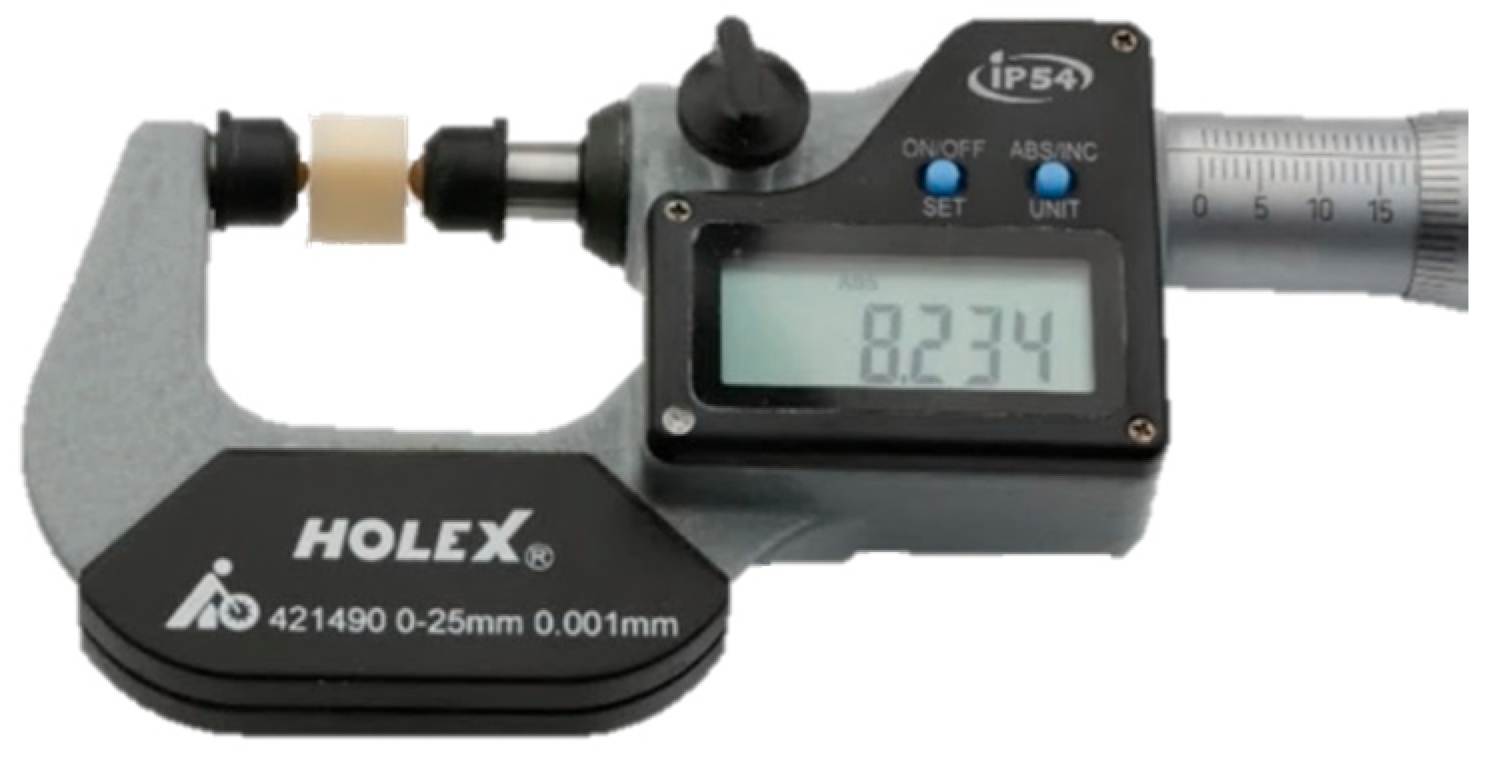
2.2. Micrometer Screw Gauge

Each specimen was measured in the x-, y-, and z-direction (Figure 1) using a calibrated digital micrometer screw gauge (Holex, 421490 0-25, Munich, Germany) with an accuracy of ±0.001 mm (Figure 2). Measurements were conducted both in the pre-sintered (white body) and post-sintered (dense) states.

2.3. Light Microscopy
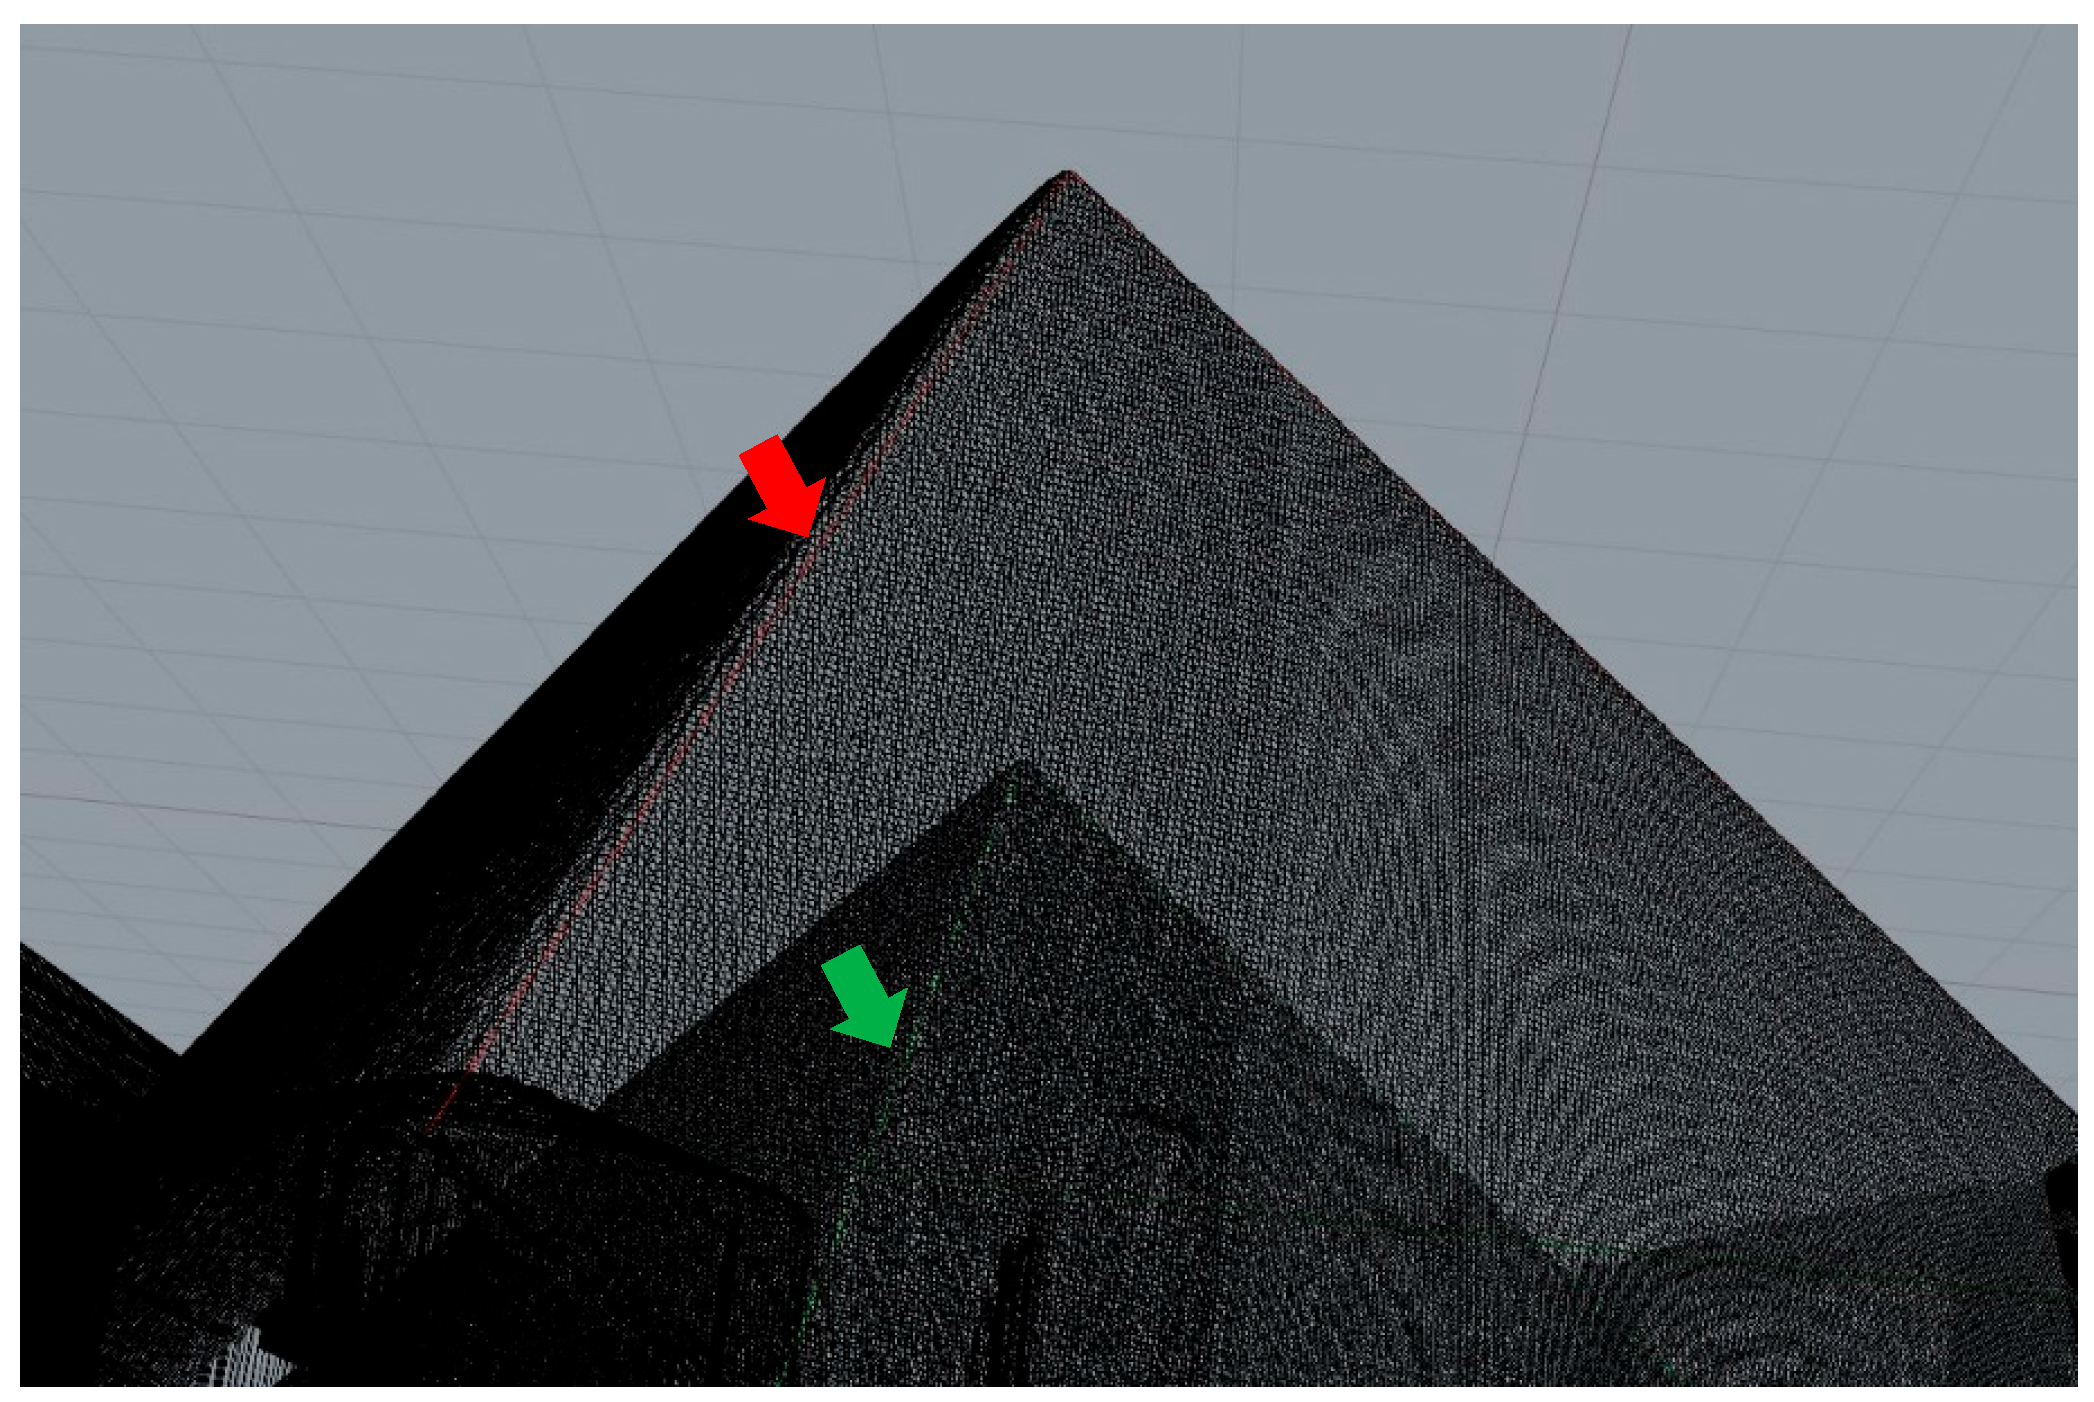
Digital light microscopy (Keyence VHX-970F, Keyence, Osaka, Japan) at 20× magnification was employed to measure each specimen in the x-, y-, and z-directions, both before and after sintering.

2.4. Surface Scans

Surface scans of all specimens were performed pre- and post-sintering using a laser scanner (LAS-20, SD Mechatronik, Feldkirchen-Westerham, Germany) with a resolution of 40 µm in the XY plane. A specific specimen holder was designed to enable simultaneous x-, y-, and z-axis scanning (Figure 3).
The resulting point cloud data were analyzed using 3D modeling software (Rhinoceros 3D, Rhino, 7.24, McNeel Robert McNeel & Associates, Seattle, WA, USA). Dimensional changes were determined by axis-specific distance comparisons between pre-sintered and post-sintered point cloud overlays (Figure 4).

2.5. Statistical Analysis

All measurements were statistically analyzed using SPSS Version 27.0 (IBM Statistics SPSS 27.0, Armonk, NY, USA). Descriptive statistics (mean and standard deviation) were computed. Normality of distribution was tested via the Kolmogorov–Smirnov test. To determine significant differences, a five-way ANOVA with Scheffé post hoc test and partial eta squared was conducted. Non-parametric Kruskal–Wallis tests with Bonferroni correction were applied to assess the impact of zirconia material and test method within pooled groups. A significance level of p < 0.05 was used throughout.

3. Results

3.1. Global Analysis

The zirconia materials had the highest impact on the shrinkage (partial eta-squared ηP2 = 0.893, p < 0.001), followed by the test method used (ηP2 = 0.175, p < 0.001), while the vertical and horizontal position and measurement direction were not significant (p = 0.195–0.763). The effect of the binary, ternary, quaternary, or quinary combinations of the five parameters (zirconia material, test method, vertical position, horizontal position, measurement direction) was significant only for the combinations of zirconia material coupled with test method (ηP2 = 0.272, p < 0.001), zirconia material coupled with measurement direction (ηP2 = 0.111, p < 0.001), zirconia material coupled with horizontal position and measurement direction (ηP2 = 0.159, p < 0.001), zirconia material coupled with test method and measurement direction (ηP2 = 0.129, p = 0.010), and zirconia material coupled with horizontal position, test method, and measurement direction (ηP2 = 0.273, p < 0.001) (Table 2).

3.2. Impact of Zirconia Materials and Test Methods Within Pooled Data (Vertical, Horizontal Position, and Measurement Direction)

The fixed effects cannot be compared directly, as the higher-order interactions between them were found to be significant. Consequently, several different analyses using pooled data were computed and divided by levels of zirconia material and test method, depending on the hypothesis of interest. The results of the descriptive statistics (mean, SD) are presented in Table 3. Twenty-four percent (5/21) of the tested groups showed deviation from the normal distribution. Data was analyzed non-parametrically.
Within all test methods, UPCE exhibited the highest shrinkage (20.2, 20.1, and 21.1%) among the investigated zirconia materials (p < 0.001). Within groups employing micrometer screw gauge and light microscopy measurements, ZCPC showed the lowest shrinkage (17.7%). Comparing the surface scan measurement groups, ZCPC exhibited the lowest values (17.8%) among the multilayer zirconia materials; however, it was in the same range of values (17.6%) with UTML (Table 3, Figure 5).
Within ZYML, UPCE and AIDI the test method surface scan led to higher shrinkage compared to micrometer screw gauge or light microscopy ones (p < 0.001). Within PRIT, micrometer screw gauge (18.2%), followed by light microscopy (18.3%) measurements present the lowest and with the test method surface scan (18.6%) the highest shrinkage (p < 0.001) (Table 3, Figure 5). Within pooled data, the vertical and horizontal position and measurement direction were not significant (p = 0.195–0.763).

3.3. Impact of the Horizontal, Vertical Position, and Measurement Point for Each Zirconia Material and Each Method, Separately

Within ZYML and the micrometer screw gauge (p < 0.001; y-axis < z-axis < x-axis), as well as light microscopy (p < 0.001; z-axis < x-axis = y-axis) test method, the measurement direction showed a significant impact on the shrinkage values (Table 2).
Within UPCE and micrometer screw gauge (p = 0.007; middle < upper), the vertical position showed a significant impact on the shrinkage values. Within the surface scan test method, an impact of the measurement direction was observed (p = 0.020; y-axis < z-axis). Within AIDI and micrometer screw gauge test method, vertical position (p < 0.001; lower < middle = upper), horizontal position (p = 0.003; inner ring = outer ring < center), and measurement direction (p < 0.001; x-axis = y-axis < z-axis) influenced the shrinkage values. Within ZCPC and surface scan test method, an impact of the measurement direction (p < 0.001; x-axis < z-axis) on the shrinkage values was observed.

4. Discussion

The present study investigated and compared the shrinkage behavior of monolayer and strength-gradient multilayered zirconia materials consisting of 3Y-TZP, 4Y-TZP, and 5Y-TZP. To the best of the authors’ knowledge, no previous studies have analyzed the shrinkage behavior of strength-gradient multilayered zirconia materials across both vertical and horizontal fabrication directions. Although multilayered zirconia disks are certified and commercially available, practitioners still have concerns about uniform shrinkage and the fit of the final restorations. To address this, dimensional measurements and shrinkage calculations were carried out using methods based on ISO standards and manufacturer practices for determining shrinkage factors in CAD/CAM zirconia disks [19]. This standardized method allows for consistent and comparable results across different materials. It helps to better understand shrinkage behavior in both clinical and laboratory applications.
Among the three measurement techniques applied, surface scanning consistently demonstrated the highest standard deviations across all tested materials. Pairwise comparison revealed that shrinkage values derived from surface scans significantly differed from those obtained using a micrometer screw gauge and light microscopy. However, no significant differences were found between the micrometer screw gauge and light microscopy results. In the present study, the measurements of specimen edge lengths were performed manually, which may have contributed to greater variability due to operator-dependent positioning or alignment inconsistencies. This limitation is likely method-related rather than solely due to specimen preparation. To address this, future studies will focus on automating the specimen positioning and measurement process to minimize user-related variability and improve the reproducibility of surface scan-based evaluations. While three measurement techniques were employed, the study focused on identifying overall shrinkage trends rather than method validation. Each technique was applied consistently, and known limitations such as lower resolution and higher variability of surface scanning were considered in data interpretation. Inter-method calibration and error analysis were beyond the study’s scope but are noted for future research. Consequently, the null hypothesis (i), stating that the measurement method had no impact on shrinkage, was rejected. Regarding material-dependent behavior, the monolayer 3Y-TZP material HTML showed higher shrinkage values (18.6–18.8%) compared to the 5Y-TZP material UTML (17.6–18.2%) (Table 3). These findings align with previous reports indicating decreasing density from 3Y-TZP to 5Y-TZP within multilayer zirconia disks [22].
In strength-gradient multilayered zirconia materials, generations are layered vertically. Based on material composition, it was assumed that lower sections (with higher 3Y-TZP content) would exhibit higher shrinkages than upper sections (with more 5Y-TZP). However, this assumption was not supported by the findings of UPCE and AIDI, where specimens from upper and middle vertical positions exhibited higher shrinkage than those from lower positions. Horizontal specimen location influenced shrinkage only for the AIDI material measured using micrometer screw gauge. Center-positioned specimens shrank more than those from the inner or outer ring, likely due to inhomogeneous green body density caused by pressing during manufacturing. Furthermore, the sintering oven and its temperature distribution can influence the shrinkage behavior. To compensate for this and to ensure comparability between materials, the same number of specimens were always placed at the same height and position within the firing chamber and sintered according to the respective manufacturer’s specifications.
With respect to measurement direction (x-, y-, and z-axes), significant differences were found for ZYML and AIDI when using the micrometer screw gauge (ZYML: y < z < x; AIDI: x = y < z), and for UPCE and ZCPC using surface scans (UPCE: y < z; ZCPC: x < z). In most cases—except for ZYML—shrinkage was higher along the z-axis, indicating a potential anisotropic material behavior during sintering. However, the observed differences remained below 1%, indicating limited clinical relevance.
Thus, null hypotheses (ii) and (iii), which assumed that the vertical and horizontal positioning within the disk would not influence shrinkage, were also rejected. Variability in shrinkage along the vertical and z-direction can be attributed to both the manufacturing process (e.g., uniaxial pressing) and the dominant zirconia type within each layer. Previous studies have similarly found that the fabrication technique influences linear sintering shrinkage in zirconia [16]. The absence of vertical differences in PRIT, ZCPC, and ZYML may reflect uniform blending of zirconia types and layer thicknesses across their disks. In addition to shrinkage behavior, previous research has demonstrated that mechanical properties also vary with the position of restoration within multilayer zirconia disks [23,24]. Thus, both optical and mechanical factors—alongside dimensional stability—should be considered when positioning restorations during the CAD/CAM workflow.
This study focused on linear shrinkage only in standardized cubic specimens, which may limit its clinical relevance. Future research should analyze more complex, clinically representative geometries, such as full-contour crowns and multi-unit bridges, and loading conditions to better reflect functional distortion. Moreover, the lack of phase characterization of the layers and actual layer composition, as well as height within the multilayer disks, can be considered limitations of this study. These parameters should be addressed in future investigations. The resolution of the scanner (XY = 40 µm) used for surface scans should also be noted as a limitation. The vertical resolution affects the accuracy of the point cloud data, and further studies should explore the impact of resolution on shrinkage determination.
From a clinical perspective, the pooled results suggest a largely uniform shrinkage behavior in tested strength-gradient multilayered zirconia materials, supporting their safe and reliable application for CAD/CAM fabricated dental restorations. A non-uniform shrinkage behavior may result in an unfavorable marginal and internal fit of the final restoration. The associated increased cement gap, marginal leakage, or micro-movements under functional loading can be related to restoration failures [25]. The observed uniform shrinkage behavior of tested materials suggests precise internal and marginal fit, supporting long-term restoration performance in clinical practice.

5. Conclusions

Within the limitations of this in vitro study, the following conclusions can be drawn:
  • The zirconia material itself had the most substantial impact on linear shrinkage, followed by the measurement method applied.
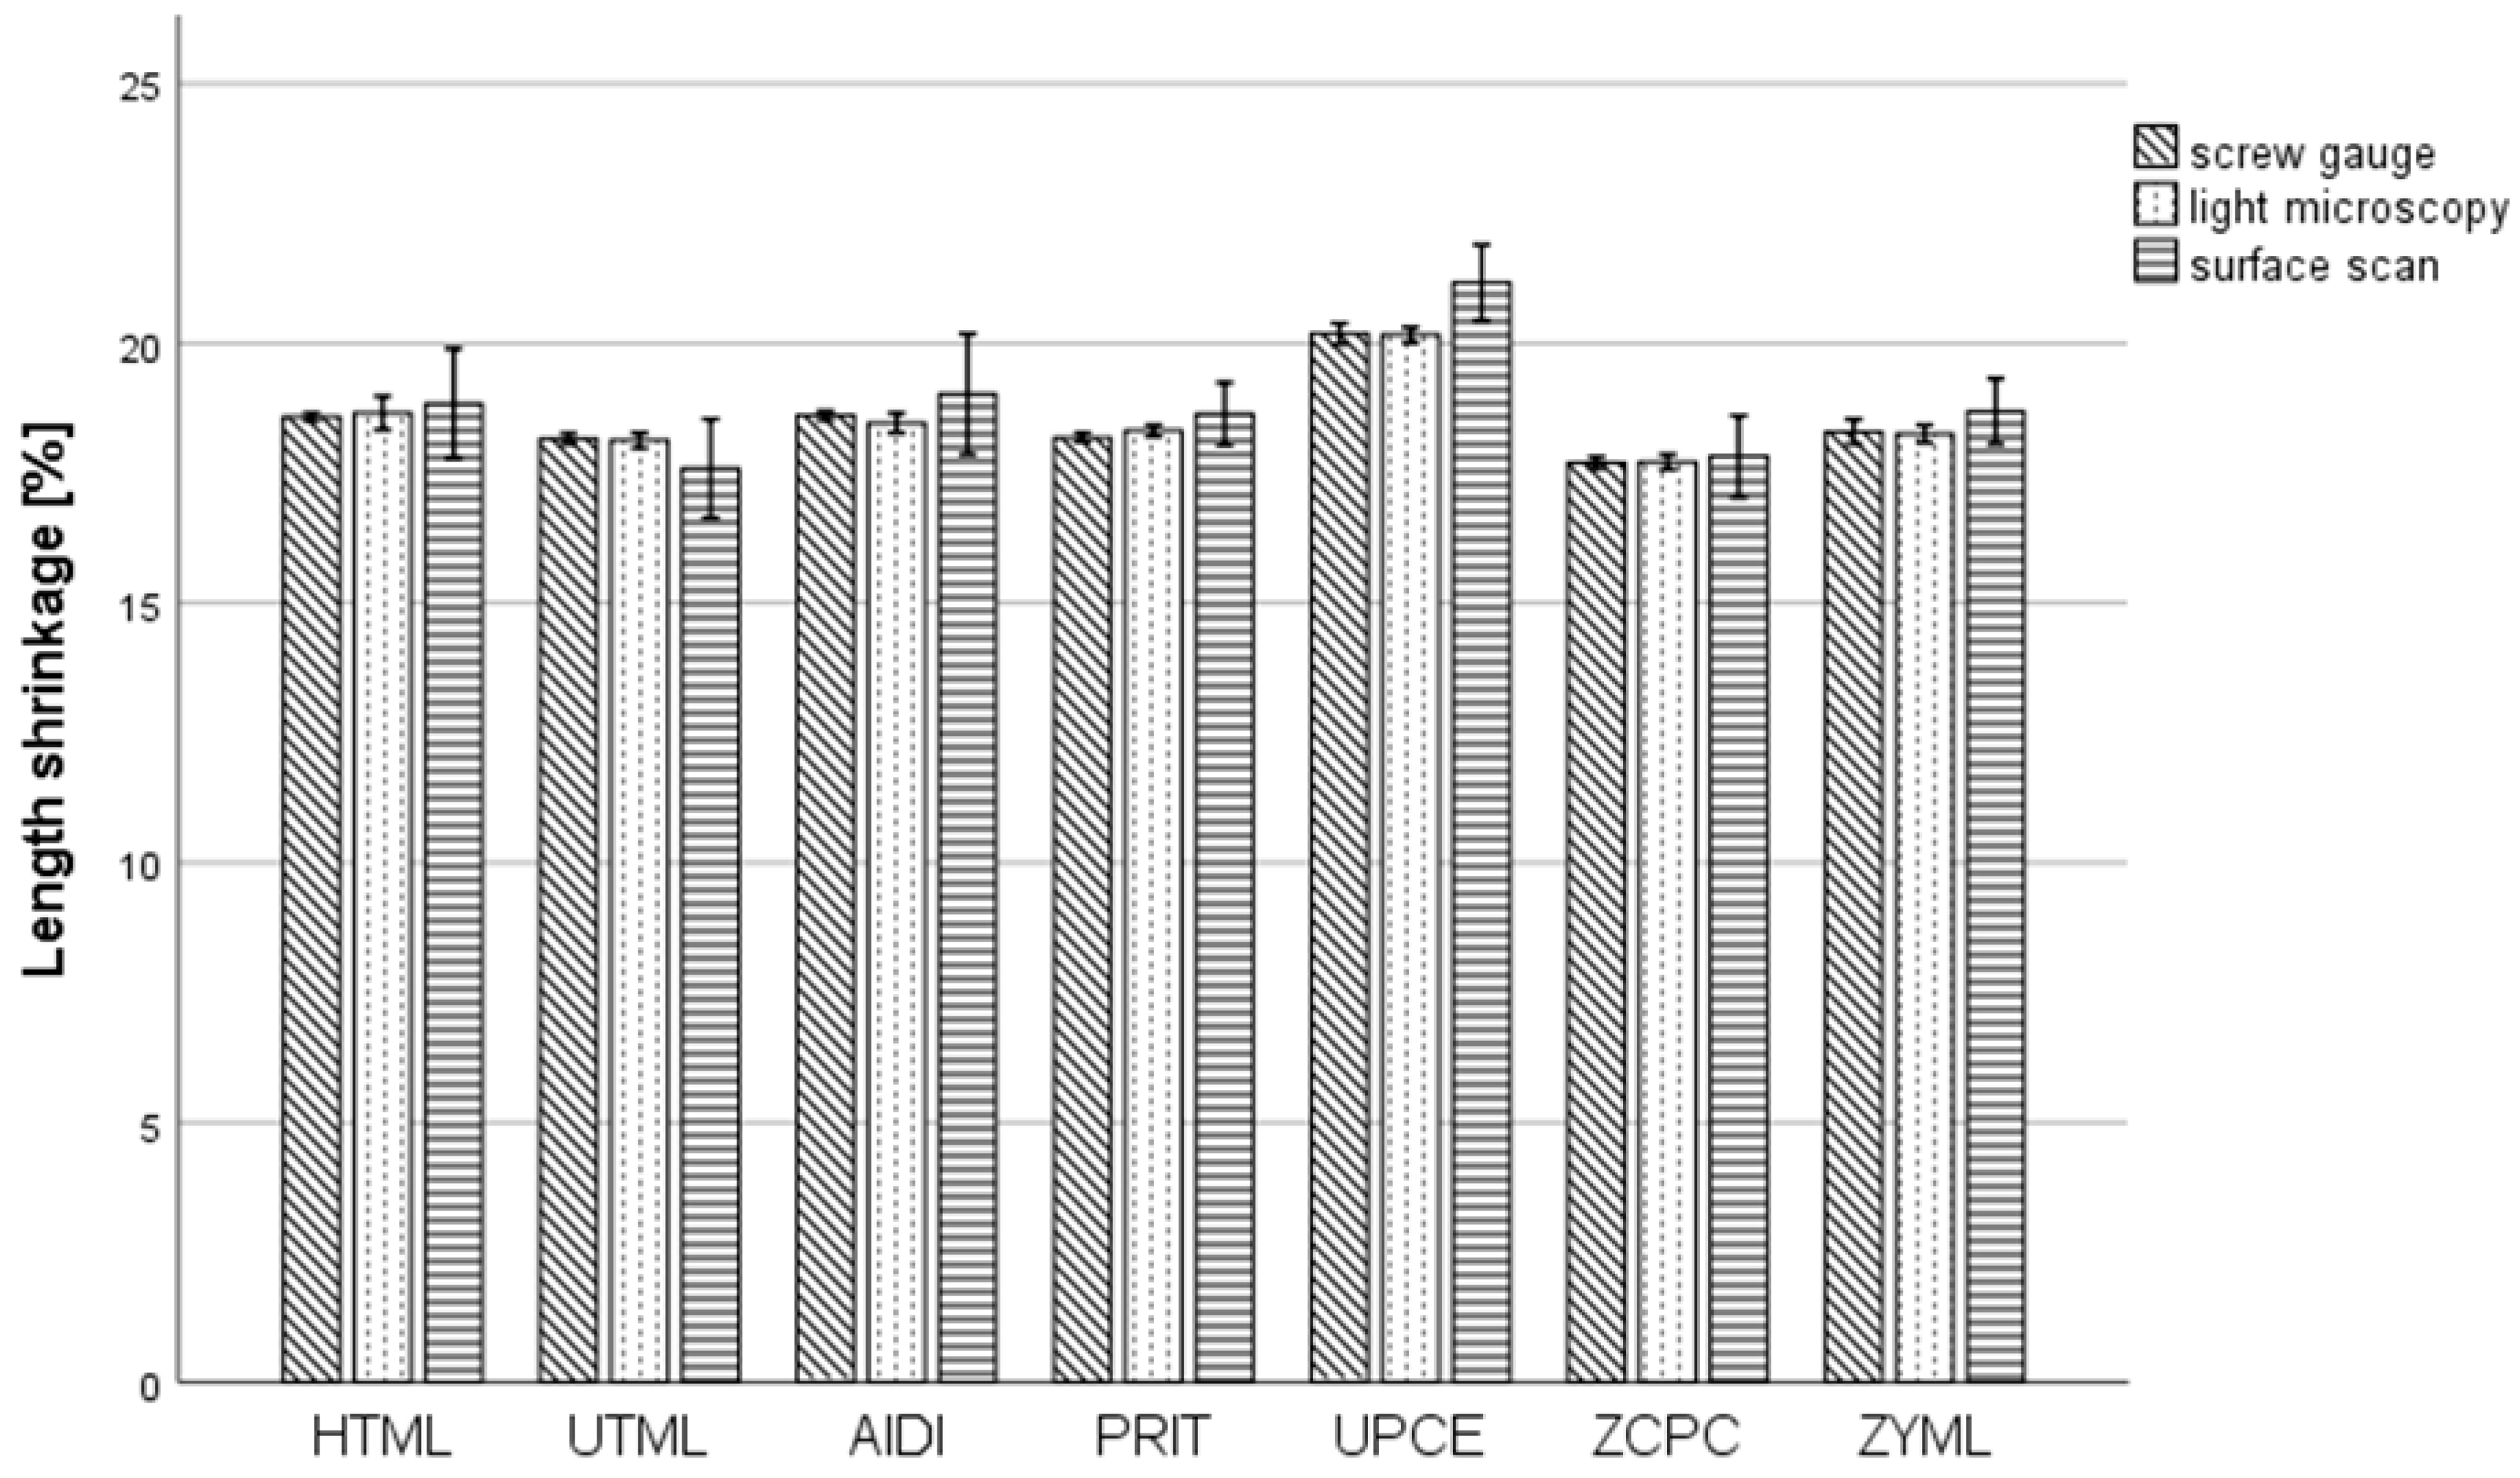
  • Among the tested materials, UPCE demonstrated the highest shrinkage values (20.1–21.1%), while ZCPC exhibited the lowest (17.7–17.8%), depending on measurement method.
  • The monolayer 3Y-TZP material HTML showed higher shrinkage values (18.6–18.8%) than the monolayer 5Y-TZP material UTML (17.6–18.2%).
  • Measurements using a micrometer screw gauge or digital light microscopy resulted in more consistent and less variable shrinkage values compared to surface scan techniques.
  • Shrinkage values recorded across the upper, middle, and lower vertical layers of the strength-gradient multilayered zirconia disks did not significantly differ in the global analysis. This supports the assumption of a uniform shrinkage behavior in strength-gradient multilayer zirconia materials for clinically relevant restorations.

Author Contributions

Conceptualization, B.S., A.C. and J.M.; methodology, M.H., A.C. and J.M.; software, M.H.; validation, B.S. and A.E.; data curation, B.S., M.H., J.M. and A.C.; writing—original draft preparation, A.C.; writing—review and editing, B.S., J.M., M.H. and A.E.; supervision, B.S. All authors have read and agreed to the published version of the manuscript.

Funding

This research received no external funding.

Institutional Review Board Statement

Not applicable.

Informed Consent Statement

Not applicable.

Data Availability Statement

The original contributions presented in this study are included in the article. Further inquiries can be directed to the corresponding author.

Acknowledgments

The authors would like to thank Kuraray Noritake for providing materials and financial support for this study, and Melisa Klimenta for conducting part of the measurements.

Conflicts of Interest

The authors declare no conflicts of interest.

References

  1. Borik, M.; Gerasimov, M.; Lomonova, E.; Milovich, F.; Myzina, V.; Ryabochkina, P.; Sidorova, N.; Tabachkova, N. Mechanical properties and transformation hardening mechanism in yttria, ceria, neodymia and ytterbia co-doped zirconia based solid solutions. Mater. Chem. Phys. 2019, 232, 28–33. [Google Scholar] [CrossRef]
  2. Belli, R.; Hurle, K.; Schürrlein, J.; Petschelt, A.; Werbach, K.; Peterlik, H.; Rabe, T.; Mieller, B.; Lohbauer, U. Relationships between fracture toughness, Y2O3 fraction and phases content in modern dental Yttria-doped zirconias. J. Eur. Ceram. Soc. 2021, 41, 7771–7782. [Google Scholar] [CrossRef]
  3. Wiedenmann, F.; Pfefferle, R.; Reichert, A.; Jerman, E.; Stawarczyk, B. Impact of high-speed sintering, layer thickness and artificial aging on the fracture load and two-body wear of zirconia crowns. Dent. Mater. 2020, 36, 846–853. [Google Scholar] [CrossRef] [PubMed]
  4. Antón, X.; Stawarczyk, B.; Reymus, M.; Joda, T.; Liebermann, A. Impact of high-speed sintering on accuracy and fit of 4 mol% yttria-stabilized tetragonal zirconia polycrystals. Int. J. Prosthodont. 2021, 34, 775–783. [Google Scholar] [CrossRef]
  5. Stawarczyk, B.; Keul, C.; Eichberger, M.; Figge, D.; Edelhoff, D.; Lümkemann, N. Three generations of zirconia: From veneered to monolithic. Part I. Quintessence Int. 2017, 48, 369–380. [Google Scholar]
  6. Vardhaman, S.; Borba, M.; Kaizer, M.R.; Kim, D.K.; Zhang, Y. Optical and Mechanical Properties of the Multi-Transition Zones of a Translucent Zirconia. J. Esthet. Restor. Dent. 2025, 37, 525–532. [Google Scholar] [CrossRef]
  7. Lümkemann, N.; Stawarczyk, B. Impact of hydrothermal aging on the light transmittance and flexural strength of colored yttria-stabilized zirconia materials of different formulations. J. Prosthet. Dent. 2021, 125, 518–526. [Google Scholar] [CrossRef]
  8. Alqutaibi, A.Y.; Ghulam, O.; Krsoum, M.; Binmahmoud, S.; Taher, H.; Elmalky, W.; Zafar, M.S. Revolution of Current Dental Zirconia: A Comprehensive Review. Molecules 2022, 27, 1699. [Google Scholar] [CrossRef]
  9. Ban, S. Development and characterization of ultra-high translucent zirconia using new manufacturing technology. Dent. Mater. J. 2023, 42, 1–10. [Google Scholar] [CrossRef]
  10. Sulaiman, T.A.; Suliman, A.A.; Abdulmajeed, A.A.; Zhang, Y. Zirconia restoration types, properties, tooth preparation design, and bonding. A narrative review. J. Esthet. Restor. Dent. 2024, 36, 78–84. [Google Scholar] [CrossRef]
  11. Arellano Moncayo, A.M.; Peñate, L.; Arregui, M.; Giner-Tarrida, L.; Cedeño, R. State of the Art of Different Zirconia Materials and Their Indications According to Evidence-Based Clinical Performance: A Narrative Review. Dent. J. 2023, 11, 18. [Google Scholar] [CrossRef] [PubMed]
  12. Michailova, M.; Elsayed, A.; Fabel, G.; Edelhoff, D.; Zylla, I.M.; Stawarczyk, B. Comparison between novel strength-gradient and color-gradient multilayered zirconia using conventional and high-speed sintering. J. Mech. Behav. Biomed. Mater. 2020, 111, 103977. [Google Scholar] [CrossRef] [PubMed]
  13. Čokić, S.M.; Cóndor, M.; Vleugels, J.; Van Meerbeek, B.; Van Oosterwyck, H.; Inokoshi, M.; Zhang, F. Mechanical properties–translucency–microstructure relationships in commercial monolayer and multilayer monolithic zirconia ceramics. Dent. Mater. 2022, 38, 797–810. [Google Scholar] [CrossRef] [PubMed]
  14. Strasser, T.; Wertz, M.; Koenig, A.; Koetzsch, T.; Rosentritt, M. Microstructure, composition, and flexural strength of different layers within zirconia materials with strength gradient. Dent. Mater. 2023, 39, 463–468. [Google Scholar] [CrossRef]
  15. Koo, P.J.; Lee, J.H.; Ha, S.R.; Seo, D.G.; Ahn, J.S.; Choi, Y.S. Changes in the Properties of Different Zones in Multilayered Translucent Zirconia Used in Monolithic Restorations During Aging Process. J. Funct. Biomater. 2025, 16, 96. [Google Scholar] [CrossRef]
  16. Oh, G.J.; Yun, K.D.; Lee, K.M.; Lim, H.P.; Park, S.W. Sintering behavior and mechanical properties of zirconia compacts fabricated by uniaxial press forming. J. Adv. Prosthodont. 2010, 2, 81–87. [Google Scholar] [CrossRef]
  17. Cesar, P.F.; Miranda, R.B.d.P.; Santos, K.F.; Scherrer, S.S.; Zhang, Y. Recent advances in dental zirconia: 15 years of material and processing evolution. Dent. Mater. 2024, 40, 824–836. [Google Scholar] [CrossRef]
  18. Ding, H.; Tsoi, J.K.; Kan, C.W.; Matinlinna, J.P. A simple solution to recycle and reuse dental CAD/CAM zirconia block from its waste residuals. J. Prosthodont. Res. 2021, 65, 311–320. [Google Scholar] [CrossRef]
  19. ISO 18675:2022; Dentistry-Machinable Ceramic Blanks. International Organization for Standardization: Geneva, Switzerland, 2022.
  20. Mosa, M.O.; Ibraheem, A.F.; Hussein, H.M. Digital Evaluation of the Trueness and Fitting Accuracy of a Three-Unit Fixed Zirconium Bridge Fabricated from Different Types of Zirconia and Different Marginal Cement Space Thickness. Eur. J. Gen. Dent. 2024, 13, 30–36. [Google Scholar] [CrossRef]
  21. Yazigi, C.; Busch, R.; Kern, M. Zirconia restorations and the tool diameter compensation. Int. J. Comput. Dent. 2023, 26, 257–264. [Google Scholar]
  22. Winter, A.; Schurig, A.; Odenthal, A.L.; Schmitter, M. Impact of different layers within a blank on mechanical properties of multi-layered zirconia ceramics before and after thermal aging. Dent. Mater. 2022, 38, e147–e154. [Google Scholar] [CrossRef] [PubMed]
  23. Rosentritt, M.; Preis, V.; Schmid, A.; Strasser, T. Multilayer zirconia: Influence of positioning within blank and sintering conditions on the in vitro performance of 3-unit fixed partial dentures. J. Prosthet. Dent. 2022, 127, 141–145. [Google Scholar] [CrossRef] [PubMed]
  24. Li, Q.L.; Jiang, Y.Y.; Wei, Y.R.; Swain, M.V.; Yao, M.F.; Li, D.S.; Wei, T.; Jian, Y.T.; Zhao, K.; Wang, X.D. The influence of yttria content on the microstructure, phase stability and mechanical properties of dental zirconia. Ceram. Int. 2022, 48, 5361–5368. [Google Scholar] [CrossRef]
  25. Baldi, A.; Comba, A.; Ferrero, G.; Italia, E.; Michelotto Tempesta, R.; Paolone, G.; Mazzoni, A.; Breschi, L.; Scotti, N. External gap progression after cyclic fatigue of adhesive overlays and crowns made with high translucency zirconia or lithium silicate. J. Esthet. Restor. Dent. 2022, 34, 557–564. [Google Scholar] [CrossRef]
Figure 1. Study design and positioning of specimens within the zirconia disks.
Materials 18 03217 g001
Figure 2. Digital micrometer screw gauge and representative specimen.
Materials 18 03217 g002
Figure 3. Specimen holder for surface scans.
Materials 18 03217 g003
Figure 4. Example of Rhinoceros 3D overlay analysis showing point cloud comparison pre- (red line) and post-sintered (green line).
Materials 18 03217 g004
Figure 5. Impact of zirconia materials and test methods within pooled data (vertical, horizontal position, and measurement direction) on length shrinkage.
Materials 18 03217 g005
Table 1. Overview of materials, abbreviations, manufacturers, zirconia type, geometry, color/shade, and batch numbers.
AbbreviationMaterialManufacturerZirconia TypeGeometry
d: 98 mm × h:
Color/
Shade
Batch/LOT
HTMLKatana Zr, HTML PlusKuraray Noritake (Tokyo, Japan)3Y-TZP18 mmA3EGLGB
UTMLKatana Zr, UTMLKuraray Noritake5Y-TZP18 mmA3EGZJZ
AIDIOptimill 3D PRO ZirAidite
(Qinhuangdao, China)
4Y-TZP/
5Y-TZP
20 mmA3 standard26640000
PRITPriti Multidisc ZrO2 Multicolorpritidenta
(Leinfelden-Echterdingen, Germany)
3Y-TZP/
5Y-TZP
20 mmA light, translucentT0924 AL 20T
UPCEExplore EstheticUPCERA
(Shenzhen, China)
4Y-TZP/
5Y-TZP
20 mmA3L2220506019-006
L2211203009-013
ZCPCIPS e.max ZirCAD PrimeIvoclar Vivadent (Schaan, Liechtenstein)3Y-TZP/
5Y-TZP
20 mmA3Z02R88
ZYMLKatana YMLKuraray Noritake
(Tokyo, Japan)
3Y-TZP/
5Y-TZP
22 mmA3EGRKE
Table 2. Descriptive statistics of length shrinkage (in %) depending on material, vertical and horizontal position, specimen axis, and measurement method.
MaterialVertical PositionHorizontal PositionSpecimen AxisLength Shrinkage in % (Mean ± SD)
Micrometer Screw GaugeLight MicroscopySurface Scans
HTMLMiddleCenterx18.618.519.7
y18.618.520.0
z18.518.218.9
Inner ringx18.6 ± 0.0018.7 ± 0.0419.2 ± 2.02
y18.6 ± 0.00 *18.8 ± 0.1018.6 ± 0.73
z18.5 ± 0.0318.5 ± 0.3017.6 ± 1.64
Outer ringx18.6 ± 0.0219.2 ± 0.50 *18.6 ± 0.29 *
y18.7 ± 0.06 *18.7 ± 0.01 *19.5 ± 0.39
z18.5 ± 0.04 *18.4 ± 0.1018.4 ± 1.14
UTMLMiddleCenterx18.118.217.8
y18.218.216.1
z18.117.916.0
Inner ringx18.2 ± 0.02 *18.1 ± 0.14 *17.9 ± 0.13 *
y18.2 ± 0.04 *18.2 ± 0.1218.0 ± 1.29
z18.1 ± 0.04 *17.9 ± 0.0917.5 ± 1.10
Outer ringx18.3 ± 0.22 *18.3 ± 0.0817.9 ± 0.01
y18.2 ± 0.03 *18.2 ± 0.15 *16.9 ± 0.35 *
z18.1 ± 0.1018.1 ± 0.0518.7 ± 0.69
ZYMLMiddleCenterx18.418.017.7
y18.218.220.1
z18.118.018.3
Inner ringx18.6 ± 0.12 *18.3 ± 0.07 *19.3 ± 0.85
y18.0 ± 0.0918.4 ± 0.0918.5 ± 0.73
z18.3 ± 0.0218.1 ± 0.0119.2 ± 0.38 *
Outer ringx18.2 ± 0.10 *18.3 ± 0.1519.1 ± 0.18 *
y18.4 ± 0.0618.7 ± 0.3518.9 ± 0.84
z18.2 ± 0.06 *18.1 ± 0.03 *18.7 ± 1.04
UpperCenterx18.818.518.5
y17.718.218.9
z18.218.117.9
Inner ringx18.5 ± 0.05 *18.3 ± 0.0419.0 ± 0.47
y18.2 ± 0.10 *18.3 ± 0.03 *18.6 ± 0.06 *
z18.2 ± 0.0718.1 ± 0.0818.5 ± 0.07
Outer ringx18.6 ± 0.12 *18.1 ± 0.0519.3
y18.1 ± 0.0118.3 ± 0.01 *17.8
z18.2 ± 0.0318.1 ± 0.26 *18.2
LowerCenterx18.618.119.2
y18.118.318.5
z18.318.119.1
Inner ringx18.7 ± 0.27 *18.4 ± 0.0418.8 ± 0.22
y17.9 ± 0.0218.3 ± 0.0218.1 ± 0.38
z18.3 ± 0.0318.3 ± 0.03 *18.7 ± 0.78
Outer ringx18.6 ± 0.13 *18.3 ± 0.08 *19.1 ± 0.21
y18.2 ± 0.1018.3 ± 0.1517.7 ± 0.88
z18.3 ± 0.03 *18.2 ± 0.06 *18.5 ± 0.25 *
PRITMiddleCenterx18.218.218.4
y18.218.318.7
z18.118.318.2
Inner ringx18.2 ± 0.0718.2 ± 0.0219.5 ± 1.10
y18.2 ± 0.05 *18.2 ± 0.06 *18.8 ± 0.25 *
z18.1 ± 0.08 *18.4 ± 0.12 *18.8 ± 0.54 *
Outer ringx18.2 ± 0.0218.3 ± 0.0518.2
y18.2 ± 0.04 *18.4 ± 0.16 *18.6
z18.2 ± 0.06 *18.2 ± 0.05 *19.4
UpperCenterx18.218.218.6
y18.218.218.7
z18.218.217.9
Inner ringx18.1 ± 0.0118.5 ± 0.02 *19.3 ± 1.01
y18.3 ± 0.0718.3 ± 0.06 *18.5 ± 0.47
z18.1 ± 0.08 *18.2 ± 0.04 *18.7 ± 0.99
Outer ringx18.1 ± 0.0618.4 ± 0.1518.2 ± 0.27
y18.1 ± 0.05 *18.5 ± 0.0218.9 ± 0.66
z18.1 ± 0.0918.3 ± 0.02 *18.3 ± 0.31 *
LowerCenterx18.118.518.9
y18.118.418.5
z18.118.418.8
Inner ringx18.2 ± 0.0018.3 ± 0.15 *17.8 ± 1.55
y18.2 ± 0.10 *18.3 ± 0.03 *18.1 ± 0.77
z18.2 ± 0.0618.3 ± 0.1518.7 ± 0.28
Outer ringx18.2 ± 0.0618.4 ± 0.04 *18.6 ± 0.03 *
y18.4 ± 0.2018.3 ± 0.00 *18.6 ± 0.30
z18.2 ± 0.00 *18.2 ± 0.06 *19.0 ± 0.57
UPCEMiddleCenterx20.220.121.6
y20.220.120.3
z19.119.921.3
Inner ringx20.2 ± 0.0020.1 ± 0.0021.5 ± 0.03
y20.3 ± 0.0620.1 ± 0.0620.1 ± 0.18 *
z20.1 ± 0.0420.0 ± 0.1221.3 ± 0.25
Outer ringx20.2 ± 0.00 *20.0 ± 0.05 *21.4 ± 0.53
y20.2 ± 0.00 *20.4 ± 0.18 *20.5 ± 0.47 *
z20.1 ± 0.02 *20.1 ± 0.0722.5 ± 1.00 *
UpperCenterx20.320.120.5
y20.320.320.9
z20.320.120.7
Inner ringx20.3 ± 0.0420.1 ± 0.0120.8 ± 0.21
y20.2 ± 0.01 *20.3 ± 0.0121.4 ± 0.50
z20.2 ± 0.0620.2 ± 0.0522.3 ± 1.40 *
Outer ringx20.3 ± 0.0620.2 ± 0.11 *21.1 ± 0.44
y20.3 ± 0.0620.2 ± 0.0320.6 ± 0.53 *
z20.3 ± 0.28 *20.1 ± 0.27 *22.0 ± 0.88
LowerCenterx20.220.021.5
y20.220.421.0
z20.220.220.5
Inner ringx20.1 ± 0.06 *20.4 ± 0.3521.1 ± 0.44
y20.2 ± 0.08 *20.2 ± 0.13 *20.7 ± 0.31 *
z20.3 ± 0.5120.2 ± 0.0421.2 ± 0.10 *
Outer ringx20.1 ± 0.1420.2 ± 0.20 *21.3 ± 1.46
y20.1 ± 0.1820.1 ± 0.02 *20.7 ± 0.01 *
z20.1 ± 0.02 *20.2 ± 0.0721.2 ± 0.35 *
AIDIMiddleCenterx18.618.518.1
y18.618.418.2
z18.718.520.7
Inner ringx18.5 ± 0.0118.5 ± 0.1818.7 ± 0.58
y18.6 ± 0.0218.4 ± 0.2018.4 ± 0.10 *
z18.6 ± 0.02 *18.4 ± 0.1119.1 ± 1.18
Outer ringx18.6 ± 0.04 *18.1 ± 0.0119.3 ± 0.89 *
y18.6 ± 0.0718.3 ± 0.1321.1 ± 1.91
z18.6 ± 0.02 *18.4 ± 0.0719.7 ± 0.51 *
UpperCenterx18.618.618.1
y18.718.417.4
z18.818.519.8
Inner ringx18.6 ± 0.0818.6 ± 0.4018.7 ± 0.37
y18.6 ± 0.04 *18.5 ± 0.06 *18.4 ± 1.65
z18.7 ± 0.05 *18.4 ± 0.0818.7 ± 0.36
Outer ringx18.6 ± 0.0218.4 ± 0.05 *19.8 ± 0.50 *
y18.6 ± 0.05 *18.5 ± 0.14 *19.7 ± 0.52
z18.7 ± 0.0818.5 ± 0.07 *18.6 ± 2.63
LowerCenterx18.518.419.5
y18.518.516.5
z18.818.821.6
Inner ringx18.5 ± 0.0318.3 ± 0.0319.1 ± 0.44
y18.5 ± 0.06 *18.3 ± 0.0319.5 ± 1.87
z18.6 ± 0.01 *18.5 ± 0.27 *18.7 ± 0.23
Outer ringx18.5 ± 0.02 *18.6 ± 0.34 *18.2 ± 0.36
y18.5 ± 0.03 *18.5 ± 0.0319.0 ± 0.94
z18.6 ± 0.0418.8 ± 0.4218.6 ± 0.52
ZCPCMiddleCenterx17.817.517.5
y17.617.718.6
z17.717.718.0
Inner ringx17.7 ± 0.0618.0 ± 0.20 *17.7 ± 0.55
y17.7 ± 0.09 *17.9 ± 0.0518.8 ± 0.32
z17.6 ± 0.1317.6 ± 0.0317.9 ± 0.15
Outer ringx17.6 ± 0.01 *17.7 ± 0.0617.1 ± 0.73
y17.6 ± 0.0417.8 ± 0.05 *17.8 ± 1.42
z17.7 ± 0.0017.6 ± 0.13 *18.6 ± 0.04
UpperCenterx17.717.917.7
y17.817.720.4
z17.717.817.9
Inner ringx17.7 ± 0.1117.6 ± 0.0017.1 ± 0.15
y17.6 ± 0.08 *17.8 ± 0.14 *17.4 ± 0.99 *
z17.8 ± 0.0417.8 ± 0.20 *18.3 ± 0.42 *
Outer ringx17.6 ± 0.0617.7 ± 0.07 *17.8 ± 0.12 *
y17.8 ± 0.2817.8 ± 0.1016.6 ± 0.58 *
z17.7 ± 0.14 *17.6 ± 0.1517.9 ± 0.90
LowerCenterx17.817.917.5
y17.717.617.9
z17.717.818.2
Inner ringx17.6 ± 0.0617.7 ± 0.15 *17.5 ± 0.61 *
y17.8 ± 0.1417.7 ± 0.0017.7 ± 0.20
z17.6 ± 0.05 *17.5 ± 0.01 *18.0 ± 0.63 *
Outer ringx17.7 ± 0.11 *17.7 ± 0.24 *17.6 ± 0.10 *
y17.7 ± 0.22 *17.6 ± 0.1016.8 ± 0.82
z17.8 ± 0.2417.7 ± 0.1418.6 ± 0.30
* indicates the deviation from the normal distribution. Bold values: highest and lowest shrinkage per material.
Table 3. Descriptive statistics showing the length shrinkage (in %) for each zirconia material measured using each test method.
Zirconia MaterialMicrometer Screw GaugeLight MicroscopySurface Scan
Mean ± SDMean ± SDMean ± SD
HTML18.6 ± 0.07 deA18.7 ± 0.32 deA18.8 ± 1.06 bcA
UTML18.2 ± 0.10 *abA18.1 ± 0.15 abA17.6 ± 0.95 abA
AIDI18.6 ± 0.09 eB18.5 ± 0.19 cdA19.0 ± 1.16 cB
PRIT18.2 ± 0.08 bcA18.3 ± 0.11 *bcB18.6 ± 0.61 *bcC
UPCE20.2 ± 0.20 *fA20.1 ± 0.15 eA21.1 ± 0.73 *dB
ZCPC17.7 ± 0.11 aA17.7 ± 0.14 aA17.8 ± 0.79 aA
ZYML18.3 ± 0.24 bcdA18.3 ± 0.17 bA18.7 ± 0.63 cB
* Indicates the deviation from the normal distribution. abcdef indicates significant differences between the zirconia materials within one test method. ABC indicates significant differences between the test methods within zirconia material.
Disclaimer/Publisher’s Note: The statements, opinions and data contained in all publications are solely those of the individual author(s) and contributor(s) and not of MDPI and/or the editor(s). MDPI and/or the editor(s) disclaim responsibility for any injury to people or property resulting from any ideas, methods, instructions or products referred to in the content.

