Abstract
The Nd2In compound exhibits an intriguing borderline first-/second-order transition at its Curie temperature. Several studies have pointed to its potential for magnetic cooling, but also raised controversies about the actual order of the transition, the amplitudes of the hysteresis, and of its magnetocaloric effect. Here, we estimate the thermal hysteresis using magnetic and thermal measurements at different rates. It is found to be particularly small (0.1–0.4 K), leading to almost fully reversible adiabatic temperature changes when comparing zero-field cooling and cyclic protocols. Some open questions remain with regard to the magnetostriction of Nd2In, which is presently found to be limited, in line with the absence of a thermal expansion discontinuity at the transition. The comparison of the magnetocaloric effect in Nd2In and Eu2In highlights that the limited saturation magnetization of the former affects its performance. Further efforts should therefore be made to design materials with such borderline first-/second-order transitions using heavier rare earths.
1. Introduction
Rare-earth indium R2In compounds form a relatively large materials family with intriguing magnetic properties; members of this family have recently attracted researchers’ interest due to their potential magnetocaloric applications. R2In compounds based on trivalent rare earths crystallize in a hexagonal Ni2In-type crystal structure (space group P63/mmc) featuring two inequivalent rare earth sites with distinct coordination geometries [1]. Meanwhile divalent-like Eu2In and Yb2In compounds crystallize in a Co2Si-type orthorhombic structure (space group Pnma), also comprising inequivalent sites [2,3]. Most of the hexagonal R2In with R = Nd, Pr, Gd, Tb, Dy, Ho, Er, Tm exhibit ferromagnetism with Curie temperatures loosely following a De Gennes behavior [4,5]. Yet, several compounds from the series present unique features that are of particular interest. Sm2In shows ferrimagnetic ordering with small spontaneous magnetization [6]. Gd2In actually presents an antiferromagnetic ground state turning into ferromagnetism through a metamagnetic transition at about 100 K [7]. The metamagnetic transition of Gd2In is remarkable. It is of the first-order type and can be induced by temperature, magnetic field, or pressure, but is associated with a limited latent heat and hysteresis [8,9,10,11,12]. More recently, the search for materials for magnetic cooling and the observation of a giant magnetocaloric effect in Eu2In involving a rather unique mechanism has triggered a renewed interest for R2In compounds [13,14,15]. Whereas the heavy rare earth shows continuous second-order ferromagnetic transitions, the light rare-earth Nd2In and Pr2In present first-order ferromagnetic transitions (FOMT) [16,17,18,19]. The latent heat of these FOMTs leads to isothermal entropy change (ΔS) and adiabatic temperature change (ΔTad) larger than that observed for the heavy rare earth R2In despite the lower saturation magnetization of the light rare earths [20,21,22]. In combination with a broader availability of light rare earths, it makes Pr2In and Nd2In potential magnetocaloric materials for cryogenic cooling with performances on par or greater than those of other magnetocaloric material families [23,24,25,26,27,28,29], especially when looking at the temperature range relevant for the liquefaction of natural gases.
Unlike conventional FOMT materials such as Gd5Si2Ge2, MnAs, FeRh, La(Fe,Si)13 or MnFe(P,As) which exhibit crystal symmetry breaking, large volume changes or pronounced lattice distortions [30], Nd2In was found to be nearly structurally invariant across its magnetic transition, with a temperature-dependent crystallographic study revealing no symmetry breaking or discontinuities in lattice parameters [19]. Its ferromagnetic transition therefore appears to be on the borderline between the first- and second-order type. As a result, while three nearly simultaneous studies have confirmed the potential of Nd2In for use in magnetic cooling [17,18,19], the exact nature of the ferromagnetic transition remains subject to debate. Using the same criteria—for instance, the shape of the heat capacity peak or the field dependence of the isothermal entropy change—the transition has been alternatively suggested to be of first- or second- order. The report of large magnetostrictive strains at the transition also contrasts with the nearly negligible volume change from temperature-dependent diffraction experiments. In addition, the thermal hysteresis of the transition shows a scatter with illustrations presenting an inverted hysteresis [17], with reports mentioning almost no thermal hysteresis or hysteresis less than 2 K [18,19]. Finally, the amplitude of the magnetocaloric effect itself presents some discrepancies, with adiabatic temperature changes ∆Tad ranging from about 1.8 K for µ0∆H = 2 T from indirect heat capacity measurements down to 1.13 K for µ0∆H = 1.95 T from direct cyclic measurements.
Since only first-order transitions can present a finite thermal hysteresis, a relatively accurate determination of the hysteresis would be needed to settle the controversies on the nature of the phase transition. The question of the hysteresis is also essential for assessing magnetocaloric performances. If thermal hysteresis is present, it would affect the reversibility of the phase transition upon magnetization/demagnetization cycles and therefore would lead to a decrease or even an absence of magnetocaloric effect after the first field application. One can actually note that a finite hysteresis could be the origin of the differences in the reported ∆Tad values, since hysteresis would affect only direct cyclic measurements. Here, we revisit the magnetocaloric effect and the ferromagnetic transition in Nd2In by using thermal measurements. We pay special attention while separating the dynamic contributions that may hinder the estimate of the thermal hysteresis during magnetic or thermal properties measurements. We observe a particularly small, yet finite, thermal hysteresis of 0.1–0.4 K. This hysteresis is found to be sufficiently limited to not result in noticeable losses during cyclic ∆Tad measurements. Finally, a descriptive parametric model is applied to shed light on the origin of the ∆Tad difference between Eu2In and Nd2In.
2. Materials and Methods
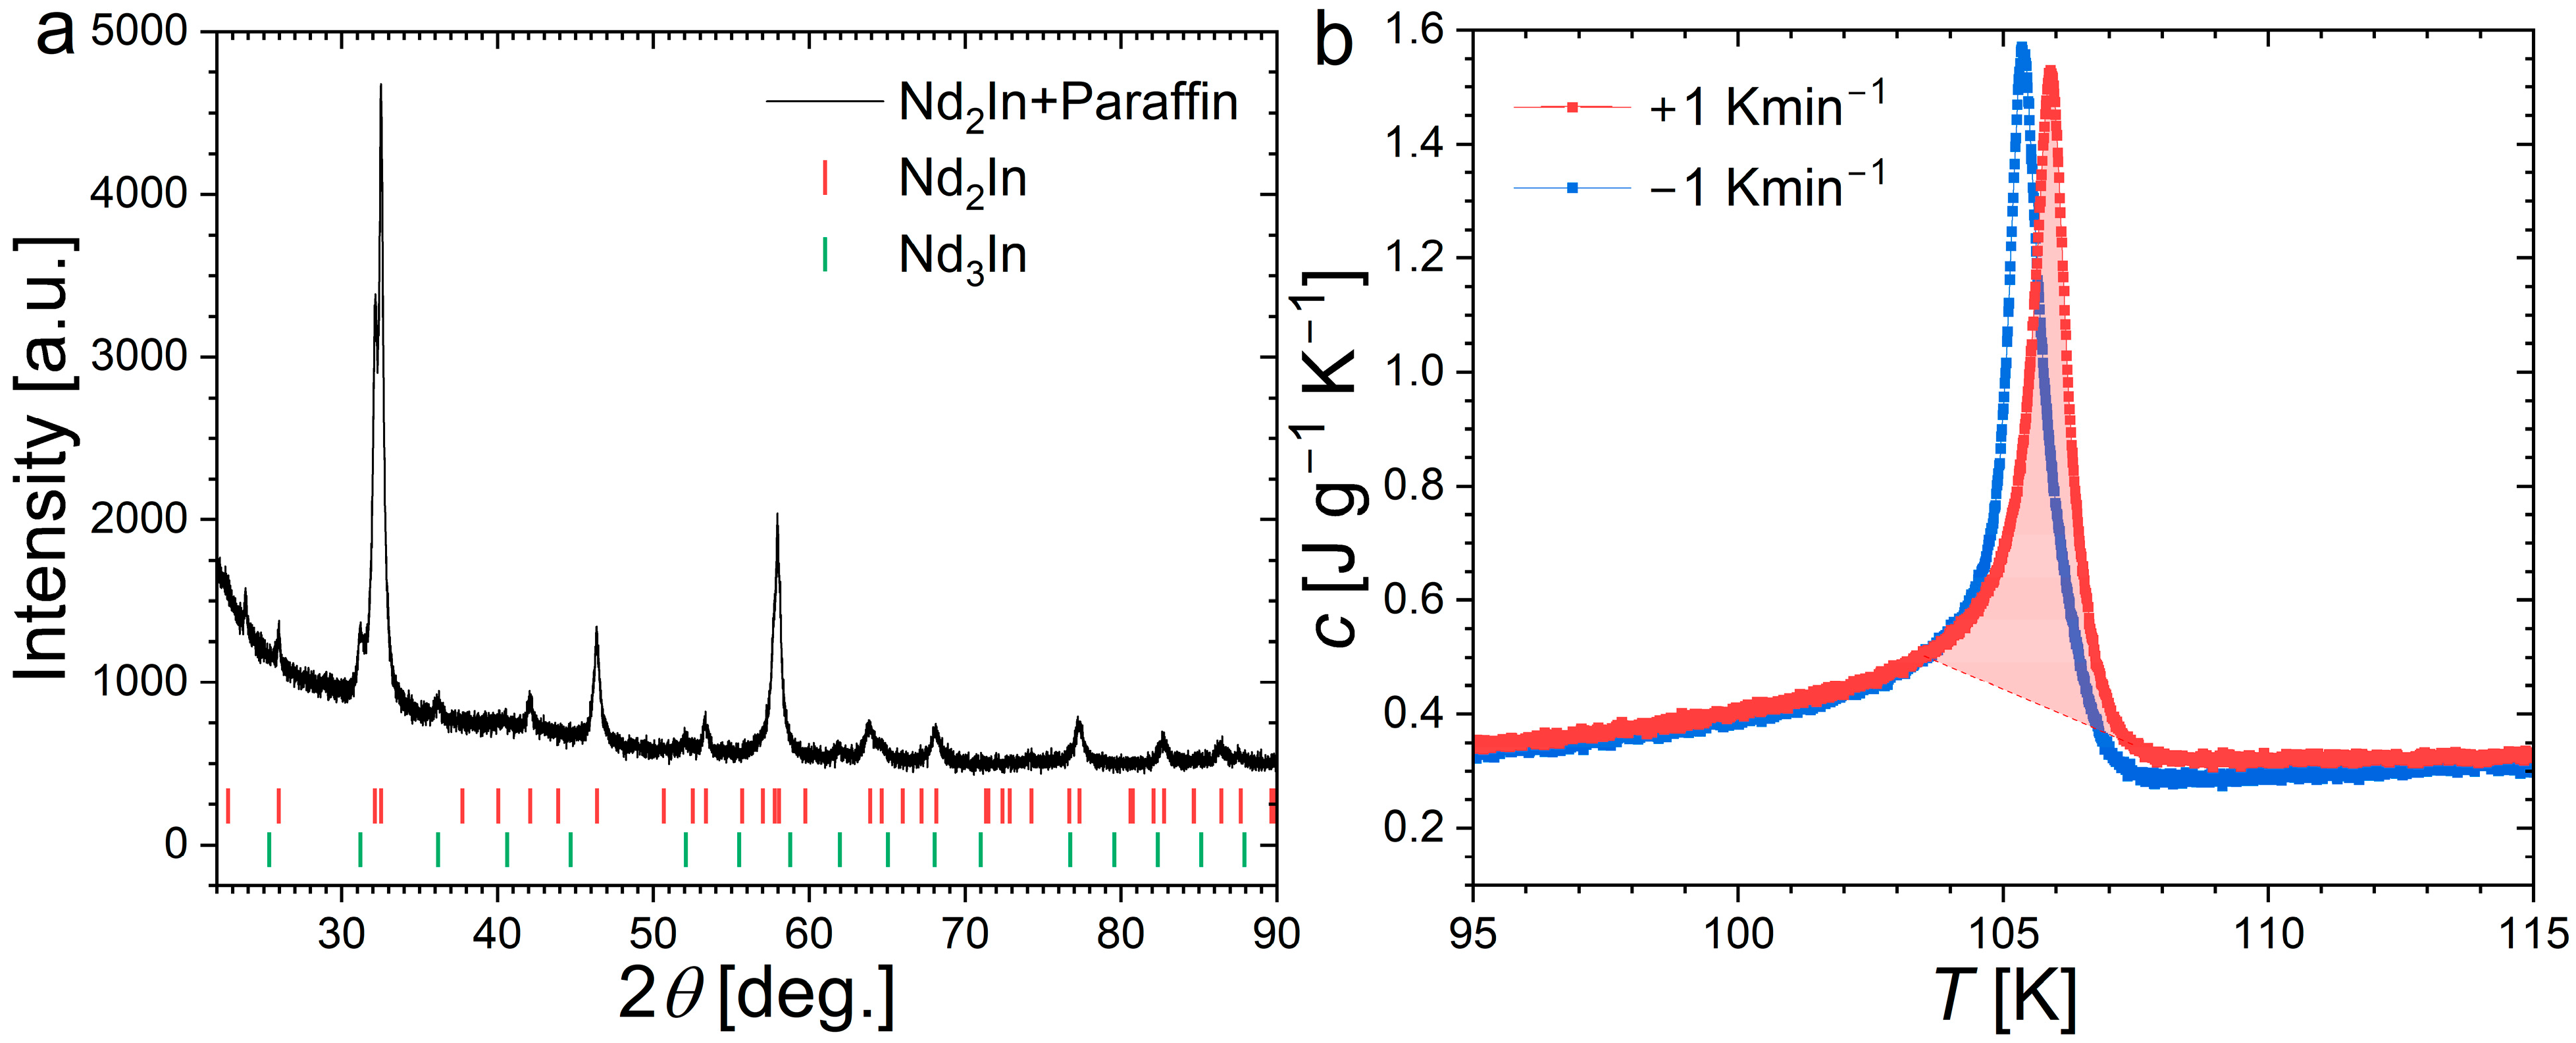
A polycrystalline Nd2In sample was prepared by arc melting followed by heat treatment. The elemental starting materials were arc-melted 4 times in a purified Ar atmosphere while flipping the button at each iteration. The resulting button was sealed into a quartz ampule and annealed at 700 °C for 100 h. Powder X-ray diffraction measurements were carried out at room temperature using a PANalytical Empyrean diffractometer (Malvern Panalytical, Malvern, UK). The powder was crushed and sieved in an Ar-purified glovebox, then mixed with paraffin oil to prevent oxidation during the XRD measurement. Figure 1 shows the resulting diffractogram, which can be indexed and refined using the Rietveld method in the reported hexagonal structure with lattice parameters a = 5.5002(6) Å and c = 6.8684(9) Å, consistent with former reports [1,19,31]. In addition to a significant background present at low angle due to the paraffin oil, additional peaks are visible at 31.2° and 36.2°, which can be attributed to a cubic Nd3In secondary phase (6.6(4)wt.%). A similar Nd3In secondary phase was also observed in previous reports [18,19].
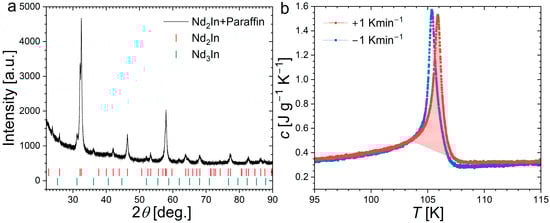
Figure 1.
Panel (a): Powder X-ray diffraction pattern measured at room temperature on Nd2In powder dispersed in paraffin oil. The ticks mark out the reflections corresponding to Nd2In and Nd3In structures. Panel (b): specific heat of Nd2In recorded by a Peltier Cell Differential Scanning Calorimeter upon heating and cooling. The highlighted area corresponds to the integration of the transition entropy change.
Physical properties were recorded using a Quantum Design Versalab cryostat (Quantum Design, San Diego, CA, USA). Magnetization measurements were carried out using a Vibrating Sample Magnetometry option. A homemade thermometry option close to the principle of a Differential Thermal Analyzer was used to record thermograms across the phase transition. This DTA was built by fixing two thermal sensors (one for sample, one for reference) at the extremities of two conic pillars made of PLA on a blank Versalab puck. Sample and reference temperatures were read by using bare chip Cernox sensors (CX-1070-BC-HT, Lake Shore Cryotronics, OH, USA) with a fast response time and limited thermal dilution (sensor mass << sample mass). The sensor resistivity yielding the temperature after calibration was recorded using a built-in Quantum Design Electrical Transport Option, with the same excitation amplitude (1 mA) and different frequencies (15.26 and 21.36 Hz, respectively) for sample and reference channels. Similar sensors and electronics, mounted on a different sample holder, were found to be effective in recording thermal events associated with FOMT. This included capturing fine burst-like features that developed during the transition, as observed in La(Fe,Co,Si)13 giant magnetocaloric materials [32].
Direct ∆Tad measurements were carried out using the DTA hardware by sweeping the magnetic field at a rate of µ0dH/dt = 1.8 Tmin−1 in high-vacuum conditions. For ∆Tad measurements at µ0∆H = 2 T, the initial temperature before field application was reached after a zero-field cooling from the paramagnetic state, and two successive magnetization/demagnetization cycles were recorded. For ∆Tad (µ0∆H = 1 T), only cyclic ΔTad were recorded (no ZFC). The sample for ∆Tad measurement is relatively large (1.101 g) and the thermal exchanges are limited, so that appropriate adiabatic conditions are ensured during the magnetic field change. If a single field application is applied, the subsequent exponential thermal relaxation of ∆Tad to the initial temperature shows a typical relaxation time constant of ~30 min, which is considerably longer than the actual ∆Tad measurement time. The robustness of this ΔTad setup without extraction was confirmed by measuring a Gd reference sample. The resulting ∆Tad = 3.06 K for µ0∆H = 1 T was found to be slightly lower, yet within 4% of direct measurements using rotative magnetic field with µ0dH/dt ≈ 1 Ts−1 on Gd samples of similar purity [33].
Heat capacity measurements were carried out using a Quantum Design heat capacity option equipped with a vertical puck kit. The built-in 2τ analysis is used for measurements between 50 and 200 K and complemented by Single-Pulse Measurements (SPMs) near the Curie temperature [34]. Since Differential Scanning Calorimetry is often considered as the most suitable technique for recording the latent heat of FOMT, a complementary DSc measurement was carried out on Nd2In. Figure 1 presents the measurements carried out near the FOMT using a homemade Peltier cell DSC for a Quantum Design cryostat [32]. The integration of the c/T peak subtracted by a linear background yields a transition entropy change of 10.9 J kg−1 K−1.
Dilatometry measurements were carried out using a homemade strain gauge option. ZEMIC BAB-120-3AA250(11) (Xi’an, China) strain gauges were bonded with H-610 epoxy on a polished 9 × 9 × 5 mm3 bulk piece of Nd2In and a fused silica reference sample. A Keithley 2400 source meter unit was used for the voltage excitation of the Wheatstone bridge and a Keithley 2182A nanovoltmeter was employed to record the output voltage signal; both were controlled via a 2018LabVIEW interface (Tektronix, OR, USA). Prior to the measurement, a Cu metal reference (Puratronic, 99.999%, Alfa Aesar, MA, USA) was measured by using gauges originating from the same batch (and the same glue). At T = 293 K, the measured linear thermal expansion for the cupper, 16.8 ppmK−1, was in line with the expected value and over the whole temperature range (50–350 K), deviations from the NIST reference values did not exceed 2.5%.
3. Results
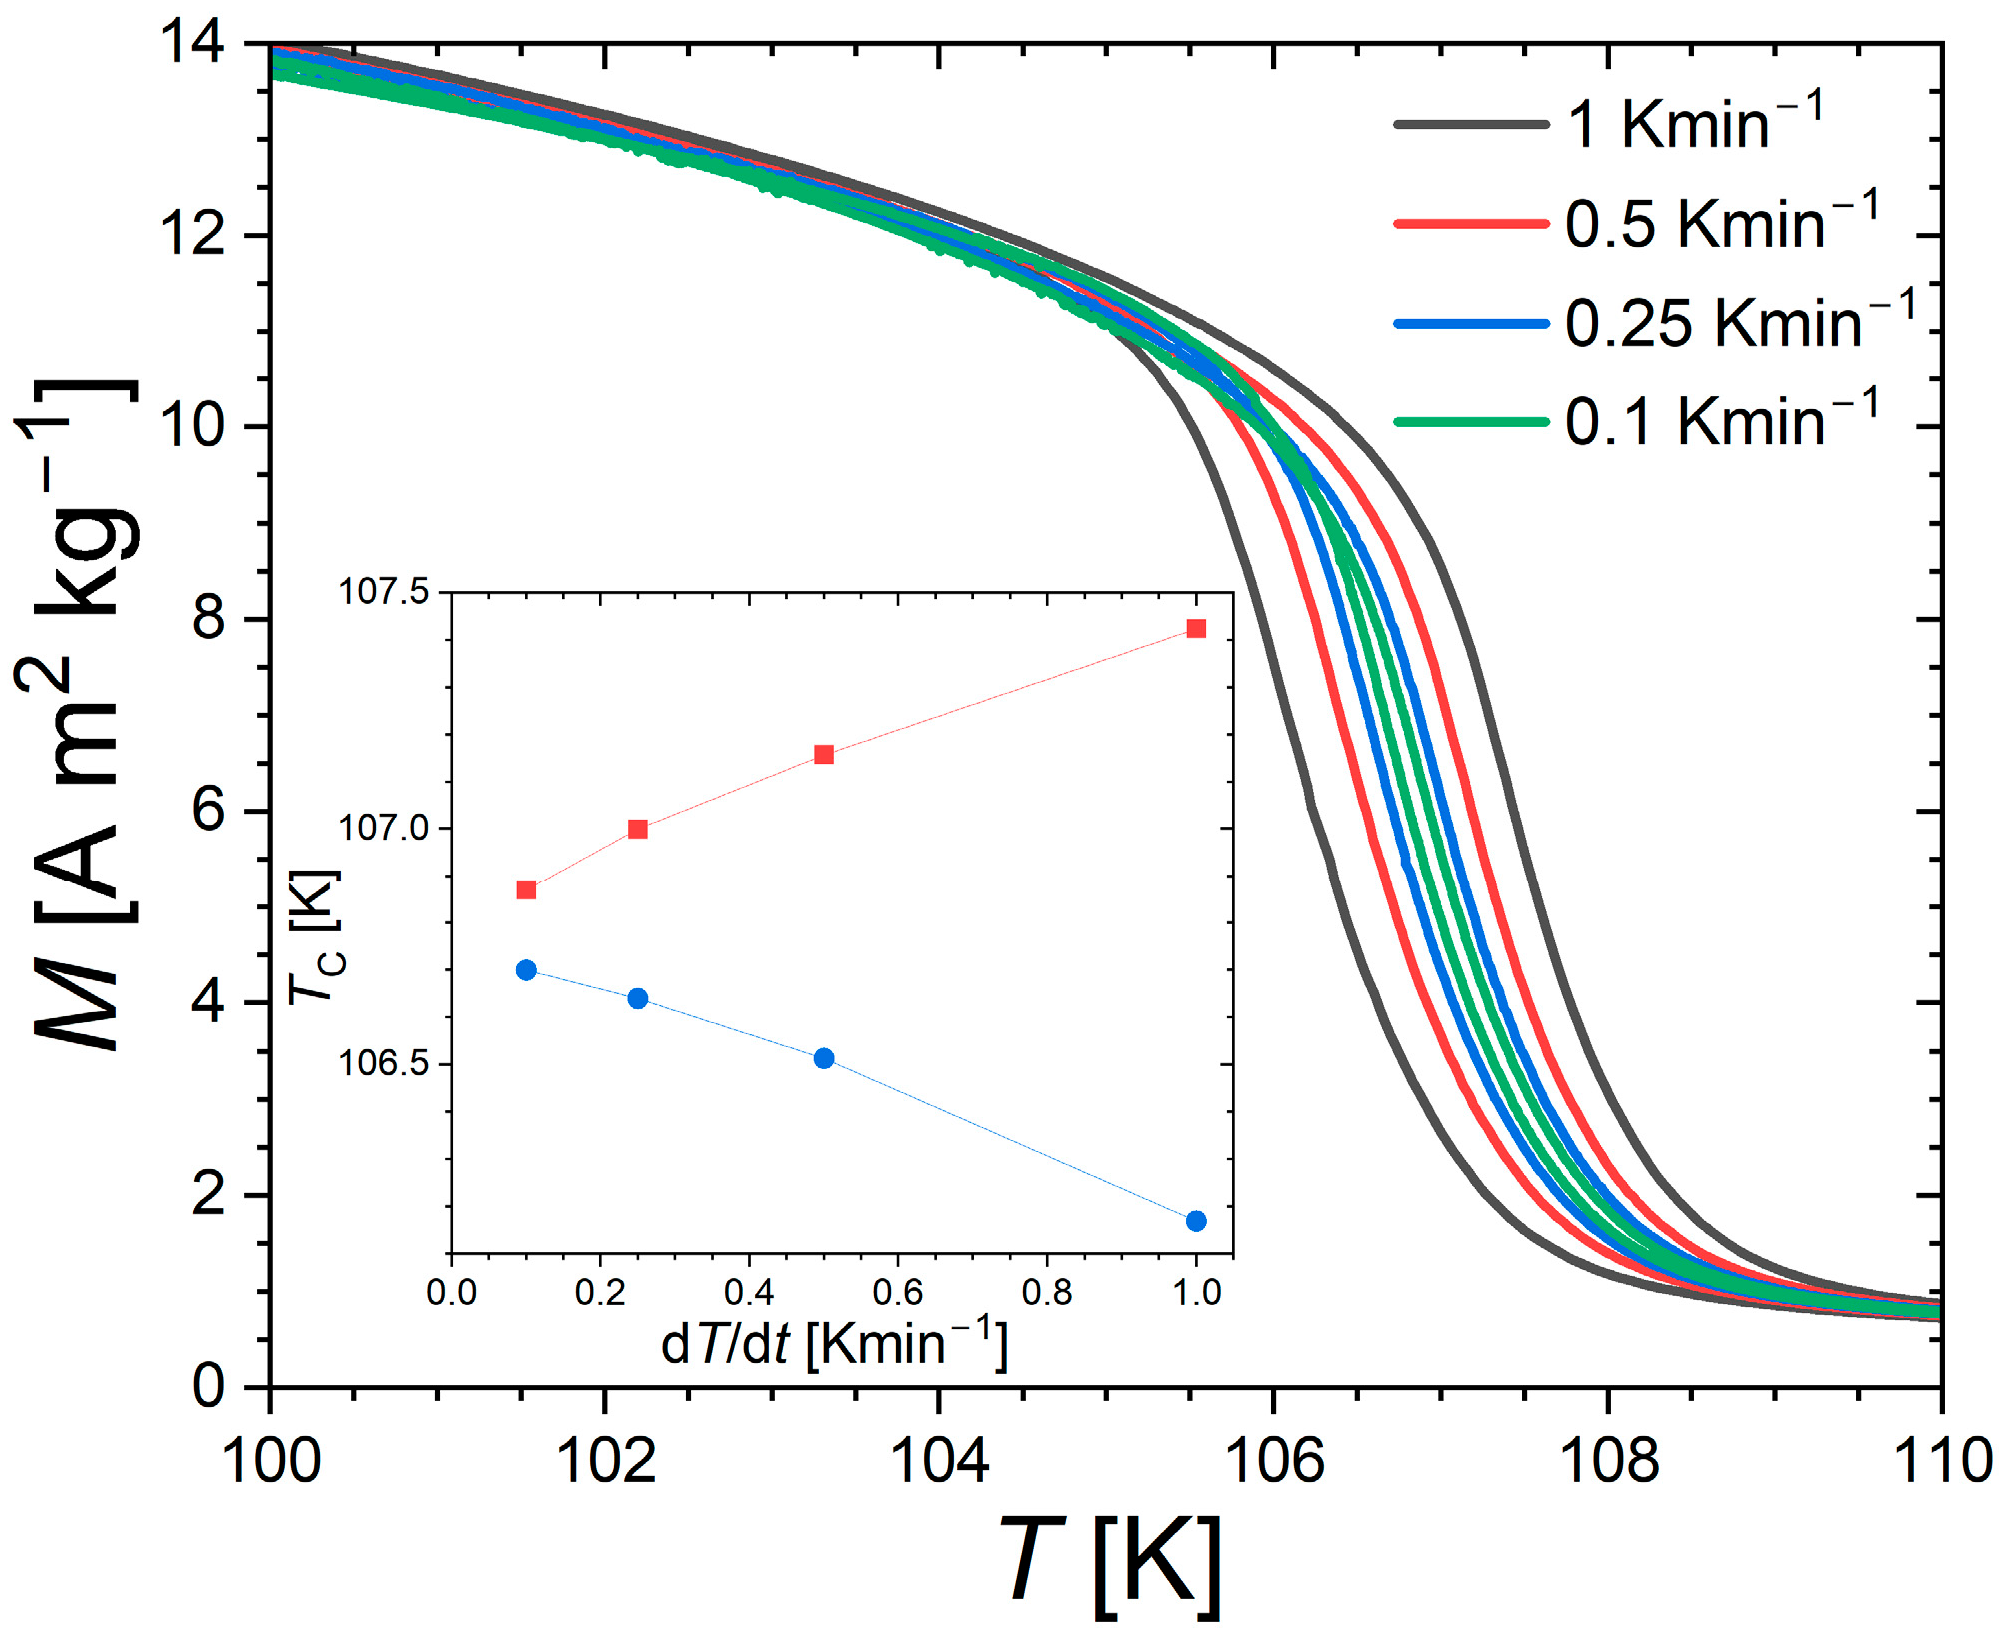
Figure 2 presents magnetization measurements as a function of the temperature near the Curie temperature of Nd2In. In line with former reports [4,5,17,18,19], a relatively sharp drop in magnetization is observed at about 108 K. As the present study is devoted to the main ferromagnetic transition in Nd2In, the comparatively minor magnetic anomaly usually observed at lower temperature is not investigated (spin reorientation transition near ~50 K) [17,18,19]. At the ferro–paramagnetic transition, a finite thermal hysteresis is observed between measurement upon heating and cooling. However, this dataset, recorded at different sweeping rates, successfully illustrates the difficulty of separating the intrinsic thermal hysteresis of the phase transition from the thermal lag inherent to dynamic measurements. At the lowest rate (0.1 Kmin−1), a finite thermal hysteresis δThyst ≈ 0.18 K is observed. This value turns out comparable with the exceptionally small hysteresis δThyst ≈ 0.1 K at the first-order ferromagnetic transition of Eu2In [13] and one order of magnitude smaller than typically observed in archetypical giant magnetocaloric materials with optimized hysteresis, such as La(Fe,Si)13 or MnFe(P,Si) [35,36,37].
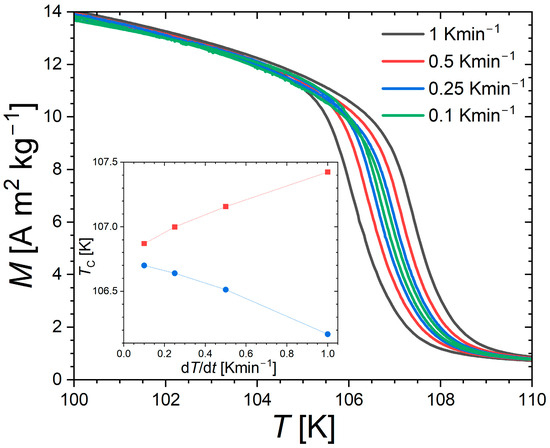
Figure 2.
Temperature dependence of the magnetization in µ0H = 0.1 T recorded at different sweeping rates upon heating and cooling. In the inset, transition temperatures are shown upon heating (squares) and cooling (circles). The transition temperatures were determined as the maxima on derivative |dM/dT| curves.
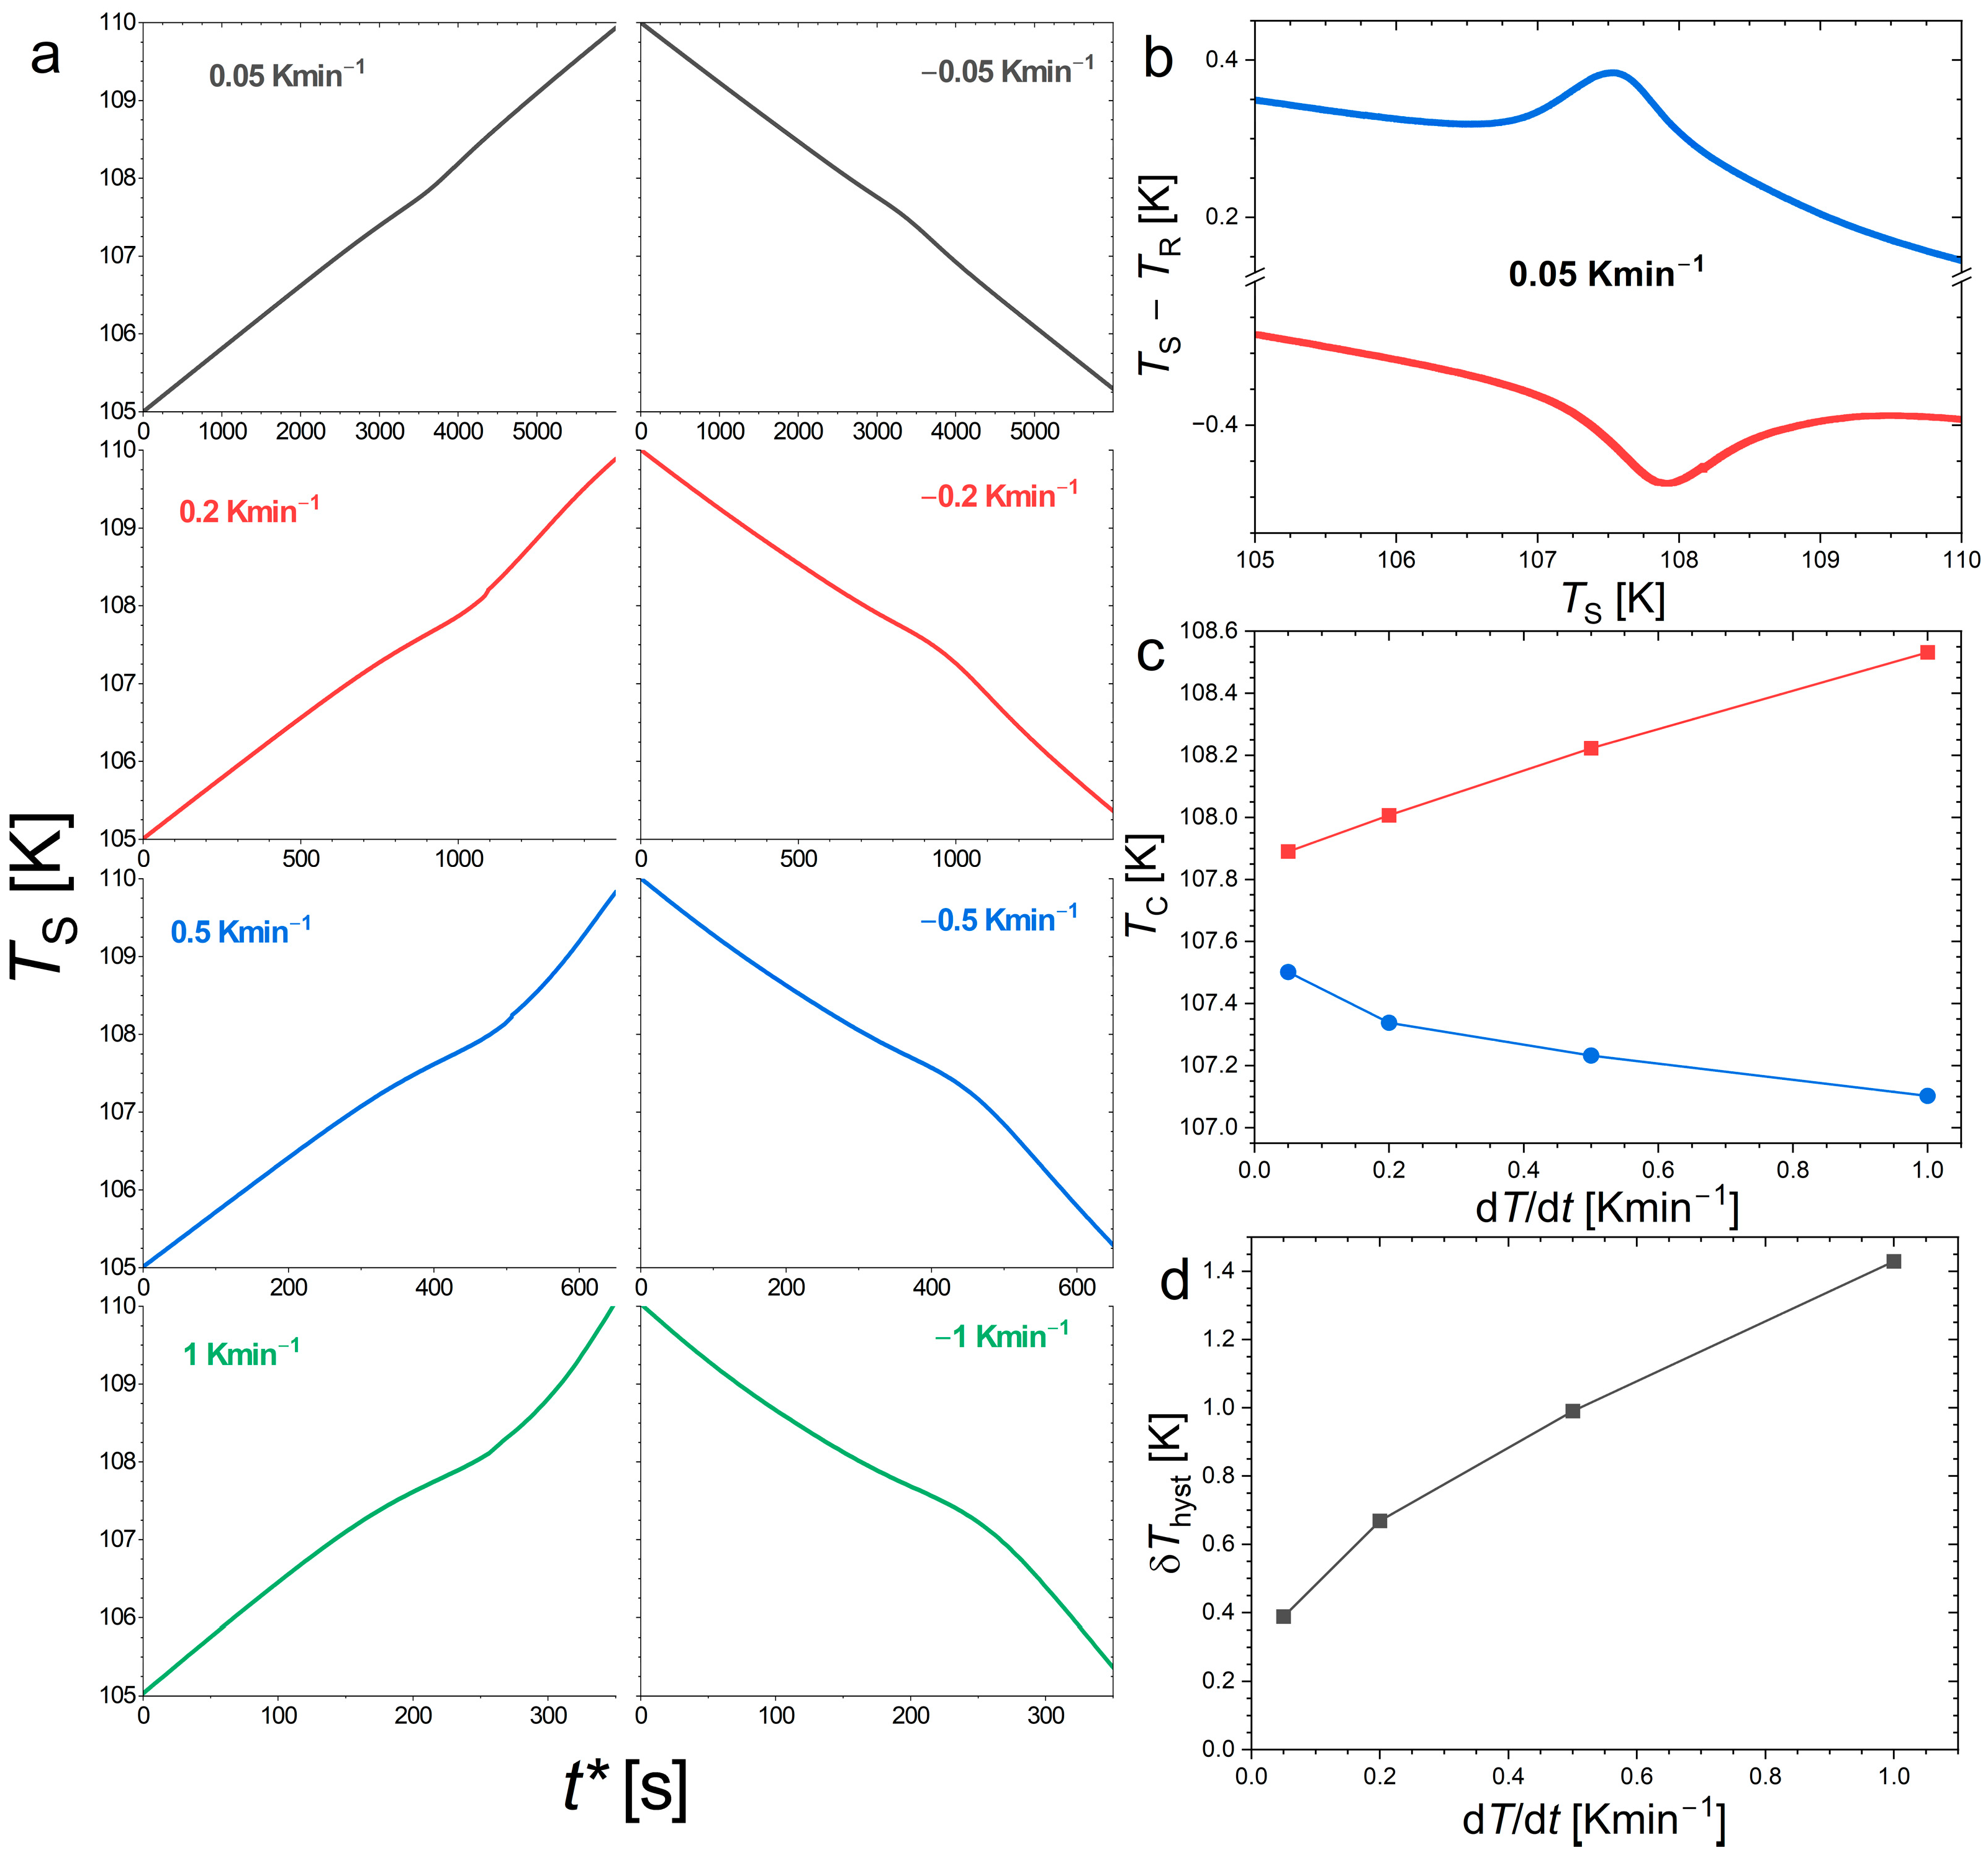
Unfortunately, magnetic data achieved with finer control of the temperature—for instance, by stabilizing the temperature at each temperature point—would not yield a more accurate estimate of the hysteresis. Typically, during the thermalization to a new temperature, the cryostat stabilizes through decaying thermal oscillations around the target temperature. If the amplitude of these oscillations is on par with the thermal hysteresis, the thermomagnetic history of the sample can no longer be tracked. Different measurement protocols, particularly different sweeping rates, are likely responsible for the scatter in the reported thermal hysteresis values for Nd2In [17,18,19]. To obtain a more reliable estimate of δThyst, we turned to methods which involved taking a direct reading of the actual sample temperature during the measurements. For instance, DTA is one of the most traditional methods for detecting phase transitions. Figure 3 presents DTA thermograms at different sweeping rates in Nd2In. A thermal anomaly marks out the ferromagnetic transition near 108 K, but it corresponds to a relatively broad feature, without a clear plateau of constant temperature expected due to the latent heat of a first-order transition. Yet, the DTA vs. T curves still correspond to a notable peak. Even if the thermal sensor is connected (by using grease) to the sample, measurements at different rates allow a progressive dynamic contribution to appear. The smallest measured hysteresis is δThyst ≈ 0.38 K, which extrapolates to the range 0.4–0.2 K for static conditions.
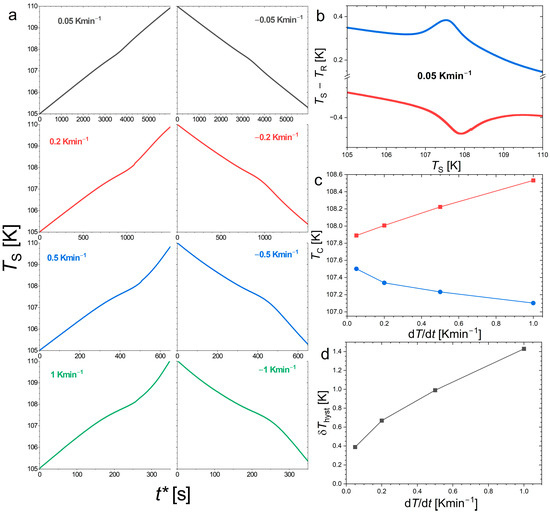
Figure 3.
Thermal measurements carried out at different sweeping rates at the ferromagnetic transition of Nd2In. (a) Sample temperature (TS) thermograms recorded in DTA upon heating (left) and cooling (right), with the time axis presented as t* = t − t (T = 105 K) and t* = t − t (T = 110 K), respectively. (b) DTA signal at the slowest sweeping rate of ±0.05 Kmin−1 upon heating (bottom) and cooling (top). (c) Transition temperature upon heating (squares) and cooling (circles) determined as dT/dt minima on the thermograms. (d) Thermal hysteresis determined from the difference in transition temperatures.
If DTA is well suited to detecting phase transitions while offering a broad dynamical range, it provides only a limited accuracy for quantitative analysis. Specific heat measurements were therefore carried out by using the standard analysis of the heat capacity option of a Quantum Design cryostat from 50 to 200 K in various magnetic fields and complemented by the Single-Pulse Method (SPM) near the Curie temperature. SPM involves applying large heat pulses to fully cross the transition, and it offers a better temperature incrementation, allows the separation of heating and cooling branches, and allow us to overcome the limitations of the built-in 2τ method [34,38,39,40].
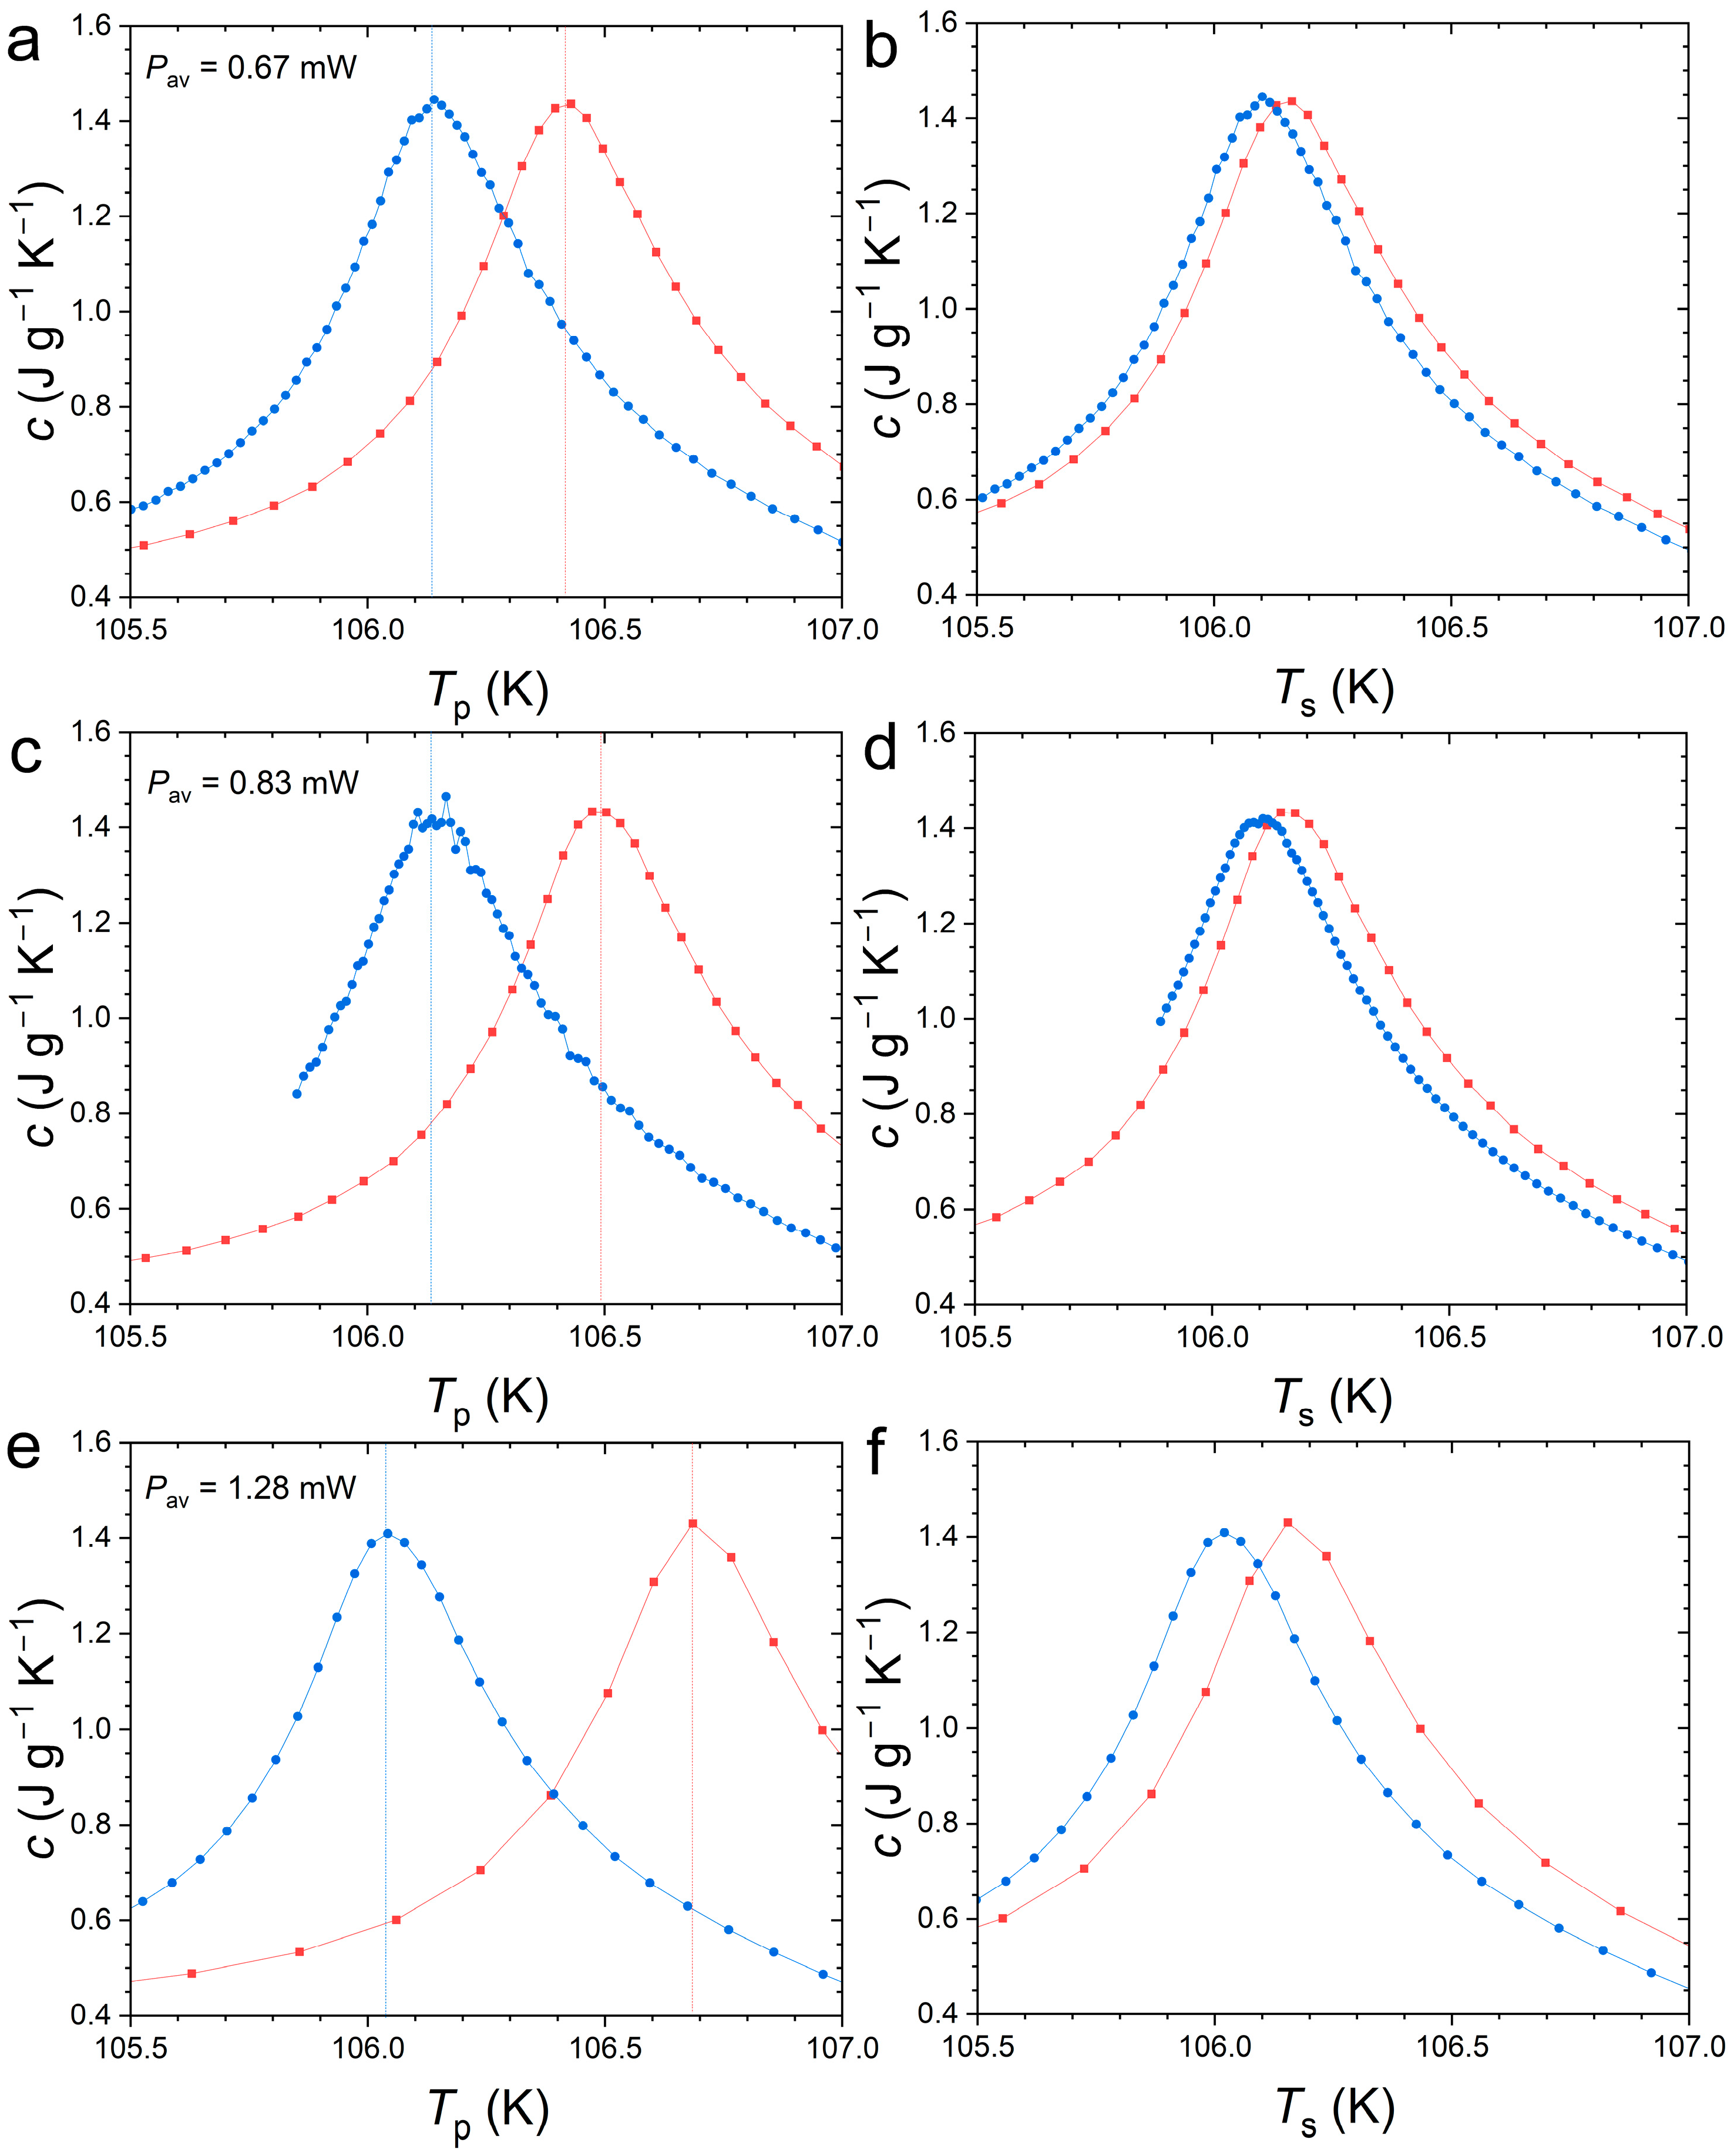
Figure 4 presents the specific heat peak measured by SPM at the Curie temperature of Nd2In. First, one can note that the thermal anomaly associated with the FOMT is relatively successfully captured by the SPM method, as it yields a peak maximum of ~1.5 J g−1 K−1 comparable to DSC measurements presented in Figure 1. We also observe that the peak marking the transition is rather symmetric. A Gaussian distribution of latent heat centered on the transition temperature is typical of first-order transitions and contrasts with the lambda-like anomaly of second-order transitions. The improved temperature resolution offered by SPM allows us to accurately describe the specific heat event, which may explain the difference compared to the original report on Nd2In concluding on a lambda-like anomaly [15]. When analyzed in a 1τ model considering the sample and platform as a single system in perfect thermal contact, the specific heat is expressed as a function of the platform temperature (TP). By selecting a different bath temperature (T0) and targeted pulse temperature range, different amounts of heat power can be applied. Increased heat power leads to a faster crossing of the transition and also results in an apparent increase in thermal hysteresis between the peak upon heating and cooling as a function of TP, corresponding to δThyst in the range 0.29 to 0.64 K for the explored SPM parameters.
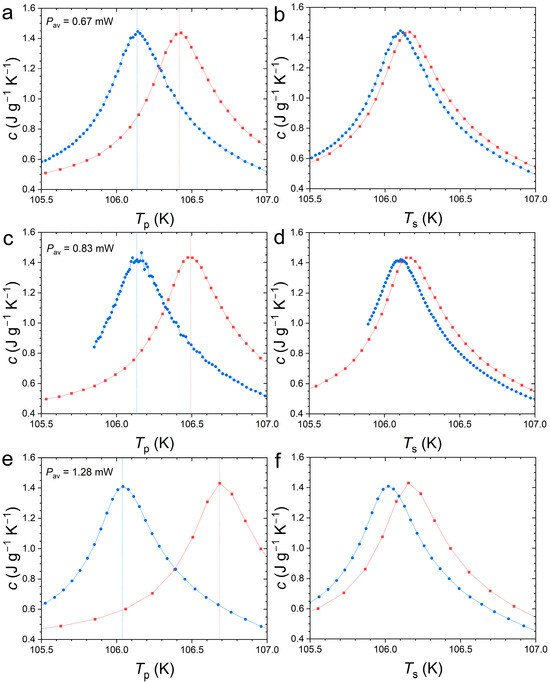
Figure 4.
Specific heat for Nd2In in H = 0 determined by the Single-Pulse Method using different heating powers upon heating (squares) and cooling (circles). (a,c,e), raw data presented as a function of the platform temperature (Tp); (b,d,f) corresponding data corrected for thermal lags (as a function of the sample temperature (TS)).
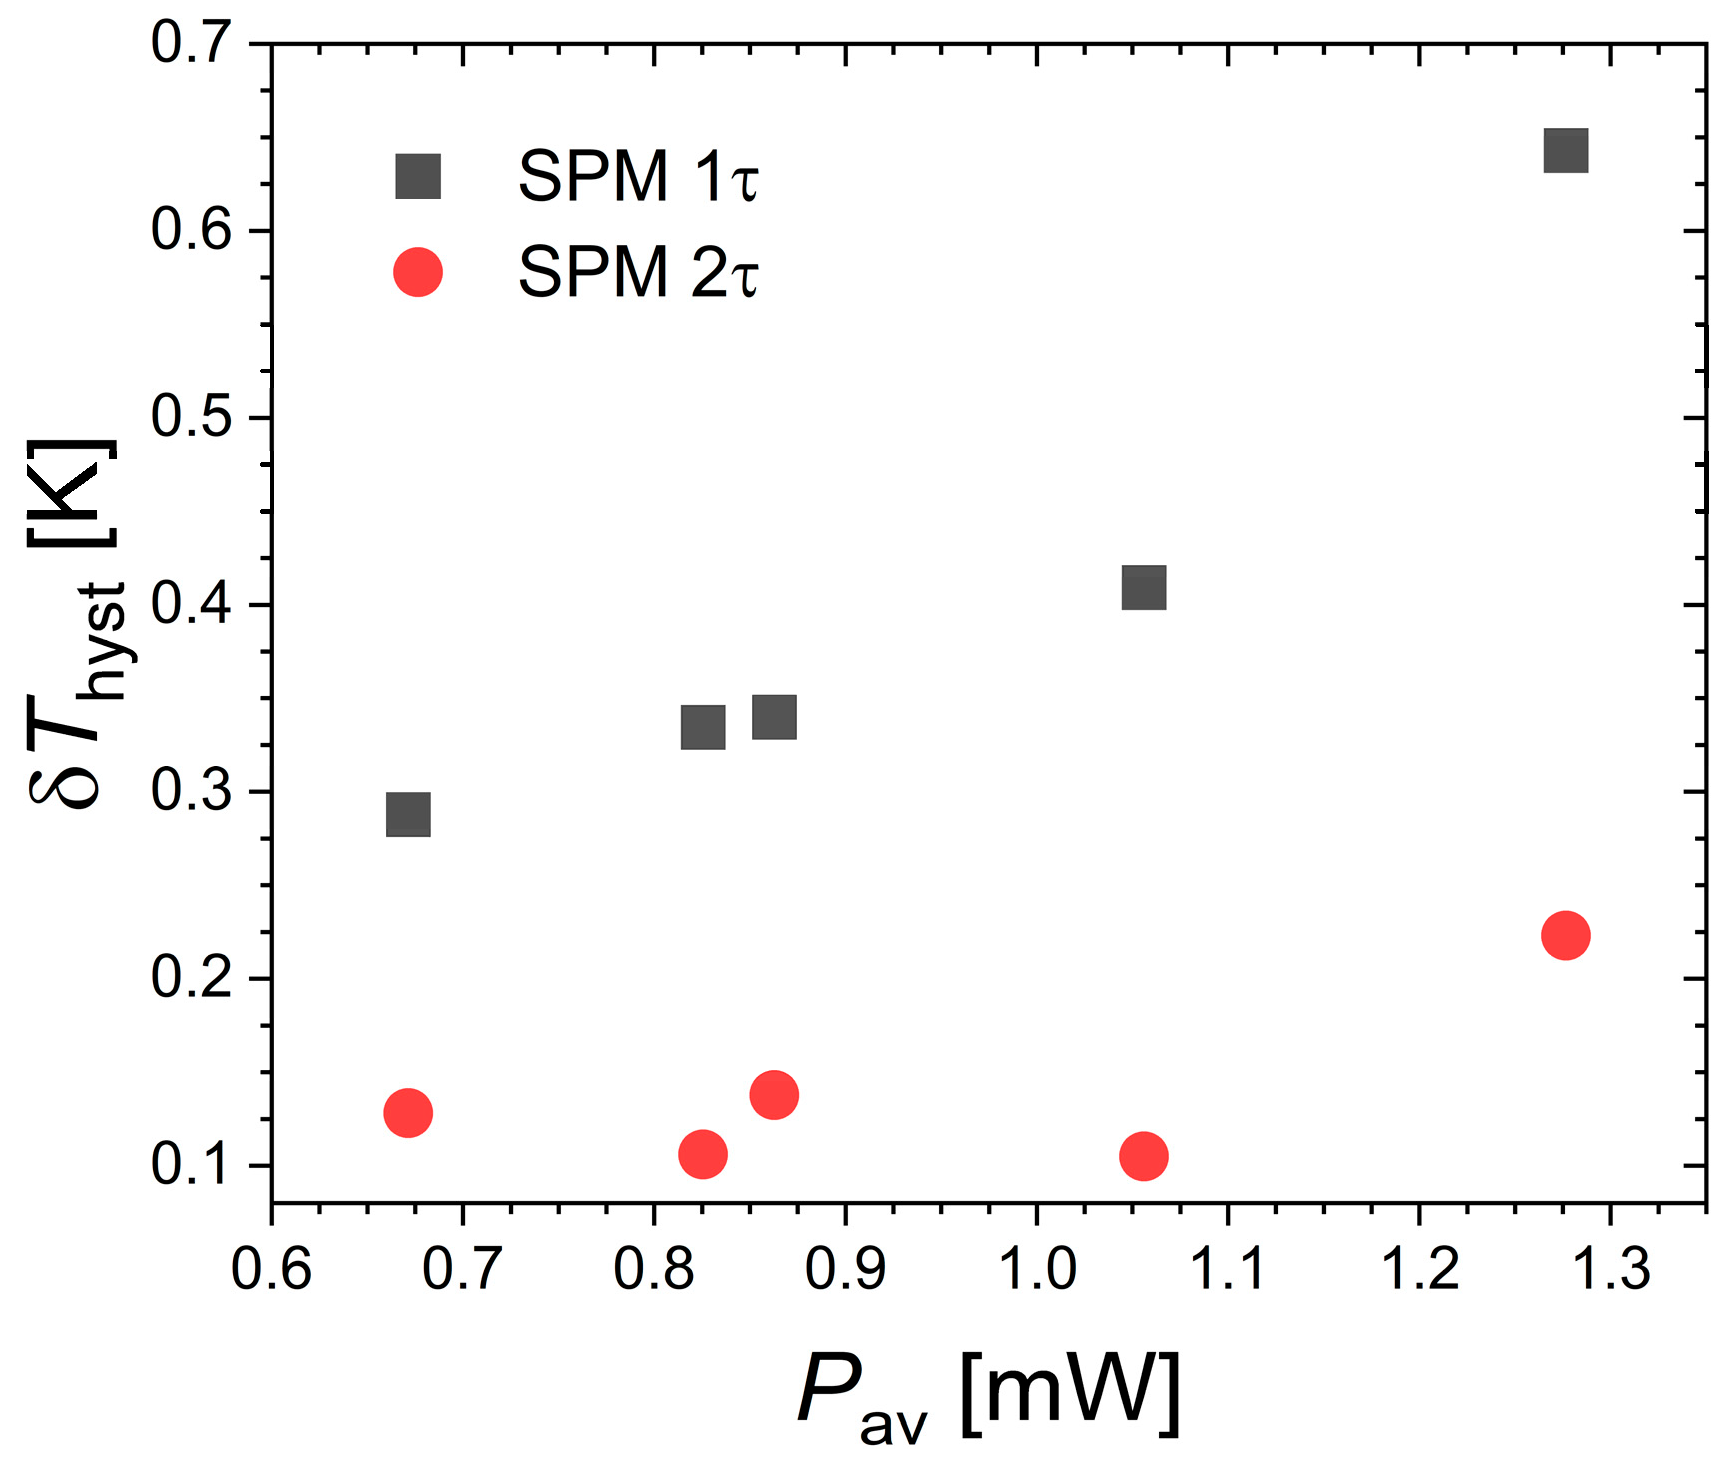
The increase in δThyst with the applied heat again illustrates the difficulty of estimating the thermal hysteresis even in experimental setups in which the thermometer is in contact with the sample. To take into account the thermal lag between sample (TS) and platform (TP) temperatures, one has to involve a second heat balance which accounts for a finite conductance of the grease [34,38,39,40]. The thermal lag can be estimated using the grease Kg and wire Kw conductance determined by extrapolation of the 2τ fittings before and after the transition. Figure 4 illustrates the difference between the raw data as a function TP and the corrected data vs. TS and Figure 5 summarizes δThys from the peak maxima for the different pulses. Correcting for thermal lags leads to a reduced, yet non-vanishing, hysteresis of 0.1 to 0.2 K. However, the thermal lag correction, and therefore hysteresis, is highly sensitive to the estimation of Kg, which is a parameter that is indirectly estimated. Unfortunately, independently measuring or calibrating Kg is challenging as it depends on the amount of grease and the sample positioning, both of which are difficult to reproduce between different measurements. It should be noted here that a reduction in Kg by 40% would be required to cancel out the hysteresis, which at first glance seems rather unlikely.
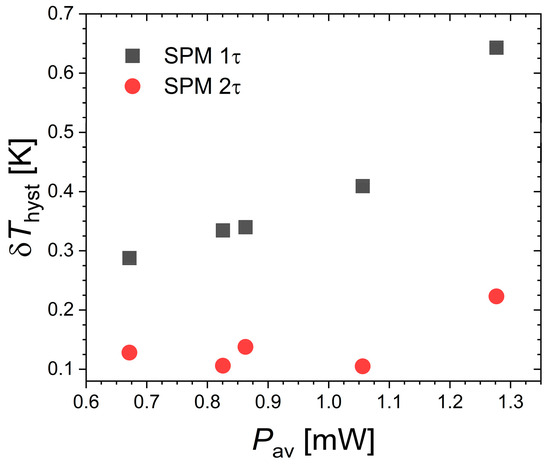
Figure 5.
Thermal hysteresis at the ferromagnetic transition of Nd2In determined by specific heat (SPM) in H = 0 within 1τ and 2τ thermal models.
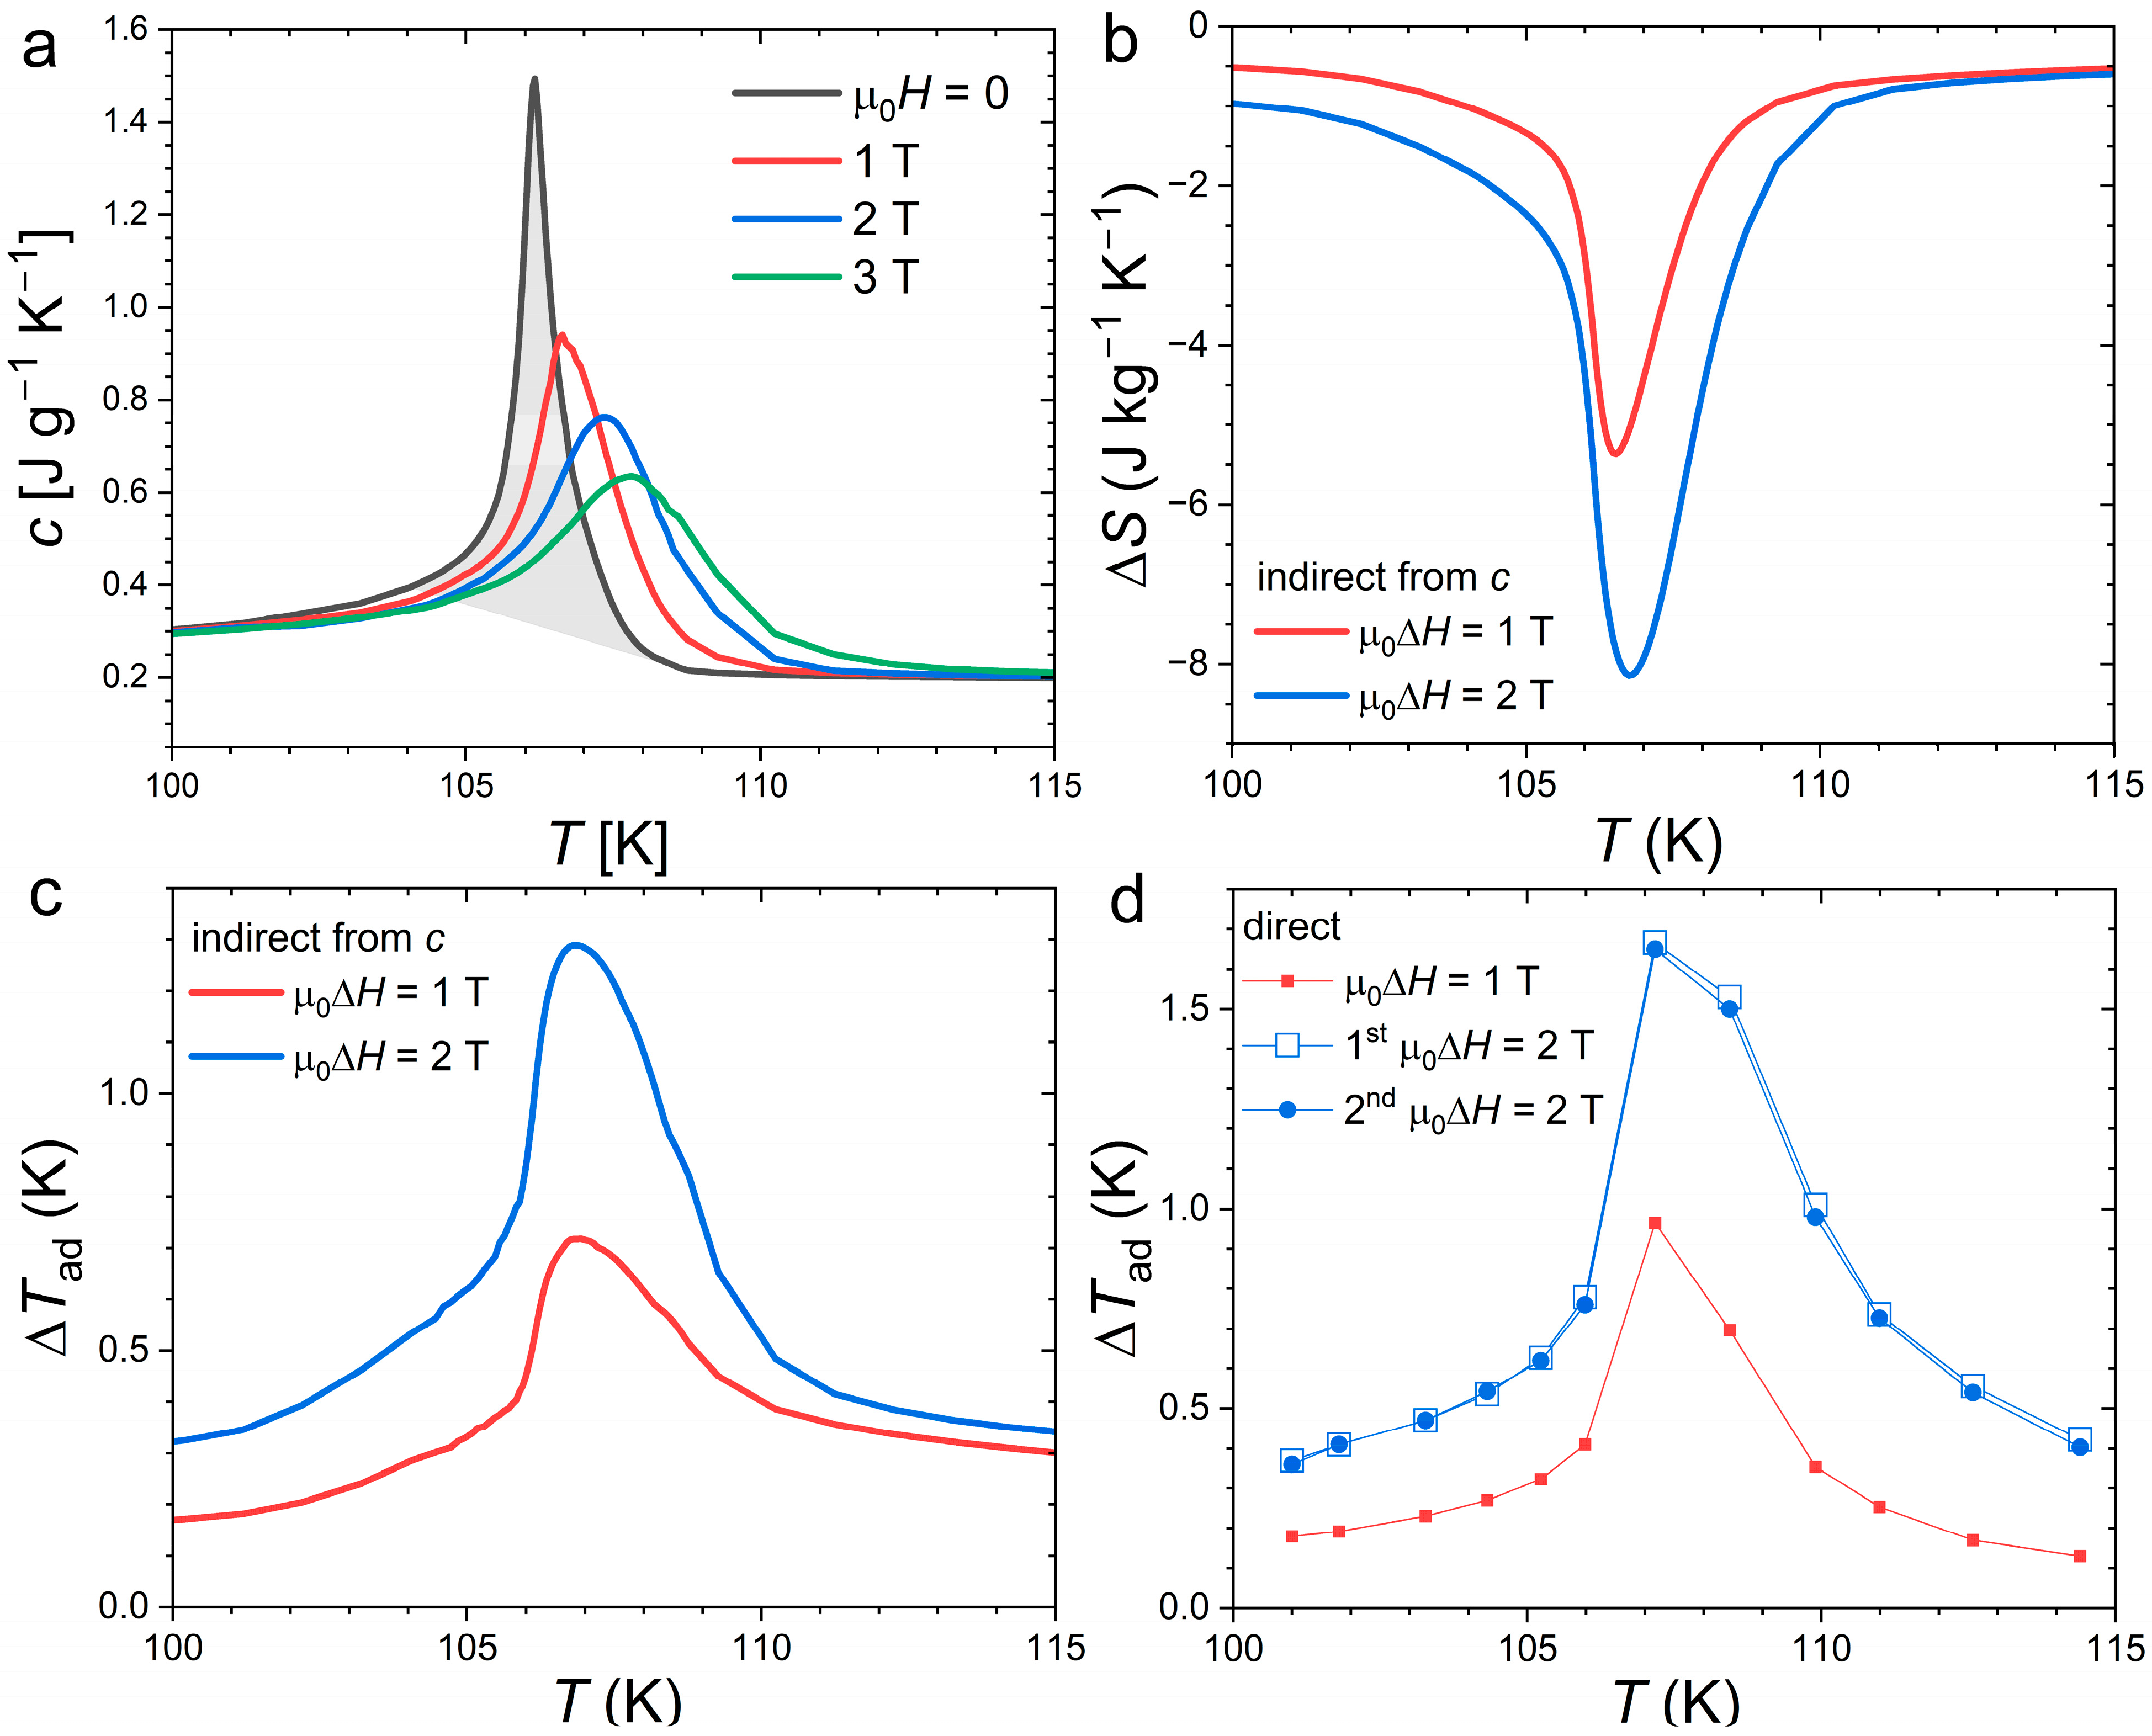
Figure 6 presents measurements of the specific heat in applied magnetic fields and the corresponding determination of the magnetocaloric effect as well as a comparison with direct ΔTad measurements. The transition entropy change was estimated by integration of the specific heat using a linear background yielding a value 10.8 J kg−1 K−1. A comparable estimate (10.9 J kg−1 K−1) was obtained using DSC data, as shown in Figure 1, which confirms the reliability of the present specific heat data even at the FOMT. In addition to measurement techniques, estimating the transition entropy is actually made tricky by the selection of the starting and end points of the transition. Here, even when considering a temperature window of 4 K, which is relatively large with regard to the ~0.7 K full width at half maximum of the peak, the ΔStr in Nd2In appears thrice smaller than that found in orthorhombic Eu2In (ΔStr ≈ 27.5 J kg−1 K−1 [13]) indicating a significantly weaker FOMT.
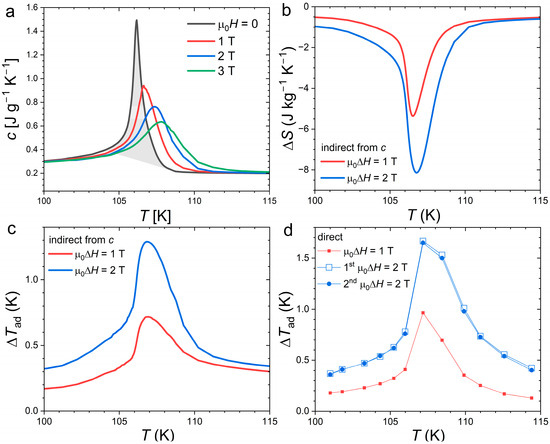
Figure 6.
Specific heat and magnetocaloric effect of Nd2In. (a) Specific heat as a function of the temperature in zero and for different magnetic fields (built-in 2τ analysis outside the transition complemented by SPM at TC). The shaded area illustrates the transition entropy (ΔStr). (b) Isothermal entropy changes (ΔS) and (c) adiabatic temperature changes (ΔTad) indirectly calculated from specific heat data. (d) ΔTad from direct measurements. For 2 T, the first measurement after a zero-field cooling and subsequent cycle are presented.
The application of a magnetic field yields a pronounced broadening of the specific heat peak, which highlights the relatively weak character of the FOMT in comparison to strong latent heat system for which the peak intensity is more robust upon high field application. The shift in the transition due to the field estimated from the specific heat maxima in different fields is linear and yields a relatively modest . The isothermal entropy change indirectly derived from calorimetry data corresponds to a maximum of −8.2 J kg−1 K−1 for µ0ΔH = 2 T, well within the range of previously reported values (from −7.42 to −13 J kg−1 K−1 [17,18,19]). The adiabatic temperature change was estimated by indirect specific heat measurements at 1.3 K for 2 T. Similarly to ΔS, the ΔTad performances are found to be intermediate among the previously reported results [17,18,19].
More specific to our study, we performed direct ∆Tad measurements at the first magnetization after zero field cooling and upon further demagnetizing/magnetization cycles. The differences between the first and second magnetizing measurements turned out to be insignificant (differences of 0.03 K or less), demonstrating that the MCE is nearly fully reversible upon cycling, even at an intermediate applied magnetic field of 2 T. The ΔTad from direct measurement reaches 1.68 K for 2 T, which is apparently larger than that found from indirect measurements. The difference may originate from the uncertainty of each technique. In particular, the indirect method suffers from several possible sources of error, such as underestimating the latent heat, cumulative errors during the entropy integration, and starting the integration from a temperature different from 0 [41,42].
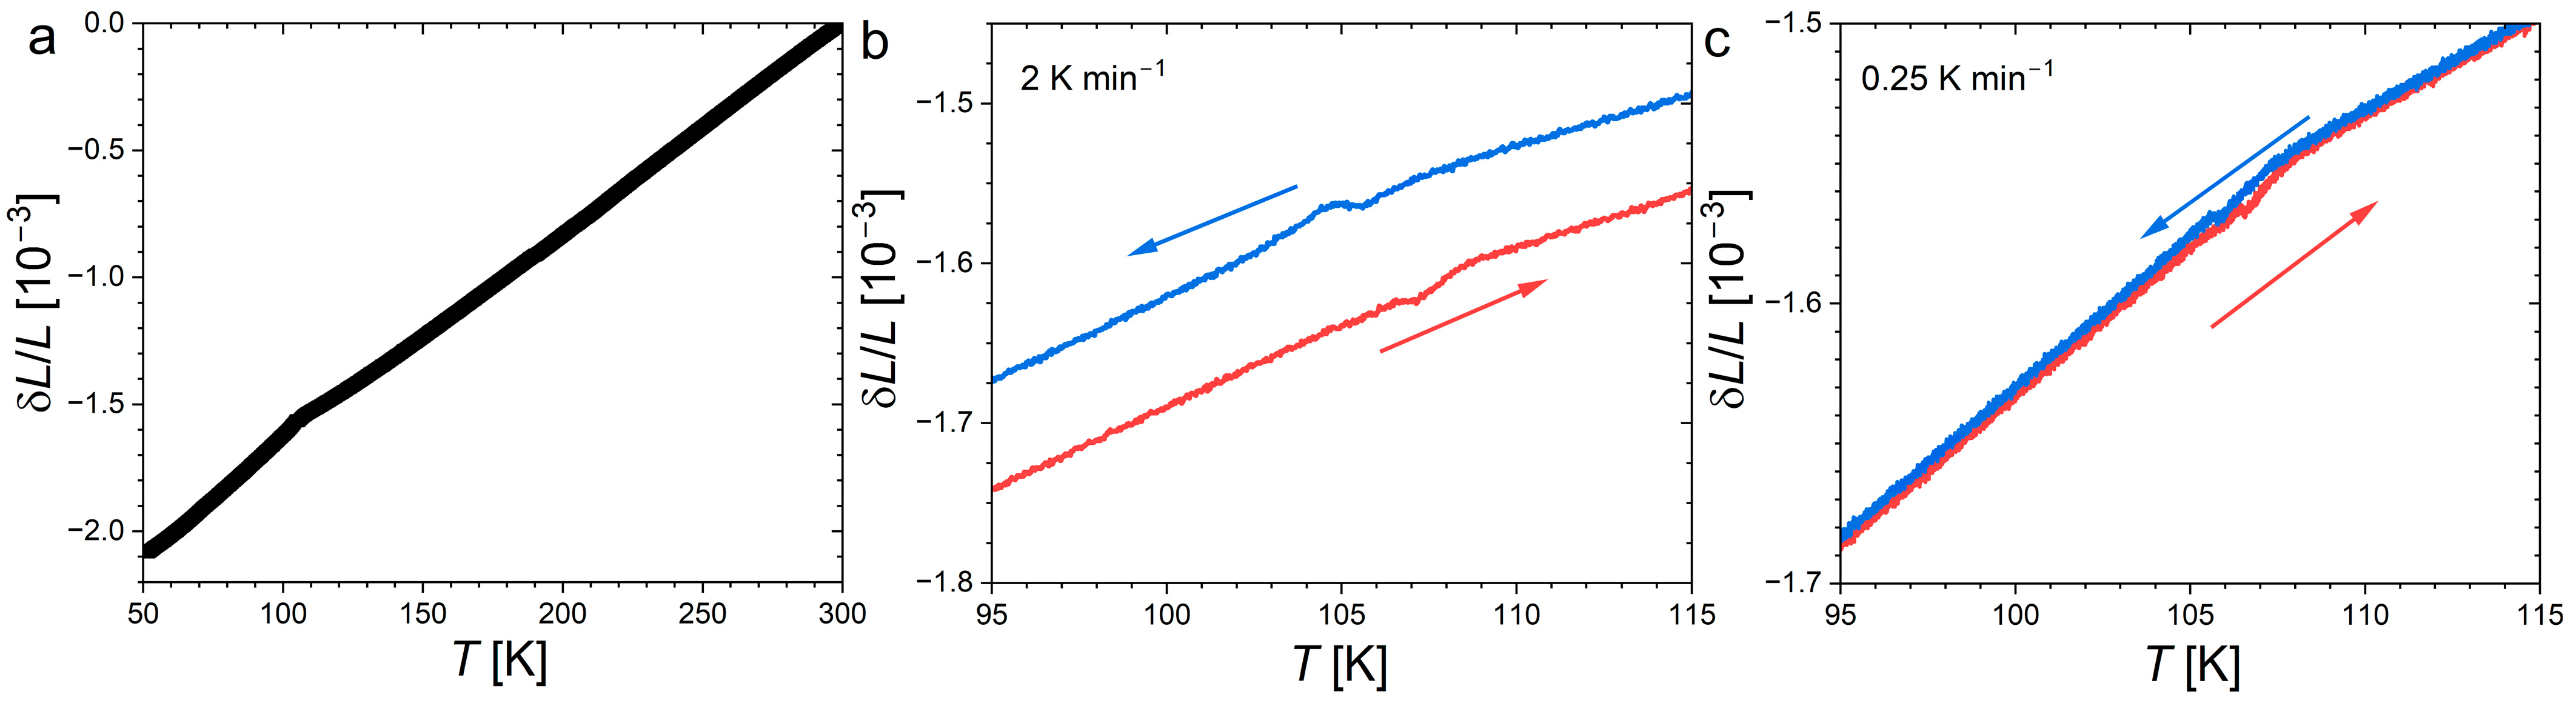
Thermal expansion and magnetostriction of Nd2In are presented in Figure 7 and Figure 8, respectively. In line with former dilatometry or temperature-dependent XRD experiments [17,18,19], the ferromagnetic transition does not correspond to a significant discontinuity, but is fingerprinted by the appearance of a negative spontaneous magnetostriction. The absence of marked anomaly contrasts with the large volume or cell parameter changes usually observed at the FOMT of giant MCE materials. In the paramagnetic state, above 150 K, the thermal expansion αL ≈ 8.5 ppmK−1 is rather linear and is in line with that observed from powder XRD, αV ≈ 28 ppmK−1 [19]. Below TC, the linear expansion is larger and amounts to αL ≈ 9.8 ppmK−1.
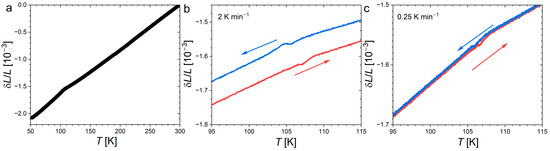
Figure 7.
(a) Linear thermal expansion of Nd2In in H = 0. Enlargement on the ferromagnetic transition; (b,c) measurements at 2 Kmin−1 and 0.25 Kmin−1, respectively. The arrows indicate the heating/cooling directions.
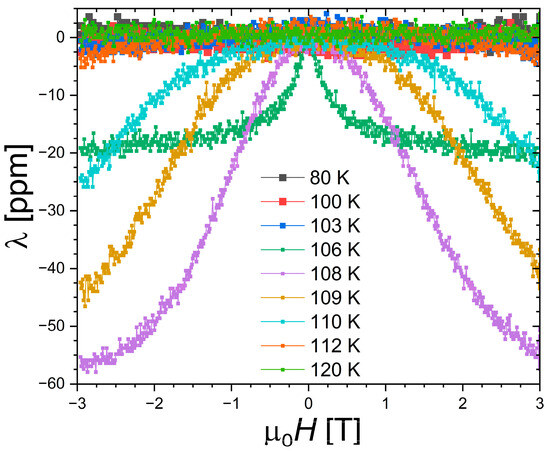
Figure 8.
Longitudinal magnetostriction for Nd2In measured at different temperatures.
A close inspection of the thermal expansion near the ferromagnetic transition reveals a small bump and a finite thermal hysteresis. Both features are strongly suppressed by reducing the sweeping rate, suggesting they mainly originate from sample thermalization. At the slowest rate of 0.25 Kmin−1, a thermal hysteresis of δThyst ≈ 0.4 K is observed.
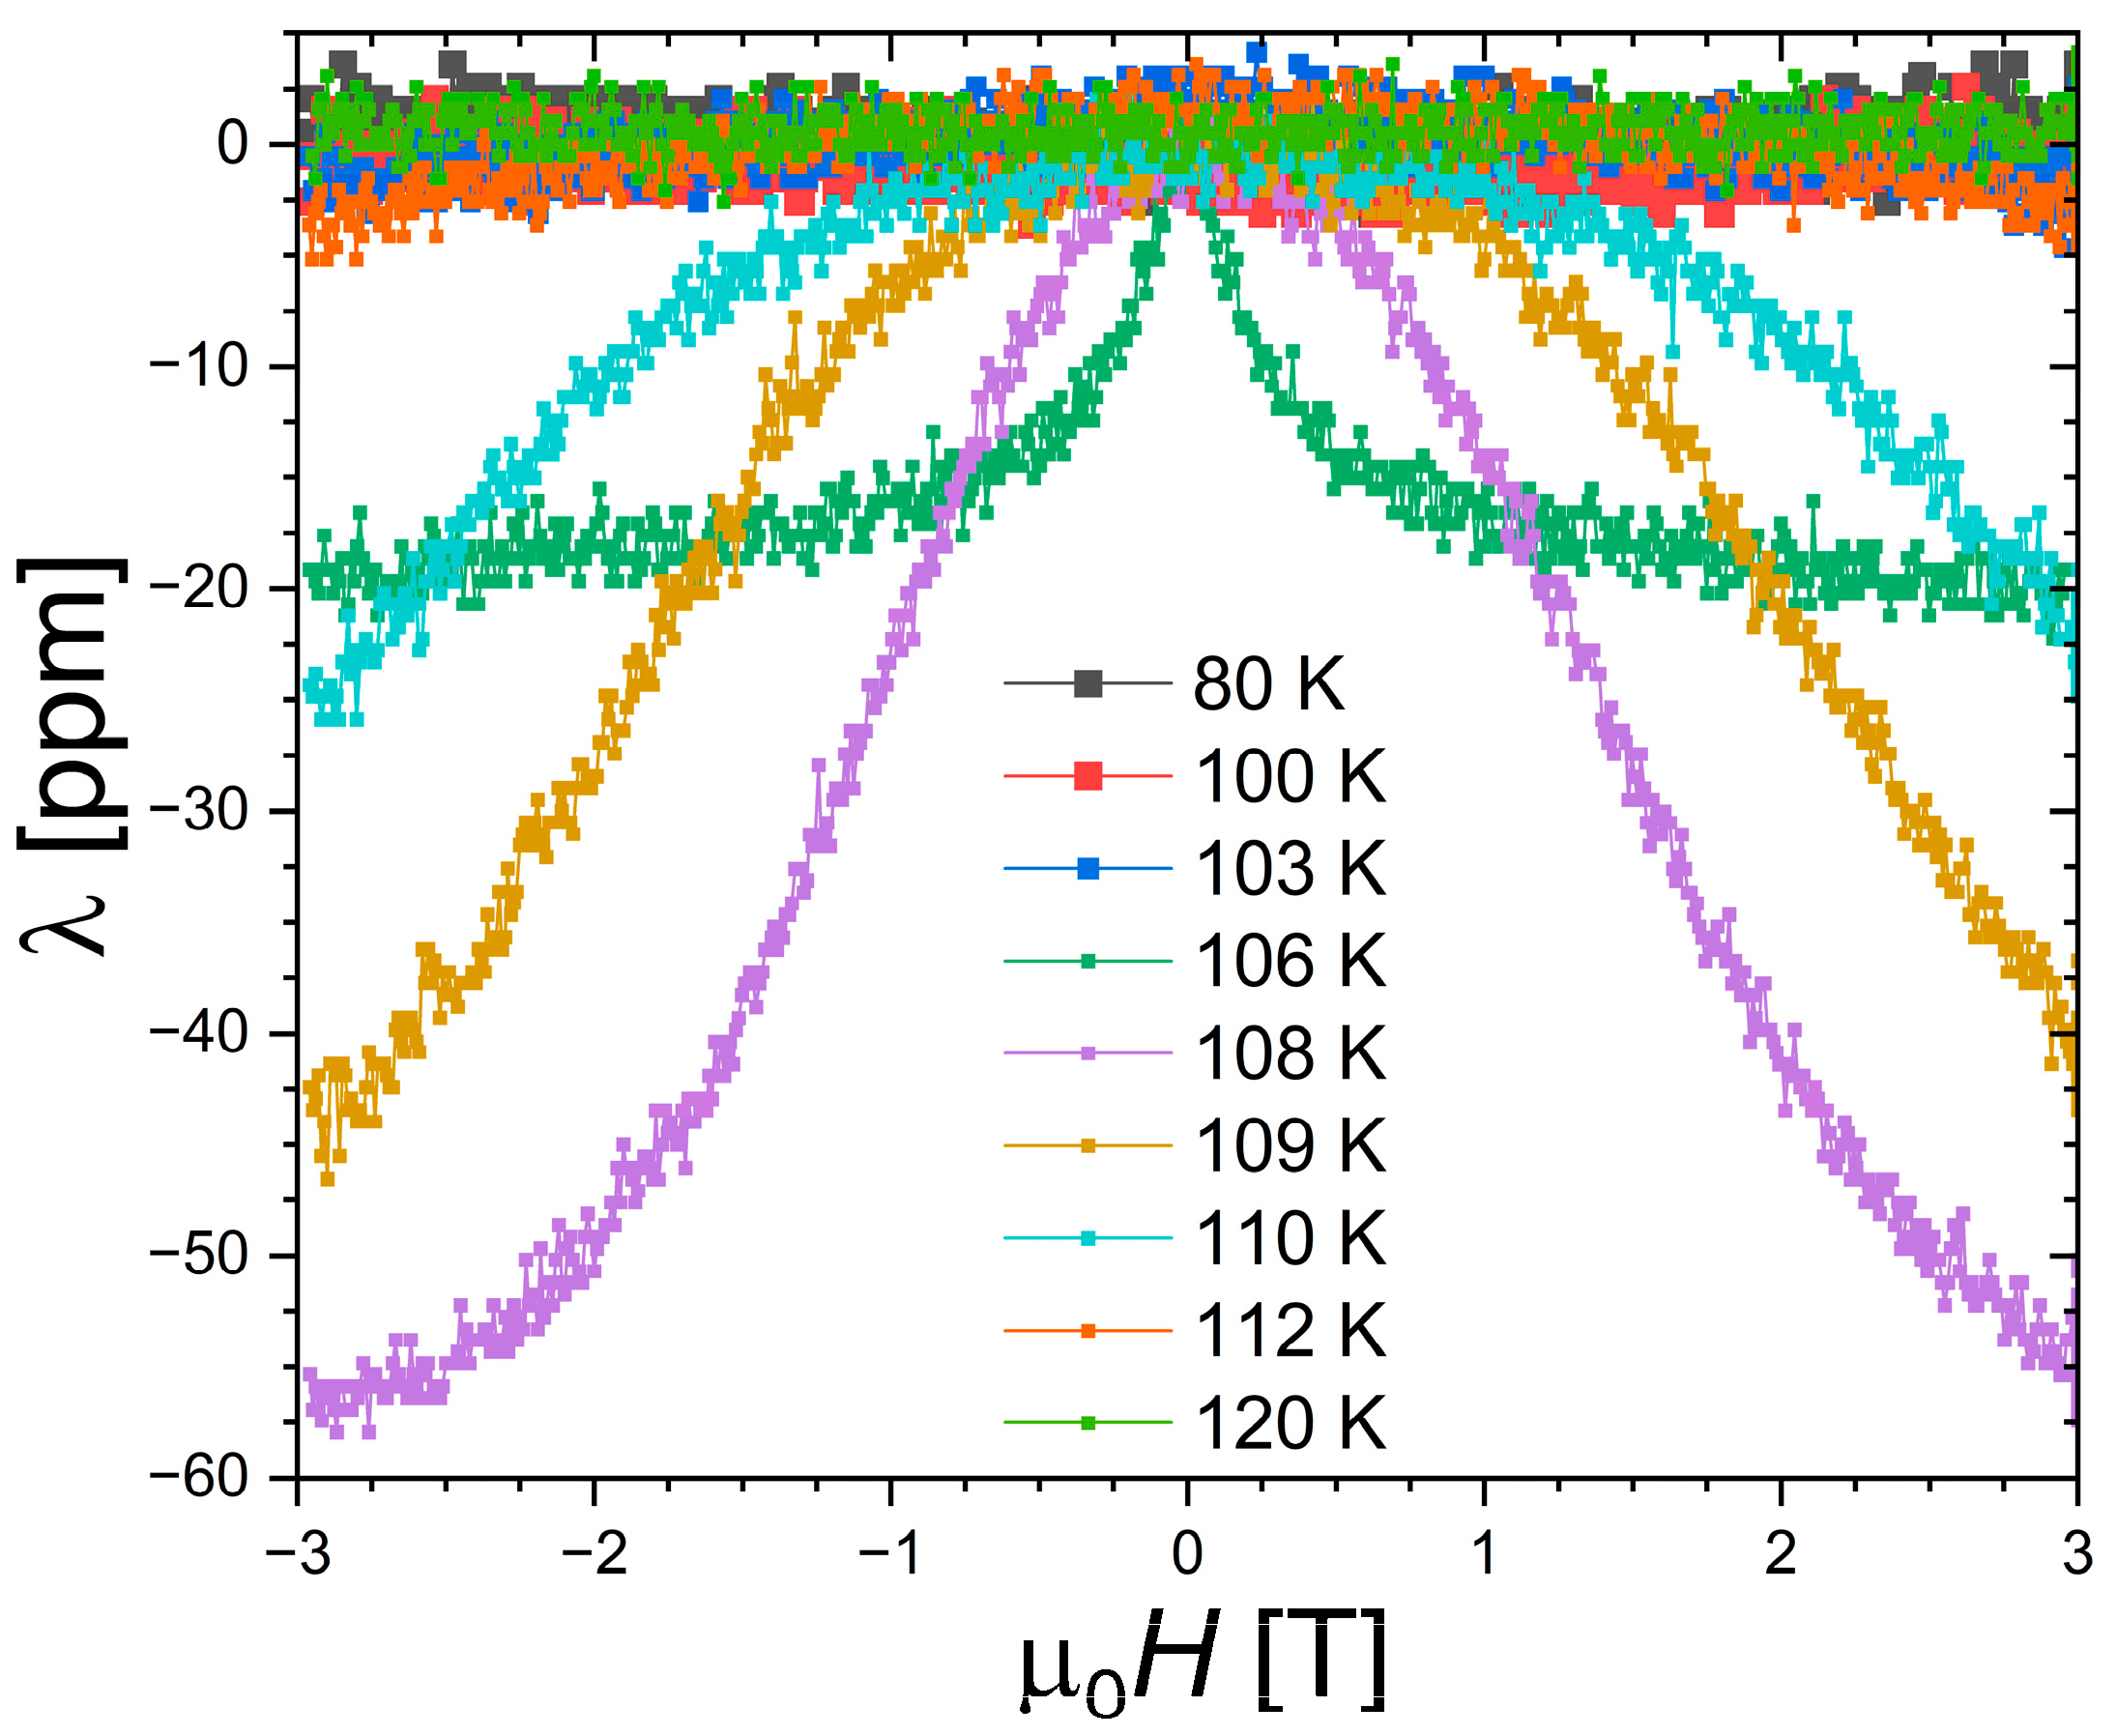
Longitudinal magnetostriction measurements were carried out at selected temperatures, below, at, and above the ferromagnetic transition. In the ferromagnetic state, the forced magnetostriction is small (≈2 ppm for 3 T at 80 K). A finite negative longitudinal magnetostriction appears near the phase transition, with an S-shape just above TC, mimicking the magnetization of a field-induced FOMTs. This magnetostriction quickly vanishes when the temperature is raised (or requires significantly larger magnetic field to be induced), and become negligible (≤1 ppm) in the paramagnetic state above 120 K. Qualitatively, the presently observed temperature dependence of the magnetostriction is in overall agreement with the former two reports [17,18]. Quantitatively, however, one can note some notable differences. In ref. [18] employing strain measurements as a function of the temperature in different magnetic fields, a negative magnetostriction was observed only in applied fields of 8 T and more. Here, finite negative magnetostriction is observed at intermediate fields of 1 or 2 T during isothermal measurements. Differences in thermalization might influence the observation of subtle magnetostrictive features. With a progressive saturation just above TC at −58 ppm for 3 T, the amplitude presently observed is significantly smaller than the giant saturation magnetostriction of ~450 ppm reported in ref. [17].
4. Discussion
As pointed out by Biswas et al. [19], the classification of the Nd2In ferromagnetic transition into first- or second-order transition has turned out to be tricky. The absence of noticeable discontinuity on the thermal expansion suggests a continuous transition, whereas the rather symmetric heat capacity peak is more typical of a FOMT. In this context, the presence of a thermal hysteresis distinctive of FOMT is important. But, as illustrated here, hysteresis is also particularly challenging to measure with a reasonable accuracy, which is the primary reason for the scatter among the reported values for Nd2In. Magnetization, DTA, specific heat, and dilatometry performed at different rates suggest a finite δThyst, but of exceptionally small amplitude of 0.1 to 0.4 K, comparable to that observed in Eu2In [13]. While Nd2In definitively lays at the first-/second-order boundary, the persisting finite hysteresis suggests this ferromagnetic transition is more likely to be a FOMT.
Giant saturation magnetostriction [17] or field-induced transition processing in two stages on strains [18] were not observed. Some aspects of the magnetostriction of Nd2In therefore remain elusive and would require further investigation. One can, however, point out that the absence of thermal expansion anomaly at the transition is, at first glance, in line with the modest longitudinal magnetostriction presently observed at TC.
The very limited thermal hysteresis leads to nearly identical ΔTad between measurements after a ZFC and those measured in cyclic conditions. The scatter in reported ΔTad values for Nd2In does not, therefore, originate from irreversibility. It most likely involves the uncertainty inherent to the ΔTad measurement methods and the sample preparation; in particular, parameters influencing the sharpness of the transition such as the raw materials’ purity or the sintering conditions. However, no direct relation can be established between phase purity and magnetocaloric performances, as ΔS or ΔTad do not appear to scale with the Nd3In weight fractions in the various studies. For instance, our sample appears to suffer from the largest Nd3In contamination, but the presently observed ΔTad ≈ 1.7 K for 2 T are intermediate values among the different reports on Nd2In [17,18,19]. The magnetocaloric effect of Nd2In is significant compared to other materials in this temperature range, but it remains notably smaller than ΔTad ≈ 5.0 K for 2 T found in the closely related Eu2In [13]. Figure 9 summarizes the experimental ΔS and ΔTad data available for both compounds in different magnetic fields, and a parametric latent heat model used for their interpretation.
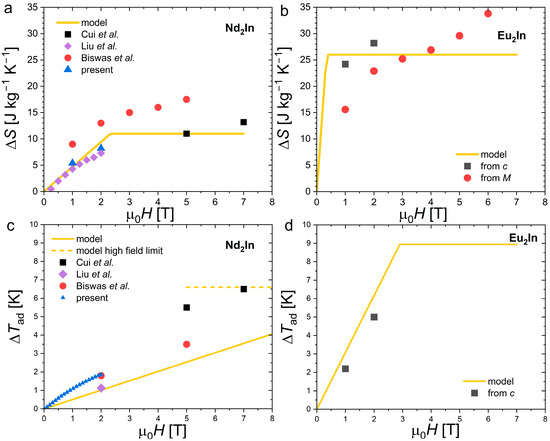
Figure 9.
Comparison of magnetocaloric performances between Nd2In and Eu2In. (a,b) Isothermal entropy change (ΔS) for Nd2In and Eu2In, respectively. (c,d) Adiabatic temperature change (ΔTad) for Nd2In and Eu2In, respectively. Refs. [17,18,19] are cited in the figure.
Among the various approaches which can be used to predict the magnetocaloric effect, a parametric “latent heat” method can appropriately describe the giant magnetocaloric effect with FOMT. This model consists of describing the shift in the entropy discontinuity of a FOMT due to the application of a magnetic field [43,44,45,46,47,48]. At high magnetic fields, when the transition is fully induced, ΔS corresponds to the entropy change in the transition ΔS = ΔStr and correspondingly ΔTad = TCΔStr/cback, where cback is the specific heat background outside the transition. Below their respective saturating fields, ΔS = ΔStr[ΔH(dTtr/dH)]/δTtr and ΔTad = ΔH(dTtr/dH)[1 − δTtr/(ΔStr/cback + δTtr)] are dependent on the magnetic field change (ΔH) and can be expressed as a function of several externally measured parameters such as the shift in the transition due to field (dTtr/µ0dH) or the width of the transition (δTtr) [43,44,45,46,47,48]. While it is advantageous to describe giant MCEs, this model neglects the magnetocaloric contributions that do not originate from the FOMT (the magnetocaloric effect due to application of the field on the paramagnetic and ferromagnetic fractions below and above the FOMT). Table 1 summarizes the parameters used to model Nd2In and Eu2In in Figure 9.

Table 1.
Parameters used to model the magnetocaloric effect of Nd2In and Eu2In.
Applying the model to the case of Nd2In and Eu2In yields only a modest agreement with the experimental results. But the apparent deviation also originates from the large scatter on the experimental values. One is thus limited to a discussion of the overall tendencies which remain relatively well captured by the model. Regarding ΔS, the larger ΔStr for Eu2In than Nd2In favors significantly larger ΔS at high fields. In addition, large ΔS values are reached sooner in Eu2In than Nd2In at intermediate fields (1 T). While both compounds present very sharp transitions, the difference primarily originates from the greater sensitivity to the magnetic field in Eu2In (dTtr/µ0dH), which is nearly six times larger than that presently observed in Nd2In. The Clausius Clapeyron relation dTtr/µ0dH = −ΔM/ΔStr implies that this larger dTtr/µ0dH mostly originates from the larger magnetization change at the transition. ΔM is a parameter involving extrinsic aspects such as the sharpness of the transition, but it is also bounded by the saturation magnetization which is primarily attributed to the nature of the rare earth in these compounds. With gJ = 7 μB for Eu2+ in comparison to 3.27 μB for Nd3+, Eu2In shows a twice larger saturation magnetization and an even greater ΔM than Nd2In due to its more pronounced FOMT characteristics.
Noting that the specific heat outside the transition cback is relatively high for both Nd2In and Eu2In, it negatively affects the ΔTad to a similar extent. Greater dTtr/µ0dH also favors larger ΔTad in Eu2In at intermediate fields. High field ΔTad measurements on Eu2In would, however, be needed to expand the comparison.
5. Conclusions
Magnetization and thermal measurements carried out in different conditions indicate an exceptionally small thermal hysteresis of ~0.1 to ~0.4 K at the first-order ferromagnetic transition of Nd2In. Adiabatic temperature changes measured after resetting the thermomagnetic history and in cyclic conditions show that the hysteresis does not lead to significant losses upon cycling, further confirming the interest of this compound for MCE applications. A limited longitudinal magnetostriction is observed at the field-induced transition, which is in line with the absence of a significant anomaly on the thermal expansion as a function of the temperature. The comparison of the MCE between Nd2In and Eu2In highlights that a large amount of magnetization remains one of the most important parameters for achieving exceptional performances. Further research on R2In materials should therefore focus on combining the isostructural FOMT transition observed in light Nd2In, Pr2In and Eu2In compounds with the larger moments offered by heavy rare earths, such as those possibly occurring in Er2(In,Al) [49]. Additionally, the underlying mechanism responsible for the nearly non-hysteretic FOMT in R2In compounds warrants further investigation, particularly with regard to its generalization across various rare earths.
Author Contributions
Conceptualization, F.G. and H.Y.; formal analysis, F.G.; investigation, B.G. and B.H.; measurements and discussions, B.H.; writing—original draft preparation, B.G.; writing—review and editing, F.G. and H.Y.; supervision, Z.-Q.O., F.G. and H.Y.; funding acquisition, Z.-Q.O., F.G. and H.Y. All authors have read and agreed to the published version of the manuscript.
Funding
This work was funded by the National Natural Science Foundation of China (grant numbers 12464015 and 52461036) and the program for young talents of science and technology in the Universities of Inner Mongolia autonomous region (grant number NJYT23107). The work of F. Guillou at Caen University was supported by the French government, managed by the Agence Nationale de la Recherche under the France 2030 programme (ANR-23-EXES-0001), by the Normandy region and a CPJ project.
Institutional Review Board Statement
Not applicable.
Informed Consent Statement
Not applicable.
Data Availability Statement
The original contributions presented in this study are included in the article. Further inquiries can be directed to the corresponding author.
Conflicts of Interest
The authors declare no conflicts of interest.
References
- Palenzona, A. The crystal structure and lattice constants of R.E.2In and some R.E.5In3 compounds. J. Less-Common Met. 1968, 16, 379–384. [Google Scholar] [CrossRef]
- McMasters, O.D.; Nipper, C.L.; Gschneidner, K.A., Jr. The ytterbium-indium system. J. Less-Common Met. 1971, 23, 253–262. [Google Scholar] [CrossRef]
- Fornasini, M.L.; Cirafici, S. Crystal structures of Eu3Ga2, EuGa, Eu2In, EuIn, and EuIn4. Z. Kristall. 1990, 190, 295–304. [Google Scholar] [CrossRef]
- Gamari-Seale, H.; Anagnostopoulos, T.; Yakinthos, J.K. Magnetic characteristics of rare-earth indium R2In (R = Y, Nd, Sm, Gd, Tb, Dy, Ho, Er, and Tm) intermetallic compounds. J. Appl. Phys. 1979, 50, 434–437. [Google Scholar] [CrossRef]
- Bazela, W.; Szytuła, A. Crystal structure and magnetic properties of RE2In compounds. J. Less-Common Met. 1988, 138, 123–128. [Google Scholar] [CrossRef]
- Ravot, D.; Mauger, A.; Gorochov, O. Magnetic susceptibility of Sm2In: Theory and experiment. J. Alloys Compd. 1995, 225, 461–464. [Google Scholar] [CrossRef]
- McAlister, S.P. Magnetic and electrical properties of Gd2In. J. Phys. F Met. Phys. 1984, 14, 2167. [Google Scholar] [CrossRef]
- Ilyn, M.I.; Tishin, A.M.; Gschneidner, K.A., Jr.; Pecharsky, V.K.; Pecharsky, A.O. Magnetothermal Properties of Polycrystalline Gd2In. Cryocoolers 2002, 11, 457–464. [Google Scholar] [CrossRef]
- Bhattacharyya, A.; Giri, S.; Majumdar, S. Field induced sign reversal of magnetocaloric effect in Gd2In. J. Magn. Magn. Mater. 2012, 324, 1239–1241. [Google Scholar] [CrossRef]
- Tencé, S.; Chevalier, B. Magnetic and magnetocaloric properties of Gd2In0.8X0.2 compounds (X = Al, Ga, Sn, Pb). J. Magn. Magn. Mater. 2016, 399, 46–50. [Google Scholar] [CrossRef]
- Kamantsev, A.P.; Koshkidko, Y.S.; Taskaev, S.V.; Khovaylo, V.V.; Koshelev, A.V.; Cwik, J.; Shavrov, V.G. Inverse Magnetocaloric Effect and Kinetic Arrest Behavior in As-Cast Gd2In at Cryogenic Temperatures. J. Supercond. Nov. Magn. 2022, 35, 2181–2186. [Google Scholar] [CrossRef]
- Sharma, S.; Singh, S.; Patel, A.K.; Gupta, S.K.; Gajjar, P.N.; Kumarthor, P. Effect of Ni substitution on the structural, magnetic, and thermodynamic properties in Gd2−xNixIn (0 ≤ x ≤ 1) intermetallic compounds: An experimental and theoretical study. Intermetallics 2022, 151, 107743. [Google Scholar] [CrossRef]
- Guillou, F.; Pathak, A.K.; Paudyal, D.; Mudryk, Y.; Wilhelm, F.; Rogalev, A.; Pecharsky, V.K. Non-hysteretic first-order phase transition with large latent heat and giant low-field magnetocaloric effect. Nat. Commun. 2018, 9, 2925. [Google Scholar] [CrossRef] [PubMed]
- Mendive-Tapia, E.; Paudyal, D.; Petit, L.; Staunton, J.B. First-order ferromagnetic transitions of lanthanide local moments in divalent compounds: An itinerant electron positive feedback mechanism and Fermi surface topological change. Phys. Rev. B 2020, 101, 174437. [Google Scholar] [CrossRef]
- Alho, B.P.; Ribeiro, P.O.; von Ranke, P.J.; Guillou, F.; Mudryk, Y.; Pecharsky, V.K. Free-energy analysis of the nonhysteretic first-order phase transition of Eu2In. Phys. Rev. B 2020, 102, 134425. [Google Scholar] [CrossRef]
- Biswas, A.; Zarkevich, N.A.; Pathak, A.K.; Dolotko, O.; Hlova, I.Z.; Smirnov, A.V.; Mudryk, Y.; Johnson, D.D.; Pecharsky, V.K. First-order magnetic phase transition in Pr2In with negligible thermomagnetic hysteresis. Phys. Rev. B 2020, 101, 224402. [Google Scholar] [CrossRef]
- Cui, W.; Yao, G.; Sun, S.; Wang, Q.; Zhu, J.; Yang, S. Unconventional metamagnetic phase transition in R2In (R = Nd, Pr) with lambda-like specific heat and nonhysteresis. J. Mater. Sci. Technol. 2022, 101, 80–84. [Google Scholar] [CrossRef]
- Liu, W.; Scheibel, F.; Gottschall, T.; Bykov, E.; Dirba, I.; Skokov, K.; Gutfleisch, O. Large magnetic entropy change in Nd2In near the boiling temperature of natural gas. Appl. Phys. Lett. 2021, 119, 022408. [Google Scholar] [CrossRef]
- Biswas, A.; Chouhan, R.K.; Thayer, A.; Mudryk, Y.; Hlova, I.Z.; Dolotko, O.; Pecharsky, V.K. Unusual first-order magnetic phase transition and large magnetocaloric effect in Nd2In. Phys. Rev. Mater. 2022, 6, 114406. [Google Scholar] [CrossRef]
- Zhang, Q.; Cho, J.H.; Du, J.; Yang, F.; Liu, X.G.; Feng, W.J.; Zhang, Y.J.; Li, J.; Zhang, Z.D. Large reversible magnetocaloric effect in Tb2In. Solid State Commun. 2009, 149, 396–399. [Google Scholar] [CrossRef]
- Zhang, Q.; Cho, J.H.; Li, B.; Hu, W.J.; Zhang, Z.D. Magnetocaloric effect in Ho2In over a wide temperature range. Appl. Phys. Lett. 2009, 94, 182501. [Google Scholar] [CrossRef]
- Zhang, H.; Shen, B.G.; Xu, Z.Y.; Chen, J.; Shen, J.; Hu, F.X.; Sun, J.R. Large reversible magnetocaloric effect in Er2In compound. J. Alloys Compd. 2011, 509, 2602–2605. [Google Scholar] [CrossRef]
- Wlodarczyk, P.; Hawelek, L.; Kowalczyk, M.; Kaminska, M.; Polak, M.; Hudecki, A.; Kolano-Burian, A. Magnetocaloric Properties of Mn1.1Fe0.9P0.5As0.5−xGex (0 ≤ x ≤ 0.1) Compounds. Materials 2017, 10, 529. [Google Scholar] [CrossRef] [PubMed]
- Xu, L.; Qian, C.; Ai, Y.; Su, T.; Hou, X. Tunable Magnetocaloric Properties of Gd-Based Alloys by Adding Tb and Doping Fe Elements. Materials 2019, 12, 2877. [Google Scholar] [CrossRef]
- Zvereva, E.; Vasilchikova, T.; Evstigneeva, M.; Tyureva, A.; Nalbandyan, V.; Gonçalves, J.; Barone, P.; Stroppa, A.; Vasiliev, A. Chirality and Magnetocaloricity in GdFeTeO6 as compared to GdGaTeO6. Materials 2021, 14, 5954. [Google Scholar] [CrossRef] [PubMed]
- Gębara, P.; Hasiak, M. Determination of Phase Transition and Critical Behavior of the As-Cast GdGeSi-(X) Type Alloys (Where X = Ni, Nd and Pr). Materials 2021, 14, 185. [Google Scholar] [CrossRef]
- Cho, K.; Shon, W.; Bae, J.; Lee, J.; Yoon, S.; Kim, J.; Rhyee, J.-S.; Cho, B. Anisotropic Metamagnetic Spin Reorientation and Rotational Magnetocaloric Effect of Single Crystal NdAlGe. Materials 2023, 16, 2771. [Google Scholar] [CrossRef]
- Sharma, V.; Barua, R. Synthesis, Characterization, and Magnetocaloric Properties of the Ternary Boride Fe2AlB2 for Caloric Applications. Materials 2024, 17, 3886. [Google Scholar] [CrossRef]
- Shahbazi, M.; Dehghan Manshadi, A.; Shinde, K.; Mackinnon, I.D.R. Magnetocaloric Properties and Microstructures of HoB2 and Nb-Substituted HoB2. Materials 2025, 18, 866. [Google Scholar] [CrossRef]
- Gschneidner, K.A., Jr.; Pecharsky, V.K.; Tsokol, A.O. Recent developments in magnetocaloric materials. Rep. Prog. Phys. 2005, 68, 1479–1539. [Google Scholar] [CrossRef]
- Rodríguez-Carvajal, J. Recent advances in magnetic structure determination by neutron powder diffraction. Phys. B Condens. Matter 1993, 192, 55–69. [Google Scholar] [CrossRef]
- Guillou, F.; Hardy, V. Burst-like features observed from different techniques at the first-order magnetic transition of La(Fe,Co,Si)13. J. Alloys Compds. 2024, 977, 173161. [Google Scholar] [CrossRef]
- Wang, K.; Ouyang, Y.; Shen, Y.; Zhang, Y.; Zhang, M.; Liu, J. High-throughput characterization of the adiabatic temperature change for magnetocaloric materials. J. Mater. Sci. 2021, 56, 2332–2340. [Google Scholar] [CrossRef]
- Hardy, V.; Bréard, Y.; Martin, C. Derivation of the heat capacity anomaly at a first-order transition by using a semi-adiabatic relaxation technique. J. Phys. Condens. Matter 2009, 21, 075403. [Google Scholar] [CrossRef] [PubMed]
- Zarkevich, N.A.; Zverev, V.I. Viable Materials with a Giant Magnetocaloric Effect. Crystals 2020, 10, 815. [Google Scholar] [CrossRef]
- Paul-Boncour, V.; Bessais, L. Tuning the Magnetocaloric Properties of the La(Fe,Si)13 Compounds by Chemical Substitution and Light Element Insertion. Magnetochemistry 2021, 7, 13. [Google Scholar] [CrossRef]
- Wang, Z.; Dengina, E.; Kosogor, A.; Hiroto, T.; Tang, X.; Kulesh, N.; Bolyachkin, A.; Ohkubo, T.; Sepehri-Amin, H. Insights into reduction of hysteresis in (Mn, Fe)2(P, Si) compounds by experimental approach and Landau theory. Materialia 2024, 37, 102195. [Google Scholar] [CrossRef]
- Hwang, J.S.; Lin, K.J.; Tien, C. Measurement of heat capacity by fitting the whole temperature response of a heat-pulse calorimeter. Rev. Sci. Instrum. 1997, 68, 94–101. [Google Scholar] [CrossRef]
- Lashley, J.C.; Hundley, M.F.; Migliori, A.; Sarrao, J.L.; Pagliuso, P.G.; Darling, T.W.; Jaime, M.; Cooley, J.C.; Hults, W.L.; Morales, L.; et al. Critical examination of heat capacity measurements made on a Quantum Design physical property measurement system. Cryogenics 2003, 43, 369–378. [Google Scholar] [CrossRef]
- Suzuki, H.; Inaba, A.; Meingast, C. Accurate heat capacity data at phase transitions from relaxation calorimetry. Cryogenics 2010, 50, 693–699. [Google Scholar] [CrossRef]
- Pecharsky, V.K.; Gschneidner, K.A., Jr. Magnetocaloric effect from indirect measurements: Magnetization and heat capacity. J. Appl. Phys. 1999, 86, 565–575. [Google Scholar] [CrossRef]
- Moreno-Ramírez, L.M.; Franco, V.; Conde, A.; Neves Bez, H.; Mudryk, Y.; Pecharsky, V.K. Influence of the starting temperature of calorimetric measurements on the accuracy of determined magnetocaloric effect. J. Magn. Magn. Mater. 2018, 457, 64–69. [Google Scholar] [CrossRef]
- Pecharsky, V.K.; Gschneidner, K.A., Jr.; Pecharsky, A.O.; Tishin, A.M. Thermodynamics of the magnetocaloric effect. Phys. Rev. B 2001, 64, 144406. [Google Scholar] [CrossRef]
- Annaorazov, M.P.; Ünal, M.; Nikitin, S.A.; Tyurin, A.L.; Asatryan, K.A. Magnetocaloric heat-pump cycles based on the AF–F transition in Fe–Rh alloys. J. Magn. Magn. Mater. 2002, 251, 61–73. [Google Scholar] [CrossRef]
- Sandeman, K.G. Magnetocaloric materials: The search for new systems. Scr. Mater. 2012, 67, 566–571. [Google Scholar] [CrossRef]
- Porcari, G.; Fabbrici, S.; Pernechele, C.; Albertini, F.; Buzzi, M.; Paoluzi, A.; Kamarad, J.; Arnold, Z.; Solzi, M. Reverse magnetostructural transformation and adiabatic temperature change in Co- and In-substituted Ni-Mn-Ga alloys. Phys. Rev. B 2012, 85, 024414. [Google Scholar] [CrossRef]
- Liu, J.; Gottschall, T.; Skokov, K.; Moore, J.D.; Gutfleisch, O. Giant magnetocaloric effect driven by structural transitions. Nat. Mater. 2012, 11, 620–626. [Google Scholar] [CrossRef]
- Guillou, F.; Yibole, H.; Kamantsev, A.; Porcari, G.; Cwik, J.; Koledov, V.; Van Dijk, N.H.; Brück, E. Field Dependence of the Magnetocaloric Effect in MnFe(P,Si) Materials. IEEE Trans. Magn. 2015, 51, 7244252. [Google Scholar] [CrossRef]
- Yao, G.; Sun, S.; Yang, J.; Wu, H.; Wang, Q.; Zhu, J.; Cui, W. Enhanced magnetocaloric effects in hetero-structural alloyed Er2In1−xAlx (0 ≤ x ≤ 0.4) system by novel nonhysteretic metamagnetsm. Scr. Mater. 2021, 194, 113649. [Google Scholar] [CrossRef]

Disclaimer/Publisher’s Note: The statements, opinions and data contained in all publications are solely those of the individual author(s) and contributor(s) and not of MDPI and/or the editor(s). MDPI and/or the editor(s) disclaim responsibility for any injury to people or property resulting from any ideas, methods, instructions or products referred to in the content. |
© 2025 by the authors. Licensee MDPI, Basel, Switzerland. This article is an open access article distributed under the terms and conditions of the Creative Commons Attribution (CC BY) license (https://creativecommons.org/licenses/by/4.0/).