Abstract
Occupied and unoccupied electronic states of altermagnetic MnTe(0001) single crystals were studied by photoemission and inverse-photoemission spectroscopies after establishing a reproducible surface cleaning procedure involving repeated sputtering and annealing cycles. The angle-resolved photoemission spectroscopy (ARPES) exhibited a hole-like band dispersion centered at the point, which was consistent with the reported ARPES results and our density functional theory (DFT) calculations with the on-site Coulomb interaction U. The observed Mn 3d↑-derived peak at −3.5 eV, however, significantly deviated from the DFT + U calculations. Meanwhile, the Mn 3d↓-derived peak at +3.0 eV observed by inverse-photoemission spectroscopy agreed well with the DFT + U results. Based on simulations of the spectral function employing an w-dependent model self-energy, we found significant relaxation effects in the electron-removal process, while such effects were negligible in the electron-addition process. Our study provides a comprehensive picture of electronic states, forming a solid foundation for understanding the magnetic and transport properties of MnTe.
Keywords:
MnTe; single crystal; altermagnetism; ARPES; IPES; density functional theory; electron correlation 1. Introduction
Altermagnetism is a newly identified magnetism with zero net magnetization in which magnetic sublattices are interrelated by crystal rotation symmetries, rather than by translation or inversion [1,2,3]. Altermagnetic materials have attracted much interest for their potential spintronic and thermoelectric applications [1,2,3]. Although hexagonal MnTe has recently been recognized as one of the most typical altermagnets, it has long been extensively studied for its unique transport properties closely coupled to magnetism. The crystal structure of MnTe is the NiAs-type structure (P63/mmc), which is nonsymmorphic, with glide planes and screw axes [4,5,6]. The nonsymmorphic symmetry together with spin alignment is the ground of the altermagnetism of MnTe.
Neutron scattering measurements indicated that the magnetic moment of Mn is ferromagnetically aligned in the c-plane with a preferable direction of the a-axis, and the adjacent magnetic moments along the c-axis are aligned antiferromagnetically [7,8,9]. The Néel temperature is around 310 K, and the magnetization is 4.7 μB, which is consistent with an effective magnetic moment of 5 μB for the Mn d5 electron configuration [7,8,9]. Density functional theory (DFT) calculations confirmed that the experimental magnetic structure was energetically the most stable in the ground state [10]. However, doping with 0.3% Li is sufficient to induce the c-axis component of the spin, and with 5% Li doping, it is completely along the c-axis [11].
MnTe is an insulator with an optical gap of 1.26–1.35 eV [12,13,14,15]. It is also a good thermoelectric material [16,17,18,19], and magnon drag plays an important role in the thermoelectric properties [20]. Magnon drag occurs when the magnons (spin waves), induced by a thermal gradient, transfers part of their momentum to the carriers (electrons or holes). The power factor of MnTe can be further increased by tuning the magnitude of the magnon–electron drag and the electrical conductivity by Cr doping [21]. The interplay between spin entropy, hopping transport, and magnon/paramagnon lifetimes can be utilized to develop high-performance spin-driven thermoelectric materials [21,22]. From a spintronic application point of view, the anisotropic magnetoresistance of MnTe should be noted [23,24], which is associated with the three-fold symmetry of the magnetic domains within the c-plane [25].
Since the recognition of altermagnetism as a new magnetic state, the occupied electronic structures such as electronic band dispersions have been extensively studied using angle-resolved photoemission spectroscopy (ARPES) on thin films grown by molecular beam epitaxy (MBE) [26,27,28] and cleaving bulk single crystals [29]. The exchange split band below the Néel temperature (TN) was observed [26], and three-dimensional band structures and constant-energy contours near the Fermi level have been confirmed to be consistent with the DFT calculations with on-site Coulomb interaction of U [27,29]. While the observed band structures from the MBE-grown thin films are considered to be consistent in the magnetic phase, TN varies depending on the film thickness [26,28], likely due to substrate-induced strain. It is known that TN increases with applied pressure [30,31].
To date, no attempts have been made to prepare well-defined clean surfaces of bulk MnTe single crystals using sputtering and annealing. Once it is established, one can examine bulk transport and magnetic properties as well as the electronic states on the same single crystalline samples by ARPES and angle-resolved inverse-photoemission spectroscopy (IPES). Furthermore, orientation-dependent surface-derived states could also be detected, as predicted by DFT [32].
While photoemission spectroscopy experiments on MnTe single crystals have been extensively conducted in recent years, investigations of the unoccupied states by IPES have thus far been limited to polycrystalline samples with clean surfaces prepared by in situ mechanical scraping [33,34,35,36]. It was reported that the exchange split Mn 3d↑ in the occupied state was located at −3.7 eV, and Mn 3d↓ in the unoccupied state was located at +2.9 eV, indicating an effective U value of Ueff = 6.6 eV [33,34,35]. The Ueff value was much larger than the exchange splitting of 4 eV in the standard LDA calculation [37,38]. Furthermore, a broad satellite structure was found at −8 eV, which is a direct evidence of strong electron correlation in Mn 3d states [33,34,35,36].
To take into account the electron correlation effect, configuration interaction (CI) cluster model calculations were performed, and an average of the Mn 3d–3d Coulomb interaction U = 4–5 eV and the ligand (Te)-to-the-Mn 3d charge transfer energy Δ = 0–2 eV were obtained [33,34,35,39]. Since Δ < U, MnTe is classified as a charge-transfer type insulator in the Zaanen-Sawatzky-Allen diagram [40]. The satellite structure was also found in the Mn 2p core-level spectra of MnTe [41]. While the CI cluster model calculations captured satellite structure in the single-particle excitation, it is not compatible with the itinerant nature of quasiparticles. To accurately describe the photoemission and inverse-photoemission spectra as single-particle spectral functions, many-body interactions must be incorporated in a manner consistent with the band theory.
In this study, by establishing a reproducible cleaning process of MnTe(0001) single crystal surface, we have investigated its occupied and unoccupied electronic states using photoemission and inverse-photoemission spectroscopies. The experimental results were compared with our DFT + U calculations, and we simulated single particle excitation spectra using a model self-energy function. We discuss the difference in the relaxation process via the p−d hybridization in the occupied and unoccupied states separated by the band gap.
2. Materials and Methods
2.1. Crystal Growth
A two-step melting procedure was used to grow high-quality MnTe single crystals. A quartz ampoule was filled with a stoichiometric amount of high-purity Mn (99.9999%, The Nilaco Corporation, Tokyo, Japan) and Te shots (99.9999%, The Nilaco Corporation, Tokyo, Japan), then the ampoule was sealed at a pressure of 4 × 10⁻³ Pa. The sealed quartz ampoule was heated to 1273 K gradually (50 K/h), maintained there for 72 h, and then cooled at 25 K/h to room temperature in an electronic furnace FUM312PC (Advantec Toyo Seisakusho Kaisha, Ltd., Tokyo, Japan). After this heat treatment, the sample was ground to ensure homogeneous mixing. The sample was finally put in a conical alumina crucible and sealed in a quartz ampule at a pressure of 2.8 × 10⁻³ Pa. The ampule was gradually heated to 1273 K and held there for 30 h. It was then heated to 1473 K and held for 24 h. Finally, the sample was gradually cooled to 973 K at a rate of 5 K per hour, then annealed for 12 h at 973 K before cooling to room temperature at a rate of 8 K/h.
2.2. XRD and EPMA
Powder X-ray diffraction (XRD) measurements with Cu Kα radiation (λ = 1.54 Å) were performed on the as-grown MnTe sample with a SmartLab SE (Rigaku corporation, Tokyo, Japan). To analyze the XRD data, we referred to the crystallographic database for hexagonal MnTe (space group P63/mmc, No. 194; JCPDS card # 18-0814) and cubic (pyrite-type) MnTe2 (space group , No. 205; JCPDS card # 18-0813). The lattice parameters were determined by the Rietveld refinement of the XRD patterns using the Fullprof software (version: December 2023) package. Pseudo-Voigt functions were used to fit the data based on χ2 minimization. To improve the numerical stability and convergence, the contribution from the Cu Kα2 satellite line was subtracted from the XRD data prior to the refinement calculations. The elemental composition of the samples was examined using an electron probe micro-analyzer (EPMA) JXA-iSP100 (JEOL Ltd., Tokyo, Japan).
2.3. Clean Surface Preparation and Characterizations
We cut and mechanically polished the single crystals to reveal the (0001) plane shown in Figure 1a. Figure 1b shows the Laue diffraction patterns from a (0001) c-plane displaying hexagonal symmetry.
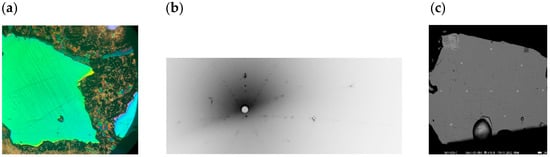
Figure 1.
(a) Mechanically polished the single crystals of the MnTe(0001) plane. (b) Laue diffraction patterns from a (0001) c-plane displaying hexagonal symmetry. (c) Scanning electron microscope (SEM) image with points in white selected for EPMA analysis.
The cleaning procedure of the MnTe(0001) surface was performed in three stages. To remove the surface contamination from the sample, argon ion sputtering was performed at beam energies of 1, 1.5, and 2 kV beam energy, followed by subsequent annealing at 523, 603, 633, and 673 K. To achieve an ordered and smooth surface, subsequent annealing is required. After every cycle of sputtering and annealing, we performed Auger electron spectroscopy (AES) measurements to check the surface cleanness and composition. The atomic concentration of an element (a) on a sample with n elements can be determined using the following equation, , where and are the Auger spectral intensity and relative sensitivity factors for element M, respectively. For percentage atomic concentration, × 100% was used in our calculations.
We optimized the cleaning conditions and finally obtained a clean surface by sputtering the sample at 2 kV beam energy for 5 min, followed by annealing at 673 K for 60 min. After each sputtering–annealing cycle, we ensured that the surface was clean and ordered.
2.4. Photoemission Spectroscopy and Inverse-Photoemission Spectroscopy
Angle-resolved/angle-integrated photoemission spectroscopy measurements have been performed on the linear undulator beamline (BL–1) of HiSOR, Hiroshima University [42,43] using a hemispherical electron-energy analyzer A-1 (MB Scientific AB, Uppsala, Sweden). The energy resolution was set at 20–50 meV. The ARPES data were taken at hν = 117 eV with the p polarization geometry. We set sample temperature at 20 K, and the base pressure of the main chamber was 3.6 × 10⁻⁹ Pa.
The resonant inverse-photoemission (RIPES) spectra of MnTe were taken with tunable photon energy mode. The light emitted from the sample was monochromatized by nonperiodic spherical gratings with the nominal line densities of 1200 lines/mm and magnified by the triple multichannel plates in front of a one-dimensional position-sensitive detector [36]. The sample was cooled using He closed cycles cryostat down to 20 K. The energy resolution was about 0.8 eV. The base pressure of the main chamber was 2.2 × 10⁻⁹ Pa. For RIPES measurements, we obtained a clean surface by Ar sputtering only because there is no heating stage available in the IPES system. However, we confirmed by AES measurement that Ar sputtering is effective to remove surface contamination, and it does not change the chemical composition of the surface.
2.5. Density Functional Theory Calculations
The electronic structure calculations for MnTe were performed using the full-potential linearized augmented plane-wave (FLAPW) method, as implemented in the FLEUR code (MaX Release 6.0) [44]. The basis set consisted of augmented plane waves in the interstitial region and atomic-like radial functions, along with their energy derivatives, inside the muffin-tin spheres. A maximum angular momentum cutoff of lmax = 12 was used, and local orbitals were included for Mn (3s, 3p) and Te (4d) states. Brillouin zone sampling for self-consistent calculations used a 14 × 14 × 14 k-point grid, and a separate path with 960 k-points was defined for band structure calculations.
To describe the exchange-correlation potential, both the generalized gradient approximation (GGA) formulated by Perdew, Burke, and Ernzerhof (PBE) [45] and the local density approximation (LDA) [46] were employed. To better account for the ground state properties such as magnetic moment and insulating ground state, we have employed the DFT + U formalism. Without the U value, one cannot explain band gap [37,38] and other ground state properties [14]. It was previously clarified that the lattice constants were reproduced for U = 2–3 eV and the Néel temperature for U = 4.5 eV [14]. We performed DFT + U calculations with varying U values, and confirmed that the band gap disappears at U = 0 eV and the magnitude of exchange splitting in the Mn 3d state increases with increasing U. The on-site Coulomb interaction was treated using the rotationally invariant approach with effective Hubbard parameters of U = 6.2 eV alongside a Hund’s exchange parameter of J = 0.86 eV referring to the previous calculation, as these parameters could reproduce experimental magnetic moment [47].
Spin–orbit coupling (SOC) effects were included self-consistently to capture relativistic interactions. We observed that the inclusion of SOC lifts the degeneracy of the energy bands at the A point and reduces the band gap by about 0.3 eV. In addition to band structure calculations, the total and orbital-resolved densities of states (DOS) were evaluated to provide a detailed understanding of the orbital contributions, particularly from Mn 3d and Te 5p states, near the Fermi level.
The structural parameters, including the lattice constants, were taken from Rietveld refinement of powder X-ray diffraction (XRD) data using the FullProf suite [48], ensuring that the theoretical model accurately reflects the experimental crystallography. We have also assumed an antiferromagnetic (AFM) configuration of MnTe obtained from experiments.
2.6. Spectral Function and Model Self-Energy
The single-particle excitation spectrum is given by the imaginary part of the single-particle Green’s function :
where is the one-electron energy for wave vector k and spin σ. The real part of the pole of the spectral function, given by , corresponds to the quasiparticle energy, while its imaginary part determines the quasiparticle lifetime (natural linewidth). Consider adding a hole to an initial N-particle state through photoexcitation, resulting in an (N−1)-particle state. Let be the energy of the initial state and the energy of the (N−1)-particle state without many-body relaxation. According to the Koopmans’ theorem, the one-electron energy is . However, the actual (N−1)-particle final state undergoes energy shift (relaxation) due to many-body interactions, and the added hole can be regarded as a quasiparticle with finite lifetime. If the observed quasiparticle energy is denoted , we have:
where the real part of the self-energy represents the energy shift due to many-body interactions.
In this study, we simulate the k-integrated spectral function by employing a k-independent model self-energy Σ(ω) for angle-integrated photoemission and inverse-photoemission spectra:
where is the density of states for energy and spin without relaxation effects. Here, represents the dynamical relaxation induced by the addition of a photohole, defining quasiparticle energy and lifetime. By neglecting the k dependence, we implicitly assume that the excitation is a local one and does not alter global charge distributions that are closely linked to the underlying crystal symmetry described by the space group.
Here, we briefly descript the derivation of a model self-energy following our previous paper [49]. We consider the transition from the unperturbed state to perturbed final state of the (N−1)-particle system using the first-order perturbation theory with a time-dependent many-body interaction , where ξ is a characteristic relaxation energy and is the perturbation operator. The transition probability is given by: with . In the limit of , reduces to the Fermi's golden rule: . In the case of finite quasiparticle lifetime , we approximate the function by a Lorentzian function . This approximation is justified because both give in the limit of . Taking the uncertainty principle into account, the natural linewidth is given by: . By defining and , the self-energy takes the following form: . If there are several excitations, we add them as .
Then, we impose conditions and near the Fermi level. These conditions ensure infinite hole lifetime at the valence-band top and positive spectral function near the Fermi level, respectively. The simplest model fulfilling these conditions is: with real parameters A, B, C, D, ξ, and η. Ensuring the above conditions, we derive relations . Setting , we finally obtain: [49]. Note that the self-energy expansion near the Fermi level () is consistent with the Fermi-liquid theory: , with a coupling parameter .
The introduced model self-energy assumes the electron–hole symmetry. A more general asymmetric functional form could also be considered. However, this significantly complicates the equation and has little impact on the spectral behavior near , though it may affect the spectral details near the Fermi level. For insulators like MnTe, the self-energy within the band gap should be zero. We applied the model self-energy function to simulate the occupied and unoccupied spectral function, using parameter sets that were not necessarily identical. In this study, we found that the self-energy effect on the inverse-photoemission spectra (IPES) of MnTe is almost negligible, suggesting that is sufficiently suppressed in the unoccupied region and choice of the ξ and η does not affect significantly the shape of the IPES spectral function.
3. Results
Figure 2 presents the powder X-ray diffraction spectrum of MnTe single crystals. The Rietveld fitting of the dominant peaks is consistent with diffraction from the (022), (101), (102), (110), (103), and (202) planes of the hexagonal MnTe phase. After Rietveld refinement using FullProf software, the lattice parameters were a = b = 4.1485 Å, c = 6.7125 Å, γ = 120°, and α = β = 90°, which are consistent with the reference values [5,6,11,12]. The unit cell volume is evaluated to be 100.0440 Å3. The c/a value at the room temperature is 1.62, which is close to the ideal Oh coordination c/a = = 1.63.
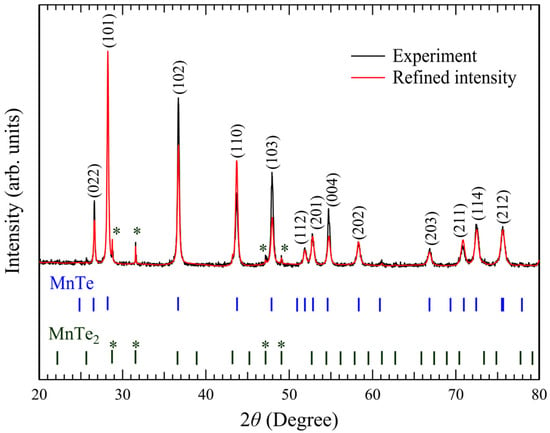
Figure 2.
Rietveld refinement result of powder XRD pattern for the MnTe sample. Experimental data (black line) and Rietveld-refined fit (red line) assuming MnTe and MnTe2 phases. Vertical bars indicate the calculated diffraction peak positions for each phase. Asterisks (*) indicate distinct peaks attributed to the MnTe2 phase. MnTe2 phase fraction was estimated to be at most 4.8%.
We have noticed a contribution from MnTe2, which is also found in previous publications [4,6,16,27]. It has been reported that in the oxidizing atmosphere, part of Mn is oxidated, and MnTe2 is created above 400 K [4,6]. However, all of the XRD peaks can be assigned to the MnTe and MnTe2, excluding other impurities such as MnO. We have estimated that the volume fraction of the MnTe2 impurity phase was at most 4.8% based on the two-phase Rietveld refinements, as shown in Figure 2. We assume that the MnTe2 detected in the XRD originates from grain boundaries. The electronic structure obtained from a single domain of MnTe(0001) phase, however, should not be affected by this minor phase. As described below, we confirmed that the ratio of Mn and Te atoms is 1:1 by various methods. Furthermore, the observed band structures are fully consistent with those of NiAs-type MnTe, which is completely different from MnTe2 with the pyrite-type structure () [50,51].
Figure 1c shows the scanning electron microscope image of one of the three single-crystal samples that were cut from various ingot positions and used for the EPMA analyses. For each sample, we acquired compositions from twenty-four distinct locations. We obtained Mn ≈ 50.10% and Te ≈ 49.89% on average, indicating that the sample composition is almost 1:1.
Figure 3 shows the final AES spectrum of MnTe(0001) after repeated cleaning processes. The estimated Mn and Te atomic ratio, [Te]/[Mn], is 1.02, which is nearly 1:1. Here we should mention possible carbon (C) contamination of up to 3.8%, which was estimated from a shallow dip structure at the kinetic energy of ~290 eV, corresponding to the C KLL Auger line.
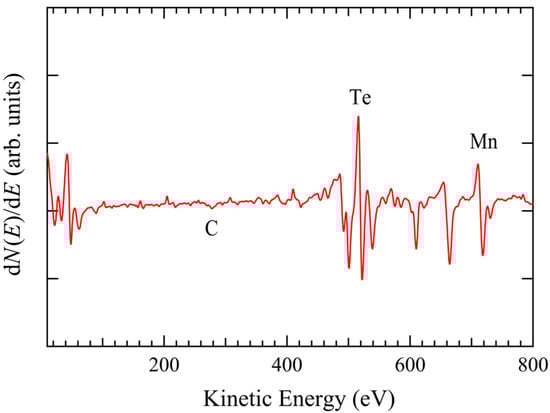
Figure 3.
Final AES spectrum of the clean MnTe(0001) surface obtained after repeated cycles of sputtering and annealing.
Meanwhile, the low-energy electron diffraction (LEED) image taken at an incident electron kinetic energy of 42.2 eV (Figure 4) shows sharp six-fold symmetric spots. We do not see any superstructure due to adsorbed or segregated impurity atoms like C on the surface. The LEED image indicates a well-defined long range atomic order on the MnTe(0001) surface after cleaning process. We assume that a small amount of impurities on the surface, such as C, may contribute to additional ARPES linewidth broadening. However, the electron–impurity or electron–defect scattering is elastic and, therefore, does not alter the band structure [52].
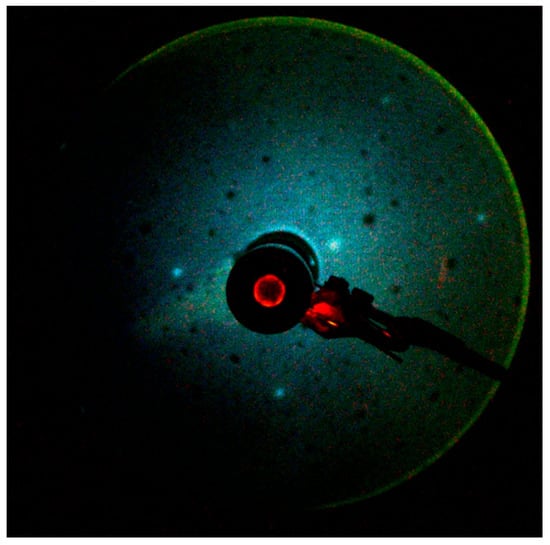
Figure 4.
LEED image of the clean MnTe(0001) surface obtained after repeated cycles of sputtering and annealing. The incident electron kinetic energy was 42.2 eV.
Figure 5a shows the ARPES intensity map in the kx–ky plane, which was obtained integrating spectral intensity over −0.1 eV to 0 eV. One can see clearly a six-fold symmetric intensity distribution in Figure 5a, which is consistent with the symmetry of the MnTe(0001) surface. The surface/bulk Brillouin zone is shown in Figure 5b. According to previous kz dependent measurements [29], the point of the surface Brillouin zone taken at hν = 117 eV is closer to the A point of the bulk Brillouin zone. Our ARPES results are consistent with previously reported ARPES results on bulk single crystals of cleaved surface [29].
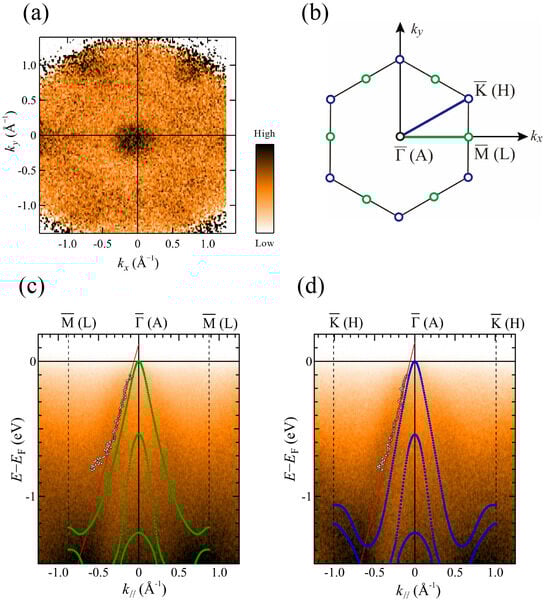
Figure 5.
ARPES results for a MnTe(0001) single crystal measured at 20 K using photon energy hν = 117 eV in the p-polarization geometry. (a) kx–ky map near the Fermi level, obtained by integrating spectral intensity over the energy range from −0.1 eV to 0 eV. The kx direction corresponds to the direction. (b) Surface (bulk) Brillouin zone. ARPES intensity plots along (c)
and (d)
directions. Open circles indicate peak positions obtained by MDC fitting. Red lines represent fits to obtained data points from −0.6 to −0.1 eV. DFT + U calculations along the AL (green circles in (c)) and AH (blue circles in (d)) directions are overlaid.
Figure 5c,d exhibit ARPES image plots along the and directions, respectively. We have overlaid the band points given by the DFT + U along the AL (green circles in Figure 5c) and AH (blue circles in Figure 5d) directions of the bulk Brillouin zone. Since MnTe is typically hole-doped, the energy scale in the DFT + U calculations is referenced to the top of the valence band located at the A point. The shape of the convex band dispersion with its maximum at the A point in the DFT + U calculations is consistent with the ARPES image plots. The good agreement between theory and experiment confirms that a well-defined MnTe(0001) surface has been successfully prepared.
To examine the experimental band points in more detail, we fitted the momentum distribution curves (MDCs: ARPES intensity as a function of wavenumber at a given energy) using a single Lorentzian for k// < 0 Å−1 and from −0.8 eV up to −0.1 eV. The extracted experimental band points are represented by open circles in Figure 5c,d. We limited the fitting region because the spectral intensity is stronger for k// < 0 Å−1, and peak fitting was not stable above −0.1 eV and below −0.8 eV due to significant peak broadening. Subsequently, we fitted the experimentally obtained band points within the energy range from −0.6 eV up to −0.1 eV using a linear function, as indicated by the red lines in Figure 5c,d. Then, the Fermi wave number was estimated as kF ≈ ±0.1 Å−1. To achieve agreement with this experimental kF value, the theoretical band dispersion should be shifted toward higher energies (hole doping direction) by approximately 0.1 eV. As the intensity of the dispersive spectral features is significantly suppressed near the valence band maximum, one cannot see well-defined Fermi surfaces due to hole doping, as shown in Figure 5a.
Considering the value of the c/a ratio, the local MnTe6 octahedral structure is close to the ideal octahedral coordination. Consequently, Mn 3d orbitals directed toward the neighboring Te atoms are classified as eg orbitals, while those oriented along directions toward next-nearest-neighbor Mn sites correspond to the t2g orbitals. Significant p–d hybridization primarily occurs between the Mn 3d eg orbitals and Te 5 p orbitals since Mn atoms have Te atoms as their nearest neighbors. In contrast, the Mn 3d t2g orbitals, extending toward next-nearest-neighbor Mn atoms, form a narrow peak structure in the density of states, reflecting their localized character and thus contributing to the local magnetic moments.
Recent ARPES measurements [26,27,28,29] have mainly focused on the band dispersions above −3 eV, specifically above the flat bands derived from Mn 3d t2g states. Significant electron correlation effects are not visible because the dispersive bands near the valence band maximum predominantly originate from itinerant Te 5p states. Nevertheless, the existence of satellite structures due to electron correlation has been demonstrated in the wide energy range [33,34,35,39,41]. To further investigate electron correlation effects, we examine the occupied and unoccupied Mn 3d-derived states using resonant photoemission and inverse-photoemission spectroscopies.
Figure 6 shows angle-integrated photoemission spectra measured in the Mn 3p–3d resonance region under on-resonance (hν = 51 eV) and off-resonance (hν = 47.5 eV) photon-energy conditions. The main peak located around −3.5 eV is significantly enhanced in the on-resonance spectrum. The difference between the on- and off-resonance spectra in Figure 6 highlights the Mn 3d-derived spectral intensity. While the electron-correlation-derived satellite structure previously observed in polycrystalline MnTe appeared as a broad feature around −8 eV [33,34,35,39], we observed two distinct peaks at approximately −7 eV and −10 eV. Although the valence-band maximum is primarily derived from Te 5p states, we found a contribution from Mn 3d states from −2 eV up to the Fermi level.
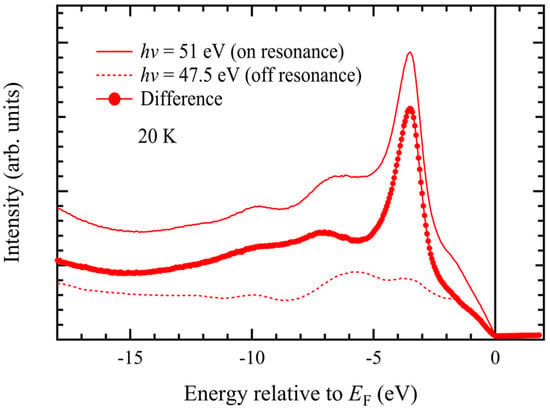
Figure 6.
Resonant photoemission spectra taken at hν = 51 eV (on-resonance) and hν = 47.5 eV (off-resonance). The difference spectrum reveals the Mn 3d spectral intensity contribution.
Figure 7 shows results of Mn 3p–3d resonant inverse-photoemission spectroscopy on MnTe(0001). At the on-resonance electron kinetic energy, the peak at +3.0 eV significantly enhanced, clearly indicating that it is derived from the Mn 3d↓ state. The spectral shape is similar to previous results on polycrystalline MnTe [36].
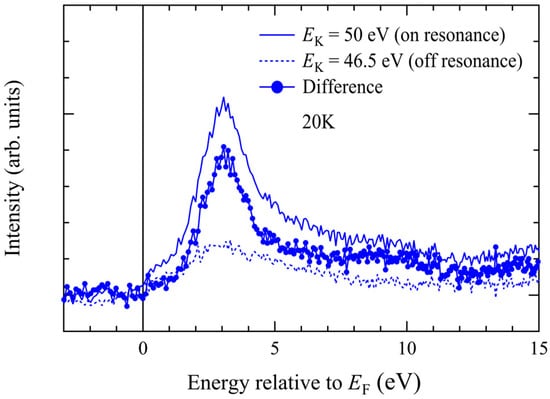
Figure 7.
Resonant inverse-photoemission spectra measured at incident-electron-kinetic energies of EK = 50 eV (on-resonance) and 46.5 eV (off-resonance). The difference spectrum reveals the Mn 3d spectral intensity contribution.
In Figure 8, we show the theoretical partial density of states (DOS) inside the muffin-tin potential given by our DFT + U calculations: Mn 3d↑ partial DOS (red area), Mn 3d↓ partial DOS (blue area), total DOS (black line), Te 5p partial DOS (green area), and Te 5s partial DOS (yellow area). Note there exist electronic states in the inter muffin-tin region (violet area).
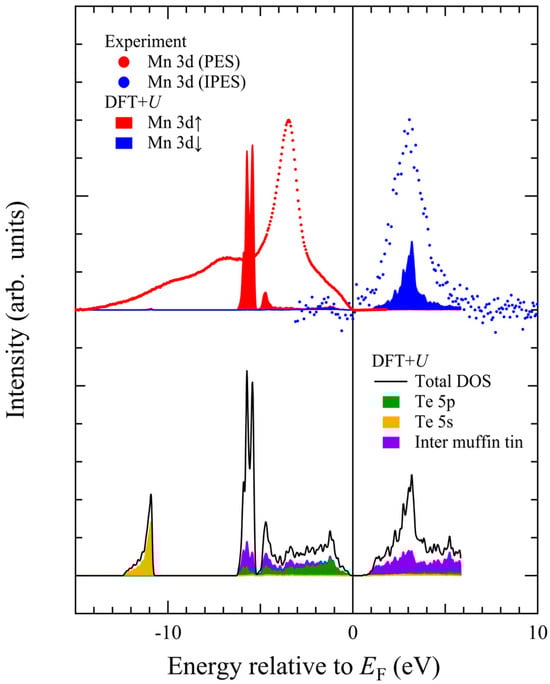
Figure 8.
Theoretical partial density of states (DOS) inside the muffin-tin potential, as obtained from our DFT + U calculations: Mn 3d↑ partial DOS (red area), Mn 3d↓ partial DOS (blue area), total DOS (black line), Te 5p partial DOS (green area), Te 5s partial DOS (yellow area), and the DOS in the interstitial (inter muffin-tin) region (violet area). Experimentally determined occupied Mn 3d states (red circles) and unoccupied Mn 3d states (blue circles) are also shown.
The Mn 3d-t2g↑-derived DOS in the occupied state exhibits a narrow peak at around −5.5 eV, and the Mn 3d-t2g↓-derived DOS in the unoccupied state has a peak at +3.5 eV. The Te 5p states extend from −6 eV up to the top of the valence band maximum. The contribution from Te 5p partial DOS is dominant from −4 eV up to the Fermi level. Note that there are broad states in the inter muffin-tin region forming almost flat DOS from −6 eV up to +6 eV. As the Te 5p states are primarily located in the occupied states, the unoccupied Mn 3d↓ states are energetically separated from the Te 5p states by the band gap.
The upper panel of Figure 8 shows the Mn 3d-derived spectra obtained via resonant photoemission and inverse-photoemission spectroscopies after background subtraction using Shirley’s method [53]. The observed Mn 3d↑ is located at −3.5 eV in the photoemission spectra, and Mn 3d↓ is located at +3.0 eV in the inverse-photoemission spectra. The experimental Ueff value is 6.5 eV, which is consistent with previous results [33,34,35,36].
It is now clear that the experimentally observed Mn 3d↑ energy position significantly deviates from the DFT + U calculation, whereas the observed Mn 3d↓ energy position agrees well. The theoretical peak separation between Mn 3d↑ and Mn 3d↓ amounts up to 9 eV, which is about 2.5 eV larger than the experimental value. If we set U = 0 eV, the peak separation reduces to 4 eV [37,38], but the band gap disappears. Although theoretical Mn 3d peak positions could be adjusted by U values, the ground-state properties such as magnetic moment are well reproduced by Ueff ~ 4–5 eV [14,47]. In addition, it is impossible to reproduce the observed satellite structure in the gap region between −10 eV and −7 eV within the DFT + U scheme.
Although the photoionization cross sections of the Te 5s and Te 5p orbitals are more than one order of magnitude smaller than that of Mn 3d around hν ~ 50 eV [54], the off-resonance spectrum in Figure 6 primarily reflects these states. The Te 5s states are located around −12 eV, and the Te 5p states extend from −7 eV up to the Fermi level. These states have been more clearly identified in the X-ray photoemission spectrum [41].
4. Discussion
While GW calculations generally provide more accurate descriptions of quasiparticle properties compared to DFT + U, a previous study reported that GW band dispersions for MnTe are qualitatively similar to those obtained from DFT + U calculations [55]. In this study, therefore, we have assumed that the DFT + U can provide reasonable ground state properties, and we introduce k-independent self-energy to simulate Mn 3d-derived spectral function. Figure 9 shows spectral functions with various ξ, η, and values. While the simulated spectral intensity for the satellite structure is stronger, we can reproduce the peak shift and appearance of the satellite structure, which cannot be explained by DFT + U calculations. Based on the fitting, the excitation energy ξ was estimated to be in the range of 6–7 eV, which is comparable with the experimental Ueff value. It suggests that the spectral features in the occupied region reflect charge excitations of the order of 6–7 eV.
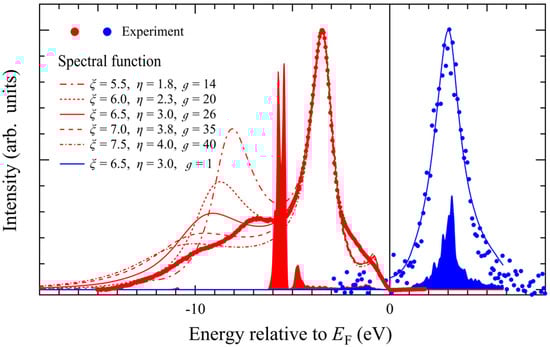
Figure 9.
Spectral function calculated using a model self-energy. Parameter values are listed in the legend. Experimental data points (filled circles) and DFT + U results for Mn 3d↑ (red area) and Mn 3d↓ (blue area) are also shown. To account for impurity/defect scattering effects and instrumental energy resolution, energy-independent lifetime broadenings of 0.2 eV (full width at half maximum, FWHM) and 0.8 eV (FWHM) were applied to the occupied and unoccupied states, respectively.
On the other hand, for the unoccupied region, the observed Mn 3d↓ peak coincide with the DFT + U results. In Figure 9, we used ξ = 6.5 eV with a much reduced value (intensity of the self-energy) to reproduce experimental results. It indicates significant difference of the dynamical relaxation in the hole addition process and electron addition process.
We assume this difference originates from the difference in the relaxation processes. For the occupied states, the Te 5p states are located near the Mn 3d↑ states. Therefore, there exist more relaxation channels via the p–d hybridization in the hole-addition process. One can interpret the peak at −3.5 eV in the spectral function as the final state relaxed by the p−d hybridization, likely corresponding to the final states in the CI cluster model calculation. Since the Te 5p states in MnTe are almost completely filled, the Te 5p contribution is small in the unoccupied states. Furthermore, the unoccupied Mn 3d↓ states are isolated by the band gap. We assume that the relaxation in the electron-addition process is, therefore, suppressed compared to the hole-addition process.
If we calculate the coupling parameter of the many-body interactions in Mn 3d states, we obtain , which is intermediate between (weakly correlated) and (strongly correlated). The effective mass enhancement factor is calculated to be , and the renormalization factor is . Since the valence-band maximum of pristine MnTe is predominantly derived from Te 5p states, electron correlation effects are expected to be weak. However, the substitution of Mn and/or Te with elements that enhance the contribution of d-orbitals near the valence band maximum could lead to pronounced correlation effects.
5. Conclusions
We have investigated the occupied and unoccupied electronic states of an altermagnetic MnTe single crystal using photoemission and inverse-photoemission spectroscopies. We have established a reproducible procedure for obtaining a clean MnTe(0001) surface through repeated sputtering and annealing cycles. The angle-resolved photoemission spectroscopy taken at hν = 117 eV exhibited a hole-like band dispersion, which is consistent with our DFT + U calculations along the AL and AH directions. The observed Mn 3d↑-derived peak at −3.5 eV, however, significantly deviated from the DFT + U calculations, whereas the Mn 3d↓-derived peak observed by inverse-photoemission spectroscopy agreed well with the DFT + U results. Based on simulations of the spectral function employing an ω-dependent self-energy, we found significant relaxation effects in the electron-removal process, whereas such effects were suppressed in the electron-addition process. Our study provides a comprehensive picture of the electronic states, forming a solid foundation for understanding the magnetic and transport properties of MnTe.
Author Contributions
Conceptualization, K.G.M. and K.S.; methodology, K.G.M., Y.K., S.K., M.A., H.S. and S.-i.I.; software, Y.K.; formal analysis, K.G.M., Y.K., H.Y. and K.S.; investigation, K.G.M., Y.K., H.Y., M.A. and H.S.; writing—original draft preparation, K.G.M. and Y.K.; writing—review and editing, S.K. and K.S.; supervision, S.-i.I. and K.S.; project administration, K.S.; funding acquisition, K.S. All authors have read and agreed to the published version of the manuscript.
Funding
K.G.M. acknowledges the MEXT fellowship. This work is partially supported by Grants-in-Aid for Scientific Research (Grant No. 22K03495).
Institutional Review Board Statement
The ARPES measurements were performed with the approval of the Proposal Assessing Committee of the Research Institute for Synchrotron Radiation Science (Proposal Nos. 23BG012, 25AU015, and 25AU016).
Informed Consent Statement
Not applicable.
Data Availability Statement
The original contributions presented in this study are included in the article. Further inquiries can be directed to the corresponding authors.
Acknowledgments
We acknowledge the experimental facilities (XRD and EPMA) at N-BARD, Hiroshima University. We thank N-BARD, Hiroshima University, for supplying the liquid helium.
Conflicts of Interest
The authors declare no conflicts of interest.
Correction Statement
This article has been republished with a minor correction to resolve spelling and grammatical errors. This change does not affect the scientific content of the article.
Abbreviations
The following abbreviations are used in this manuscript:
| ARPES | Angle-resolved photoemission spectroscopy |
| CI | Configuration Interaction |
| DFT | Density Functional Theory |
| DOS | Density of States |
| EPMA | Electron Probe Microanalysis |
| GGA | Generalized Gradient Approximation |
| IPES | Inverse-photoemission spectroscopy |
| MDC | Momentum Distribution Curve |
| PES | Photoemission spectroscopy |
| SEM | Scanning Electron Microscope |
| SOC | Spin–Orbit Coupling |
| XRD | X-ray Diffraction |
References
- Šmejkal, L.; Sinova, J.; Jungwirth, T. Beyond conventional ferromagnetism and antiferromagnetism: A phase with nonrelativistic spin and crystal rotation symmetry. Phys. Rev. X 2022, 12, 031042. [Google Scholar] [CrossRef]
- Mazin, I.; PRX editors. Editorial: Altermagnetism—A new punch line of fundamental magnetism. Phys. Rev. X 2022, 12, 040002. [Google Scholar] [CrossRef]
- Din, A.D.; Amin, O.J.; Wadley, P.; Edmonds, K.W. Antiferromagnetic spintronics and beyond. npj Spintron. 2024, 2, 25. [Google Scholar] [CrossRef]
- Kunitomi, N.; Hamaguchi, Y.; Anzai, S. Fictitious transitions of the crystallographic structure in manganese telluride at high temperatures. J. Phys. Soc. Jpn. 1963, 18, 744. [Google Scholar] [CrossRef]
- de Melo, O.; Leccabue, F.; Pelosi, C.; Sagredo, V.; Chourio, M.; Martin, J.; Bocelli, G.; Calestani, G. Crystal growth and characterization of MnTe single crystals. J. Cryst. Growth 1991, 110, 445–451. [Google Scholar] [CrossRef]
- Minikayev, R.; Dynowska, E.; Witkowska, B.; Bell, A.M.T.; Szuszkiewicz, W. Unit-cell dimensions of α-MnTe in the 295 K–1200 K temperature range. X-Ray Spectrom. 2015, 44, 394–397. [Google Scholar] [CrossRef]
- Kunitomi, N.; Hamaguchi, Y.; Anzai, S. Neutron diffraction study on manganese telluride. J. De Phys. 1964, 25, 568–574. [Google Scholar] [CrossRef]
- D'Sa, J.E.; Bhobe, P.; Priolkar, K.; Das, A.; Paranjpe, S.; Prabhu, R.; Sarode, P. Low-temperature neutron diffraction study of MnTe. J. Magn. Magn. Mater. 2004, 285, 267–271. [Google Scholar] [CrossRef]
- Szuszkiewicz, W.; Hennion, B.; Witkowska, B.; Łusakowska, E.; Mycielski, A. Neutron scattering study of structural and magnetic properties of hexagonal MnTe. Phys. Status Solidi 2005, 2, 1141–1146. [Google Scholar] [CrossRef]
- Krause, M.; Bechstedt, F. Structural and magnetic properties of MnTe phases from ab initio calculations. J. Supercond. Nov. Magn. 2012, 26, 1963–1972. [Google Scholar] [CrossRef]
- Moseley, D.H.; Taddei, K.M.; Yan, J.; McGuire, M.A.; Calder, S.; Polash, M.M.H.; Vashaee, D.; Zhang, X.; Zhao, H.; Parker, D.S.; et al. Giant doping response of magnetic anisotropy in MnTe. Phys. Rev. Mater. 2022, 6, 014404. [Google Scholar] [CrossRef]
- Zanmarchi, G. Optical measurements on the antiferromagnetic semiconductor MnTe. J. Phys. Chem. Solids 1967, 28, 2123–2130. [Google Scholar] [CrossRef]
- Allen, J.W.; Lucovsky, G.; Mikkelsen, J.C., Jr. Optical properties and electronic structure of crossroads material MnTe. Solid State Commun. 1977, 24, 367–370. [Google Scholar] [CrossRef]
- Mori, S.; Sutou, Y.; Ando, D.; Koike, J. Optical and electrical properties of α-MnTe thin films deposited using rf magnetron sputtering. Mater. Trans. 2018, 59, 1506–1512. [Google Scholar] [CrossRef]
- Ferrer-Roca, C.; Segura, A.; Reig, C.; Muñoz, V. Temperature and pressure dependence of the optical absorption in hexagonal MnTe. Phys. Rev. B 2000, 61, 13679–13686. [Google Scholar] [CrossRef]
- Kim, B.; Kim, I.; Min, B.-K.; Oh, M.; Park, S.; Lee, H. Thermoelectric properties of non-stoichiometric MnTe compounds. Electron. Mater. Lett. 2013, 9, 477–480. [Google Scholar] [CrossRef]
- Zheng, Y.; Lu, T.; Polash, M.H.; Rasoulianboroujeni, M.; Liu, N.; Manley, M.E.; Deng, Y.; Sun, P.J.; Chen, X.L.; Hermann, R.P.; et al. Paramagnon drag in high thermoelectric figure of merit Li-doped MnTe. Sci. Adv. 2019, 5, eaat9461. [Google Scholar] [CrossRef]
- Luo, Y.; Wang, J.; Yang, J.; Mao, D.; Cui, J.; Jia, B.; Liu, X.; Nielsch, K.; Xu, X.; He, J. Microstructural iterative reconstruction toward excellent thermoelectric performance in MnTe. Energy Environ. Sci. 2023, 16, 3743–3752. [Google Scholar] [CrossRef]
- Zulkifal, S.; Wang, Z.; Zhang, X.; Siddique, S.; Yu, Y.; Wang, C.; Gong, Y.; Li, S.; Li, D.; Zhang, Y.; et al. Multiple valence bands convergence and localized lattice engineering lead to superhigh thermoelectric figure of merit in MnTe. Adv. Sci. 2023, 10, e2206342. [Google Scholar] [CrossRef]
- Wasscher, J.D.; Haas, C. Contribution of magnon-drag to the thermoelectric power of antiferromagnetic MnTe. Phys. Lett. 1964, 8, 302–304. [Google Scholar] [CrossRef]
- Polash, M.M.H.; Vashaee, D. Magnon-bipolar carrier drag thermopower in antiferromagnetic/ferromagnetic semiconductors: Theoretical formulation and experimental evidence. Phys. Rev. B 2020, 102, 045202. [Google Scholar] [CrossRef]
- Polash, M.H.; Stone, M.; Chi, S.; Vashaee, D. Designing Spin-Crossover Systems to Enhance Thermopower and Thermoelectric Figure-of-Merit in Paramagnetic Materials. Energy Environ. Mater. 2024, 8, e12822. [Google Scholar] [CrossRef]
- Kriegner, D.; Výborný, K.; Olejník, K.; Reichlová, H.; Novák, V.; Marti, X.; Gazquez, J.; Saidl, V.; Němec, P.; Volobuev, V.V.; et al. Multiple-stable anisotropic magnetoresistance memory in antiferromagnetic MnTe. Nat. Commun. 2016, 7, 11623. [Google Scholar] [CrossRef]
- Kriegner, D.; Reichlova, H.; Grenzer, J.; Schmidt, W.; Ressouche, E.; Godinho, J.; Wagner, T.; Martin, S.Y.; Shick, A.B.; Volobuev, V.V.; et al. Magnetic anisotropy in antiferromagnetic hexagonal MnTe. Phys. Rev. B 2017, 96, 214418. [Google Scholar] [CrossRef]
- Komatsubara, T.; Murakami, M.; Hirahara, E. Magnetic properties of manganese telluride single crystals. J. Phys. Soc. Jpn. 1963, 18, 356–364. [Google Scholar] [CrossRef]
- Lee, S.; Lee, S.; Jung, S.; Jung, J.; Kim, D.; Lee, Y.; Seok, B.; Kim, J.; Park, B.G.; Šmejkal, L.; et al. Broken Kramers Degeneracy in Altermagnetic MnTe. Phys. Rev. Lett. 2024, 132, 036702. [Google Scholar] [CrossRef]
- Krempaský, J.; Šmejkal, L.; D’souza, S.W.; Hajlaoui, M.; Springholz, G.; Uhlířová, K.; Alarab, F.; Constantinou, P.C.; Strocov, V.; Usanov, D.; et al. Altermagnetic lifting of Kramers spin degeneracy. Nature 2024, 626, 517–522. [Google Scholar] [CrossRef] [PubMed]
- Chilcote, M.; Mazza, A.R.; Lu, Q.; Gray, I.; Tian, Q.; Deng, Q.; Moseley, D.; Chen, A.H.; Lapano, J.; Gardner, J.S.; et al. Stoichiometry-Induced Ferromagnetism in Altermagnetic Candidate MnTe. Adv. Funct. Mater. 2024, 34, 2405829. [Google Scholar] [CrossRef]
- Osumi, T.; Souma, S.; Aoyama, T.; Yamauchi, K.; Honma, A.; Nakayama, K.; Takahashi, T.; Ohgushi, K.; Sato, T. Observation of a giant band splitting in altermagnetic MnTe. Phys. Rev. B 2024, 109, 115102. [Google Scholar] [CrossRef]
- Ozawa, K.; Anzai, S.; Hamaguchi, Y. Effect of pressure on the magnetic transition point of manganese telluride. Phys. Lett. 1966, 20, 132–133. [Google Scholar] [CrossRef]
- Sugiura, H.; Sawaoka, A.; Saito, S.; Inoue, K. Effect of pressure on the Néel temperature and the lattice parameter of MnTe. J. Phys. Chem. Solids 1979, 40, 701–705. [Google Scholar] [CrossRef]
- Sattigeri, R.M.; Cuono, G.; Autieri, C. Altermagnetic surface states: Towards the observation and utilization of altermagnetism in thin films, interfaces and topological materials. Nanoscale 2023, 15, 16998–17005. [Google Scholar] [CrossRef]
- Sato, H.; Tamura, M.; Happo, N.; Mihara, T.; Taniguchi, M.; Mizokawa, T.; Fujimori, A.; Ueda, Y. Electronic structure of NiAs-type MnTe studied by photoemission and inverse-photoemission spectroscopies. Solid State Commun. 1994, 92, 921–924. [Google Scholar] [CrossRef]
- Sato, H.; Tamura, M.; Happo, N.; Mihara, T.; Taniguchi, M.; Mizokawa, T.; Fujimori, A.; Ueda, Y. Electronic structure of NiAs-type MnTe. J. Magn. Magn. Mater. 1995, 140–144, 153–154. [Google Scholar] [CrossRef]
- Sato, H.; Mihara, T.; Furuta, A.; Tamura, M.; Mimura, K.; Happo, N.; Taniguchi, M.; Ueda, Y. Chemical trend of occupied and unoccupied Mn 3d states in MnY (Y = S, Se, Te). Phys. Rev. B 1997, 56, 7222–7231. [Google Scholar] [CrossRef]
- Sato, H.; Kani, Y.; Ueda, Y.; Nagasaki, F.; Senba, S.; Namatame, H.; Taniguchi, M. Mn 3p–3d resonant inverse-photoemission spectroscopy of NiAs-type MnTe. Surf. Rev. Lett. 2002, 09, 341–345. [Google Scholar] [CrossRef]
- Wei, S.-H.; Zunger, A. Total-energy and band-structure calculations for the semimagnetic Cd1−xMnxTe semiconductor alloy and its binary constituents. Phys. Rev. B 1987, 35, 2340–2365. [Google Scholar] [CrossRef] [PubMed]
- Podgorny, M. Electronic structure of ordered ferro- and antiferromagnetic phases of Cd1−xMnxTe semimagnetic semiconductor. Eur. Phys. J. B 1988, 69, 501–509. [Google Scholar] [CrossRef]
- Sato, H.; Tanaka, A.; Furuta, A.; Senba, S.; Okuda, H.; Mimura, K.; Nakatake, M.; Ueda, Y.; Taniguchi, M.; Jo, T. Resonant Photoemission Spectroscopy in the Mn 2p–3d Excitation Region of NiAs-Type MnTe. J. Phys. Soc. Jpn. 1999, 68, 2132–2138. [Google Scholar] [CrossRef]
- Zaanen, J.; Sawatzky, G.A.; Allen, J.W. Band gaps and electronic structure of transition-metal compounds. Phys. Rev. Lett. 1985, 55, 418–421. [Google Scholar] [CrossRef]
- Iwanowski, R.; Heinonen, M.; Witkowska, B. X-ray photoelectron study of NiAs-type MnTe. J. Alloy. Compd. 2010, 491, 13–17. [Google Scholar] [CrossRef]
- Shimada, K.; Arita, M.; Matsui, T.; Goto, K.; Qiao, S.; Yoshida, K.; Taniguchi, M.; Namatame, H.; Sekitani, T.; Tanaka, K.; et al. Linear undulator beamline at a compact storage ring (HiSOR). Nucl. Instrum. Methods Phys. Res. A 2001, 467–468, 504–507. [Google Scholar] [CrossRef]
- Iwasawa, H.; Shimada, K.; Schwier, E.F.; Zheng, M.; Kojima, Y.; Hayashi, H.; Jiang, J.; Higashiguchi, M.; Aiura, Y.; Namatame, H.; et al. Rotatable high-resolution ARPES system for tunable linear-polarization geometry. J. Synchrotron Radiat. 2017, 24, 836–841. [Google Scholar] [CrossRef]
- Wortmann, D.; Michalicek, G.; Baadji, N.; Beida, W.; Betzinger, M.; Bihlmayer, G.; Bornhake, T.; Bröder, J.; Burnus, T.; Enkovaara, J.; et al. “Fleur,” Zenodo, 2023. Available online: https://zenodo.org/records/13833162 (accessed on 8 August 2022).
- Perdew, J.P.; Burke, K.; Ernzerhof, M. Generalized gradient approximation made simple. Phys. Rev. Lett. 1996, 77, 3865–3868. [Google Scholar] [CrossRef] [PubMed]
- Perdew, J.P.; Zunger, A. Self-interaction correction to density-functional approximations for many-electron systems. Phys. Rev. B 1981, 23, 5048–5079. [Google Scholar] [CrossRef]
- Youn, S.J.; Min, B.I.; Freeman, A.J. Crossroads electronic structure of MnS, MnSe, and MnTe. Phys. Status Solidi 2004, 241, 1411–1414. [Google Scholar] [CrossRef]
- Rodríguez-Carvajal, J. Recent advances in magnetic structure determination by neutron powder diffraction. Phys. B Condens. Matter 1993, 192, 55–69. [Google Scholar] [CrossRef]
- Miyai, Y.; Ideta, S.-I.; Arita, M.; Tanaka, K.; Oda, M.; Kurosawa, T.; Shimada, K. Dual origin in the temperature dependence of the coupling parameter for the strange metal state in heavily overdoped cuprate superconductor. Phys. Rev. Res. 2025, 7, L012039. [Google Scholar] [CrossRef]
- Kaznacheyev, K.V.; Muro, T.; Matsushita, T.; Iwasaki, T.; Kuwata, Y.; Harada, H.; Suga, S.; Ishii, H.; Miyahara, T.; Mizokawa, T.; et al. Electronic structure of pyrite-type MnTe2 studied by photoelectron spectroscopy. Phys. Rev. B 1998, 58, 13491–13497. [Google Scholar] [CrossRef]
- Xu, Y.; Li, W.; Wang, C.; Chen, Z.; Wu, Y.; Zhang, X.; Li, J.; Lin, S.; Chen, Y.; Pei, Y. MnTe2 as a novel promising thermoelectric material. J. Mater. 2018, 4, 215–220. [Google Scholar] [CrossRef]
- Jiang, J.; Shimada, K.; Hayashi, H.; Iwasawa, H.; Aiura, Y.; Namatame, H.; Taniguchi, M. Coupling parameters of many-body interactions for the Al(100) surface state: A high-resolution angle-resolved photoemission spectroscopy study. Phys. Rev. B 2011, 84, 155124. [Google Scholar] [CrossRef]
- Shirley, D.A. High-resolution x-ray photoemission spectrum of the valence bands of gold. Phys. Rev. B 1972, 5, 4709–4714. [Google Scholar] [CrossRef]
- Yeh, J.J.; Lindau, I. Atomic subshell photoionization cross sections and asymmetry parameters: 1 ≤ Z ≤ 103. At. Data Nucl. Data Tables 1985, 32, 1–155. [Google Scholar] [CrossRef]
- Junior, P.E.F.; de Mare, K.A.; Zollner, K.; Ahn, K.-H.; Erlingsson, S.I.; van Schilfgaarde, M.; Výborný, K. Sensitivity of the MnTe valence band to the orientation of magnetic moments. Phys. Rev. B 2023, 107, L100417. [Google Scholar] [CrossRef]


Disclaimer/Publisher’s Note: The statements, opinions and data contained in all publications are solely those of the individual author(s) and contributor(s) and not of MDPI and/or the editor(s). MDPI and/or the editor(s) disclaim responsibility for any injury to people or property resulting from any ideas, methods, instructions or products referred to in the content. |
© 2025 by the authors. Licensee MDPI, Basel, Switzerland. This article is an open access article distributed under the terms and conditions of the Creative Commons Attribution (CC BY) license (https://creativecommons.org/licenses/by/4.0/).