
Numerical Analysis of Cement Placement into Drilling Fluid in Oilwell Applications


Abstract
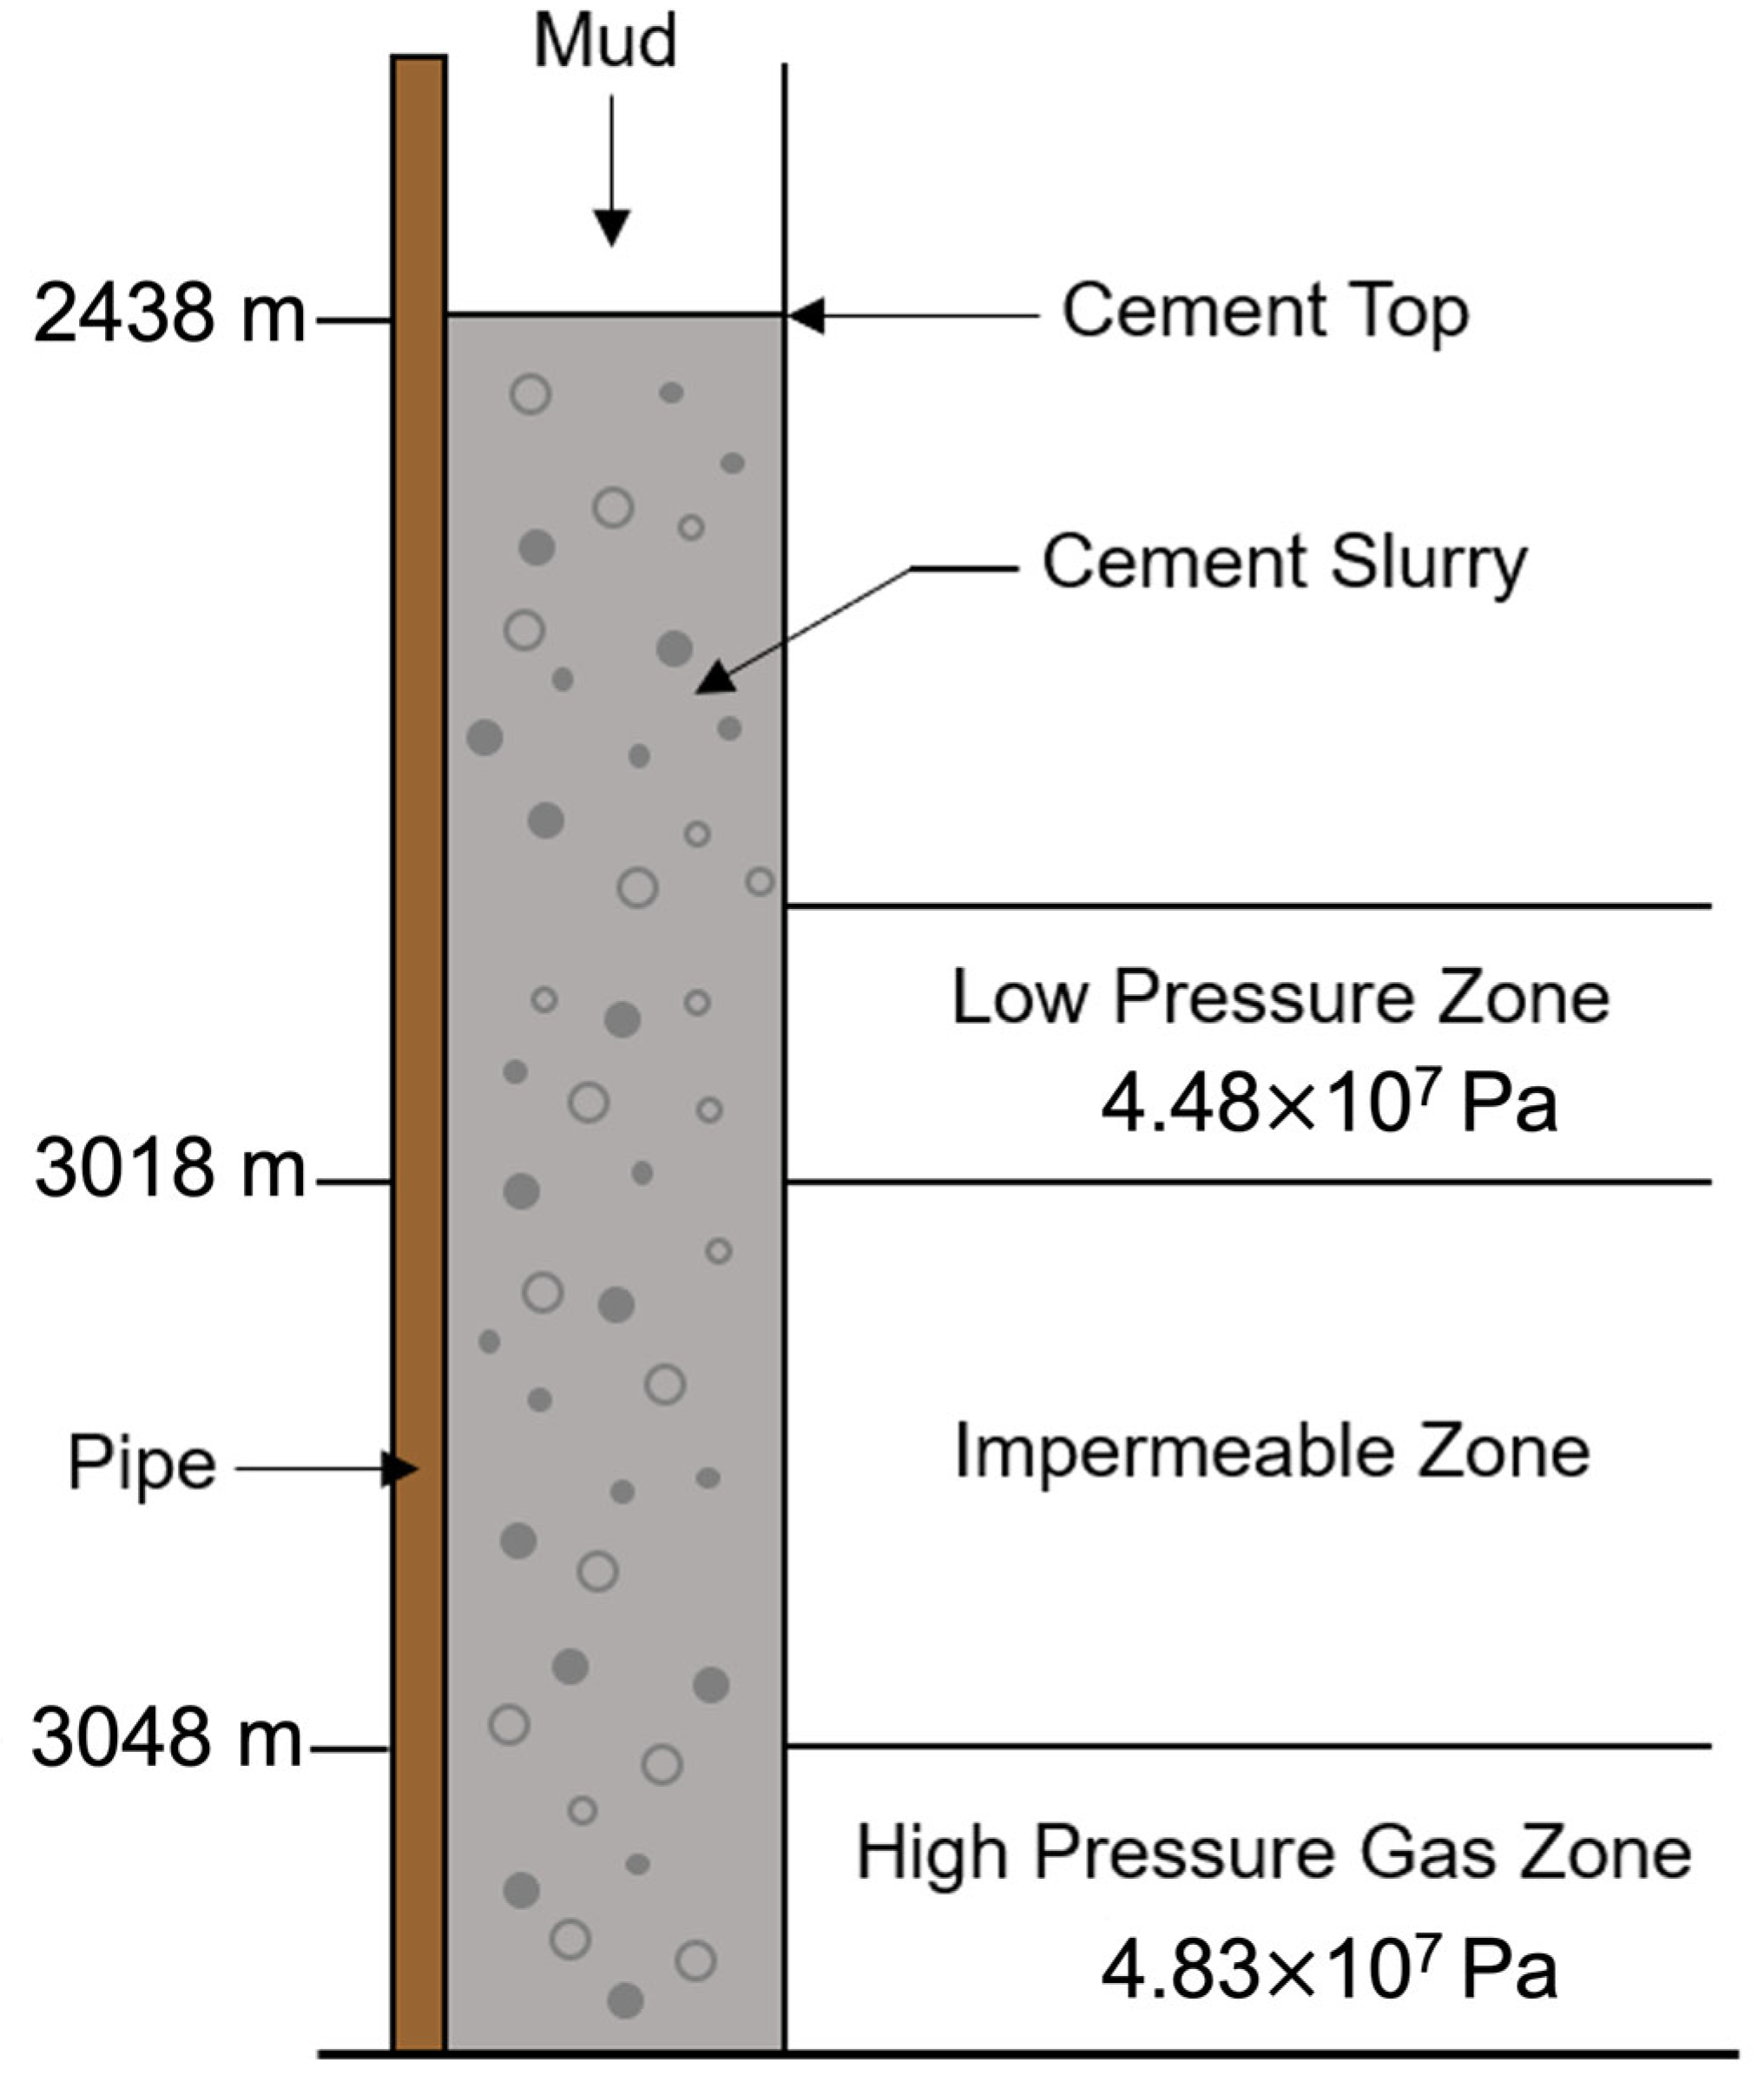
1. Introduction
2. Governing Equations and Constitutive Relations
2.1. Governing Equations
2.2. Constitutive Relations
2.2.1. Interfacial Interaction Between the Two Fluids
2.2.2. Stress Tensor
2.3. Assumptions and Boundary Conditions
- (1)
- The mass fraction of the drilling fluid in the entire calculation domain is 1.
- (2)
- The mass fraction of the cement slurry is 0.
- (1)
- Inlet boundary condition: For the cement slurry inlet velocity, which is downward, we used the following values: 0.5 m/s, 0.2 m/s, and 0.05 m/s.
- (2)
- Wall boundary condition: The walls are standard walls with no slip.
- (3)
- Outlet condition: Outflow.
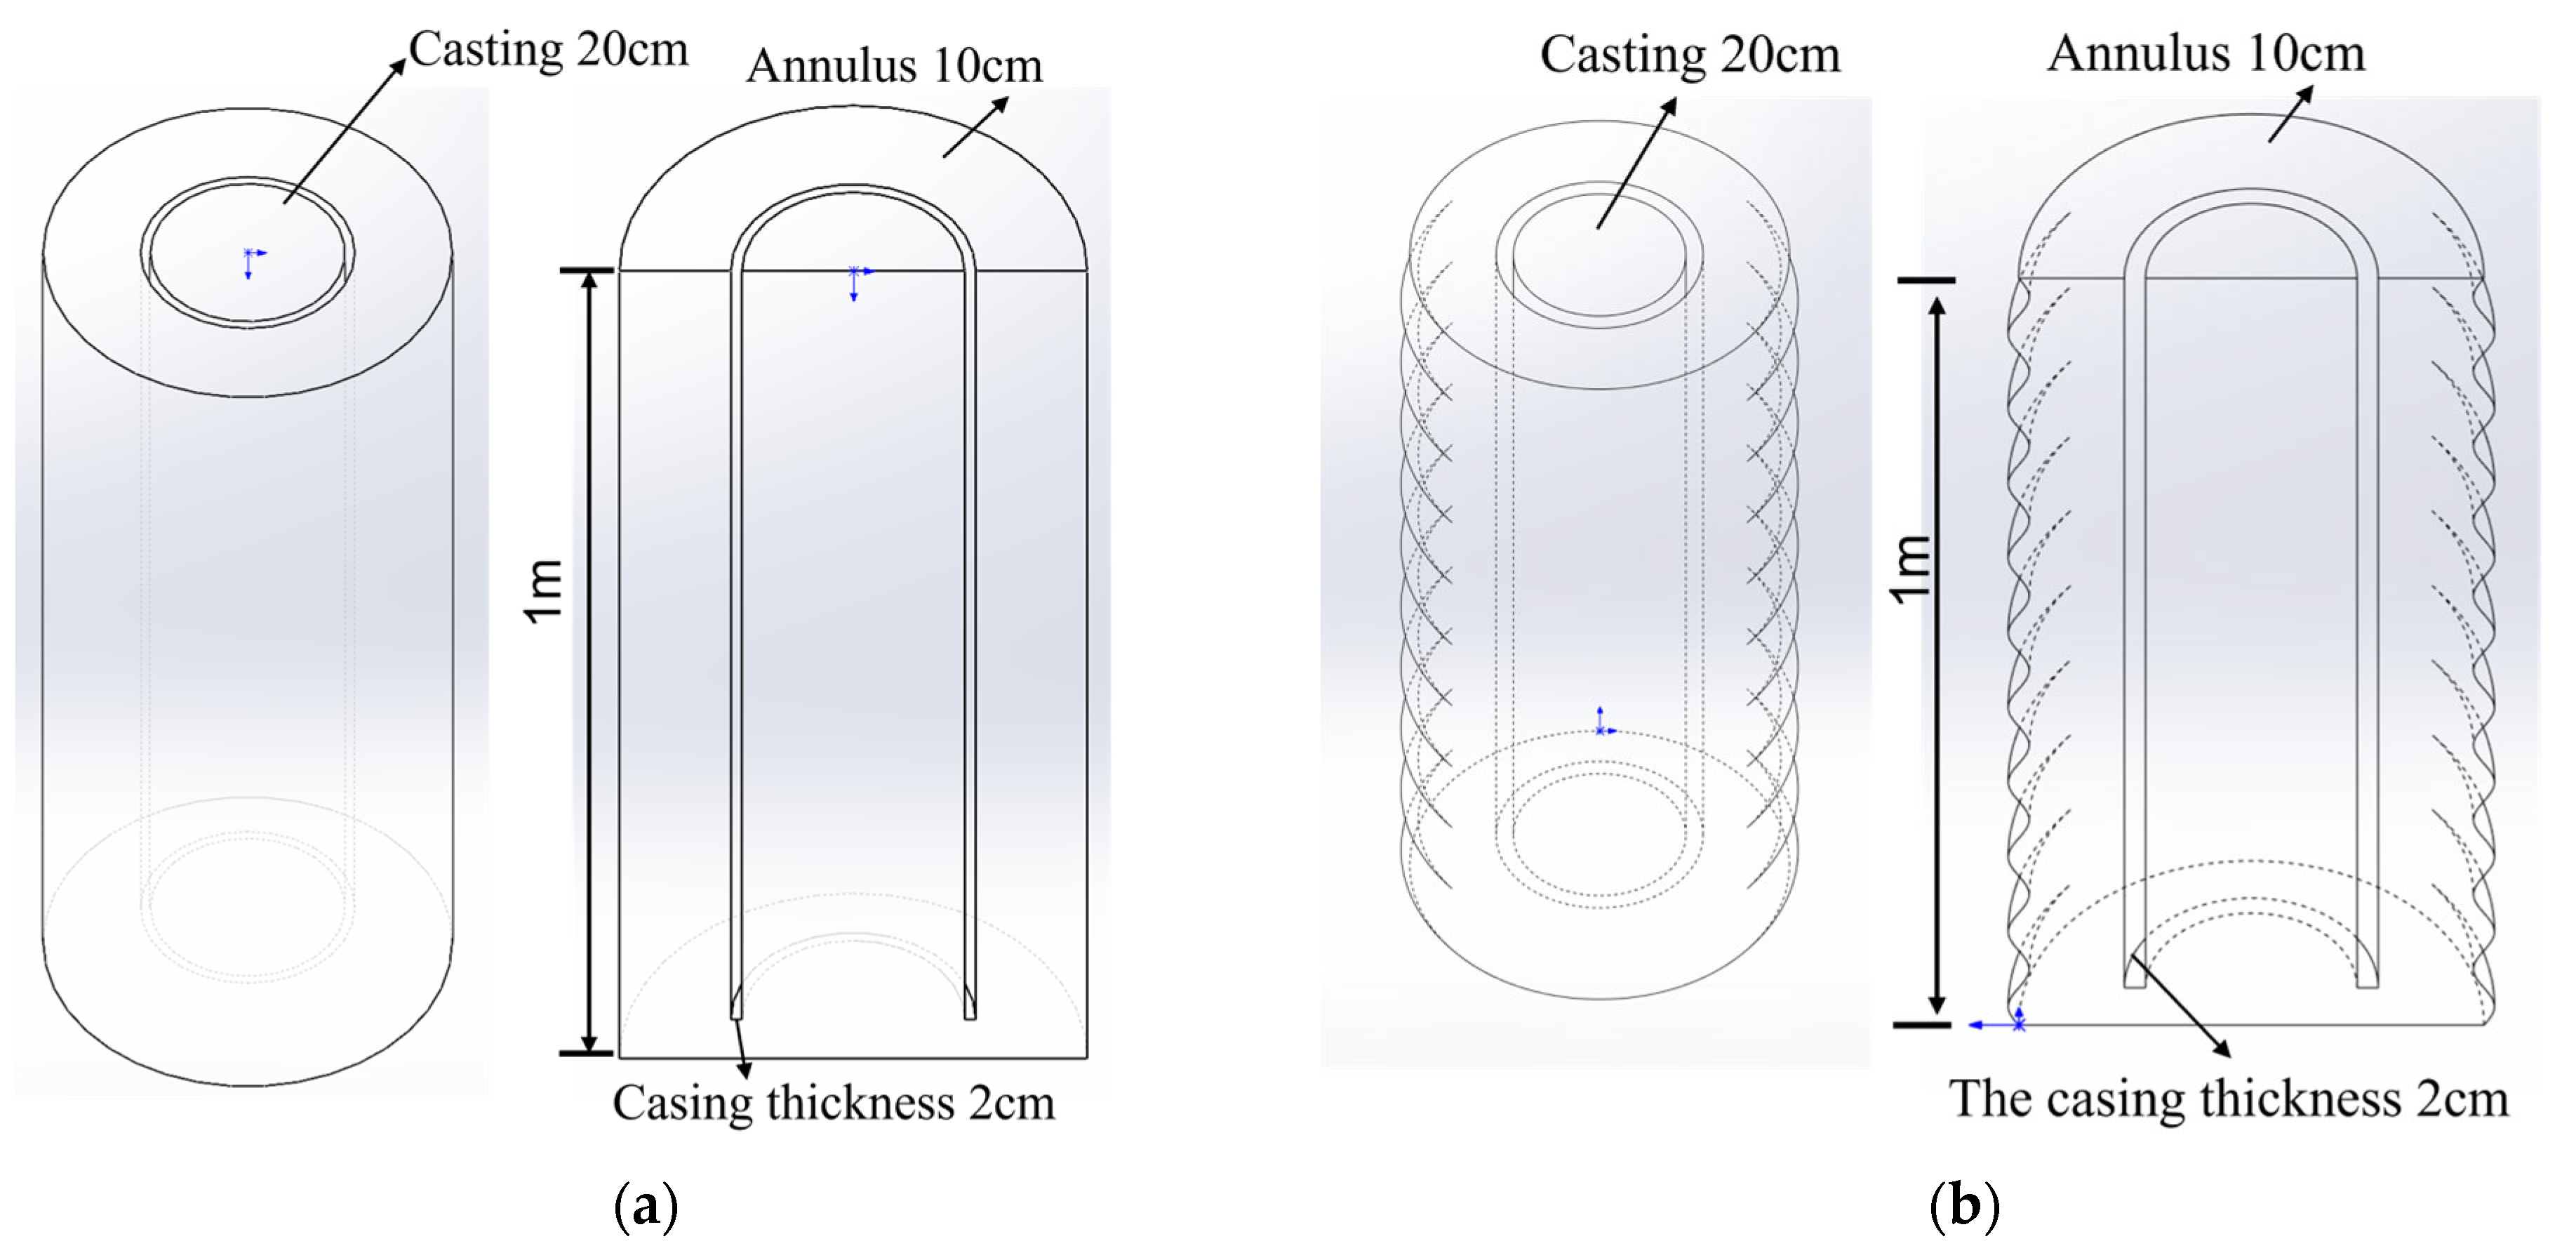
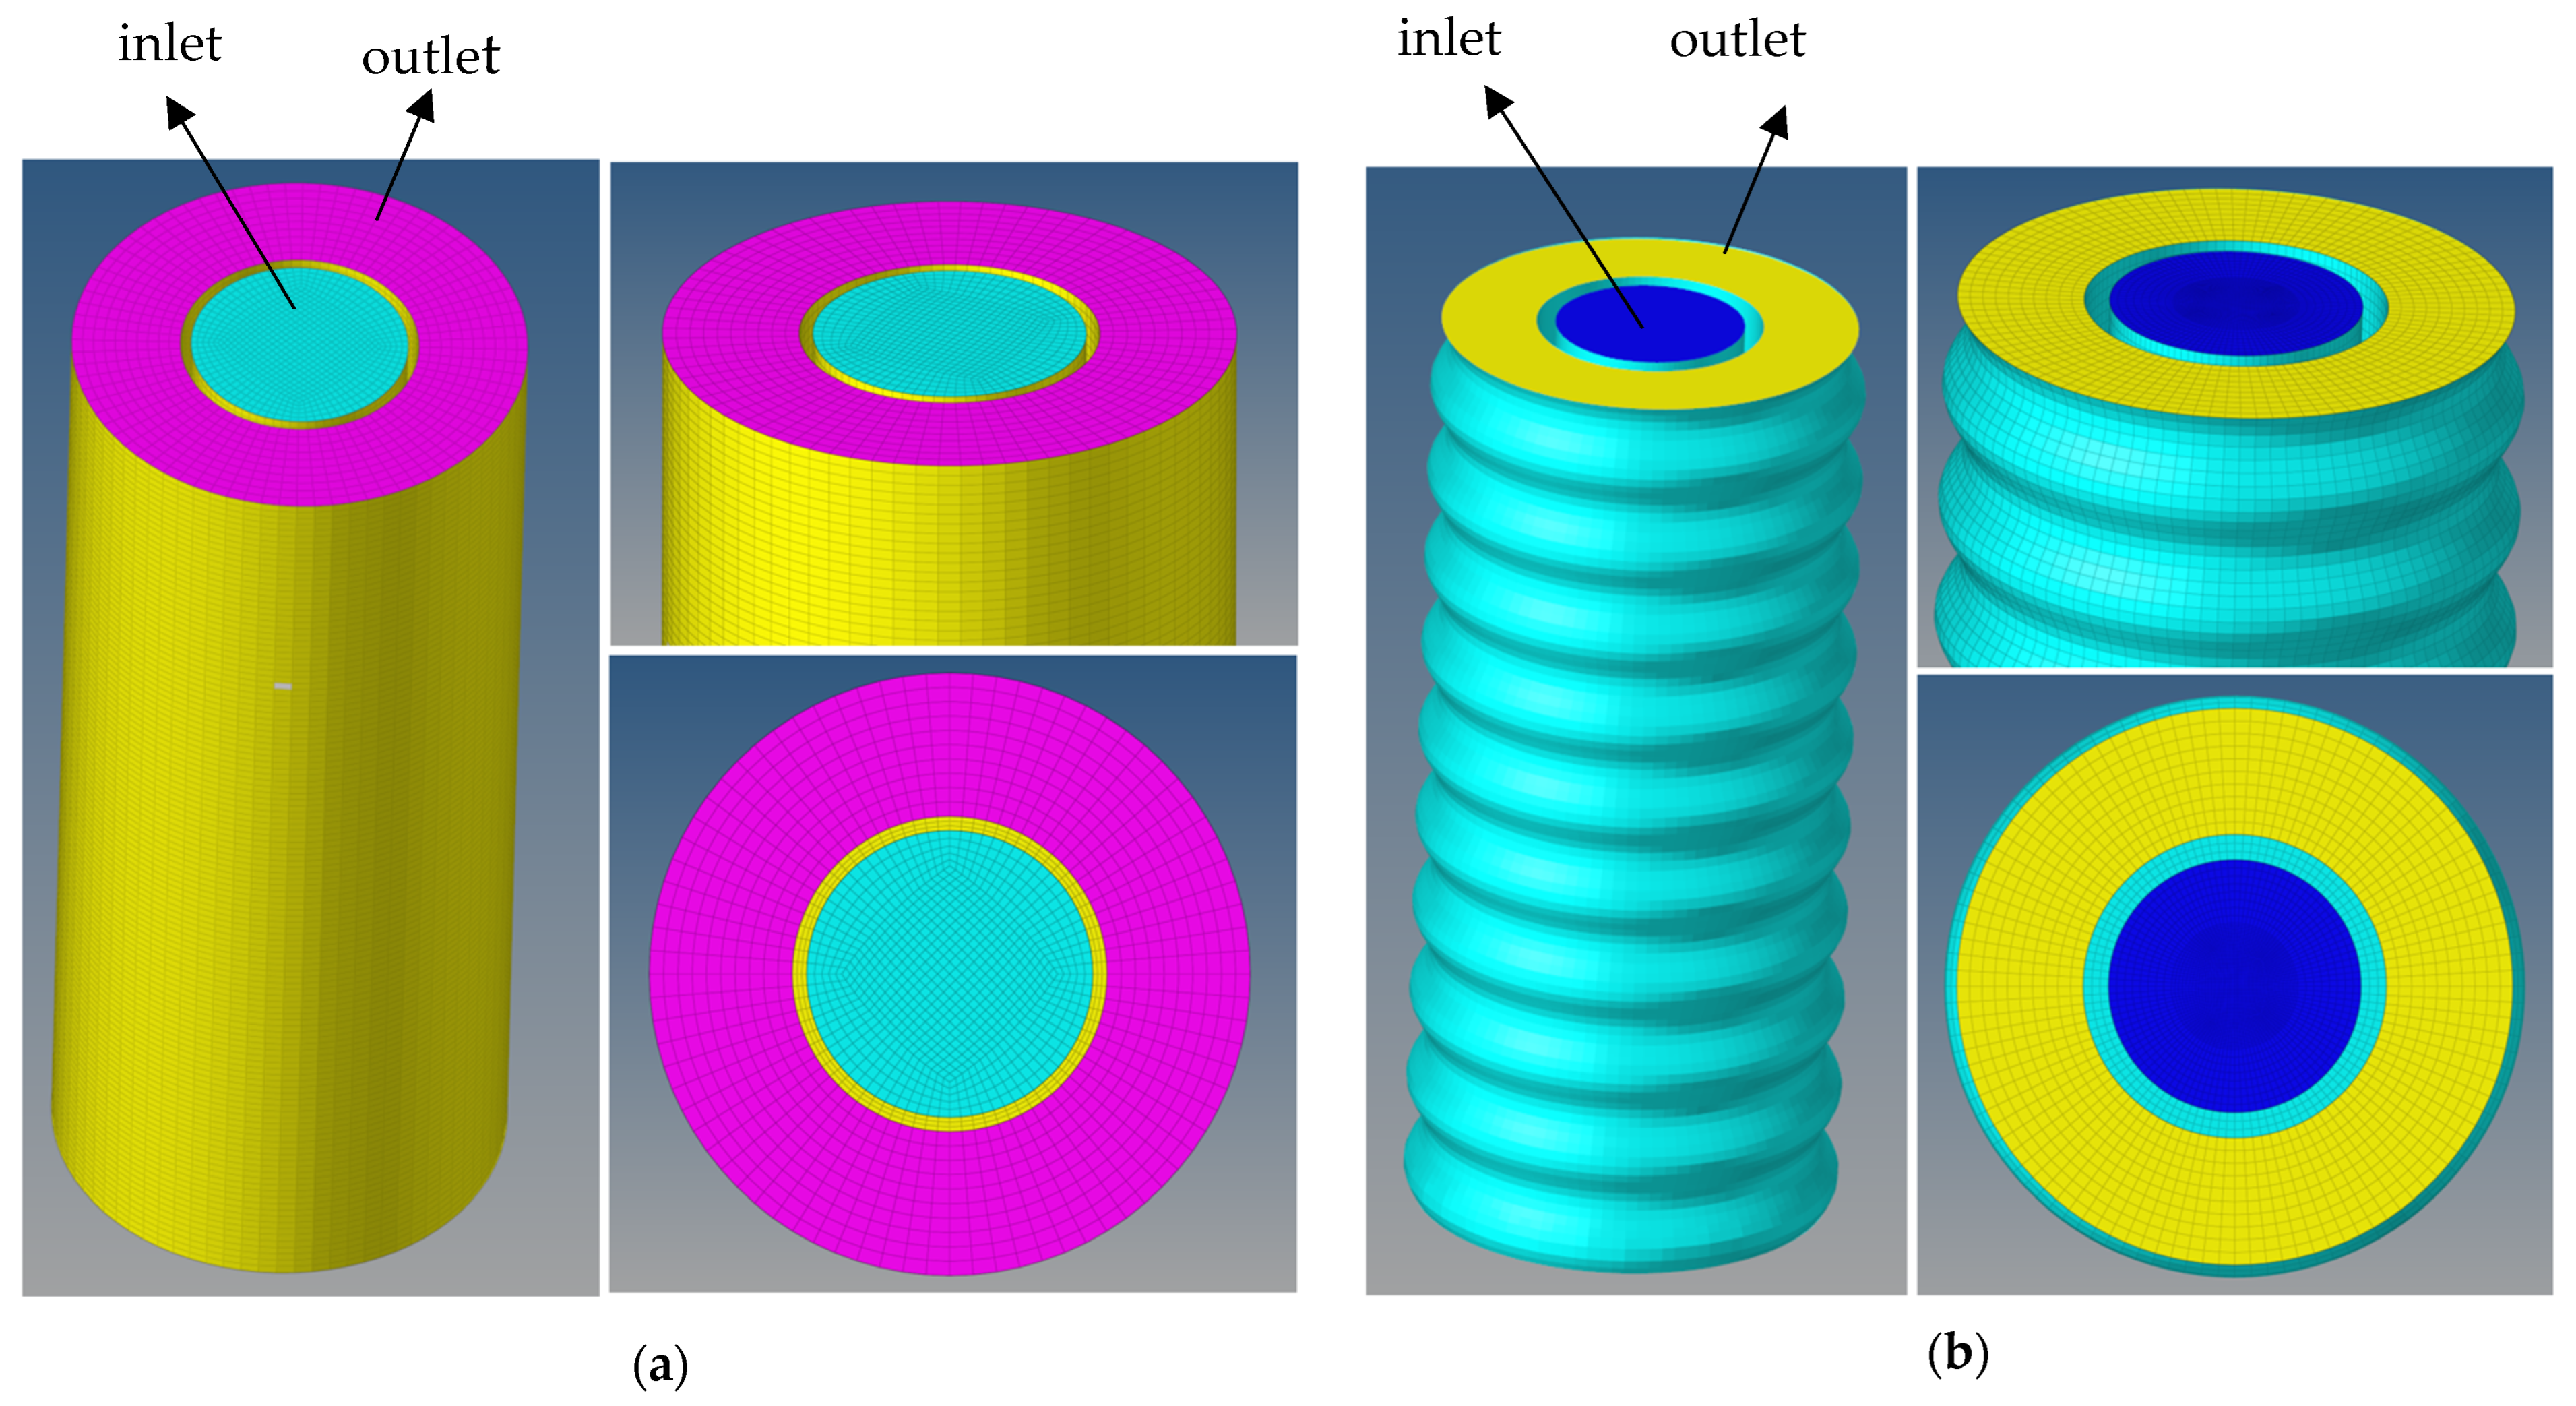
3. Geometry and Mesh
4. Numerical Results and Discussion
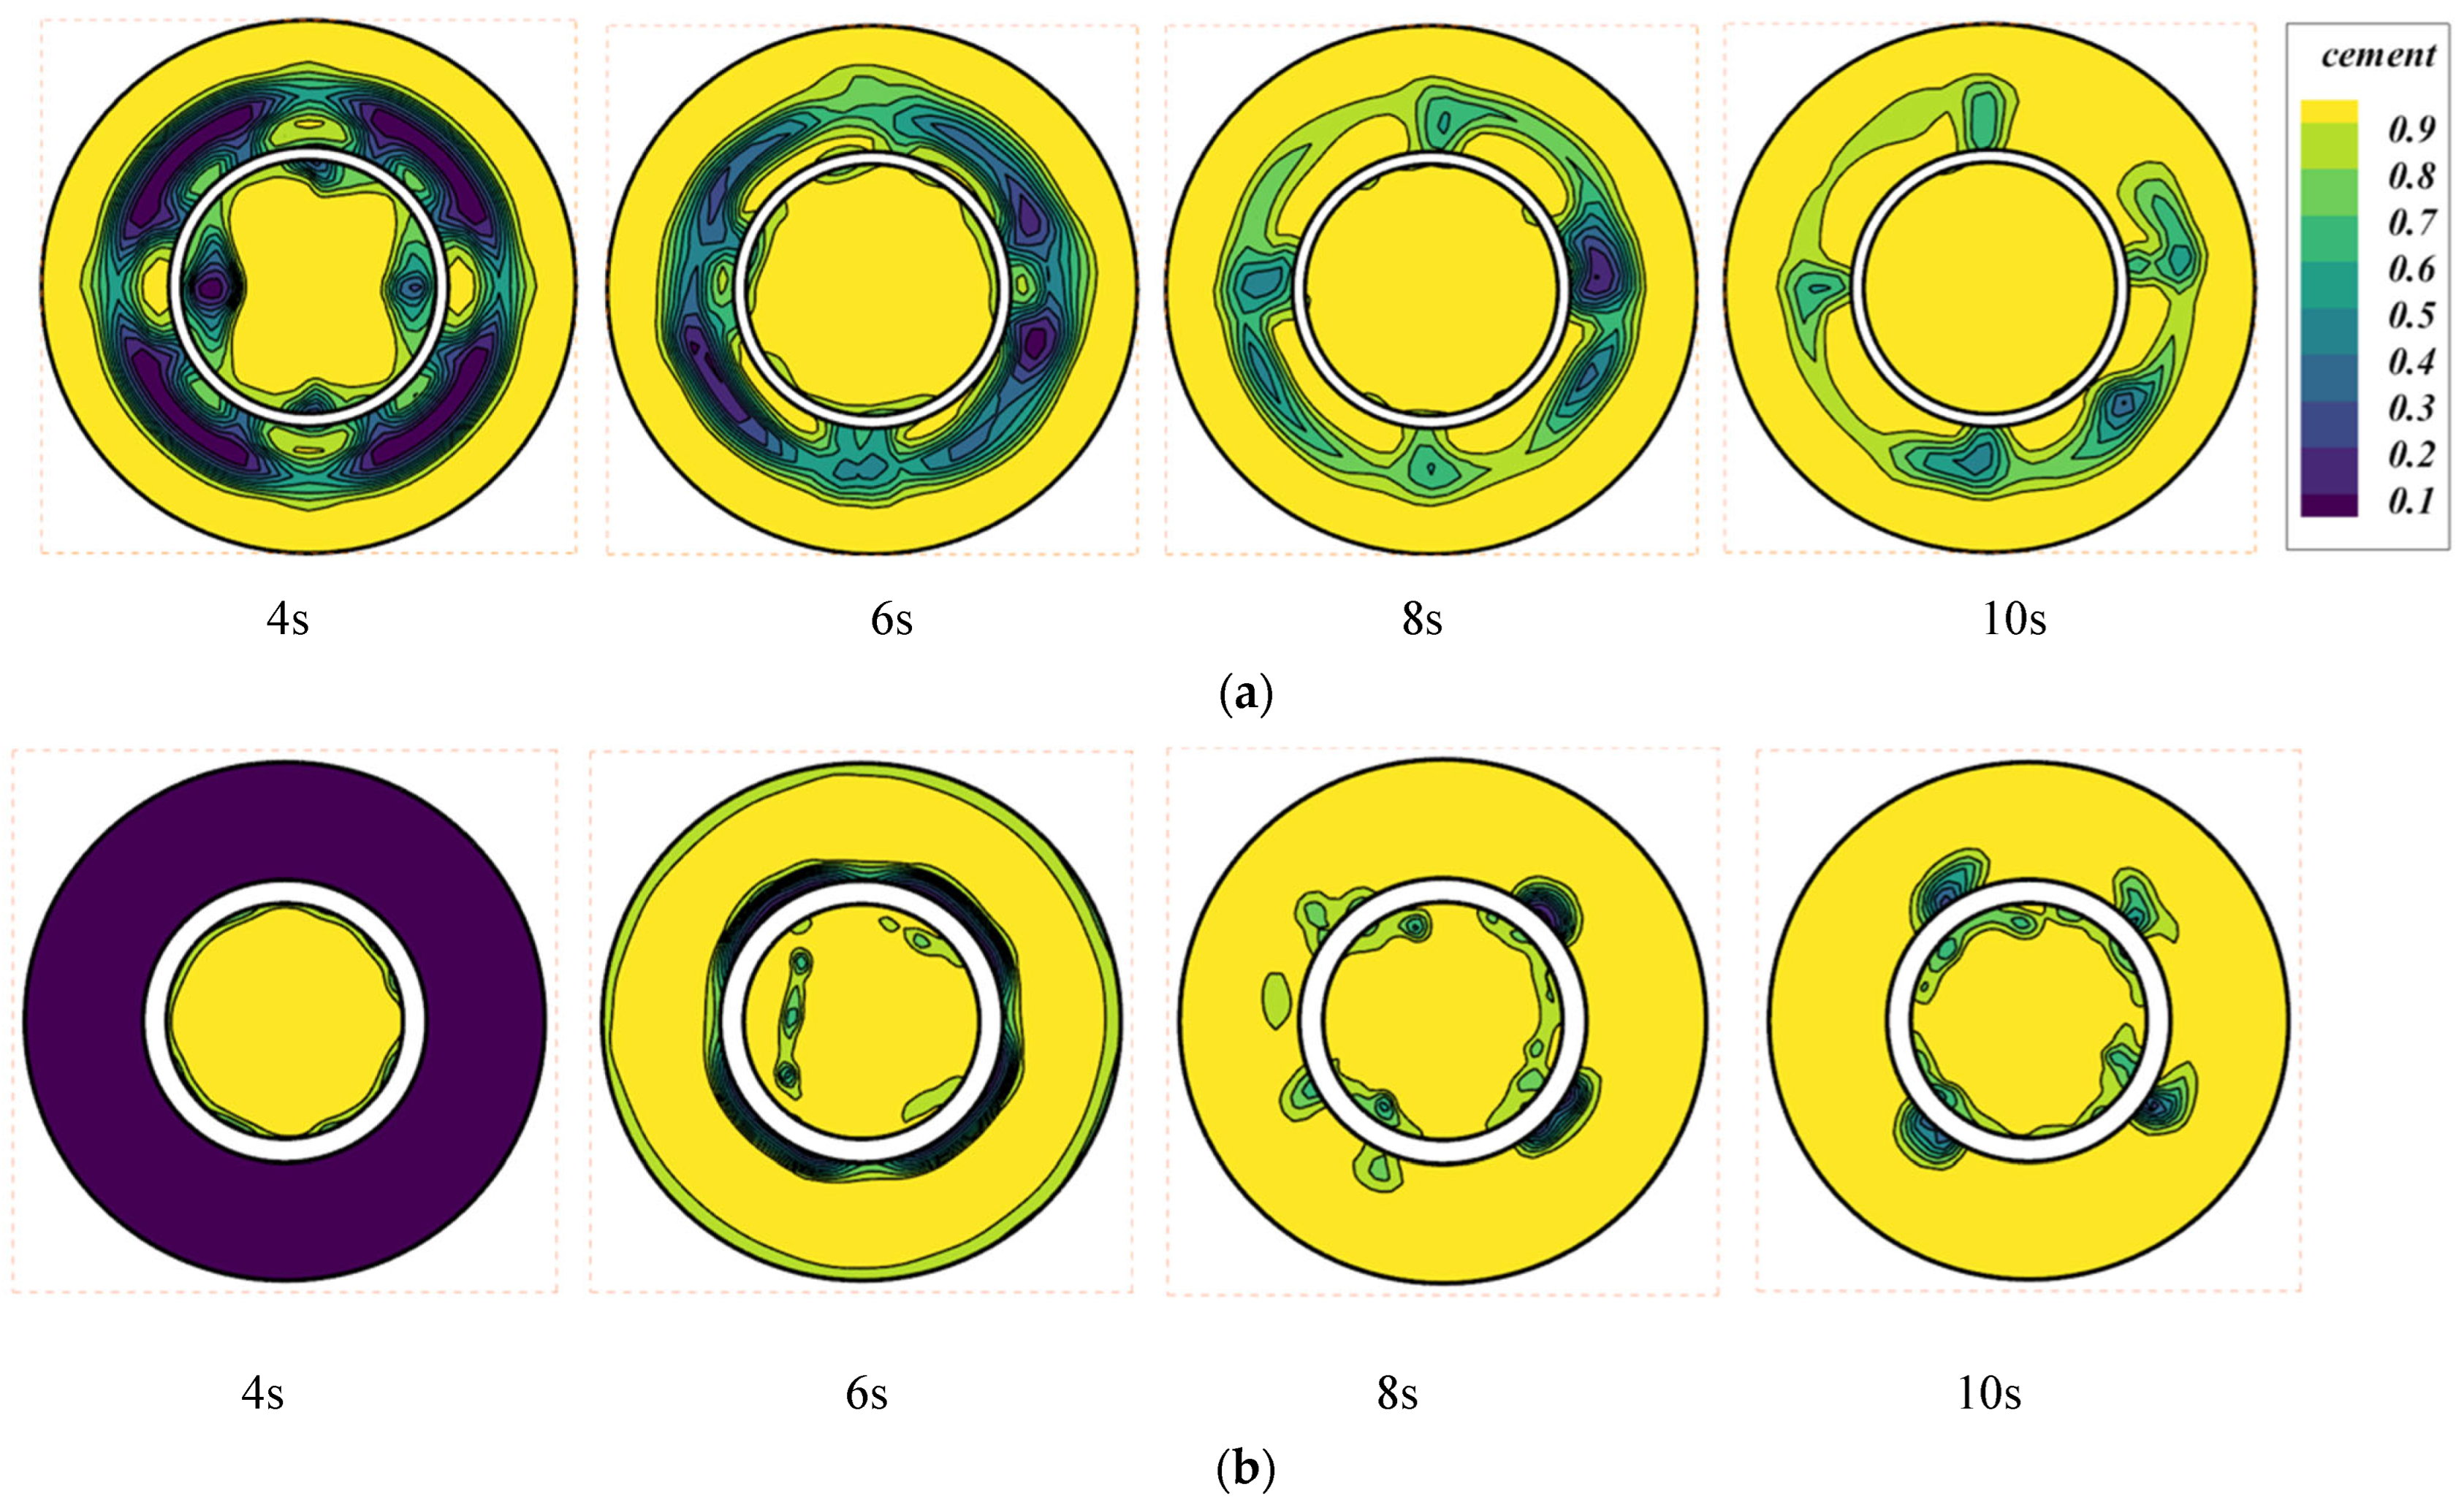
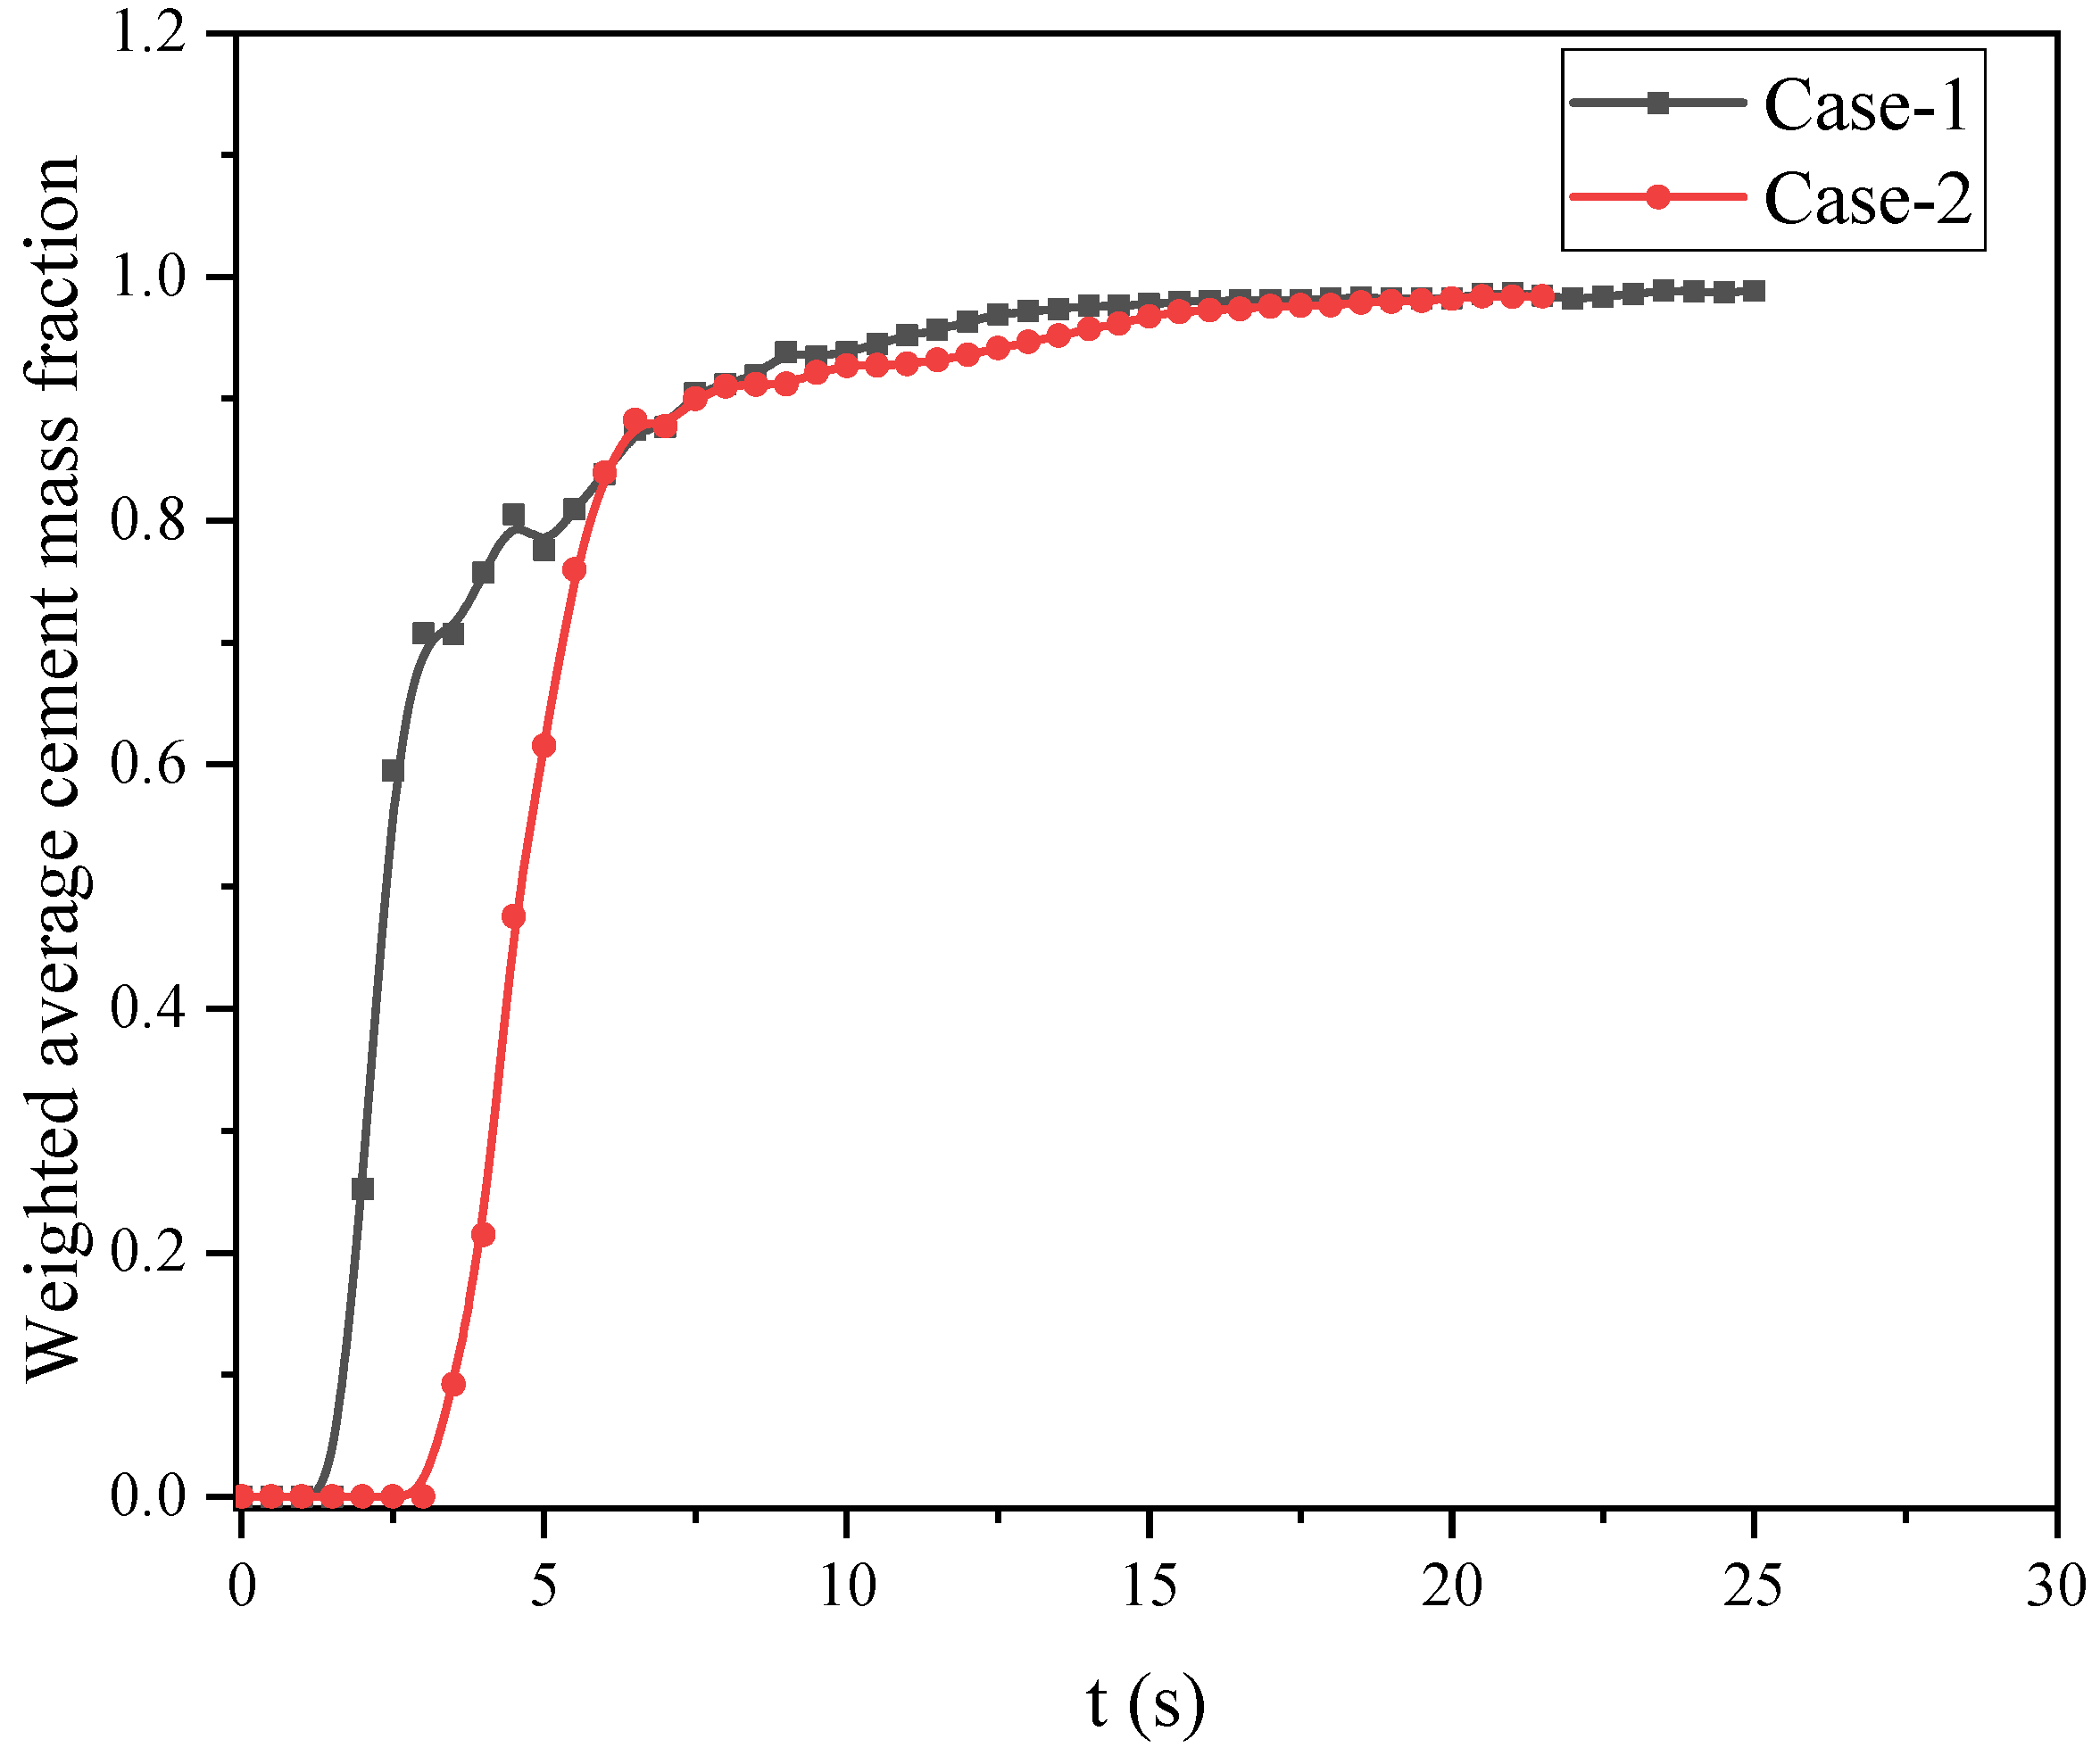
4.1. Mass Fraction of Cement Phase in Different Cases Under Uniform Velocity Conditions
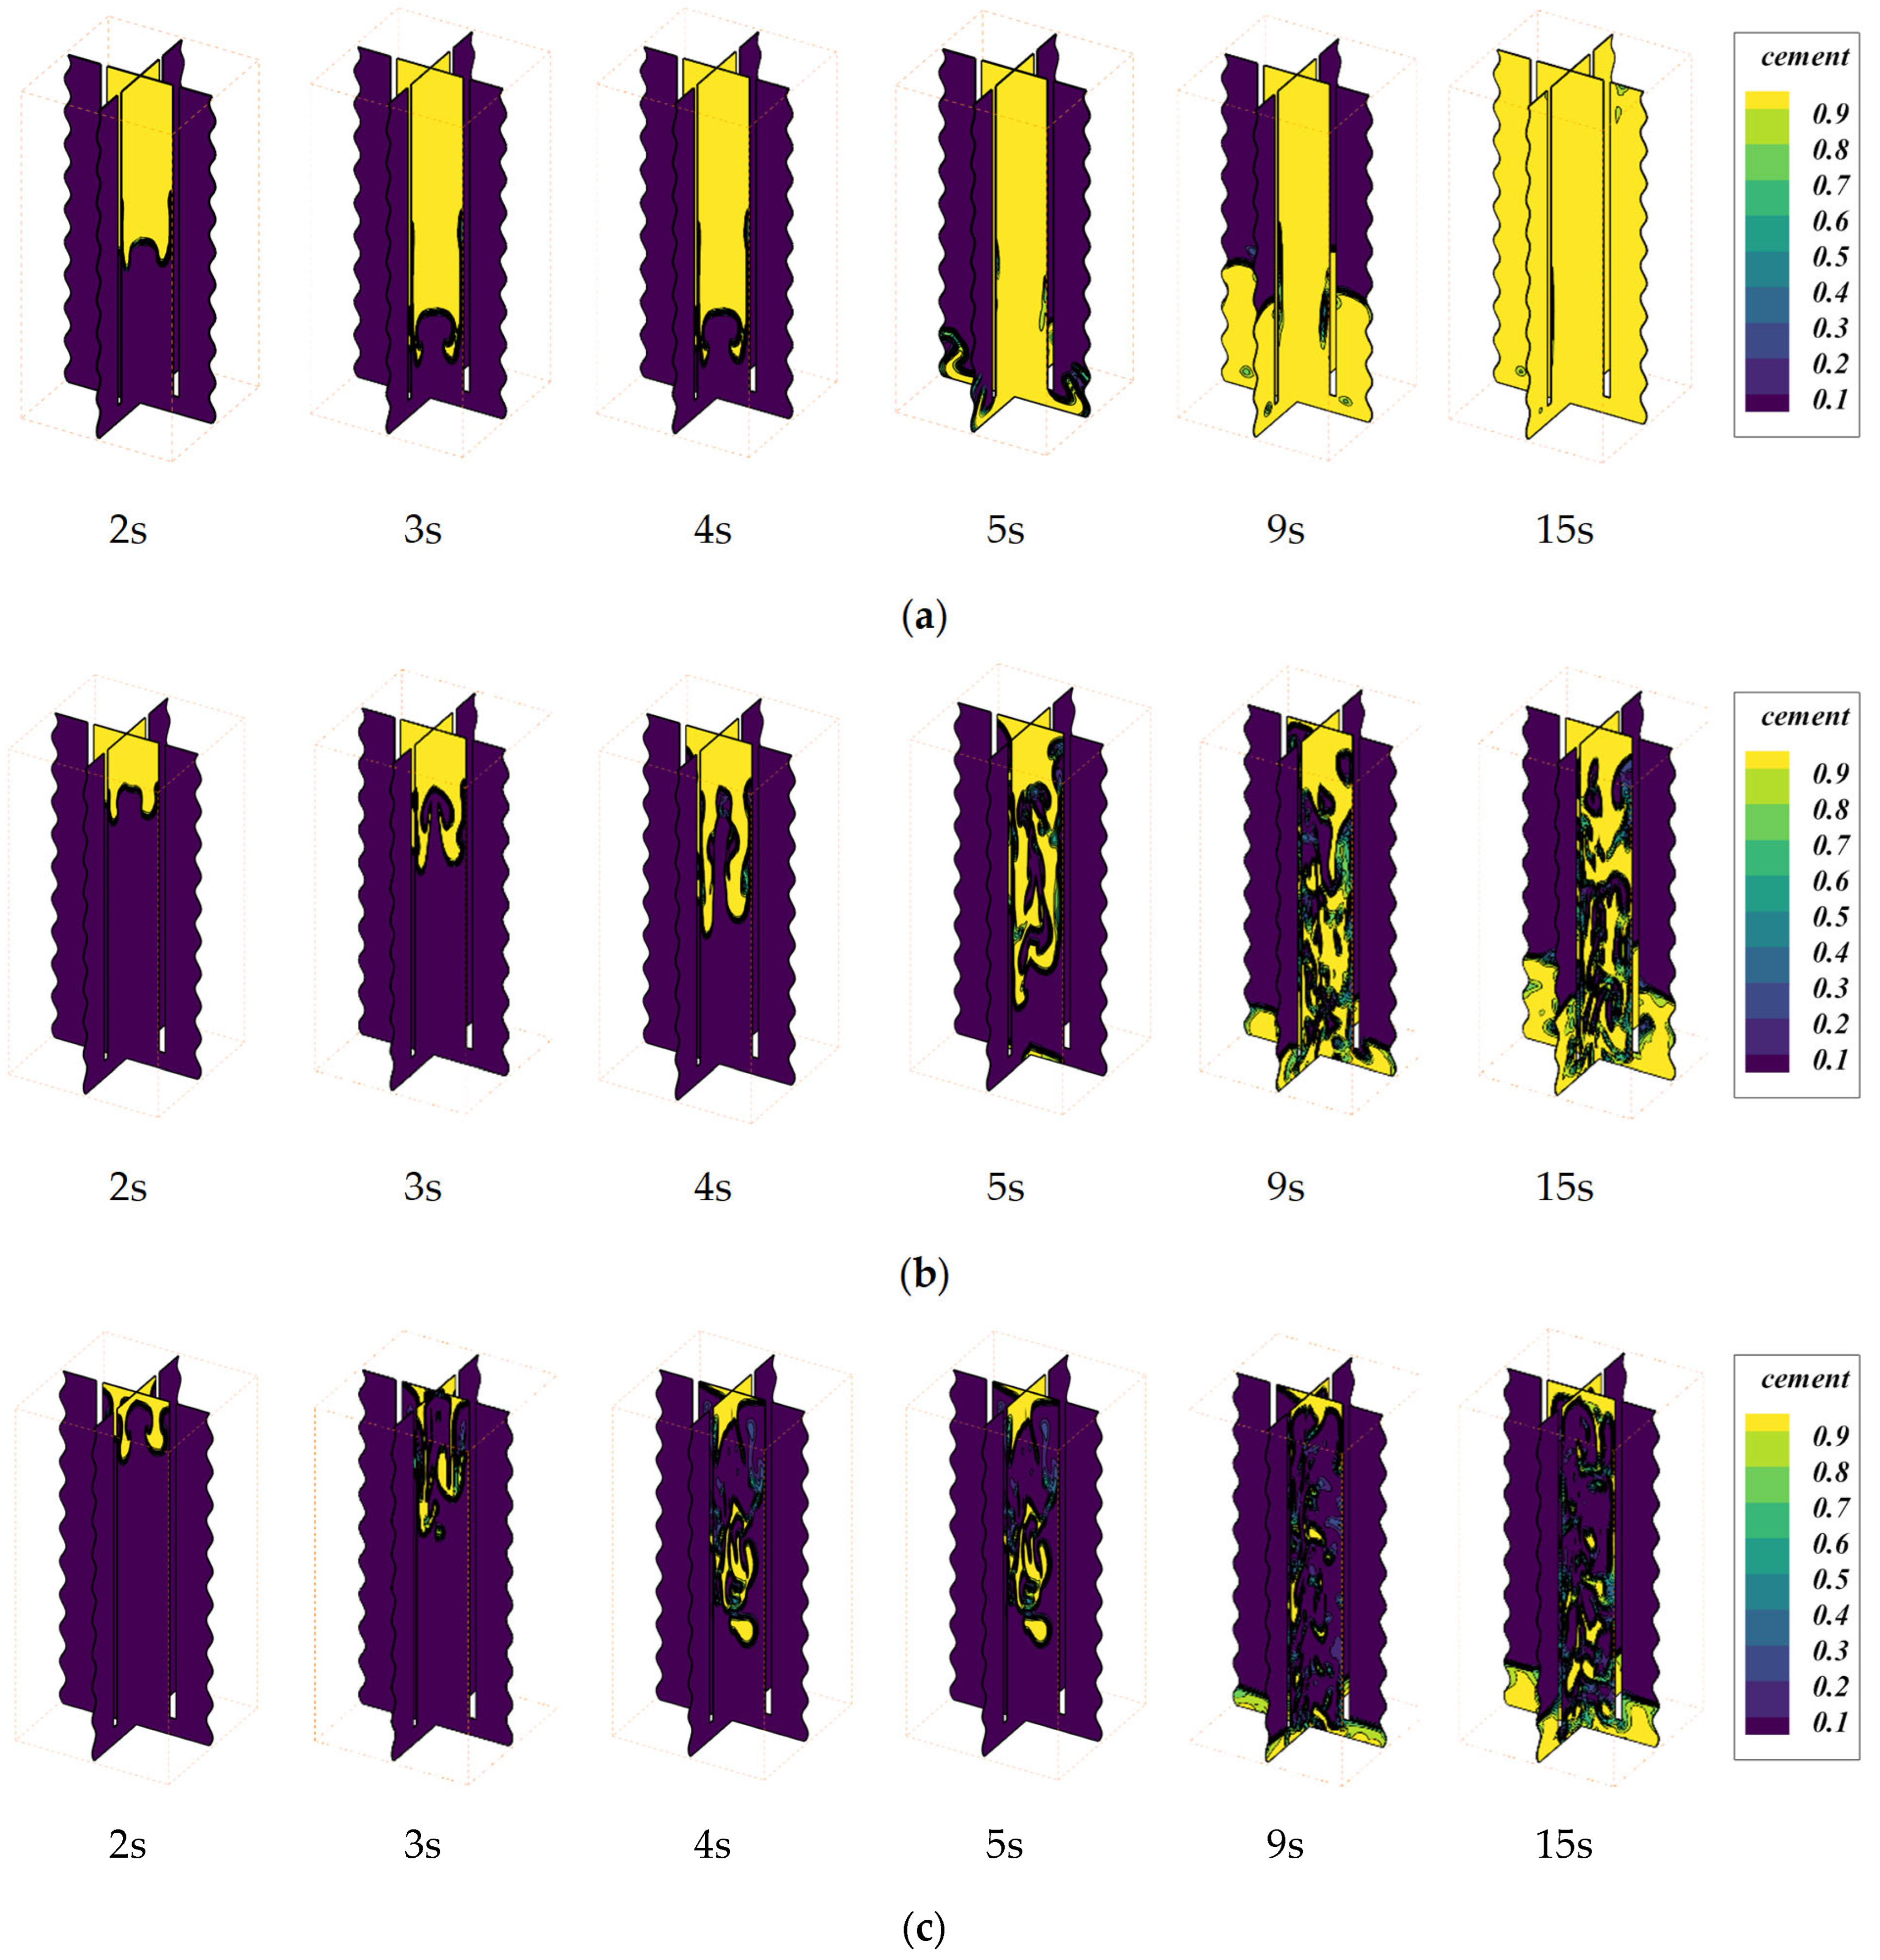
4.2. Variation of Cement Phase in Case-2 Under Different Inlet Velocities
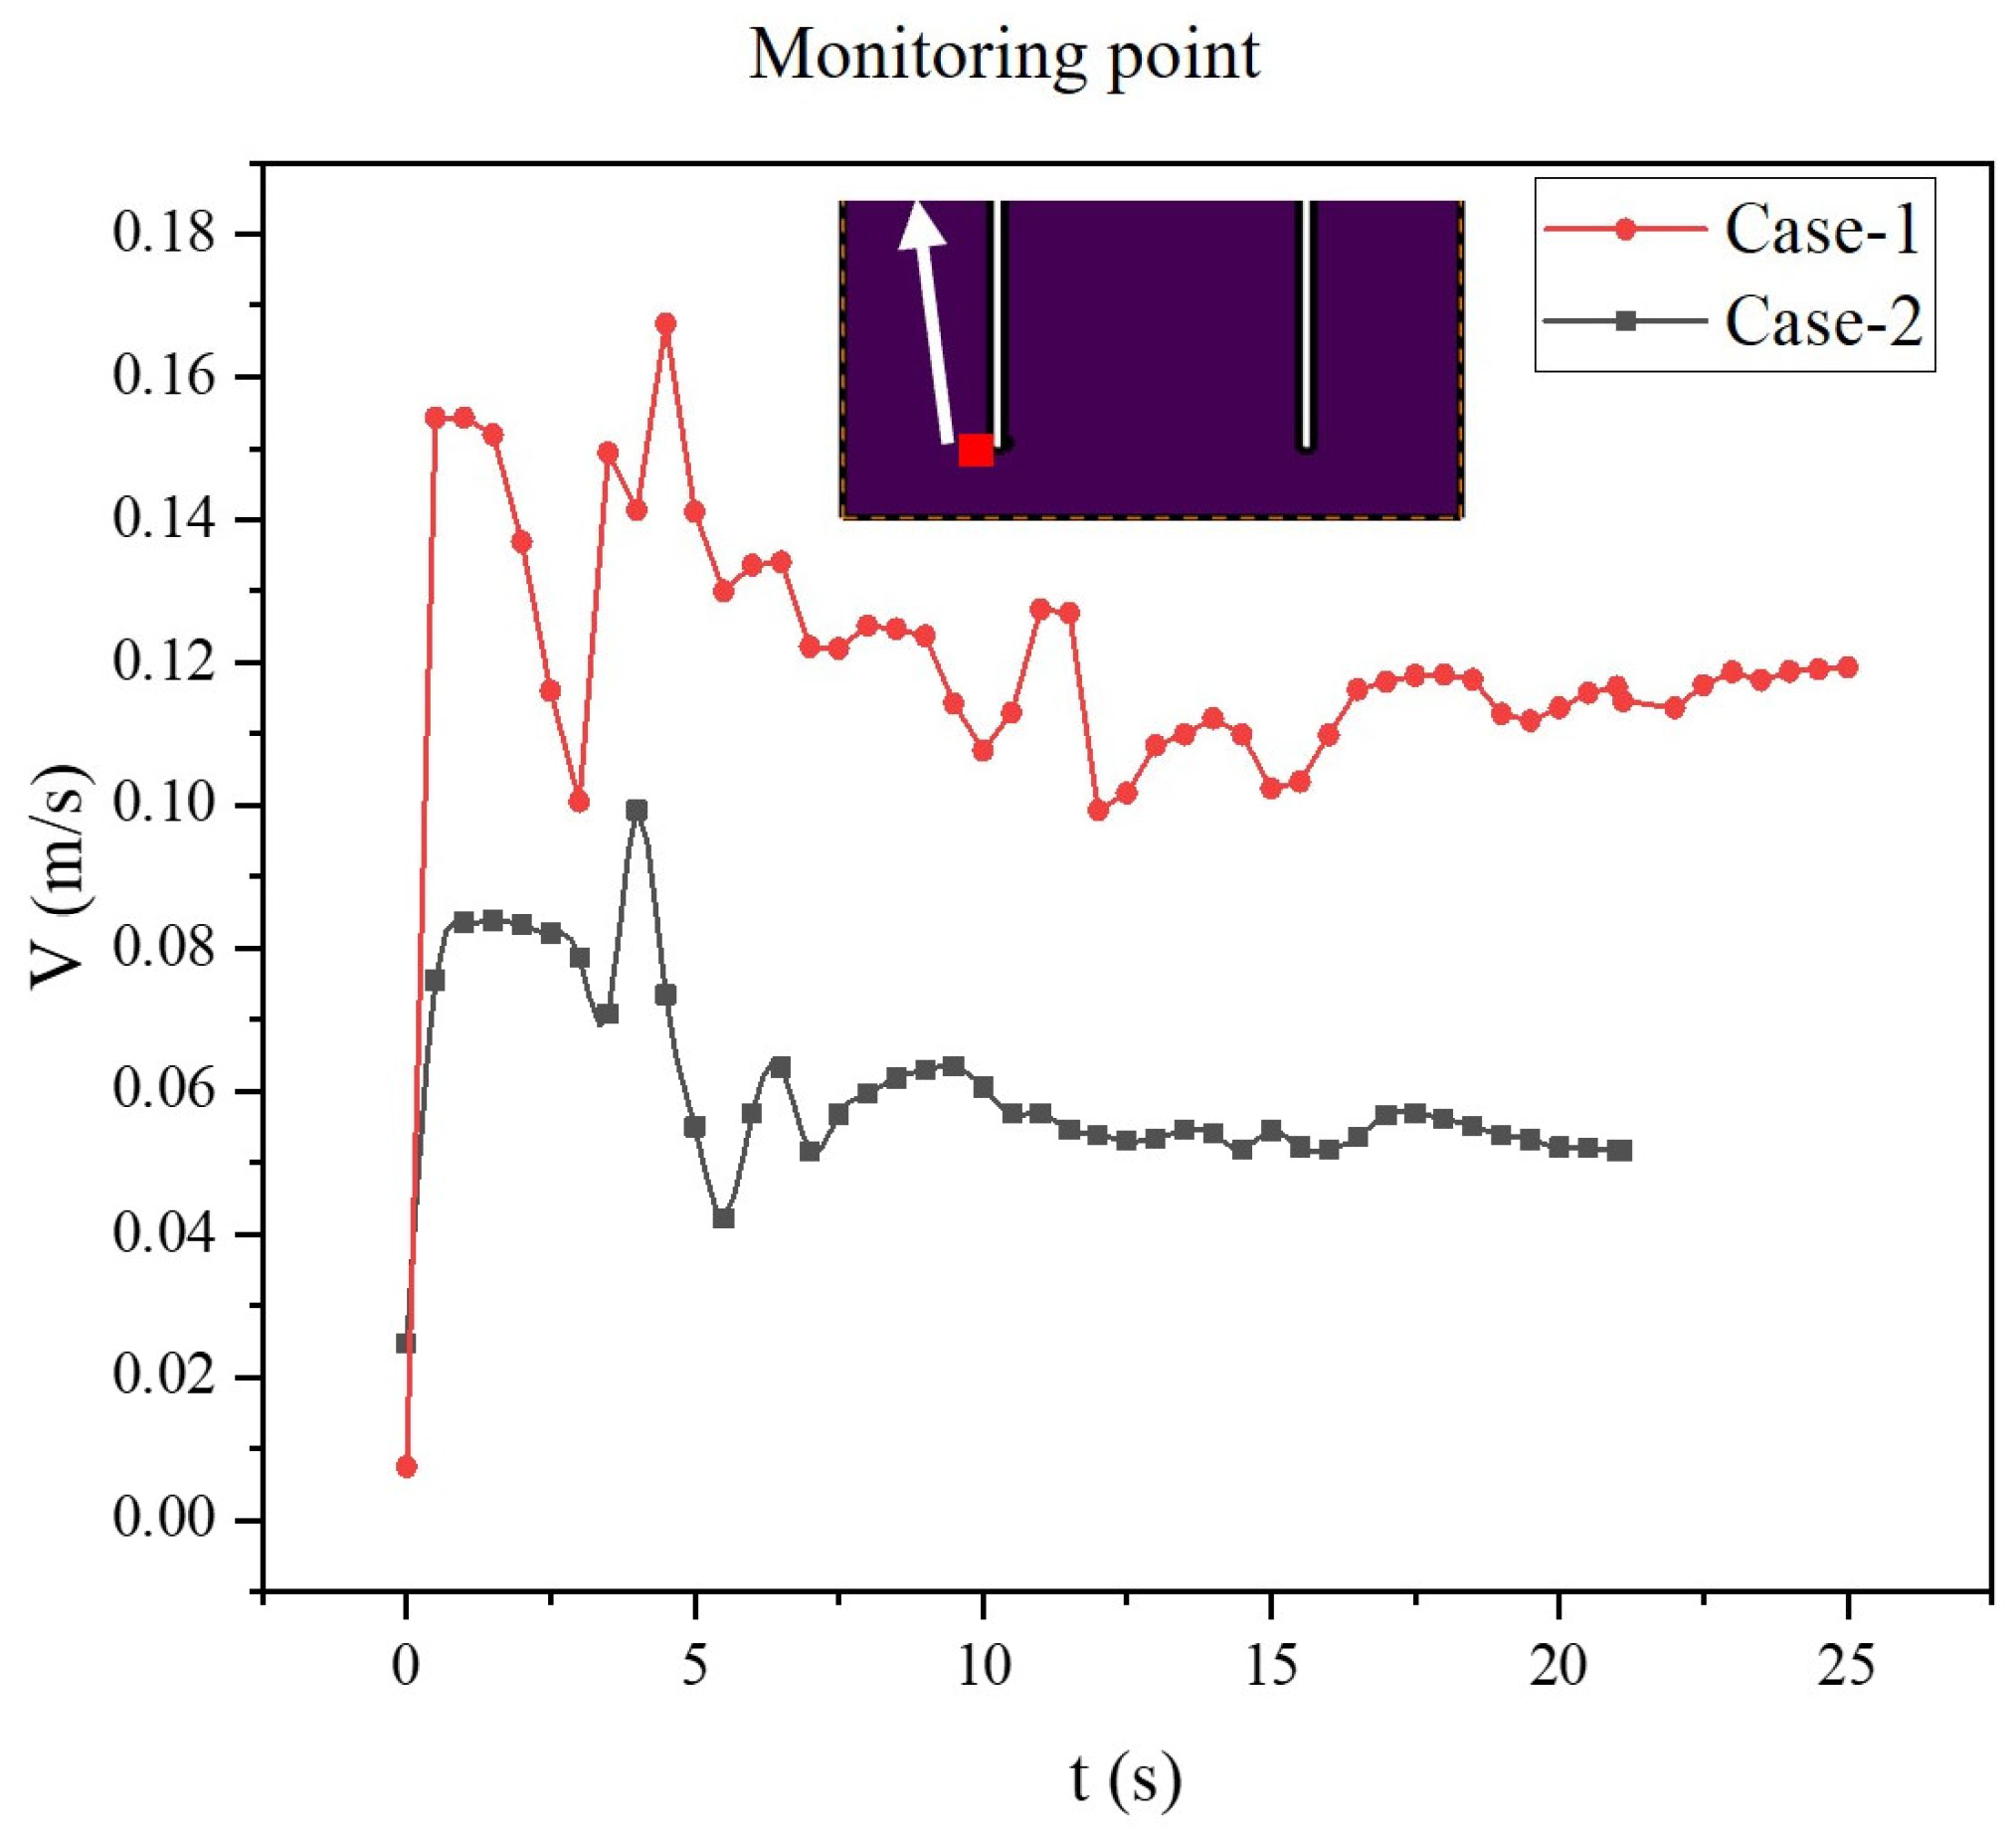
4.3. The Velocity Vector Fields for Different Cases
5. Conclusions
Author Contributions
Funding
Institutional Review Board Statement
Informed Consent Statement
Data Availability Statement
Conflicts of Interest
Nomenclature
| Symbol | Description |
| Cauchy stress tensor of the “fluid mixture” | |
| Kinematical tensor | |
| Symmetric part of the velocity gradient tensor | |
| Identity tensor | |
| Cement slurry phase stress tensor | |
| Drilling fluid phase stress tensor | |
| Interfacial interaction between the two phases | |
| Second invariant of the tensor | |
| Second invariant of the stress tensor | |
| Pressure of the “fluid mixture” | |
| Velocity of the “fluid mixture” | |
| Velocity of the cement slurry phase | |
| Velocity of the drilling fluid phase | |
| Relative velocity between the two phases | |
| Unit normal vector | |
| Consistency of the cement slurry (for Herschel–Bulkley fluid) | |
| Power-law exponent of the cement slurry (for Herschel–Bulkley fluid) | |
| Volume fraction of the cement slurry | |
| Surface tension | |
| Curvature of the interface between the two phases | |
| Dirac function | |
| Yield stress of the cement slurry | |
| Viscosity of the “fluid mixture” | |
| Viscosity of the cement slurry phase | |
| Viscosity of the drilling fluid phase | |
| Density of the “fluid mixture” | |
| Density of the cement slurry phase | |
| Density of the drilling fluid phase | |
| Gradient operator |
References
- Griffin, T.J., Jr.; Moran, L.K. Spacer Composition and Method of Use. U.S. Patents US4083407A, 11 March 1978. [Google Scholar]
- Bittleston, S.H.; Ferguson, J.; Frigaard, I.A. Mud removal and cement placement during primary cementing of an oil well—Laminar non-Newtonian displacements in an eccentric annular Hele-Shaw cell. J. Eng. Math. 2002, 43, 229–253. [Google Scholar] [CrossRef]
- Carter, L.G.; Evans, G.W. A study of cement-pipe bonding. J. Pet. Technol. 1964, 16, 157–160. [Google Scholar] [CrossRef]
- Docherty, K.; Kefi, S.; Khalfallah, I.; Taoutaou, S.; Offenbacher, M.; Ravitz, R. Mud removal-clearing the way for effective cementing. Schlumberger Oilfield Rev. 2016, 28, 20–25. [Google Scholar]
- Tao, C.; Rosenbaum, E.; Kutchko, B.G.; Massoudi, M. A Brief Review of Gas Migration in Oilwell Cement Slurries. Energies 2021, 14, 2369. [Google Scholar] [CrossRef]
- Tao, C.; Kutchko, B.G.; Rosenbaum, E.; Wu, W.-T.; Massoudi, M. Steady Flow of a Cement Slurry. Energies 2019, 12, 2604. [Google Scholar] [CrossRef]
- Beirute, R.M.; Cheung, P.R. Method for selection of cement recipes to control fluid invasion after cementing. SPE Prod. Eng. 1990, 5, 433–440. [Google Scholar] [CrossRef]
- Pelipenko, S.; Frigaard, I.A. Mud removal and cement placement during primary cementing of an oil well—Part 2; steady-state displacements. J. Eng. Math. 2004, 48, 1–26. [Google Scholar] [CrossRef]
- Velayati, A.; Kazemzadeh, E.; Soltanian, H.; Tokhmechi, B. Gas migration through cement slurries analysis: A comparative laboratory study. Int. J. Min. Geo-Eng. 2015, 49, 281–288. [Google Scholar]
- Enayatpour, S.; van Oort, E. Advanced modeling of cement displacement complexities. In Proceedings of the SPE/IADC Drilling Conference and Exhibition, Hague, The Netherlands, 14–16 March 2017. [Google Scholar]
- Tao, C.; Kutchko, B.G.; Rosenbaum, E.; Massoudi, M. A Review of Rheological Modeling of Cement Slurry in Oil Well Applications. Energies 2020, 13, 570. [Google Scholar] [CrossRef]
- Tao, C.; Massoudi, M. On the Flow of a Cement Suspension: The Effects of Nano-Silica and Fly Ash Particles. Materials 2024, 17, 1504. [Google Scholar] [CrossRef] [PubMed]
- Tao, C.; Rosenbaum, E.; Kutchko, B.; Massoudi, M. Pulsating Poiseuille flow of a cement slurry. Int. J. Non-Linear Mech. 2021, 133, 103717. [Google Scholar] [CrossRef]
- Konan, N.A.; Rosenbaum, E.; Massoudi, M. Motion of air bubbles in a cement slurry. Materials 2023, 16, 6433. [Google Scholar] [CrossRef] [PubMed]
- Konan, N.A.; Rosenbaum, E.; Massoudi, M. On the response of a Herschel–Bulkley fluid due to a moving plate. Polymers 2022, 14, 3890. [Google Scholar] [CrossRef] [PubMed]
- Plancher, L.; Pierre, A.; Nguyen, G.T.; Hébert, R.L.; Ledésert, B.A.; Di Martino, P.; Mélinge, Y. Rheological behaviour of cementitious materials incorporating solid–solid phase change materials. Materials 2021, 15, 20. [Google Scholar] [CrossRef]
- Brackbill, J.U.; Kothe, D.B.; Zemach, C. A continuum method for modeling surface tension. J. Comput. Phys. 1992, 100, 335–354. [Google Scholar] [CrossRef]
- Massoudi, M. Constitutive relations for the interaction force in multicomponent particulate flows. Int. J. Non-Linear Mech. 2003, 38, 313–336. [Google Scholar] [CrossRef]
- Herschel, W.H.; Bulkley, R. Measurement of consistency as applied to rubber-benzene solutions. Am. Soc. Test Proc. 1926, 26, 621–633. [Google Scholar]
- Jones, T.E.R.; Taylor, S. A mathematical model relating the flow curve of a cement paste to its water/cement ratio. Mag. Concr. Res. 1977, 29, 207–212. [Google Scholar] [CrossRef]
- Atzeni, C.; Massidda, L.; Sanna, U. Comparison between rheological models for portland cement pastes. Cem. Concr. Res. 1985, 15, 511–519. [Google Scholar] [CrossRef]
- Choi, M.; Prud’homme, R.K.; Scherer, G. Rheological evaluation of compatibility in oil well cementing. Appl. Rheol. 2017, 27, 43354. [Google Scholar]
- Banfill, P.F.G. The rheology of fresh cement and concrete—A review. In Proceedings of the 11th International Cement Chemistry Congress, Durban, South Africa, 11–16 May 2003; Volume 1, pp. 50–62. [Google Scholar]


| Liquid | Cement Slurry | Drilling Fluid |
|---|---|---|
| Density (kg/m3) | 1200 | 998 |
| Surface Tension (N/m) | 0.07 | 0.07 |
| Rheological Model | Herschel–Bulkley | Linear Newtonian |
| Viscosity (kg/ms) | N/A | |
| Consistency Index, k (kg∙s n−2/m) | 0.6 | N/A |
| Flow Index, n | 0.4 | N/A |
| Yield Shear Stress, (Pa) | 1.4 | N/A |
| Critical Shear Rate, (1/s) | 5.5 | N/A |
| Parameter | Case-1 (Smooth Outer Wall) | Case-2 (Irregular Outer Wall) |
|---|---|---|
| Replacement Efficiency | Lower | Higher |
| Velocity Distribution | Uniform and symmetric | Non-uniform with localized variations |
| Recirculation Region Formation | large | Small |
| Optimal Inlet Velocity | 0.5 m/s | 0.5 m/s |
Disclaimer/Publisher’s Note: The statements, opinions and data contained in all publications are solely those of the individual author(s) and contributor(s) and not of MDPI and/or the editor(s). MDPI and/or the editor(s) disclaim responsibility for any injury to people or property resulting from any ideas, methods, instructions or products referred to in the content. |
© 2025 by the authors. Licensee MDPI, Basel, Switzerland. This article is an open access article distributed under the terms and conditions of the Creative Commons Attribution (CC BY) license (https://creativecommons.org/licenses/by/4.0/).
Share and Cite
Tao, C.; Wang, Q.; Ahmadi, G.; Massoudi, M. Numerical Analysis of Cement Placement into Drilling Fluid in Oilwell Applications. Materials 2025, 18, 3098. https://doi.org/10.3390/ma18133098
Tao C, Wang Q, Ahmadi G, Massoudi M. Numerical Analysis of Cement Placement into Drilling Fluid in Oilwell Applications. Materials. 2025; 18(13):3098. https://doi.org/10.3390/ma18133098
Chicago/Turabian StyleTao, Chengcheng, Qian Wang, Goodarz Ahmadi, and Mehrdad Massoudi. 2025. "Numerical Analysis of Cement Placement into Drilling Fluid in Oilwell Applications" Materials 18, no. 13: 3098. https://doi.org/10.3390/ma18133098
APA StyleTao, C., Wang, Q., Ahmadi, G., & Massoudi, M. (2025). Numerical Analysis of Cement Placement into Drilling Fluid in Oilwell Applications. Materials, 18(13), 3098. https://doi.org/10.3390/ma18133098