3.1. Experimental Phenomena
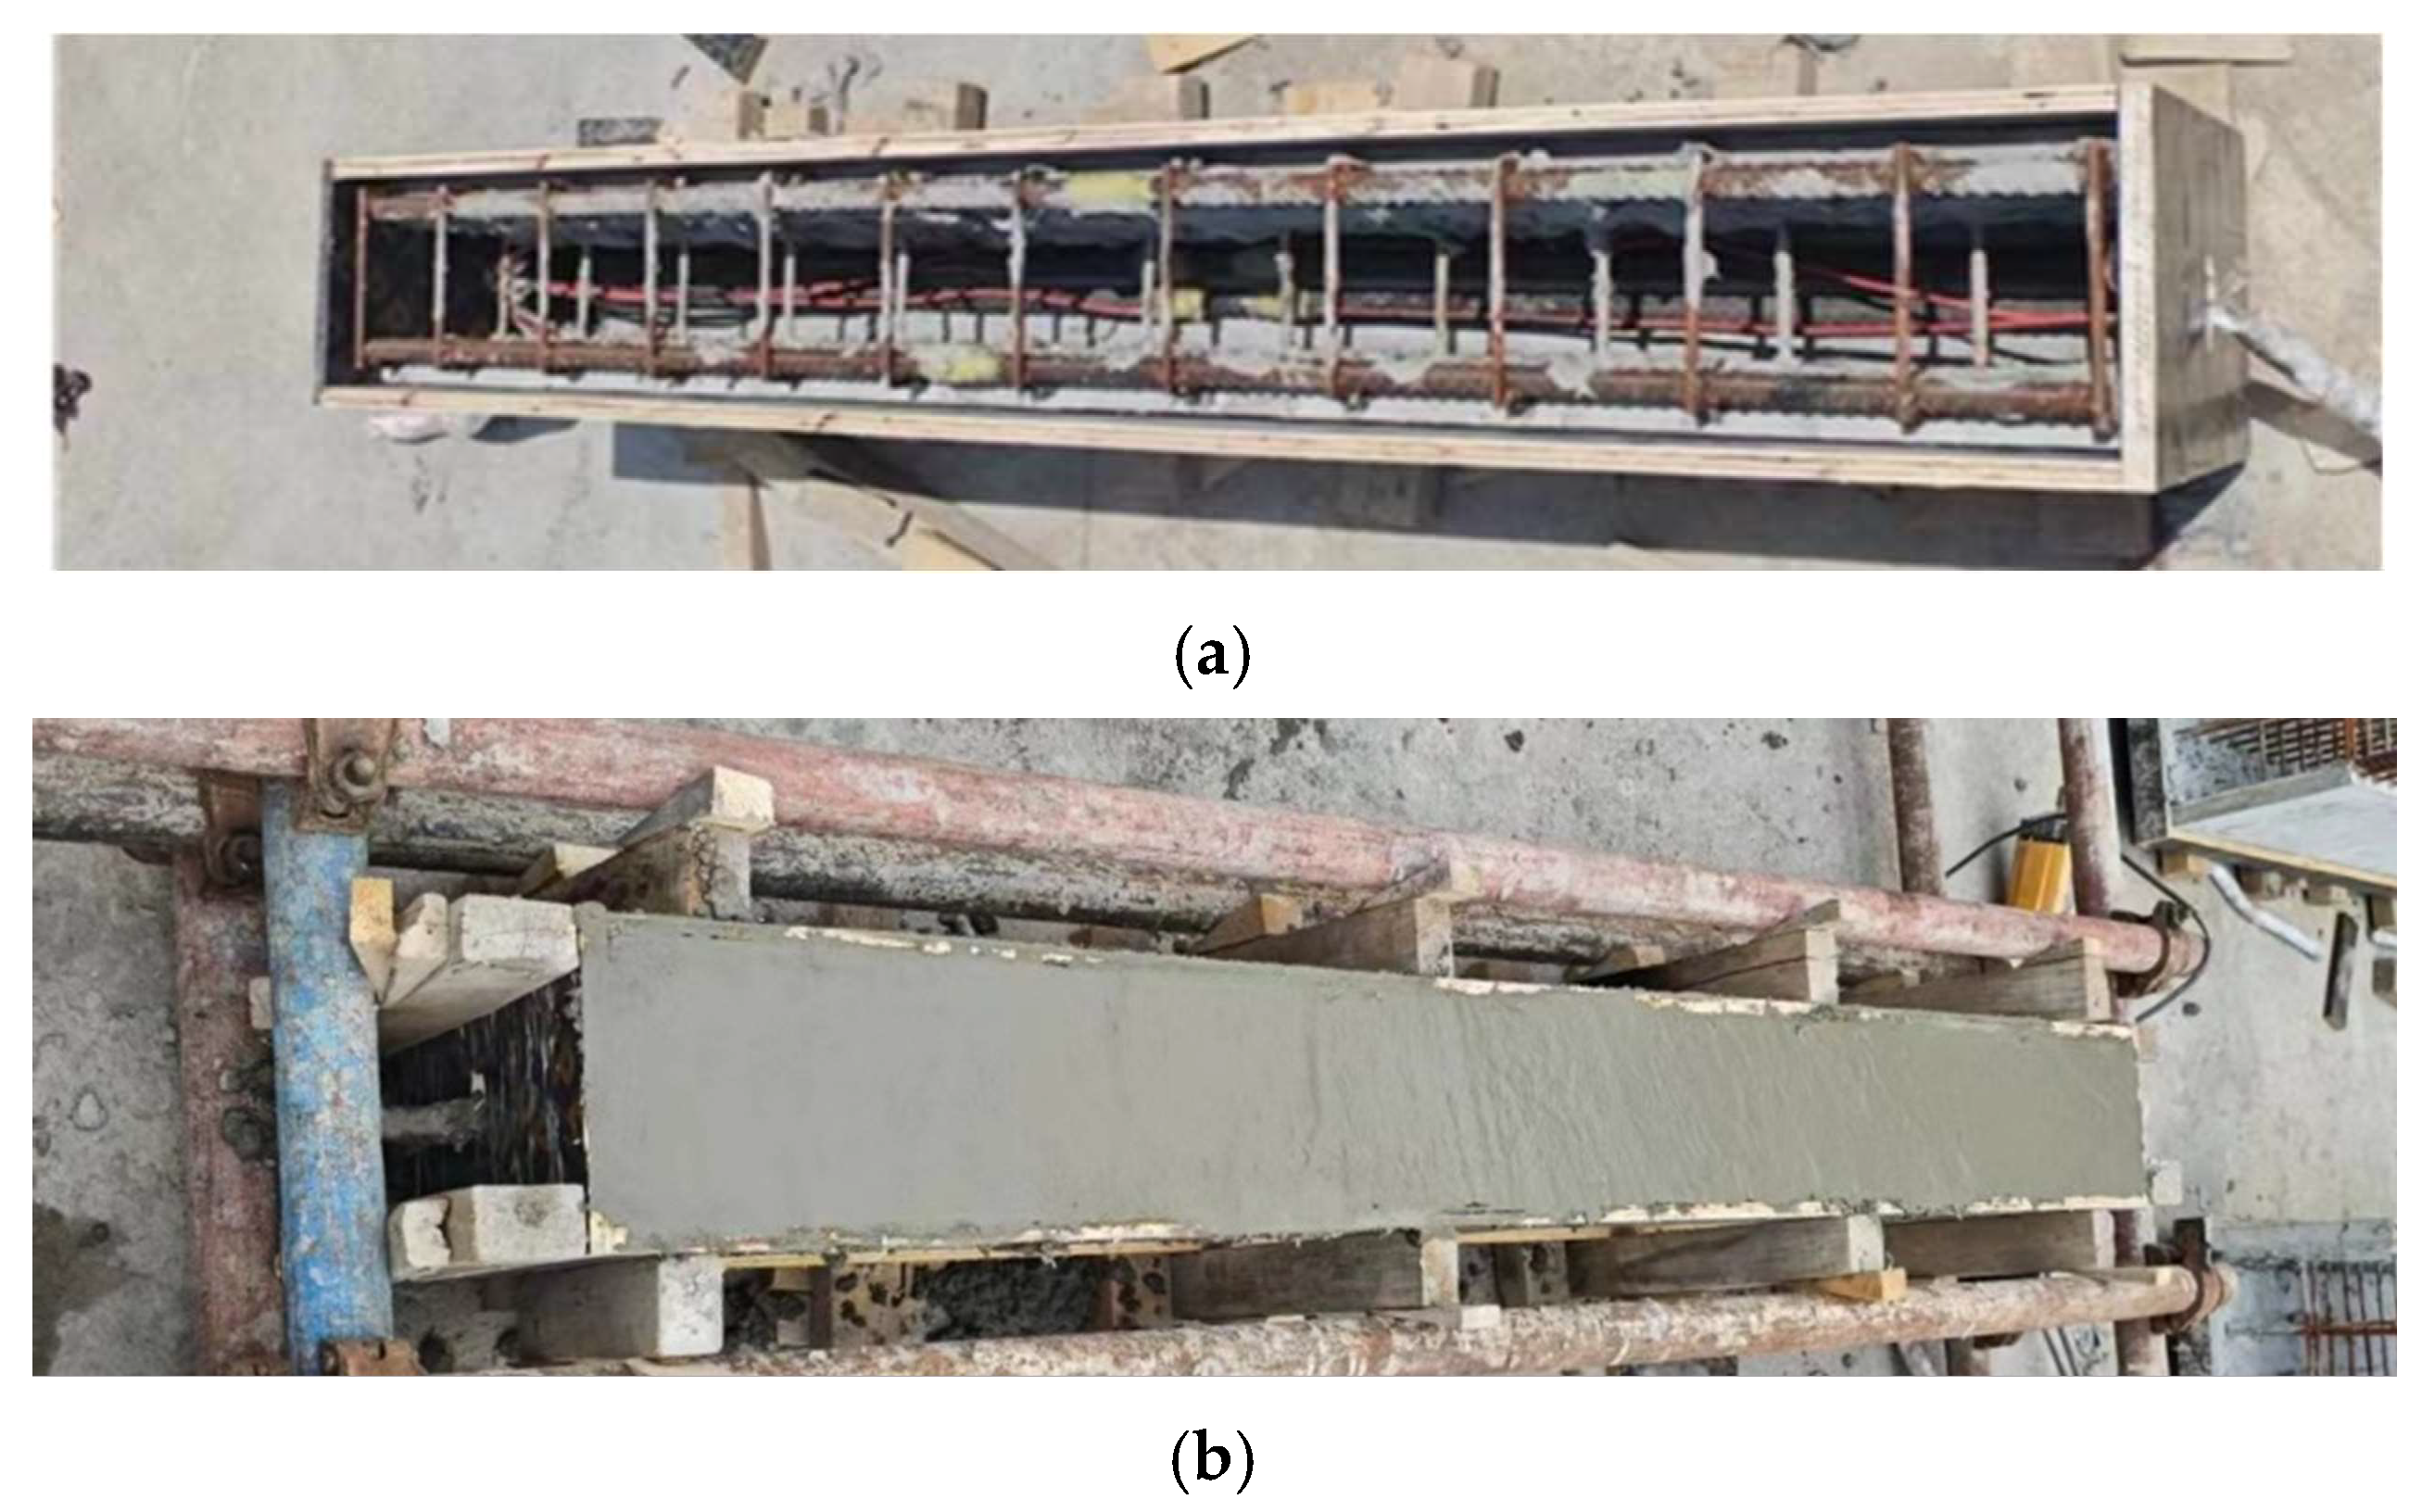
In this test, the specimens were placed on a 5000 kN pressure testing machine. The front of the beam served as the main observation surface, while the concrete strain gauge, displacement meter, and other instruments were installed on the back of the beam. The following section describes the experimental phenomena and failure patterns of each specimen. No detachment or slippage was observed at the interface between the concrete at the beam top and the ECC formwork, indicating that bond failure did not occur. This demonstrated the excellent integrity of the R/ECC composite beam.
Specimen beam E2S38R: The specimen exhibited initial vertical cracking (width: 0.05 mm, length: 153 mm) at the mid-span back surface under 121 kN load, accompanied by a displacement of 4.02 mm. As the loading increased to 374 kN, diagonal shear cracks propagated toward the loading points, with post-cast RC concrete initiating localized crushing and vertical crack widening to 3.2 mm. The ultimate failure occurred at 383.97 kN (displacement: 17.48 mm), characterized by interconnected diagonal shear cracks (maximum width: 2.2 mm) and vertical flexural cracks extending to five-sixths of the beam height. Post-peak behavior showed progressive concrete spalling at loading points, with main diagonal cracks coalescing into 9.2 mm-wide fractures at 22 mm displacement. The failure pattern combined shear-dominated diagonal cracking and flexural–shear interaction, as illustrated in
Figure 6.
Specimen beam E3S38R: The specimen exhibited linear elastic behavior with negligible stiffness degradation until initial cracking occurred at 83.54 kN, marked by three vertical cracks (148–152 mm) in the mid-span and left regions. As loading increased to 160.8 kN, vertical cracks propagated to half the beam height, while oblique microcracks (60–193 mm) emerged near the mid-span and supports. Upon reaching 225.4 kN, vertical cracks widened to 1.02 mm, and a diagonal crack initiated coalescence, accompanied by compressive crushing of concrete at 236.5 kN. Peak load (260.1 kN, displacement 48.64 mm) triggered five dense diagonal cracks (63.4 mm average length) near the loading point and vertical cracks exceeding 5.1 mm width. Failure manifested as interconnected diagonal cracking and concrete crushing, with crack distribution illustrated in
Figure 7.
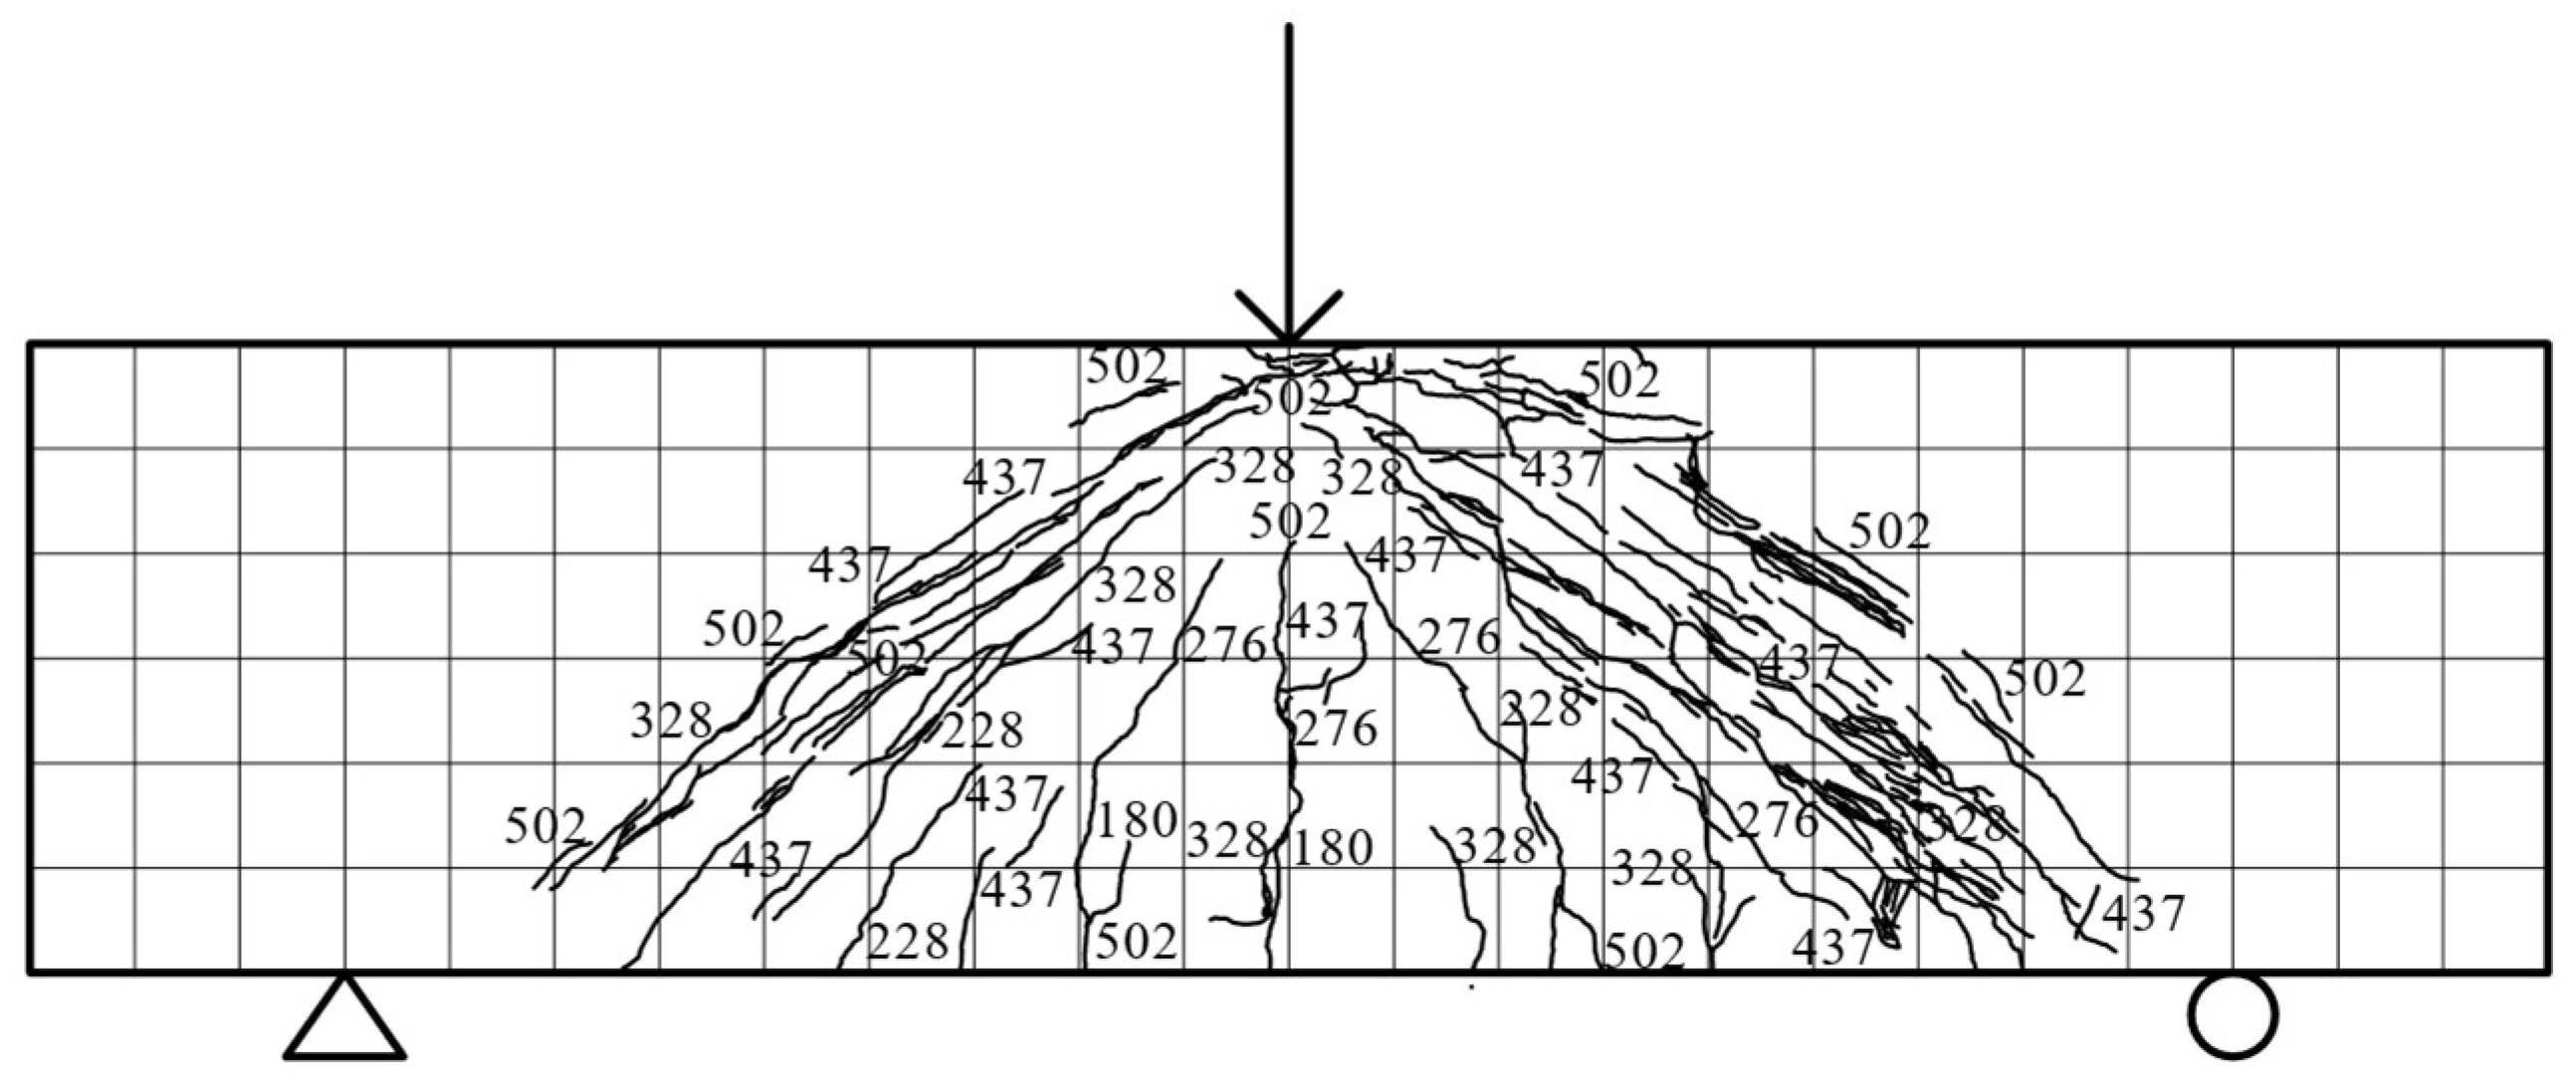
Specimen beam E1.5S38R: The load–displacement curve exhibited linear behavior in the elastic stage, with no stiffness degradation before cracking. Initial vertical microcracks (98 mm and 91 mm) emerged in the front-span tensile zone at 175.9 kN, followed by oblique microcracks developing symmetrically near the mid-span at 227.8 kN. As loading increased to 275.9 kN, vertical cracks propagated to half of the beam height, while dense oblique microcracks formed between supports and loading points, ultimately reaching five-sixths of the section height. At 502.3 kN, vertical cracks widened to 0.27 mm, oblique cracks extended to loading points, and compressive zone concrete crushed, coinciding with the ultimate load of 507.92 kN and a mid-span displacement of 14.62 mm. Post-peak, the bearing capacity declined to 50% at 20.02 mm displacement, with failure characterized by combined shear–flexural cracking and concrete crushing, as illustrated in
Figure 8.
Specimen beam E2S75R: The load–displacement curve of specimen E2S75R remained linear in the elastic stage (≤114 kN) without stiffness degradation. At 188 kN, inclined microcracks (181.5 mm long, 0.01 mm wide) initiated at the mid-span bottom, while a vertical crack (149 mm long) formed 76 mm from the mid-span on the left rear side. By 300 kN, 28 discontinuous diagonal cracks propagated to five-sixths of the beam height (ECC-RC composite interface) along the front right support-loading line. The peak load of 444.07 kN coincided with 81 diagonal cracks and a 2.6 mm-wide mid-span vertical crack. Failure involved concrete crushing (380 kN) and a 60% post-peak capacity drop (42.4 mm displacement), with crack patterns illustrated in
Figure 9.
Specimen beam E2S25R: Specimen E2S25R exhibited a linear load–displacement relationship in the elastic stage (≤162 kN) without stiffness degradation. At 162 kN, vertical cracks (83.5 mm and 51.3 mm long) initiated at the mid-span and 148.3 mm left of the beam bottom, accompanied by a 136.8 mm-long crack on the rear side. Diagonal microcracks first emerged near the support-loading points at 276 kN, propagating to five-sixths of the beam height (ECC-RC interface), totaling 31 cracks, while the rear developed 6 diagonal cracks (max. 162.1 mm). By 330 kN, the front diagonal cracks increased to 58 with 0.11 mm maximum width, and the rear cracks reached 35 (max. 296.8 mm). The ultimate load of 344.7 kN (10.33 mm displacement) preceded concrete crushing near the loading point and diagonal crack penetration (4.2 mm width), with failure patterns illustrated in
Figure 10.
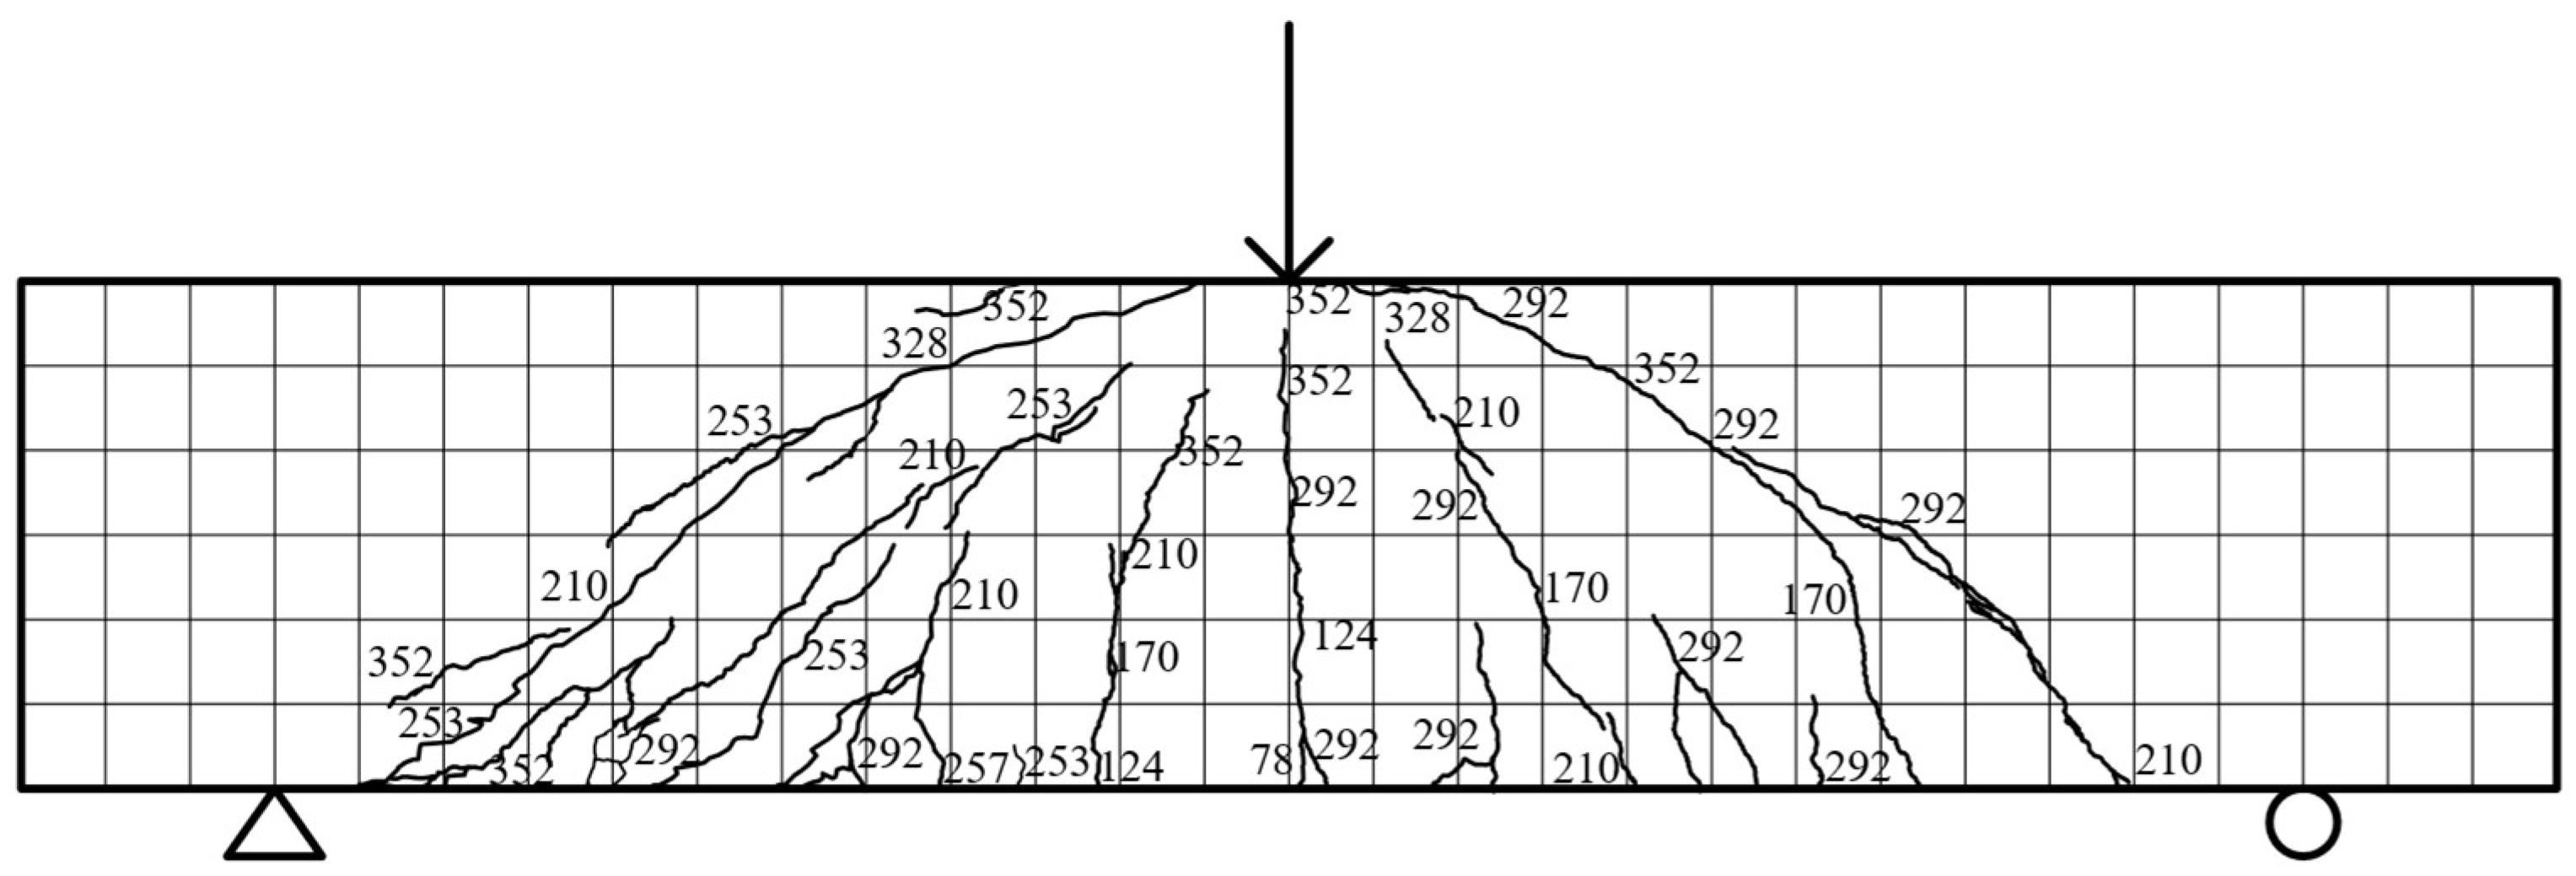
Specimen beam R2S38R: Specimen R2S38R demonstrated a linear load–displacement response in the elastic stage (≤78 kN) without stiffness reduction. At 78 kN, the first vertical crack (102 mm long) emerged 9 mm right of the mid-span, marking the loss of tensile capacity in the concrete. By 170 kN, the second vertical crack extended 756 mm, while two diagonal cracks (max. 233.6 mm long, 0.03 mm wide) initiated on the right side, accompanied by a 112.6 mm-long vertical crack at the rear mid-span. The crack count increased to seventeen (including six diagonal cracks reaching 397.7 mm) at 253 kN, with rear diagonal cracks propagating to two-thirds of the beam height (max. width 0.13 mm). The ultimate load of 352 kN (12.36 mm displacement) coincided with the interconnection of six primary cracks and diagonal crack widening (max. 0.37 mm rear width), as depicted in
Figure 11.
3.2. Bearing Capacity Analysis
Through the test records, the cracking load, yield load, and ultimate load of each specimen are shown in
Table 5.
(1) As presented in
Table 5, specimen E2S38R demonstrated significant performance improvements compared with specimen R2S38R when ordinary concrete was replaced with engineered cementitious composite (ECC). The experimental results revealed a 3.4% increase in yield load, an 8.2% enhancement in ultimate bearing capacity, and a substantial 29.3% improvement in displacement corresponding to the ultimate load. Both composite beams maintained identical geometrical and reinforcement parameters, including shear span ratio, reinforcement configuration, and stirrup ratio, except for their shell materials. The enhanced mechanical performance of the ECC-incorporated prefabricated shell composite beam was primarily attributed to the superior material properties of engineered cementitious composite (ECC). The observed increases in yield load and bearing capacity directly correlated with ECC’s exceptional strength characteristics, while the remarkable improvement in displacement capacity reflected the material’s enhanced ductility and durability. These material advantages effectively improved the structural integrity and deformation capacity of the composite system under loading.
(2) In addition to the different shear span ratios of specimens E1.5S38R, E2S38R, and E3S38R, the other parameters, such as shell material, reinforcement form, and stirrup ratio, were the same. As shown in
Table 5, the shear-bearing capacity of the specimens decreased with the increase in the shear span ratio. When the shear span ratios were 1.5, 2.0, and 3.0, the ultimate shear bearing capacity of the specimens decreased by 24.4% and 32%, respectively, while the yield load decreased by 28.7% and 53.2%, respectively.
(3) Except for the different stirrup ratios, the other parameters, such as shell material, reinforcement form, and shear span ratio of specimens E2S25R, E2S38R, and E2S75R, were the same. By comparing and analyzing
Table 5, it was concluded that the bearing capacity of specimens increased with the increase in the stirrup ratio, and the stirrup ratios of E2S25R, E2S38R, and E2S75R were 0.25%, 0.38%, and 0.75%, respectively. The yield load of the specimens increased by 26.1% and 9.6%, respectively, and the shear-bearing capacity increased by 10.23% and 13.53%, respectively.
The load-bearing capacity test values of each specimen were compared with the values calculated according to Specification [
29]. The calculated load-bearing capacities of each ECC specimen according to the design code were 255.3 kN, 170.2 kN, 340.5 kN, 255.3 kN, and 255.3 kN, respectively. The ECC composite specimens showed bearing capacities consistently higher than the code-predicted values. The primary reason is that the code-specified calculation method is based on elastic theory, whereas the specimens progressively entered nonlinear stages during loading. Thus, the actual capacity exceeds code values. The code provisions were based on conventional concrete members. This study used ECC material, which has different mechanical properties. The ECC’s mechanical properties and material nonlinearity should be considered to establish the shear capacity calculation formula for ECC precast shell assembled monolithic composite beams.
3.3. Deformation Analysis
The load–displacement relationships of all specimens were established through experimental measurements, as illustrated in
Figure 12. Analysis of these curves enabled systematic evaluation of stiffness evolution and ductility characteristics. Except for specimen E3S38R, all test specimens exhibited three distinct deformation phases: (1) linear elastic stage, (2) elastoplastic loading stage, and (3) post-peak softening phase. During the initial elastic stage, all specimens demonstrated proportional linear responses with minimal stiffness degradation, as indicated by nearly identical slopes in their load–displacement curves before concrete cracking. Transition to the elastoplastic stage coincided with extensive crack network formation, marking the commencement of cracked section behavior. This phase exhibited progressive stiffness reduction correlated with sequential yielding of longitudinal reinforcement and stirrups, accompanied by significant nonlinear deformation accumulation. The specimens ultimately reached their peak load capacities through the development of critical diagonal shear cracks, followed by abrupt shear-dominated failure patterns. This failure mechanism manifested as a rapid load-bearing capacity reduction in the descending branch of the curves, characterized by substantial post-yield displacement accumulation before structural collapse.
(1) Except for the different materials of the mold shell, the other parameters, shear span ratio, reinforcement form, and the stirrup ratio of specimens E2S38R and R2S38R were the same. As shown in
Figure 12, under the ultimate bearing capacity, the corresponding displacement of specimen E2S38R was 17.48 mm, while that of R2S38R was 12.36 mm. The displacement corresponding to the ultimate load of E2S38R was 29.3% higher than that of R2S38R. Similarly, the displacement of E2S38R under yield load was 5.4% higher than that of R2S38R.
(2) Specimens E3S38R, E2S38R, and E1.5S38R formed the shear span ratio comparison group. Their shell material, stirrup ratio, and cross-sectional form were identical, with shear span ratios of 3.0, 2.0, and 1.5, respectively.
Figure 12 shows that in the elastic stage, the initial slopes of the load–displacement curves differed due to varying specimen lengths (
L0 = 1800 mm, 1200 mm, and 900 mm, respectively). The initial slope increased as L
0 decreased. With shear span ratios of 3.0, 2.0, and 1.5, the displacement at yield load increased as the shear span ratio decreased, with growth rates of 38.4% and 16.2%, respectively. Conversely, the displacement at ultimate load decreased as the shear span ratio reduced, with reductions of 64.0% and 16.4%, respectively.
(3) For specimens E2S25R, E2S38R, and E2S75R, all parameters—including shell material, reinforcement form, and shear span ratio—were identical except for the stirrup ratio, which was 0.25%, 0.38%, and 0.75%, respectively.
Figure 12 indicates that as the stirrup ratio increased, the ultimate bearing capacity grew by 10.23% and 13.53%, respectively. The peak load displacements were 10.33 mm, 17.48 mm, and 37.66 mm, corresponding to growth rates of 40.9% and 53.4%. The yield load displacements were 8.42 mm, 11.00 mm, and 20.51 mm, with increases of 23.5% and 46.4%, respectively.
3.4. Bearing Capacity Degradation Analysis
When the specimen reached the peak load, with the increase in load, the plastic damage inside the specimen accumulated continuously, which led to the degradation of the bearing capacity of the specimen. In this study, the bearing capacity degradation coefficient
λi was introduced to analyze the damage accumulation degree of the specimen. The specific calculation formula is shown in (1).
In the formula,
Pi is the peak load of the
i-level loading, and
Pi−1 is the peak load of the
i-level loading.
The bearing capacity degradation coefficient calculated according to Formula (1) is shown in
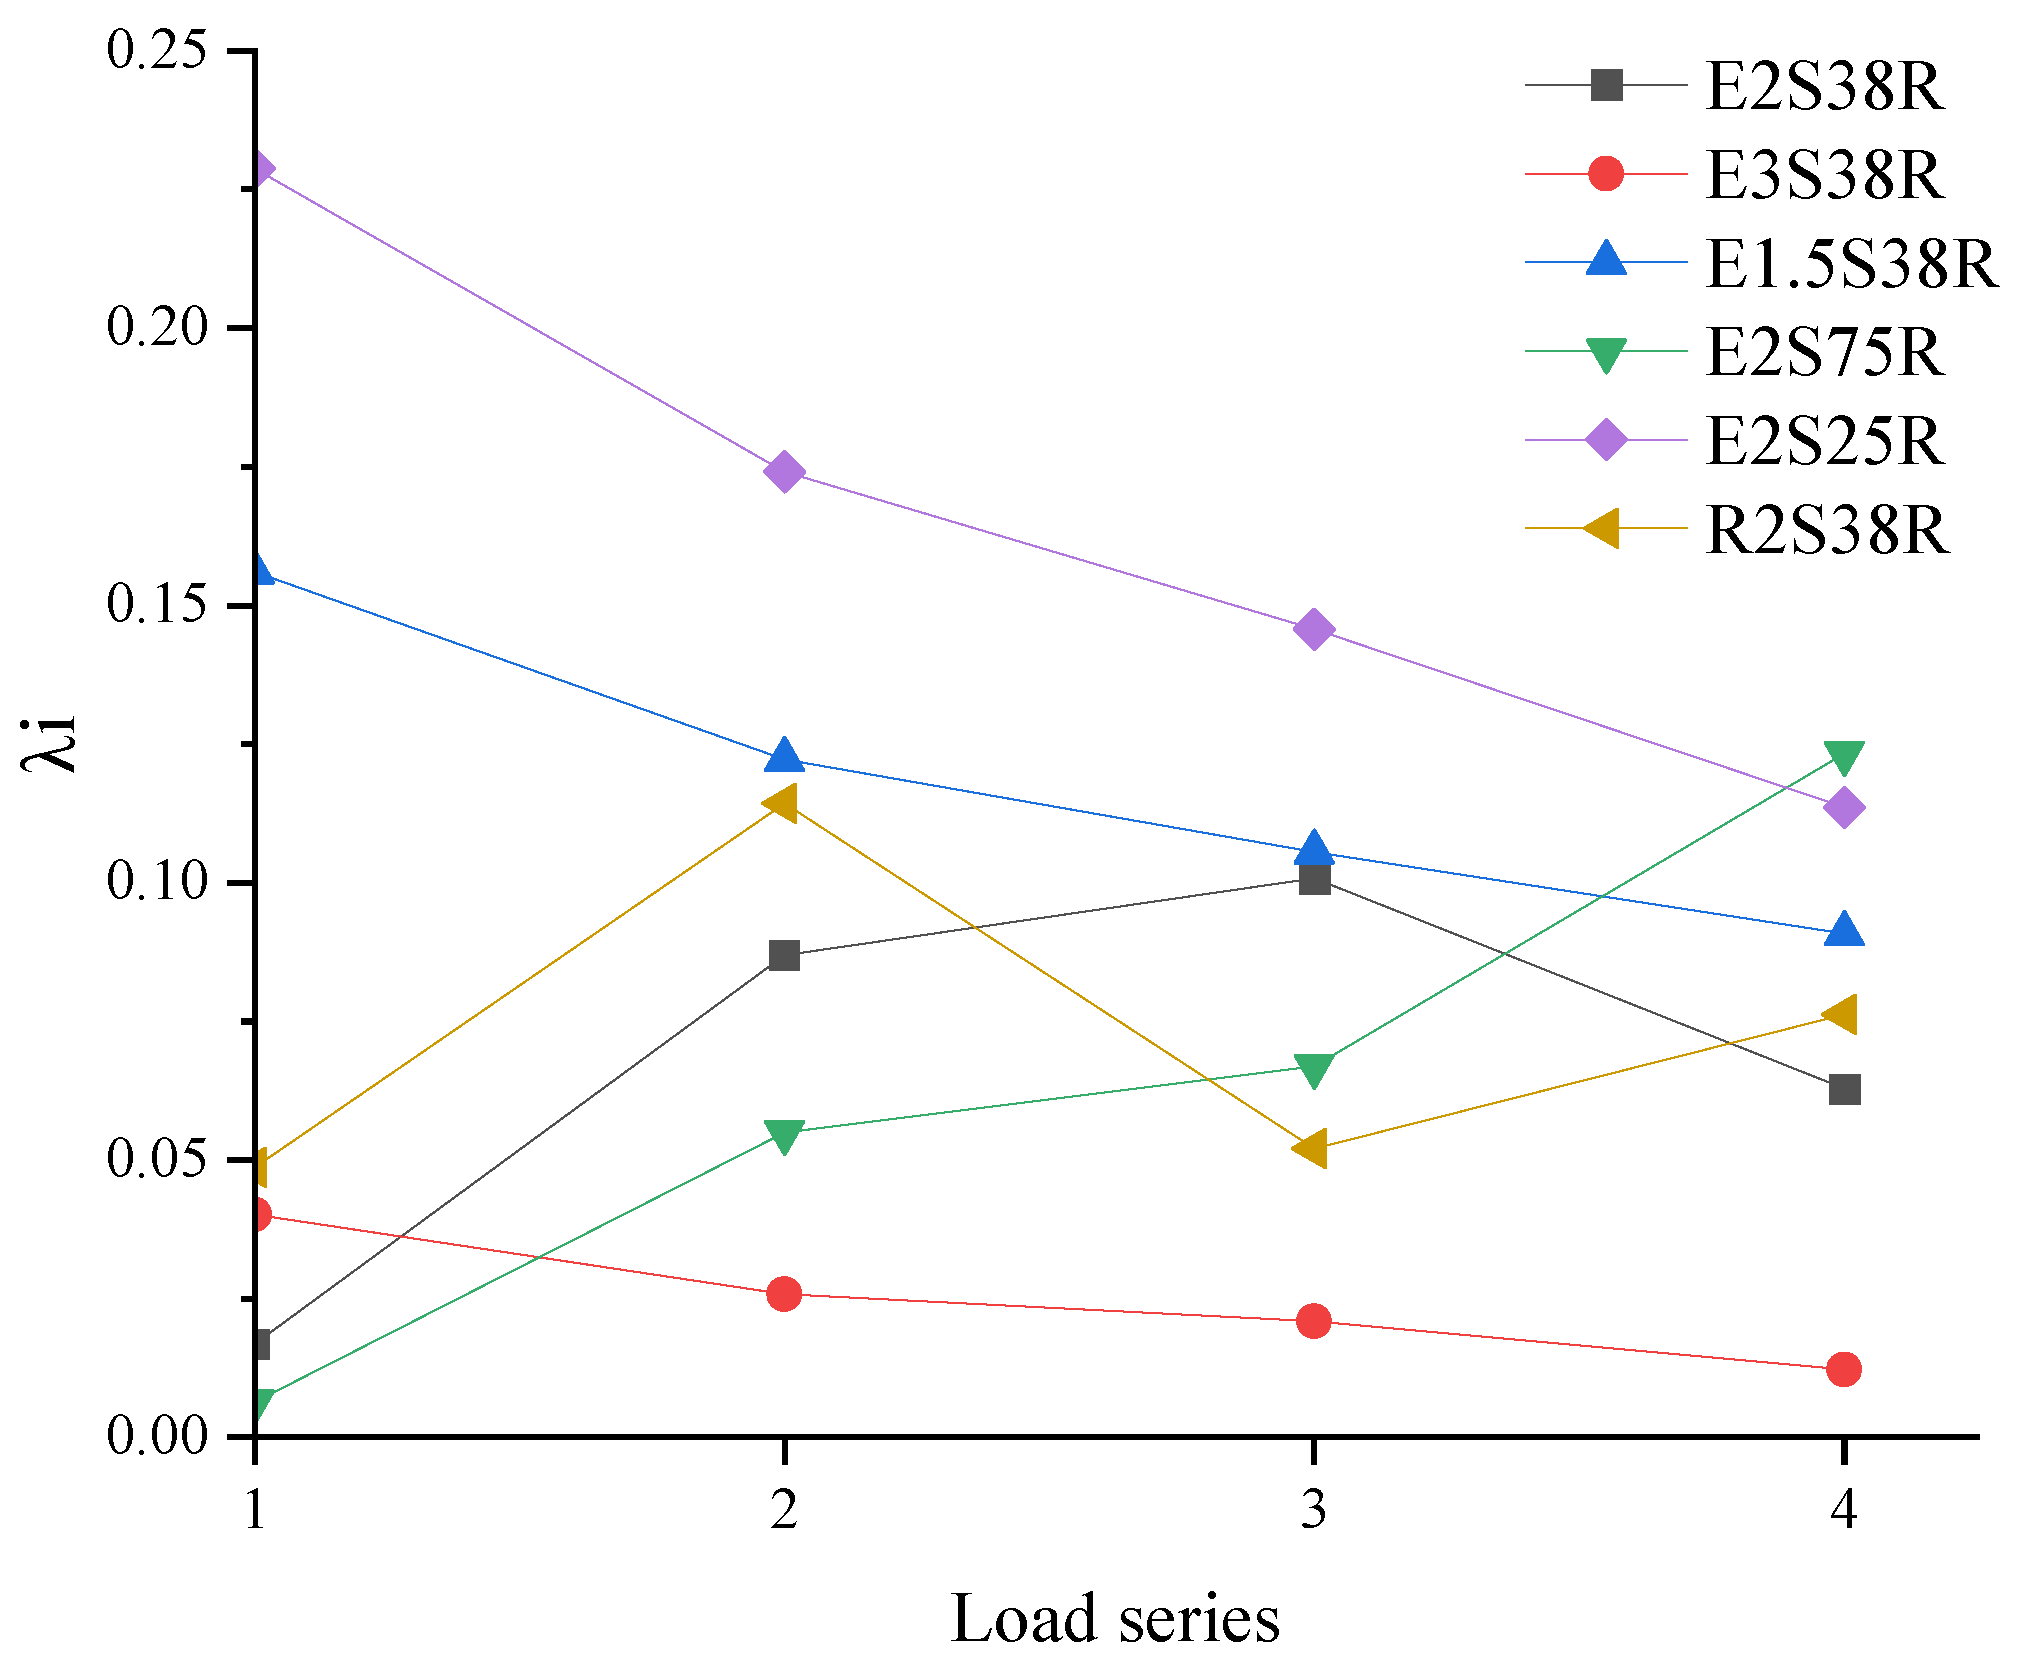
Table 6, and the curve drawn by the bearing capacity degradation coefficient and the load series is shown in
Figure 13. Among them, because specimen E3S38R was a flexural failure, there was no obvious bearing capacity degradation in its load–displacement curve. Therefore, the calculated bearing capacity change rate of the E3S38R specimen (calculated from 225.72 kN) and the curve drawn by the load series were also placed as a reference in the figure, which was convenient for comparative analysis.
(1) Comparative analysis of mold shell materials (E2S38R vs. R2S38R) revealed distinct post-peak bearing capacity degradation patterns. As shown in
Figure 13, specimen R2S38R exhibited accelerated load-bearing deterioration following peak load attainment, particularly under first-cycle (0.049 vs. 0.017, +65.31%) and second-cycle loading conditions (+23.68%). In contrast, specimen E2S38R demonstrated more pronounced degradation during subsequent loading cycles, with third-cycle degradation coefficients exceeding R2S38R’s values by 48.51% (0.101 vs. 0.052). The four-cycle averaged bearing capacity degradation coefficient for E2S38R (0.067) measured 8.22% lower than that of R2S38R (0.073), statistically confirming the ECC shell material’s capacity to mitigate degradation rates. This phenomenon originated from ECC’s unique strain-hardening behavior, which delayed abrupt post-peak capacity reduction through distributed microcracking mechanisms. The delayed degradation profile of E2S38R particularly manifested during early post-peak loading phases, where fiber bridging effects effectively maintained structural integrity beyond yield points.
(2) The shear span ratios of specimens E3S38R, E2S38R, and E1.5S38R were 3, 2, and 1.5, respectively. The average value of the bearing capacity degradation coefficient of specimen E1.5S38R (with the smallest shear span ratio) was 0.118. Under the first-stage load, the bearing capacity degradation coefficient of specimen E1.5S38R (0.156) was 89.1% higher than that of specimen E2S38R (0.017), which indicated that specimens with smaller shear span ratios were more prone to initial damage due to local stress concentration. Under the second-level load, the bearing capacity degradation coefficient of specimen E1.5S38R (0.122) was 28.7% higher than that of specimen E2S38R (0.087), demonstrating that damage propagation accelerated more rapidly in specimens with smaller shear span ratios as the load increased. Under the third and fourth-level loads, the load degradation coefficients of specimen E1.5S38R remained higher than those of specimen E2S38R. These results confirmed that smaller shear span ratios corresponded to more significant bearing capacity degradation.
(3) Comparing different stirrup ratios, the stirrup ratios of specimens E2S25R, E2S38R, and E2S75R were 0.25%, 0.38%, and 0.75%, respectively. The stirrup ratio of specimen E2S25R was the lowest, which led to the rapid decrease in bearing capacity after peak load. At the first stage load, the bearing capacity degradation coefficient of specimen E2S25R (0.229) was 92.58% and 97.38% higher than that of specimens E2S38R (0.017) and E2S75R (0.006), respectively. After the second and third loads, the bearing capacity degradation coefficient of specimen E2S25R was also greater than that of specimens E2S38R and E2S75R. Due to the high stirrup ratio of specimen E2S75R, the degradation of the bearing capacity of the specimen after the peak load was not obvious, so the degradation coefficient of the bearing capacity of specimen E2S75R was less than that of specimens E2S38R and E2S25R in the first three loads. When loading to a large displacement, that is, under the fourth load, the bearing capacity of specimen E2S75R had a significant decrease, so that the degradation coefficient of its bearing capacity was higher than that of specimens E2S38R and E2S25R. The average degradation coefficients of bearing capacity of specimens E2S25R, E2S38R, and E2S75R were 0.166, 0.067, and 0.063, respectively. It showed that the average value of the bearing capacity degradation coefficient of the specimen decreased with the increase in the stirrup ratio. The E2S25R specimen exhibited brittle failure due to the low stirrup ratio, and the bearing capacity degradation coefficient was relatively large.
3.5. Stiffness Degradation Analysis
Under sustained load, the stiffness of the specimen decreased with the increase in displacement. The stiffness variation of the specimen was analyzed by secant stiffness
Ki. The calculation formula is shown in (2):
In the formula,
Ki is the secant stiffness of the specimen under the
i-level loading;
Fi is the peak load of the
i load;
Ui is the displacement corresponding to the peak load during the
i-stage loading.
The stiffness displacement curve calculated by Formula (2) is shown in
Figure 14.
(1) As the applied load increased, cracks and internal damage within the specimen progressively accumulated, while the specimen stiffness exhibited a continuous decline corresponding to displacement increments. During the later loading stage with larger displacement, the stiffness degradation demonstrated a more gradual progression compared to the initial loading phase, attributable to the yielding of the internal steel reinforcement.
(2) Comparing different mold shell materials (E2S38R, R2S38R), the initial stiffness of specimen R2S38R was greater than that of the ECC composite beam specimen, which was because the ordinary concrete in the RC composite beam mold shell material contained coarse aggregate. The yield loads of specimen E2S38R and specimen R2S38R were 358.57 kN and 346.24 kN, respectively. From the stiffness-displacement curve after the yield load, it could be concluded that the stiffness degradation slope of specimen R2S38R was −4.34, and the stiffness degradation slope of specimen E2S38R was −1.58. The stiffness degradation rate of specimen R2S38R after yield was significantly greater than that of specimen E2S38R. This was because after the specimen entered the yield stage, the ordinary concrete in the mold shell of specimen R2S38R was continuously peeled off, resulting in a smaller cross-sectional area of the effective bearing capacity of the RC composite beam, which resulted in faster stiffness degradation. The ECC material in the shell of specimen E2S38R formed multiple fine cracks by fiber bridging. After cracking, it was forced together with the steel bar, and there was no spalling. Therefore, the stiffness degradation of specimen E2S38R was more gentle than that of specimen R2S38R. It also showed that the ECC shell material could effectively slow down the stiffness degradation rate of the composite beam.
(3) Comparing different shear span ratios, the shear span ratios of specimens E3S38R, E2S38R, and E1.5S38R were 3, 2, and 1.5, respectively. The initial stiffness of the specimens was 62.42 kN/mm, 71.11 kN/mm, and 80.26 kN/mm, respectively, indicating that under the same other parameters, the larger the shear span ratio of the specimen, the smaller the initial stiffness. When the specimen yielded, the stiffness of the specimen was 23.23 kN/mm, 30.57 kN/mm, and 35.93 kN/mm, respectively. With the increase in load, specimen E1.5S38R experienced baroclinic failure, showing brittle failure, which resulted in a sharp decrease in stiffness, while the stiffness degradation of specimens E3S38R and E2S38R was relatively slow.
(4) Comparing different stirrup ratios, the stirrup ratios of specimens E2S25R, E2S38R, and E2S75R were 0.25%, 0.38%, and 0.75%, respectively. The initial stiffness of E2S75R (74.50 kN/mm) was higher than that of E2S38R (71.11 kN/mm) and E2S25R (69.38 kN/mm) by 4.53% and 6.86%, respectively. The reason was that the stirrup ratio of E2S75R was 49.33% and 66.67% higher than that of E2S38R and E2S25R, respectively. When specimens E2S25R, E2S38R, and E2S75R reached the yield load, the stiffness of each load level decreased, as shown in
Table 7:
It can be seen from
Table 7 that under each test load, the higher the stirrup ratio of the specimen, the smaller the stiffness degradation of the specimen.
3.6. Strain Analysis of Longitudinal Reinforcement
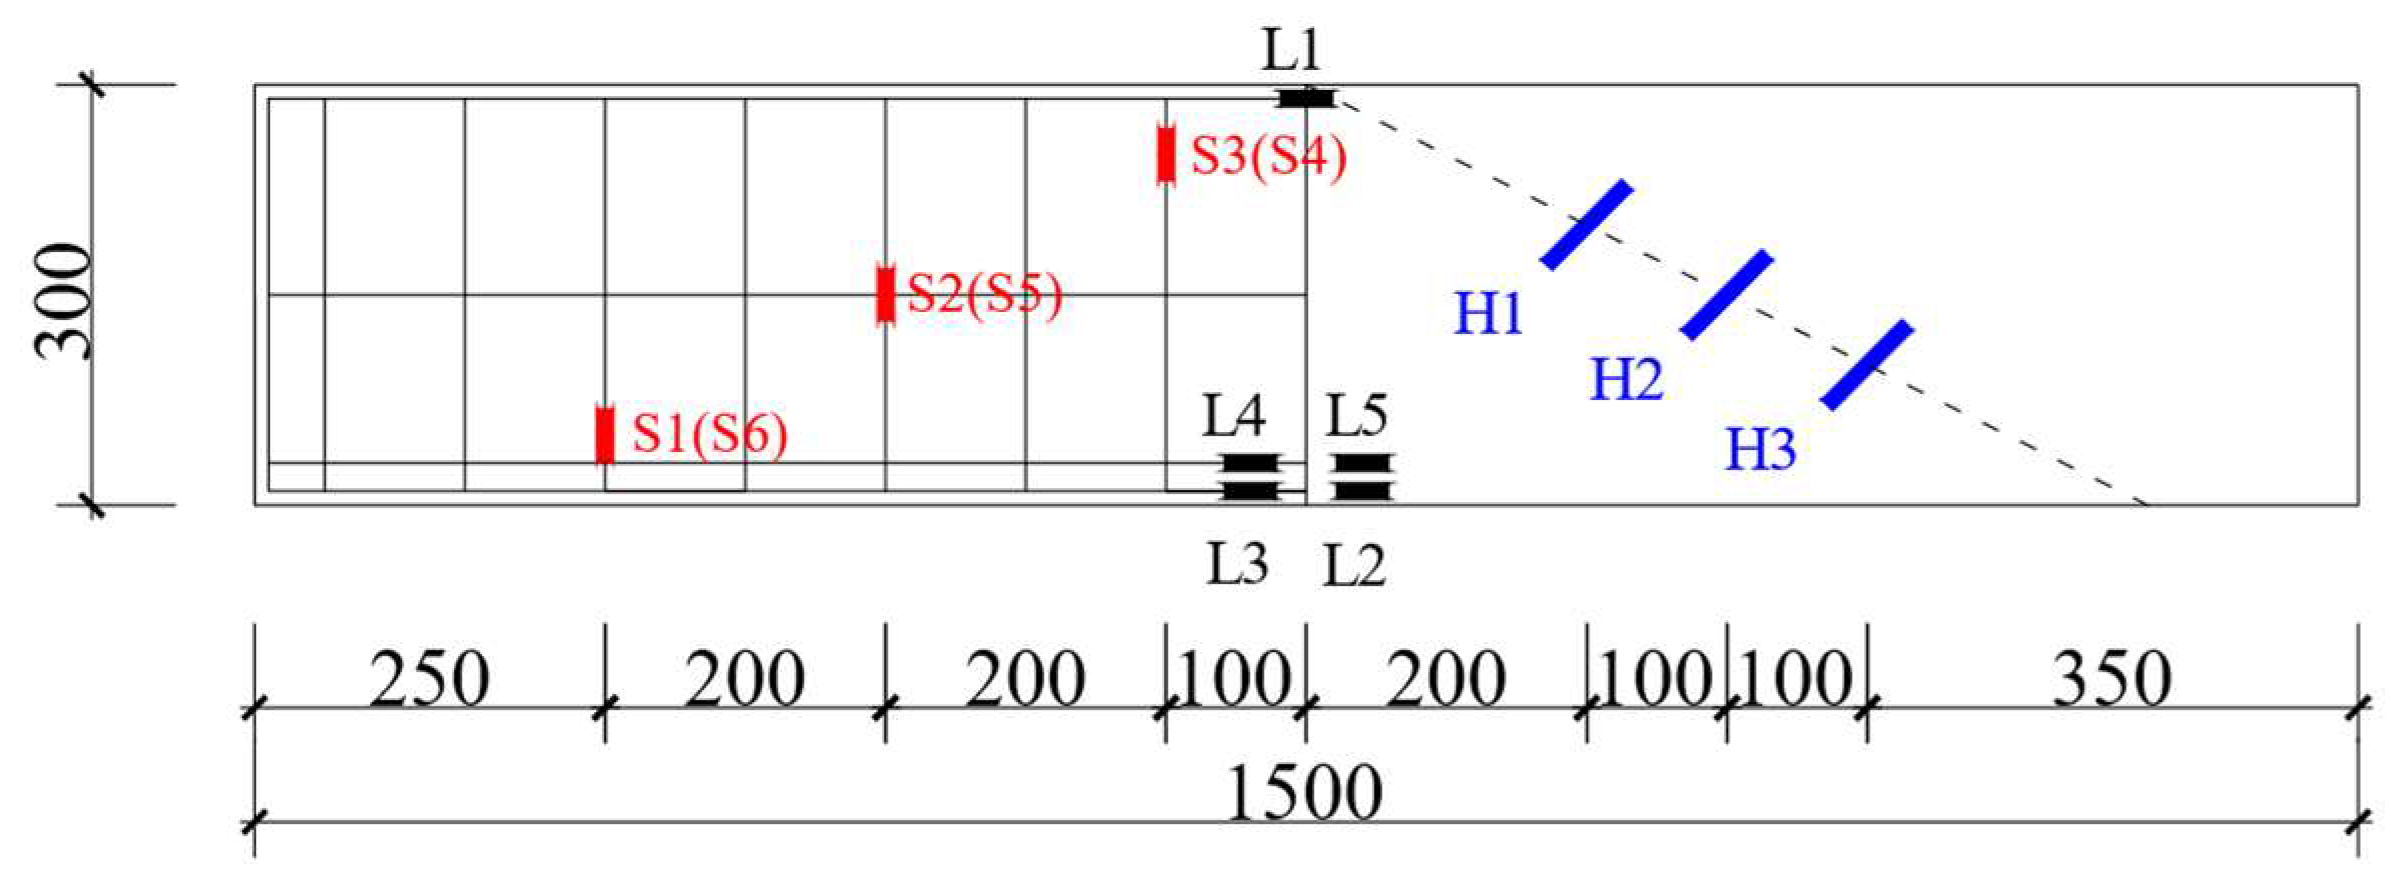
The longitudinal reinforcement strain gauge was numbered as L series, and the layout is shown in
Figure 5. The load–steel strain diagram drawn from the data measured by the experiment is shown in
Figure 15, and the data of each strain gauge rose steadily, indicating that there was no relative slip between the steel bar and the concrete and ECC mold shell.
(1) From
Figure 15a, it can be seen that compared with different mold shell materials (E2S38R and R2S38R), the load of the first vertical crack of the R2S38R specimen (78 kN) was 35.5% smaller than the load of specimen E2S38R (121 kN), resulting in the upper longitudinal reinforcement strain of the R2S38R specimen being greater than that of specimen E2S38R at the same load level. When the load was 100 kN, the strain of the R2S38R specimen (−459.6 με) was 28.9% higher than that of specimen E2S38R (326.9 με). At 200 kN, the strain of the R2S38R specimen (1793.4 με) was 51.33% higher than that of the E2S38R specimen (872.7 με). It was shown that the RC shell was more likely to crack under low load than the ECC shell, and the crack released the stress in advance, forcing the upper longitudinal reinforcement to bear more tensile stress. Comparing the different shear span ratios of the specimens, the corresponding strains of specimens E3S38R, E2S38R, and E1.5S38R with shear span ratios of 3, 2, and 1.5 were 663.5 με, 337.9 με, and 266.8 με, respectively, when the load was 100 kN, and the decreases were 49.1% and 21.0%, respectively. When the load was 200 kN, the corresponding strains of specimens E3S38R, E2S38R, and E1.5S38R were 1588.2 με, 896.0 με, and 722.3 με, respectively, and the decreases were 43.6% and 19.4%, respectively. It showed that the strain of the compressive longitudinal reinforcement in the upper part of the specimen decreased with the decrease in the shear span ratio of the specimen. The high shear span ratio (E3S38R) was dominated by bending deformation, the strain in the tensile zone of concrete was significant, the cracks developed along the mid-span, and the strain accumulation rate of longitudinal reinforcement was fast. The shear effect of the low shear span ratio (E1.5S38R) was enhanced, the main oblique cracks were rapidly penetrated, the compressive strain of concrete was dominant, and the strain growth rate of longitudinal reinforcement was slowed down.
(2) It can be seen from
Figure 15b that, compared with different mold shell materials (E2S38R and R2S38R), the load corresponding to the yield of the lower longitudinal reinforcement of the specimen R2S38R was 125 kN, while the load corresponding to the yield of the lower longitudinal reinforcement of the specimen E2S38R was 322.6 kN, which was 61.25% higher than that of the R2S38R specimen. It showed that ECC had strain-hardening characteristics and could form dense microcracks when subjected to tension. This multi-crack cracking mechanism effectively dispersed the stress concentration and delayed the formation of main cracks, thus protecting the longitudinal reinforcement from premature yield.
A comparison of specimens with varying shear span ratios (λ = 3 for E3S38R, λ = 2 for E2S38R, and λ = 1.5 for E1.5S38R) revealed distinct strain patterns in the lower longitudinal reinforcement. At 100 kN loading, the measured strains were 946.2 με (E3S38R), 358.1 με (E2S38R), and 403.5 με (E1.5S38R). This differential became more pronounced at 200 kN, with strain values increasing to 2172.8 με (E3S38R), 1092.1 με (E2S38R), and 1041.9 με (E1.5S38R). Notably, at 300 kN loading, E2S38R and E1.5S38R specimens reached similar strain levels of 1828 με and 1812.6 με, respectively. The strain development patterns demonstrated two critical observations: (1) E2S38R and E3S38R specimens shared comparable ascending phases in their strain curves, despite their different λ values. (2) Specimens with λ = 3 consistently exhibited 33–121% higher reinforcement strains than those with λ = 2 and 1.5 across loading stages. This strain disparity was directly correlated with bending moment magnitude in the mid-span region, where increased shear span ratios (λ) amplified flexural effects, thereby elevating tensile strain in the lower longitudinal reinforcement.
(3) It can be seen from
Figure 15c that, compared with different mold shell materials (E2S38R and R2S38R), the strain of the longitudinal reinforcement in the mold shell of specimen R2S38R began to increase from 180 kN, while the lower longitudinal reinforcement of specimen R2S38R had already yielded at 127 kN. With the yield of the lower longitudinal reinforcement, when the load reached 300 kN, the strain of the longitudinal reinforcement in the mold shell suddenly increased to 752 με, and then the strain gauge failed. When the load was less than 127 kN, the lower longitudinal reinforcement dominated the bending resistance, and the bond-slip at the die shell interface accumulated. When the load exceeded 127 kN, after the lower longitudinal reinforcement yielded, the longitudinal reinforcement in the shell was forced to bear the bending moment increment. However, due to insufficient interface constraints, the strain concentration accelerated local failure.
3.7. Stirrup Strain Analysis
S1 through S6 were the designations for the strain gauges. S1 to S3 were installed along the line connecting the support and the loading point, while S4 to S6 were installed at symmetrically opposite locations on the back face, corresponding to S1–S3. The specific arrangement is shown in
Figure 5. In the same control group of specimens, the stirrup strain gauges at the corresponding positions were selected for comparative analysis. The specific analysis process was as follows:
(1) Comparing the specimens of different shell materials, the load–stirrup strain of specimens E2S38R and R2S38R is shown in
Figure 16. It could be seen from the figure that at the S1 position, the strain of the stirrup was close to a linear change before the oblique crack appeared. When the R2S38R load of the specimen reached 170.3 kN, the lower longitudinal reinforcement yielded. At this time, the stirrup at the S1 position bore more shear force, which made the strain increase rapidly. After the crack of specimen E2S38R appeared, the tensile force was borne by the fiber between the cracks and the lower longitudinal reinforcement, the yield of the longitudinal reinforcement was relatively late (307 kN), and there was no oblique crack at the S1 position, resulting in little change in the stirrup at the S1 position. At the S2 position, oblique cracks appeared when R2S38R was 170 kN, which made the stirrup strain at the S2 position increase sharply. At the S2 and S3 positions, the stirrup strain changes of specimens E2S38R and R2S38R were roughly the same. Under the same load, the stirrup strain value of the E2S38R specimen was less than that of R2S38R, which indicated that the characteristics of the fiber material in the ECC shell could provide partial shear resistance.
(2) The shear span ratios of specimens E3S38R, E2S38R, and E1.5S38R were 3, 2, and 1.5, respectively. The stirrup load–strain curve of the shear span ratio control group is shown in
Figure 17. When the strain increased to 908 με, the strain gauge was destroyed, and the unit reached the yield strain of the steel bar. It showed that when the stirrup in the S1 position had not yet yielded, the bond between the stirrup and the concrete was destroyed, resulting in the damage of the stirrup strain gauge; the stirrup strain at the S1 position of the E2S38R specimen did not change during the loading cycle; the strain gauge at the S1 position of the E1.5S38R specimen changed to 0 before the load reached 226.5 kN, and increased rapidly from 226.5 kN to 449 kN. Similar to specimen E3S38R, when the stirrup had not yet yielded, the bond between the stirrup and the concrete was destroyed, resulting in damage to the stirrup strain gauge. It was shown that when the shear span ratio was 3 (E3S38R) and 1.5 (E1.5S38R), the bond between the stirrup and the concrete near the bearing end of the test beam was destroyed in the later stage of loading, while when the shear span ratio was 2, it did not occur.
In the S2 position, the strain of the E3S38R specimen increased suddenly at 100 kN, and the bond between the steel bar and the concrete was destroyed when the strain increased to 1263 με, resulting in the damage of the strain gauge; the strain gauges of specimen E2S38R and specimen E1.5S38R increased steadily at 173 kN. The stirrup of the E2S38R specimen yielded when the load was 326 kN. When the load reached the yield load of 383.97 kN, the stirrup strain was 6350 με, indicating that the strengthening stage after the stirrup yield was fully exerted and the ductility of the component was enhanced. The E1.5S38R stirrup yielded 403 kN. Similar to specimen E2S38R, the strengthening stage of the stirrups was fully utilized.
At the S3 position, the specimen E1.5S38R with a shear span ratio of 3 began to grow at the S3 position of 145 kN. When the strain increased to 1596 με, the bond between the stirrup and the concrete was destroyed, failing the strain gauge. The shear span ratio of specimen E2S38R was 2. When the load exceeded 198.9 kN, it grew steadily and slowly. When the load reached 375 kN, the stirrup strain at the S3 position reached 2015 με, and the maximum strain after yielding was 4860 με. Until the end of the test, the strain gauge did not fail due to damage, indicating that the bond between the stirrup and concrete was good. In this comparison group, the shear span ratio of E1.5S38R was the smallest at 1.5. Due to the small shear span ratio, the stirrup at the S3 position was forced from the beginning of the test, and the overall relationship was linear. When the load was 381 kN, the stirrup strain reached 2025 με and yielded. After yielding, the stirrup continued to grow until the end of the test.
(3) Effect of stirrup ratio: The stirrup ratios of specimens E2S25R, E2S38R, and E2S75R were 0.25%, 0.38% and 0.75%. The load–stirrup strain diagram of the comparison group is shown in
Figure 18.
At the S1 position, the stirrup strain of this group of specimens was quite different. The stirrup strain of specimens E2S38R and E2S75R at the S1 position did not change during the whole test. E2S25R with a stirrup ratio of 0.25% increased when the load reached 172 kN. When the load reached the ultimate load of the specimen of 344.7 kN, the corresponding stirrup strain was 1879 με, indicating that the stirrup did not yield before the failure of the component, showing brittle failure. When the load was 250 kN, the stirrup strains of E2S25R, E2S38R, and E2S75R were 294.6 με, 19.4 με, and 12.1 με; when the load was 325 kN, the stirrup strains of E2S25R, E2S38R, and E2S75R were 1143.4 με, 40.7 με, and 26.6 με, respectively.
In the S2 position, the stirrup strain of this group of specimens before 153 kN did not show a significant change. Because the maximum stirrup ratio of specimen E2S75R was 0.75% when the specimen reached the ultimate load of 444.07 kN, the stirrup strain was 1548 με and did not yield, and the strength of the stirrup was not fully exerted. The specimen E2S25R was roughly the same as the specimen E2S38R. The stirrup strain did not change much before 126 kN. When the load reached 274 kN, the stirrup strain of the E2S38R specimen was 1544 με, and the E2S25R specimen was 1976 με. Under this load, the stirrup strain of E2S25R was 27.8% higher than that of the E2S38R specimen. When the stirrup reached the yield strain at the S2 position, the load of the E2S38R specimen was 15.3% higher than that of E2S25R. When the load was 200 kN, the stirrup strains of E2S25R, E2S38R, and E2S75R were 715 με, 612 με, and 34.9 με, respectively. When the load was 300 kN, the stirrup strains of E2S25R, E2S38R, and E2S75R were 2133.7 με, 1775.3 με, and 424.4 με, respectively.
At the S3 position, the strain of the specimen E2S75R did not change much. When the load was 425 kN, the stirrup strain was 284.9 με, and the stirrup at the S3 position of the specimen did not yield. When the specimens E2S38R and E2S25R were at 200 kN, the stirrup strain rose steadily until it yielded. When the load was 250 kN, the stirrup strains of E2S25R, E2S38R, and E2S75R were 748 με, 534 με, and −17.4 με, respectively. When the load was 300 kN, the stirrup strains of E2S25R, E2S38R, and E2S75R were 1606.6 με, 862.4 με, and 44 με, respectively.
The comprehensive analysis showed that the strain of the stirrup decreased with the increase in the stirrup ratio under the same level of load. The specimen E2S25R (stirrup ratio was 0.25%) with the lowest reinforcement ratio was close to yield in the stirrups at three positions, and the strength and ductility of the stirrups were fully utilized, but it presented brittle failure. For specimen E2S38R with a stirrup ratio of 0.38%, except that the stirrups at the S1 position were not yielded, the stirrups at the other positions were yielded, and the strain could continue to develop after yielding. Due to the high reinforcement ratio of specimen E2S75R with a stirrup ratio of 0.75%, the stirrups at the three positions did not yield, and the maximum stirrup strain was 1520 με, indicating that the stress utilization rate of the stirrups was not high, and their strength and ductility were not fully utilized.


