Abstract
The blast furnace (BF) and basic oxygen route account for approximately 70% of the global steel production and create 1.8 tons of CO2 per ton of steel, produced primarily due to the use of coke and pulverized coal (PC) at the BF. With global pressure to reduce CO2 emissions, optimization of BF operation is crucial, which is possible through optimizing fuel consumption, and improving process stability. Understanding the complex combustion and flow dynamics in the raceway region is essential for enhancing reducing agent utilization. Modeling plays a key role in predicting these behaviors and providing insights into the process; however, validation of these models is crucial for their reliability but difficult in the complex and hostile BF raceway region. In this study, a validated raceway model developed at Swerim was used to evaluate four different cases, namely R1 (Reference), R2 (Low oxygen to blast), R3 (High blast moisture), and R4 (High PC) using an injection coal from SSAB Oxelösund. During actual experiments, the temperature distribution in the raceway was measured using a thermovision camera (TVC) to validate the CFD simulation results. The combined use aims to cross-validate the results simultaneously to establish a reliable framework for future parametric studies of raceway behavior under varying operational conditions using CFD simulations The results indicated that it is possible to measure the temperature within the raceway region using TVC at depths indicated to be 0.5–0.7 m, when not obscured by the coal plume, or <0.5 m, when obscured. TVC measurements are clearly quantitatively affected when obscured, indicated by considerably lower temperatures in the order of 200 °C between similar process conditions. A decrease of O2 injection results in an extended raceway region as the conditions become less chemically favorable for combustion due to a lower reactant content offsetting the ignition point and reducing the reaction rate in the raceway. An increased moisture content in the blast results in a reduced size of the race-way region as energy is consumed as latent energy and cracks water. An increase in PC rate results in a larger/wider raceway region, as more PC is devolatilized and combusted early on, resulting in larger gas volumes expanding the raceway region outwards, perpendicular to the injection.
1. Introduction
Although efforts are being made toward greener steelmaking routes, the blast furnace (BF) route remains the dominant production method for steel in Europe, contributing to about 7% of CO2 emissions. Reducing greenhouse gas emissions is a key focus for European steelmakers which can be achieved by partially replacing coke with pulverized coal injection (PCI) or by injection of biocoal. The overall need for fossil coal can be reduced, as each kg of coke produced requires 1.25–1.4 kg of coal.
High coke replacement at high PC injection rates (PCR) requires the optimization of gas distribution to achieve high gas efficiency, as the reducing gas generated at the raceway must be efficiently distributed and used in the indirect reduction of iron oxide. At high PCR, the theoretical flame temperature drops, which is counter measured by increased oxygen enrichment to blast, and the ore/coke ratio in the burden increases [1]. The maximum oxygen enrichment to the blast is mainly limited by the minimum top-gas temperature at which moisture in charged burden can be evaporated [2]. In addition, the flame temperature is also lowered more if a high volatile coal is used, the blast temperature lowered, or the blast moisture increased. Although industrial research has been conducted, requirements of stable BF operation make studies difficult on an industrial scale, and experiments on a laboratory scale [3] and pilot scale [4] are widely used instead. The harsh environment inside an industrial scale BF limits process monitoring opportunities to external monitoring; therefore, is the use of computational fluid dynamics (CFD) combined with available process data a comprehensive tool to increase knowledge?
Several 3D models take this into account through different approaches, such as tuyere combustion models [5,6], tuyere–raceway combustion models [7,8,9,10] and tuyere–raceway–coke bed combustion models [9,11,12,13]. Raceway combustion models can solve detail particle dispersion due to the rather small computational domain. However, this has an impact on particle dispersion [4], and the results cannot be applied directly for conclusions about the BF raceway combustion efficiency. In the tuyere–raceway models, the raceway cavity was represented by a simplified geometry, and this approach gives the opportunity to resolve the free shear flow (jet) in the raceway region, capturing its effect on particle dispersion and combustion efficiency. Interactions with coke were neglected and the chemical reactions and gas composition were based only on pulverized coal (PC) combustion and gasification. The tuyere–raceway–coke bed combustion models include combustion of coke. The raceway shape was not explicitly calculated but was defined as a boundary condition to limit computational efforts. The raceway was represented by a total void balloon-shaped cavity by Shen et al. [9,11,12], while Maier et al. [13] used a more circular shape with gradients in void fraction in the raceway boundary. Both were based on literature sources, but a difference in gas flow field in the raceway cavity was observed.
The model by Maier involved coke bed movement and showed that inter-phase momentum transfer made coke particles recirculate in the upper part of the raceway, fall into the jet, and partly combust. This behavior was reported from experimental observations with a high-speed camera [14] as well as within experiments conducted in the RFCS project IMPCO [15]. In addition, a 3D CFD model was developed at Swerim, following the tuyere–raceway modeling approach to ensure detailed particle trajectories in the blast. In addition to similar tuyere–raceway models, coke interaction and subsequent chemical reactions were included to properly evaluate the combustion in the BF raceway. Two different lance designs and three different injection materials were studied as follows: conventional PC and two alternative carbon materials [15,16] using kinetic parameters deduced from thermal gravimetric analysis (TGA), and boundary conditions representing operational conditions used under BF trials. Model results were validated against high-speed camera measurements into the BF raceway, and the model indicated suitability to be used as part of a broader tool for evaluated PC and alternative carbon materials, as well as injection lances.
The 3D CFD model has been further used in comprehensive studies evaluating different PCs with varying volatile matter (VM) [17], and with injection of different types of biocoals [18,19]. In [18], PC mixed with biocoals were injected into the industrial BF of SSAB in Oxelösund with simultaneous temperature measurements using a thermovision camera (TVC), supplied by DIAS Infrared Systems, Dresden, Germany, focused into the raceway.
In previous studies, TVC was used to analyze raceway conditions such as the effect on PCR on temperatures [20] or to support CFD model development, but typically as separate efforts. While some have reconstructed temperature fields using CFD or thermal cameras, validation of raceway temperature from CFD model with TVC measurements has not been demonstrated. The inherent difficulty in pinpointing the exact TVC measurement location within the raceway further limits such validation approaches.
In the present work, a novel methodology is proposed to enable direct validation of the CFD model with TVC measurements. This approach aims to establish a reliable framework for future parametric studies of raceway behavior under varying operational conditions using CFD simulations. The focus is a multi-disciplinary approach, combining the use of both 3D CFD simulations of the raceway and experimental measurements in the form of TVC to be combined to cross-validate the results from both methods simultaneously.
2. Materials and Methods
2.1. Material and BF Process Variations
This study includes injection of a PC at SSAB BF No.4 in Oxelösund during chosen time periods, with simultaneous measurements into the raceway with a TVC. The chemical composition, in wt.%, of the PC was 80.6 C (Cfix 70.6), 4.1 H, 4.6 O, 2.2 N, volatile matter (VM) 18.5 and 8.2 Ash. The higher heating value of the PC was 32.3 MJ/kg. The PC was injected through swirl-tip oxy-coal lances, while a second dust lance was injecting nitrogen gas. Different process periods with varying raceway parameters were studied, and average values were deduced.
Four time periods, which correspond to a reference period, R1, a low oxygen to blast period, R2, a high blast moisture period, R3, and a higher PCI period, R4, were selected for modeling. As seen in Table 1, the PCI is around 121 g/Nm3 for the reference and other periods, except for R4, where the PCI is ~10 g/Nm3 higher. The blast flow, temperature, and oxygen to the lance are similar for all time periods, but the oxygen to the blast is lower for R2. The consumption of coke at the tuyere level is correspondingly lower when PCR increases, or oxygen enrichment decreases. The blast moisture is lowest in R2 and highest in R3. Table 2 shows BF parameters input into the Fluent CFD model.

Table 1.
Pulverized coal injection rate (PCR), and raceway parameters on average during chosen time periods.

Table 2.
Parameters inserted into the CFD model corresponding to the average BF parameters for each time-period, varied parameters are in bold italics.
2.2. Thermovision Camera
The validation of the CFD model is conducted by comparing images from a TVC positioned to measure through a viewing hole at the back of the blowpipe in the BF at SSAB Oxelösund, as shown on the left in Figure 1. Time-averaged temperature measurements from the TVC recorded over several hours are compared with corresponding locations from the CFD simulations. As an example, a snapshot of the thermal image obtained from TVC is shown on the right side of Figure 1.
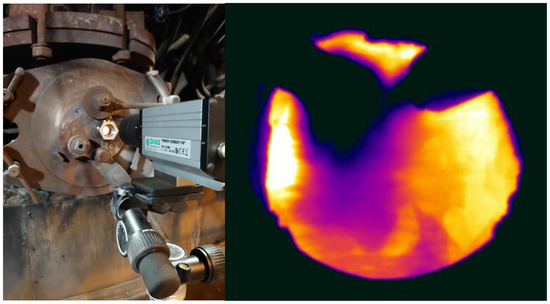
Figure 1.
The thermovision camera, TVC, at the lid of the blowpipe looking into the raceway region through the tuyere (left). Example of thermal image obtained from TVC (right).
The TVC used in this study, Model PYROVIEW 512N Compact+ is a 2D IR camera with a 512 × 384-pixel resolution, without the need for additional cooling, and capable of operating at two measurement ranges: 600–1500 °C or 1400–3000 °C, depending on the selected lens. Its spectral range is 0.8–1.1 um with a max frame rate of 60 Hz. A key advantage of this spectral range is that it allows the use of standard glass for the protective window, as these wavelengths are transmitted through regular glass. A specialized lens was employed to enable visualization of an area approximately 150 mm wide at a distance of 2 to 3 m, providing optimal view into the raceway. The tuyere diameter is approximately 150 mm.
The specified measurement cases, R1–R4, included long-time temperature measurement with the TVC. The measurement periods for validation of the CFD model were chosen to have as stable process and raceway parameter conditions as possible. The measured temperature is a short time average and the TVC settings are adjusted to focus on the similar position and depth for all monitored cases. Although operational settings and operational results are similar, in-furnace conditions vary over time due to factors such as shifting of the hot stove on blast, time relative to tapping, drifting in isothermal lines over time, and non-reduced material entering the lower part due to slips or scaffold peeling off. Also, the distribution of PC may vary due to the internal pressure distribution in front of tuyeres. This contributes to a fluctuating PC plume and may result in considerable variations in the measured temperature as well as the depth of the TVC measurement.
The measurement software PYROSOFT Professional (version 4.2.2.2) was used to define regions of interest (ROI) which can be points, lines, rectangles, circles/ellipsis, polygons, or free drawing. From ROI it is possible to define values of interest (VOI) which have been used in these measurements. For all VOI’s it is possible to have different information, for example, maximum, minimum, average, cross section temperatures, etc. With the software, it is possible to monitor and save temperature measurements. The sequence and formatting of file saving can be decided, such as sampling time, processing of temperature readings etc.
2.3. Methods
Model Setup
The multi-phase CFD simulations were performed using the commercial software ANSYS FLUENT version 18.2. A virtual geometry was constructed with simplified raceway with a cylindrical combustion chamber and open boundary, as seen in Figure 2. The continuous phase was modeled using 3D, steady-state Reynolds-averaged Navier–Stokes (RANS) equations with a realizable k-ε turbulence model and enhanced wall treatment. Alongside the RANS equations, energy and species transport equations were solved. Radiative heat transfer was modeled using the discrete ordinates radiation model.

Figure 2.
Computational domain, applied boundary conditions (red vector denotes outlet and blue vector denotes inlet), and contour plane with axis for the raceway-combustion model [17].
The Euler–Lagrange approach was employed to simulate the multi-phase flow dynamics, treating the solid phase in a steady-state manner by tracking spherical particles across the computational domain. These particles interacted with the continuous phase through mass, momentum, and energy exchange. A stochastic tracking model accounted for turbulence-induced dispersion, while a particle radiation interaction model incorporated particle effects into the radiation model. To accurately reflect the particle size distribution (PSD), a Rosin–Rammler distribution was applied based on PSD data from material screening. The CFD model employed in this study has been previously developed and described in detail in [15,16,17,18].
The conversion of pulverized reduction agents is defined by four steps in the model: pre-heating, devolatilization, homogenous reactions, and heterogeneous reactions. The chemical reactions considered are presented in Table 3.

Table 3.
Chemical reactions taking place in the CFD model [16,17,18,19].
Kinetic parameters for reaction (CR1), (CR7), and (CR8) were deduced from TGA data on sample mass versus time in different atmospheres, as shown in Table 4. Coke has minor volatile content thus the devolatilization is not considered in the model. Previous publications provide a comprehensive explanation of the governing equations, boundary conditions, and reaction mechanisms used in the model [16,17,18,19]. Readers seeking a deeper understanding of the model formulation and underlying assumptions are encouraged to refer to these sources.

Table 4.
Kinetic parameters for heterogeneous reactions deduced from TGA test results [19].
3. Results and Discussion
3.1. Raceway Size
The performance of the different simulation cases is investigated through determining the raceway size and comparing it between the cases. In these cases, the raceway size is defined as the region within the raceway part of the BF where the oxygen content is above 0.5%. There is thus no consideration on the temperature or other gas components.
The temperature and gas composition fields for CFD simulation of the reference case R1 are presented in Figure 3 for the XY (the horizontal plane through the lances, as seen from above) and YZ (the vertical plane through the center of the tuyere, as seen from the side) planes, respectively. The temperature and gas compositions for R2–R4 are illustrated in Figure A1, Figure A2 and Figure A3 (Appendix A). The raceway boundaries are represented by the red lines and ARW denotes the area of the bounded raceway region.
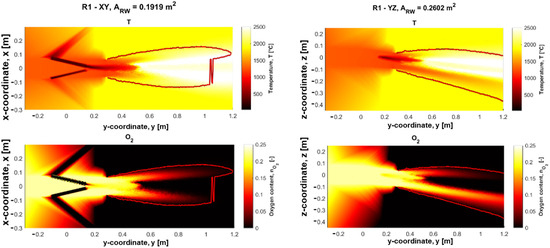
Figure 3.
Temperature and gas composition fields for the XY- and YZ-planes of the raceway of reference case R1.
The selected parameters describing the size of the raceway are the length of the upper and lower oxygen jets as well as the distance to the start of the central oxygen deficient corridor and the raceway area in both the XY- and YZ-planes. The respective values of these parameters for the four different cases are presented in Table 5.

Table 5.
Resulting raceway comparison from the R1–R4 simulations.
It is indicated by the model that lowering the oxygen in case R2, which also results in a corresponding reduction in the consumption of coke per time unit, see Table 2, results in an overall larger raceway region, as seen mainly in the XY plane. This is likely related to less favorable conditions for combustion due to lower oxygen content, which displaces the start of combustion further into the raceway, and overall, slightly reduces the temperatures in the raceway. Kinetic parameters that are characteristic of a lowly reactive coke result in lower consumption of oxygen per time unit and thus the raceway extends deeper into the BF.
The higher moisture addition to the blast in R3 contributed to reduced raceway size in both planes. This is expected behavior, as more moisture results in a higher energy requirement to supply the latent heat to increase the additional water’s temperature, evaporate it, and dissociate it, forming oxygen and hydrogen.
The coke consumption is decreased in direct correlation to increasing the PCR in R4. The oxygen deficient corridor started closer to the tuyere nose than for the reference in one plane, but later in the other plane. An overall conclusion that can be drawn is that the PC is combusted more rapidly in this case.
3.2. Temperature Validation with Thermovision Camera Data
Temperatures at each of 13 VOIs were extracted from the TVC and are shown in the snapshot to the left in Figure 4. The data corresponding to a similar plane extracted from the CFD model is pictured to the right in Figure 4.
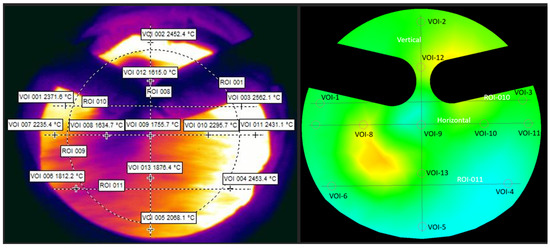
Figure 4.
Example of images used for validation of the CFD model, a snapshot from thermovision camera (left) and the same plane extracted from CFD model (right).
A comparison between the temperature data, VOI, of the TVC to the CFD model is shown in Table 6, whereas the CFD results are extracted from the simulations on a plane 0.35 m from the tip of the lance. From the overall trends, the TVC measurements indicated higher temperatures for most measurements. The exceptions are VOI 2, which lies on the top edge of the tuyere, as well as VOI 8, 12, and 13, which all lie in the region affected by the plume. This indicates that the TVC is restricted from measuring deeper into the center of the raceway when there is a coal plume present. The resulting temperature from the points in the plume may however still be useful to determine the temperature at the plume in the raceway.

Table 6.
Average temperatures for the VOI from the TVC and CFD model along with relative error.
The variation between the different periods as well as the overall magnitude of the temperature is larger in the TVC measurement compared to the steady-state results of the CFD model. The data from the points shows that the variation between the TVC measurements is in the region of 350–500 °C compared to for the CFD simulation where the variation is generally within 100 °C. The steady state CFD model result shows the variation due to the operational settings, while the TVC also captures instantaneous temperature changes in raceway due to in-furnace phenomena influencing the pressure and therefore the PCI and blast are difficult to simulate.
The measurement uncertainty of the thermal camera is approximately ±2% of the recorded temperature in Celsius, which corresponds to an uncertainty range of ±40–50 °C for the temperature values encountered in this study. The CFD simulation relative error was calculated as the absolute difference between the CFD-model temperature and the TVC temperature, divided by the TVC temperature. The average relative error values range from 5% to 25%. These differences may be attributed to factors such as the exact location of the analysis point, variations in the plume, and other process parameters not included in the model.
The TVC is set up to measure into the raceway in similar ways during all test periods R1–R4; however, the plume may block the camera’s vision at one VOI, making it measure shallowly within the tuyere whilst at another point it measures unobstructed deeper into the BF. As a result, the measuring depth of the TVC may vary between selected process periods. To investigate the effect of this, it is instead necessary to extract the comparative values from the CFD by extracting the temperature data from lines penetrating parallelly into the raceway, rather than points on a plane with fixed distance from the tuyere, which may or may not be representative. In this case the lines were created with the same angle as the tuyere exit, and they do not take into consideration the expanding field of vision of the camera. The constraint of the lines is that they pass through the x- and y-coordinates of respective previously compared points (VOI 1–VOI 13) at the tuyere exit. Figure 5 shows the lines which are used for temperature extraction, and identification of depth of TVC measurement using the temperature graphs from simulation indicated by the stars which correlate to the temperature registered in the experiment.
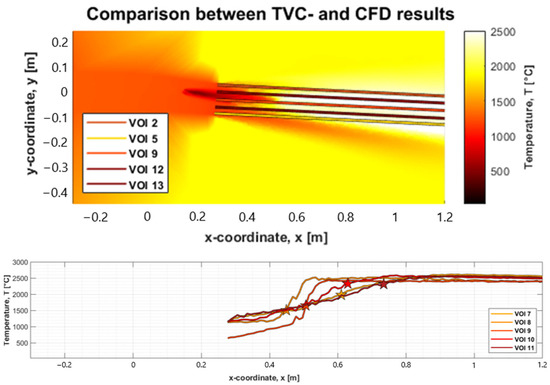
Figure 5.
Above, lines on the YZ-plane used for extraction of temperature data for validation of the model. Below, identification of depth of TVC measurement using the temperature graphs from simulation indicated by the stars which correlate to the temperature registered in the experiment.
Comparing the temperature measurements from the TVC with the CFD, the temperatures are plotted along the lines shown in both the XY- and YZ-planes. The average temperature is then extracted from the TVC in each of the compared points (VOI 1–VOI 13), as performed previously, and matched to the first point on the projected line from the CFD results with the similar temperature. The related intersection point is marked by a star on each line, see Figure 6. This gives an indication of the depth of the measurement for the XY- and YZ-planes, respectively, which can be used to determine if the depth is reasonable as depth of TVC measurement.
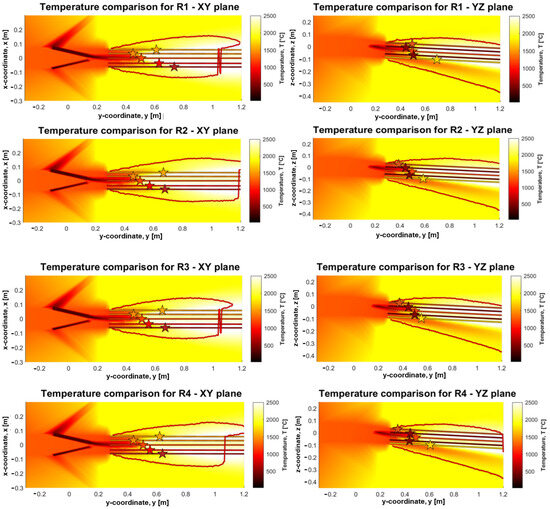
Figure 6.
CFD temperature lines from the XY- and YZ-planes compared with average temperature at the TVC measurement points, the stars indicate where the CFD model temperature matches the measured TVC average temperature. From top to bottom R1, R2, R3 and R4.
The respective distances are additionally presented in Table 7 for R1 (reference), R2 (low O2), R3 (high moisture), and R4 (high PC), with their respective simulation equivalent.

Table 7.
Depth relative injection-lance tip at which the CFD model estimated temperature matches the TVC average temperature.
While it is not possible to exactly determine a fixed depth within the raceway where the TVC is indicated, nor is it possible to completely validate the CFD model results against the camera measurement, it is possible to obtain some indications on the measurement based on the results.
The combination of simulated and experimental results indicate that the TVC is capable of measuring at a distance ranging between 0.5 and 0.7 m into the raceway, where the zero-depth reference point is located at the tip of the lance. The coal plume blocks the camera’s view in the central regions of the raceway, preventing deeper measurements into the raceway. The restriction in measuring depth was more at higher PC rates. The YZ-plane graphs suggest that there is a nearly linear trend towards increased measurement depth in the downwards vertical direction of the raceway. The XY-plane graphs similarly show a linear trend, whereas the measurement depth increases from the left towards the right of the raceway, relative to an outside observer. This is with the exception of VOI 7, which is the leftmost point, and likely in a zone that is outside the coal plume. Overall, this indicates that the coal plume occupies the upper-central left region of the raceway, relative to an observer looking into the raceway from outside.
The TVC data indicates that the temperature within the raceway is the highest for the reference period, R1. The temperature is significantly lower for all other periods, with an average temperature decrease of 163, 181, and 210 °C, for R2, R3, and R4, respectively. This is in line with the fact that lowering the O2 concentration, increasing the moisture addition, and increasing PCR all contribute to lower raceway adiabatic temperature (RAFT). However, the effect on measured temperature is higher compared to an estimate based on rule of thumb which is <100 °C [2]. The higher effect seen in the measured data can be explained that the RAFT corresponds to an average for the raceway, while the impact is likely strongest close to the tuyere nose due to evaporation and cracking of moisture and devolatilization of PC.
Overall, it is indicated that the behavior of the plume is important to consider when evaluating temperature measurements into the raceway to be able to quantify the dynamics of the raceway region of the BF and verify simulation data for raceway.
4. Conclusions
The combined use of TVC and CFD simulations was applied to gain insight into the dynamics of the raceway region and to further verify raceway modeling results. These indicate that it is possible to measure the temperature within the raceway region, using TVC at depths indicated to be 0.5–0.7 m when not obscured by the coal plume. An increase in PCR is seen to have clear effects on the data achieved from TVC, due to the focus of the measurement ending up on the plume. The measurements are clearly quantitatively affected by lower temperatures when measuring at the coal plume compared to deeper in the raceway.
The temperature differences in raceway average temperatures are in the order of 200 °C between similar process conditions. This can be compared to expected differences based on modeling results and conventional RAFT calculation in the region of <100 °C for the changes conducted. However, the impact on temperature is stronger in a position close to the tuyere nose compared to on the average of the whole region.
The conclusions regarding the impact on raceway size assume that the raceway boundary corresponds to the border at which the remaining O2 content is less than 0.5%. Furthermore, the extension of the raceway is judged for the X-Y- and Y-Z-planes, respectively, not on a continuous 3D surface of the raceway. The simulations indicate that the decrease of oxygen enrichment to the blast results in an extended raceway region, which can be due to less chemically favorable conditions for combustion, offsetting the ignition point and reducing the reaction rate in the raceway. An increased moisture content in the blast results in a reduced size of the raceway region as more energy is consumed as latent energy and to crack the water. Finally, the increase in PCR results in an inconclusive difference in raceway size in evaluated planes.
Overall, it could be seen that the raceway region is difficult to quantify even with a combined simulative and experimental effort. However, the synergy of using this approach is obvious, allowing for a more in-depth understanding of where the measurements take place via cross-validation. Future investigations into the raceway dynamics can thus clearly benefit from utilizing this multi-disciplinary approach. Further evaluation of the impact of the coal plume and its interaction with the TVC results would be beneficial.
Author Contributions
Conceptualization, J.E.; methodology, J.E., S.K., L.-E.F., M.L., L.S.Ö. and M.K.; software, S.K.; validation, L.-E.F., J.E. and S.K.; formal analysis, J.E., S.K., L.-E.F., M.L., L.S.Ö. and M.K.; investigation, J.E., S.K., L.-E.F., M.L., L.S.Ö. and M.K.; resources, M.K.; data curation, J.E., S.K., L.-E.F., M.L., L.S.Ö. and M.K.; writing—original draft preparation, J.E., S.K., L.-E.F., M.L. and L.S.Ö.; writing—review and editing, J.E., S.K., L.-E.F., M.L. and L.S.Ö.; project administration, M.L., J.E. and S.K.; funding acquisition, M.L. All authors have read and agreed to the published version of the manuscript.
Funding
The research was funded by the European Union RFCS (Research Fund for Coal and Steel), Grant agreement 800771 (2018) SPARERIB, and the APC was funded by The Center of Advanced Mining and Metallurgy at Luleå University of Technology.
Institutional Review Board Statement
Not applicable.
Informed Consent Statement
Not applicable.
Data Availability Statement
The datasets presented in this article are not readily available due to sensitivity in sharing geometrical designs and process conditions.
Acknowledgments
Support from SSAB in the industrial trials at their BF, providing raw material for experiments and the technical support from the operational personnel, is highly appreciated.
Conflicts of Interest
Authors Sailesh Kesavan, Joakim Eck and Maria Lundgren are employed by the Swerim AB, Lars-Erik From is employed by the Konstruktionstjänst AB, Martin Kjellberg is employed by the SSAB EMEA AB, SSAB Special Steels Division. The remaining author declares that the research was conducted in the absence of any commercial or financial relationships that could be construed as a potential conflict of interest.
Abbreviations
The following abbreviations are used in this manuscript:
| 3D | Three-dimensional |
| BF | Blast furnace |
| CFD | Computational fluid dynamics |
| PC | Pulverized coal |
| PCI | Pulverized coal injection |
| PCR | Pulverized coal injection rate |
| PSD | Particle size distribution |
| RANS | Reynolds-averaged Navier–Stokes |
| ROI | Region of interest |
| TVC | Thermovision camera |
| VOI | Value of interest |
| VM | Volatile matter |
Appendix A
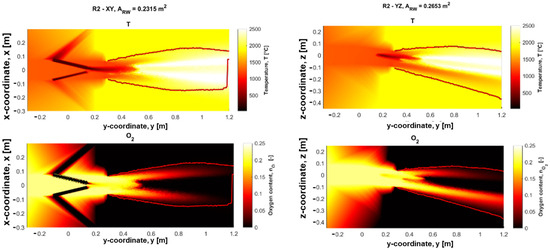
Figure A1.
Temperature and gas composition fields for the XY- and YZ-planes of the raceway of case R2, low oxygen.
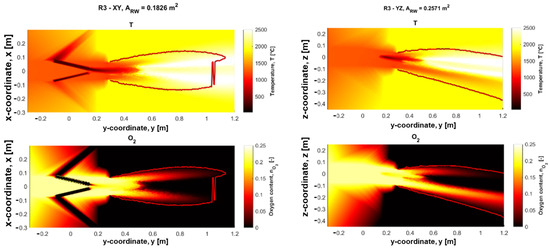
Figure A2.
Temperature and gas composition fields for the XY- and YZ-planes of the raceway of case R3, high blast moisture.
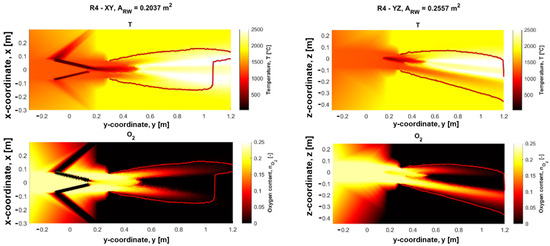
Figure A3.
Temperature and gas composition fields for the XY- and YZ-planes of the raceway of case R4, high PCI no steam.
References
- Ishii, K. Advanced Pulverized Coal Injection Technology and Blast Furnace Operation, 1st ed.; Elsevier Science Ltd.: Oxford, UK, 2000; pp. 10, 11. ISBN 0 08 043651 X. [Google Scholar]
- Geerdes, M.; Toxupeus, H.; van der Vliet, C. Modern Blast Furnace Ironmaking an Introduction; Verlag Stahleisen GmbH: Dűsseldorf, Germany, 2004; pp. 43, 44, 79. ISBN 3-514-00713-6. [Google Scholar]
- Vamvuka, D.; Schwanekamp, G.; Gudenau, H.W. Combustion of pulverized coal with additives under conditions simulating blast furnace injection. Fuel 1996, 75, 1145–1150. [Google Scholar] [CrossRef]
- Mathieson, J.G.; Truelove, J.S.; Rogers, H. Towards an understanding of coal combustion in blast furnace tuyere injection. Fuel 2005, 84, 1229–1237. [Google Scholar] [CrossRef]
- Du, S.-W.; Chen, W.-H.; Lucas, J. Performances of pulverized coal injection in blowpipe and tuyere at various operational conditions. Energy Convers. Manag. 2007, 48, 2069–2076. [Google Scholar] [CrossRef]
- Majeski, A.; Rundstedtler, A.; D’Alessio, J.; MacFadyen, N.; Ferron, K. The effects of lance positioning and design on the co-injection of pulverized coal and natural gas into blast furnace. In Proceedings of the Ninth International Conference on CFD in the Minerals and Process Industries, Melbourne, Australia, 10–12 December 2012; CSIRO: Victoria, Australia, 2012. [Google Scholar]
- Guo, B.; Zulli, P.; Rodgers, H.; Mathieson, J.G.; Yu, A. Three-dimensional Simulation of Flow and Combustion for Pulverised Coal Injection. ISIJ Int. 2005, 45, 1272–1281. [Google Scholar] [CrossRef]
- Shen, Y.; Guo, B.; Yu, A.; Zulli, P. Model Study of the Effects of Coal Properties and Conditions on Pulverized Coal combustion. ISIJ Int. 2009, 49, 819–826. [Google Scholar] [CrossRef]
- Shen, Y.S.; Guo, B.Y.; Yu, A.B.; Austin, P.R.; Zulli, P. Three-dimensional modelling of in-furnace coal/coke combustion in a blast furnace. Fuel 2011, 90, 728–738. [Google Scholar] [CrossRef]
- Shen, Y.S.; Yu, A.B. Modelling of injecting a ternary coal blend into a model ironmaking blast furnace. Miner. Eng. 2016, 90, 89–95. [Google Scholar] [CrossRef]
- Shen, Y.S.; Yu, A.B.; Austin, P.R.; Zulli, P. CFD study of in-furnace phenomena of pulverized coal injection in BF: Effects of operating conditions. Powder Technol. 2012, 223, 27–38. [Google Scholar] [CrossRef]
- Shen, Y.; Yu, A.; Austin, P.; Zulli, P. Modelling in-furnace phenomena of pulverized coal injection in ironmaking blast furnace: Effects of bed porosities. Miner. Eng. 2012, 33, 54–65. [Google Scholar] [CrossRef]
- Maier, C.; Jordan, C.; Feilmayr, C.; Harasek, M. Multi-scale modelling of hydrocarbon injection into the blast furnace raceway. In Proceedings of the 10th International Conference on CFD in Oil & Gas, Metallurgical and Process Industries, Trondheim, Norway, 17–19 June 2014; SINTEF: Trondheim, Norway, 2014. [Google Scholar]
- Kase, M.; Sugata, M.; Yamaguchi, K.; Nakagome, M. Analysis of coke behavior in raceway using endoscope and high-speed camera. Trans. ISIJ 1982, 22, 811–819. [Google Scholar] [CrossRef][Green Version]
- Improved Coal Combustion Under Variable BF Conditions (IMPCO); RFSR-CT-2012-00002, 2018, EUR 29519 EN; European Union: Brussels, Belgium, 2018.
- Ölund, M.; Sundqvist Ökvist, L.; From, L.-E.; Sandström, D.; Alatalo, J. Modelling combustion of pulverised coal and alternative carbon materials in the blast furnace raceway. In Proceedings of the 12th International Conference on CFD in Oil & Gas, Metallurgical and Process Industries, Trondheim, Norway, 30 May–1 June 2017; SINTEF: Trondheim, Norway, 2017. [Google Scholar]
- RFCS-800771:2018; Semi-Coke Particles Evolution and Raceway Instrumentation at the Blast Furnace (SPARERIB). European Commission: Brussels, Belgium, 2019.
- Sundqvist Ökvist, L.; Lundgren, M.; From, L.-E.; Eck, J.; Kjellberg, M.; Ahmed, H. Realization of Bio-Coal Injection into the Blast Furnace. Metals 2024, 14, 969. [Google Scholar] [CrossRef]
- Sundqvist Ökvist, L.; Lundgren, M. Experiences of Bio-Coal Applications in the Blast Furnace Process—Opportunities and Limitations. Minerals 2021, 11, 863. [Google Scholar] [CrossRef]
- Ferret, F.; Babich, A.; Senk, D. Temperature monitoring in the raceway during the injection of PC: Thermovision camera measurements. In Proceedings of the 8th ECIC European Coke and Ironmaking Congress and 9th ICSTI International Conference, Bremen, Germany, 29 August–2 September 2022. [Google Scholar]
Disclaimer/Publisher’s Note: The statements, opinions and data contained in all publications are solely those of the individual author(s) and contributor(s) and not of MDPI and/or the editor(s). MDPI and/or the editor(s) disclaim responsibility for any injury to people or property resulting from any ideas, methods, instructions or products referred to in the content. |
© 2025 by the authors. Licensee MDPI, Basel, Switzerland. This article is an open access article distributed under the terms and conditions of the Creative Commons Attribution (CC BY) license (https://creativecommons.org/licenses/by/4.0/).