Abstract
A plasma electrolytic oxidation (PEO) coating was produced on 6061 aluminum alloy within a silicate-containing electrolyte using a bipolar pulsed power supply. The impact of K2ZrF6 addition on the wear resistance of the coating was investigated. The phase composition, surface morphology, and elemental distribution of the coatings were assessed by means of X-ray diffraction (XRD), energy-dispersive spectroscopy (EDS), and scanning electron microscopy (SEM). Experimental data revealed that the growth rate of the coating increased by 37.3% compared to that without K2ZrF6; the addition of K2ZrF6 favored the formation of mullite and enhanced the coating densification; it also improved the breakdown voltage of the coating, which increased by 46.0% compared to that without K2ZrF6; and it also demonstrated excellent abrasion resistance, with a reduction of 41.8% in the weight of the abrasion.
1. Introduction
Due to their favorable strength-to-weight ratio, aluminum alloys find extensive use in automotive and transportation components. However, their low hardness and poor wear resistance often limit their applicability [1,2]. Micro-arc oxidation (MAO), alternatively termed PEO, enables the formation of an adherent ceramic coating on aluminum substrates, markedly enhancing their wear resistance, corrosion resistance, and adhesion strength [3,4,5]. The performance of the ceramic coating is primarily influenced by the electrolyte composition and electrical parameters [6,7].
Soft plasma discharges have received much attention in recent years. In conventional plasma electrolytic oxidation, oxide generation is known to be related to the anodic polarization; however, the rate and quality of oxide generation were found to increase when negative pulses were introduced [8,9]. In particular, during PEO processing of aluminum alloys, a distinct soft plasma discharge mode is activated when the cathodic current density surpasses its anodic counterpart. This discharge mode significantly enhances both the deposition rate and coating quality [10,11]. The appearance of soft plasma is often accompanied by a uniform distribution of sparks, a reduction in the intensity of the discharge and a reduction in acoustic emission [11,12,13]. An obvious increase in the content of α-Al2O3 was found in the ceramic layers formed in the soft plasma, and this formation of α-Al2O3 in the soft plasma is one of the most interesting phenomena in MAO research [13].
However, despite the enhanced coating density achievable through soft plasma processing of aluminum surfaces, the coating hardness depends only on the percentage of α-Al2O3 in the coating, which determines the maximum value of the coating hardness [14]. Multiple studies have aimed at toughening the coating or increasing the hardness of the coatings by adding appropriate nanoparticles to the electrolyte to obtain a ceramic layer with the corresponding oxides. Amin Hakimizad [15] found that using W-doped silica-based solution in bipolar mode reduces the porosity and at the same time generates high-hardness coatings. D.V. Mashtalyar et al. [16] prepared coatings with better mechanical properties and higher microhardness by adding titanium nitride and sodium dodecyl sulfate to the electrolyte. Zhang et al. [17] found that PEO coatings incorporating nanoparticles had a smaller pore size and better wear and corrosion resistance. Matykina et al. [18] prepared coatings with wear resistance by adding zirconium dioxide to the electrolyte. Zirconia-toughened alumina has enhanced properties including hardness, wear resistance, and most importantly, higher fracture toughness than monolithic Al2O3 [19,20,21]. However, higher concentrations of NP require the use of surfactants, which is not favorable for industrial applications [22].
Several authors have confirmed the benign effect of using K2ZrF6 additives in PEO coatings. For example, Zhang et al. [23] observed an increase in the formation rate and uniformity of MAO coatings on aluminum alloys with the addition of K2ZrF6. By K2ZrF6 addition, the current was increased, which resulted in the maximum solid melt deposition and formation rate. Further reports showed that the F− provided by K2ZrF6 led to an increase in homogeneity and made the inner layer denser [24,25].
The current study aims to investigate the influence of K2ZrF6 doping on the wear resistance of PEO coatings during soft plasma discharge. This investigation evaluates the impact of K2ZrF6 doping on the growth kinetics, breakdown voltage, and wear resistance of coatings while also introducing a wear reduction mechanism.
2. Methods and Materials
2.1. Experiment Preparation
A 6061 aluminum alloy cylinder (Φ 35 × 3 mm) with a composition of 0.8–1.2% Mg, 0.4–0.8% Si, 0.7% Fe, 0.15–0.4% Cu, 0.25% Zn, 0.04–0.35% Cr, 0.15% Ti, 0.15% Mn and balanced Al was utilized as the base material. Prior to PEO processing, the specimens were mechanically polished by the use of SiC abrasives (up to 2000 grit), followed by ethanol ultrasonic cleaning (15 min) before being re-cleaned using a large amount of deionized water, blown dry and set aside.
2.2. Plasma Electrolytic Oxidation
The oxidation process was conducted in an aqueous electrolyte system with a Na2SiO3 (AR, Sinopharm Chemical Reagent Co., Ltd., Shanghai, China) to (NaPO3)6 (AR, Sinopharm Chemical Reagent Co., Ltd., Shanghai, China) ratio of 2:1, maintained at 20 °C via a recirculating cooling circulation system. The sample, serving as the anode, was connected to a pulsed power supply opposite a stainless steel cylindrical cathode. The electrical parameters were configured as follows: current density (6 A/dm2 cathodic, 7.5 A/dm2 anodic) at a 500 Hz frequency with a 20% duty cycle and a plasma electrolytic oxidation treatment duration of 40 min. K2ZrF6 (AR, Shanghai Aladdin Biochemical Technology Co., Ltd., Shanghai, China) and citric acid (CA) were sequentially added to the electrolyte for three experiments, S1 (0 g/L K2ZrF6), S2 (5 g/L K2ZrF6), and S3 (5 g/L K2ZrF6 + CA). The corresponding relationship between the number of samples and the amount of K2ZrF6 added in the experiment is shown in Table 1.

Table 1.
Adding the content of K2ZrF6.
2.3. Coating Performance Test Methods
Coating thickness was measured by means of an eddy current thickness gauge at five randomly selected points on each side of the specimen (accuracy 0.1 μm), the average of which indicated the thickness of the coating (FMP20, Helmut Fischer GmbH, Waldkirch, Germany). The surface roughness of plasma electrolytic oxide coatings was tested utilizing a roughness meter (TR-210, Helmut Fischer GmbH, Waldkirch, Germany). Phase analysis was performed by use of an X-ray diffractometer (XRD, D/Max-2400, Rigaku Corporation, Tokyo, Japan) operating in grazing-incidence mode (3° incidence angle) with a 10–90° range, 0.02° step size, and 8°/min scanning rate. Surface morphology and elemental composition were examined with a scanning electron microscope (SEM, JSM-IT500, JEOL Ltd., Tokyo, Japan) coupled with an X-ray energy spectrometer (EDS, X-ACT, JEOL Ltd., Japan, Tokyo, Tokyo). The cross-sectional hardness of the coating was measured using a microhardness tester (HVT-1000, Jinan Hansen Precision Instruments, Jinan, China). The wear resistance of the prepared plasma electrolytic oxidation coating was characterized by a friction tester (XLGT200, Xi’an University of Technology, Xian, China). The friction coefficient during the process was recorded and the mass wear of the coating was measured by a balance. The friction test parameters are shown in Table 2.
Table 2.
Parameters for tribological testing.
3. Results and Discussion
3.1. Effect of K2ZrF6 Addition on the Time-Dependent Voltage Profile
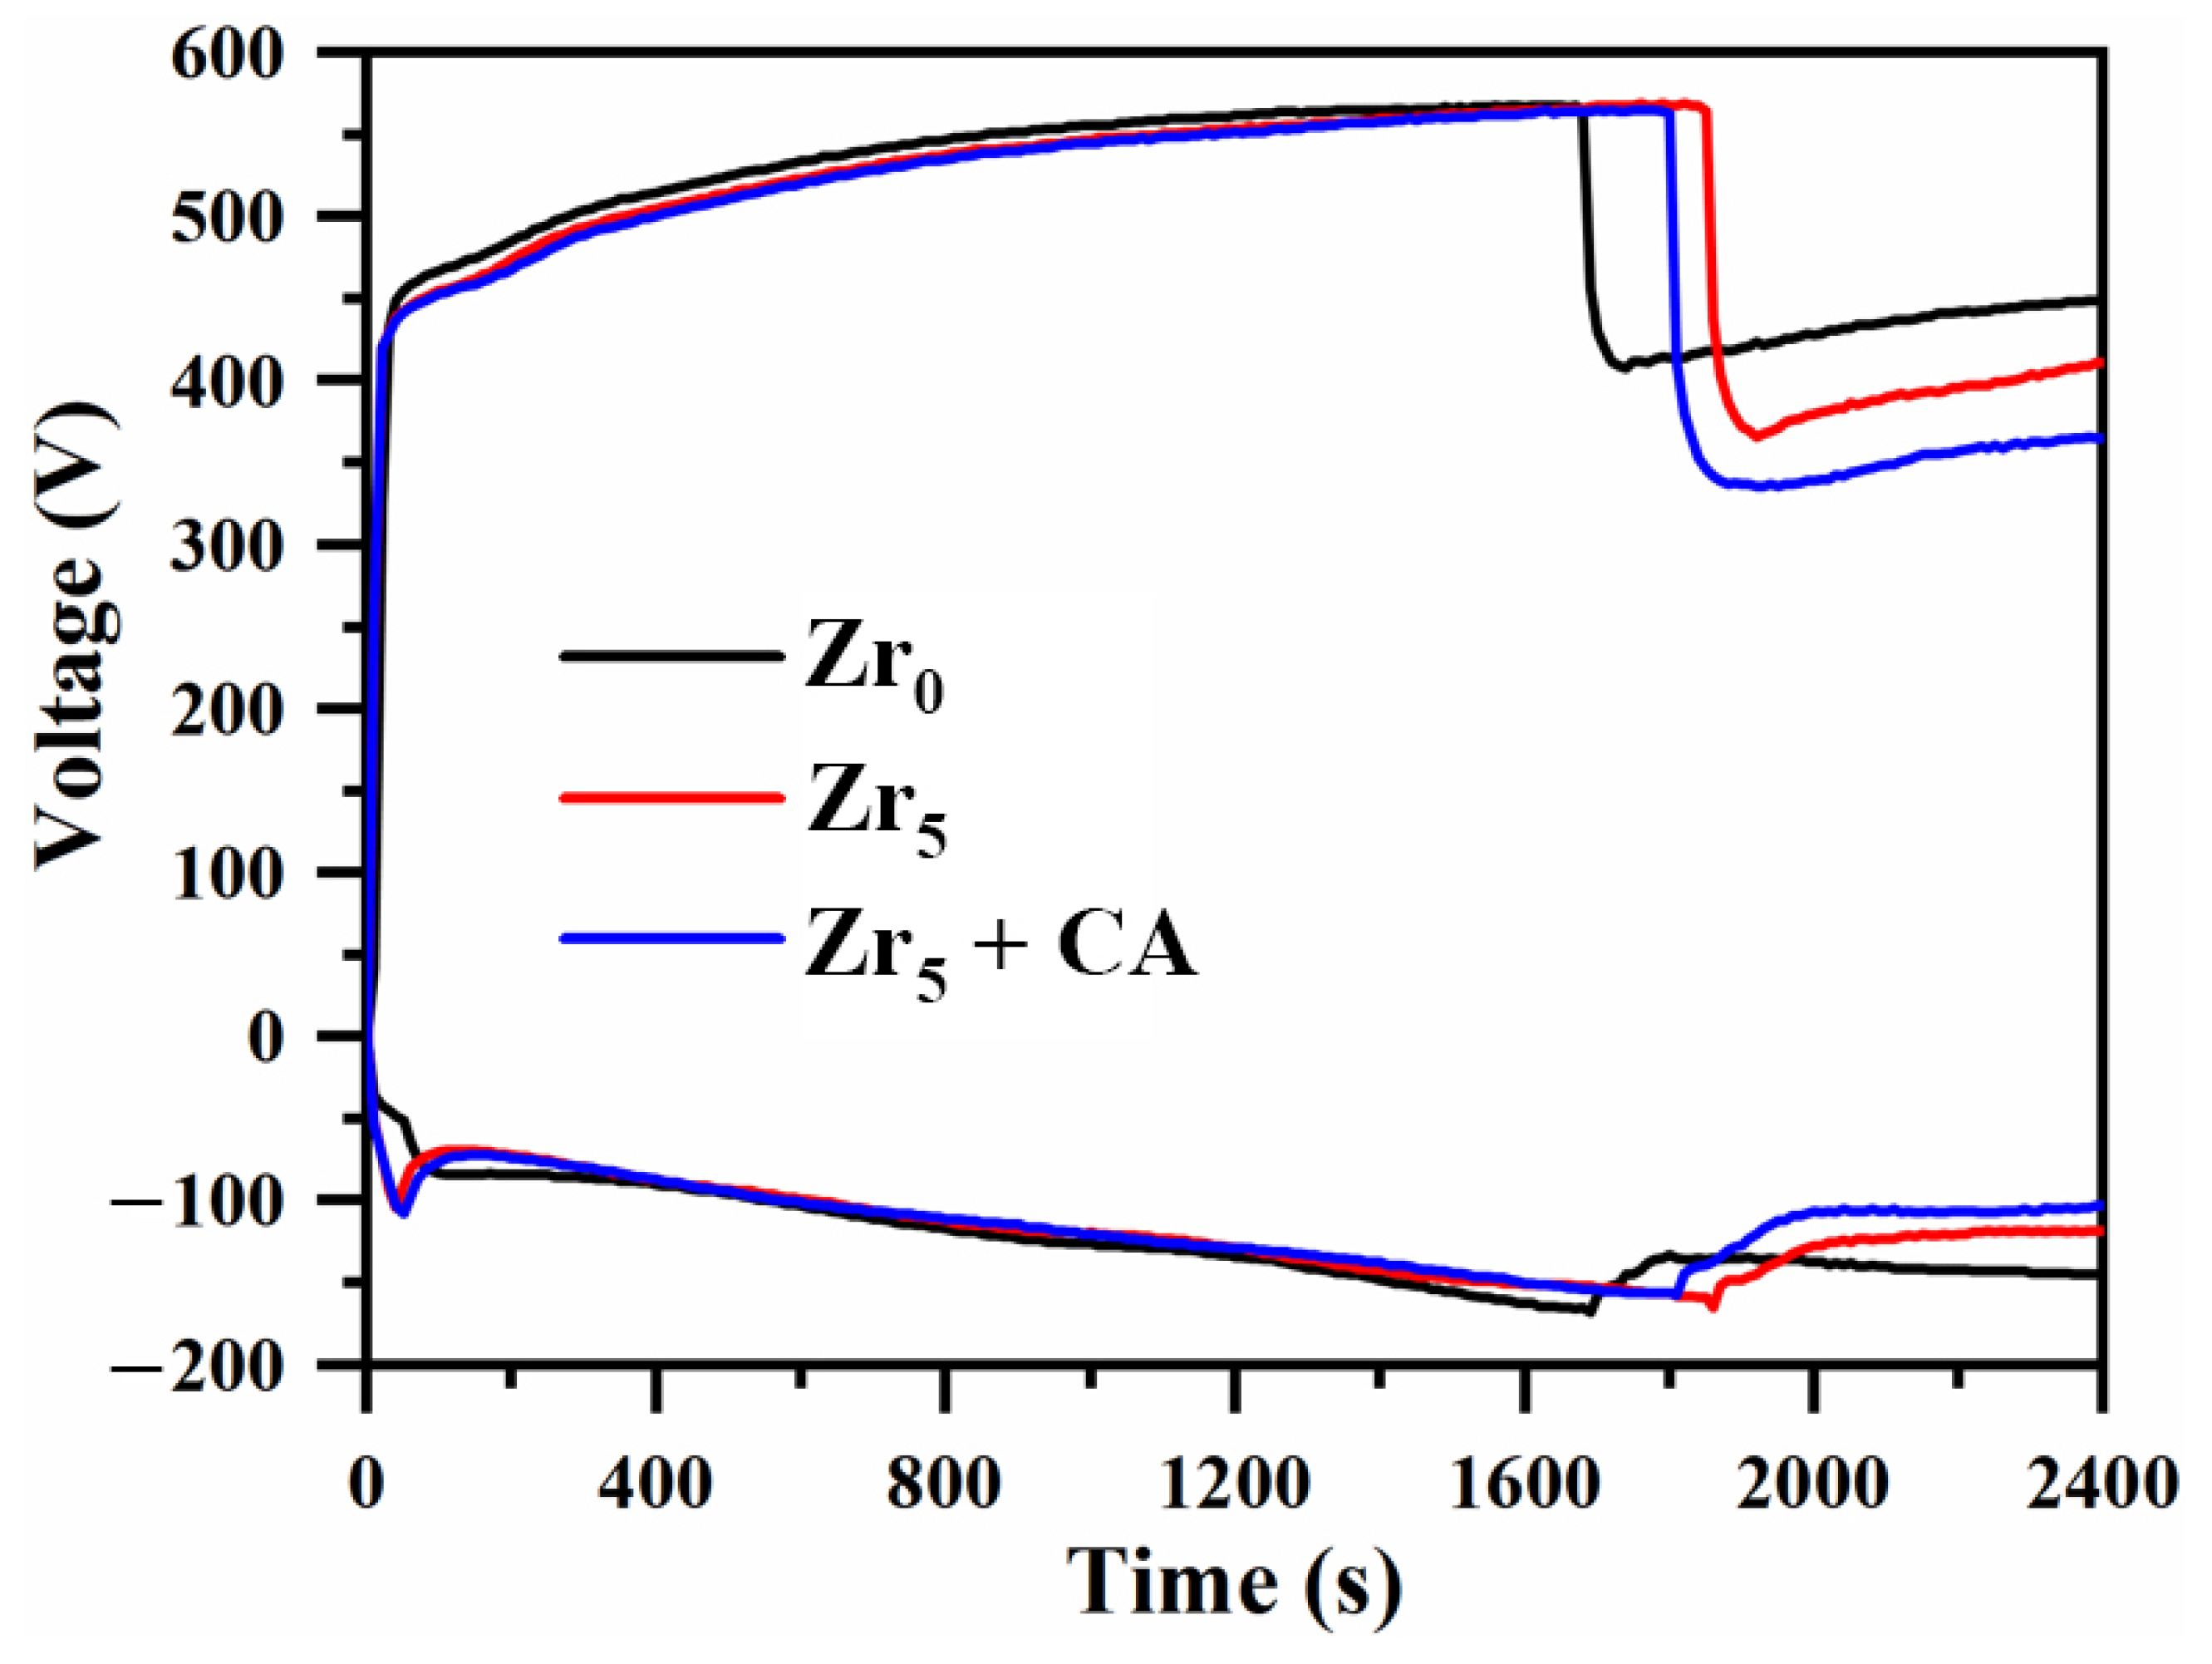
Bipolar plasma electrolytic oxidation of 6061 aluminum alloy was carried out in an Na2SO3-K2ZrF6 electrolyte system. The time-dependent voltage profile during plasma discharge of the aluminum alloy with K2ZrF6 is presented in Figure 1. As evident from the figure, the overall trend is the same when the positive voltage rises under the three parameters, and the difference is the time of appearance of the soft plasma discharge. After treatment of 5 g/L K2ZrF6, the appearance of the soft plasma discharge was delayed by about 3 min, and the minimum voltage was reduced by 42 V compared with it. The addition of citric acid (CA) after the addition of K2ZrF6 delayed the appearance of the soft plasma discharge by about 1 min, and the minimum voltage was 24 V lower than that with only K2ZrF6. The change in the time–voltage profile affects the amount of energy produced by the discharge in the plasma electrolytic oxidation, so that the growth rate of the coatings and the quality of the film formation are changed.

Figure 1.
Time-dependent voltage profile during PEO of aluminum alloy with K2ZrF6 addition.
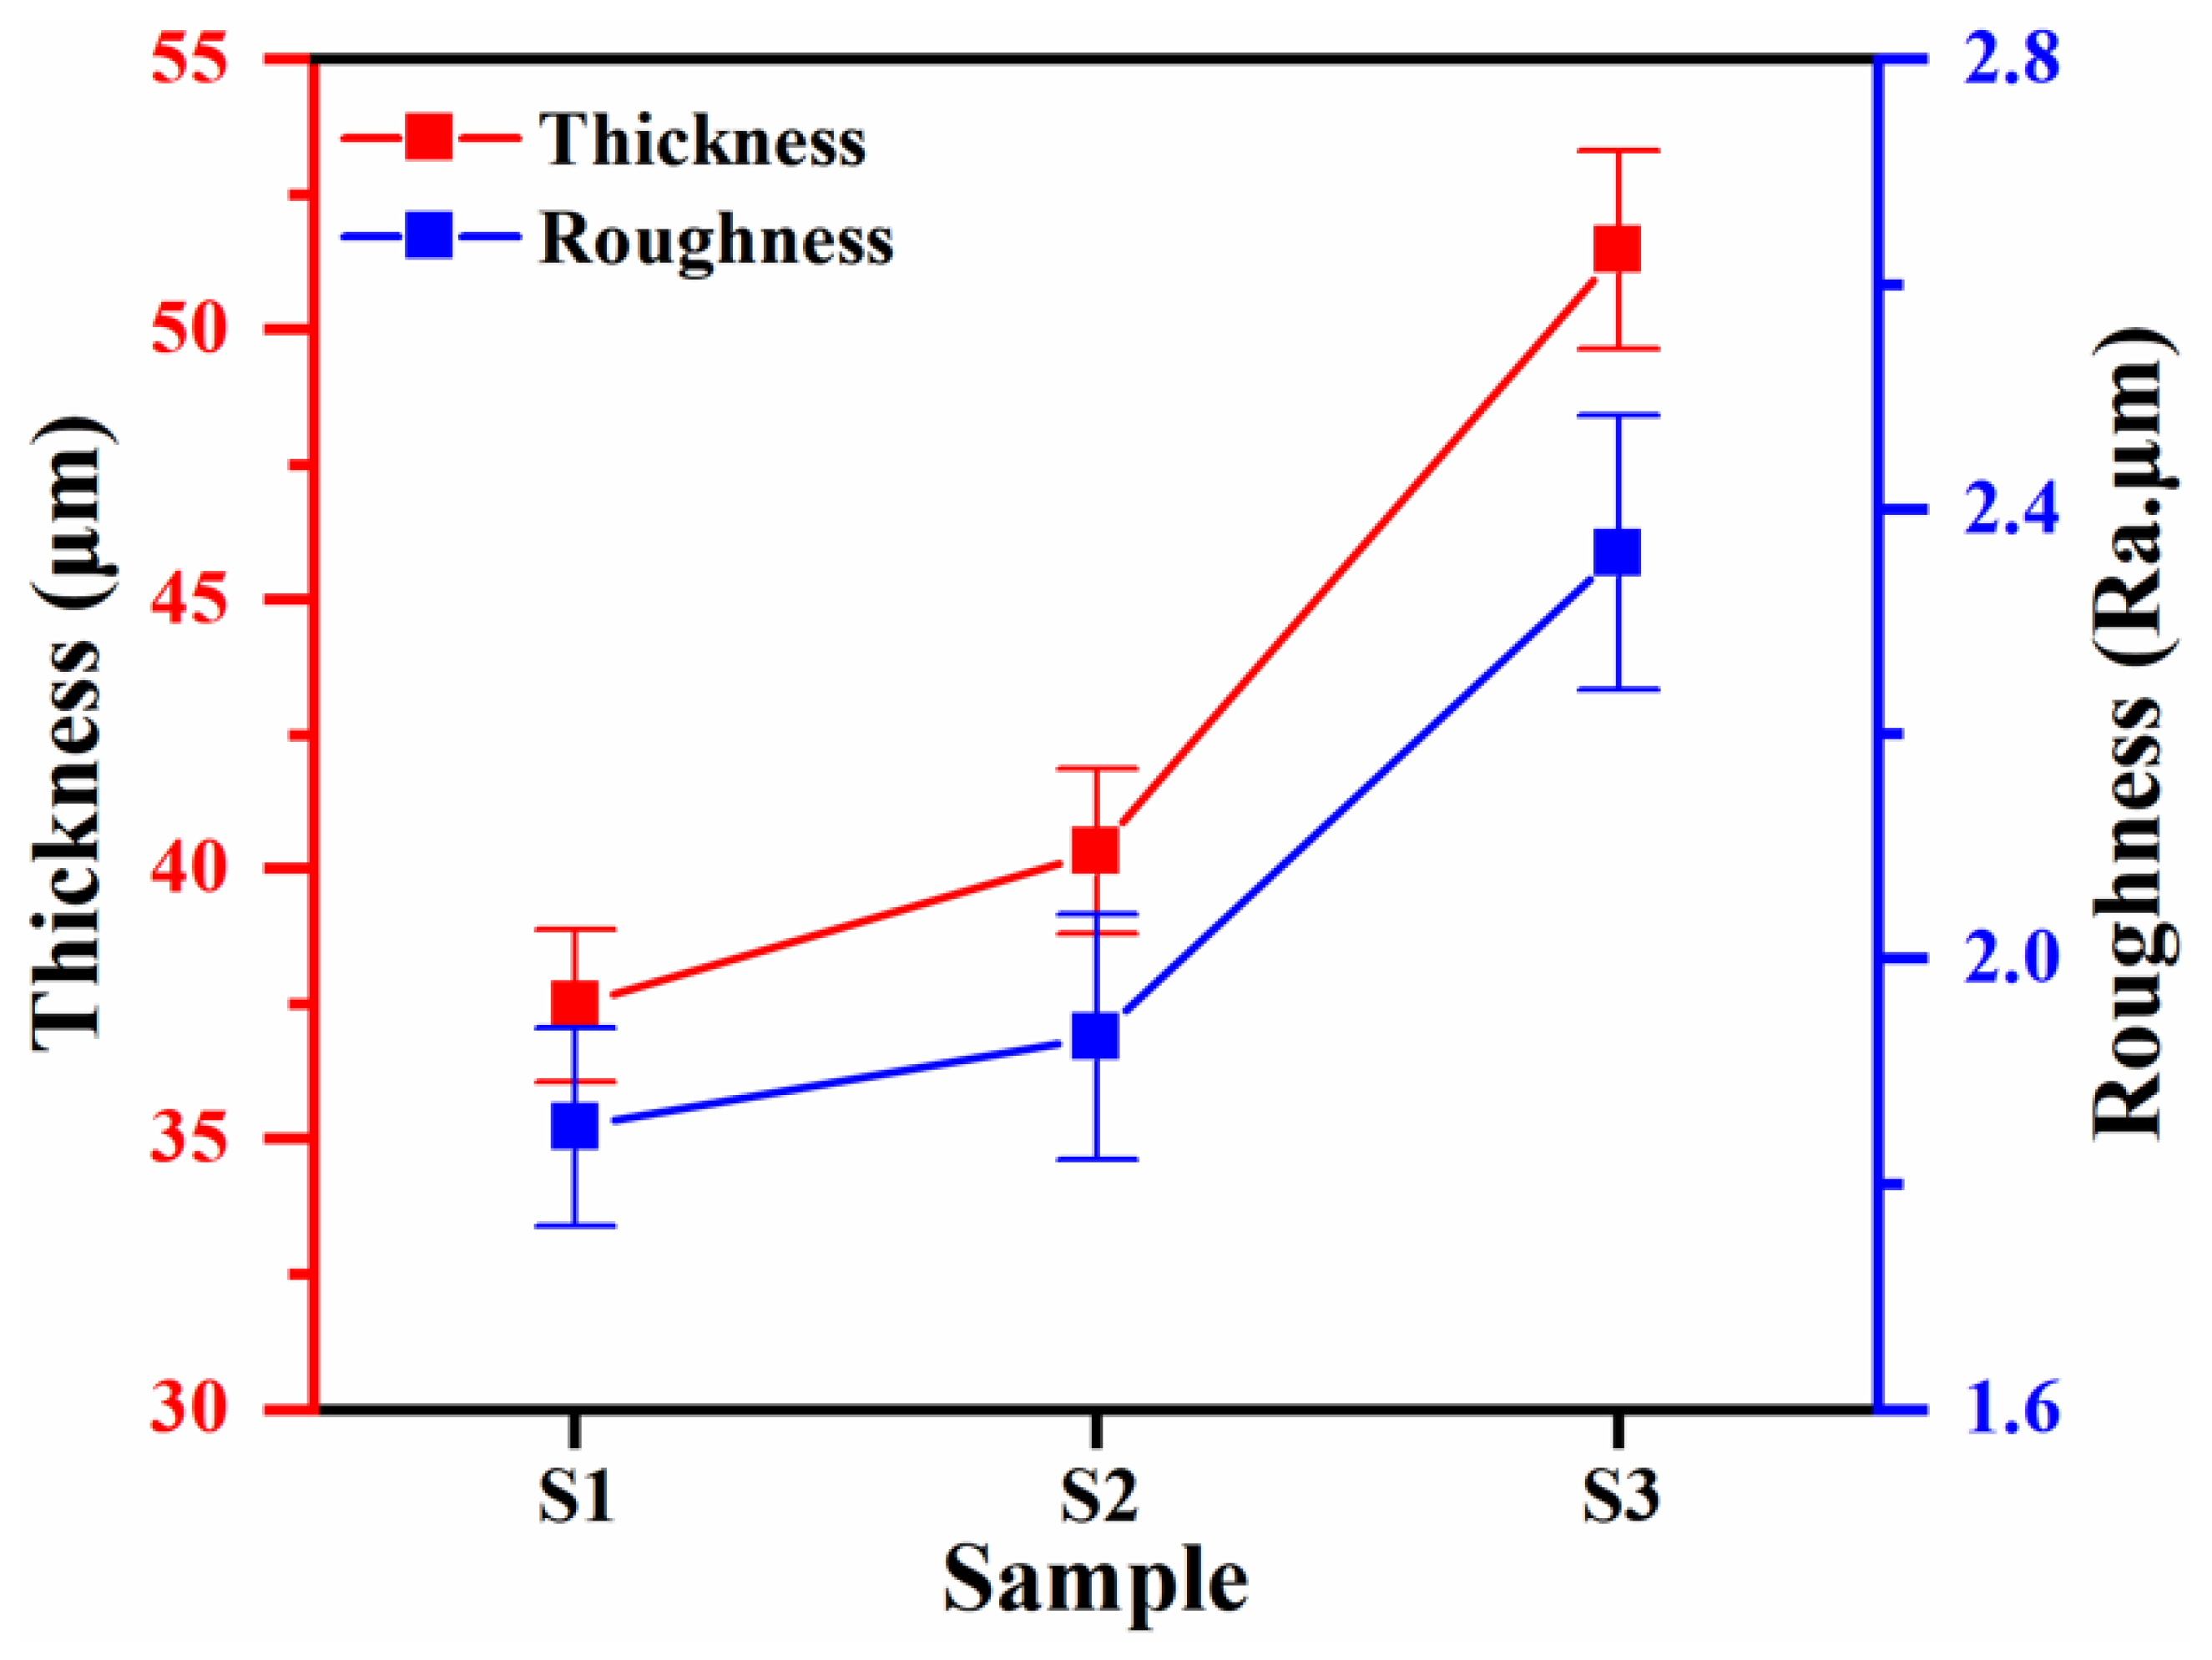
The relationship between the thickness and roughness of aluminum alloy plasma electrolytic oxidation coatings under the conditions of K2ZrF6 addition is shown in Figure 2. From the figure, it can be seen that the thickness and roughness of the coating have changed, the coating thickness of the S2 parameter has only increased by 7.6% relative to S1, and the change in roughness has increased by 4.3%, which is not a very obvious trend, which indicates that the content of K2ZrF6 in the coating is low. Compared to S1, the S3 parameters yielded a plasma electrolytic oxidized coating with 37.3% increased thickness and 27.6% increased roughness. This was due to the low solubility of K2ZrF6 when citric acid (CA) was not added and the electrolyte pH was tested to be 13.20 using a pH meter. When the appropriate amount of citric acid was added, the pH of the electrolyte was lowered to about 7.7, which provided a near-neutral environment, promoted the dissolution of K2ZrF6, and facilitated better participation of K2ZrF6 in the reaction of the coating. However, based on Figure 1, the soft plasma appeared later in the S3 parameter than in the S1 parameter, and the previous results proved that the growth rate before [26] soft plasma appeared was higher than after, which may be one of the reasons for the coating thickening. Based on component voltage theory by Zhang et al. [27], under spark discharge conditions, the majority of the positive voltage is distributed across the inner barrier layer. This potential corresponds to the critical positive voltage observed at the inflection point in the V-t curve (current-derived), termed the inner-barrier-layer positive voltage. The remaining voltage potential (outer-layer voltage) facilitates continuous outer-layer growth. Therefore, the micro-arc discharge stage is mainly aimed at the growth of the coating and the soft plasma discharge stage acts on the densification of the coating.
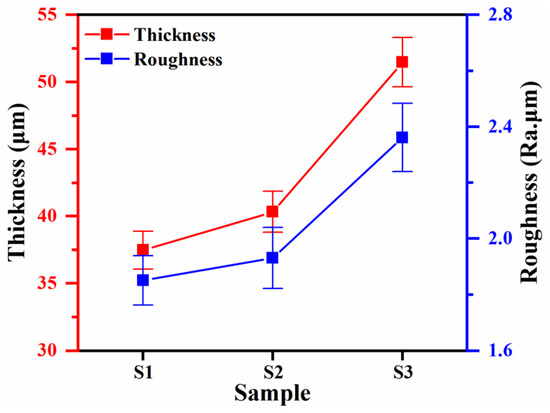
Figure 2.
Correlation between coating thickness and roughness of PEO aluminum alloy with K2ZrF6 addition.
3.2. Phase Composition and Microscopic Morphology of Coatings
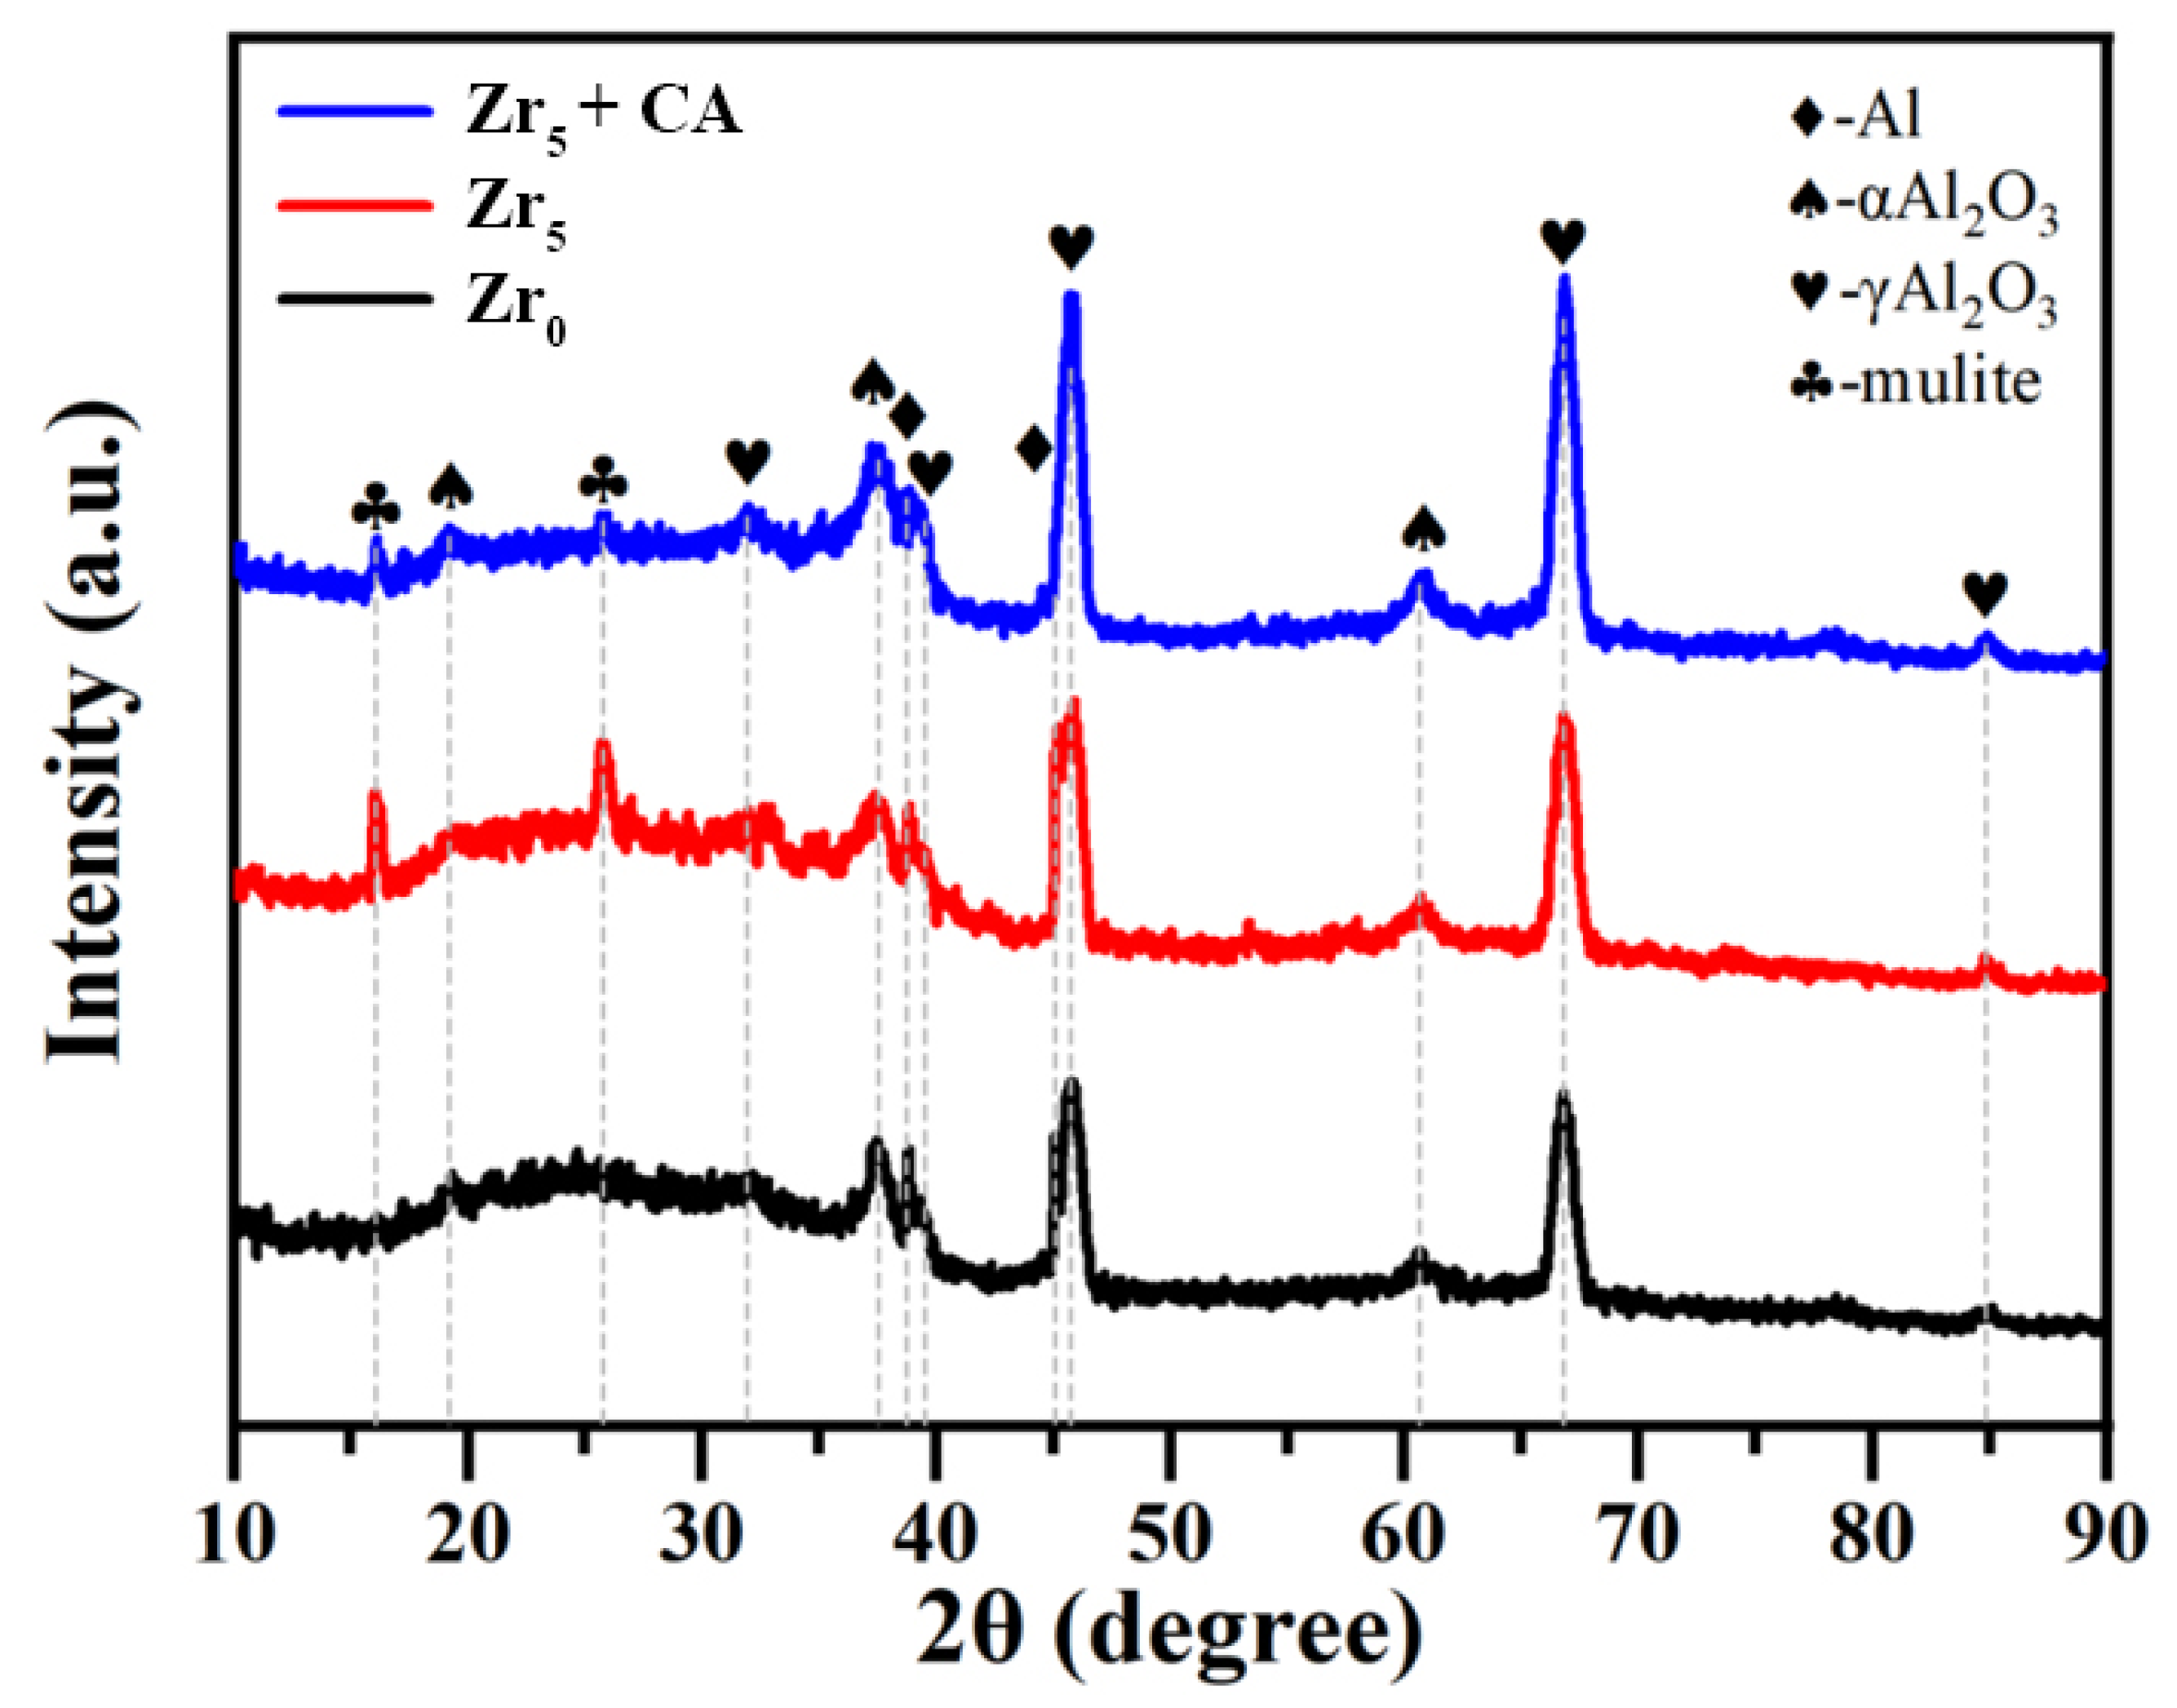
The XRD pattern of 6061 aluminum alloy PEO coating under the condition of K2ZrF6 addition is shown in Figure 3; the PEO coatings prepared before the addition of K2ZrF6 only have diffraction peaks of α-Al2O3 and γ-Al2O3, and there are no extra stray peaks. Among them, the content of γ-Al2O3 was lower compared with that under other parameters. When 5 g/L of K2ZrF6 was added to the electrolyte, two stronger diffraction peaks of a mullite phase appeared, which indicated that the addition of K2ZrF6 favored the generation of the mullite phase. The increasing mullite (3Al2O3-2SiO2) confirms the active involvement of electrolyte-derived silicon in the plasma electrolytic oxidation process. The lack of detectable SiO2 suggests either the generation of amorphous silicon oxide or complete reaction with alumina to produce mullite through high-temperature sintering during discharge events. Mullite has excellent physical, chemical, and mechanical properties [14] and is one of the extremely important crystalline phases of ceramic materials, which can be widely used in the field of wear-resistant materials. When citric acid was added, the diffraction peaks of α-Al2O3 and γ-Al2O3 became stronger, but the diffraction peaks of mullite weakened. According to a literature review, the generation of a mullite phase is more favorable in an alkaline environment [28].
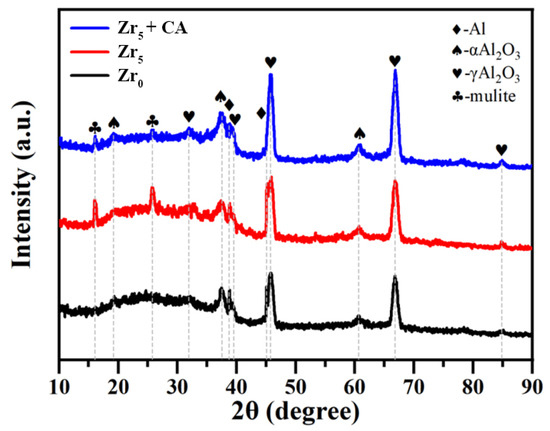
Figure 3.
XRD analysis of aluminum alloy PEO coatings under the conditions of K2ZrF6 addition.
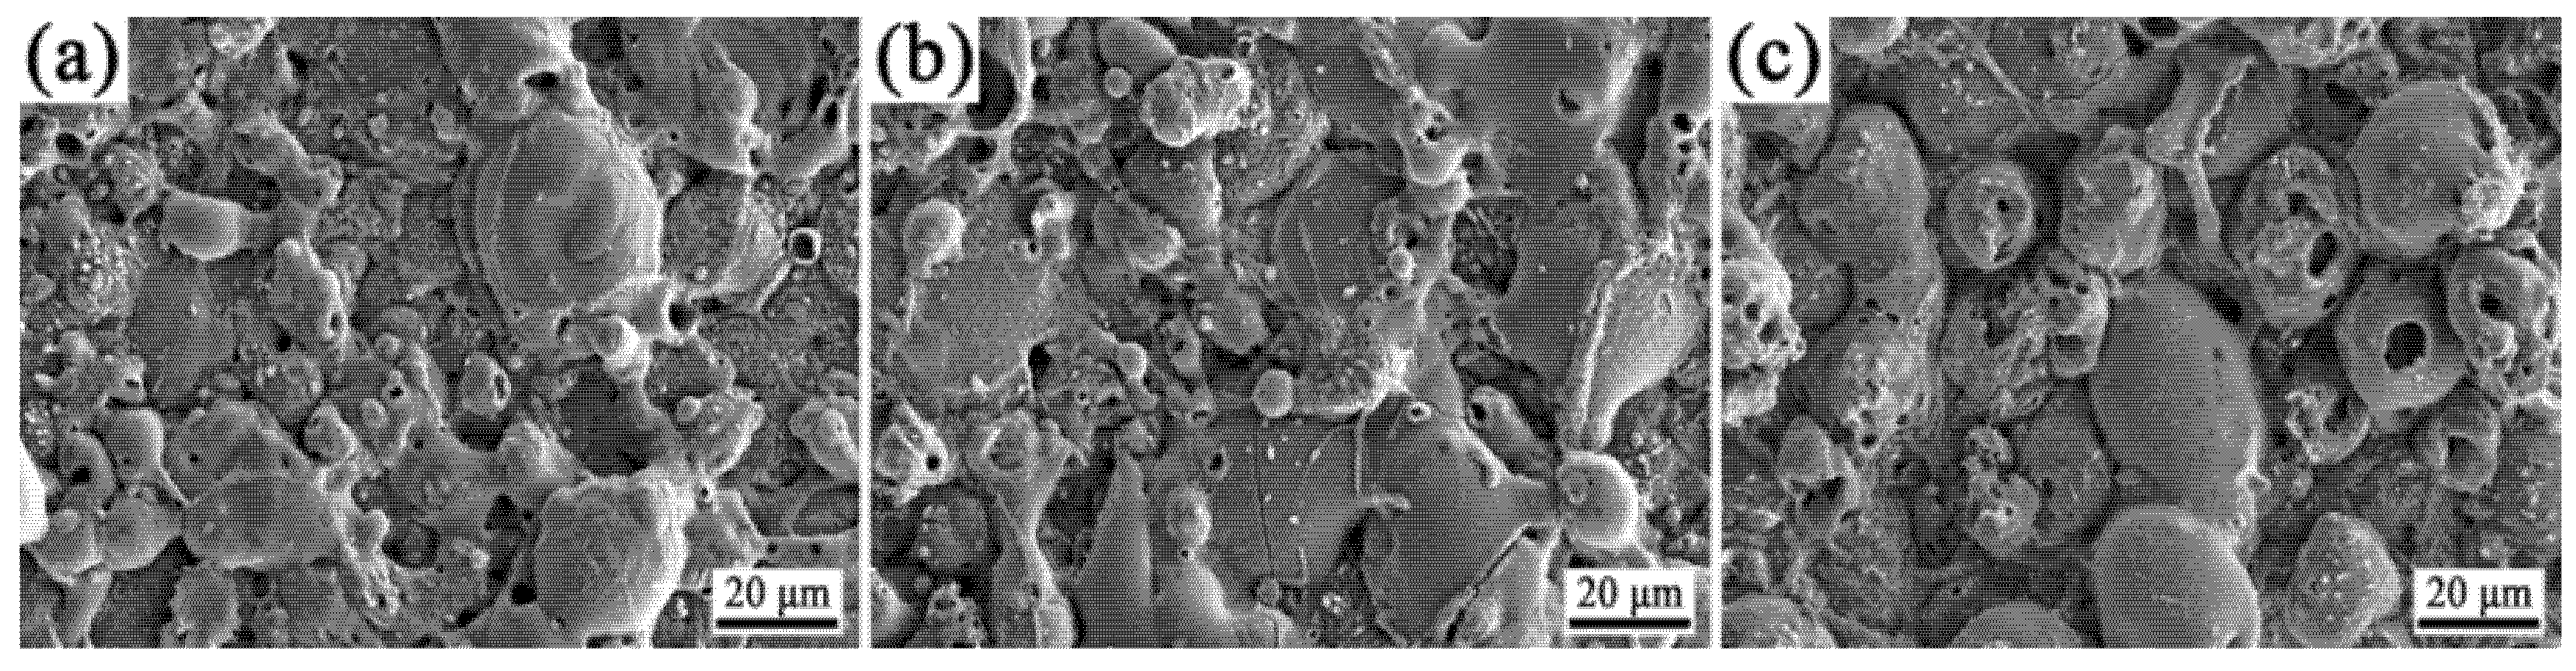
The surface morphology of the PEO coating (Figure 4) demonstrated that K2ZrF6 addition produced PEO coatings with stable surface morphologies (Figure 4a,b), preserving the discharge channel architecture established during the soft plasma regime. After the addition of citric acid, the surface of the coating has a more “coral“-like morphology, and the surface of the “coral“-like morphology [29] has more pores, which may be the discharge channel yielded by the volcanic eruption in the micro-arc discharge stage, and provide the conditions for the subsequent soft plasma discharge. As displayed in Figure 2, the coatings with S3 parameters have higher thickness and roughness, more discharge channels are favorable for the film formation rate in the soft plasma stage, and the increase in the coating growth rate also results in a larger roughness.
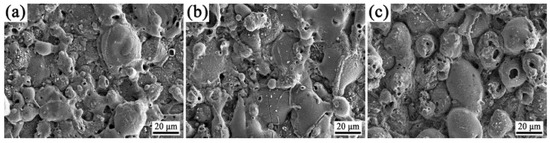
Figure 4.
Surface morphology of PEO coatings under the conditions of K2ZrF6 addition; (a) 0 g/L, (b) 5 g/L, (c) 5 g/L + CA.
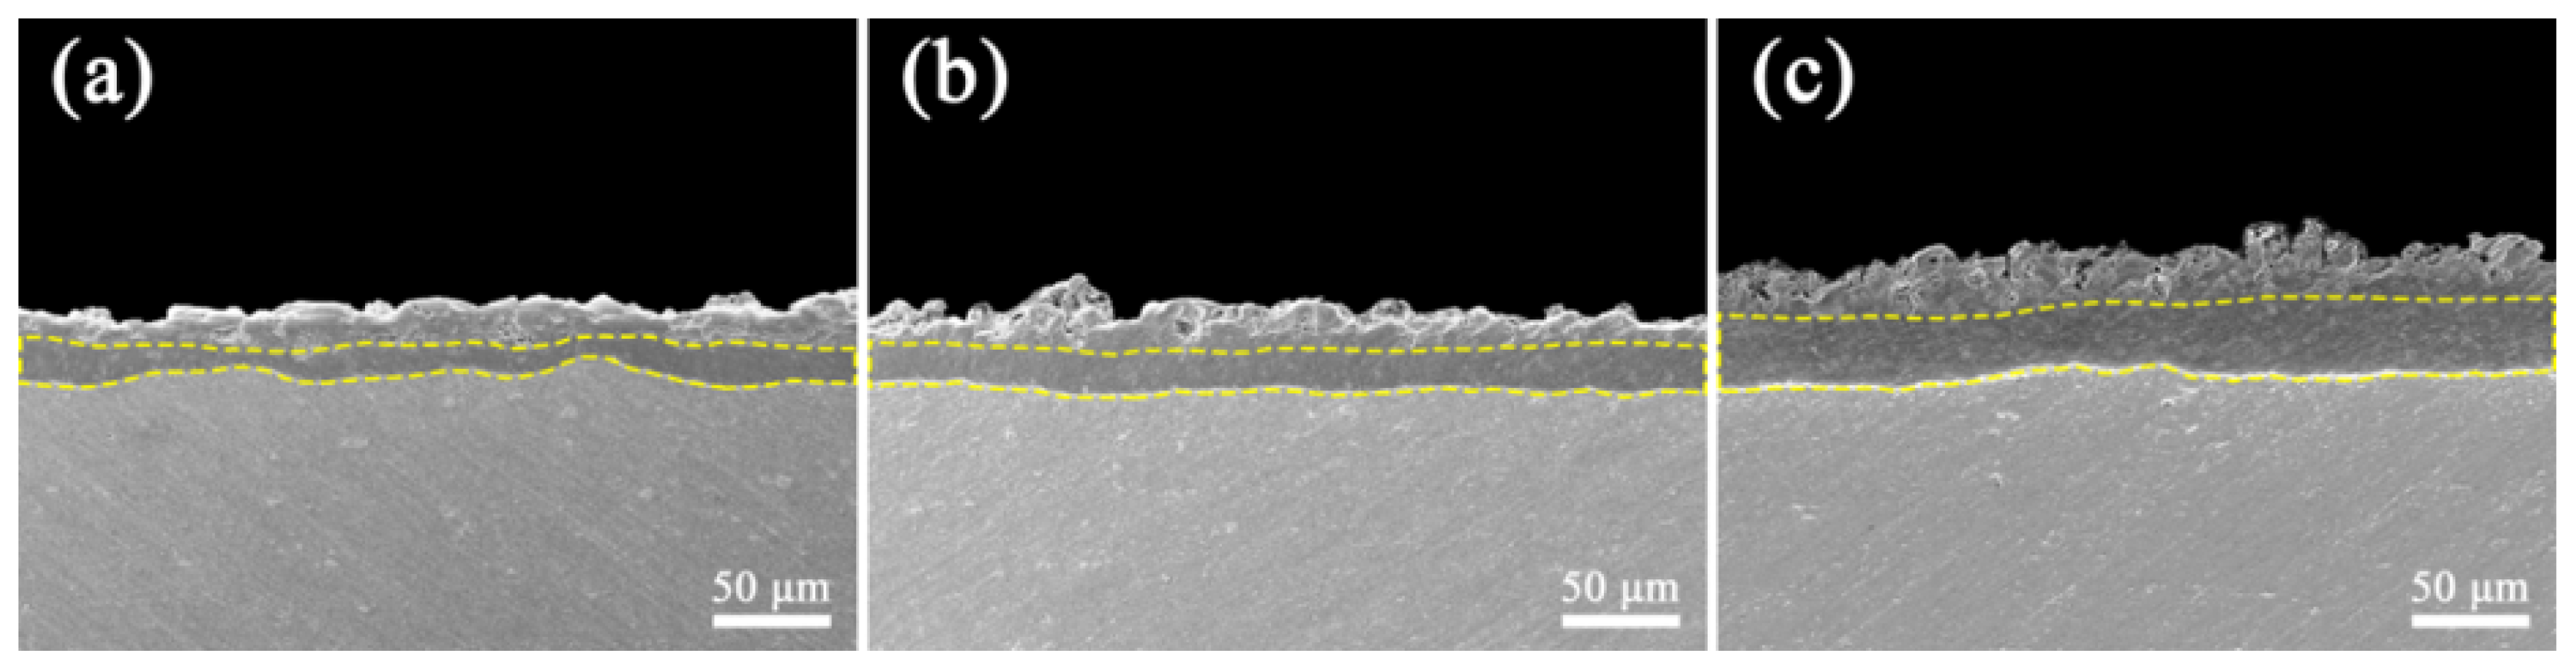
Cross-sectional morphological analysis (Figure 5) revealed the microstructure of K2ZrF6-modified PEO coating. The overall morphology of the coating cross-section is relatively dense, but the percentage of the dense layer inside the coating is not high (about 45%) and the film formation of the dense layer is not uniform. The cross-sectional morphology of the coatings with the addition of K2ZrF6 (Figure 5b) is overall denser and has a relatively high percentage of dense layers (about 50%), with the outer layer being sparser compared to that without K2ZrF6. When citric acid was added, the PEO coating thickness predominantly increased, the inner coating was denser and had the highest percentage of dense layers (about 60%), but there was also the disadvantage that the outer layer of the coating was looser, contributing to an enhancement of the coating surface roughness (Figure 2).
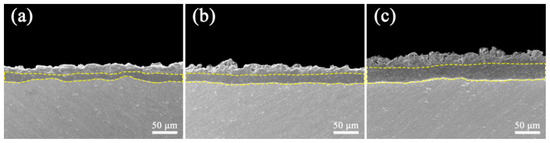
Figure 5.
Cross-sectional morphology of PEO coatings with K2ZrF6 addition; (a) 0 g/L, (b) 5 g/L, (c) 5 g/L + CA.
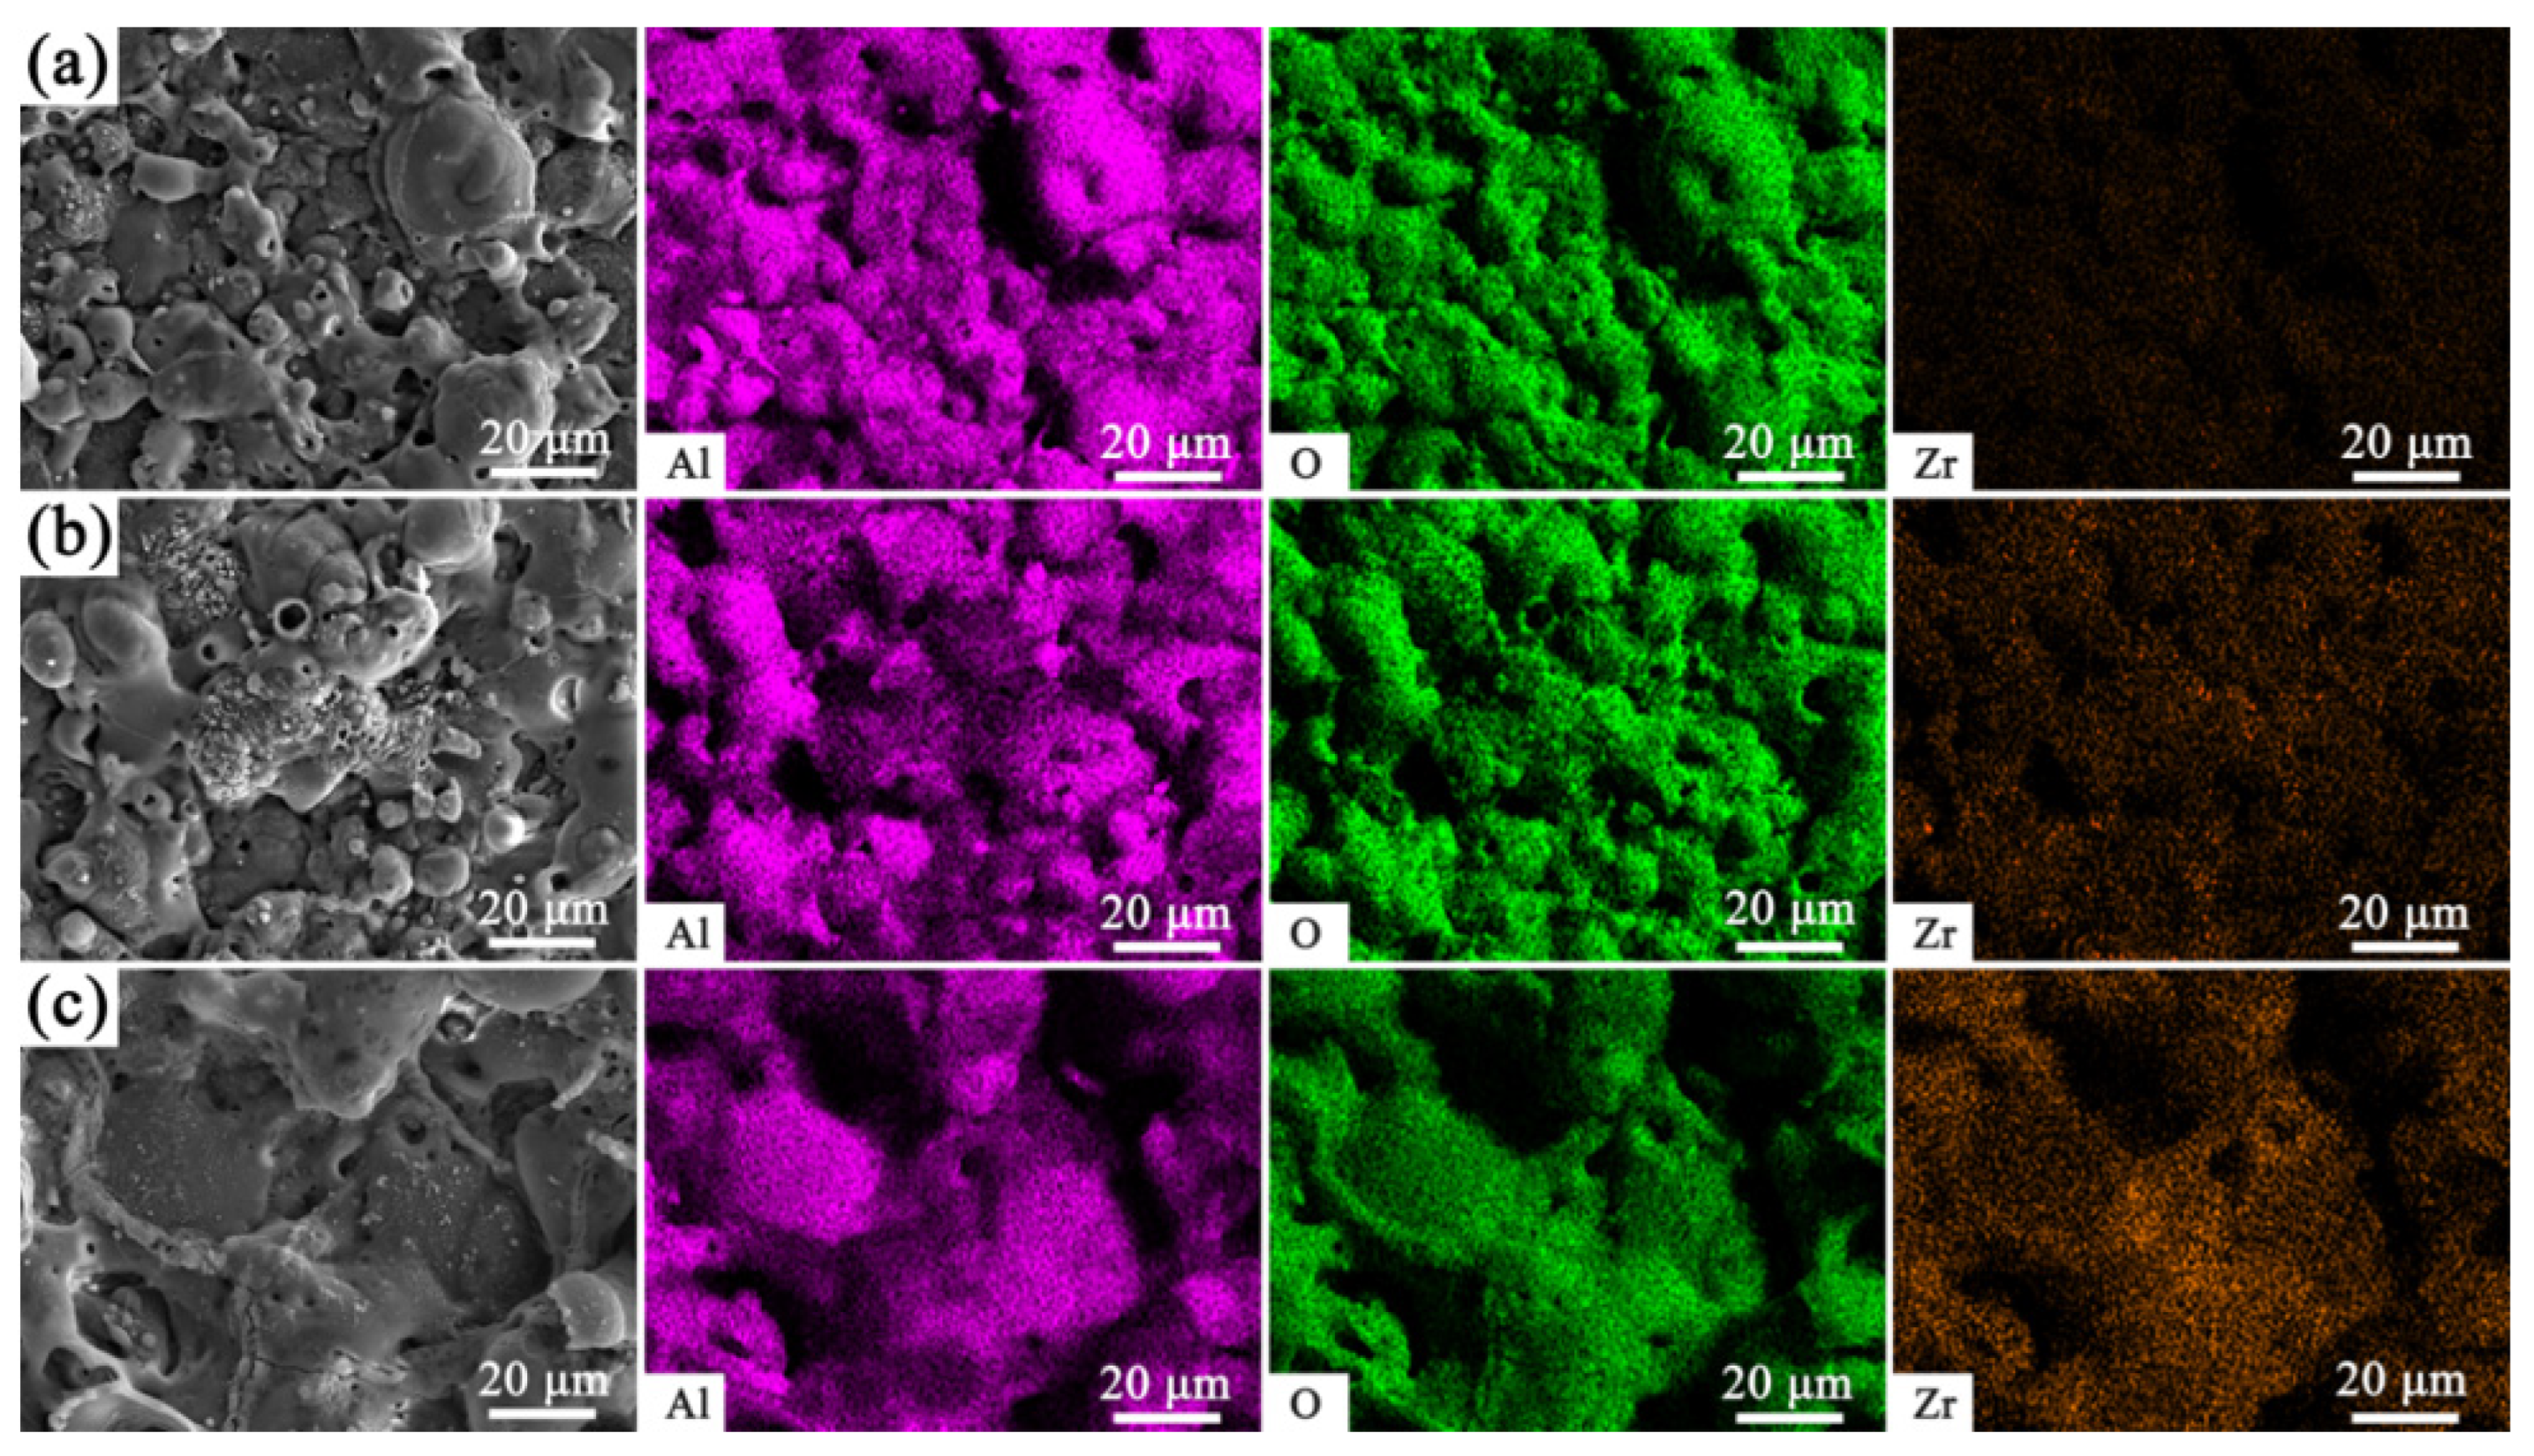
3.3. EDS Analysis and Elemental Maps of Coated Cross-Sections
The surface EDS elemental distribution of the PEO coatings under the conditions of K2ZrF6 addition is displayed in Figure 6. The distribution of zirconium elements in the coating only gradually becomes obvious when 5 g/L of K2ZrF6 and citric acid are added. An analysis of the elemental content of the PEO coating surfaces under these three different experimental parameters (Table 3) shows that following K2ZrF6 addition, there is an evident reduction in the aluminum element of the coatings, and in its place, there is an increase in the silicon element, which creates the conditions for the formation of mullite peaks. However, when only K2ZrF6 is added, the content of zirconium in the coating is only 0.08%, indicating that K2ZrF6 does not act directly on the coating but plays a catalytic role. When citric acid was added, the amount of elemental zirconium in the coating increased, but only to 1.26%, which could be the reason why zirconium oxide crystals were not detected.
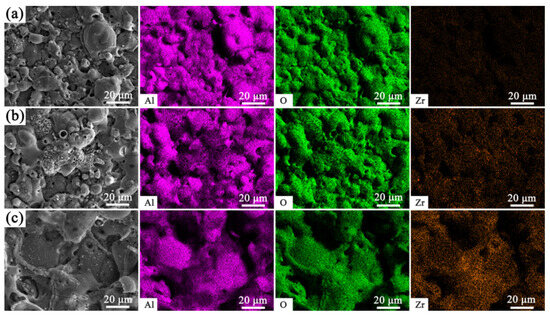
Figure 6.
Surface EDS element distribution of PEO coatings with K2ZrF6 addition; (a) 0 g/L, (b) 5 g/L, (c) 5 g/L + CA.
Table 3.
Surface composition (at. %) of PEO coatings assessed by EDS.
Figure 7 presents the cross-sectional EDS elemental distribution of the PEO coatings under the condition of K2ZrF6 addition. Accordingly, the distribution of silicon elements is still mainly present in the outer layer of the coating, which is the result of the generation of the soft plasma discharge phase. The silicon element in Figure 7c has an obvious extension to the inner layer, and the reason for this result may be that the PEO coating prepared with the addition of citric acid suffers from a sparser outer layer relative to the other two coatings, which is conducive to the entry of silicon into the inner part of the coating. Due to the low content of zirconium elements in the coating, the distribution state in the coating is not significant. However, a small distribution of zirconium elements is still revealed in Figure 7c, and it can be found that the distribution state of zirconium elements and silicon elements is basically the same, mainly distributed in the outer layer of the coating. This explains the fact that during the soft plasma discharge stage, the main elements involved in the reaction of the PEO coating are aluminum and oxygen. Figure 8 shows a schematic diagram of the movement of anions and cations in the electric field during plasma electrolytic oxidation in bipolar mode. As can be seen in the figure, there are two electric fields during the plasma electrolytic oxidation process. When the positive electric field begins to work, the anions in the electrolyte begin to move toward the anode and the cations toward the cathode; when the negative electric field begins to operate, the opposite is true. Therefore, when the negative current density is increased, the strength of the negative electric field becomes stronger, and the process of anion movement toward the anode is weakened by the electric field force. This results in the Si element in SiO32− only aggregating in the outer layer of the PEO coating.
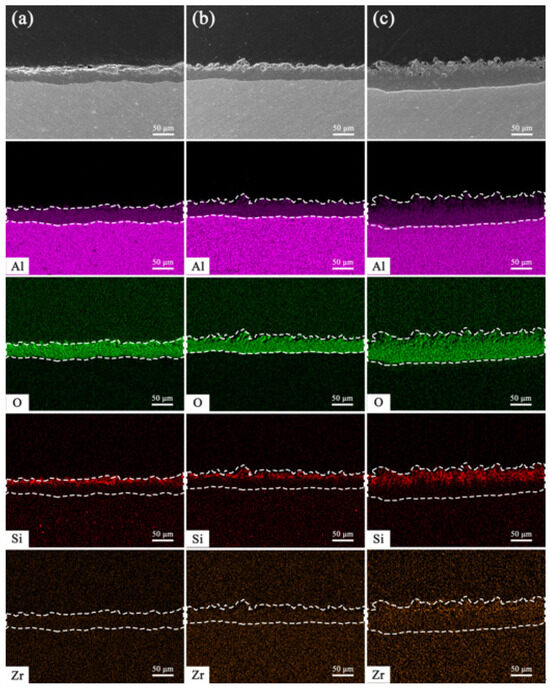
Figure 7.
Cross-sectional EDS element distribution analysis of PEO coatings with K2ZrF6 addition; (a) 0 g/L, (b) 5 g/L, (c) 5 g/L + CA.
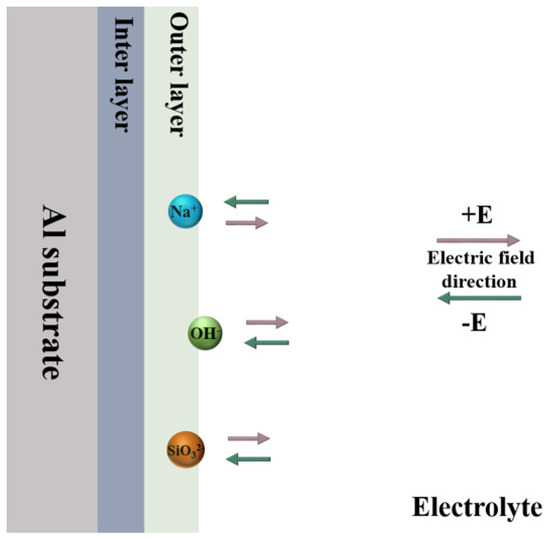
Figure 8.
Schematic diagram of the movement of anions and cations in the electric field during plasma electrolytic oxidation in bipolar mode.
Figure 9 shows the breakdown voltage and dielectric strength of the PEO coatings with K2ZrF6 addition. The result demonstrated that K2ZrF6 improves the insulating properties of the coatings, and when only K2ZrF6 is added (S2), the breakdown voltage is increased by 20.1% relative to S1. As can be seen in Figure 5b, the coating under the S2 parameter exhibits a more compact inner layer and has a higher percentage of dense layers than that under the S1 parameter. As a result, the breakdown voltage (dielectric strength) per unit thickness is higher for the S2 parameter than for S1. However, its insulation strength did not improve relative to S2 but decreased by 4.7%. As can be seen in Figure 5c, although the percentage of dense layers of the PEO coating prepared by S3 is higher than that of S2, the outer layer of the coating exhibits a more loose state, so the overall insulation strength of the coating is pulled down.
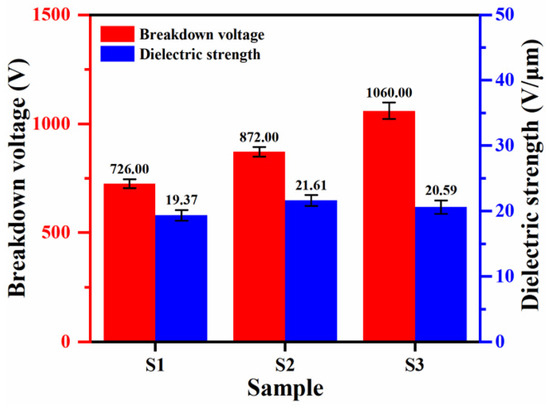
Figure 9.
Breakdown voltage and insulation strength of PEO coatings under the conditions of K2ZrF6 addition.
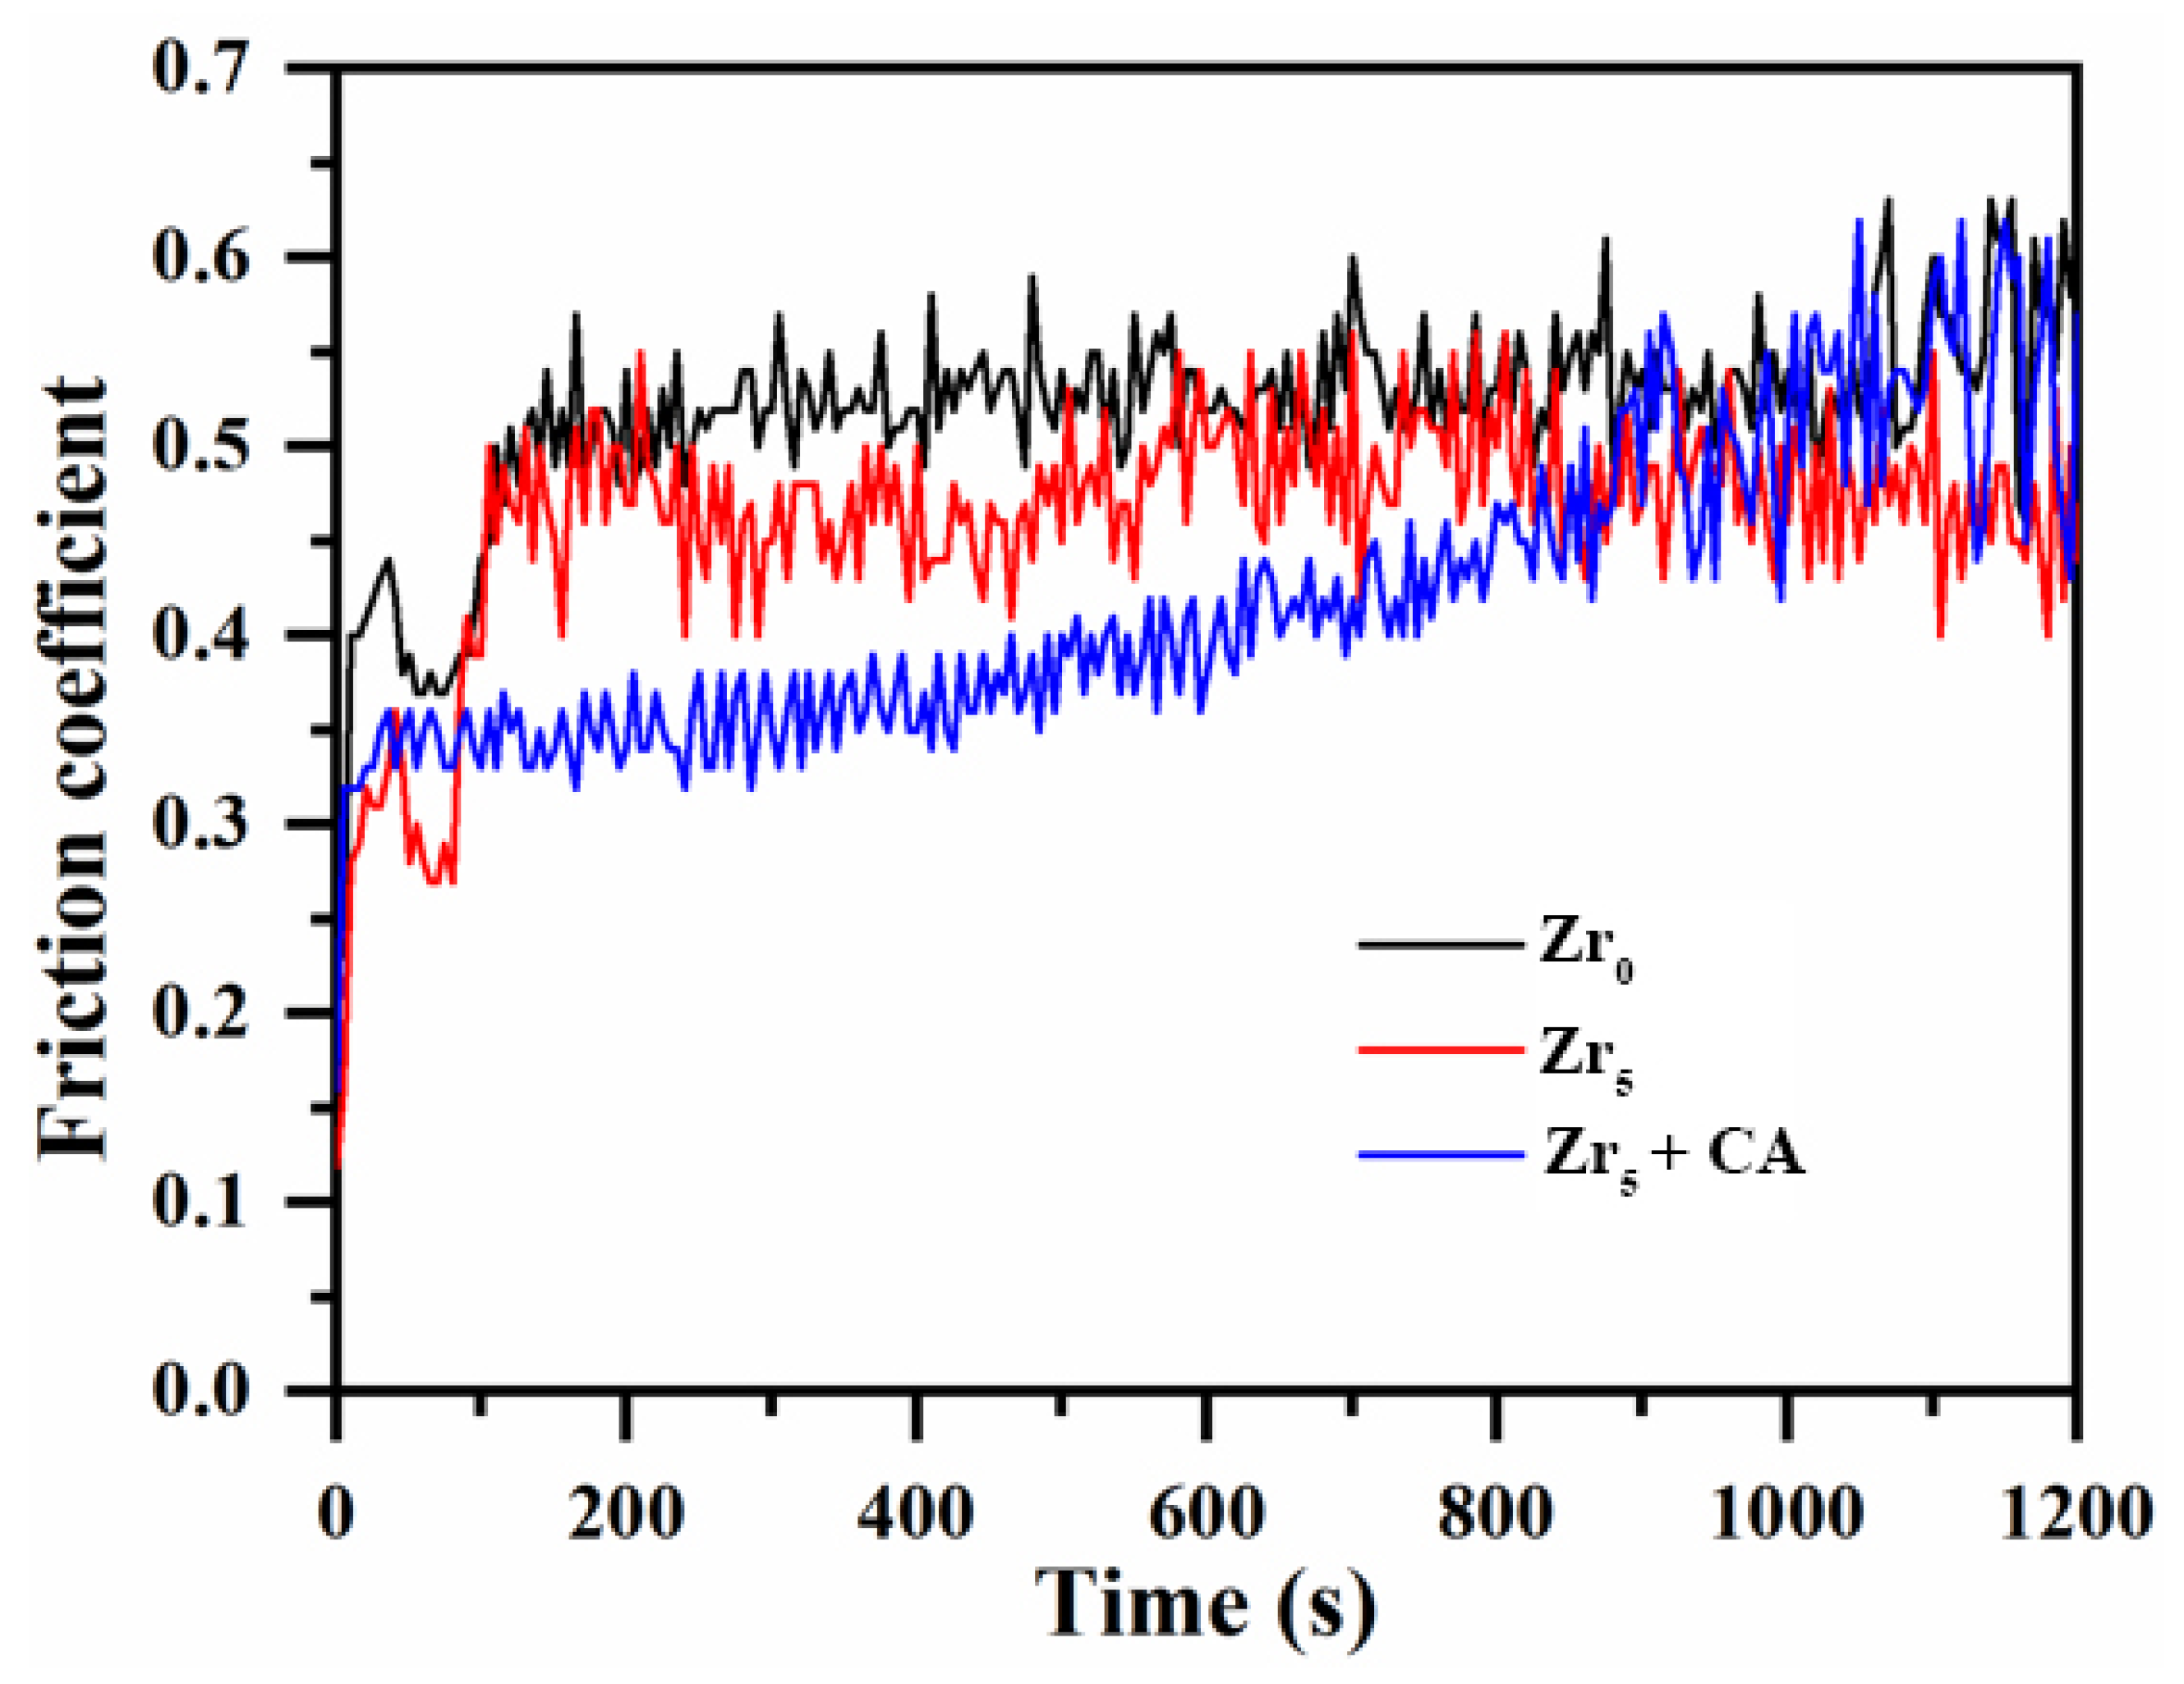
3.4. Tribological Behavior of the Coating
Figure 10 presents the evolution of the friction coefficient for K2ZrF6-modified PEO coatings as a function of time. As evident from the figure, the PEO coatings in both bipolar modes exhibit smoother friction profiles. Without the addition of K2ZrF6, the initial coefficient of friction was relatively low, and the coefficient of friction began to increase from 0.4 to 0.5 after a duration of about 2 min, and then the coefficient of friction remained around 0.5 until the end. When K2ZrF6 is added, the initial friction curve coefficient only fluctuates up and down to 0.3, and the coefficient of friction also rises to 0.5 before entering the next wear stage. However, this stage is not very stable; the fluctuation of the friction coefficient is relatively large, and the mullite diffraction peaks could be clearly evaluated through the XRD pattern (Figure 3). Although the mullite phase has excellent wear-resistant properties in the coating, the non-uniform distribution of the mullite phase in the coating leads to the instability of the friction curves, and this state lasts until the end. When citric acid was added to the electrolyte, the initial coefficient of friction was 0.35. Unlike the other two friction curves, the friction curve at this parameter does not rise abruptly but in a slower and smoother trend. This may be due to the thicker loose layer of the coating, which slowly and continuously increases the wear rate during the wear process, resulting in the coefficient of friction also being in such a state.
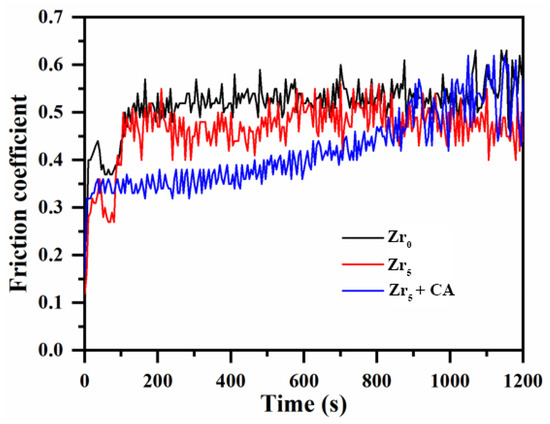
Figure 10.
Friction coefficient and time(s) of PEO coating under the condition of K2ZrF6 addition.
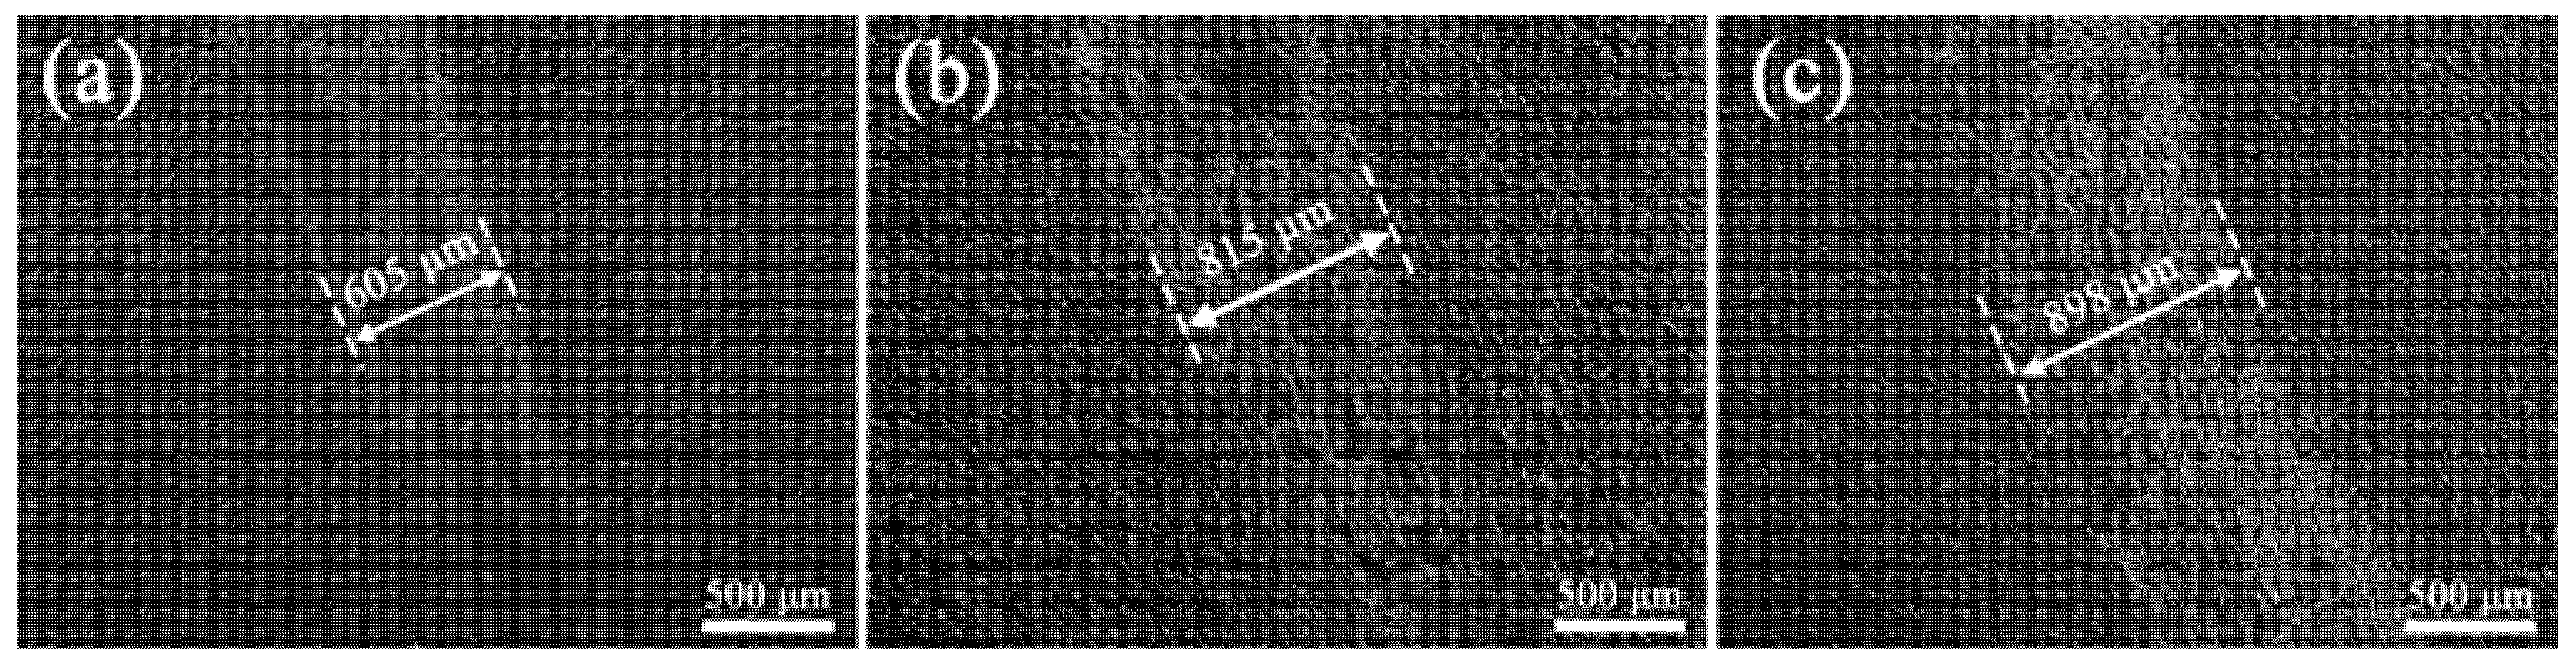
Figure 11 reveals the abrasion morphology of the PEO coating with K2ZrF6 addition. As Figure 11a demonstrates, the coating surface undergoes an obvious abrasion phase left by sliding friction. With the addition of K2ZrF6, the depth of the abrasion marks was significantly smaller compared to S1, but the width of the abrasion marks increased by 34.7% compared to S1 (Figure 11b). When citric acid was added, the abrasion mark surface of the PEO coating revealed the morphology of the original coating, showing good abrasion resistance, but its abrasion mark width was increased by 48.4% compared to S1 (Figure 11c). The reasons for this situation are shown in Figure 12. Three diagrams depict three situations that occur during frictional wear of PEO coatings: Figure 12a demonstrates that when the hardness of the friction pair (GCr15 balls with a diameter of 5 mm) is much greater than the hardness of the coating (or the coating is more sparse), the friction pair does not wear as much, and the result is a shallow, but wide, abrasion mark. When the hardness of the coating is comparable to the hardness of the friction vice (Figure 12b), wear occurs at the location where the friction vice is in contact with the coating, and the abrasion marks are relatively shallow and wider compared to S1. Figure 12c illustrates the morphology of the abrasion marks formed during wear when the coating hardness exceeds that of the friction pair, in which case the coating appears to have the shallowest and widest abrasion marks. The coatings with K2ZrF6 and citric acid showed the highest hardness and lowest wear rate, exhibiting excellent wear resistance (Table 4).
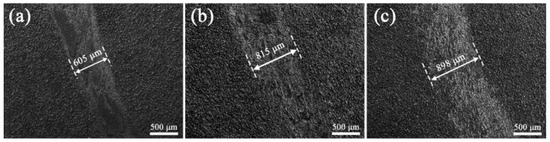
Figure 11.
Wear scar morphology of PEO coatings with K2ZrF6 addition; (a) 0 g/L, (b) 5 g/L, (c) 5 g/L + CA.
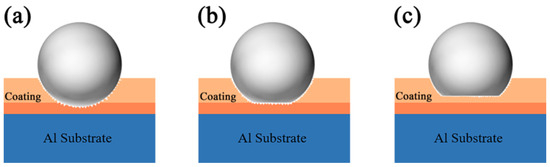
Figure 12.
Schematic diagram of the failure mode of frictional pairs in the wear process of PEO coating; (a) 0 g/L, (b) 5 g/L, (c) 5 g/L + CA.
Table 4.
Performance parameters of coatings at different negative current densities.
4. Conclusion
This study is important for the physical protection of aluminum and its alloys and improves the wear resistance of conventional plasma electrolytic oxidation coatings to a certain extent, focusing on the effect of the addition of K2ZrF6 to the PEO coatings of aluminum alloys. Given the limited solubility of K2ZrF6 in alkaline environments, citric acid was introduced to stabilize the pH value at about 8. Finally, the resulting coatings were characterized for their phase composition, microstructure, and wear resistance, yielding the following key finding:
- (1)
- The addition of K2ZrF6 delays the appearance of soft plasma discharge and increases the thickness of the PEO coatings by 37.3% and the roughness by 27.6% at the S3 parameter compared to S1.
- (2)
- The addition of K2ZrF6 facilitates the formation of a mullite phase and improves the densification of the PEO coating.
- (3)
- The addition of K2ZrF6 facilitated the improvement of the breakdown voltage of the coating, which was increased by 46.0% at the S3 parameter compared with S1; it also exhibited excellent wear resistance, with a 41.8% reduction in mass wear rate compared with S1.
Author Contributions
Conceptualization, R.T. and H.L.; methodology, H.L. and S.Z.; validation, H.L. and X.T.; formal analysis, R.T., X.T. and S.Z.; investigation, R.T. and J.C.; data curation, R.T. and J.C.; writing—original draft preparation, R.T.; writing—review and editing, H.L.; visualization, R.T.; supervision, H.L.; project administration, H.L. All authors have read and agreed to the published version of the manuscript.
Funding
This research received no external funding.
Data Availability Statement
The original contributions presented in this study are included in the article material. Further inquiries can be directed to the corresponding author.
Conflicts of Interest
The authors declare no conflicts of interest.
References
- Miller, W.S.; Zhuang, L.; Bottema, J.; Wittebrood, A.J.; De Smet, P.; Haszler, A.; Vieregge, A. Recent development in aluminium alloys for the automotive industry. Mater. Sci. Eng. A 2000, 280, 37–49. [Google Scholar] [CrossRef]
- Zhao, Y.; Yang, Z.; Domblesky, J.P.; Han, J.; Li, Z.; Liu, X. Investigation of through thickness microstructure and mechanical properties in friction stir welded 7N01 aluminum alloy plate. Mater. Sci. Eng. A-Struct. Mater. Prop. Microstruct. Process. 2019, 760, 316–327. [Google Scholar] [CrossRef]
- Shen, D.; Li, G.; Guo, C.; Zou, J.; Cai, J.; He, D.; Ma, H.; Liu, F. Microstructure and corrosion behavior of micro-arc oxidation coating on 6061 aluminum alloy pre-treated by high-temperature oxidation. Appl. Surf. Sci. 2013, 287, 451–456. [Google Scholar] [CrossRef]
- Zhu, M.H.; Cai, Z.B.; Lin, X.Z.; Ren, P.D.; Tan, J.; Zhou, Z.R. Fretting wear behaviour of ceramic coating prepared by micro-arc oxidation on Al-Si alloy. Wear 2007, 263, 472–480. [Google Scholar] [CrossRef]
- Arslan, E.; Totik, Y.; Demirci, E.E.; Vangolu, Y.; Alsaran, A.; Efeoglu, I. High temperature wear behavior of aluminum oxide layers produced by ac micro arc oxidation. Surf. Coat. Technol. 2009, 204, 829–833. [Google Scholar] [CrossRef]
- Sundararajan, G.; Krishna, L.R. Mechanisms underlying the formation of thick alumina coatings through the MAO coating technology. Surf. Coat. Technol. 2003, 167, 269–277. [Google Scholar] [CrossRef]
- Krishna, L.R.; Somaraju, K.R.C.; Sundararajan, G. The tribological performance of ultra-hard ceramic composite coatings obtained through microarc oxidation. Surf. Coat. Technol. 2003, 163, 484–490. [Google Scholar] [CrossRef]
- Hussein, R.O.; Nie, X.; Northwood, D.O. Influence of process parameters on electrolytic plasma discharging behaviour and aluminum oxide coating microstructure. Surf. Coat. Technol. 2010, 205, 1659–1667. [Google Scholar] [CrossRef]
- Cheng, Y.; Cao, J.; Mao, M.; Xie, H.; Skeldon, P. Key factors determining the development of two morphologies of plasma electrolytic coatings on an Al-Cu-Li alloy in aluminate electrolytes. Surf. Coat. Technol. 2016, 291, 239–249. [Google Scholar] [CrossRef]
- Jaspard-Mecuson, F.; Czerwiec, T.; Henrion, G.; Belmonte, T.; Dujardin, L.; Viola, A.; Beauvir, J. Tailored aluminium oxide layers by bipolar current adjustment in the plasma electrolytic oxidation (PEO) process. Surf. Coat. Technol. 2007, 201, 8677–8682. [Google Scholar] [CrossRef]
- Kamil, M.P.; Kaseem, M.; Ko, Y.G. Soft plasma electrolysis with complex ions for optimizing electrochemical performance. Sci. Rep. 2017, 7, 44458. [Google Scholar] [CrossRef] [PubMed]
- Matykina, E.; Arrabal, R.; Scurr, D.J.; Baron, A.; Skeldon, P.; Thompson, G.E. Investigation of the mechanism of plasma electrolytic oxidation of aluminium using 18O tracer. Corros. Sci. 2010, 52, 1070–1076. [Google Scholar] [CrossRef]
- Rogov, A.B.; Matthews, A.; Yerokhin, A. Role of cathodic current in plasma electrolytic oxidation of Al: A quantitative approach to in-situ evaluation of cathodically induced effects. Electrochim. Acta 2019, 317, 221–231. [Google Scholar] [CrossRef]
- Yilmaz, M.S.; Sahin, O. Applying high voltage cathodic pulse with various pulse durations on aluminium via micro-arc oxidation (MAO). Surf. Coat. Technol. 2018, 347, 278–285. [Google Scholar] [CrossRef]
- Hakimizad, A.; Raeissi, K.; Santamaria, M.; Asghari, M. Effects of pulse current mode on plasma electrolytic oxidation of 7075 al in Na2WO4 containing solution: From unipolar to soft-sparking regime. Electrochim. Acta 2018, 284, 618–629. [Google Scholar] [CrossRef]
- Mashtalyar, D.V.; Gnedenkov, S.V.; Sinebryukhov, S.L.; Imshinetskiy, I.M.; Puz’, A.V. Plasma electrolytic oxidation of the magnesium alloy MA8 in electrolytes containing tin nanoparticles. J. Mater. Sci. Technol. 2017, 33, 461–468. [Google Scholar] [CrossRef]
- Zhang, Y.; Xu, Y.; Miao, C.; Tu, X.; Yu, J.; Li, J. Effect of tungsten carbide particles on the characteristics of PEO coatings formed on AZ31B magnesium alloy in alkaline electrolyte. Int. J. Electrochem. Sci. 2018, 13, 7923–7929. [Google Scholar] [CrossRef]
- Matykina, E.; Arrabal, R.; Skeldon, P.; Thompson, G.E. Investigation of the growth processes of coatings formed by ac plasma electrolytic oxidation of aluminium. Electrochim. Acta 2009, 54, 6767–6778. [Google Scholar] [CrossRef]
- Kurtz, S.M.; Kocagoez, S.; Arnholt, C.; Huet, R.; Ueno, M.; Walter, W.L. Advances in zirconia toughened alumina biomaterials for total joint replacement. J. Mech. Behav. Biomed. Mater. 2014, 31, 107–116. [Google Scholar] [CrossRef]
- De Aza, A.H.; Chevalier, J.; Fantozzi, G.; Schehl, M.; Torrecillas, R. Crack growth resistance of alumina, zirconia and zirconia toughened alumina ceramics for joint prostheses. Biomaterials 2002, 23, 937–945. [Google Scholar] [CrossRef]
- Zadorozhnaya, O.Y.; Khabas, T.A.; Tiunova, O.V.; Malykhin, S.E. Effect of grain size and amount of zirconia on the physical and mechanical properties and the wear resistance of zirconia-toughened alumina. Ceram. Int. 2020, 46, 9263–9270. [Google Scholar] [CrossRef]
- Singh, A.K.; Drunka, R.; Smits, K.; Vanags, M.; Iesalnieks, M.; Joksa, A.A.; Blumbergs, I.; Steins, I. Nanomechanical and electrochemical corrosion testing of nanocomposite coating obtained on AZ31 via plasma electrolytic oxidation containing tin and sic nanoparticles. Crystals 2023, 13, 508. [Google Scholar] [CrossRef]
- Zhang, X.-M.; Chen, D.-F.; Gong, C.-Z.; Yang, S.-Q.; Tian, X.-B. Modulation effects of K2ZrF6 additive on microstructure and heat resistance of micro-arc oxide coatings fabricated on LY12 aluminum alloy. J. Inorg. Mater. 2010, 25, 865–870. [Google Scholar] [CrossRef]
- Liang, J.; Guo, B.G.; Tian, J.; Liu, H.W.; Zhou, J.F.; Xu, T. Effect of potassium fluoride in electrolytic solution on the structure and properties of microarc oxidation coatings on magnesium alloy. Appl. Surf. Sci. 2005, 252, 345–351. [Google Scholar] [CrossRef]
- Li, J.; Song, R.G.; Qi, X.; Wang, C.; Jiang, B. Effects of polyvinylidene fluoride sealing on micro-arc oxidation coating of 7075 aluminum alloy. Anti-Corros. Methods Mater. 2022, 69, 1–8. [Google Scholar] [CrossRef]
- Qian, C.; Chen, B.; Li, H.; Shi, R.; Yang, Z.; Zhang, N.; Song, S.; Liu, C.; Yang, B. Growth behavior and wear resistance of PEO coatings in bipolar mode. Trans. Indian Inst. Met. 2023, 76, 2263–2271. [Google Scholar] [CrossRef]
- Zhang, Y.; Wu, Y.; Chen, D.; Wang, R.; Li, D.; Guo, C.; Jiang, G.; Shen, D.; Yu, S.; Nash, P. Micro-structures and growth mechanisms of plasma electrolytic oxidation coatings on aluminium at different current densities. Surf. Coat. Technol. 2017, 321, 236–246. [Google Scholar] [CrossRef]
- Wu, Y.-k.; Yang, Z.; Wang, R.-q.; Wu, G.-r.; Chen, D.; Wang, D.-d.; Liu, X.-t.; Li, D.-l.; Guo, C.-h.; Yu, S.-x.; et al. An investigation of microstructure evolution for plasma electrolytic oxidation (PEO) coated al in an alkaline silicate electrolyte. Surf. Coat. Technol. 2018, 351, 136–152. [Google Scholar] [CrossRef]
- Xu, J.L.; Xiao, Q.F.; Mei, D.D.; Zhong, Z.C.; Tong, Y.X.; Zheng, Y.F.; Li, L. Preparation and characterization of amorphous SiO2 coatings deposited by mirco-arc oxidation on sintered NdFeb permanent magnets. J. Magn. Magn. Mater. 2017, 426, 361–368. [Google Scholar] [CrossRef]


Disclaimer/Publisher’s Note: The statements, opinions and data contained in all publications are solely those of the individual author(s) and contributor(s) and not of MDPI and/or the editor(s). MDPI and/or the editor(s) disclaim responsibility for any injury to people or property resulting from any ideas, methods, instructions or products referred to in the content. |
© 2025 by the authors. Licensee MDPI, Basel, Switzerland. This article is an open access article distributed under the terms and conditions of the Creative Commons Attribution (CC BY) license (https://creativecommons.org/licenses/by/4.0/).