
Workability and Mechanical Properties of PVA Fiber-Reinforced Concrete with Hybrid Dune Sand and Steel Slag Aggregates

Abstract
1. Introduction
2. Experiment
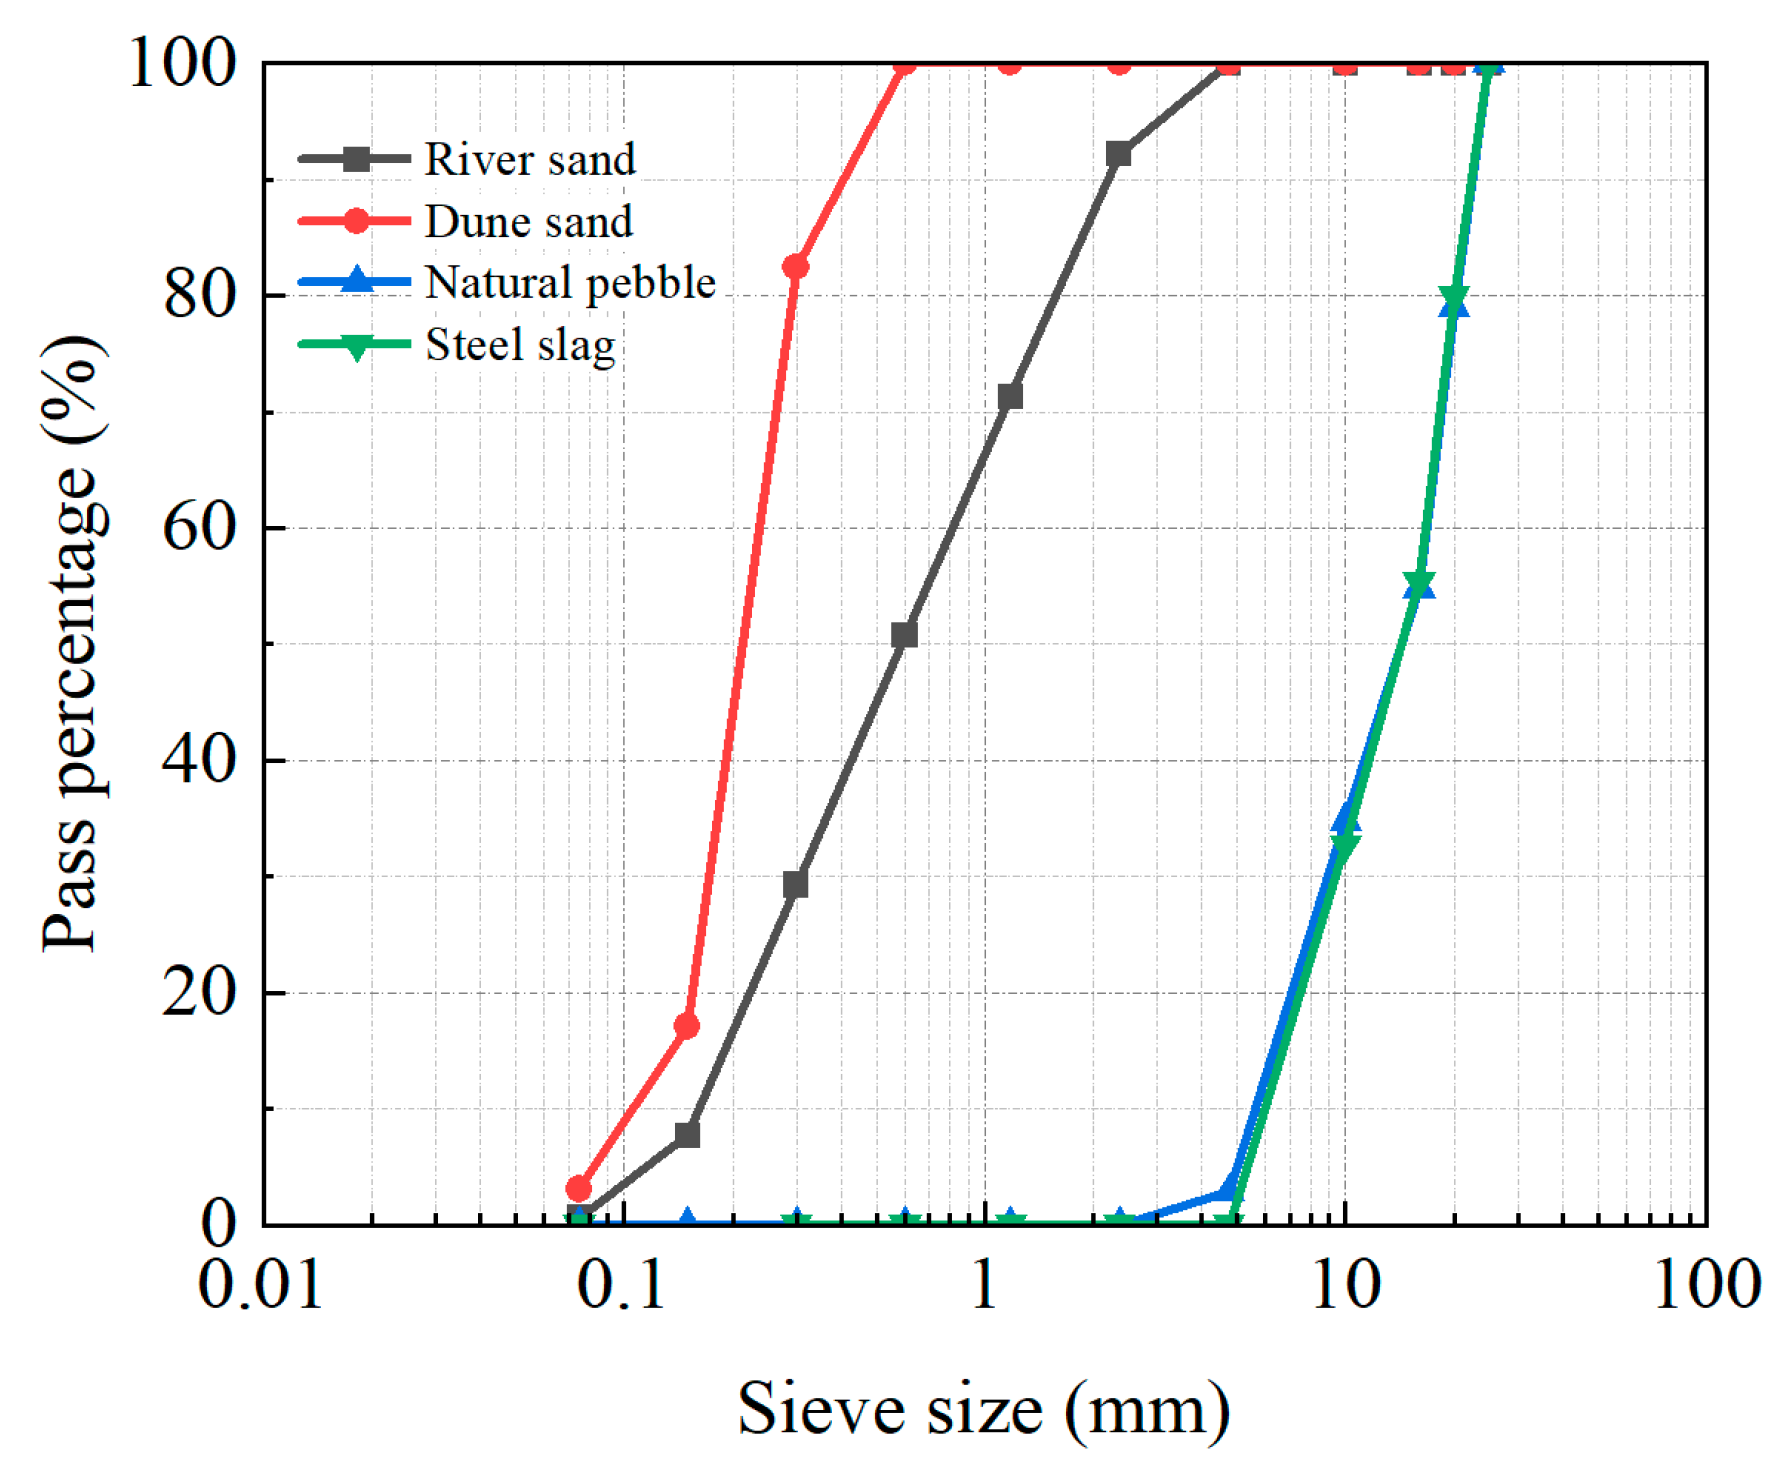
2.1. Materials
2.2. Orthogonal Test Design
2.3. Mix Proportions
2.4. Casting and Testing
3. Test Results and Evaluations
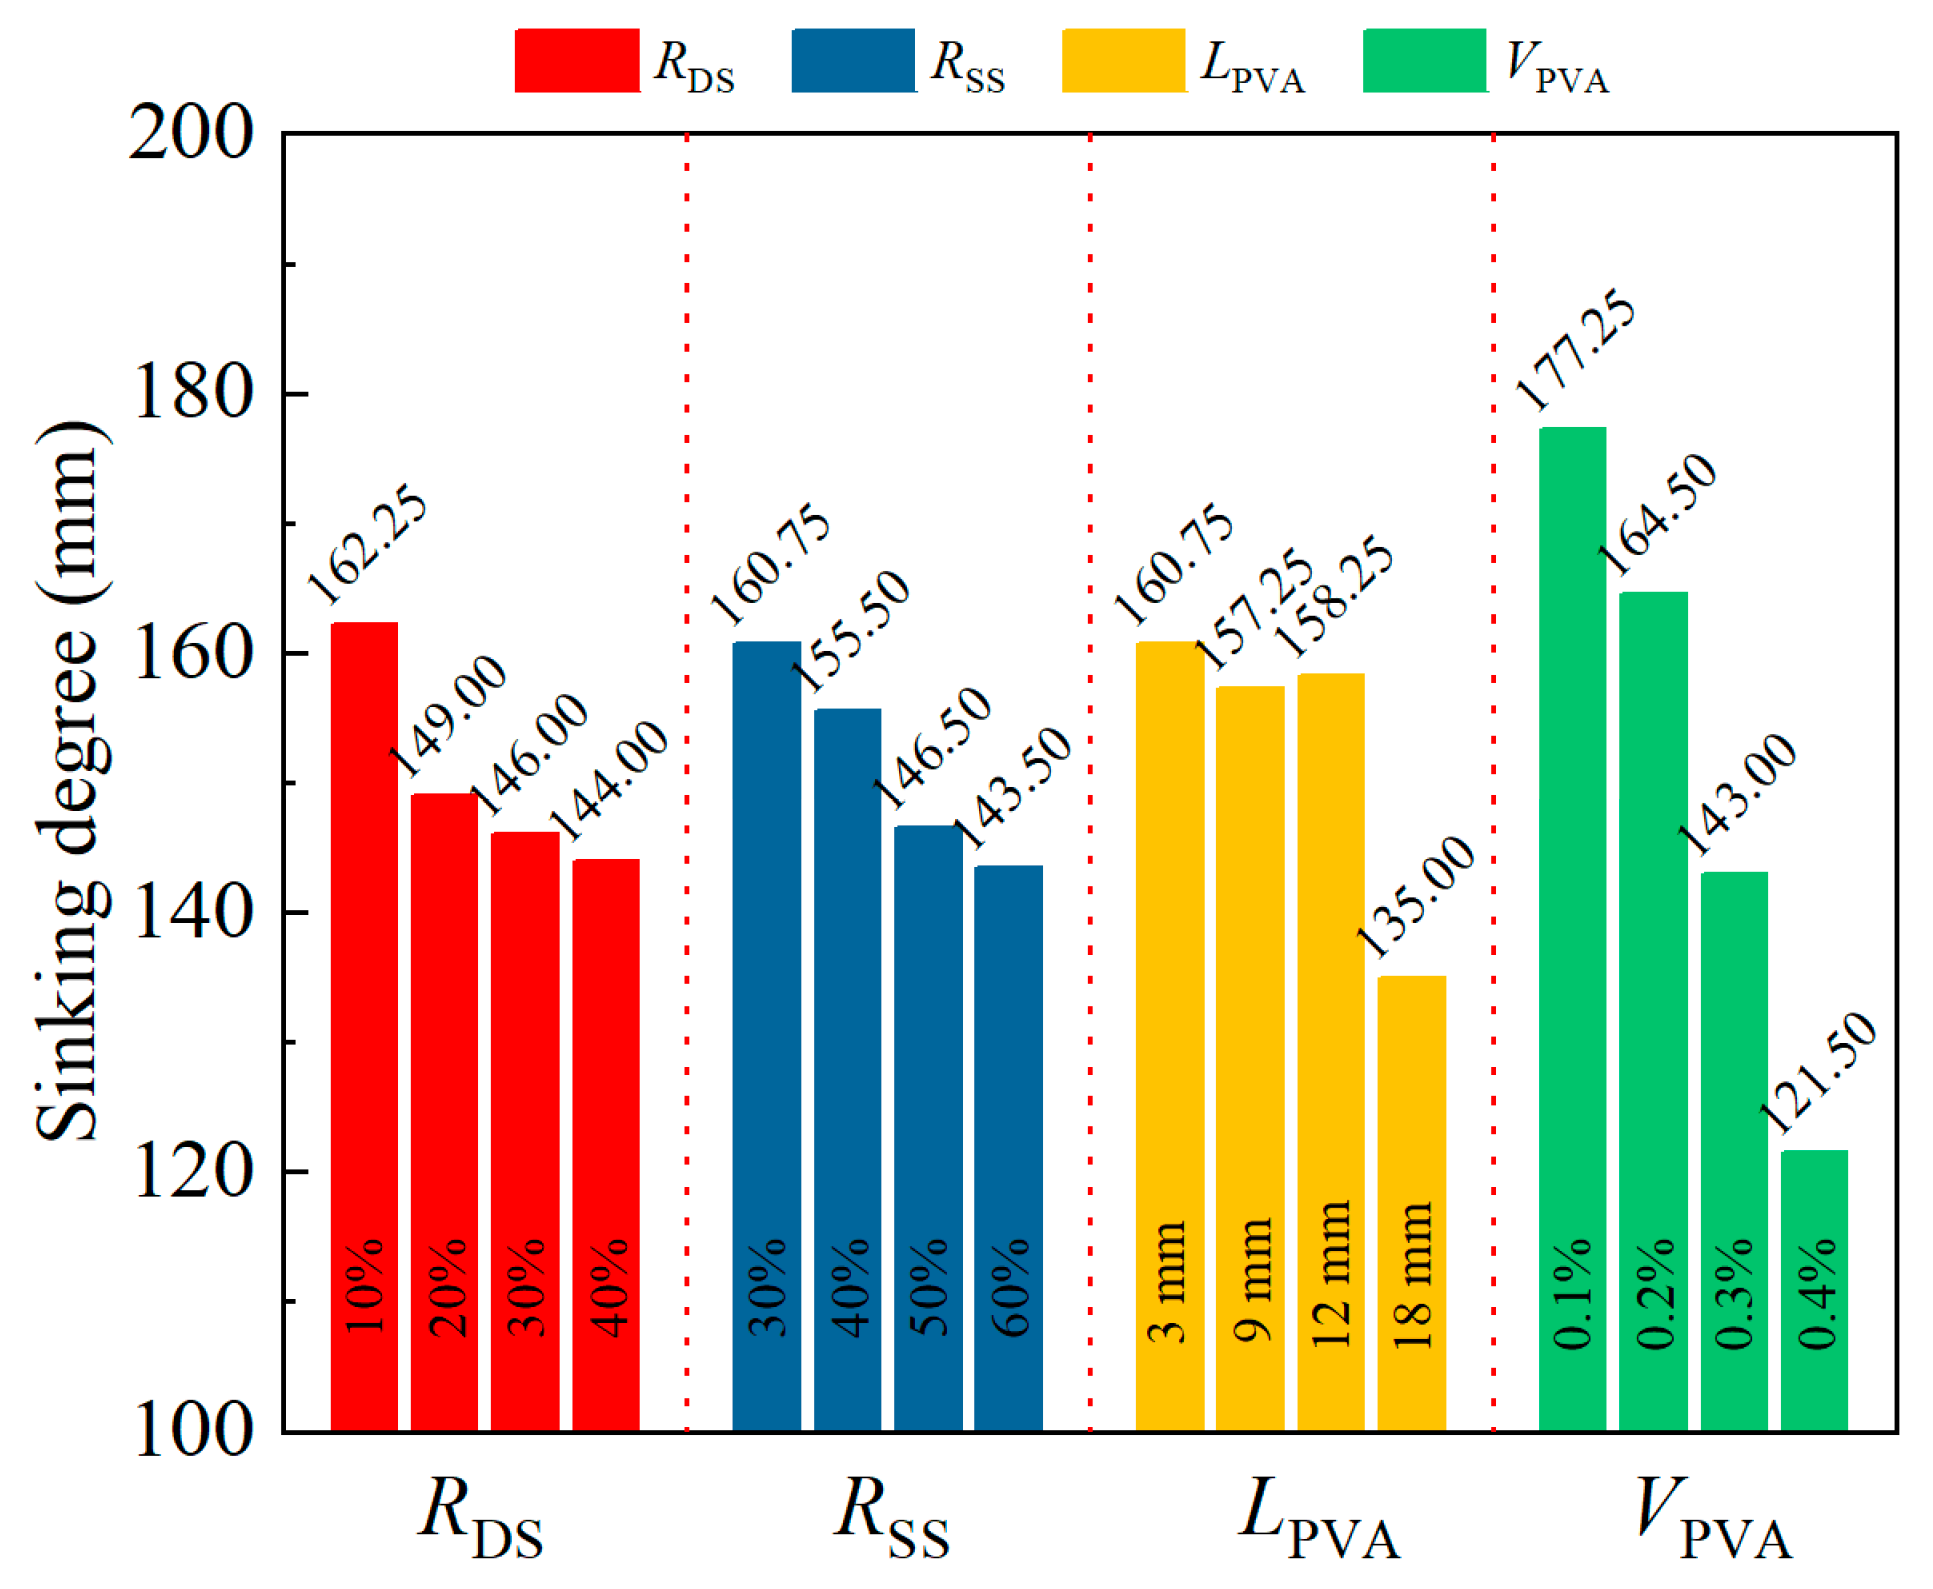
3.1. Workability
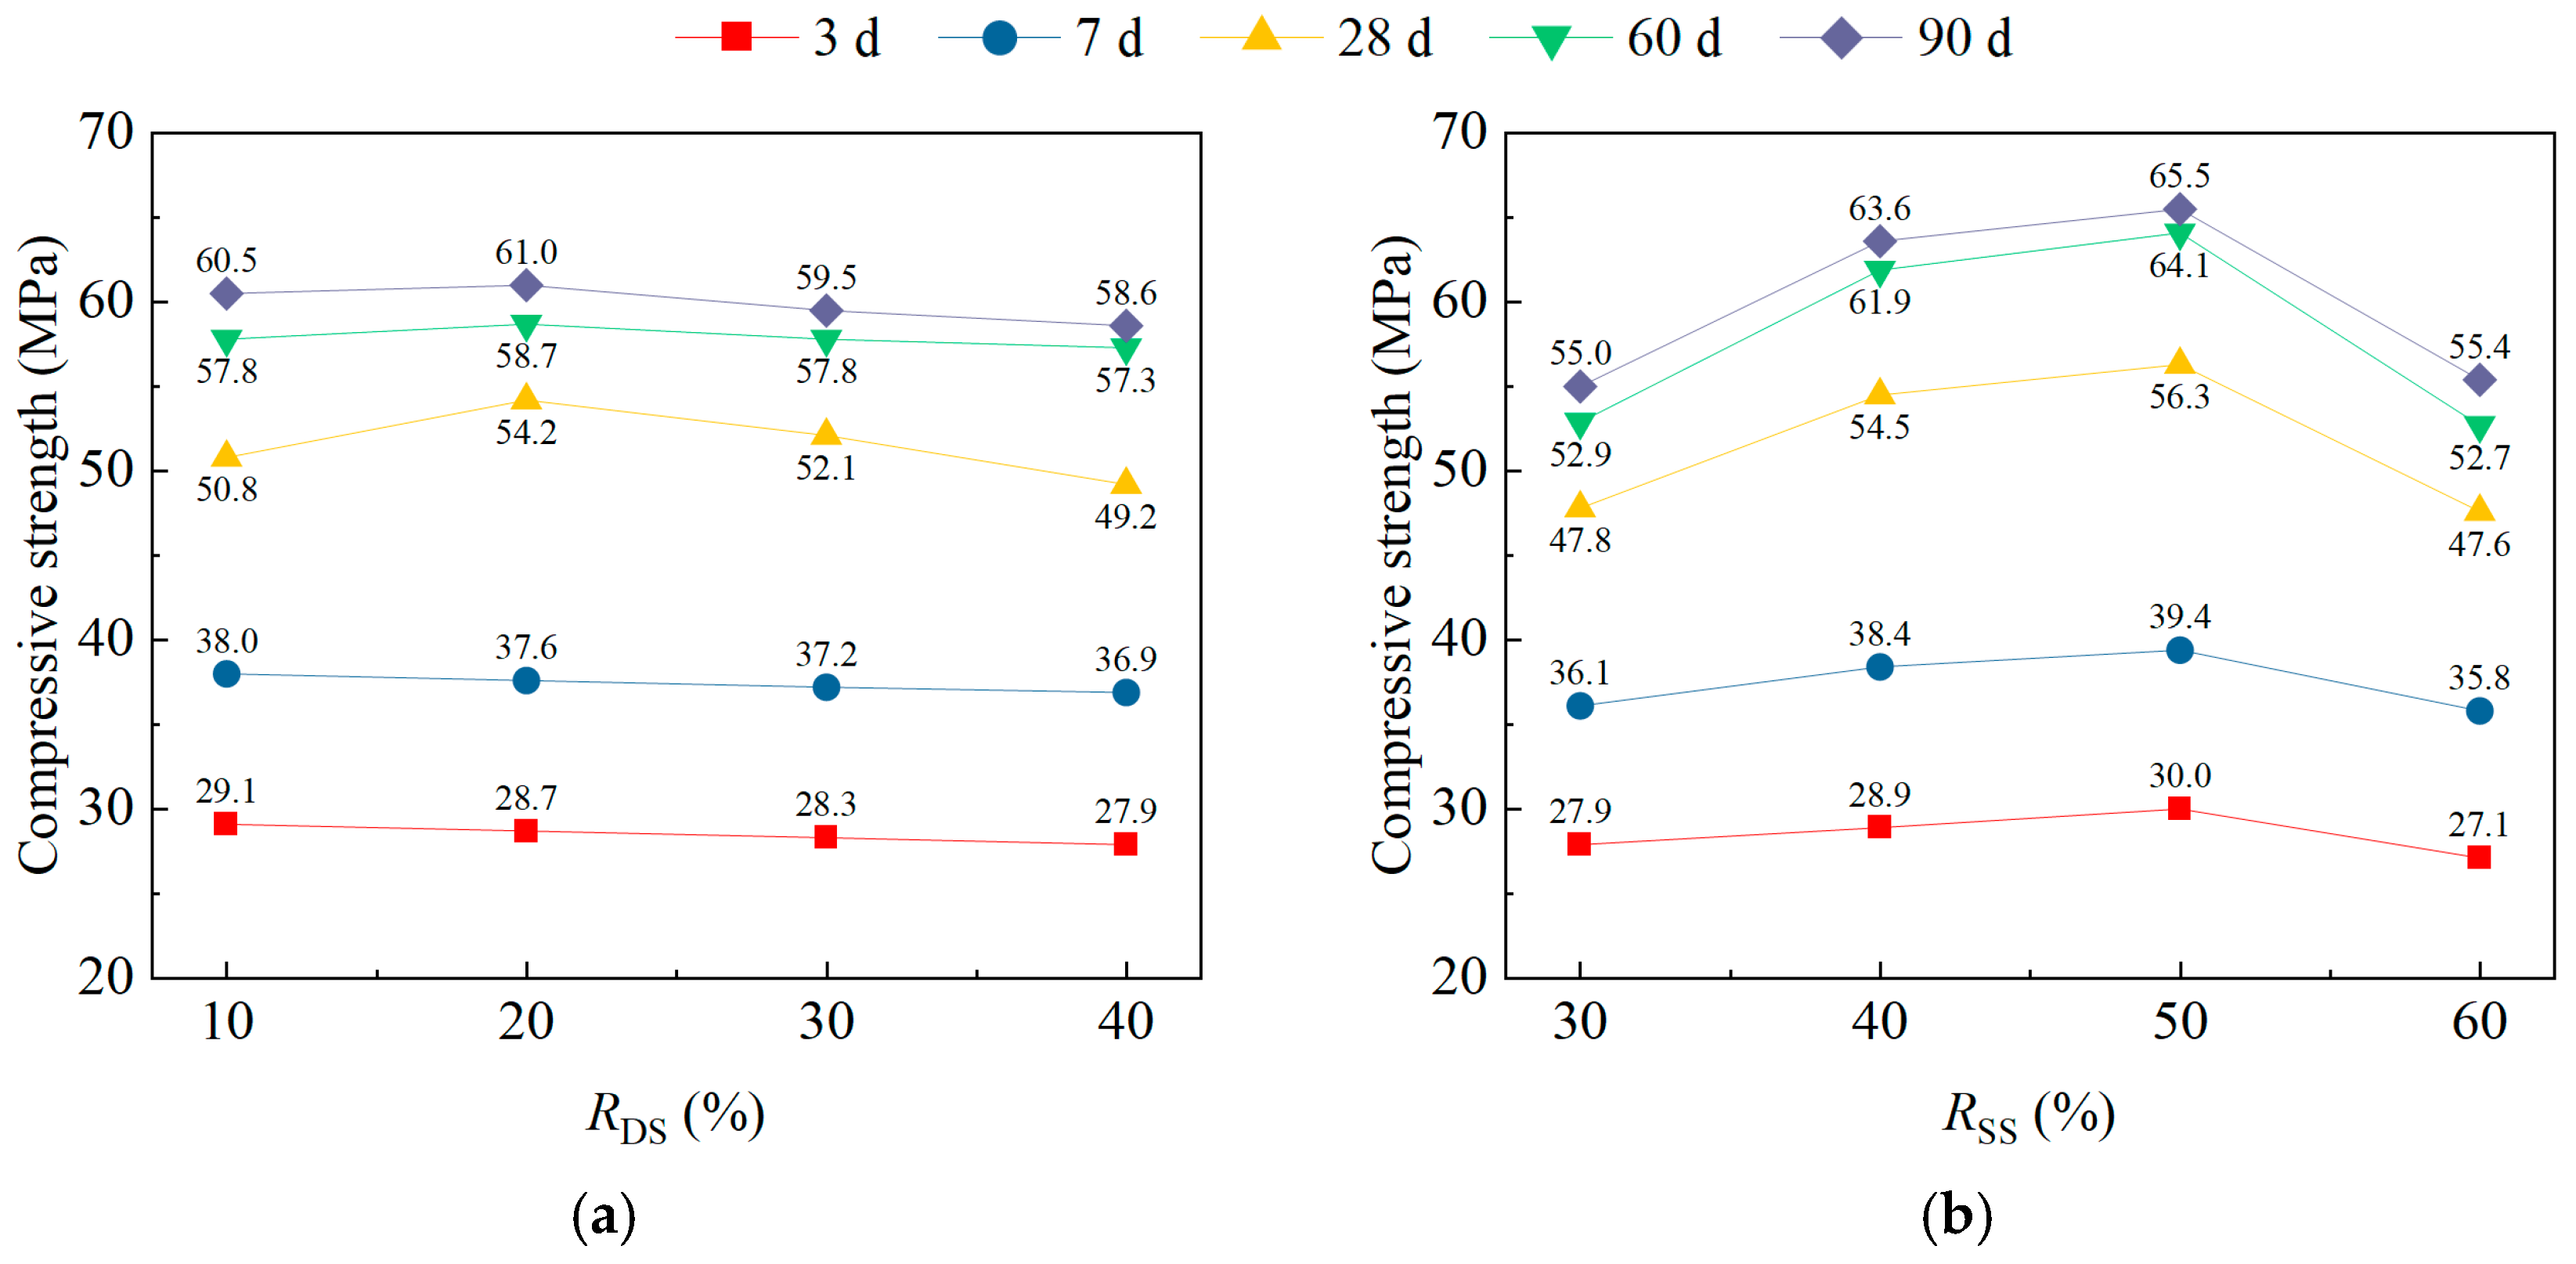
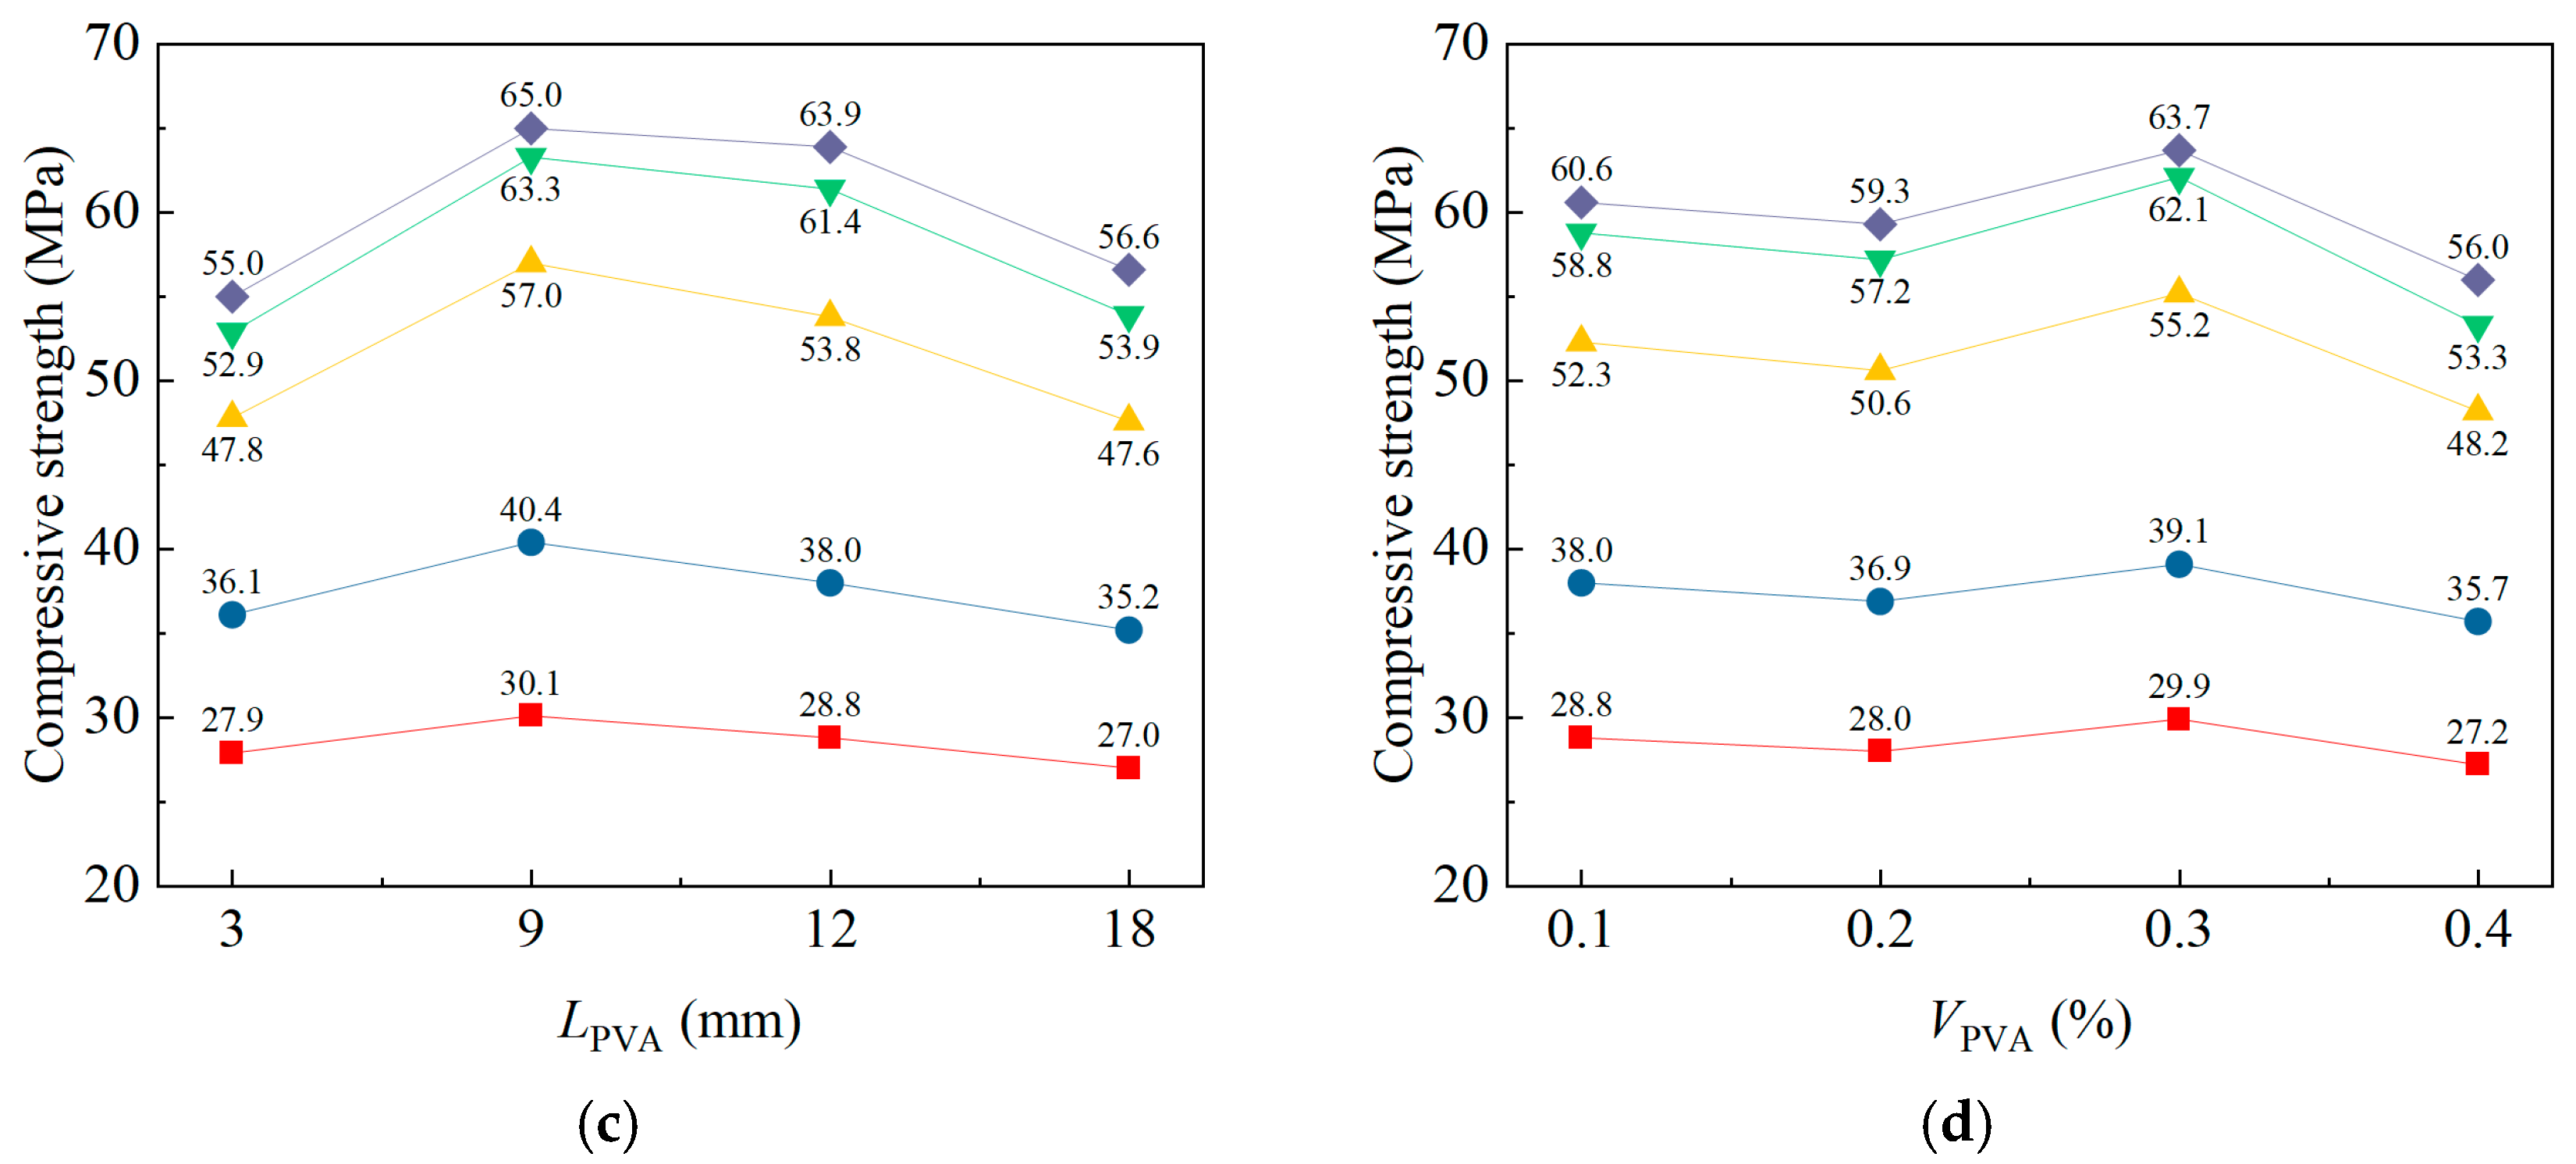
3.2. Compressive Strength
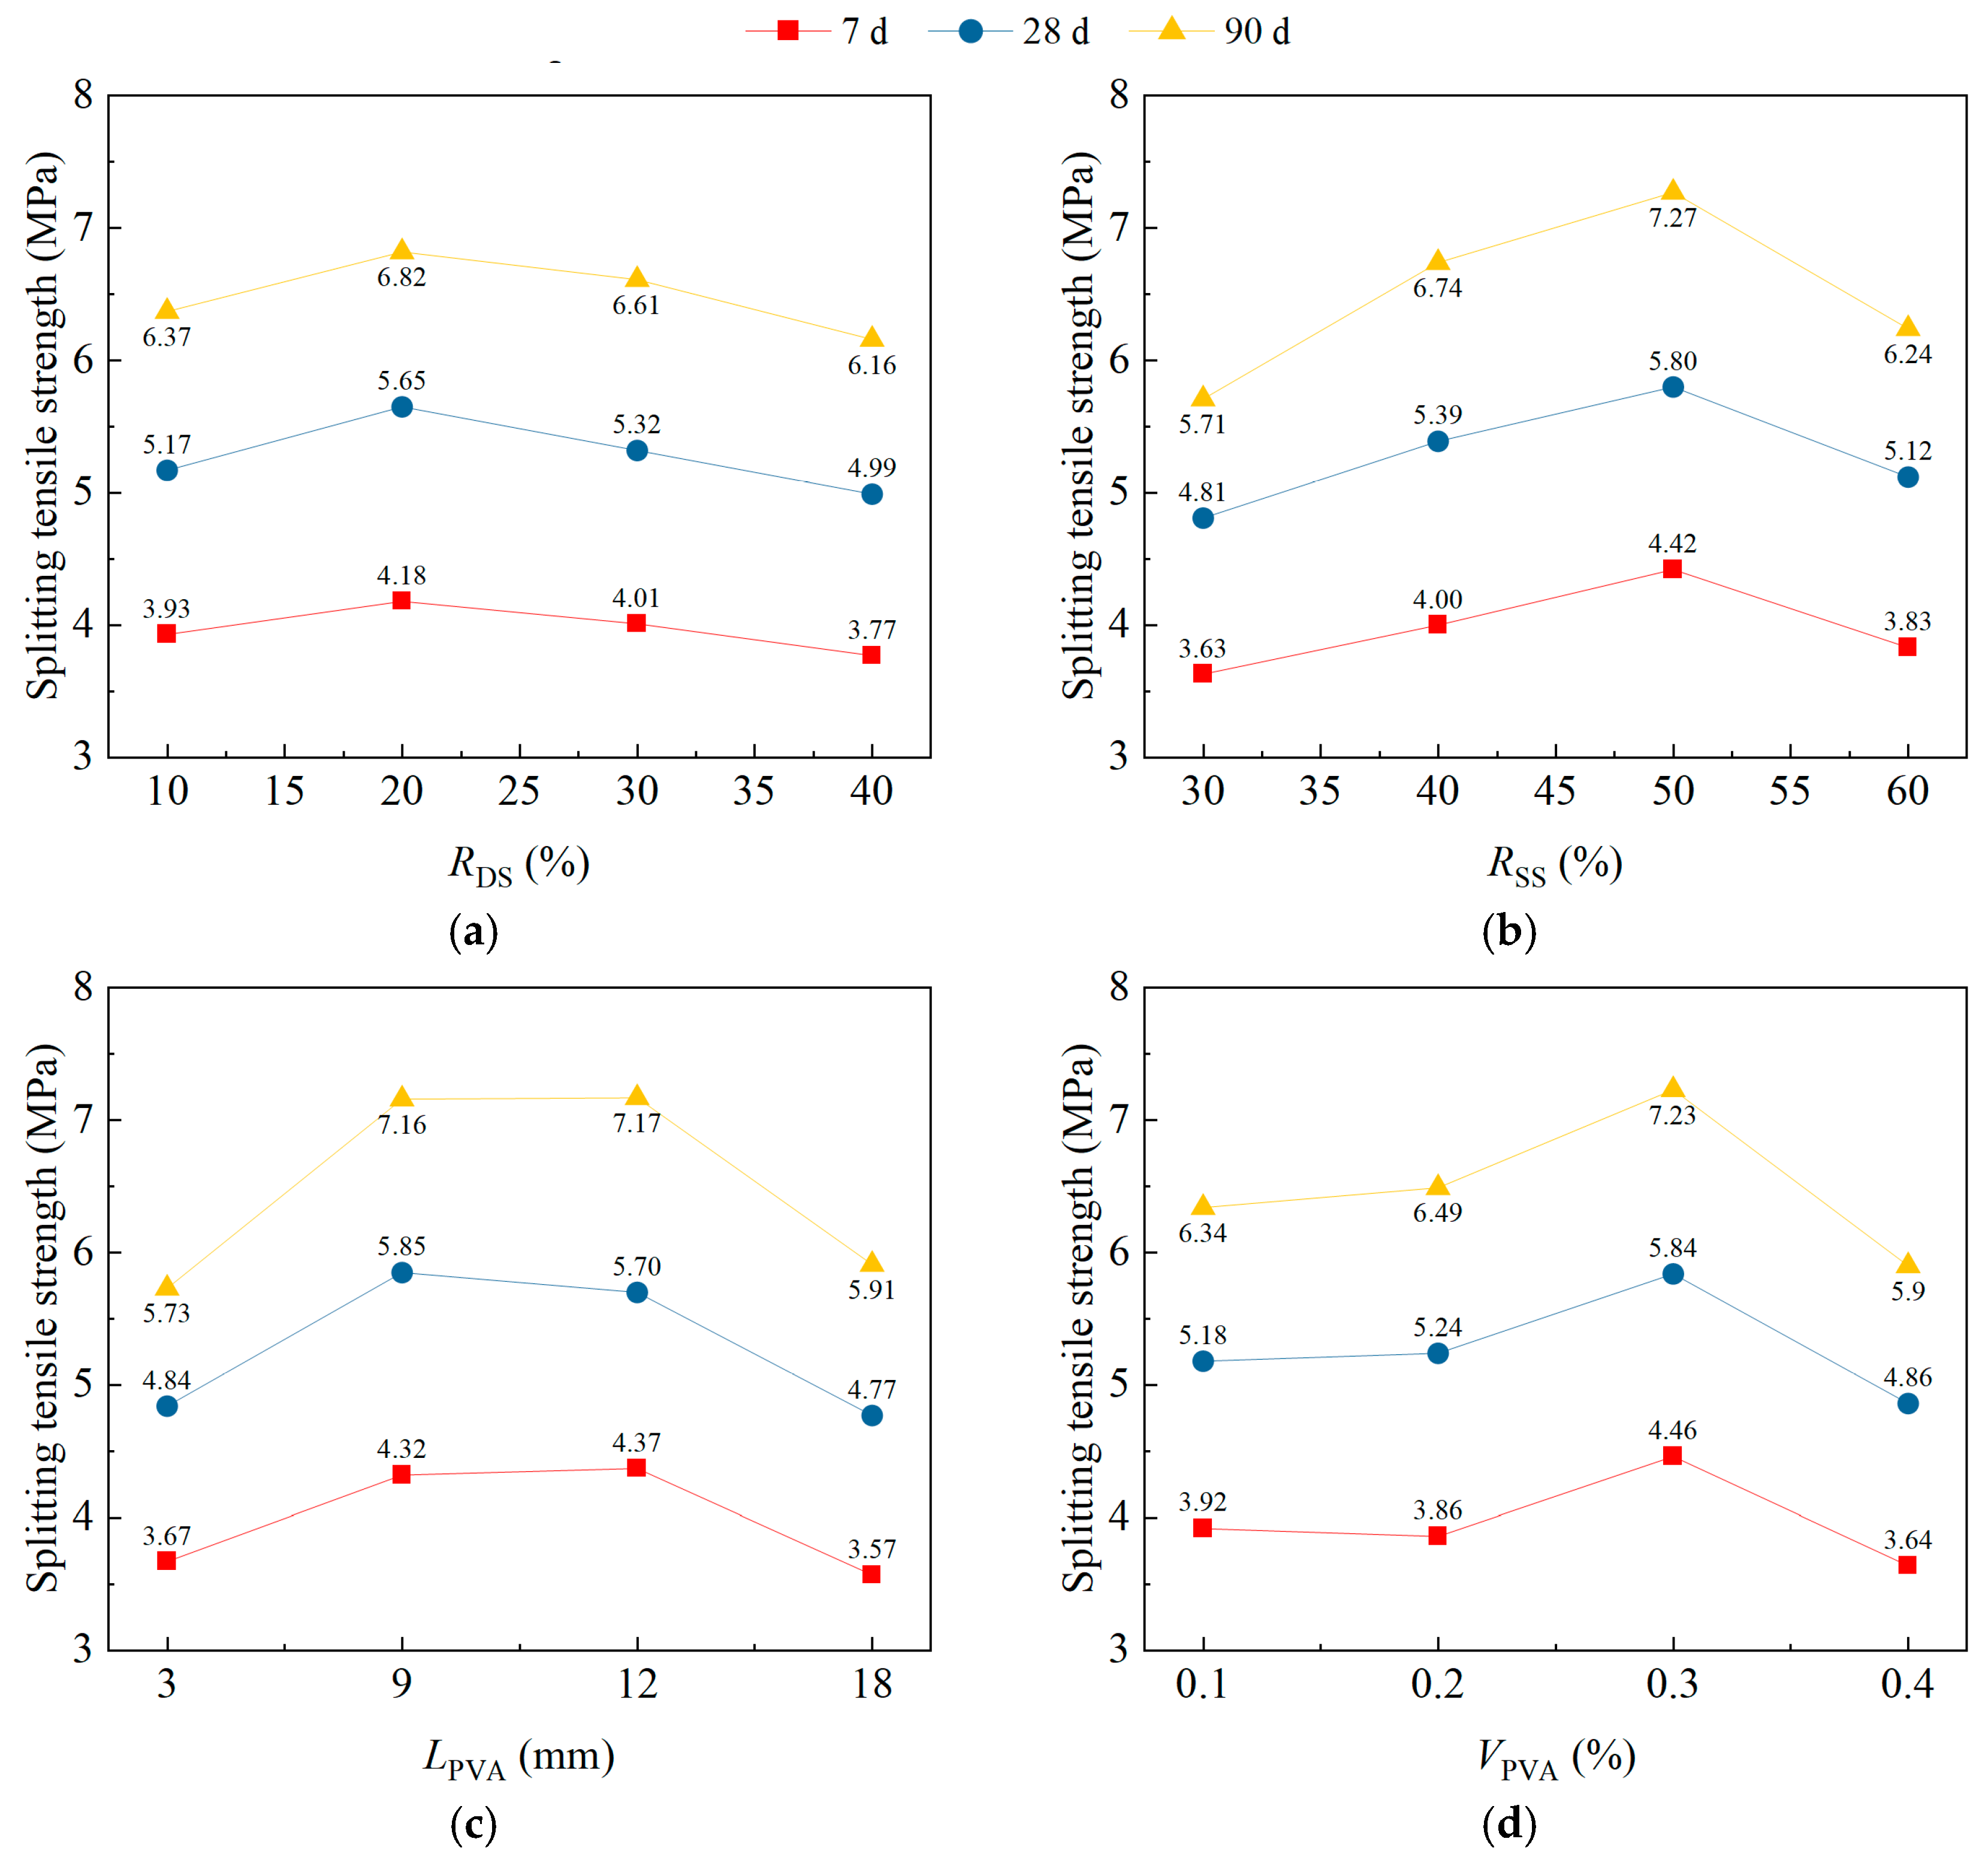
3.3. Splitting Tensile Strength
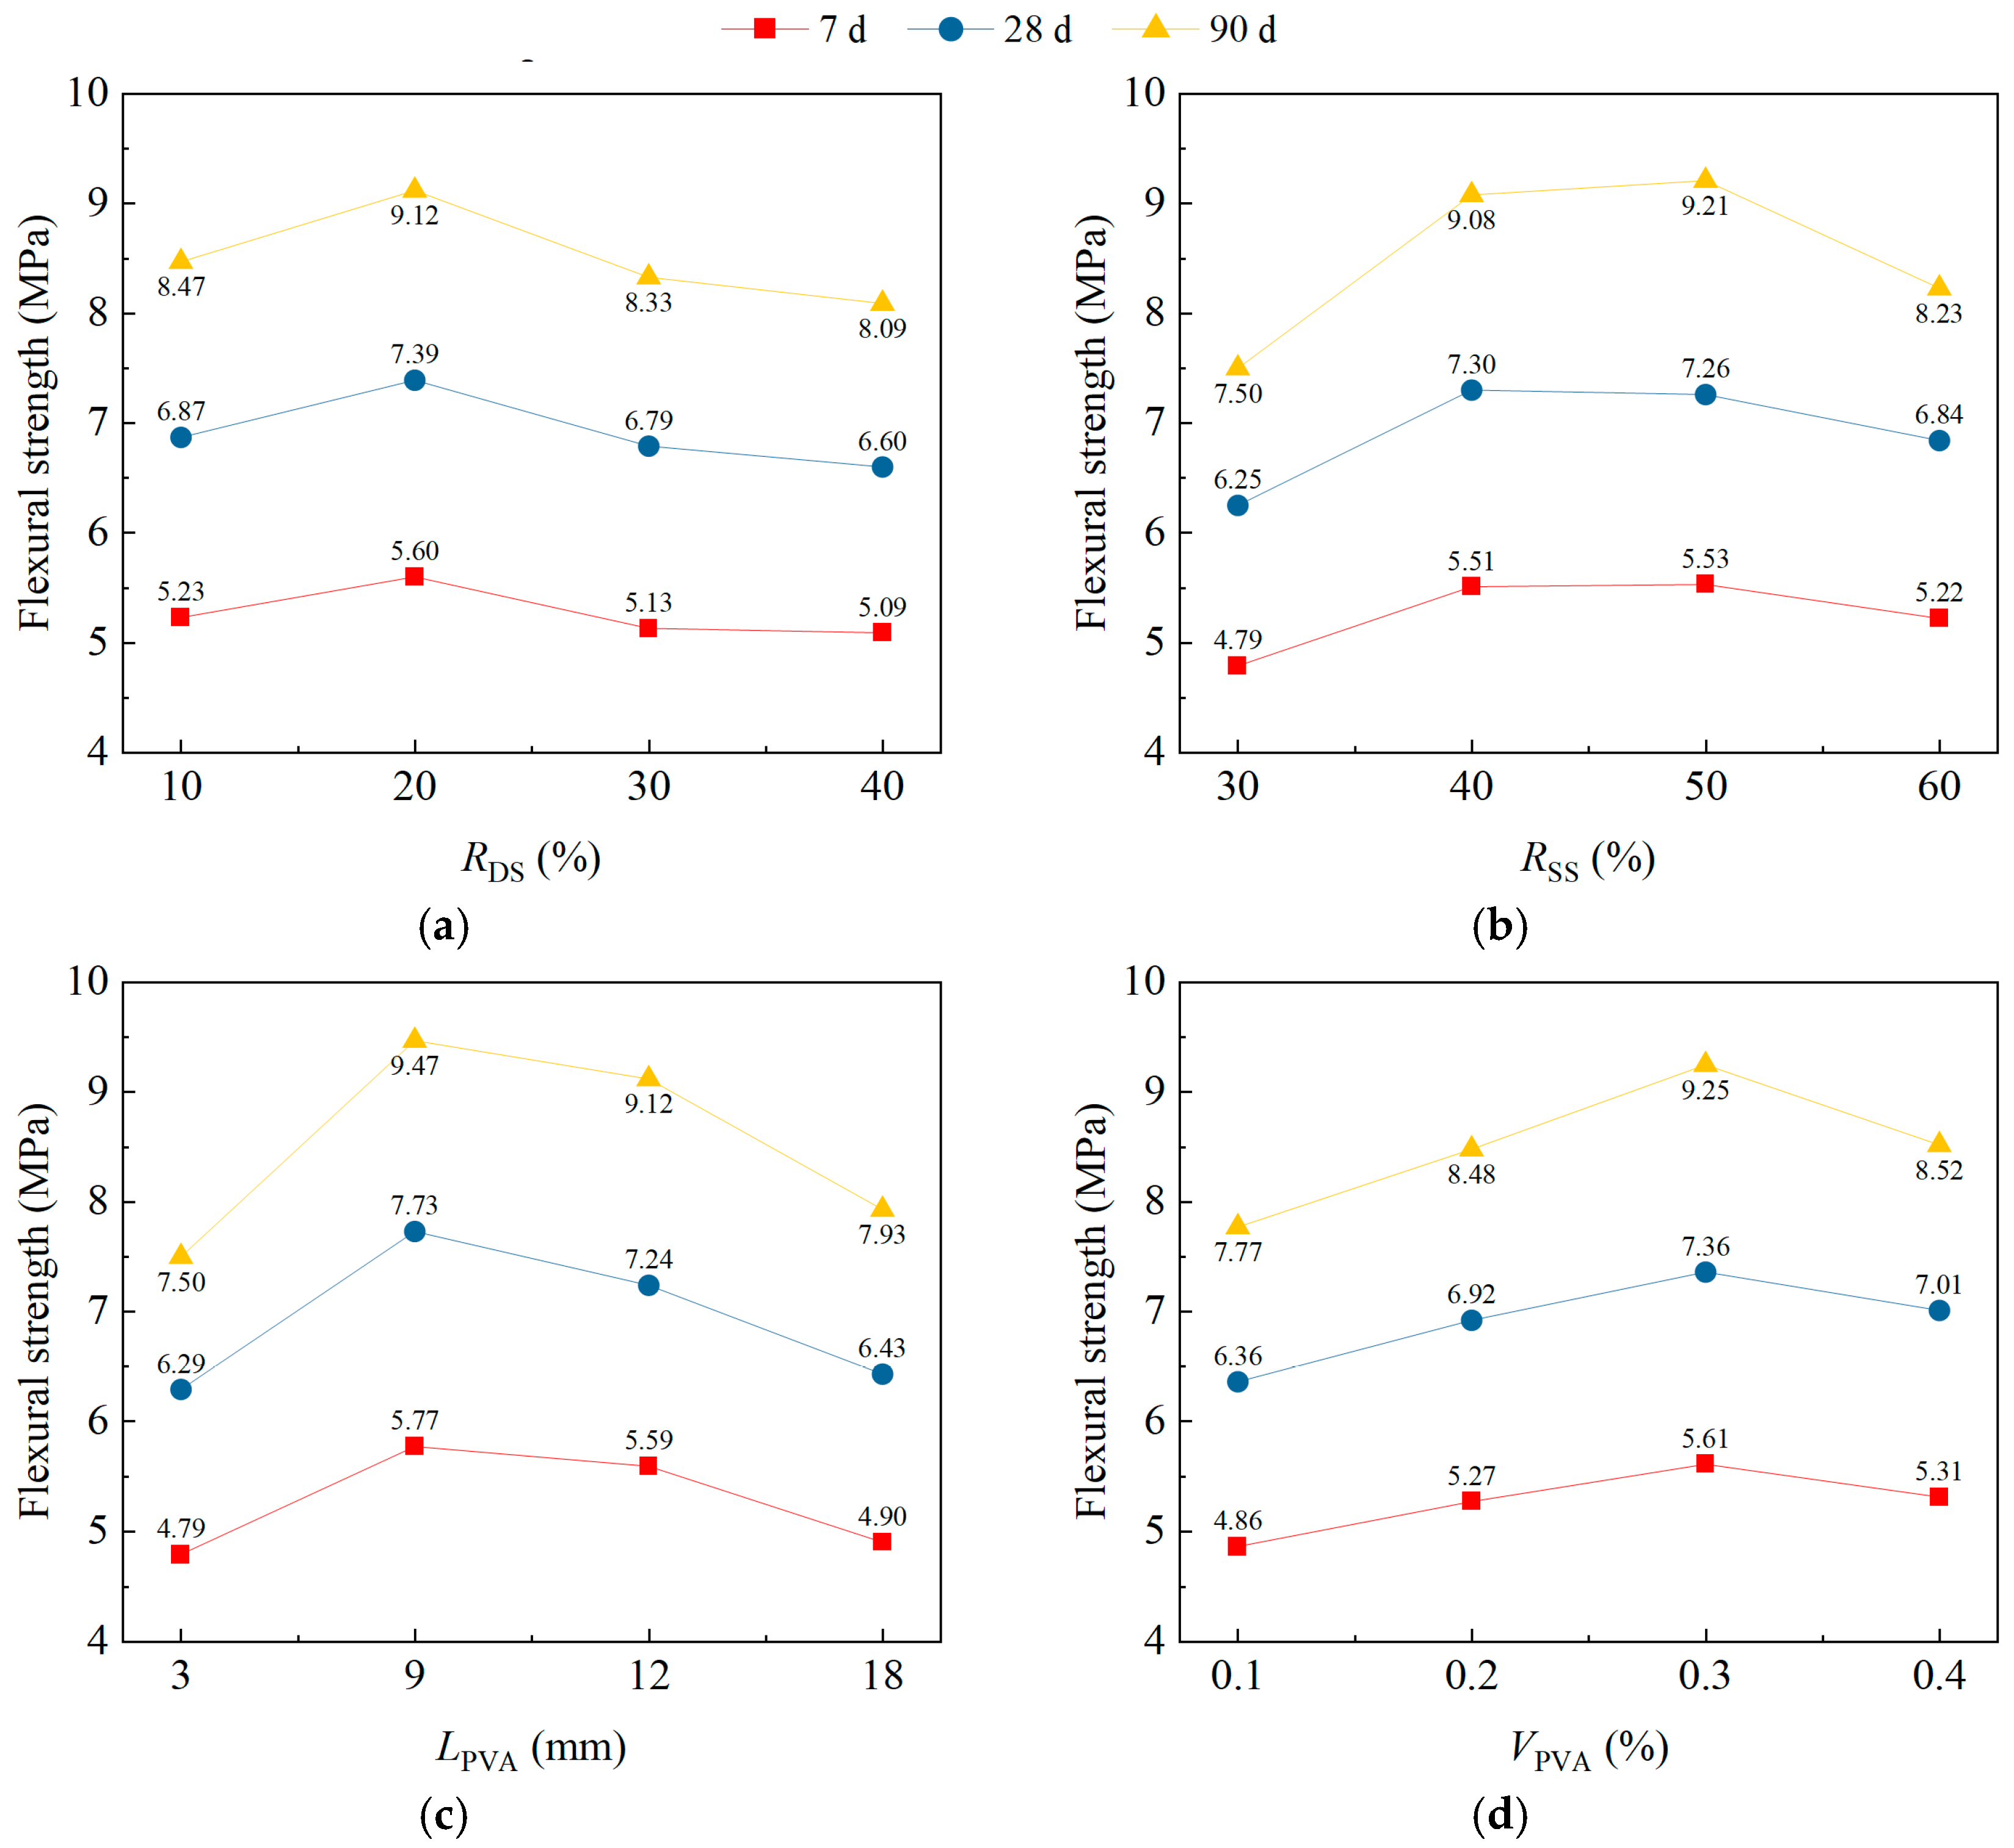
3.4. Flexural Strength
3.5. Strength Conversion Calculation Formula
3.6. Compressive Strength Growth Model
4. Conclusions
Author Contributions
Funding
Institutional Review Board Statement
Informed Consent Statement
Data Availability Statement
Conflicts of Interest
References
- Torres, A.; Brandt, J.; Lear, K.; Liu, J. A looming tragedy of the sand commons. Science 2017, 357, 970–971. [Google Scholar] [CrossRef]
- Cousins, S. Shifting sand: Why we’re running out of aggregate. Constr. Res. Innov. 2019, 10, 69–71. [Google Scholar] [CrossRef]
- Santhosh, K.G.; Subhani, S.M.; Bahurudeen, A. Cleaner production of concrete by using industrial by-products as fine aggregate: A sustainable solution to excessive river sand mining. J. Build. Eng. 2021, 42, 102415. [Google Scholar] [CrossRef]
- Wang, T.; Zhao, H.L. Fifty-year history of China desert science. J. Desert Res. 2005, 25, 145–165. [Google Scholar]
- Zhang, T.H.; Wang, Q.H.; Ren, Q.X.; Li, T.; Sun, H.Y.; Ding, J.N. Compressive and flexural properties of engineered geopolymer composites incorporating dune sands. Structures 2025, 78, 109251. [Google Scholar] [CrossRef]
- Zeng, B.; Zhang, Z.; Yang, S.; Mo, H.J.; Jin, F. Alkanolamines-activated steel slag for stabilization/solidification of heavy metal contaminated soil. J. Environ. Chem. Eng. 2023, 11, 110301. [Google Scholar] [CrossRef]
- Yuan, Y.; Peng, D.C.; Shao, X.Y. Crack analyzing of PVA fiber reinforced concrete beam. Ind. Constr. 2002, 32, 5–7. [Google Scholar]
- Gao, S.L. Study on Pseudo Strain-Hardening and Fracture Characteristic of Polyvinyl Alcohol Fiber Reinforced Cementitious Composites. Ph.D. Thesis, Dalian University of Technology, Dalian, China, 2006. [Google Scholar]
- Li, T.; Wang, Q.H.; Ren, Q.X. Compressive behavior of polyvinyl alcohol engineered cementitious composites incorporating steel slag as aggregate. Constr. Build. Mater. 2024, 413, 134878. [Google Scholar] [CrossRef]
- Li, T.; Ren, Q.X.; Wang, Q.H.; Zhang, Y.N.; Ding, J.N. Capillary of engineered cementitious composites using steel slag aggregate. J. Build. Eng. 2024, 98, 111504. [Google Scholar] [CrossRef]
- Zhou, Z.H.; Jin, Q.; Hu, D.; Zhu, L.; Li, Z.H.; Su, W.Z. Long-term volume stability of steel slag sand mortar and concrete. Case Stud. Constr. Mater. 2025, 22, e04179. [Google Scholar] [CrossRef]
- Lee, E.; Park, S.J.; Kim, Y.J. Drying shrinkage cracking of concrete using dune sand and crushed sand. Constr. Build. Mater. 2016, 126, 517–526. [Google Scholar] [CrossRef]
- Xiong, X.L.; Yang, Z.X.; Yan, X.Y.; Zhang, Y.; Dong, S.; Li, K.; Briseghella, B.; Marano, G.C. Mechanical properties and microstructure of engineered cementitious composites with high volume steel slag and GGBFS. Constr. Build. Mater. 2023, 398, 132512. [Google Scholar] [CrossRef]
- Yao, J.; Ge, Y.L.; Ruan, W.Q.; Meng, J. Effects of PVA fiber on shrinkage deformation and mechanical properties of ultra-high performance concrete. Constr. Build. Mater. 2024, 417, 135399. [Google Scholar] [CrossRef]
- Guettala, S.; Mezghiche, B. Compressive strength and hydration with age of cement pastes containing dune sand powder. Constr. Build. Mater. 2024, 25, 1263–1269. [Google Scholar] [CrossRef]
- Park, S.; Lee, E.; Ko, J.; Yoo, J.; Kim, Y. Rheological properties of concrete using dune sand. Constr. Build. Mater. 2020, 172, 685–695. [Google Scholar] [CrossRef]
- Necira, B.; Guettala, A.; Guettala, S. Study of the combined effect of different types of sand on the characteristics of high performance self-compacting concrete. J. Adhes. Sci. Technol. 2017, 31, 1912–1928. [Google Scholar] [CrossRef]
- Li, S.X.; Qin, Y.J.; Cui, Z.; Chen, C.D. Study on mix ratio of sand concrete in Taklimakan desert. New Build. Mater. 2019, 11, 42–45. [Google Scholar] [CrossRef]
- Li, H.P.; Gui, Z. Experimental study on splitting tensile strength of desert sand concrete. Fly Ash Compr. Util. 2022, 36, 95–99. [Google Scholar]
- Wu, J.C.; Shen, X.D. Analysis on frost resistance and damage mechanism of aeolian sand concrete. Trans. Chin. Soc. Agric. Eng. 2017, 33, 184–190. [Google Scholar]
- Felekoglu, B.; Turkel, S.; Baradan, B. Effect of water/cement ratio on the fresh and hardened properties of self-compacting concrete. Build. Environ. 2007, 42, 1795–1802. [Google Scholar] [CrossRef]
- Qasrawi, H.; Shalabi, F.; Asi, I. Use of low CaO unprocessed steel slag in concrete as fine aggregate. Constr. Build. Mater. 2009, 23, 1118–1125. [Google Scholar] [CrossRef]
- Qasrawi, H. The use of steel slag aggregate to enhance the mechanical properties of recycled aggregate concrete and retain the environment. Constr. Build. Mater. 2014, 54, 298–304. [Google Scholar] [CrossRef]
- He, X.M.; Ge, X.Y.; Zhang, B. Study on basic mechanical properties of steel slag aggregate concrete. Build. Sci. 2023, 39, 37–43. [Google Scholar]
- Alhozaimy, A.M.; Soroushian, P.; Mirza, F. Mechanical properties of polypropylene fiber reinforced concrete and the effects of pozzolanic materials. Cem. Concr. Compos. 1996, 18, 85–92. [Google Scholar] [CrossRef]
- Noushini, A.; Samali, B.; Vessalas, K. Static mechanical properties of polyvinyl alcohol fibre reinforced concrete (PVA-FRC). Mag. Concr. Res. 2014, 66, 465–483. [Google Scholar] [CrossRef]
- Lin, H. Research on the Performance of Mechanics and Deformation of Concrete with PVA Fiber. Master’s Thesis, Nanjing University of Aeronautics and Astronautics, Nanjing, China, 2006. [Google Scholar]
- Qian, G.F.; Gao, X.B.; Qian, C.X. Effect of PVA fiber on mechanical properties of concrete. China Concr. Cem. Prod. 2010, 3, 52–54. [Google Scholar]
- Hadjoudja, M.; Khenfer, M.M.; Mesbah, H.A.; Yahia, A. Statistical models to optimize fiber-reinforced dune sand concrete. Arab. J. Sci. Eng. 2014, 39, 2721–2731. [Google Scholar] [CrossRef]
- Ahmad, S.; Hakeem, I.; Maslehuddin, M. Development of an optimum mixture of ultra-high performance concrete. Eur. J. Environ. Civ. Eng. 2016, 20, 1106–1126. [Google Scholar] [CrossRef]
- Sun, X.J.; Gao, Z.; Cao, P.; Zhou, C.J. Mechanical properties tests and multiscale numerical simulations for basalt fiber reinforced concrete. Constr. Build. Mater. 2019, 202, 58–72. [Google Scholar] [CrossRef]
- Zhang, J.; Sawulet, B.; Li, X.M. Effect of hybrid fibers on mechanical properties of concrete mixed with desert sand. Concrete 2023, 406, 87–91. [Google Scholar]
- Qiao, L. Research on the Mix Proportion Optimization and Mechanical and Frost Resistance Durability of Dune Sand Fiber Reinforced Concrete. Master’s Thesis, Chang’an University, Xi’an, China, 2024. [Google Scholar]
- Dong, Q.; Wang, G.; Chen, X.; Tan, J.; Gu, X. Recycling of steel slag aggregate in portland cement concrete: An overview. J. Clean. Prod. 2021, 282, 124447. [Google Scholar] [CrossRef]
- Panda, A.P.; Mohapatra, B.; Das, S.S.; Dash, S.; Sethy, C.K. Assessment of induction furnace steel slag as a potential river sand substitute for the production of standard concrete. Struct. Concr. 2025, 26, 1111–1126. [Google Scholar] [CrossRef]
- Benabed, B.; Azzouz, L.; Kadri, E.; Kenai, S.; Belaidi, A.S.E. Effect of fine aggregate replacement with desert dune sand on fresh properties and strength of self-compacting mortars. J. Adhes. Sci. Technol. 2014, 28, 2182–2195. [Google Scholar] [CrossRef]
- Menadi, B.; Kenai, S.; Khatib, J.; Ait, M.A. Strength and durability of concrete incorporating crushed limestone sand. Constr. Build. Mater. 2009, 23, 625–633. [Google Scholar] [CrossRef]
- Guo, J.L.; Yuan, K.; Xu, J.J.; Wang, Y.; Gan, D.; He, M.S. The workability and mechanical performance of fly ash cenosphere–desert sand ceramsite concrete: An experimental study and analysis. Materials 2023, 16, 1298. [Google Scholar] [CrossRef] [PubMed]
- Fu, Q.; Xue, G.; Xu, S.; Li, J.J.; Dong, W. Mechanical performance, microstructure, and damage model of concrete containing steel slag aggregate. Struct. Concr. 2023, 24, 2189–2207. [Google Scholar] [CrossRef]
- Saxena, S.; Tembhurkar, A.R. Impact of use of steel slag as coarse aggregate and wastewater on fresh and hardened properties of concrete. Constr. Build. Mater. 2018, 165, 126–137. [Google Scholar] [CrossRef]
- Wang, J.; Fu, R.Z.; Dong, H. Carbon nanofibers and PVA fiber hybrid concrete: Abrasion and impact resistance. J. Build. Eng. 2023, 80, 107894. [Google Scholar] [CrossRef]
- Luo, Z.Y.; Yang, X.H.; Ji, H.L.; Zhang, C.C. Carbonation model and prediction of polyvinyl alcohol fiber concrete with fiber length and content effects. Int. J. Concr. Struct. Mater. 2022, 16, 9. [Google Scholar] [CrossRef]
- GB/T 50080; Standard for Test Method of Performance on Ordinary Fresh Concrete. China Building Industry Press: Beijing, China, 2016.
- GB/T 50081; Standard for Test Methods of Concrete Physical and Mechanical Properties. China Building Industry Press: Beijing, China, 2019.
- Liu, Y.H.; Li, Y.Q.; Jiang, G.H. Orthogonal experiment on performance of mortar made with dune sand. Constr. Build. Mater. 2020, 264, 120254. [Google Scholar] [CrossRef]
- GB 50010; Code for Design of Concrete Structures. China Building Industry Press: Beijing, China, 2015.


| Cement Blaine (m2/kg) | Water Demand (%) | Setting Time (min.) | 3 d Strength (MPa) | 28 d Strength (MPa) | |||
|---|---|---|---|---|---|---|---|
| Initial Set | Final Set | Flexural Strength | Compressive Strength | Flexural Strength | Compressive Strength | ||
| 320 | 27.8 | 150 | 210 | 6.8 | 22 | 8.8 | 52.7 |
| Type | Maximum Particle Size (mm) | Apparent Density (kg/m3) | Bulk Density (kg/m3) | Crush Index (%) | Needle Particle Content (%) | Silt Content (%) |
|---|---|---|---|---|---|---|
| Natural pebble | 20 | 2650 | 1420 | 8.6 | 9.8 | 0.75 |
| Steel slag | 20 | 3190 | 2240 | 6.3 | - | 0.03 |
| Sand Type | Density (g/cm3) | Gradation | Absorption | Average Grain Size (mm) | Silt Content (%) | ||
|---|---|---|---|---|---|---|---|
| Bulk | Apparent | Fineness Modulus | Uniformity Coefficient | ||||
| Dune sand | 1.56 | 1.44 | 2.125 | 1.44 | 3.84 | 0.218 | 0.23 |
| River sand | 1.43 | 2.92 | 2.876 | 2.92 | 3.28 | 0.600 | 0.01 |
| Type | Equivalent Diameter (μm) | Length (mm) | Density (g/cm3) | Humidity Content (%) | Elongation (%) | Strength (MPa) | Elastic Modulus (GPa) |
|---|---|---|---|---|---|---|---|
| PVA fiber | 15.3 | 3/9/12/18 | 1.2 | <0.1 | ≤7 | 383 | 40 |
| Level | Factor | |||
|---|---|---|---|---|
| RDS (%) | RSS (%) | LPVA (mm) | VPVA (%) | |
| 1 | 10 | 30 | 3 | 0.1 |
| 2 | 20 | 40 | 9 | 0.2 |
| 3 | 30 | 50 | 12 | 0.3 |
| 4 | 40 | 60 | 18 | 0.4 |
| Specimens ID | Influencing Factors | Mix Proportions (kg/m3) | ||||||||||
|---|---|---|---|---|---|---|---|---|---|---|---|---|
| RDS (%) | RSS (%) | LPVA (mm) | VPVA (%) | Cement | Fly Ash | River Sand | Dune Sand | Steel Slag | Natural Pebble | Water | HRWR | |
| D10S30PL3V0.1 | 10 | 30 | 3 | 0.1 | 495 | 55 | 540 | 60 | 336 | 784 | 240 | 4 |
| D10S40PL9V0.2 | 10 | 40 | 9 | 0.2 | 495 | 55 | 540 | 60 | 448 | 672 | 240 | 4 |
| D10S50PL12V0.3 | 10 | 50 | 12 | 0.3 | 495 | 55 | 540 | 60 | 560 | 560 | 240 | 4 |
| D10S60PL18V0.4 | 10 | 60 | 18 | 0.4 | 495 | 55 | 540 | 60 | 672 | 448 | 240 | 4 |
| D20S30PL3V0.3 | 20 | 30 | 3 | 0.3 | 495 | 55 | 480 | 120 | 336 | 784 | 240 | 4 |
| D20S40PL9V0.4 | 20 | 40 | 9 | 0.4 | 495 | 55 | 480 | 120 | 448 | 672 | 240 | 4 |
| D20S50PL18V0.1 | 20 | 50 | 18 | 0.1 | 495 | 55 | 480 | 120 | 560 | 560 | 240 | 4 |
| D20S60PL12V0.2 | 20 | 60 | 12 | 0.2 | 495 | 55 | 480 | 120 | 672 | 448 | 240 | 4 |
| D30S30PL3V0.4 | 30 | 30 | 3 | 0.4 | 495 | 55 | 420 | 180 | 336 | 784 | 240 | 4 |
| D30S40PL18V0.2 | 30 | 40 | 18 | 0.2 | 495 | 55 | 420 | 180 | 448 | 672 | 240 | 4 |
| D30S50PL12V0.3 | 30 | 50 | 12 | 0.3 | 495 | 55 | 420 | 180 | 560 | 560 | 240 | 4 |
| D30S60PL9V0.1 | 30 | 60 | 9 | 0.1 | 495 | 55 | 420 | 180 | 672 | 448 | 240 | 4 |
| D40S30PL3V0.2 | 40 | 30 | 3 | 0.2 | 495 | 55 | 360 | 240 | 336 | 784 | 240 | 4 |
| D40S40PL12V0.1 | 40 | 40 | 12 | 0.1 | 495 | 55 | 360 | 240 | 448 | 672 | 240 | 4 |
| D40S50PL9V0.3 | 40 | 50 | 9 | 0.3 | 495 | 55 | 360 | 240 | 560 | 560 | 240 | 4 |
| D40S60PL18V0.4 | 40 | 60 | 18 | 0.4 | 495 | 55 | 360 | 240 | 672 | 448 | 240 | 4 |
| Specimens ID | Slump (mm) | Extensibility Degree (mm) | 28 d fcus (MPa) | 28 d ftts (MPa) | 28 d ftl (MPa) | |||||
|---|---|---|---|---|---|---|---|---|---|---|
| Mean | SD | Mean | SD | Mean | SD | Mean | SD | Mean | SD | |
| D10S30PL3V0.1 | 202 | 10.5 | 420 | 8.9 | 47.9 | 1.12 | 4.61 | 0.42 | 5.72 | 0.39 |
| D10S40PL9V0.2 | 175 | 14.7 | 350 | 10.5 | 56.5 | 0.97 | 5.67 | 0.38 | 7.70 | 0.44 |
| D10S50PL12V0.3 | 150 | 8.9 | 300 | 14.7 | 55.4 | 1.05 | 5.86 | 0.27 | 7.49 | 0.25 |
| D10S60PL18V0.4 | 122 | 12.3 | 250 | 10.1 | 43.4 | 1.24 | 4.52 | 0.33 | 6.56 | 0.37 |
| D20S30PL3V0.3 | 145 | 11.8 | 305 | 13.2 | 50.9 | 0.88 | 5.46 | 0.41 | 6.82 | 0.35 |
| D20S40PL9V0.4 | 123 | 9.5 | 250 | 10.5 | 59.7 | 0.94 | 5.95 | 0.19 | 8.68 | 0.41 |
| D20S50PL18V0.1 | 159 | 10.5 | 320 | 11.3 | 55.1 | 1.02 | 5.31 | 0.25 | 6.44 | 0.30 |
| D20S60PL12V0.2 | 169 | 10.9 | 295 | 9.8 | 51.0 | 1.33 | 5.88 | 0.37 | 7.60 | 0.51 |
| D30S30PL3V0.4 | 129 | 8.7 | 270 | 10.2 | 47.5 | 1.02 | 4.62 | 0.28 | 6.48 | 0.29 |
| D30S40PL18V0.2 | 147 | 9.8 | 300 | 11.5 | 49.9 | 0.89 | 4.87 | 0.25 | 6.38 | 0.34 |
| D30S50PL12V0.3 | 137 | 10.1 | 275 | 12.3 | 57.0 | 0.95 | 6.03 | 0.31 | 7.44 | 0.28 |
| D30S60PL9V0.1 | 171 | 13.8 | 340 | 9.2 | 54.1 | 1.10 | 5.74 | 0.37 | 6.87 | 0.42 |
| D40S30PL3V0.2 | 167 | 12.5 | 350 | 10.6 | 45.1 | 0.98 | 4.53 | 0.21 | 5.99 | 0.33 |
| D40S40PL12V0.1 | 177 | 8.9 | 355 | 11.5 | 51.9 | 1.03 | 5.04 | 0.39 | 6.42 | 0.38 |
| D40S50PL9V0.3 | 140 | 13.4 | 280 | 14.2 | 57.6 | 1.15 | 6.01 | 0.44 | 7.68 | 0.41 |
| D40S60PL18V0.4 | 112 | 14.5 | 245 | 10.5 | 41.9 | 0.86 | 4.36 | 0.36 | 6.33 | 0.29 |
| Level | Range | Factor | |||
|---|---|---|---|---|---|
| RDS (%) | RSS (%) | LPVA (mm) | VPVA (%) | ||
| Slump (mm) | ki1 | 162.25 | 160.75 | 160.75 | 177.25 |
| ki2 | 149.00 | 155.50 | 157.25 | 164.50 | |
| ki3 | 146.00 | 146.50 | 158.25 | 143.00 | |
| ki4 | 144.00 | 143.50 | 135.00 | 121.50 | |
| Ri | 18.25 | 17.25 | 25.75 | 55.75 | |
| Extensibility degree (mm) | ki1 | 330.00 | 336.25 | 336.25 | 358.75 |
| ki2 | 292.50 | 313.75 | 305.00 | 323.75 | |
| ki3 | 296.25 | 293.75 | 306.25 | 290.00 | |
| ki4 | 307.50 | 282.50 | 278.75 | 253.75 | |
| Ri | 37.50 | 53.75 | 57.50 | 105.00 | |
| 28 d fcus (MPa) | ki1 | 50.8 | 47.8 | 47.8 | 52.3 |
| ki2 | 54.2 | 54.5 | 57.0 | 50.6 | |
| ki3 | 52.1 | 56.3 | 53.8 | 55.2 | |
| ki4 | 49.2 | 47.6 | 47.6 | 48.2 | |
| Ri | 5.00 | 8.70 | 9.40 | 7.00 | |
| 28 d ftts (MPa) | ki1 | 5.17 | 4.81 | 4.84 | 5.18 |
| ki2 | 5.65 | 5.39 | 5.85 | 5.24 | |
| ki3 | 5.32 | 5.80 | 5.70 | 5.84 | |
| ki4 | 4.99 | 5.12 | 4.77 | 4.86 | |
| Ri | 0.66 | 0.99 | 1.08 | 0.98 | |
| 28 d ftl (MPa) | ki1 | 6.87 | 6.25 | 6.29 | 6.36 |
| ki2 | 7.39 | 7.30 | 7.73 | 6.92 | |
| ki3 | 6.79 | 7.26 | 7.24 | 7.36 | |
| ki4 | 6.60 | 6.84 | 6.43 | 7.01 | |
| Ri | 0.79 | 1.05 | 1.44 | 1.00 | |
| Method of Fitting | Fitting Formula | Correlation Coefficient |
|---|---|---|
| Logarithmic fitting | 9.35lnx + 18.96 | 0.998 |
| Linear fitting | 0.33x + 34.64 | 0.805 |
| Quadratic polynomial fitting | −0.006x2 + 0.90x + 28.97 | 0.960 |
| Exponential fitting | 24.65x0.20 | 0.973 |
Disclaimer/Publisher’s Note: The statements, opinions and data contained in all publications are solely those of the individual author(s) and contributor(s) and not of MDPI and/or the editor(s). MDPI and/or the editor(s) disclaim responsibility for any injury to people or property resulting from any ideas, methods, instructions or products referred to in the content. |
© 2025 by the authors. Licensee MDPI, Basel, Switzerland. This article is an open access article distributed under the terms and conditions of the Creative Commons Attribution (CC BY) license (https://creativecommons.org/licenses/by/4.0/).
Share and Cite
Liu, Y.; Wang, X.; Jiang, S.; Ren, Q.; Li, T. Workability and Mechanical Properties of PVA Fiber-Reinforced Concrete with Hybrid Dune Sand and Steel Slag Aggregates. Materials 2025, 18, 2956. https://doi.org/10.3390/ma18132956
Liu Y, Wang X, Jiang S, Ren Q, Li T. Workability and Mechanical Properties of PVA Fiber-Reinforced Concrete with Hybrid Dune Sand and Steel Slag Aggregates. Materials. 2025; 18(13):2956. https://doi.org/10.3390/ma18132956
Chicago/Turabian StyleLiu, Yanhua, Xirui Wang, Senyan Jiang, Qingxin Ren, and Tong Li. 2025. "Workability and Mechanical Properties of PVA Fiber-Reinforced Concrete with Hybrid Dune Sand and Steel Slag Aggregates" Materials 18, no. 13: 2956. https://doi.org/10.3390/ma18132956
APA StyleLiu, Y., Wang, X., Jiang, S., Ren, Q., & Li, T. (2025). Workability and Mechanical Properties of PVA Fiber-Reinforced Concrete with Hybrid Dune Sand and Steel Slag Aggregates. Materials, 18(13), 2956. https://doi.org/10.3390/ma18132956