
Study on Similar Materials for Weakly Cemented Medium and Indoor Excavation Test

 ,
,
Abstract
1. Introduction
2. Research Background
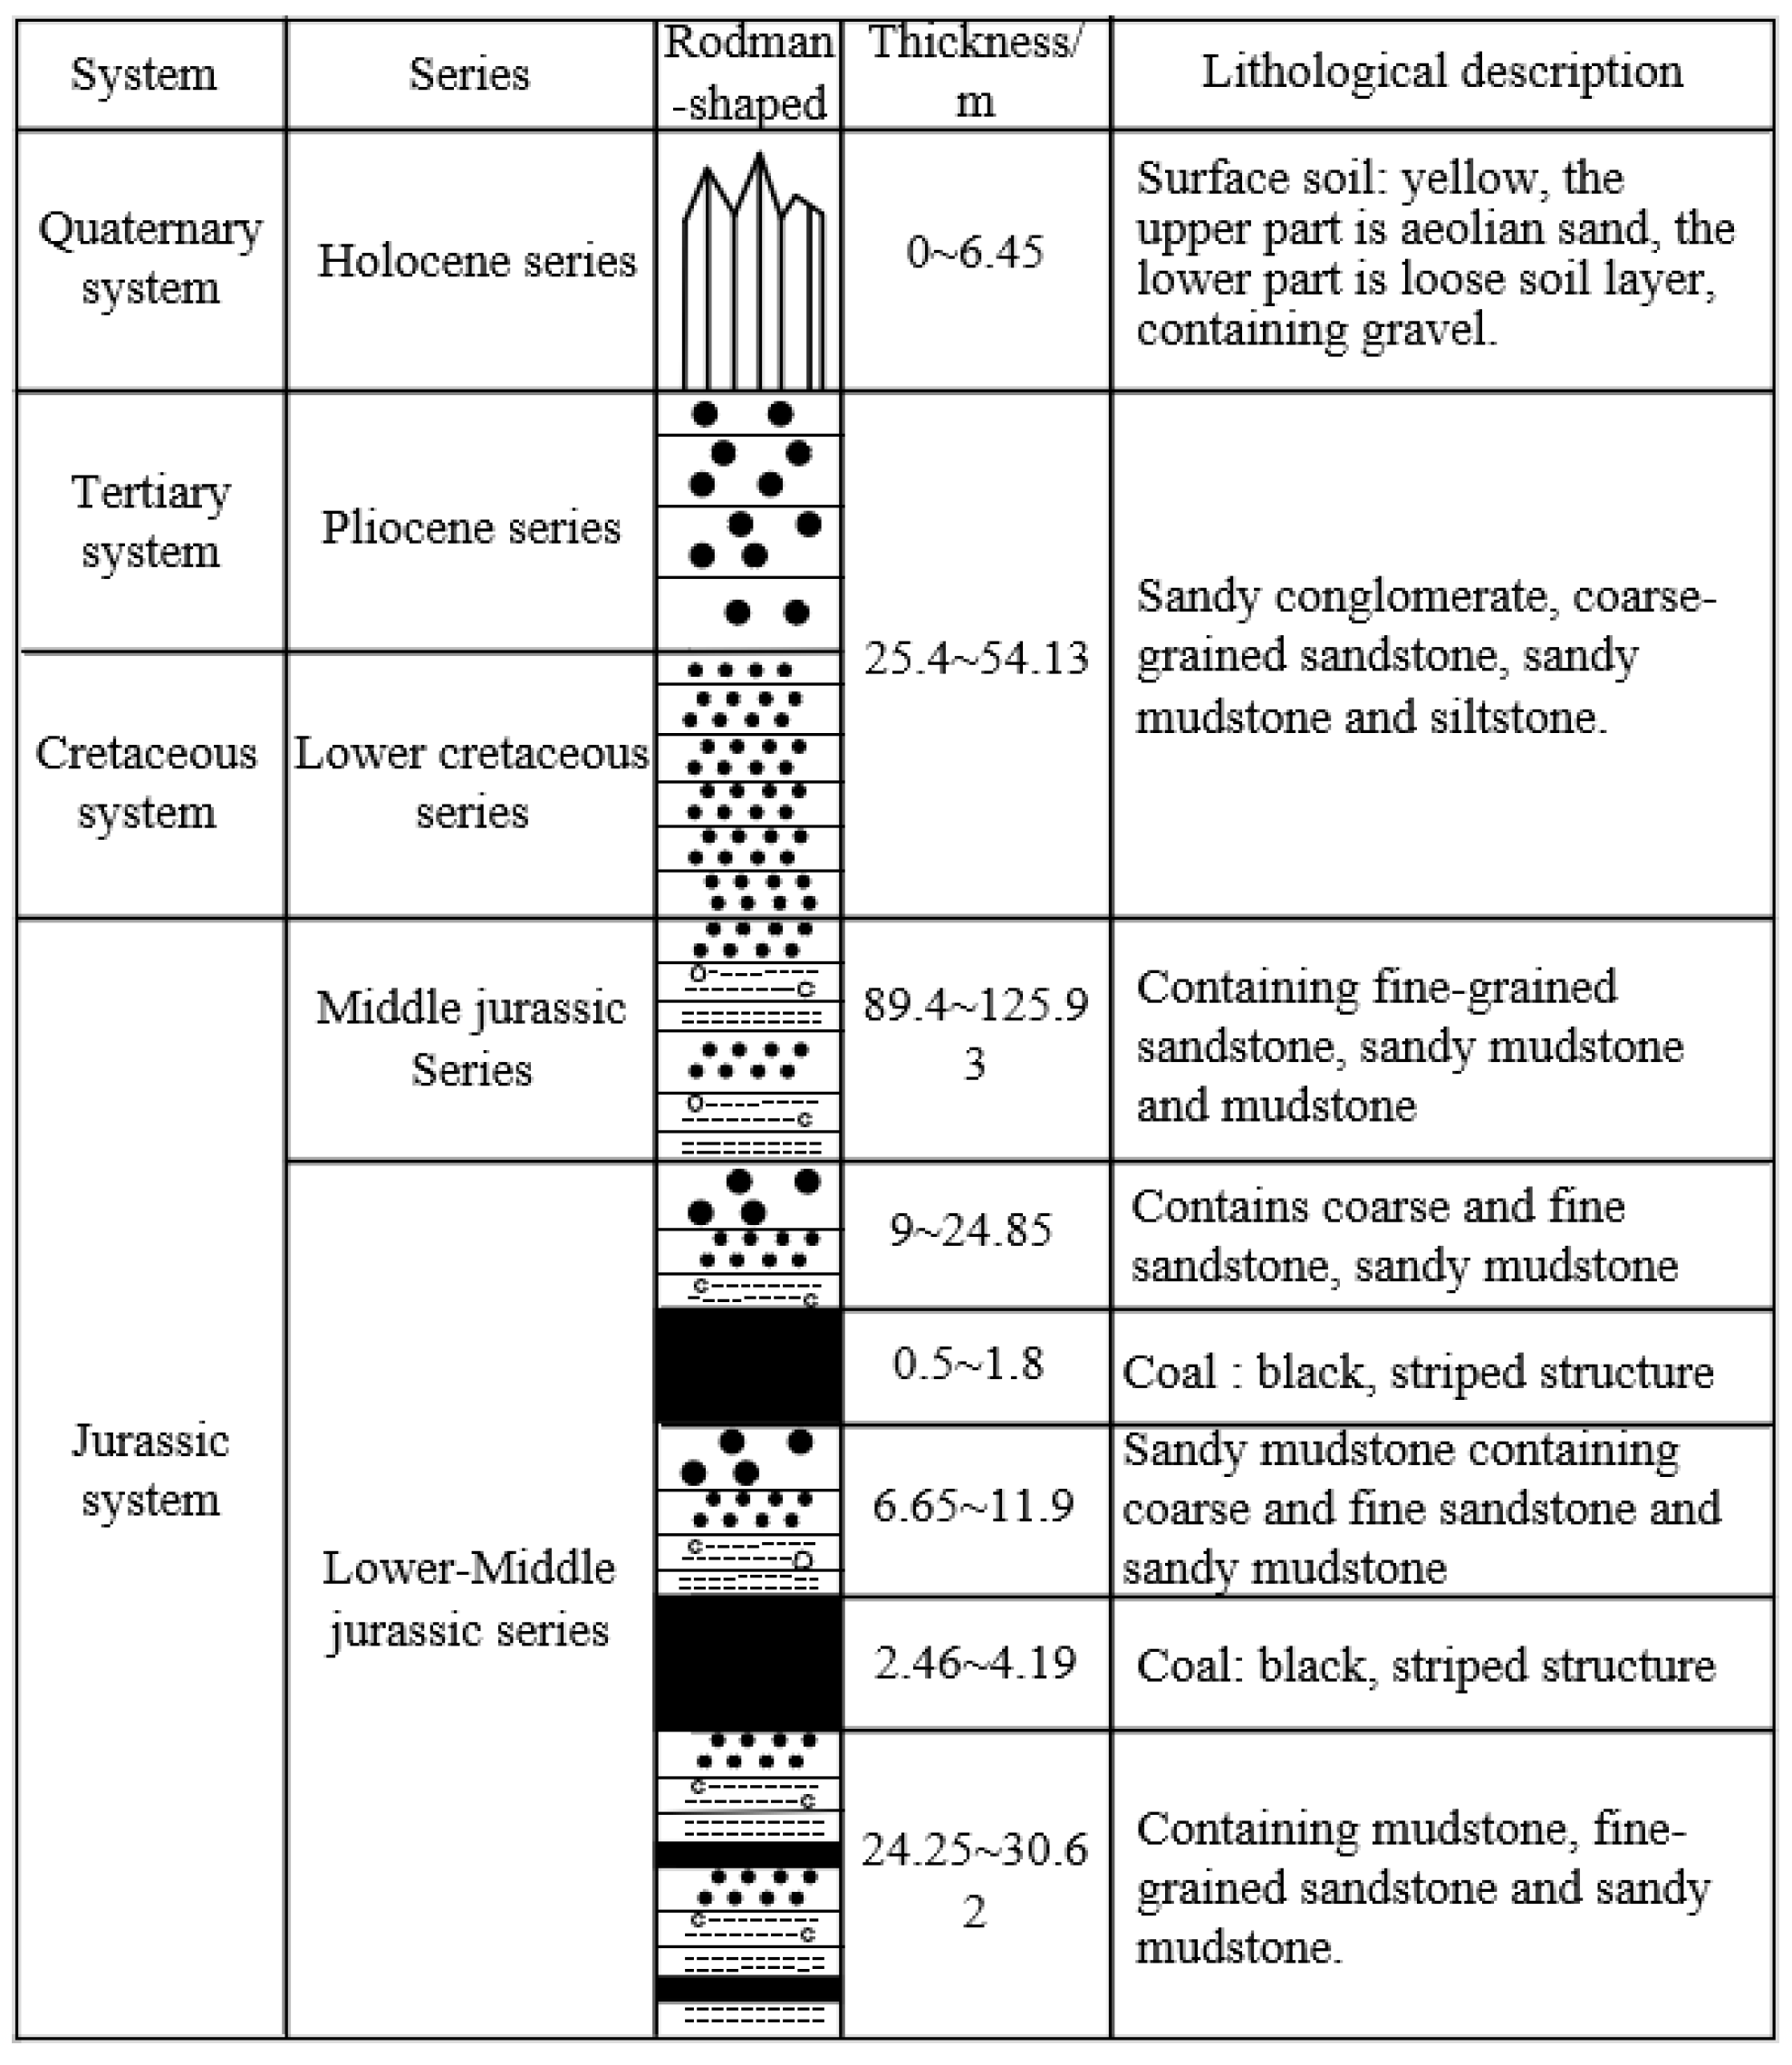
2.1. Project Overview
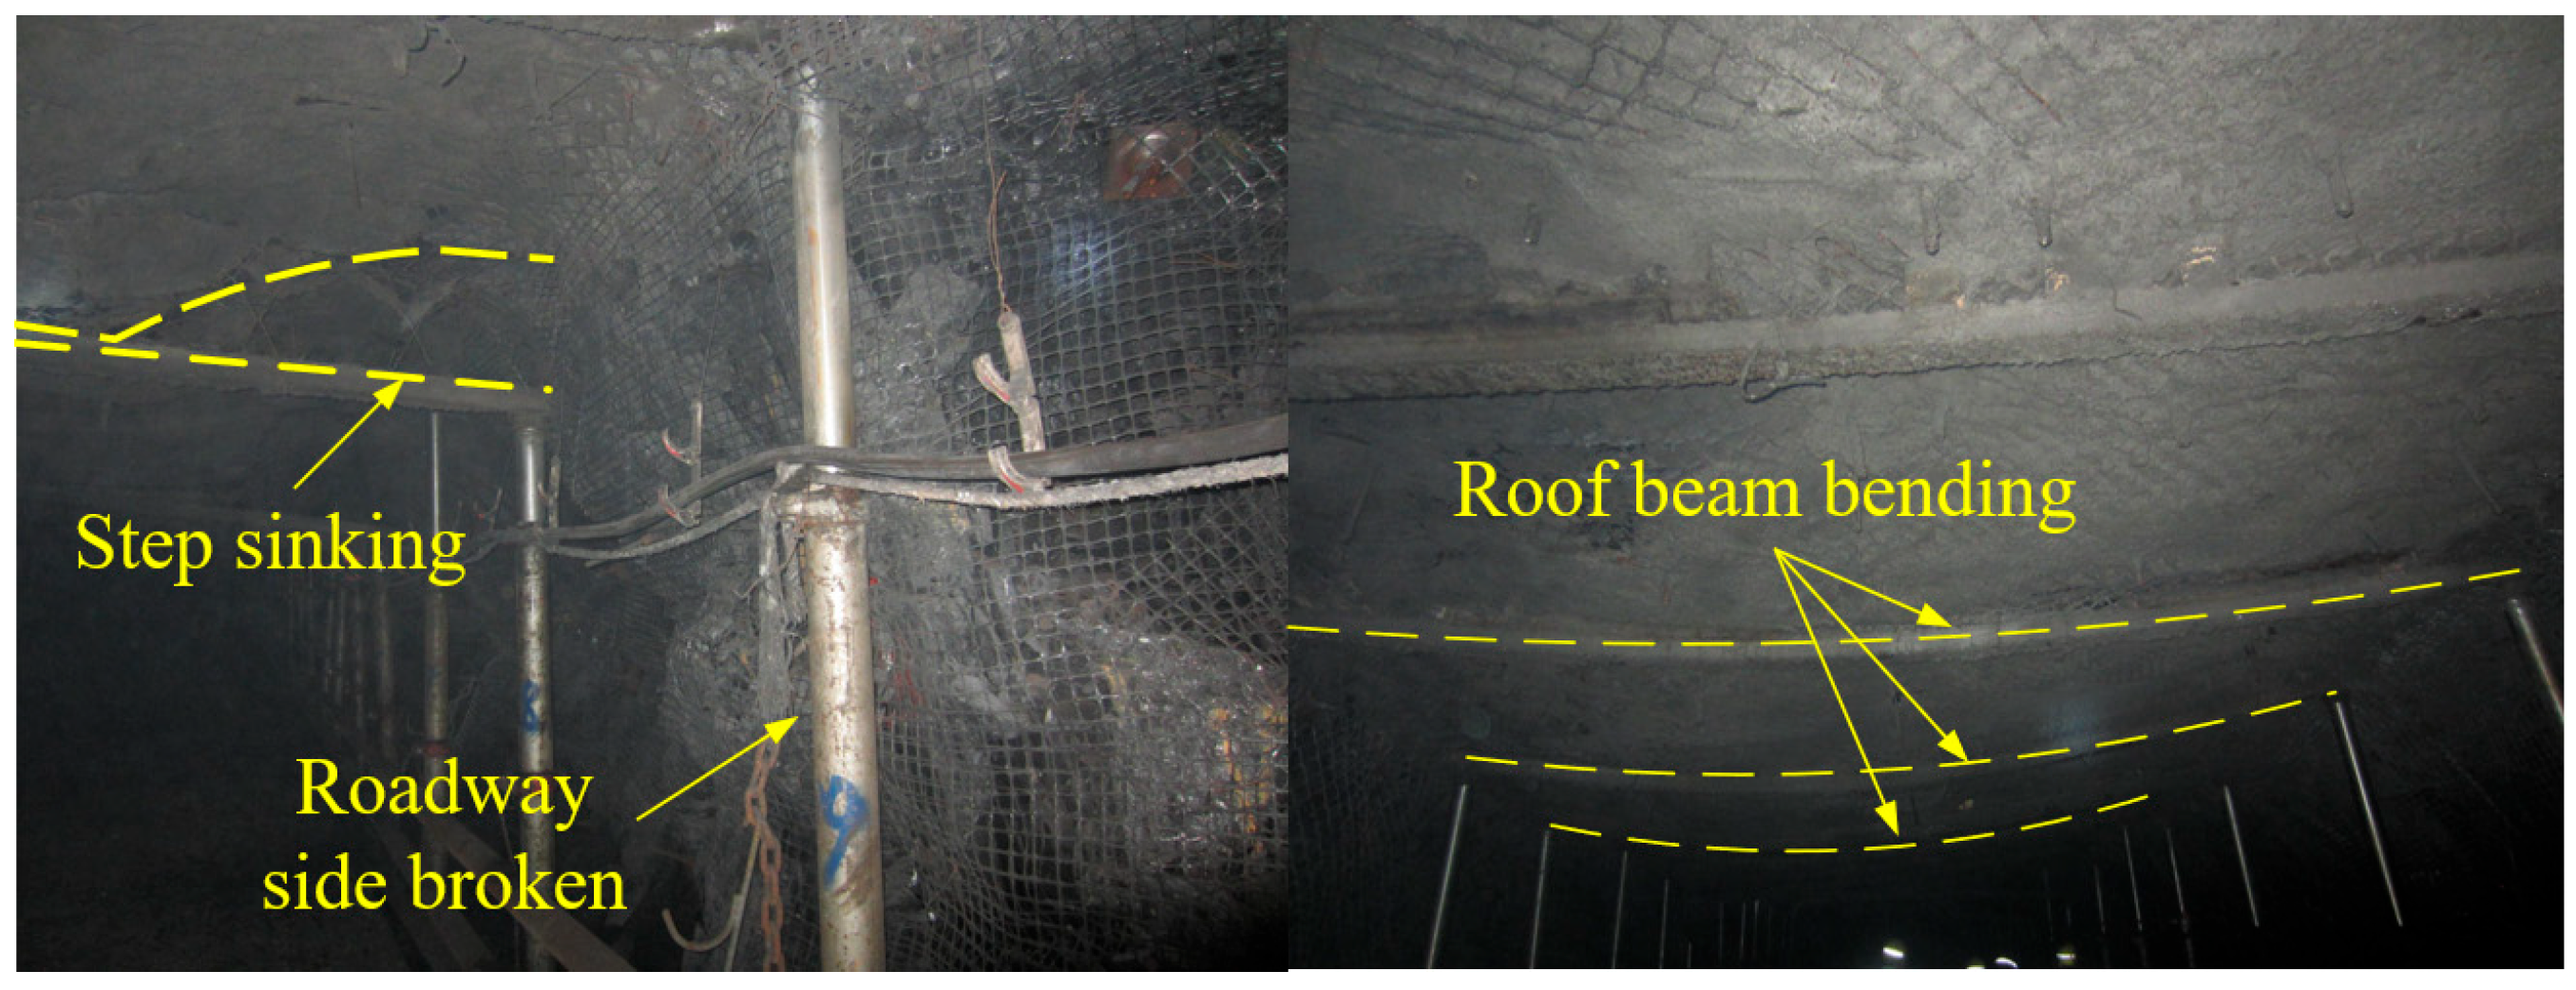
2.2. Deformation and Failure Characteristics of Roadway
3. Development of Weakly Cemented Similar Materials
3.1. Similarity Criteria and Model for Weakly Cemented Materials
3.2. Material Selection and Similarity Ratio Determination
4. Test Scheme and Process
4.1. Orthogonal Test Design
4.2. Sample Preparation and Testing Process
4.2.1. Sample Preparation and Testing Procedure
- (1)
- Material preparation: Raw materials were prepared in line with the proportions specified in Table 2.
- (2)
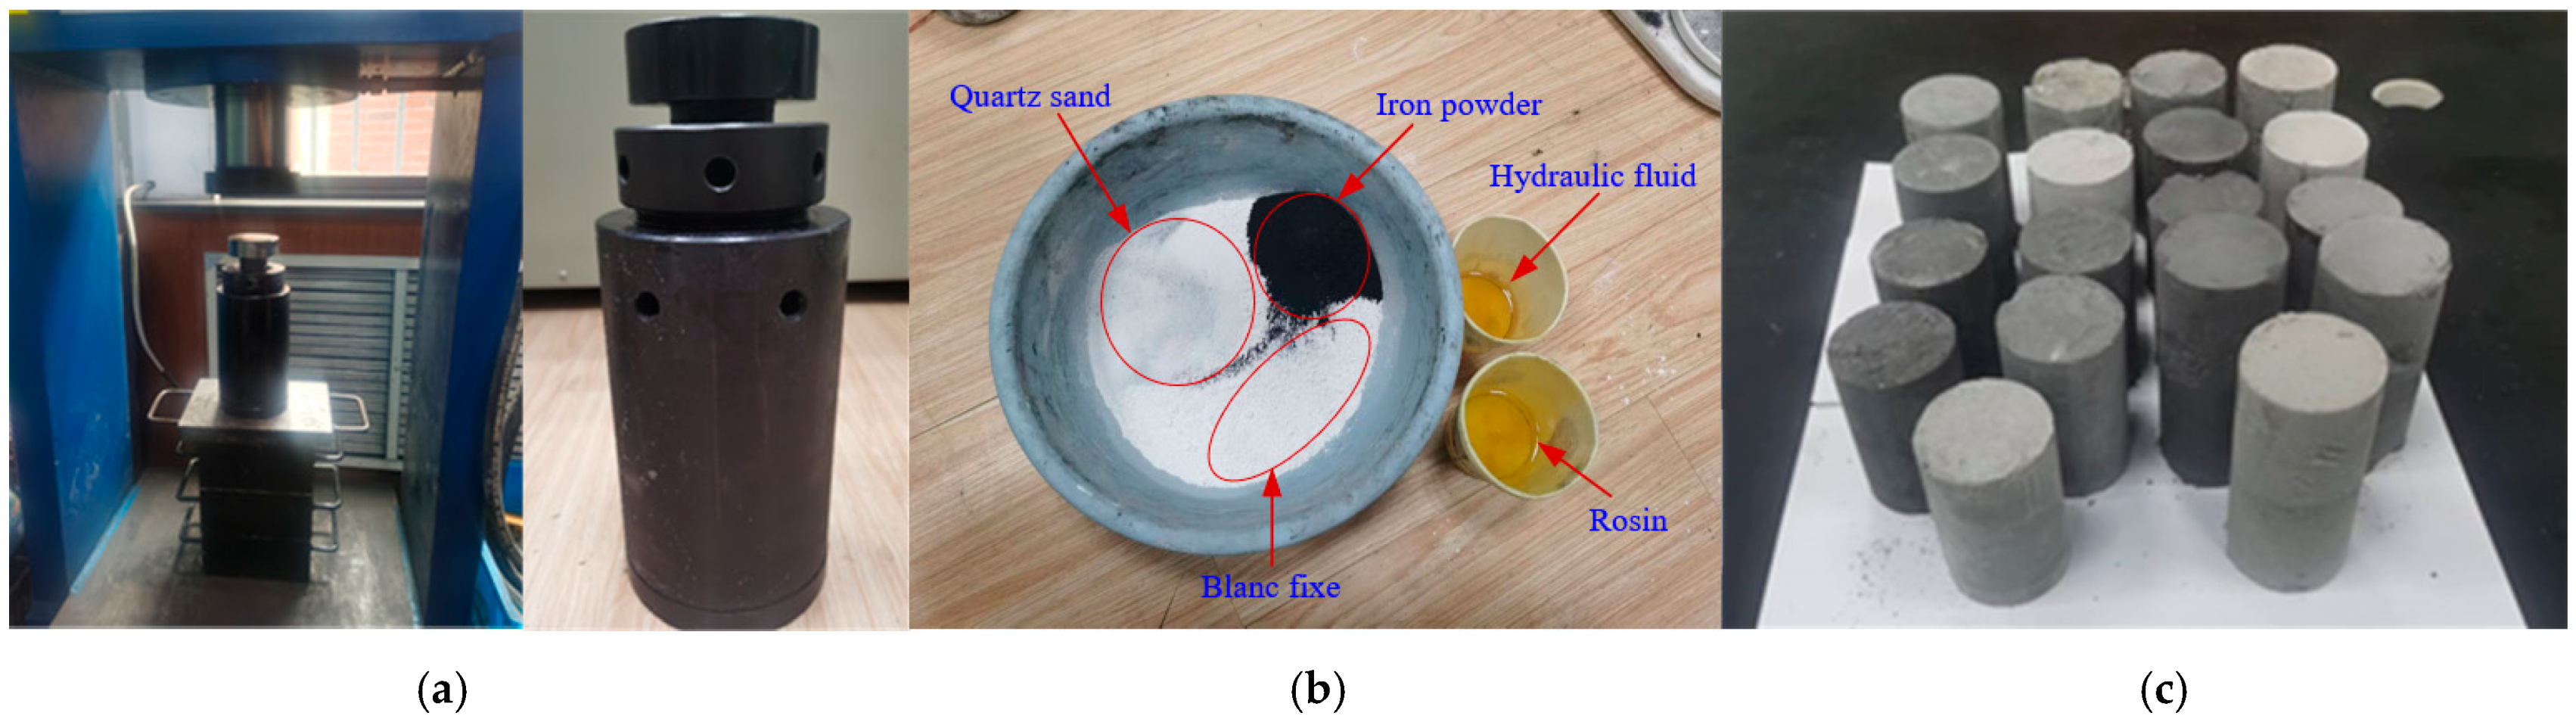
- Mold preparation: Pre-compression is essentially ascribable to the special characteristics of the materials adopted in this test and the relatively low strength of the prepared samples. Conventional soil sample molds would have resulted in demolding difficulties, rendering pre-compression unfeasible. Consequently, specially designed structured molds were employed, as depicted in Figure 4a.
- (3)
- Quartz sand, barite powder, iron powder, hydraulic oil, and rosin–alcohol solution were individually weighted. Afterward, the measured aggregates were combined in a container for mixing. After thorough mixing, the rosin–alcohol solution was added sequentially. Once the solution had been fully absorbed, hydraulic oil was incorporated, and the mixing process continued. After completion, the mixture was set aside for later use, and the mold walls were lubricated with silicone oil, as displayed in Figure 4b.
- (4)
- The mixed material was loaded into the newly designed mold cavity, and manual compaction was carried out. The compacted material volume was controlled to approximately 120% of that of the specimen.
- (5)
- Pressing: The mold plunger was installed, and pressure was applied using an electro-hydraulic press, allowing the formation of standard specimens for rock mechanics testing.
- (6)
- Demolding: The mold plunger was installed, and pressure was applied using an electro-hydraulic press, facilitating the formation of standard rock mechanics test specimens.
- (7)
- As indicated by Z in Table 2, a total of 9 test groups were conducted. Each group consisted of 4 specimens: 3 specimens for uniaxial compression tests and 1 specimen for uniaxial creep tests.
- (8)
- The specimens were numbered and cured under room-temperature and dry conditions for 10 days, allowing the alcohol to fully evaporate. The cured specimens are illustrated in Figure 4c.
- (1)
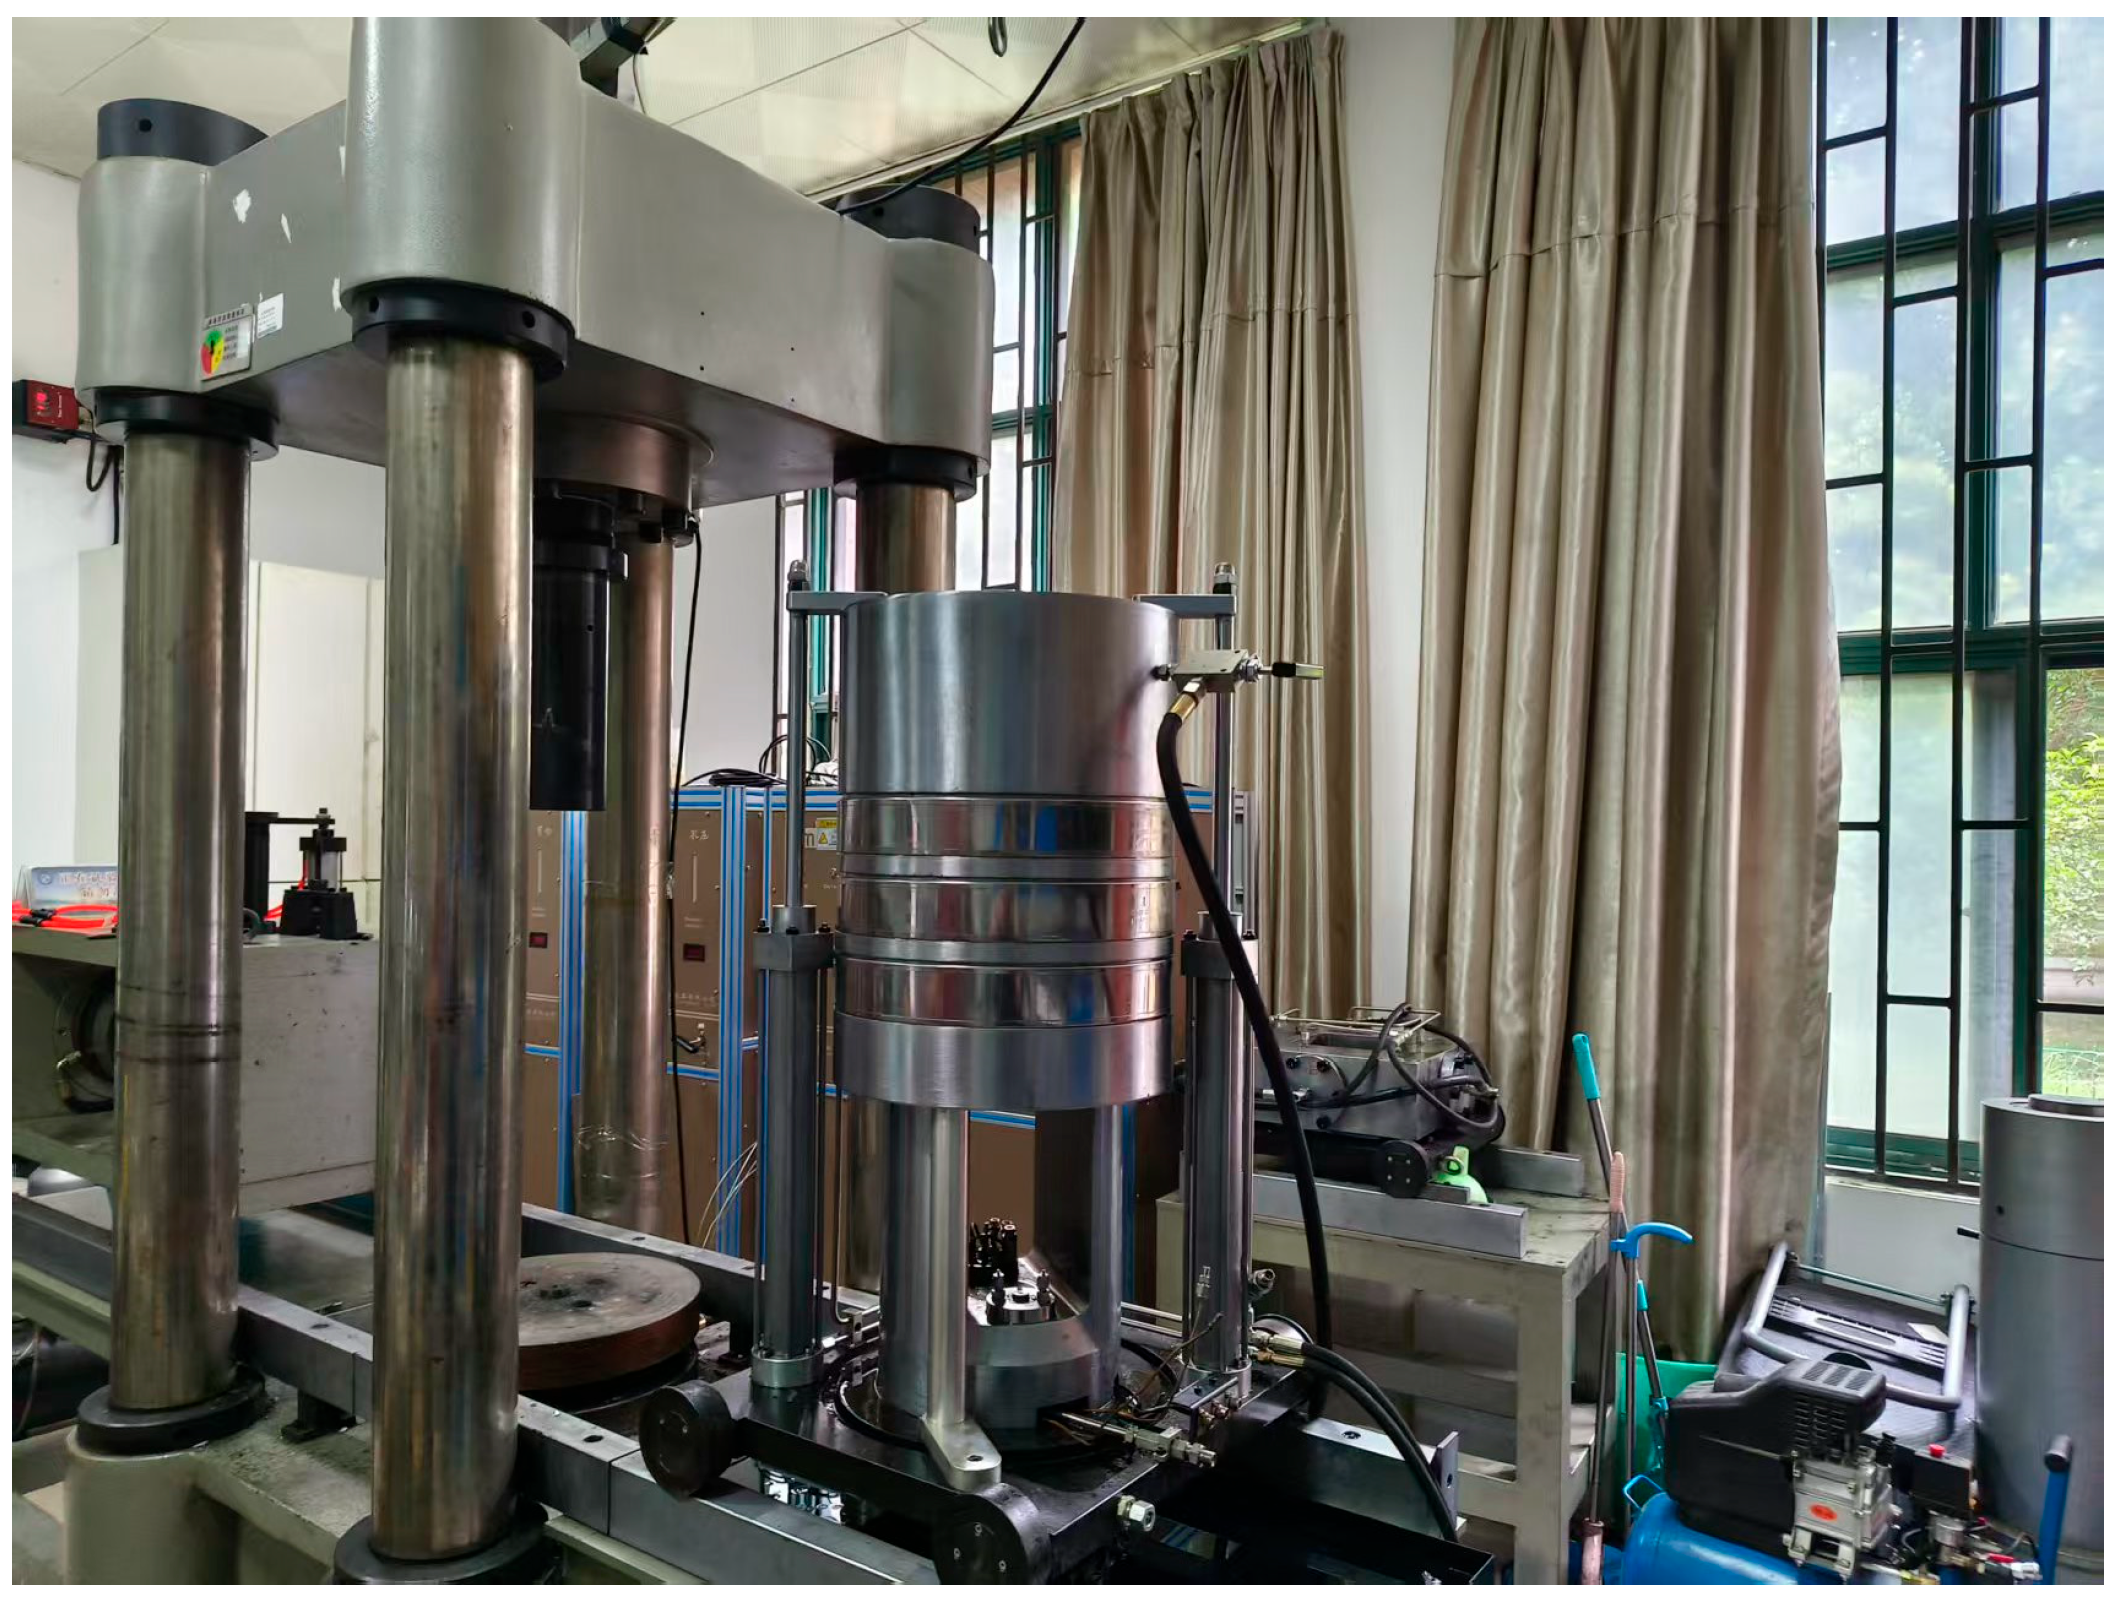
- The prepared similar material specimen was positioned at the center of the pressure head of the testing machine, and a circumferential extensometer and axial strain gauge was attached to it.
- (2)
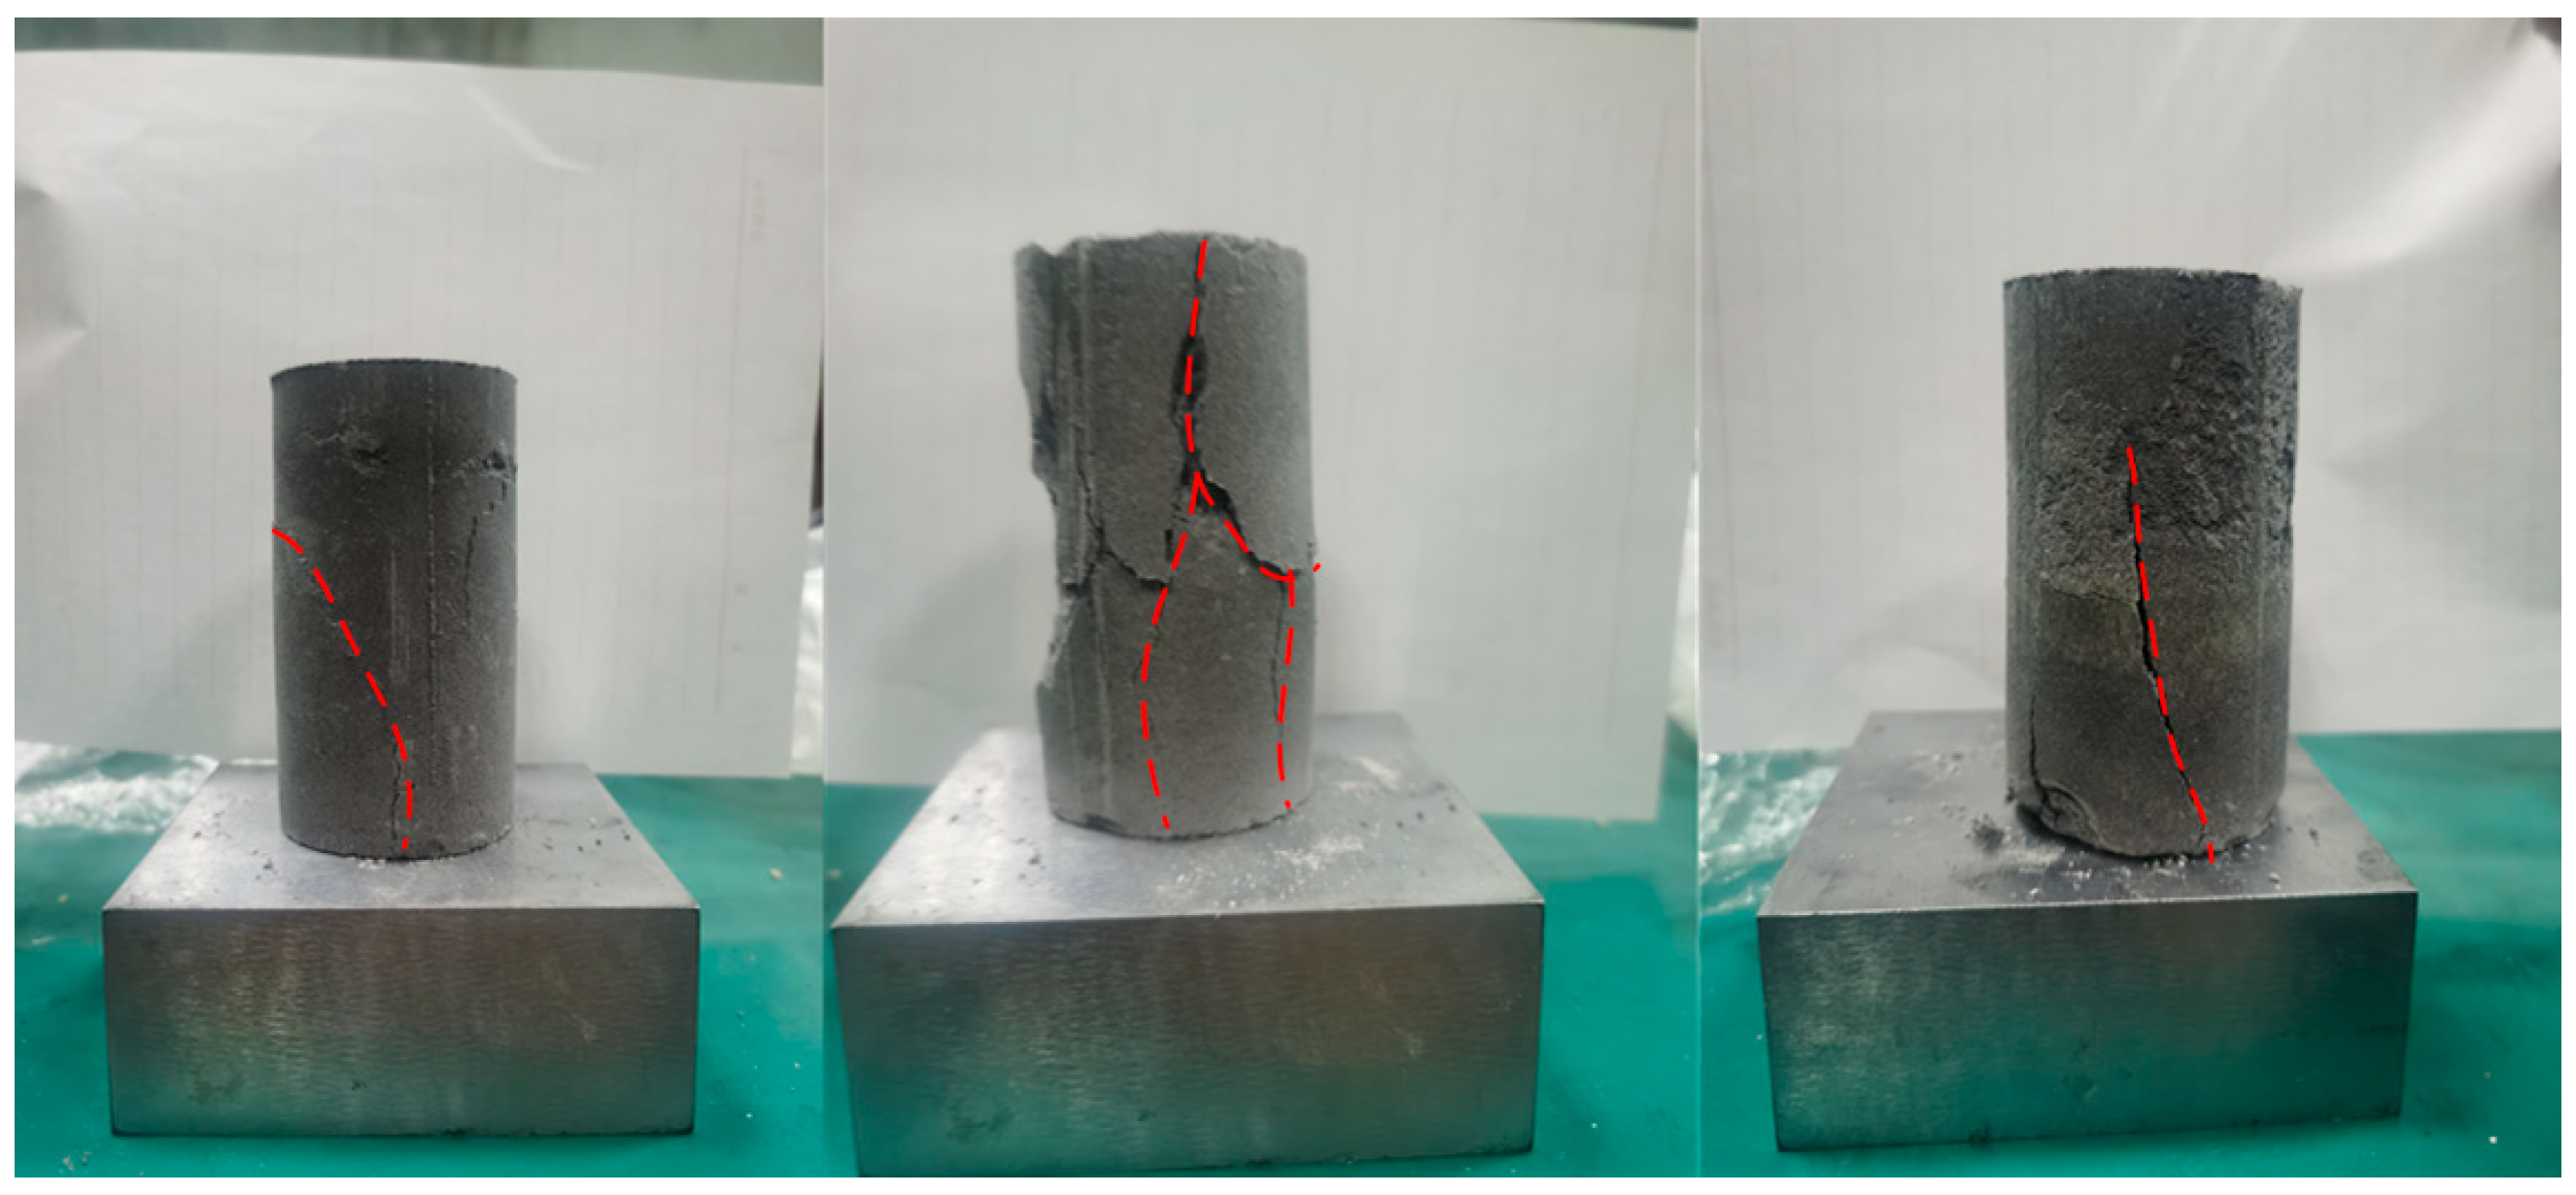
- Loading began at a displacement-controlled rate of 0.05 mm/s until specimen failure occurred.
- (1)
- The prepared similar material specimen was placed at the center of the testing machine’s pressure head, and an axial strain gauge was attached to it.
- (2)
- Loading began at a stress-controlled rate of 0.001 MPa/s until the specimen failed.
4.2.2. Physical Test Results and Analysis
- (a)
- Conventional Physical Test Results and Analysis
- (b)
- Results and Analysis of Uniaxial Creep Tests
5. Model Test
5.1. Model Design
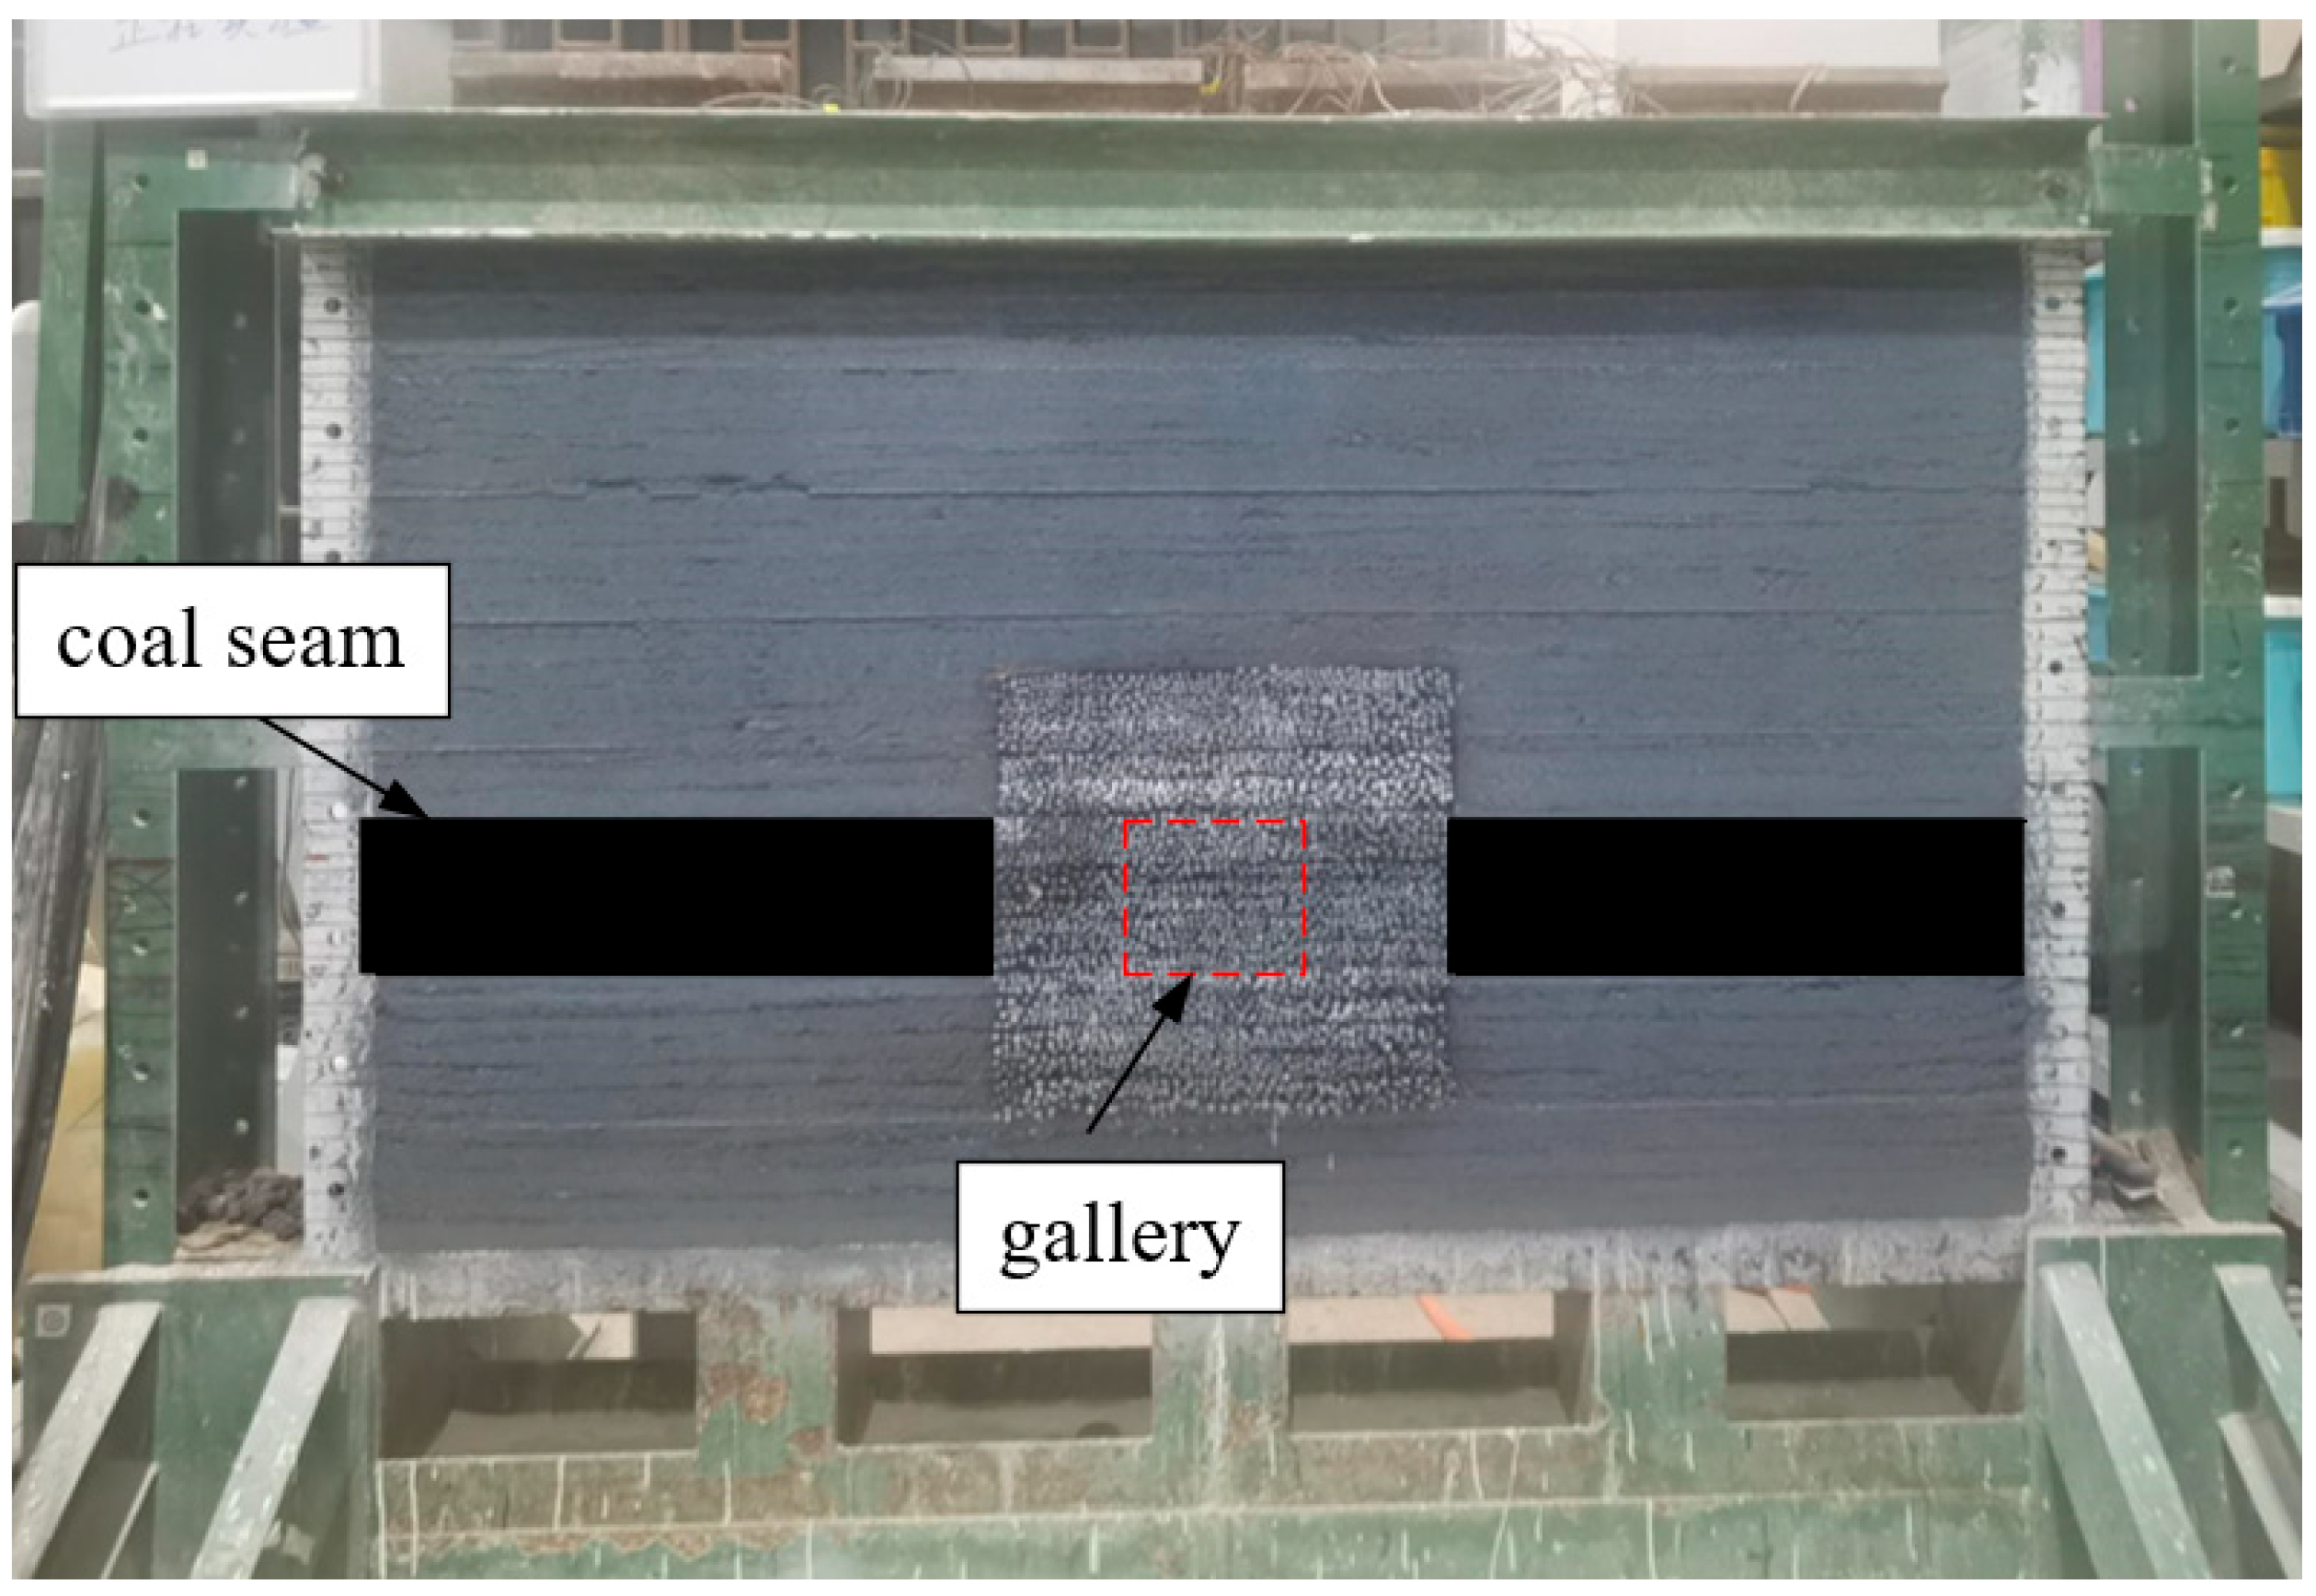
5.2. Test Process and Monitoring
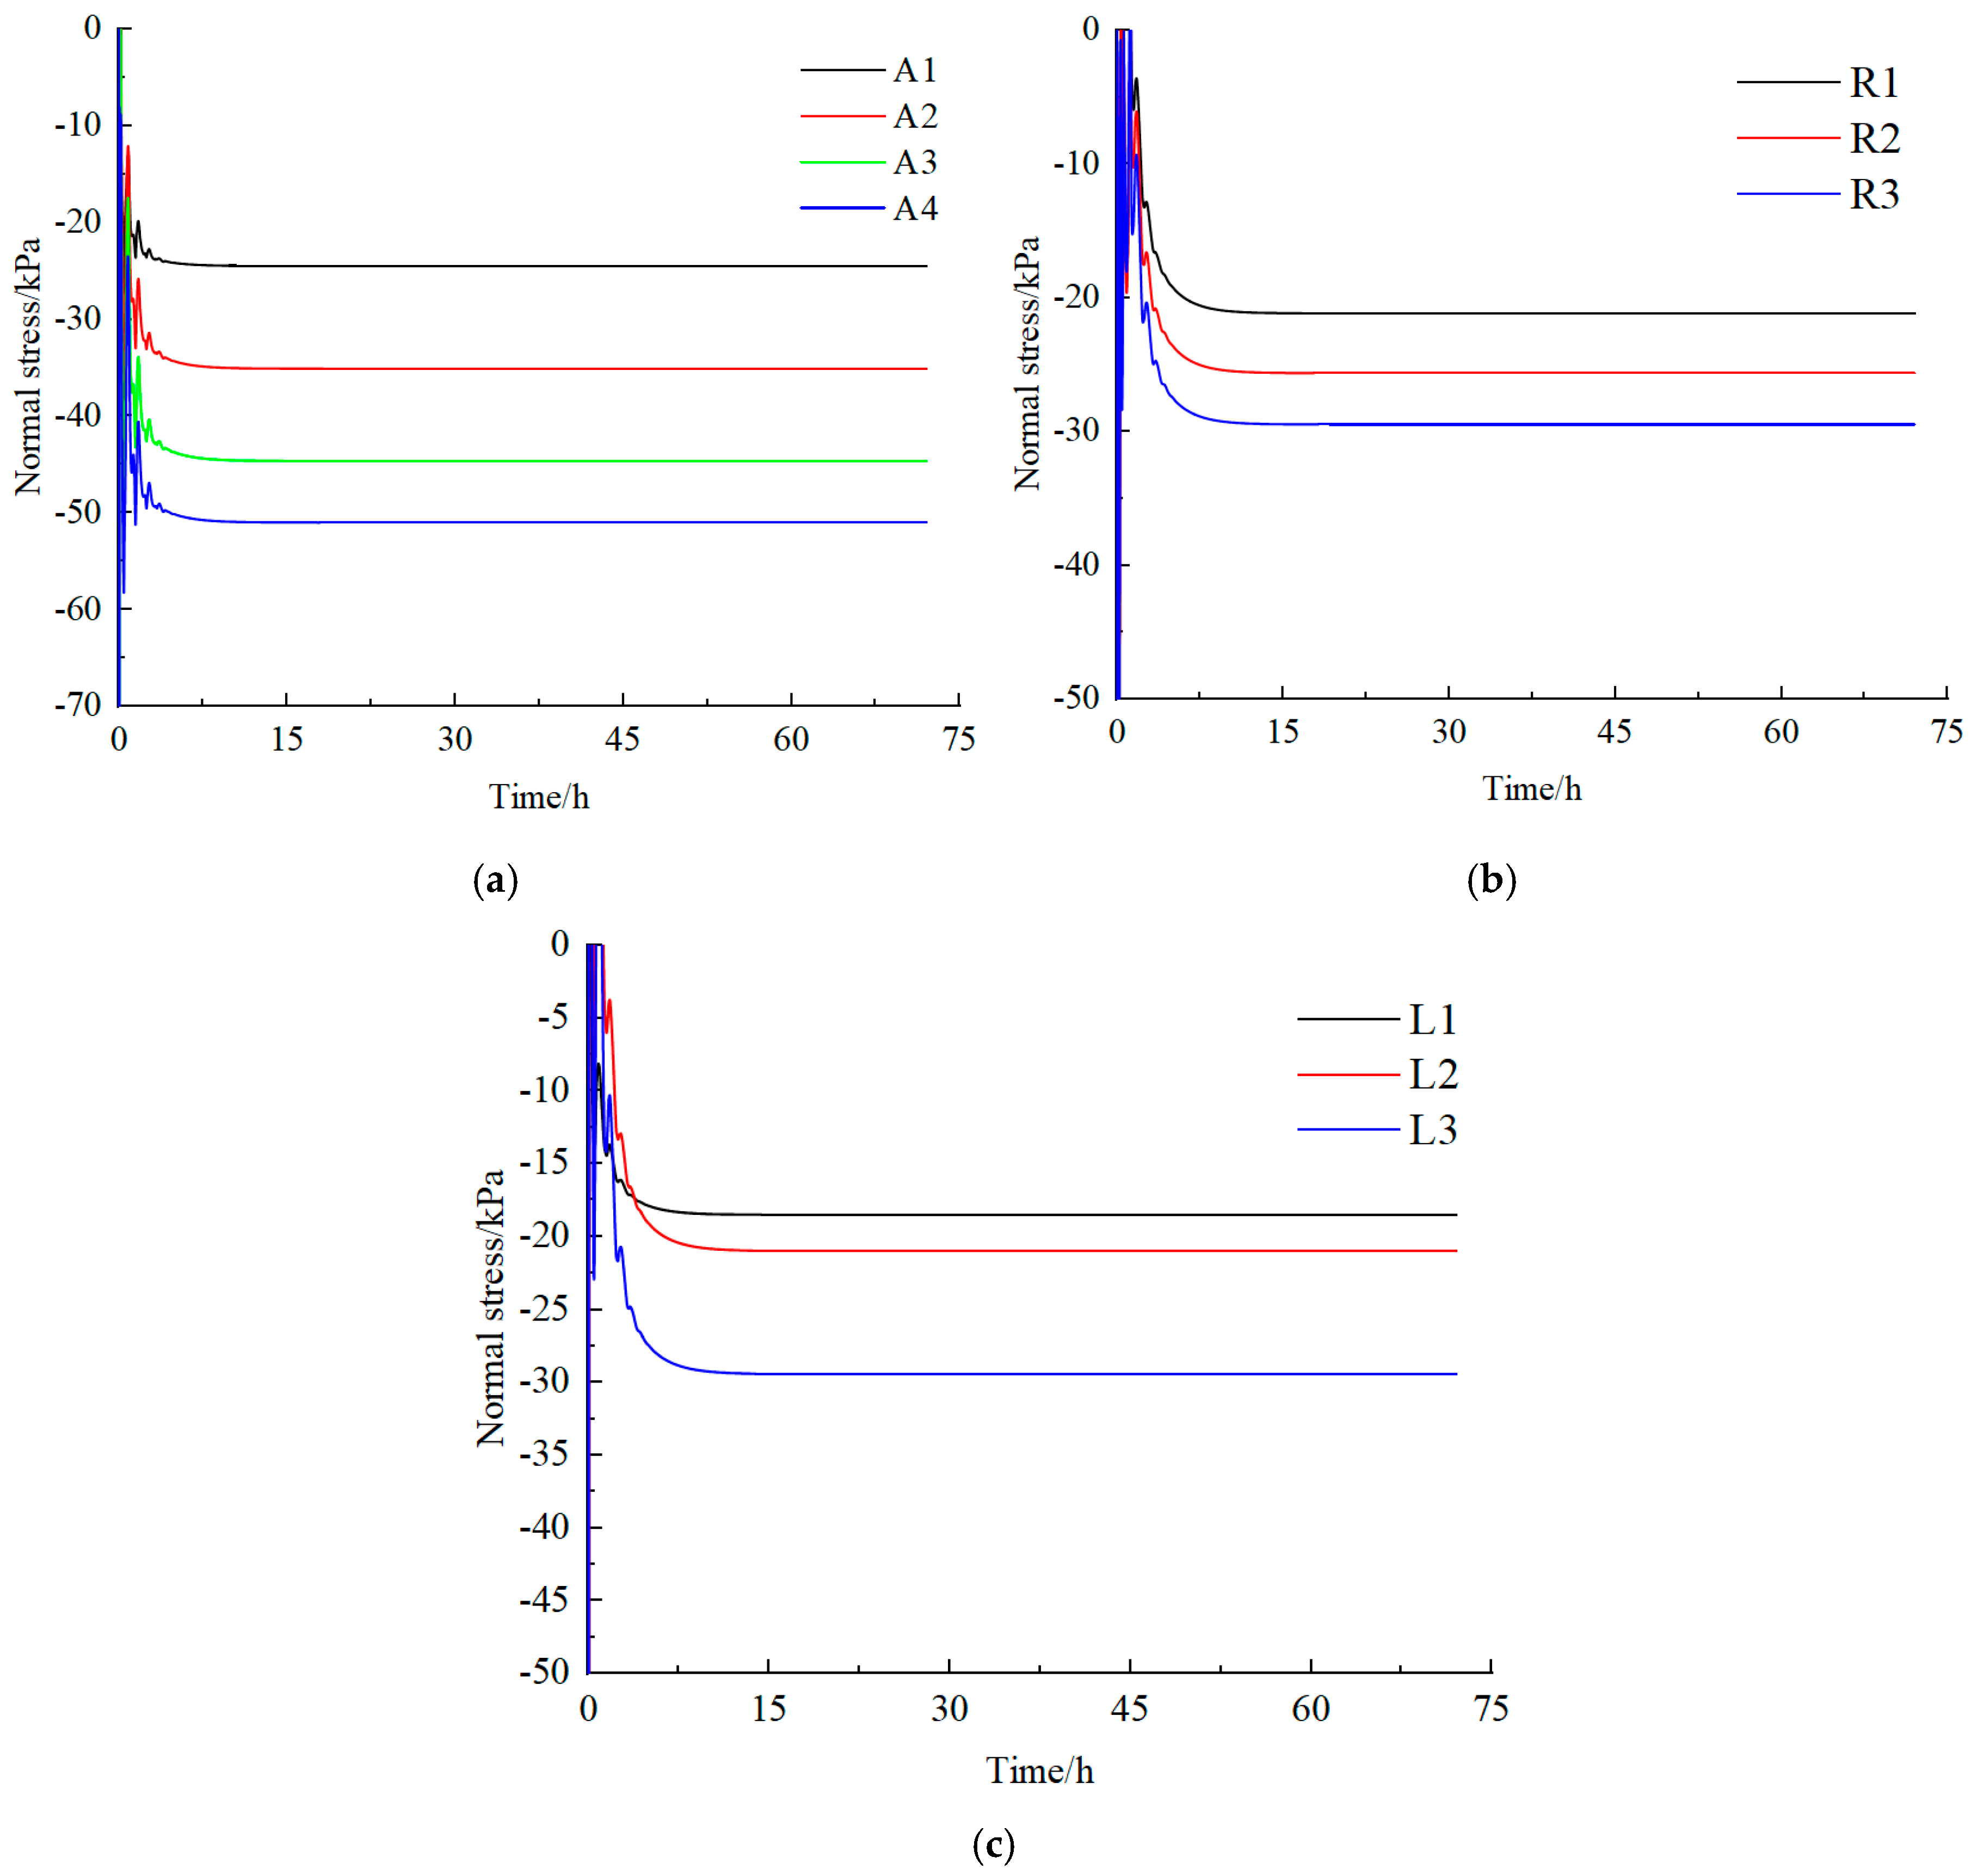
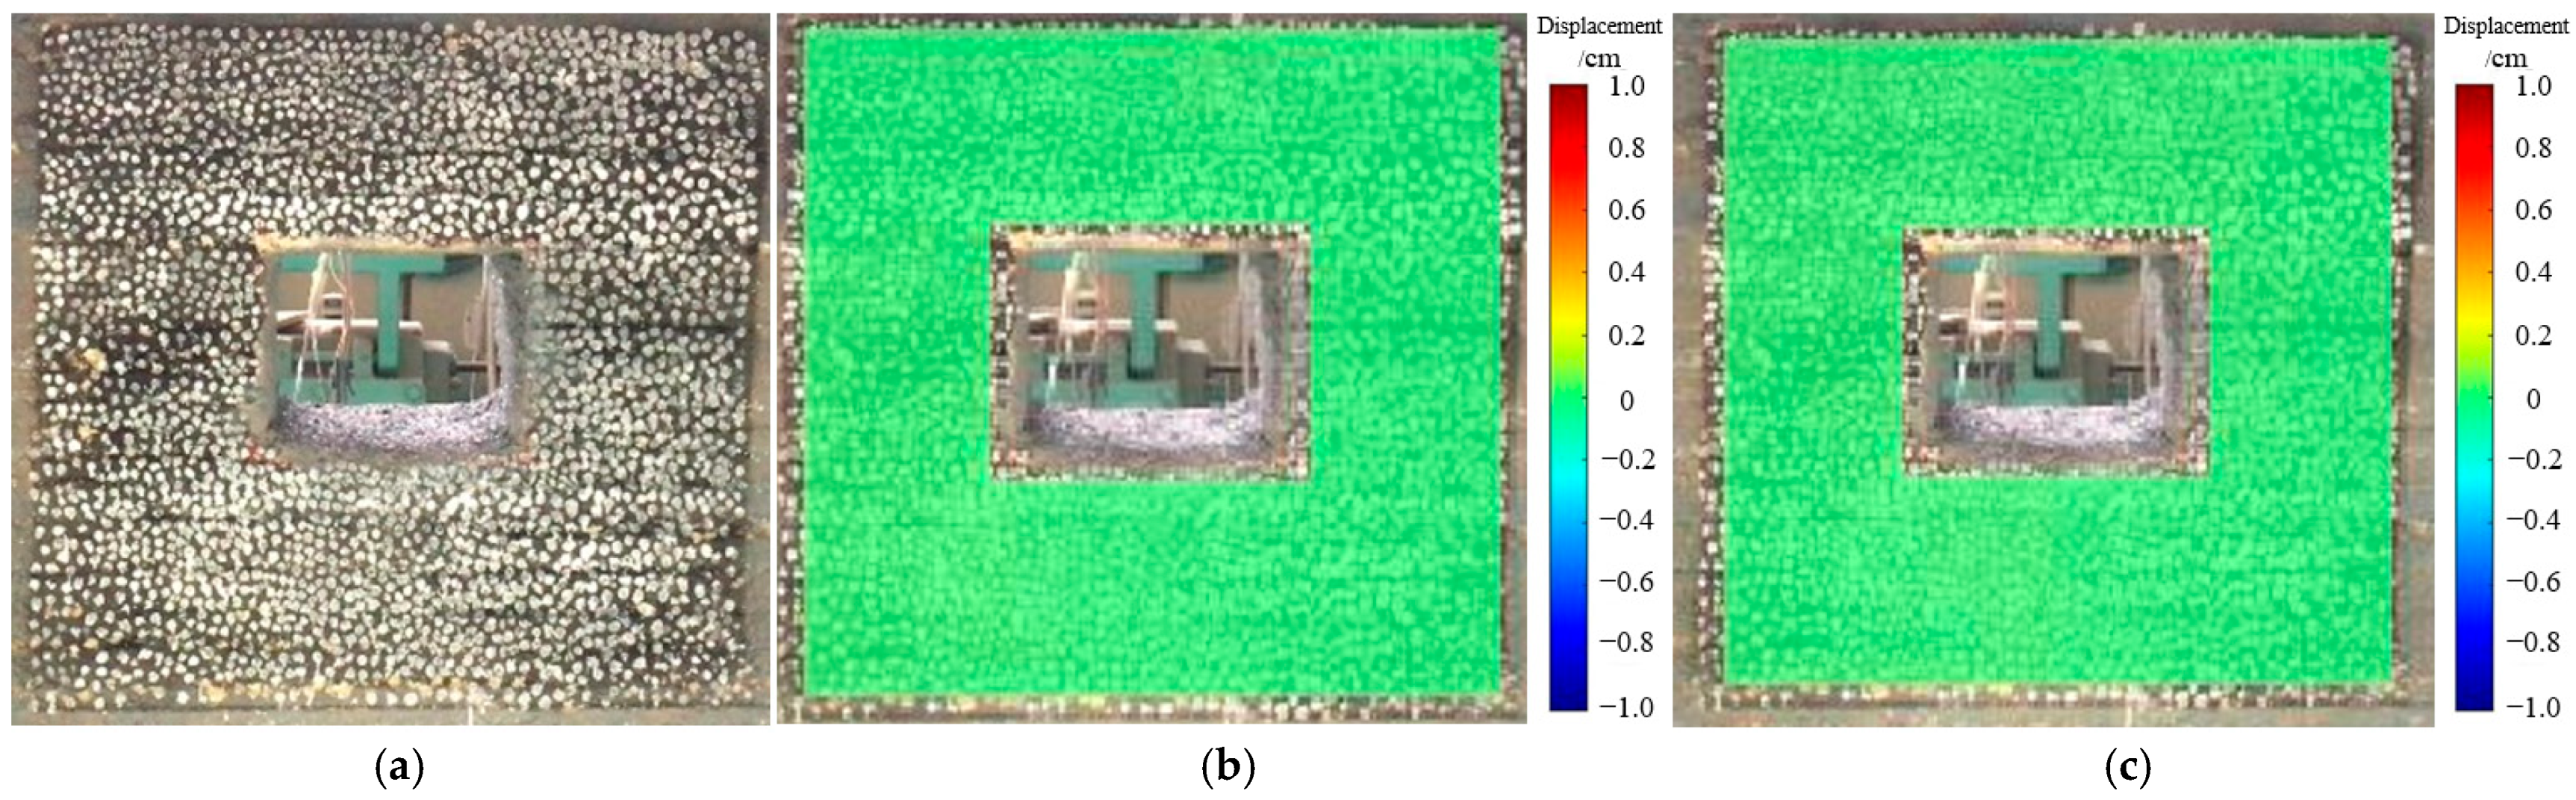
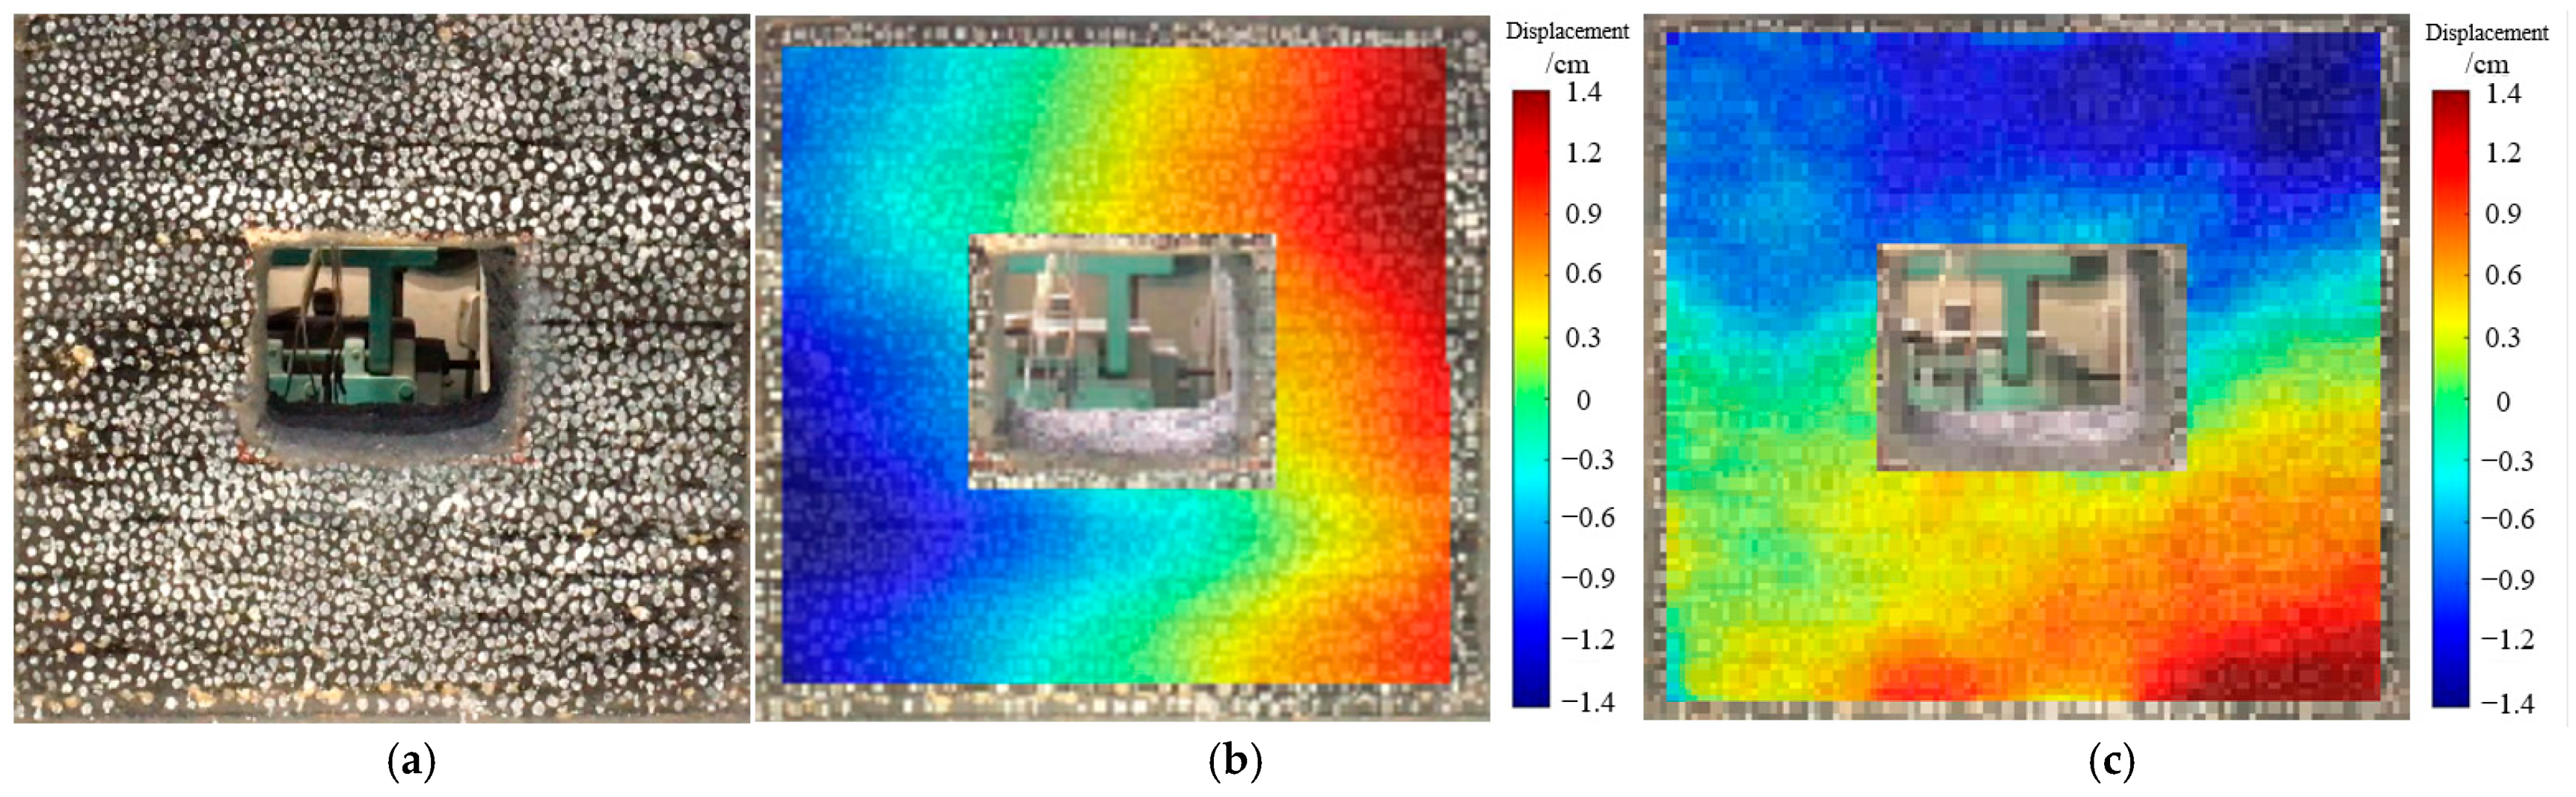
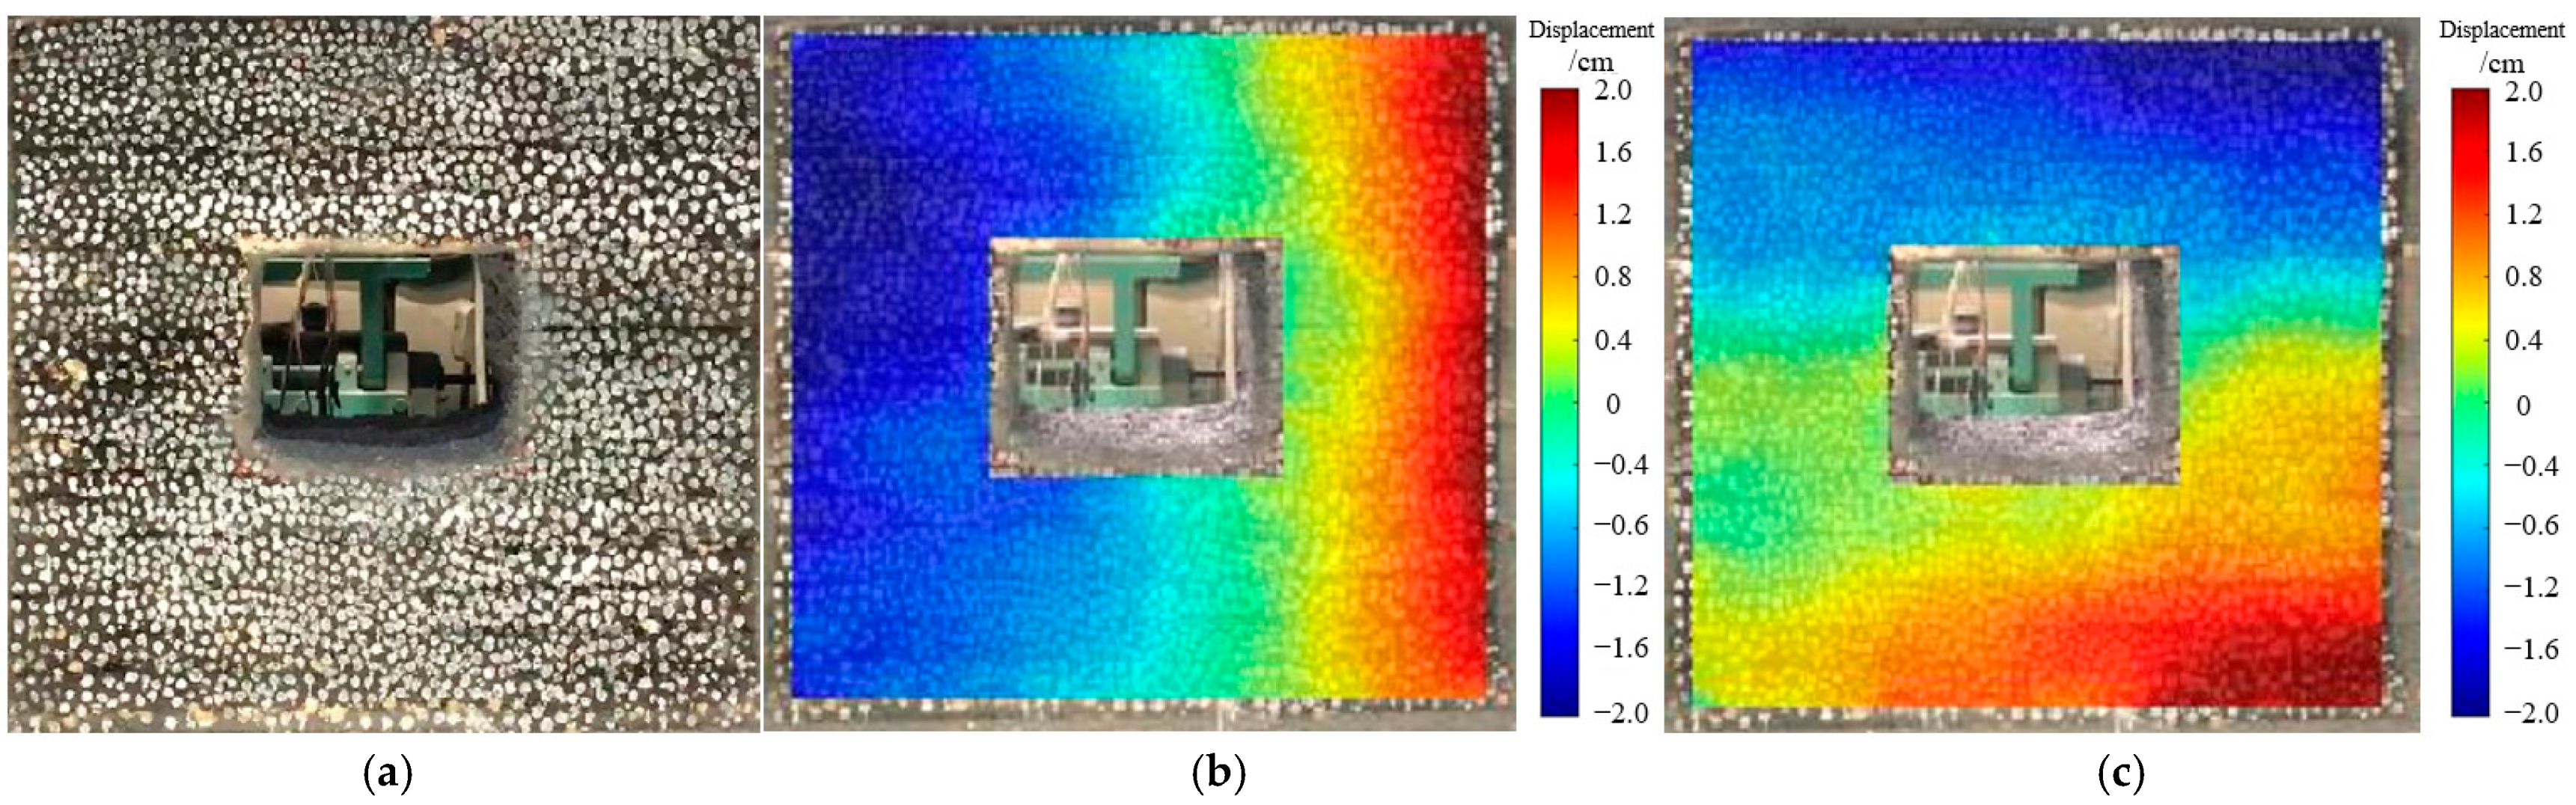
5.3. Analysis of Physical Model Test Results
- (1)
- Evolution Law of Weakly Cemented Soft Medium
- (2)
- Surface Deformation and Failure Patterns of Weakly Cemented Soft Medium
6. Conclusions
- (1)
- A similar material to simulate weakly cemented soft rock was successfully developed. The similar materials exhibited low strength and pronounced creep properties, making them particularly suitable for simulating weakly cemented medium in western mining areas. This methodology offers a brand new material selection option for conducting model tests on weakly cemented formation medium in these regions.
- (2)
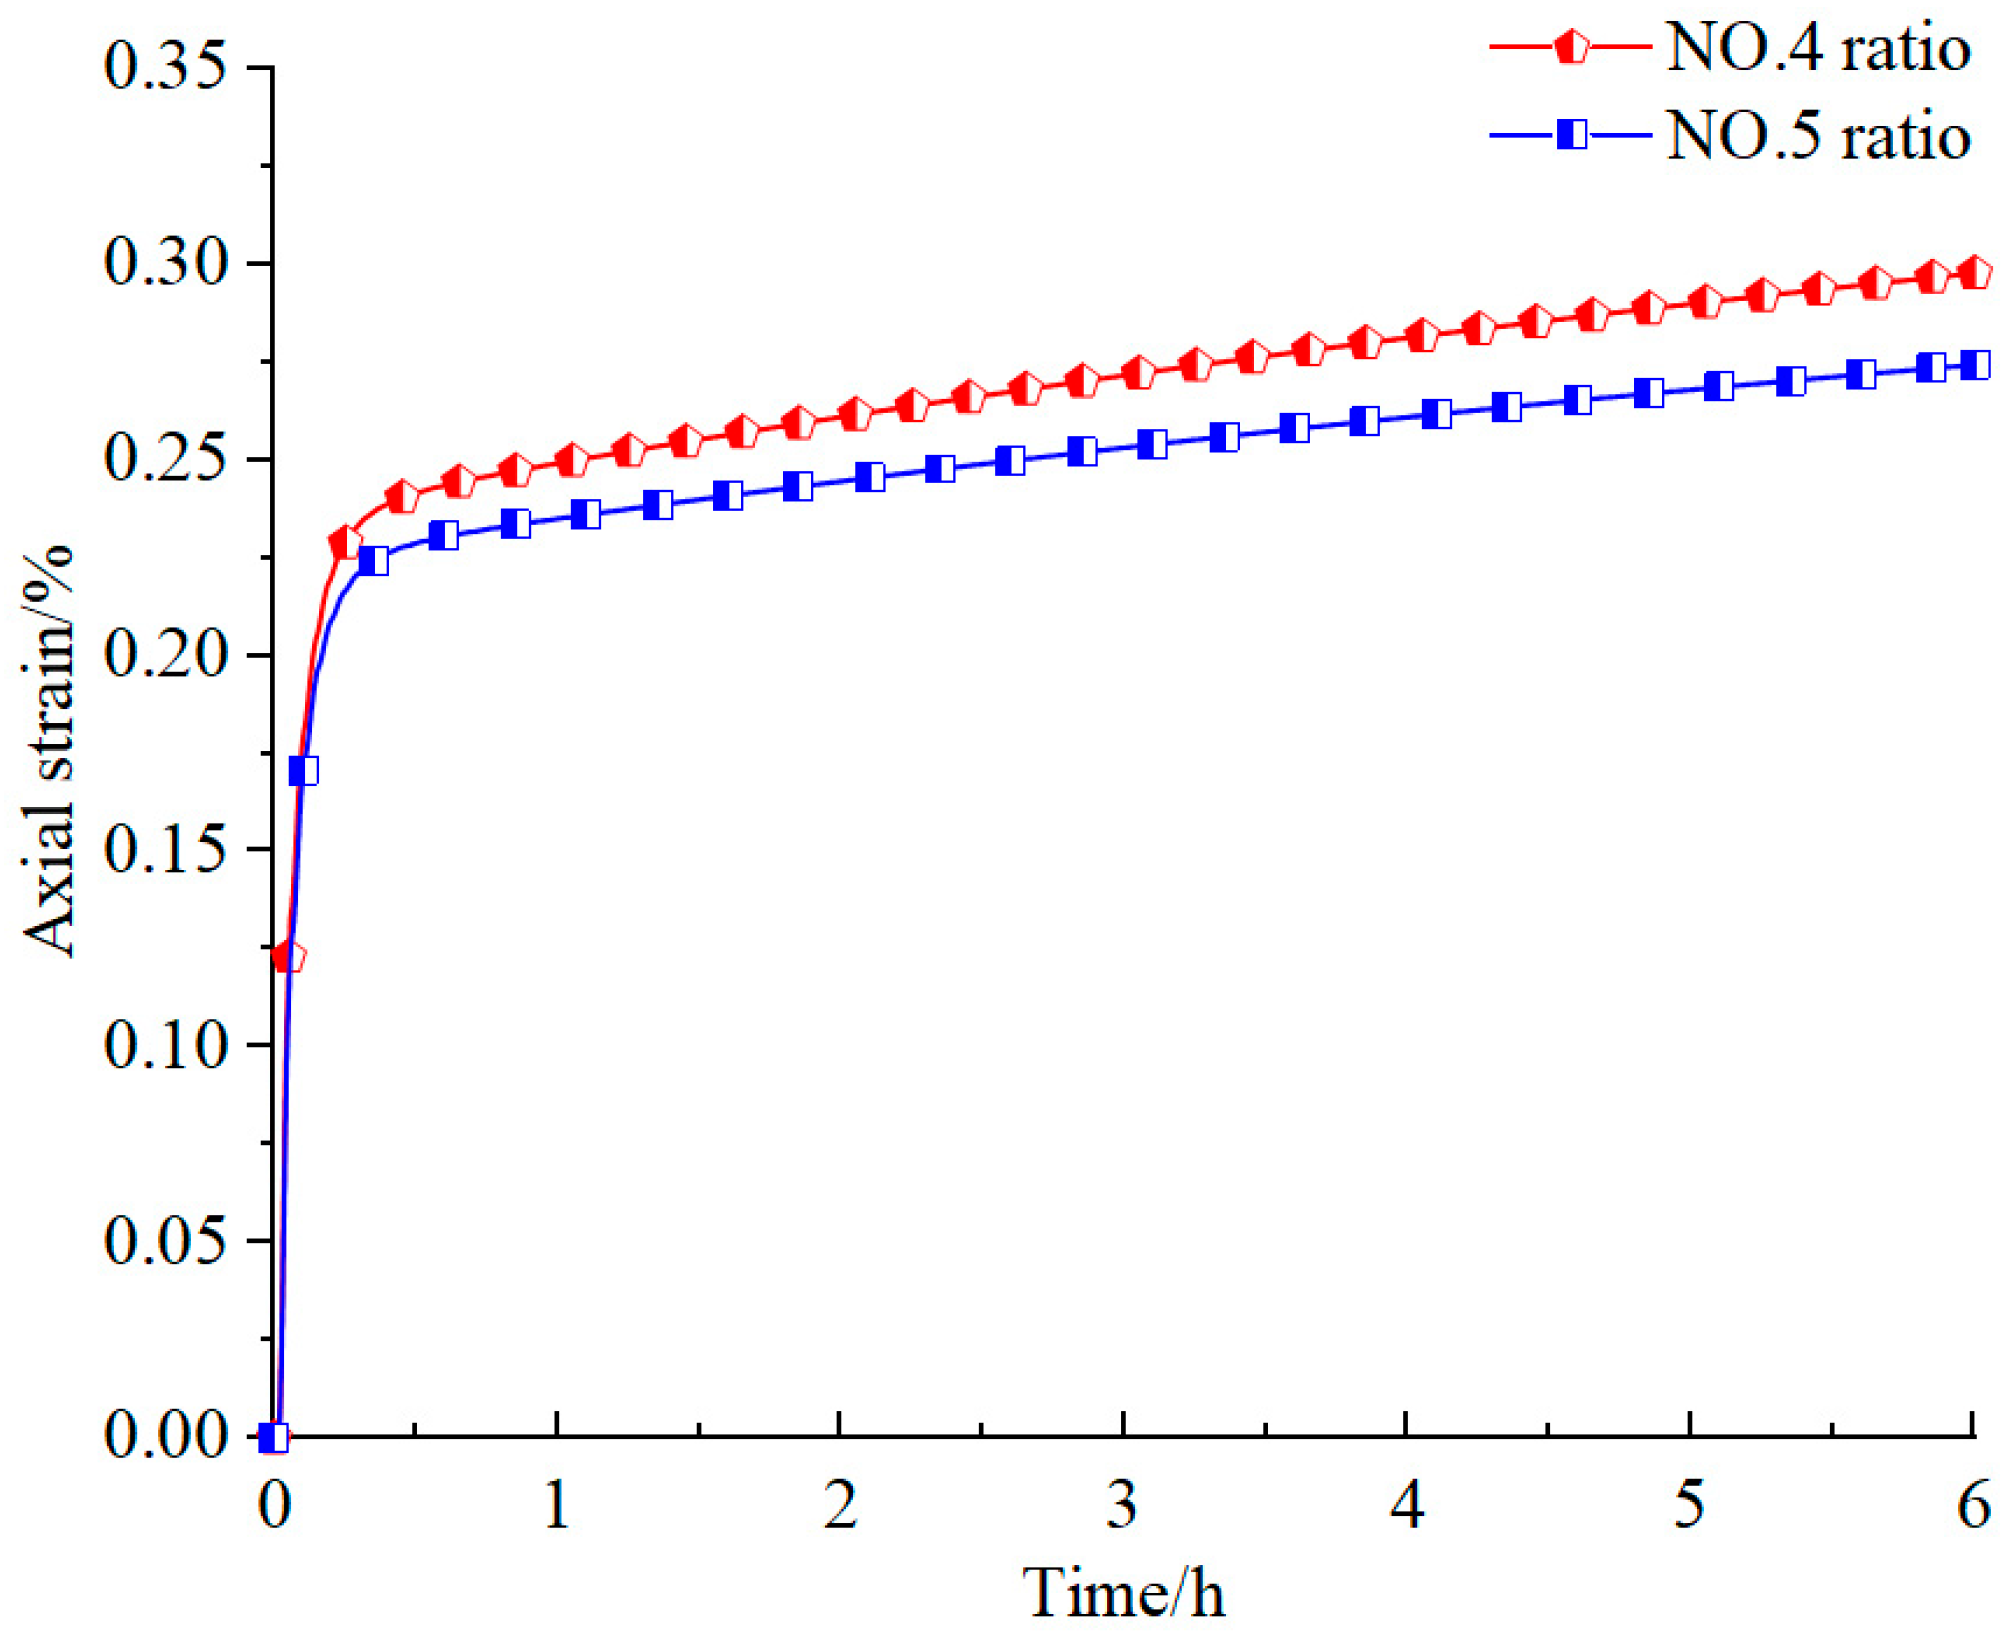
- The results from the orthogonal tests reveal that the concentration of rosin–alcohol solution significantly influenced critical parameters, such as the σc, E, and γ of the weakly cemented similar material specimens. Creep tests on specimens 4 and 5 demonstrated that as the proportion of iron powder (I) and barite powder (B) increased, the creep characteristics of the specimens progressively weakened.
- (3)
- When this similar material was employed in the similarity model test to evaluate the surrounding rock stability of the auxiliary transportation roadway in Panel 20314 of the Gaojialiang Coal Mine under long-term stratum load, the test results indicate that approximately 10 h after excavation, the stress measured at the roof and sidewall monitoring points gradually slowed and eventually stabilized. As the excavation continued, the surrounding rock deformation transitioned from a sharp increase to gradual stabilization, shifting from a symmetrical to an asymmetrical distribution. This indicates that under the combined influence of concentrated load and creep load, the surrounding rock of the roadway underwent creep deformation. Both the conventional mechanical properties and long-term creep characteristics of this material satisfied the test requirements, effectively simulating the long-term creep behavior of weakly cemented soft rock in shallow buried strata. This provided reliable material support for achieving favorable test results.
Author Contributions
Funding
Institutional Review Board Statement
Informed Consent Statement
Data Availability Statement
Conflicts of Interest
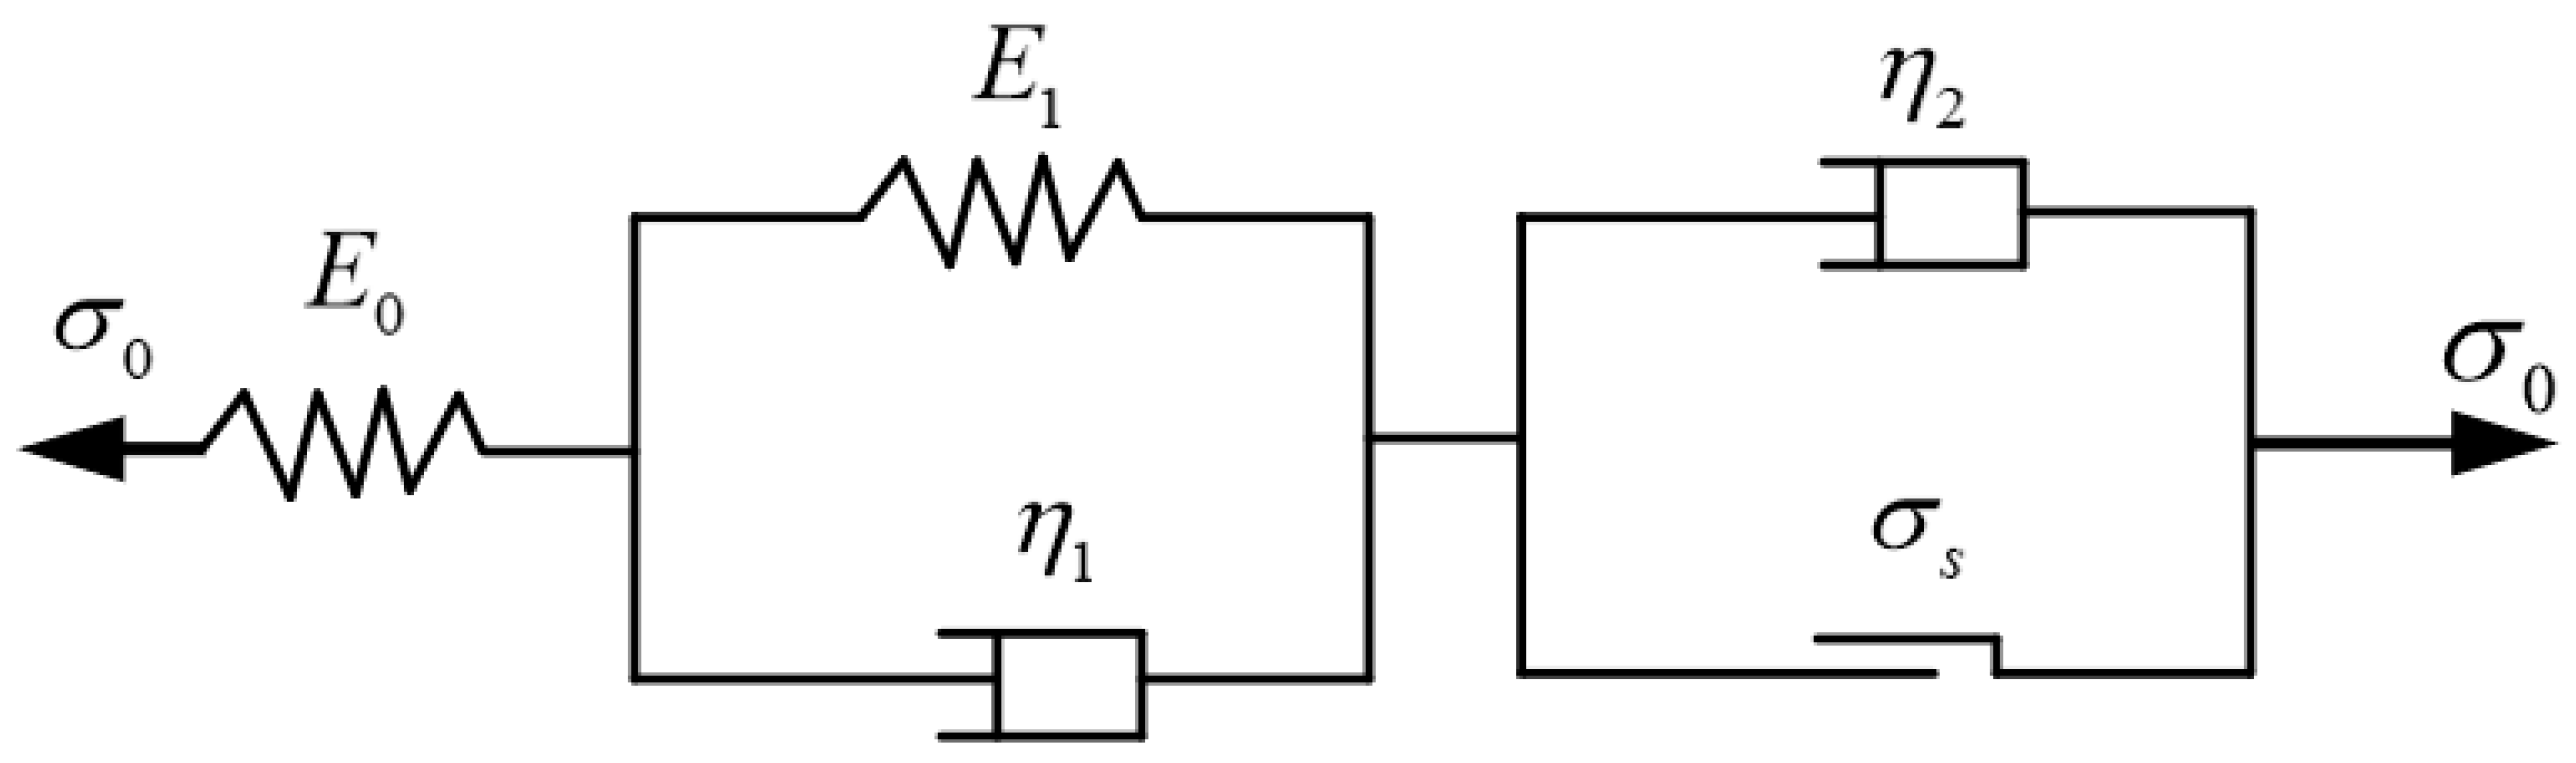
Nomenclature
| Symbols | Implication |
| P | Prototype materials |
| M | Similar materials |
| L | Geometric dimension |
| γ | Unit weight |
| σ | Stress |
| ε | Strain |
| E | Elastic modulus |
| μ | Poisson’s ratio |
| C | Cohesion |
| φ | Internal friction angle |
| σc | Uniaxial compressive strength |
| Cσ | Stress similarity ratio |
| Cγ | Unit weight similarity ratio |
| CL | Geometric similarity ratio |
| Cδ | Displacement similarity ratio |
| Cε | Strain similarity ratio |
| CE | Elastic modulus similarity ratio |
| Cf | Friction coefficient similarity ratio |
| Cμ | Poisson’s ratio similarity ratio |
| Similarity ratio of uniaxial compressive strength | |
| Cc | Cohesion similarity ratio |
| Ct | Time similarity ratio |
| Cη | Viscosity coefficient similarity ratio |
| σ0 | Creep stress |
| E0 | Elastic modulus of spring elements |
| E1 | Elastic modulus of elastomer in Kelvin body |
| η1, η2 | Viscosity coefficients |
| σs | Long-term strength |
| Strain rate |
References
- Hu, S.; Zhang, C.; Ru, W.; Han, J.; Guo, S.; Zhou, X.; Yang, L. Creep properties and energy evolution characteristics of weakly cemented rock under step loading. Int. J. Rock Mech. Min. Sci. 2023, 170, 105428. [Google Scholar] [CrossRef]
- Ru, W.K. Creep Damage and Engineering Application of Weakly Cemented Soft Rock Based on Energy Analysis. Ph.D. Thesis, Shandong University of Science and Technology, Qingdao, China, 2021. [Google Scholar]
- Zhang, Y.; Zhang, W.; Wang, K.; Xie, K.; Song, K.; Wang, Y. Hydromechanical Properties and Engineering Applications of Weakly Cemented Soft Rock in Jurassic Strata. ACS Omega 2023, 8, 16373–16383. [Google Scholar] [CrossRef]
- Cui, S.Y. Study on Hydro-dynamic Field and Media Characteristics of Weakly-Cemented Jurassic Aquifer in Dananhu Area. Ph.D. Thesis, China University of Mining and Technology, Xuzhou, China, 2017. [Google Scholar]
- Yang, Y.; Li, W.; Wang, Q.; Chen, W.; Zhou, K. Experimental Study on Mechanical Behavior and Permeability Evolution of Weakly Cemented Sandstone under Unloading Conditions. Bull. Eng. Geol. Environ. 2024, 83, 115. [Google Scholar] [CrossRef]
- Xu, R.; Zhao, Y.; Dou, B.; Hou, R.; Li, Z.; Dong, J. Experimental Investigation of the Effect of Strain Rate on the Cracking Behaviour and Acoustic Emission Characteristics of Red Sandstone Containing Orthogonal Cross Flaws under Quasistatic Uniaxial Compression. Eng. Fail. Anal. 2025, 170, 109323. [Google Scholar] [CrossRef]
- Xu, R.; Gao, L.; Jin, Y.; Wang, Y.; Li, Z.; Hu, S. Influence of Strain Measurement Methods on Crack Initiation and Crack Damage Thresholds of Shale. Geomech. Geophys. Geo-Energy Geo-Resour. 2025, 11, 34. [Google Scholar] [CrossRef]
- Ma, C.; Yuan, Y.; Zha, J.; Li, H.; Xu, Y. Determine Method of Effective Experimental Period of Similar Material Model for Improving the Simulation Results. Energy Sources Part A 2024, 46, 16165–16174. [Google Scholar] [CrossRef]
- Zhou, B.; Shan, Y.; Yao, S. Deformation Monitoring of Similar Material Model Based on Point Cloud Feature Extraction. J. Eng. 2019, 20, 6790–6794. [Google Scholar] [CrossRef]
- Hu, G.; Song, W.; Yu, X.; Lin, M.; Tie, Y.; He, B. Study on the Ratio and Model Test of Similar Materials of Heavily Weathered Granite. Materials 2024, 17, 5324. [Google Scholar] [CrossRef]
- Su, H.; Liu, S.; Hu, B.; Nan, B.; Zhang, X.; Han, X.; Zhang, X. Experimental Study on Proportion Optimization of Rock-like Materials Based on Genetic Algorithm Inversion. Materials 2024, 17, 4940. [Google Scholar] [CrossRef]
- Sun, L.; Wang, W.-X.; Xu, J.-S. Study on Proportioning Scheme of Coal System Rocky Similar Material Based on Orthogonal Test. Materials 2023, 16, 7113. [Google Scholar] [CrossRef]
- Stück, H.; Koch, R.; Siegesmund, S. Petrographical and petrophysical properties of sandstones: Statistical analysis as an approach to predict material behaviour and construction suitability. Environ. Earth Sci. 2013, 69, 1299–1332. [Google Scholar] [CrossRef]
- Holtzman, R. Micromechanical Model of Weakly-Cemented Sediments. Int. J. Numer. Anal. Meth. Geomech. 2012, 36, 944–958. [Google Scholar] [CrossRef]
- Ren, X.; Zhang, Z.; Xiang, M.; Xu, G.; Cao, W. An Experimental Study on the Preparation of Soft Rock Similar Materials Using Redispersible Latex Powder as a Modifier. Molecules 2022, 27, 7404. [Google Scholar] [CrossRef]
- Qian, Y.; Li, Z.; Jin, Y.; Wang, R. Experimental Study on Axial Tension Members of New Epoxy Resin Concrete. Build. Struct. 2020, 50, 124–127. [Google Scholar] [CrossRef]
- Cui, L.; Sheng, Q.; Miao, C.; Luo, S. Mechanical Properties of Similar Materials Simulating Weak Surrounding Rocks with Different Ratios of Fine-to-Coarse Aggregate. Appl. Sci. 2025, 15, 3540. [Google Scholar] [CrossRef]
- Li, Y.H.; Lin, Z.B. Innovative Experimental Method Based on Development of Transparent Rock Mass Materials for Physical Tests. Chin. J. Geotech. Eng. 2015, 37, 2030–2039. [Google Scholar] [CrossRef]
- Xu, Y.; Su, D.-L.; Zhou, B.; Liu, Z.; Zhou, C.-Y. Experiment Study on Similarity Ratio of Similar Material for Model Test on Red-Bed Soft. Rock. Rock Soil Mech. 2016, 37, 2231–2237. [Google Scholar] [CrossRef]
- Zhang, Y. Research on Orthogonal Experiment of Ratio of Similar Material for Coal. Coal Technol. 2018, 37, 72–74. [Google Scholar] [CrossRef]
- Lin, H.F.; Zhai, Y.L.; Li, S.G.; Li, L.; Bai, Y. Research on Mechanics and Permeability Characteristics of Similar Material of Solid-Gas Coupling Based on Orthogonal Design. J. China Coal Soc. 2016, 41, 672–679. [Google Scholar] [CrossRef]
- Ma, Z.G. Study of Simulating Creep Properties of Soft Rock with Latex Cement; Qingdao University of Science and Technology: Qingdao, China, 2014. [Google Scholar]
- Wang, H.P.; Li, S.C.; Zhang, Q.Y.; Li, Y.; Guo, X.H. Development of a New Geomechanical Similar Material. Chin. J. Rock Mech. Eng. 2006, 25, 1842–1847. [Google Scholar]
- Chu, Z.F. Study on Interaction between Tunnel Support and Surrounding Rock in Soft Rheology Rock. Ph.D. Thesis, Beijing Jiaotong University, Beijing, China, 2018. [Google Scholar]
- Chu, Z.F.; Liu, B.G.; Sun, J.L.; Shen, J.; Song, Y.; Li, T. Research on Rheological Similar Material of Soft Rock Based on Burgers Model. Chin. J. Rock Mech. Eng. 2018, 37, 1185–1198. [Google Scholar] [CrossRef]
- Chu, Z.-F.; Liu, B.-G.; Ren, D.-R.; Song, Y.; Ma, Q. Development of Rheology Similar Material of Soft Rock and Its Application in Model Test. Rock Soil Mech. 2019, 40, 2172–2182. [Google Scholar] [CrossRef]
- Du, B.; Liu, B.G. Similarity Simulation and Its Application in Shield Construction of Coal Mine Inclined Shafts; Tsinghua University Press: Beijing, China, 2016. [Google Scholar]
- Tao, B.; Wu, F.-Q.; Guo, G.-M.; Zhou, R.-G. Flexibility of Visco-Elastoplastic Model to Rheological Characteristics of Rock and Solution of Rheological Parameter. Chin. J. Rock Mech. Eng. 2005, 24, 3165–3171. [Google Scholar]
- Fan, P.X.; Wang, M.Y.; Xing, H.Z.; Jiang, K.F.; Li, Z.Z. Time-Dependent Problems of Deformation and Failure in Geo-Mechanical Model Tests. Chin. J. Rock Mech. Eng. 2014, 33, 1843–1851. [Google Scholar] [CrossRef]
- Zhang, Q.Y.; Li, S.C.; Guo, X.H.; Li, Y.; Wang, H.P. Research and Development of New Typed Cementitious Geotechnical Similar Material for Iron Crystal Sand and Its Application. Rock Soil Mech. 2008, 29, 2126–2130. [Google Scholar] [CrossRef]
- GB 50021-2001; Code for Investigation of Geotechnical Engineering. China Architecture & Building Press: Beijing, China, 2009.
- Dong, J.Y.; Yang, J.H.; Yang, G.X.; Wu, F.Q.; Liu, H.S. Research on Similar Material Proportioning Test of Model Test Based on Orthogonal Design. J. China Coal Soc. 2012, 37, 44–49. [Google Scholar] [CrossRef]
- Xu, Q. Study on Stress Transfer Law and Reasonable Size of Section Pillar in Multi-Seam Mining. Ph.D. Thesis, Shandong University of Science and Technology, Qingdao, China, 2019. [Google Scholar]


| Level | n/% | IB/IBS | I/IB | ω/% |
|---|---|---|---|---|
| 1 | 7.5 | 0.6 | 0.05 | 3.5 |
| 2 | 12.5 | 0.7 | 0.2 | 3.5 |
| 3 | 17.5 | 0.8 | 0.35 | 3.5 |
| Proportion Number | n/% | IB/IBS | I/IB | ω/% |
|---|---|---|---|---|
| 1 | 7.5 | 0.6 | 0.05 | 3.5 |
| 2 | 7.5 | 0.7 | 0.20 | 3.5 |
| 3 | 7.5 | 0.8 | 0.35 | 3.5 |
| 4 | 12.5 | 0.6 | 0.20 | 3.5 |
| 5 | 12.5 | 0.7 | 0.35 | 3.5 |
| 6 | 12.5 | 0.8 | 0.05 | 3.5 |
| 7 | 17.5 | 0.6 | 0.35 | 3.5 |
| 8 | 17.5 | 0.7 | 0.05 | 3.5 |
| 9 | 17.5 | 0.8 | 0.20 | 3.5 |
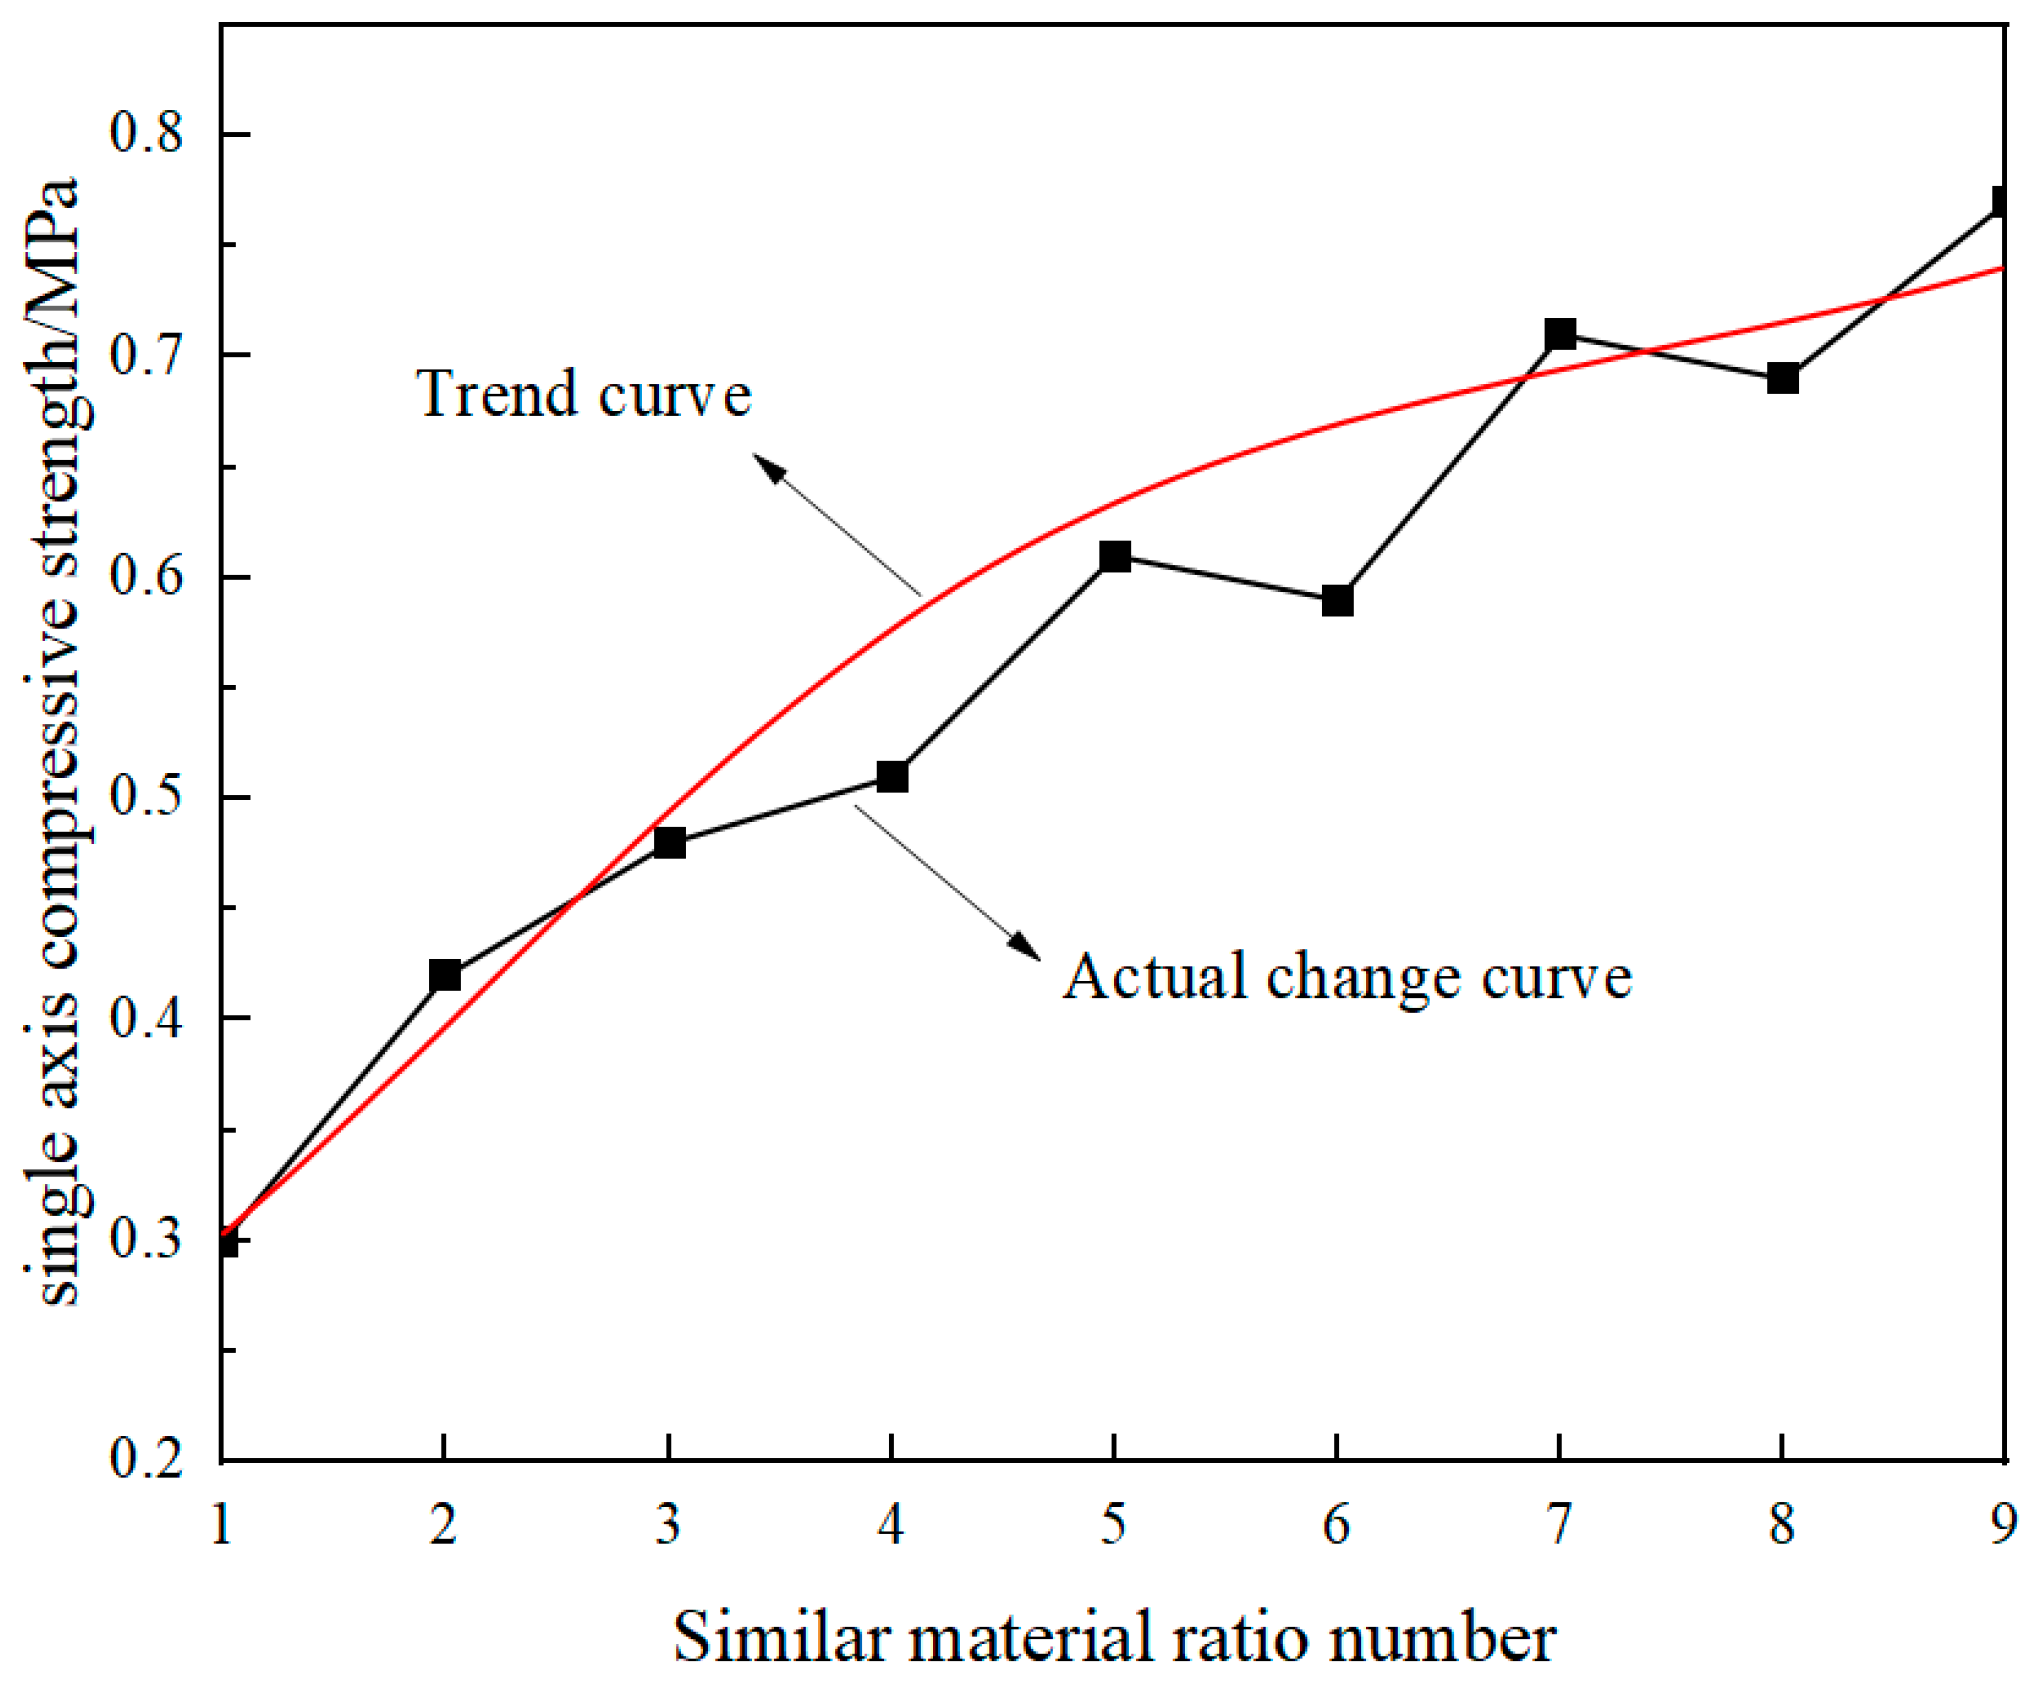
| Proportion Number | Volumetric Weight /(kN·m−3) | Elastic Modulus E/MPa | Compressive Strength σc/MPa | Poisson Ratio μ |
|---|---|---|---|---|
| 1 | 24.32 | 79.4 | 0.30 | 0.27 |
| 2 | 25.25 | 109.2 | 0.42 | 0.26 |
| 3 | 26.91 | 138.97 | 0.48 | 0.25 |
| 4 | 24.17 | 153.69 | 0.51 | 0.23 |
| 5 | 25.64 | 183.46 | 0.61 | 0.23 |
| 6 | 24.98 | 166.79 | 0.59 | 0.24 |
| 7 | 25.24 | 227.95 | 0.71 | 0.21 |
| 8 | 24.33 | 211.28 | 0.69 | 0.22 |
| 9 | 25.57 | 241.05 | 0.77 | 0.22 |
| Materials | Volumetric Weight /(kN·m−3) | Elastic Modulus E/GPa | Single-Axis Compressive Strength σc/MPa | Poisson Ratio μ |
|---|---|---|---|---|
| Weekly cemented mudstone | 23.4 | 1.96 | 10.01 | 0.29 |
| Weakly cemented sandy mudstone | 24.1 | 13.7 | 11.59 | 0.20 |
| Materials | Volumetric Weight /(kN·m−3) | Elastic Modulus E/GPa | Single-Axis Compressive Strength σc/MPa | Poisson Ratio μ |
|---|---|---|---|---|
| Mudstone-like material | 25.4 | 0.098 | 0.5 | 0.29 |
| Sandy mudstone-like material | 26.1 | 0.685 | 0.58 | 0.20 |
| Materials | Rosin–Alcohol Concentration m/% | Hydraulic Oil Content w/% | ||
|---|---|---|---|---|
| Weakly cemented mudstone | 12.5 | 0.6 | 0.20 | 3.5 |
| Weakly cemented sandy mudstone | 12.5 | 0.7 | 0.35 | 3.5 |
| Coal | 12.5 | 0.8 | 0.05 | 3.5 |
Disclaimer/Publisher’s Note: The statements, opinions and data contained in all publications are solely those of the individual author(s) and contributor(s) and not of MDPI and/or the editor(s). MDPI and/or the editor(s) disclaim responsibility for any injury to people or property resulting from any ideas, methods, instructions or products referred to in the content. |
© 2025 by the authors. Licensee MDPI, Basel, Switzerland. This article is an open access article distributed under the terms and conditions of the Creative Commons Attribution (CC BY) license (https://creativecommons.org/licenses/by/4.0/).
Share and Cite
Hu, S.; Yang, L.; Guo, S.; Zhang, C.; Yin, D.; Dou, J.; Cheng, Y. Study on Similar Materials for Weakly Cemented Medium and Indoor Excavation Test. Materials 2025, 18, 2948. https://doi.org/10.3390/ma18132948
Hu S, Yang L, Guo S, Zhang C, Yin D, Dou J, Cheng Y. Study on Similar Materials for Weakly Cemented Medium and Indoor Excavation Test. Materials. 2025; 18(13):2948. https://doi.org/10.3390/ma18132948
Chicago/Turabian StyleHu, Shanchao, Lei Yang, Shihao Guo, Chenxi Zhang, Dawang Yin, Jinhao Dou, and Yafei Cheng. 2025. "Study on Similar Materials for Weakly Cemented Medium and Indoor Excavation Test" Materials 18, no. 13: 2948. https://doi.org/10.3390/ma18132948
APA StyleHu, S., Yang, L., Guo, S., Zhang, C., Yin, D., Dou, J., & Cheng, Y. (2025). Study on Similar Materials for Weakly Cemented Medium and Indoor Excavation Test. Materials, 18(13), 2948. https://doi.org/10.3390/ma18132948