
Study on the Micro-Mechanism of Corrosion Deterioration of Concrete Under Sulfate Attack Environment


Abstract
1. Introduction
2. Test and Analysis Methods
2.1. Raw Materials
2.2. Specimen Production
2.3. Compressive Strength and Corrosion Resistance
2.4. Changes in the Apparent Morphology of the Test Specimens
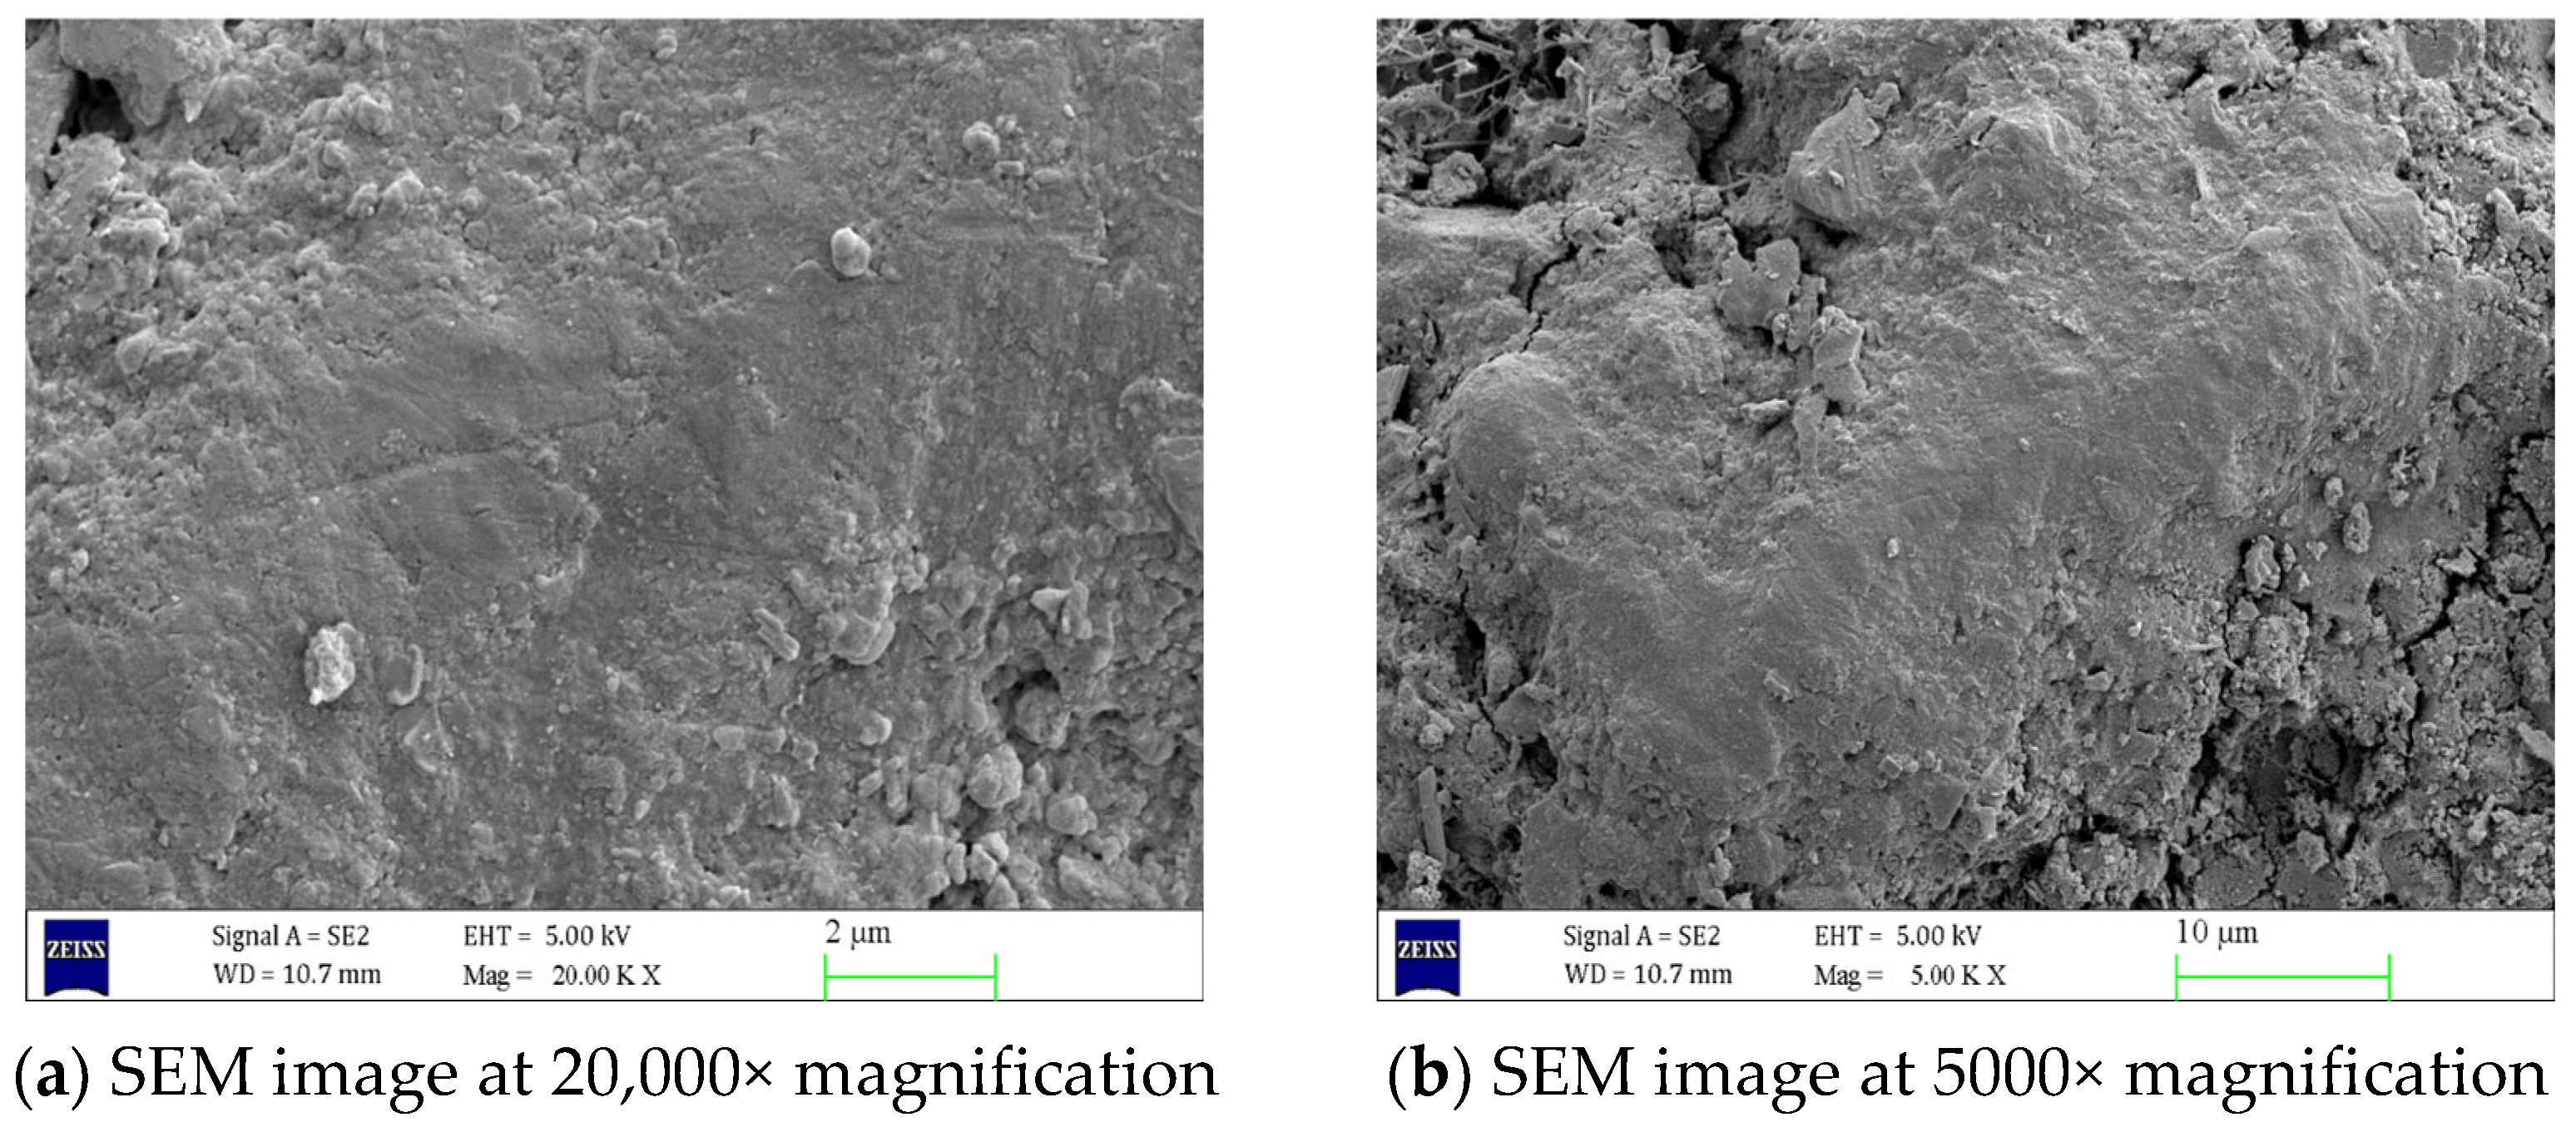
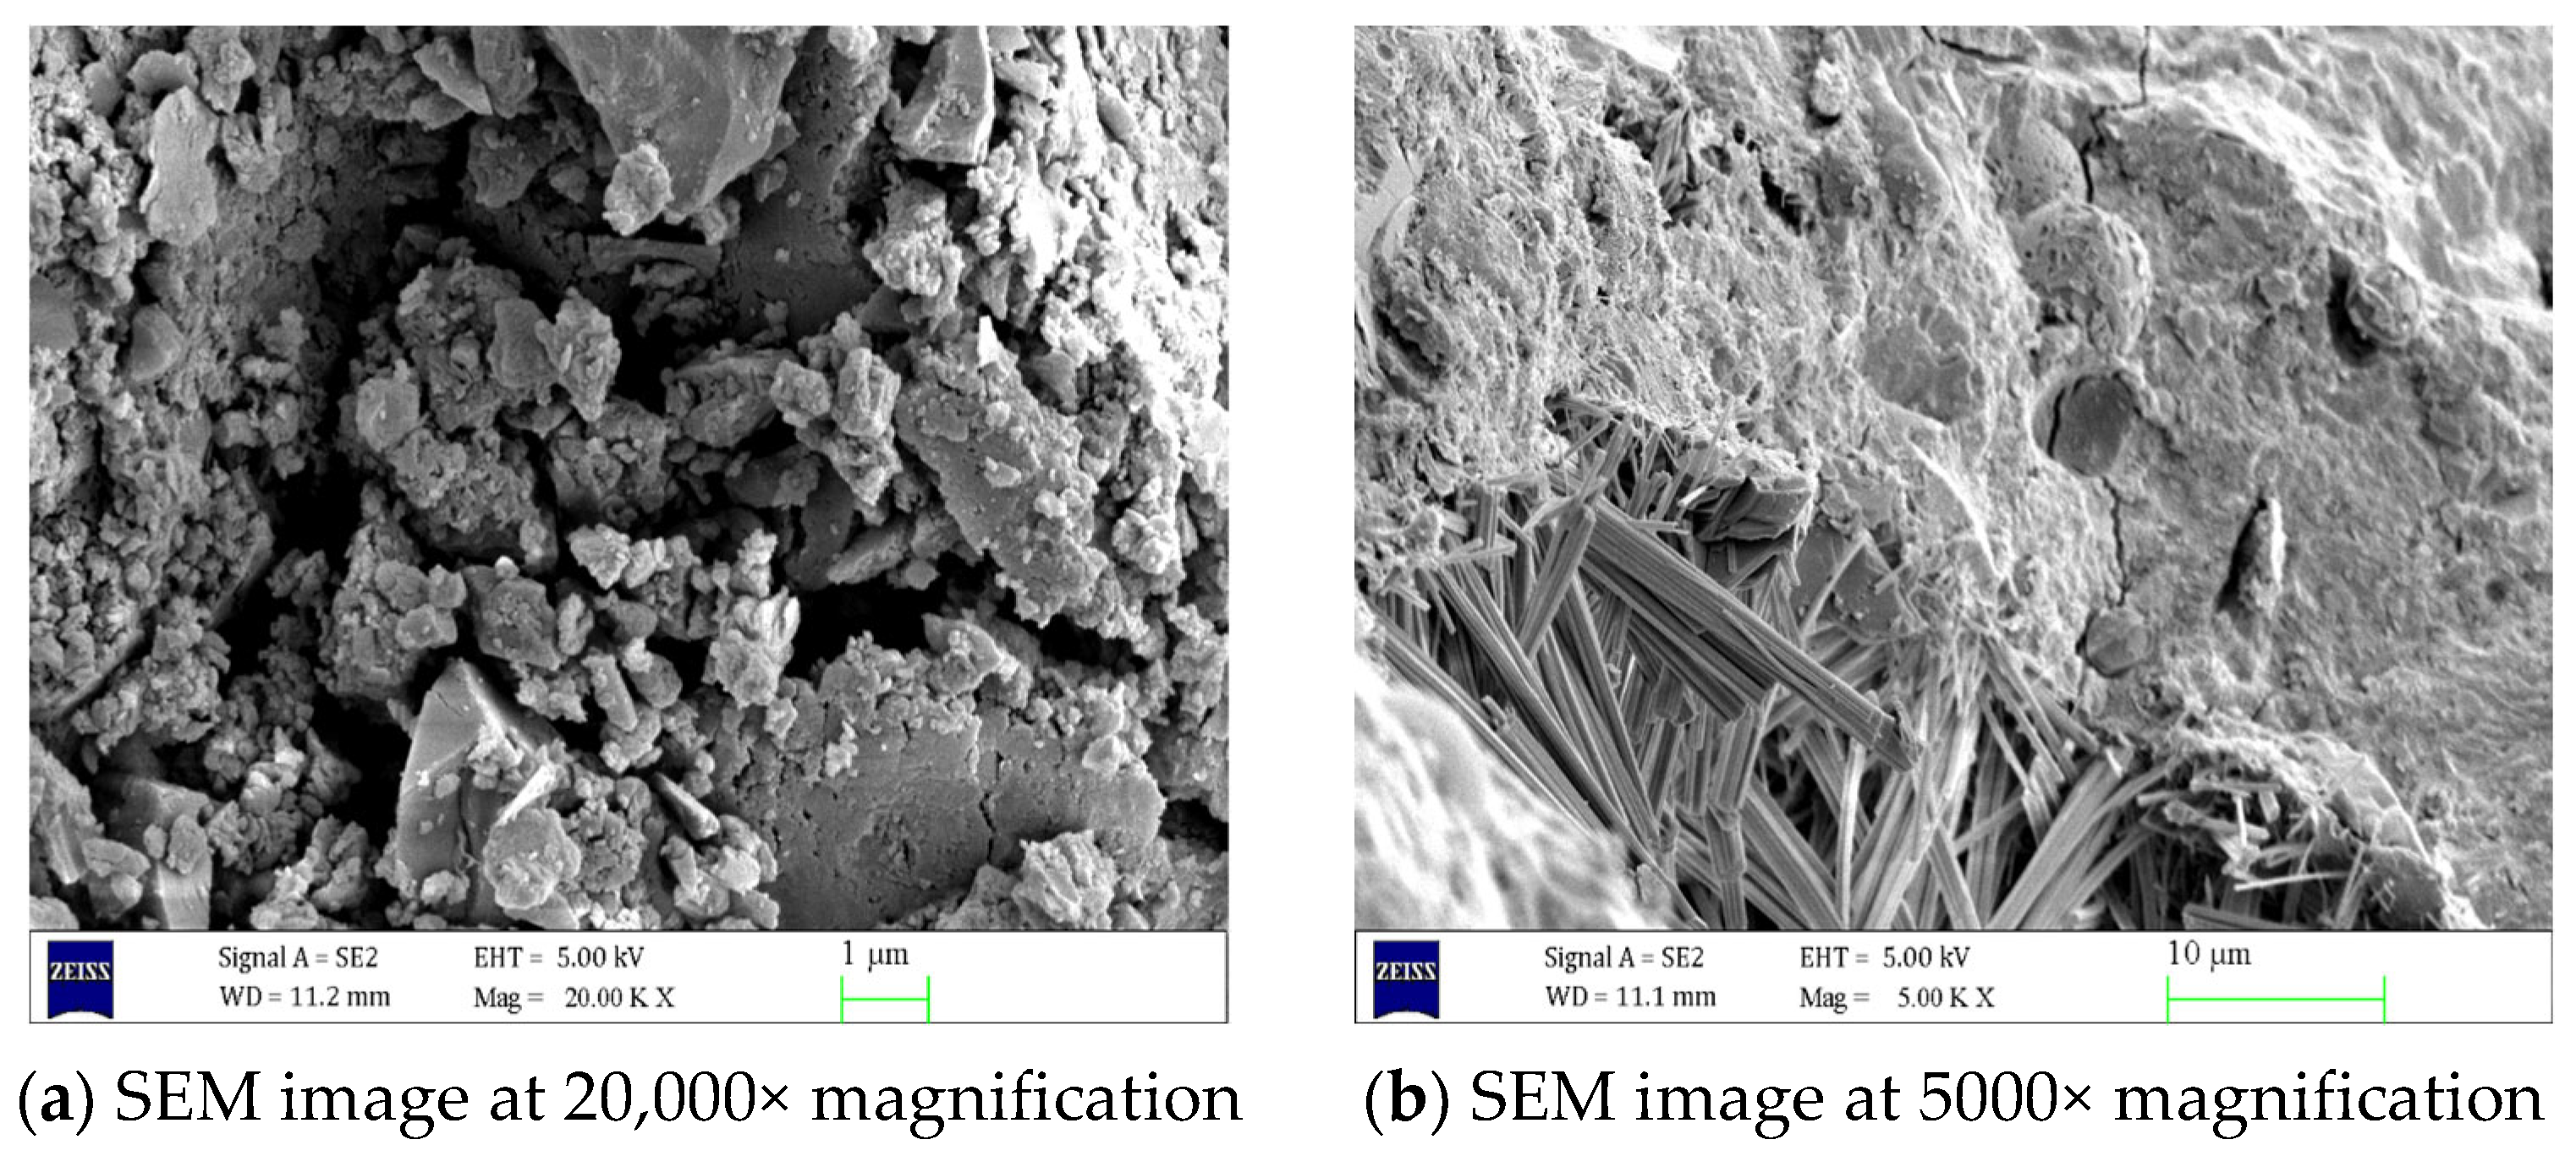
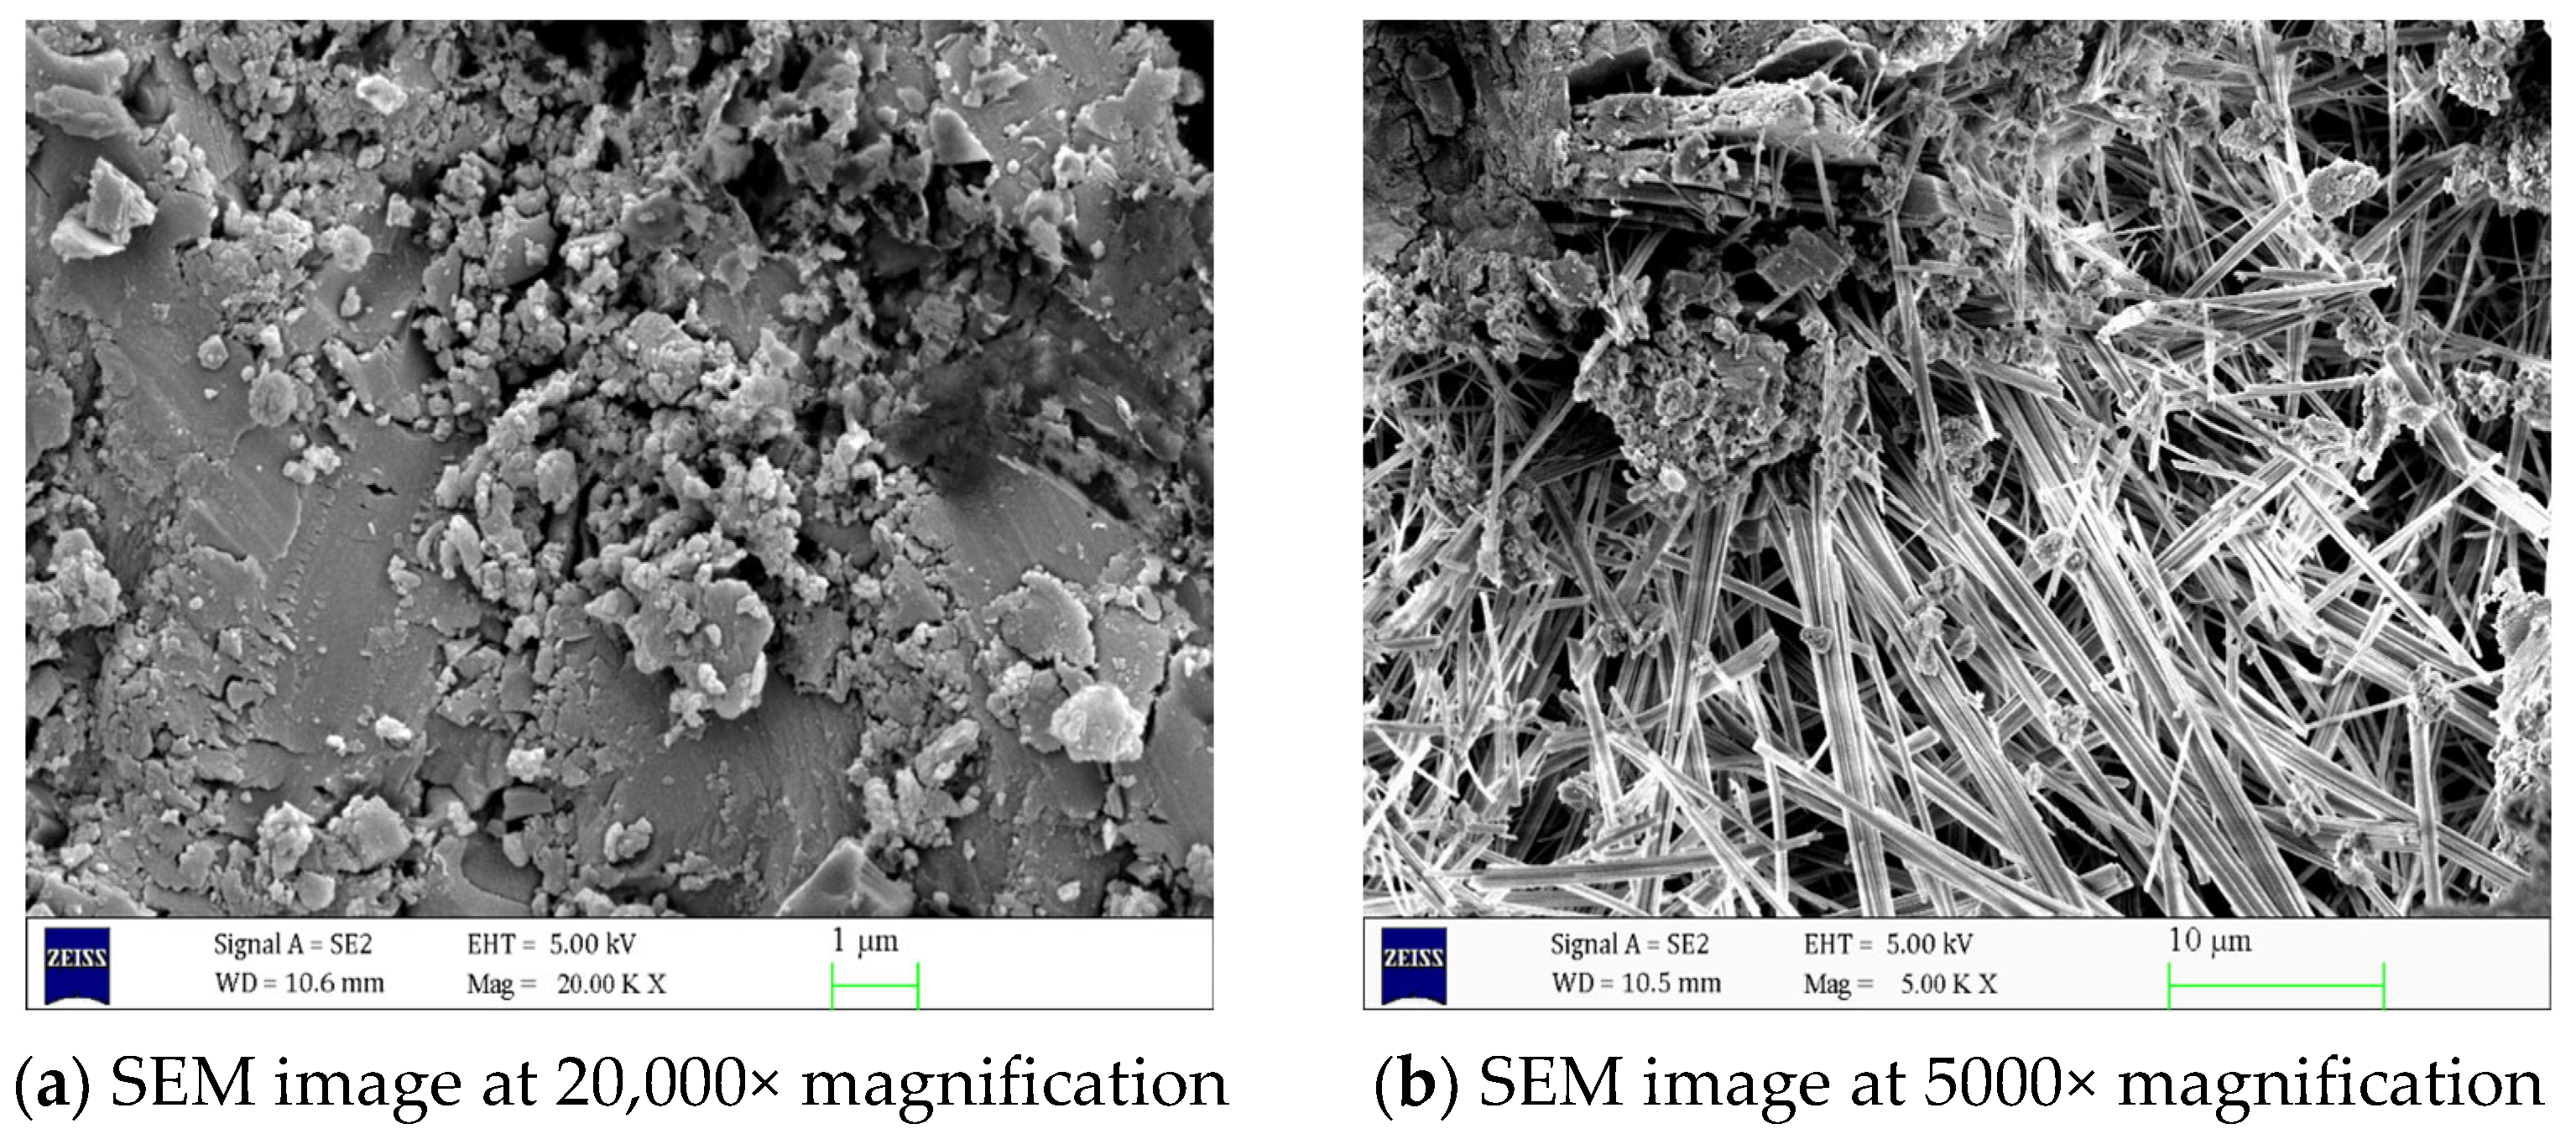
2.5. SEM Test
2.6. XRD Test
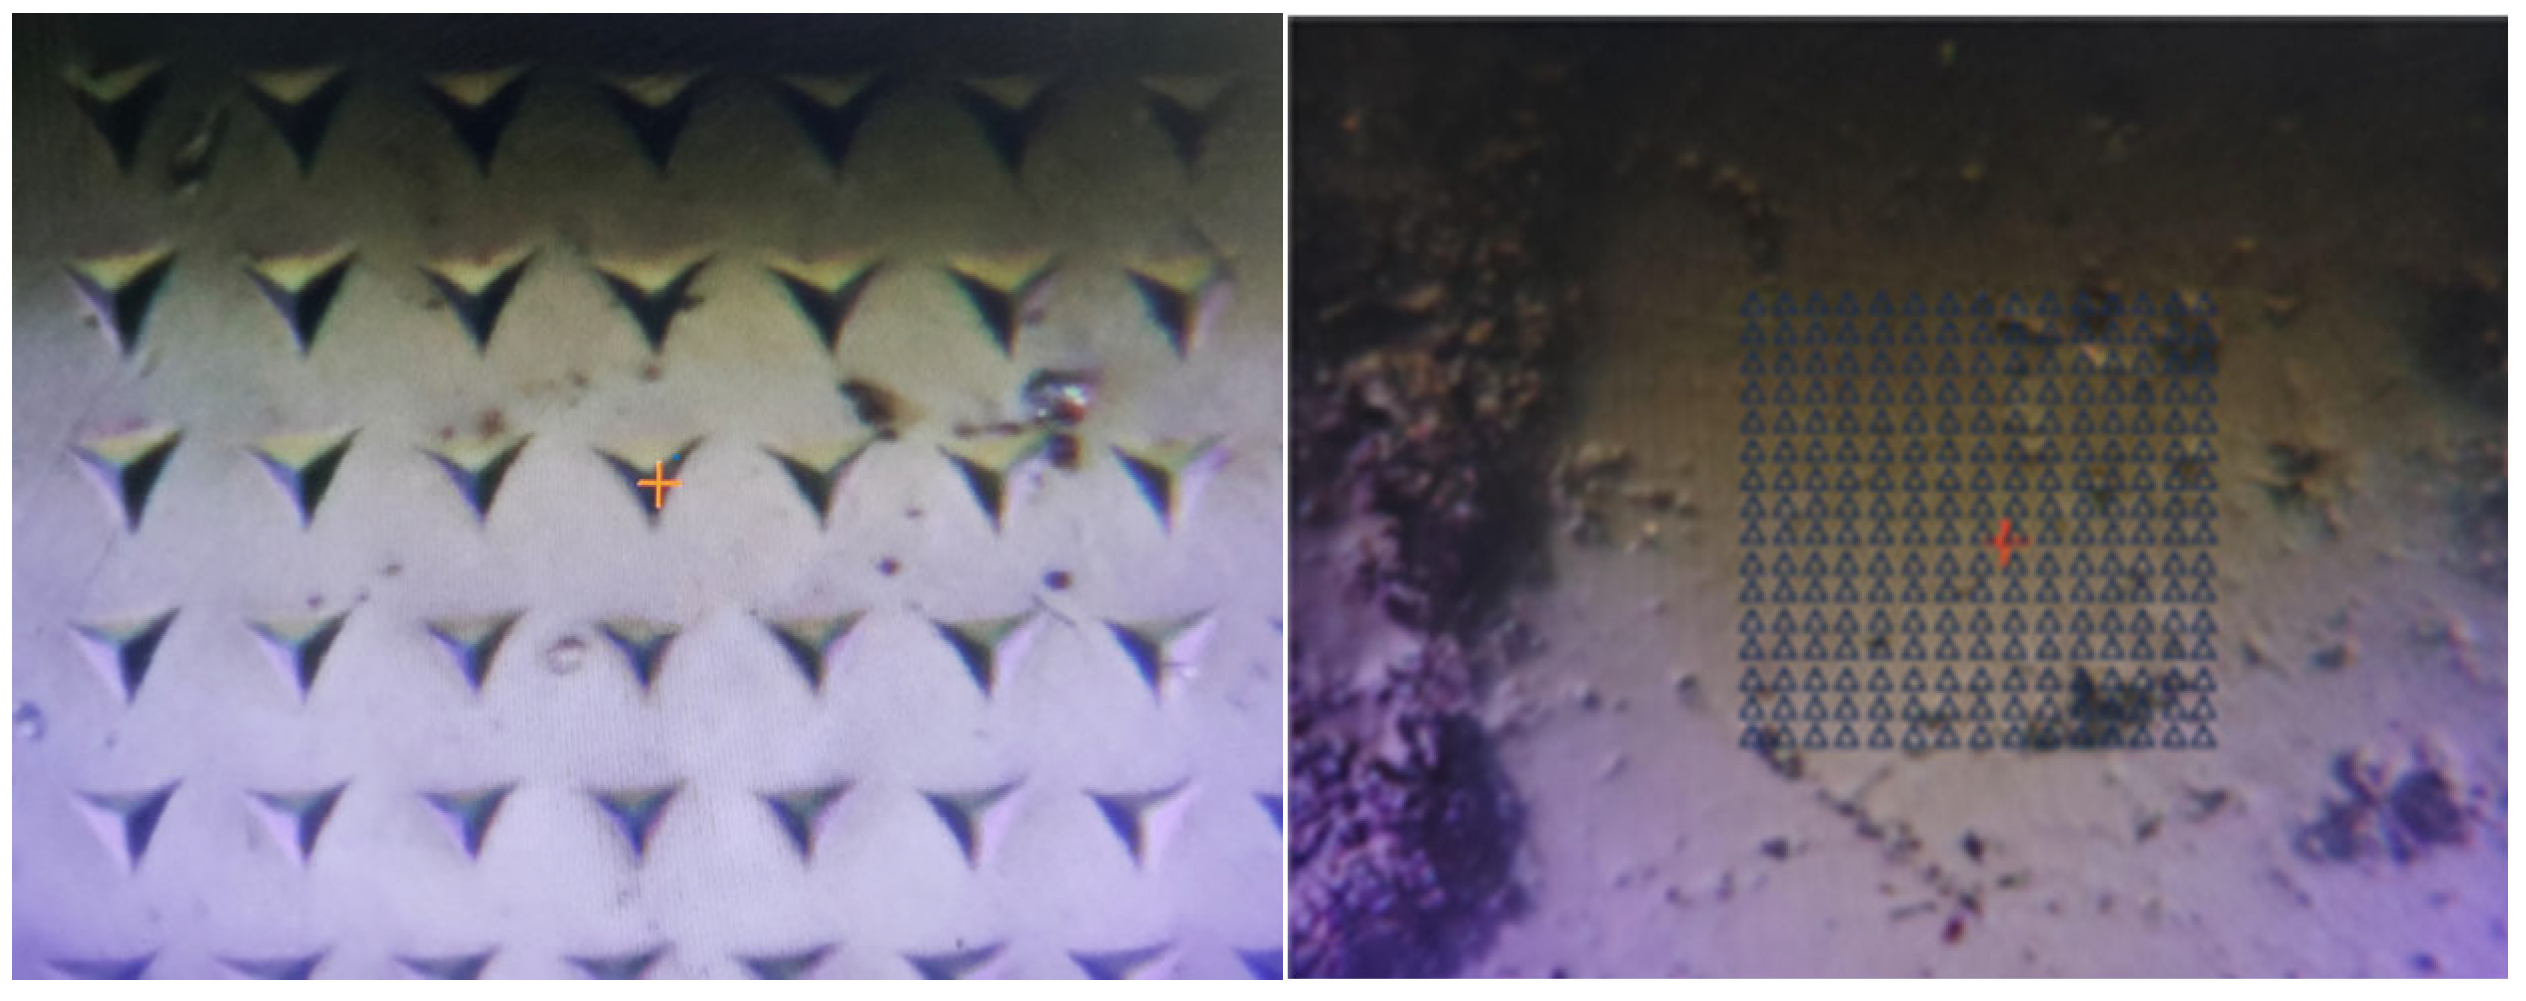
2.7. Nanoindentation Test
2.7.1. Test Principle
2.7.2. Test Methods
2.7.3. Cluster Analysis
3. Analysis of Test Results
3.1. Strength and Corrosion Resistance Coefficient Deterioration Pattern with Erosion Age
3.2. Appearance Changes in Specimens
3.3. Analysis of SEM Test Results
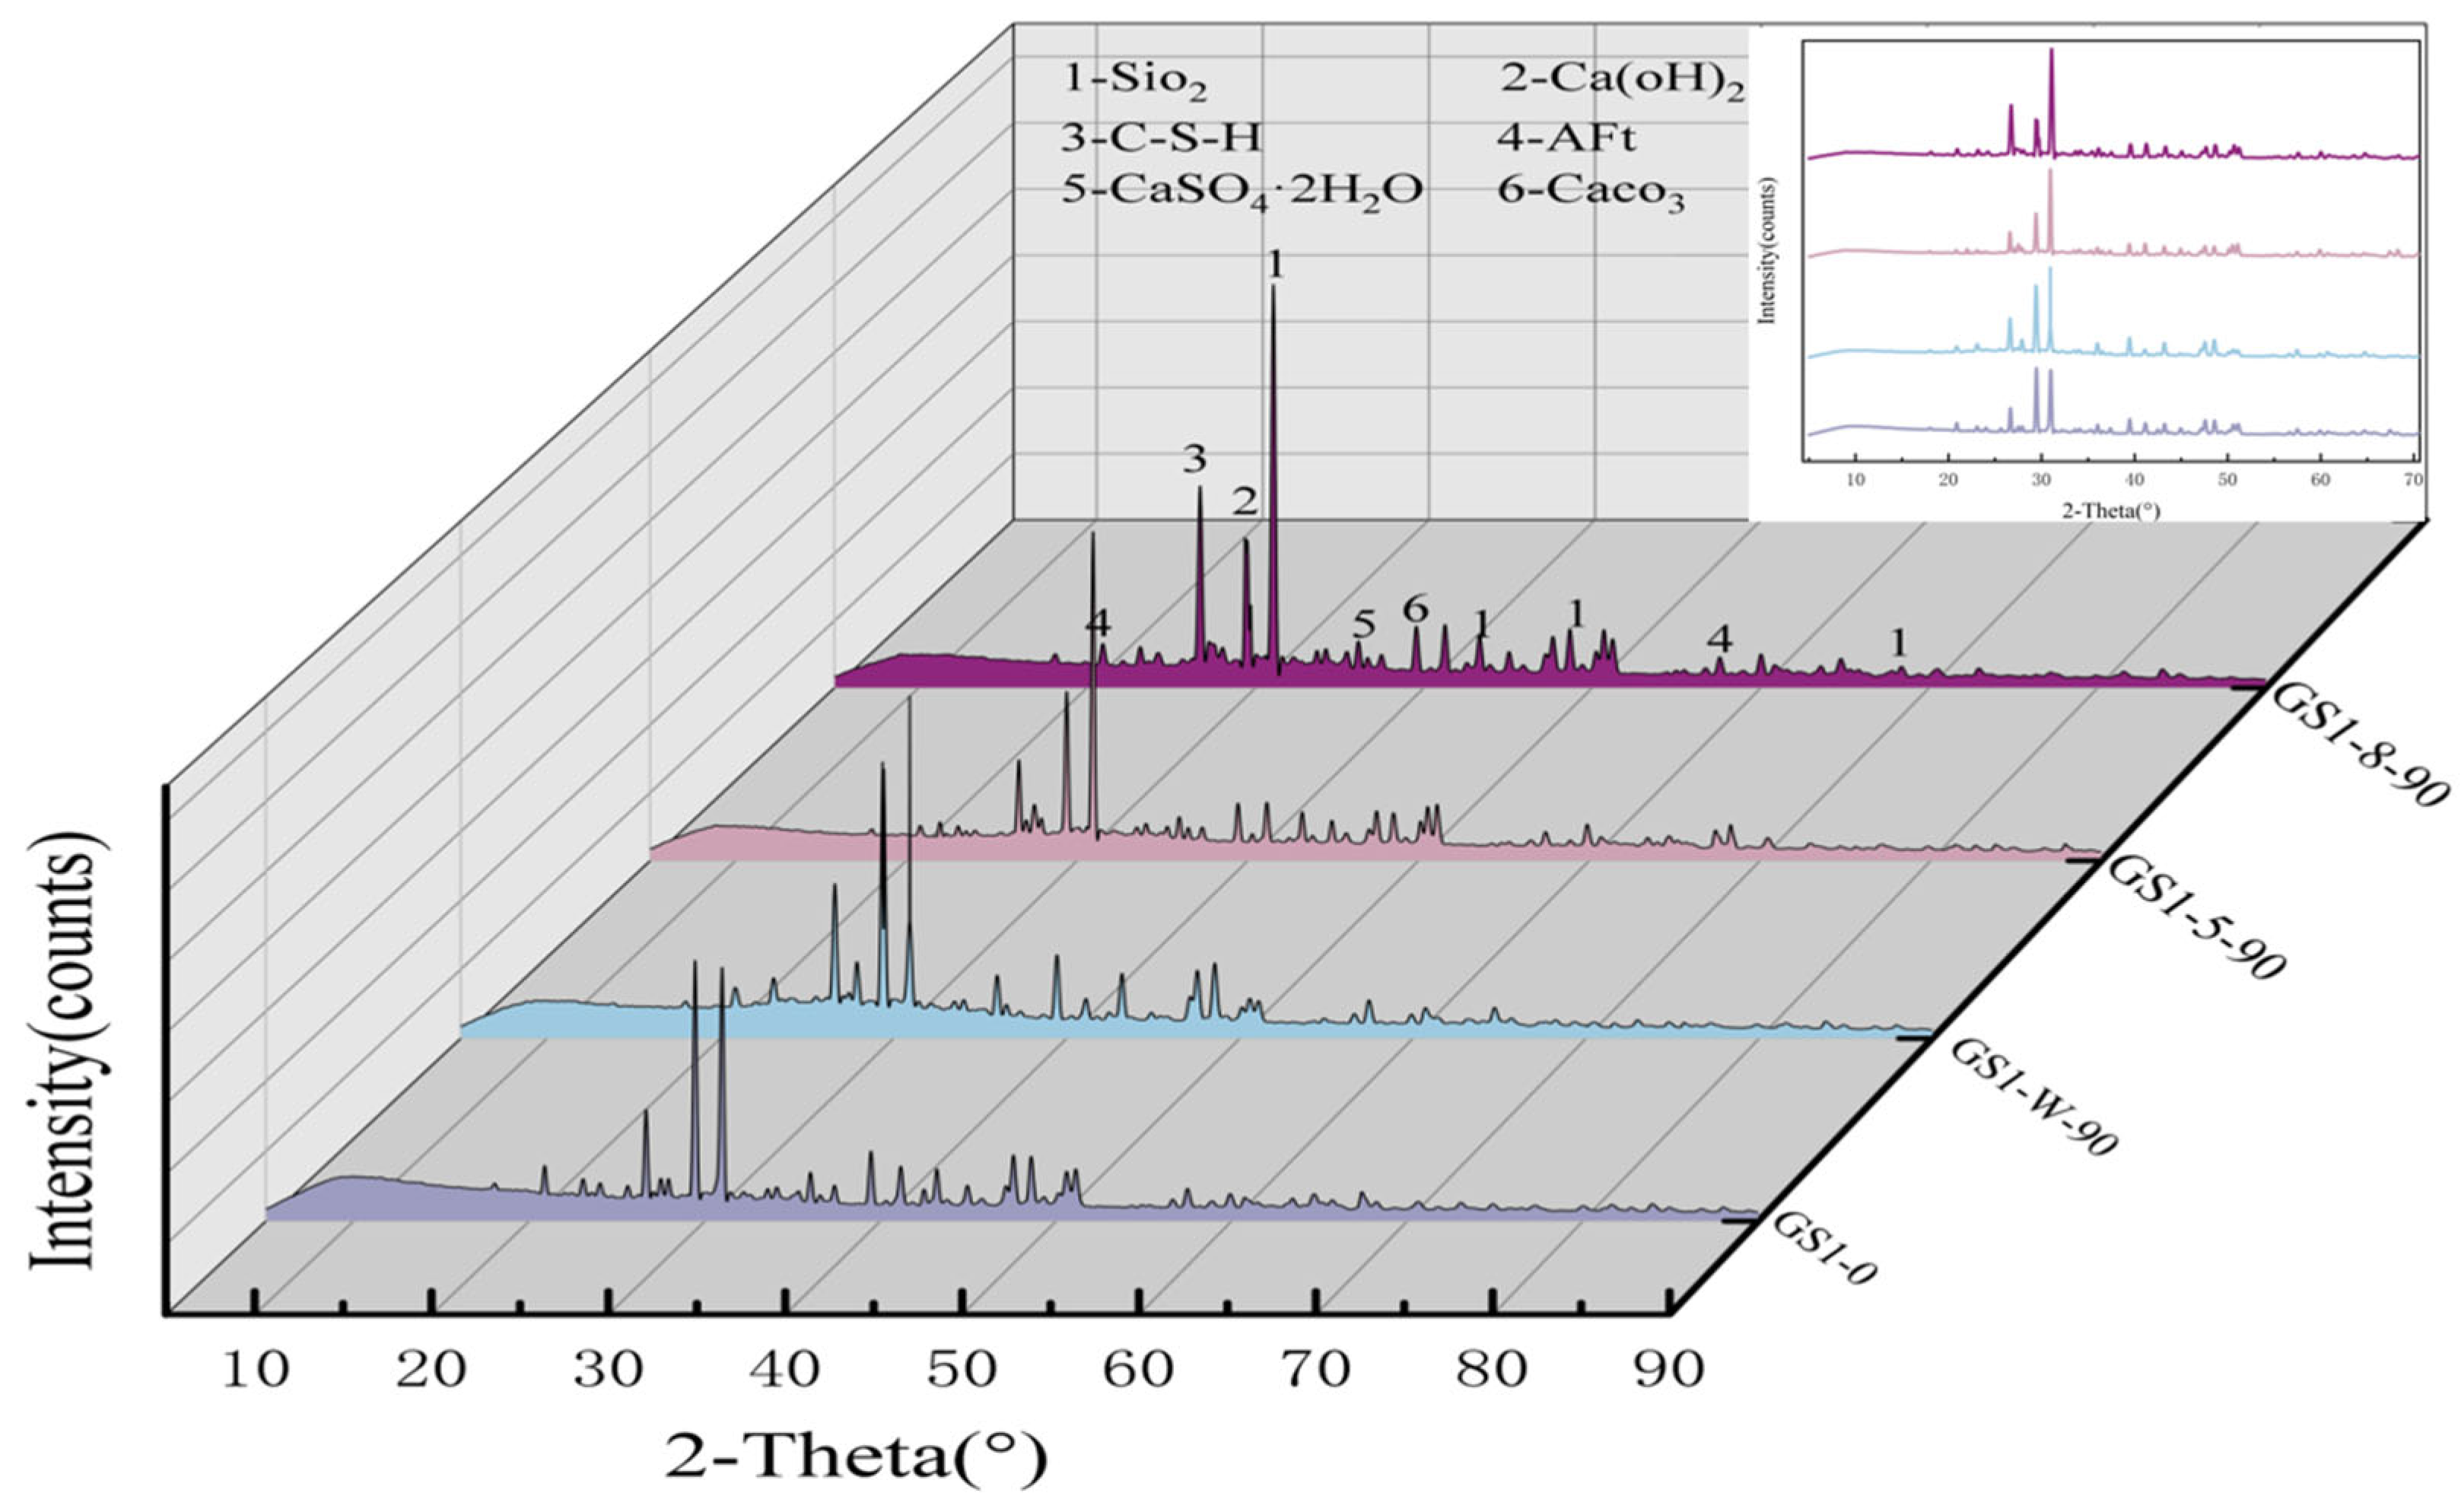
3.4. Analysis of XRD Test Results
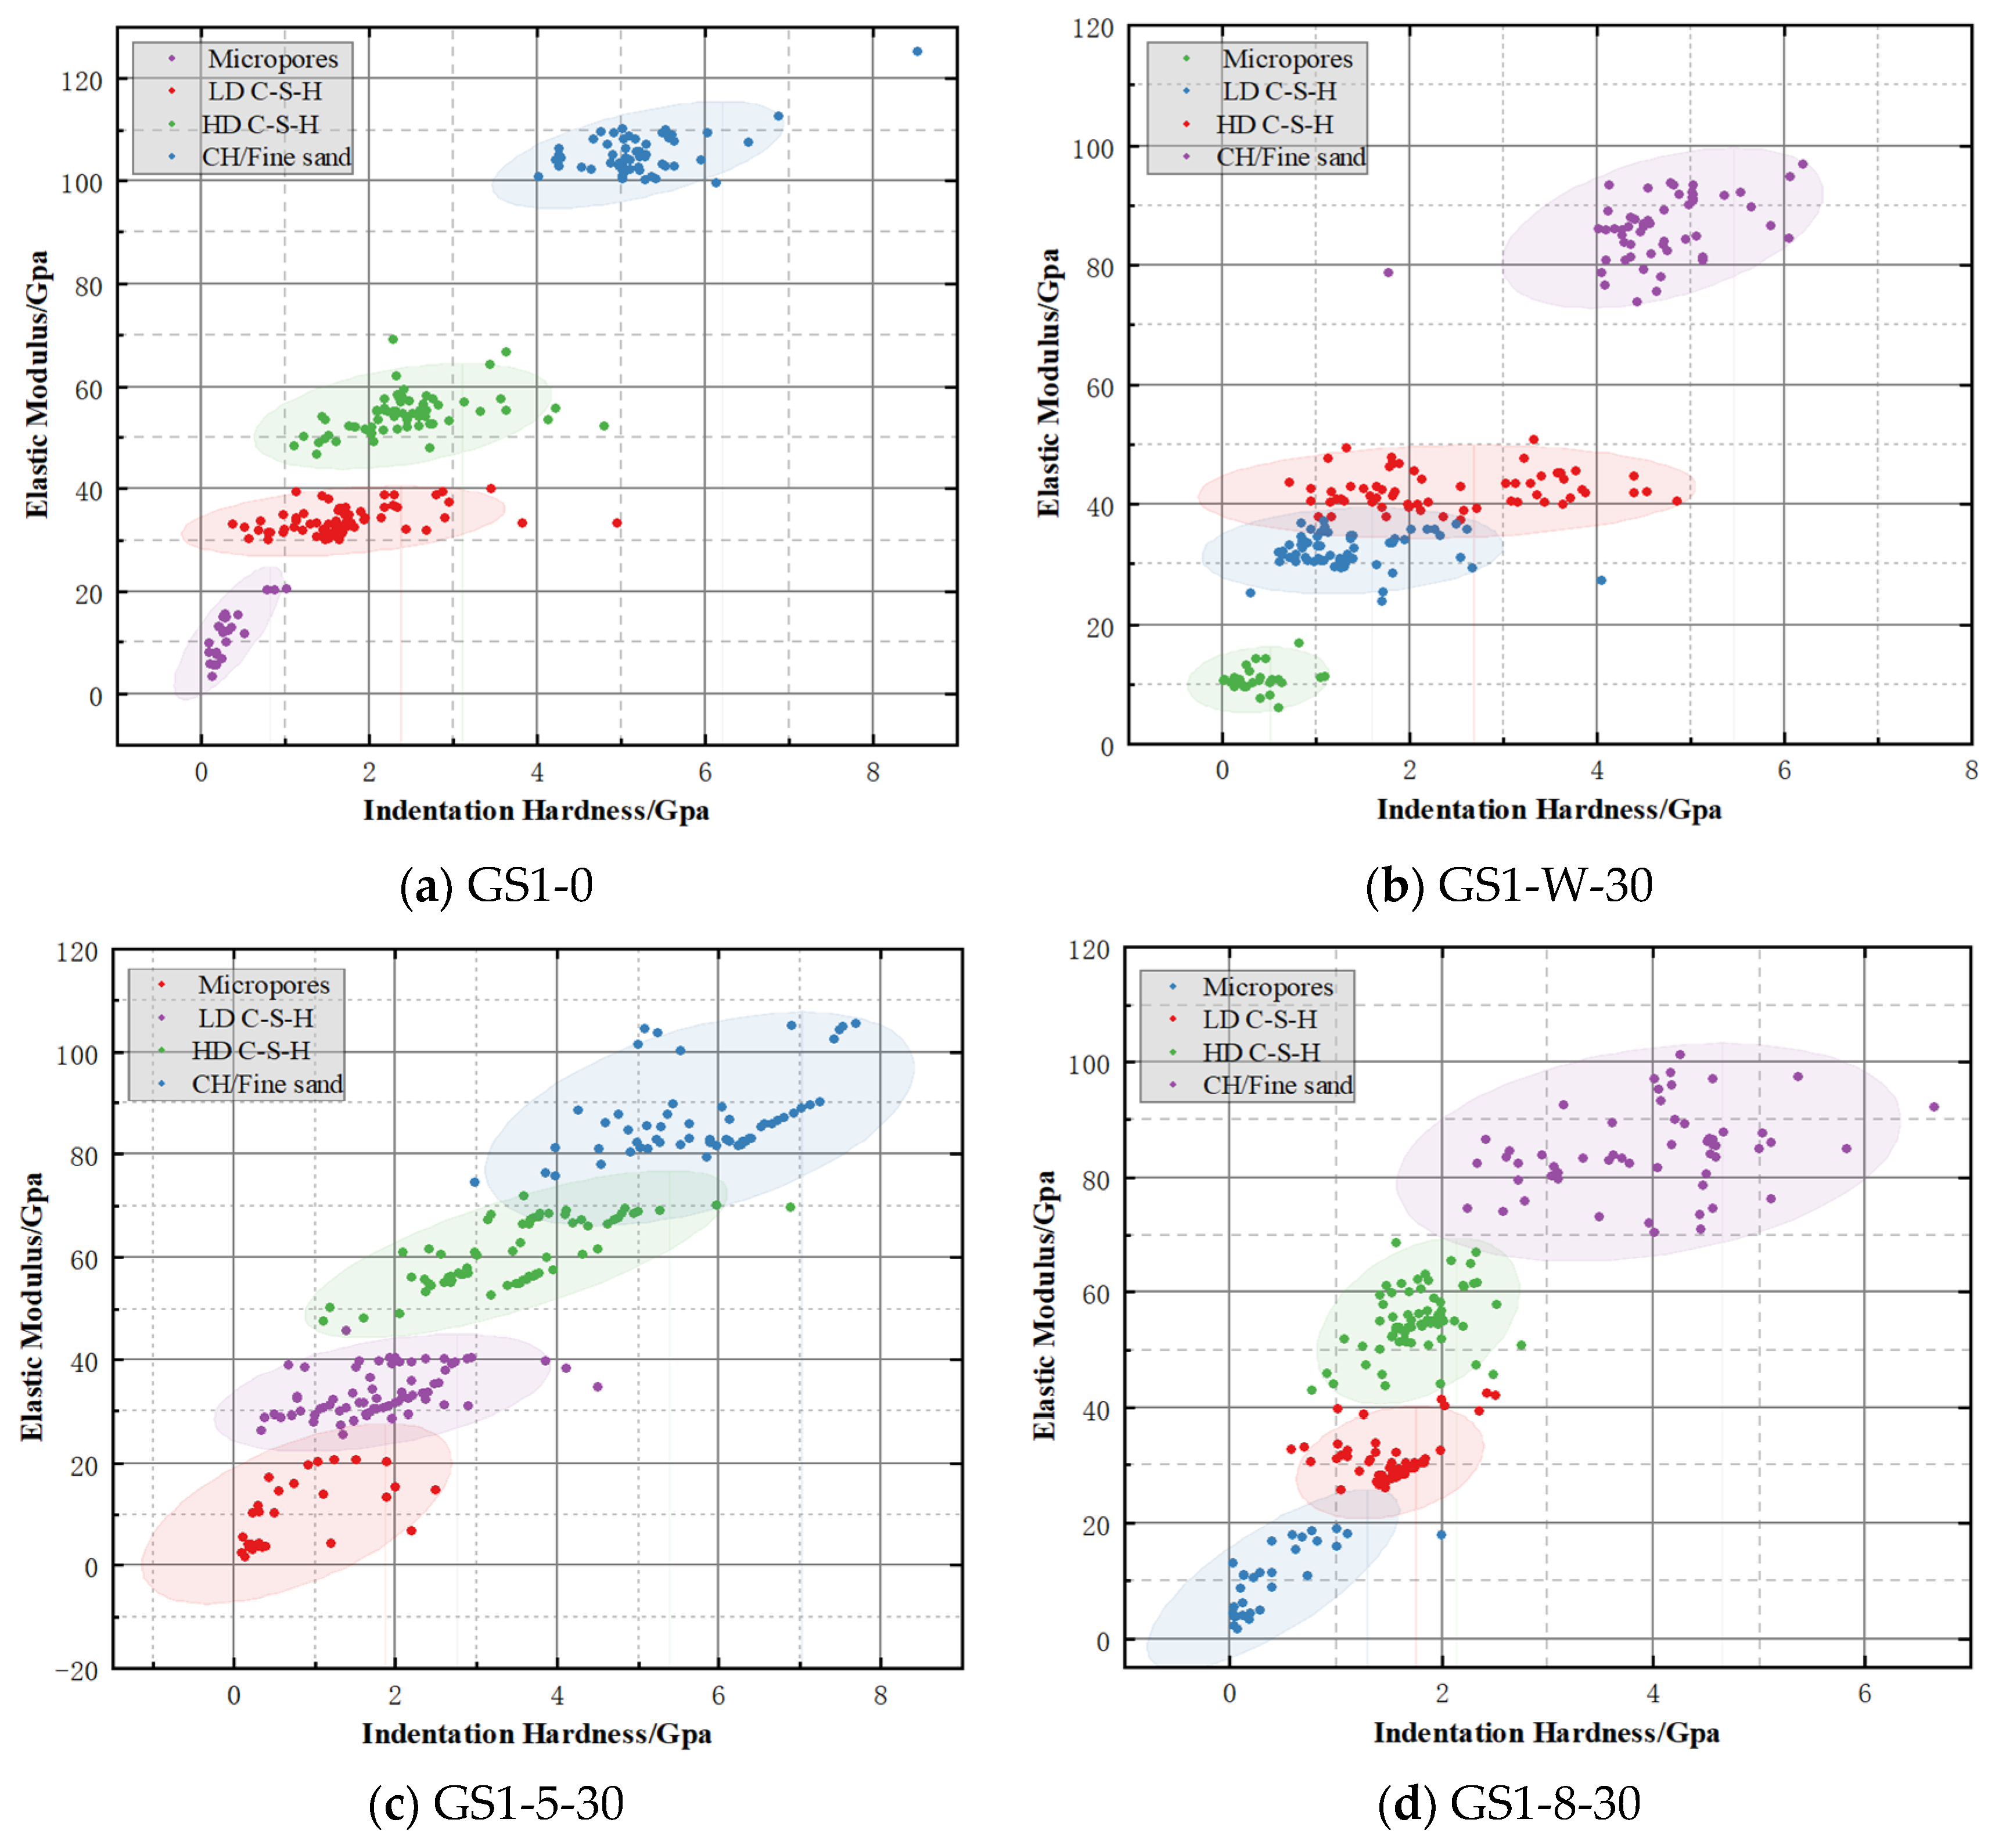
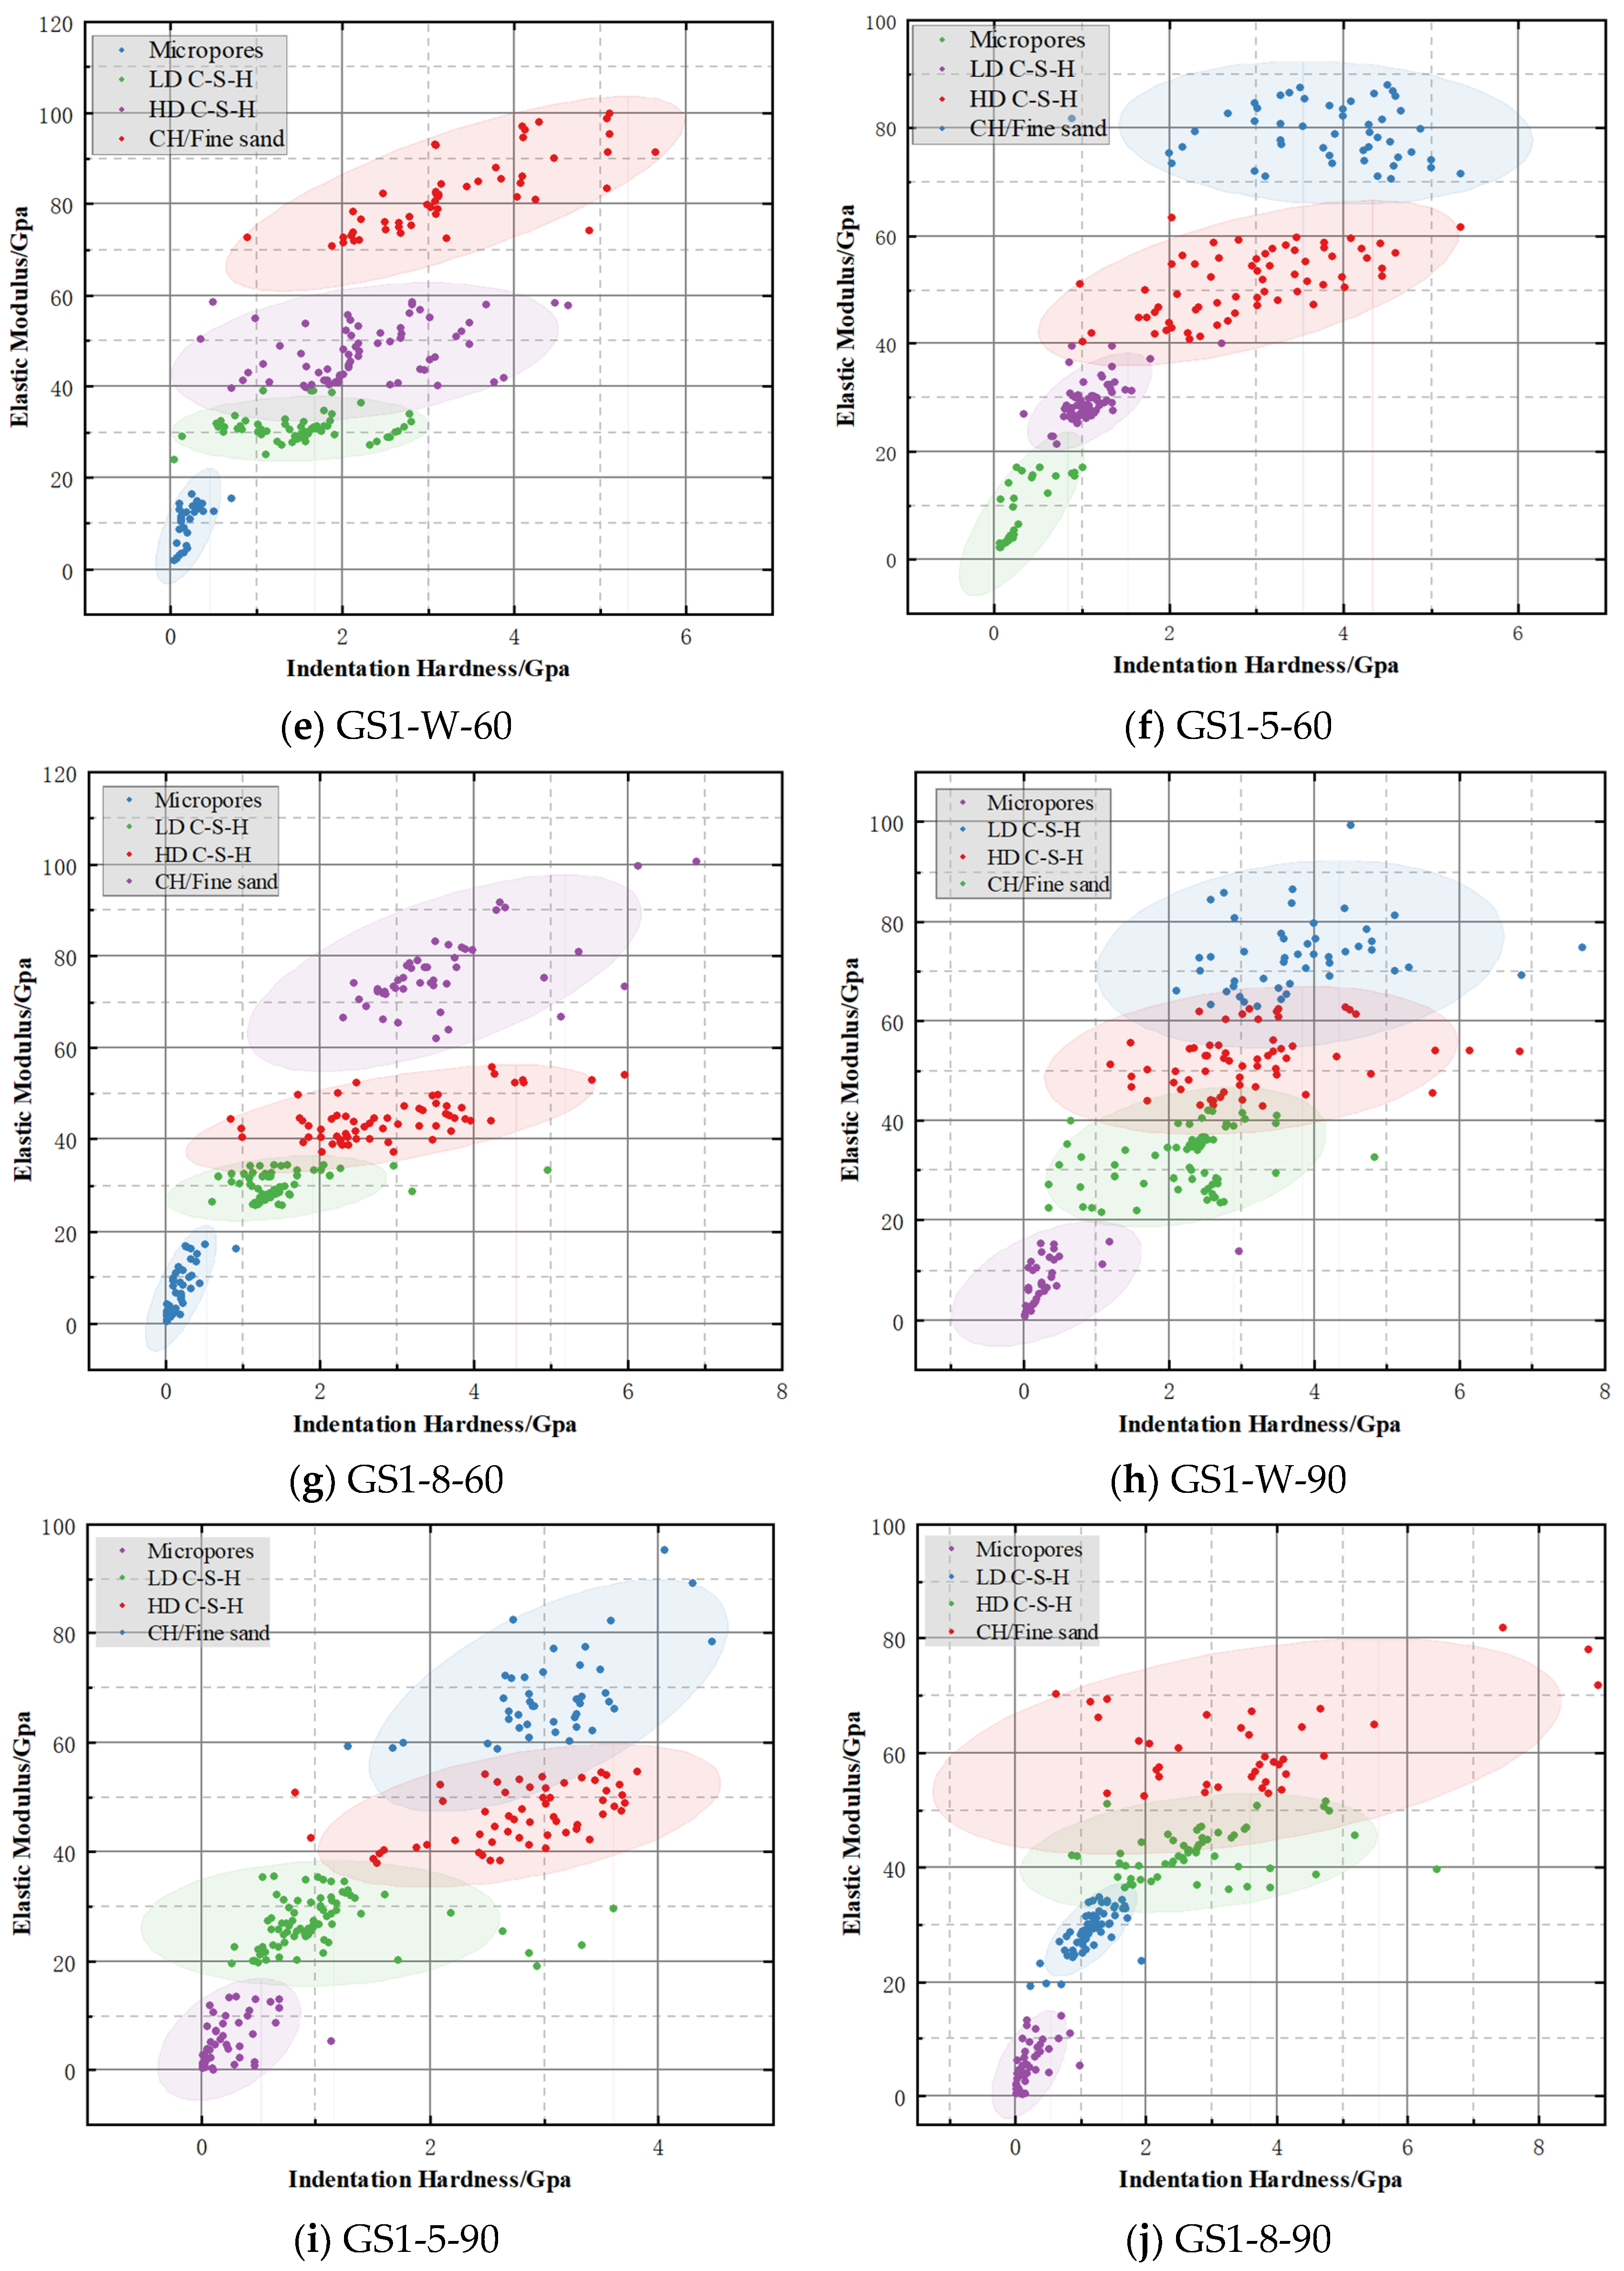
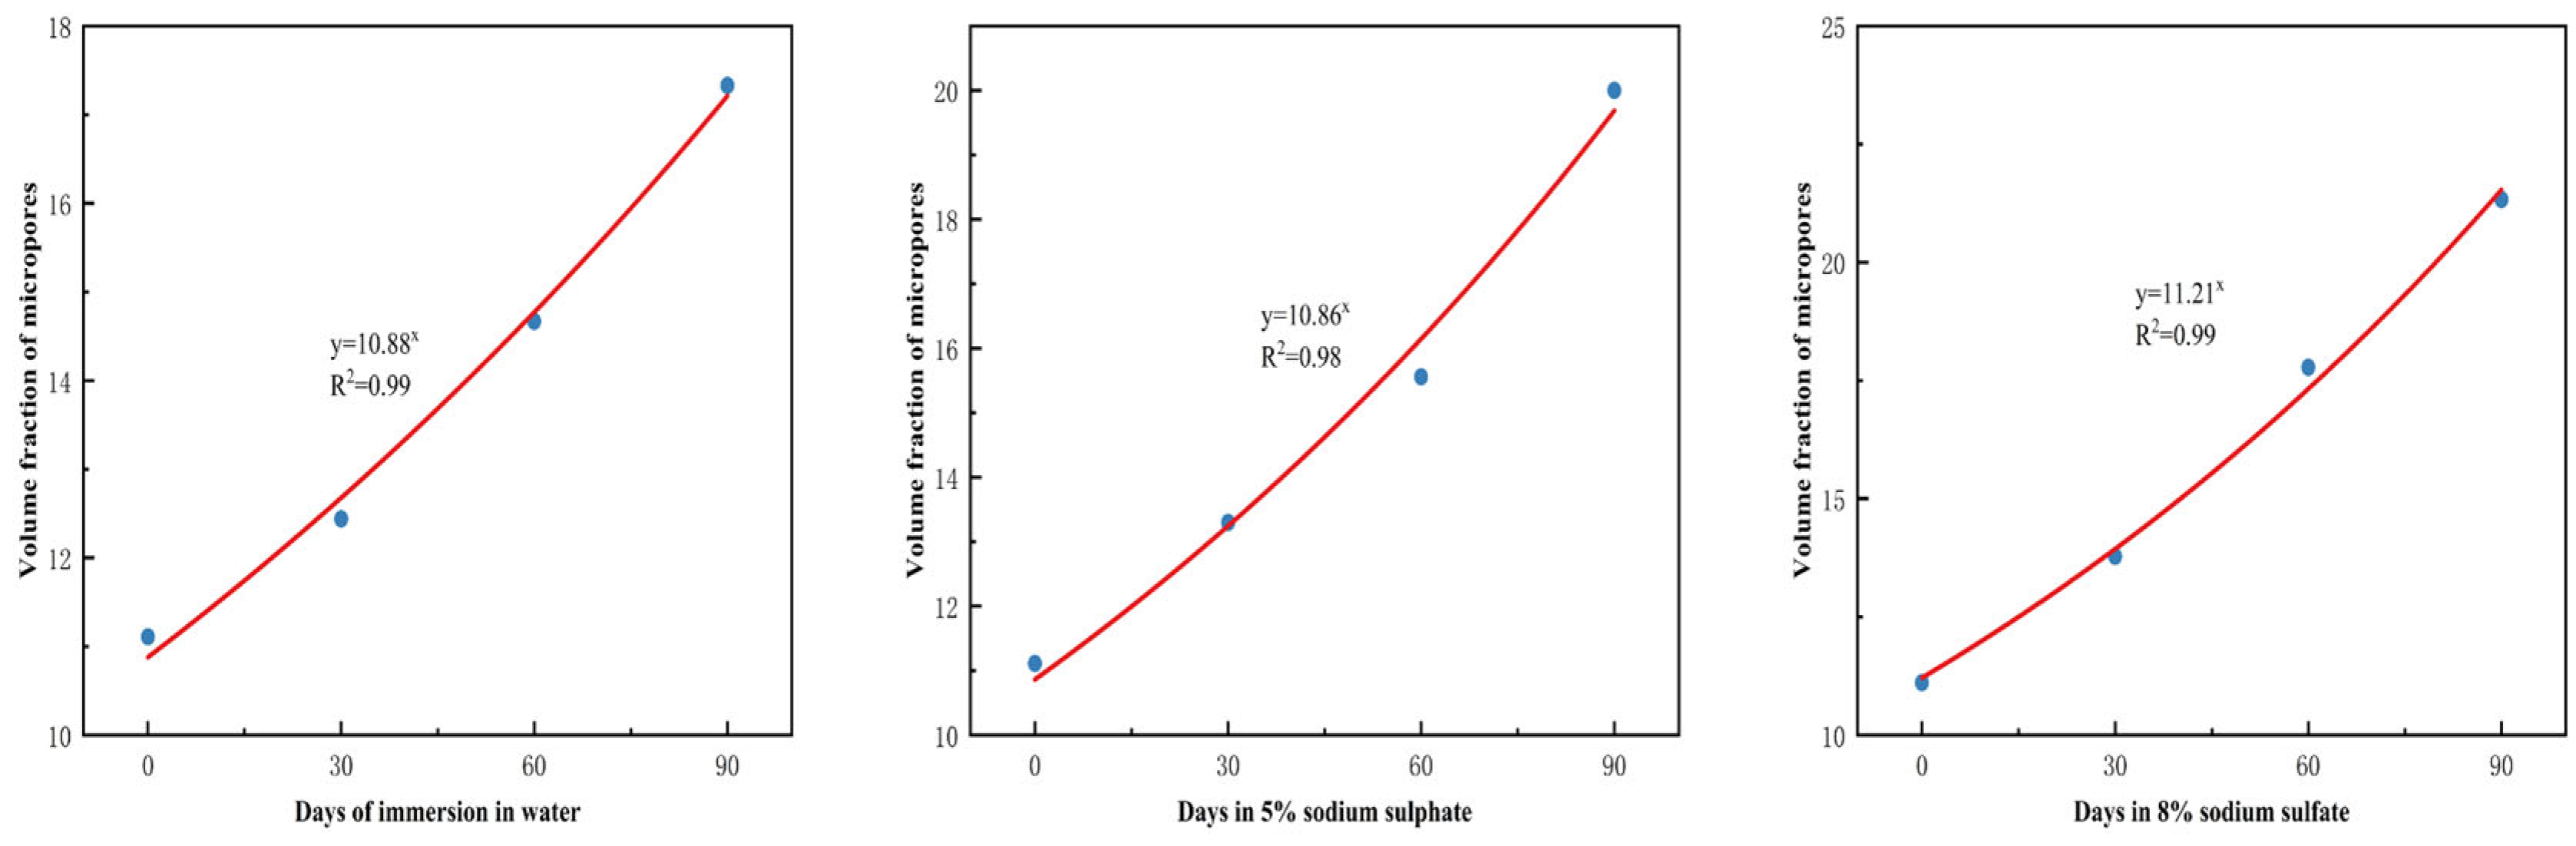
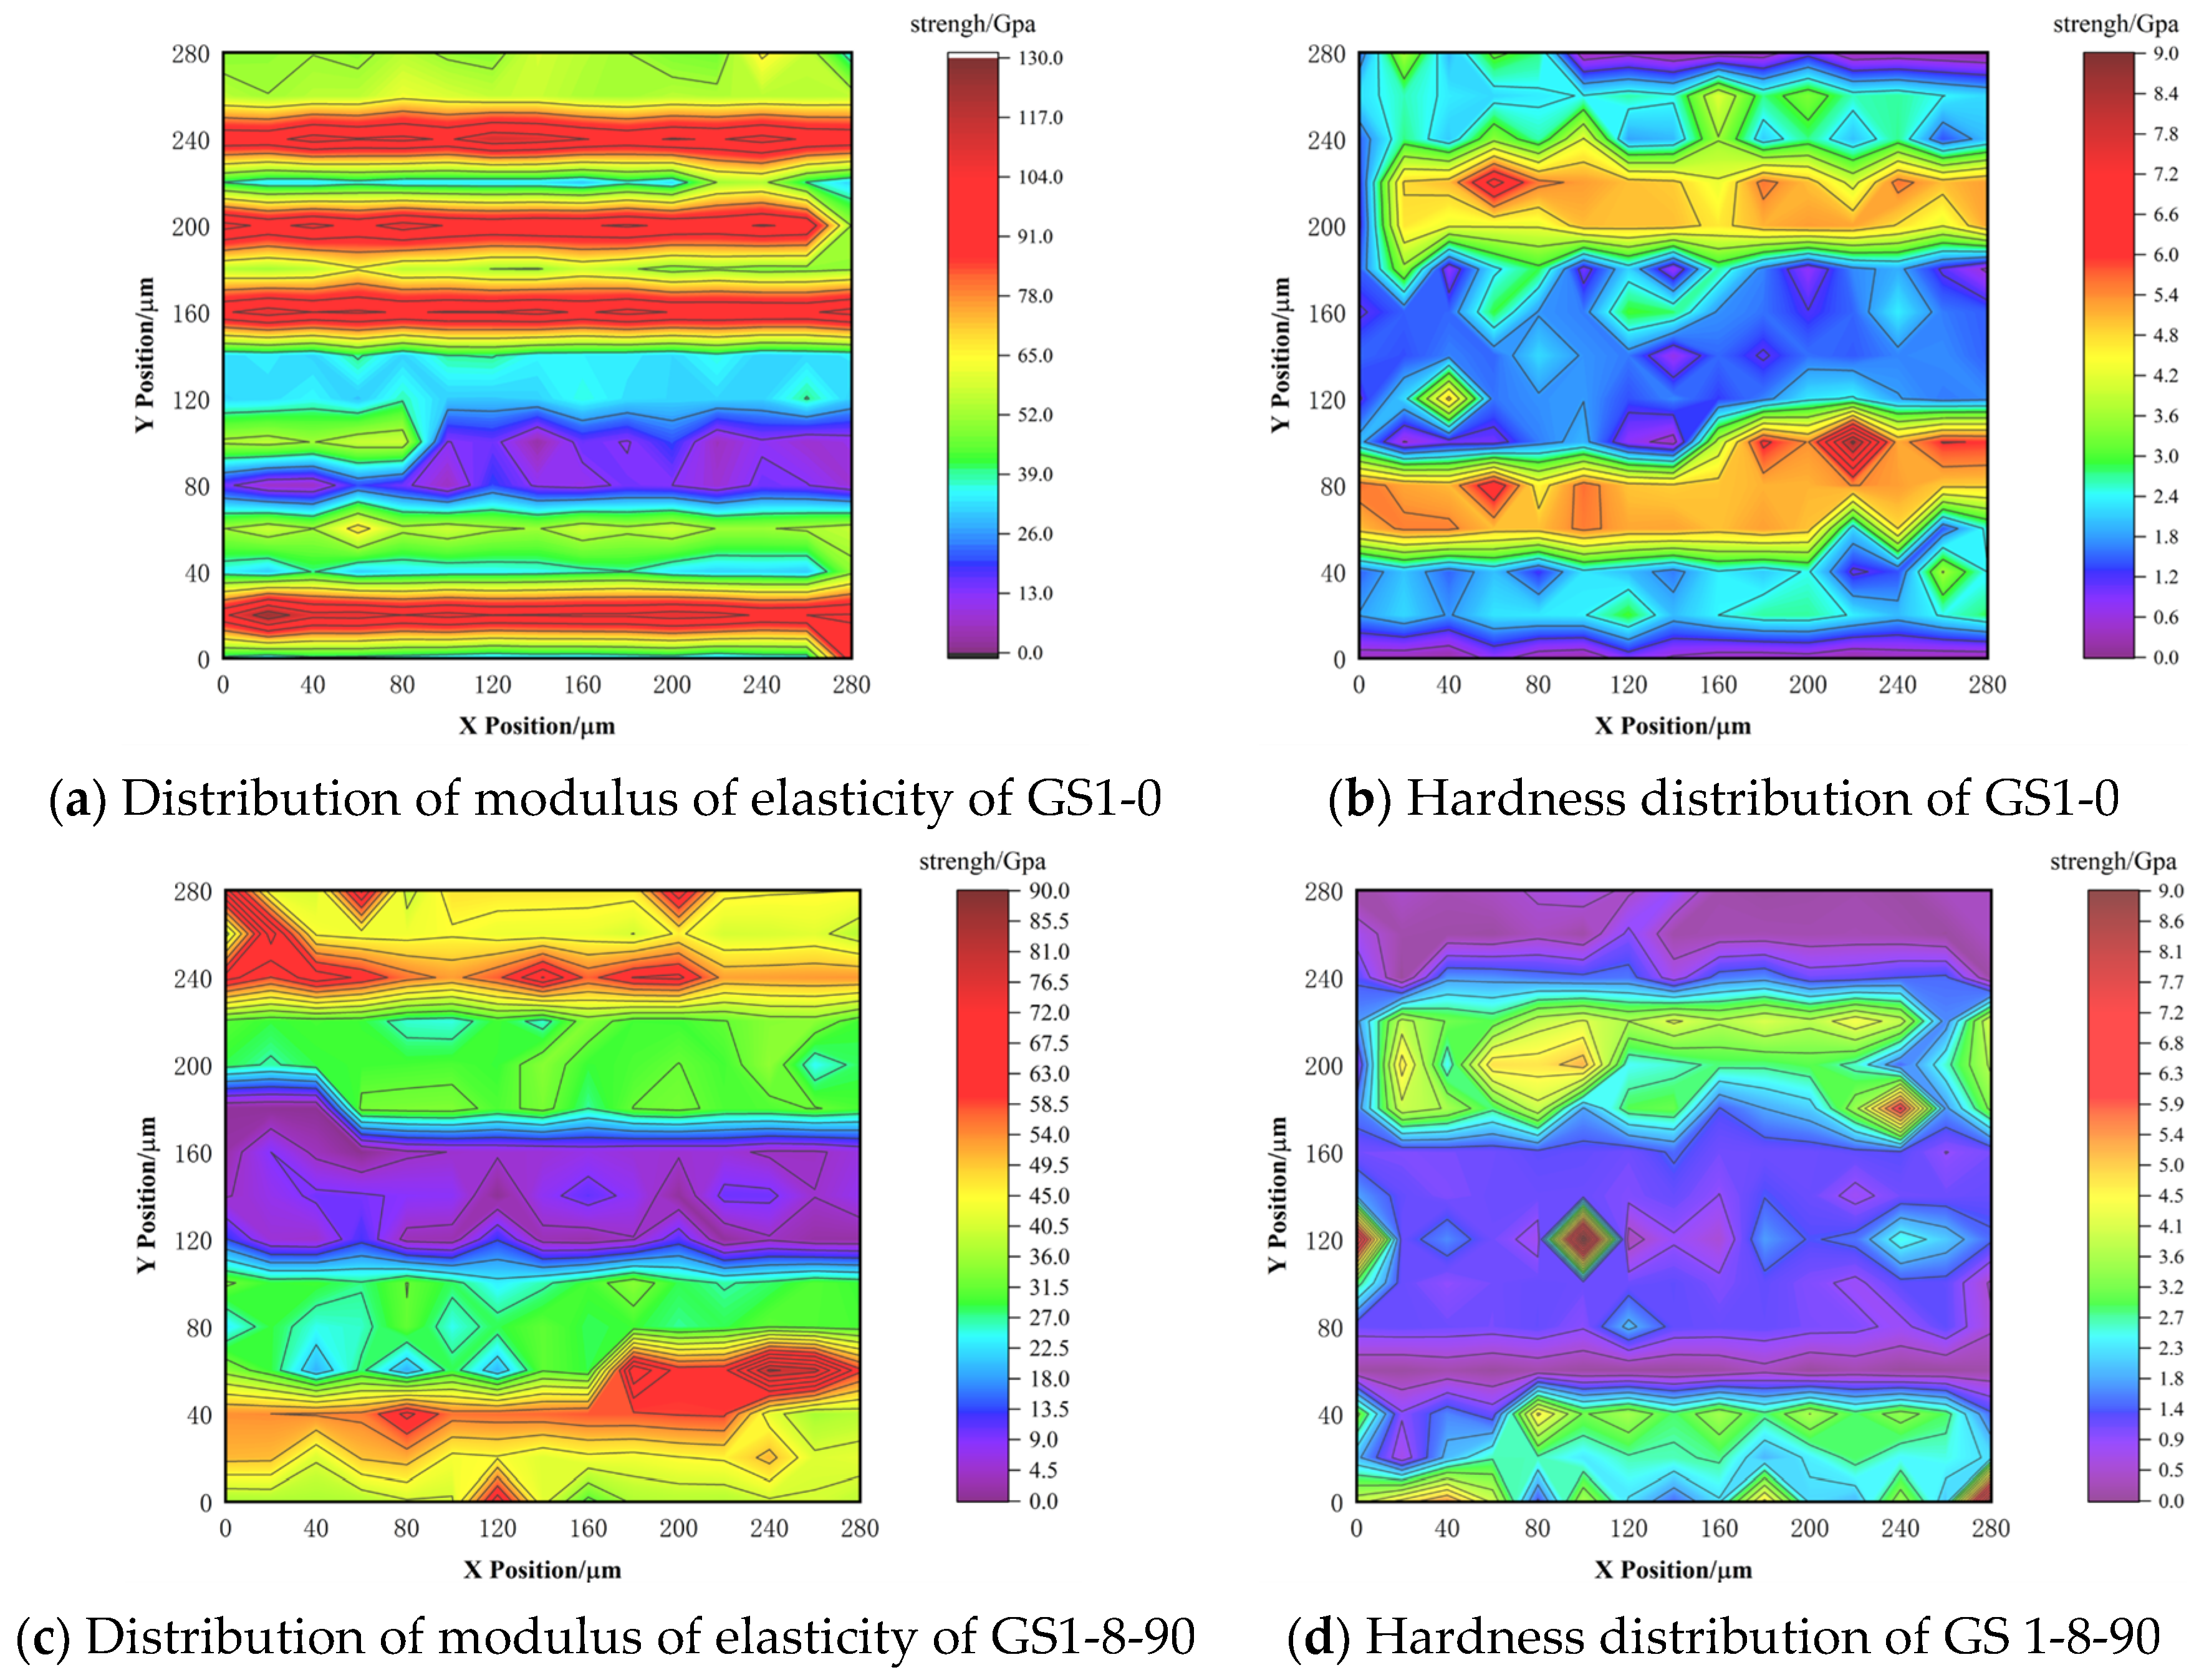
3.5. Mineral Image Cluster Distribution
4. Conclusions
Author Contributions
Funding
Institutional Review Board Statement
Informed Consent Statement
Data Availability Statement
Conflicts of Interest
References
- Xiao, S.H.; Su, G.M.; Tang, M.X.; Chu, X.H.; Zhou, J.; Hu, H.S.; Zhu, W.; Zhang, S. A Review on the Durability of Concrete in Chloride and Sulfate Environments. J. Concr. 2022, 1, 41–45. [Google Scholar]
- Ma, H.; Gong, W.; Yu, H.; Sun, W. Durability of concrete subjected to dry-wet cycles in various types of salt lake brines. Constr. Build. Mater. 2018, 193, 286–294. [Google Scholar] [CrossRef]
- Zheng, S.; Qi, L.; He, R.; Wu, J.; Wang, Z. Erosion damage and expansion evolution of interfacial transition zone in concrete under dry-wet cycles and sulfate erosion. Constr. Build. Mater 2021, 307, 124954. [Google Scholar] [CrossRef]
- Du, F.; Jin, Z.; Xiong, C.; Feng, G.; Chang, H.; Wang, P.; Yang, R.; Zhu, W.; Li, S.; Mohammad, N.M. Nanoindentation analysis of corrosion products and induced expansion stress in reinforced concrete exposed to marine environments. J. Build. Eng. 2023, 78, 107753. [Google Scholar] [CrossRef]
- Wang, Z.; Zong, M.; Zhao, K.; Li, Z.; Tian, J. Experimental Study on Corrosion Resistance and Mechanical Properties of Basalt Fiber Concrete under Sodium Sulfate Environment. J. Build. Struct. 2020, 50, 118–123+37. [Google Scholar]
- Kong, Y.; Zhou, W.; Gao, Y.; Yang, W.; Yu, B.Y.; Cheng, B.J. Resistance of Gypsum Slag Cement Concrete to Sodium Sulfate Erosion. J. Silic. Bull. 2022, 41, 2844–2850. [Google Scholar]
- Tian, L. Research on Macroscopic Properties and Microstructure of Cementitious Materials Against Sulfate Erosion in Salty Soil Area. Master’s Thesis, Lanzhou Jiao Tong University, Lanzhou, China, 2017. [Google Scholar]
- Zhou, M.; Luo, X.; Lu, C.; Zheng, Y.; Hao, F. Experimental Study on Durability of Concrete under Sulfate and Dry-wet Cycling. J. Concr. 2017, 9, 15–19. [Google Scholar]
- Wu, H.; Miao, Y.; Zhu, H.; Zhao, C.; Shu, Z.; Liu, C. Erosion resistance behavior of recycled plastic concrete in sodium sulfate solution. Constr. Build. Mater. 2022, 324, 126630. [Google Scholar] [CrossRef]
- Lu, J.; Tian, L.; Liu, Y.; Tong, L.Q. Experimental Study on Durability of Concrete under Real-time Coupling of Axial Pressure and Sulfate. Appl. Basic Eng. Sci. 2020, 28, 386–395. [Google Scholar]
- Shao, S.; Gong, A.; Wang, F.; Qu, B. Frost Resistance of Alkali-fly ash-added Concrete with Different Saturations under Sulfate Attack. People’s Yangtze River 2024, 55, 222–230. [Google Scholar]
- Liu, Y.; Pang, J. Mechanical Properties and Microstructure of Hybrid Fiber/Rubber Concrete under Sulfate Attack. Acta Mater. Compos. Sin. 2024, 41, 2055–2064. [Google Scholar]
- Zhang, J.; Wan, X.; Lu, J.; Gao, J.; Liu, J.; Zhou, X. Mechanical Properties and Microstructure Deterioration Mechanism of Nano-concrete under Sulfate Erosion. J. Disaster Prev. Mitig. Eng. 2023, 43, 1425–1433. [Google Scholar]
- Zhu, C.J.; Bai, E.L.; Xu, J.Y.; Nie, L.X.; Liu, Z.Q. Study on Dynamic Mechanical Properties of Concrete after Corrosion by Sodium Sulfate. J. Constr. Sci. 2017, 33, 6–10+23. [Google Scholar]
- Jin, Q.L.; Li, G.L.; Wang, H.D.; Liu, J.N.; Zhang, J.J. Application of nanoindentation technology in mechanical testing of materials. Surf. Technol. 2015, 44, 127–136. [Google Scholar]
- GB/T50081-2019; Standard for Test Methods of Concrete Physical and Mechanical Properties. Ministry of Housing and Urban-Rural Development of the People’s Republic of China: Beijing, China, 2019.
- GB/T50082-2024; Standard for Test Methods of Long-Term Performance and Durability of Concrete. Ministry of Housing and Urban-Rural Development of the People’s Republic of China: Beijing, China, 2024.
- Hu, C.; Li, Z. A Review on the Mechanical Properties of Cement-based Materials Measured by Nanoindentation. J. Constr. Build. Mater. 2015, 90, 80–90. [Google Scholar] [CrossRef]
- Oliver, W.C.; Pharr, G.M. Measurement of hardness and elastic modulus by instrumented indentation: Advances in understanding and refinements to methodology. J. Mater. Res. 2004, 19, 3–20. [Google Scholar] [CrossRef]
- Oliver, W.C.; Pharr, G.M. An Improved Technique for Determining Hardness and Elastic Modulus using Load and Displacement Sensing Indentation Experiments. J. Mater. Res. 1992, 7, 1564–1583. [Google Scholar] [CrossRef]
- Zhang, Z.; Qin, J.; Ma, Z.; Pang, X.; Zhou, Y. Comparison of Three Different Deconvolution Methods for Analyzing Nanoindentation Test Data of Hydrated Cement Paste. Cem. Concr. Compos. 2023, 138, 104990. [Google Scholar] [CrossRef]
- Gautham, S.; Sasmal, S. Constitutive Relations of Nanoscale Hydration Products Present in Engineered Cementitious Composites from Machine Learning Assisted Experimental Nanoindentation. J. Build. Eng. 2023, 15, 106912. [Google Scholar] [CrossRef]
- Shan, Y.H.; Tian, D.C.; Zhao, J.S.; Chen, B.; Hou, D.W. High-speed Nanoindentation Cluster Analysis and Mineral Phase Identification of Cementitious Materials. J. Build. Mater. 2023, 26, 563–570. [Google Scholar]
- Sahmaran, M.; Erdem, T.K.; Yaman, I.O. Sulfate resistance of plain and blended cements exposed to wetting–drying and heating–cooling environments. Constr. Build. Mater. 2007, 21, 1771–1778. [Google Scholar] [CrossRef]
- Wang, K.; Guo, J.; Wu, H.; Yang, L. Influence of Dry-wet Ratio on Properties and Microstructure of Concrete under Sulfate Attack. Constr. Build. Mater. 2024, 263, 120635. [Google Scholar] [CrossRef]
- Zhang, J.; Yan, P.; Qin, W. Building Materials; Tsinghua University Press: Beijing, China, 2008. [Google Scholar]
- Hu, C. Nanoindentation as a Tool to Measure and Map Mechanical Properties of Hardened Cement Pastes. MRS Commun. 2015, 5, 83–87. [Google Scholar] [CrossRef]
- Chen, X.; Hou, D.; Han, Y.; Ding, X.; Hua, P. Clustering Analysis of Grid Nanoindentation Data for Cementitious Materials. J. Mater. Sci. 2021, 56, 12238–12255. [Google Scholar] [CrossRef]
- Luo, Q.; Liu, D.; Qiao, P.; Feng, Q.; Sun, L. Microstructural Damage Characterization of Concrete under Freeze-thaw Action. Int. J. Damage Mech. 2018, 27, 1551–1568. [Google Scholar] [CrossRef]
- Ulm, F.J.; Vandamme, M.; Bobko, C.; Ortega, J.A.; Tai, K.; Ortiz, C. Statistical Indentation Techniques for Hydrated Nanocomposites: Concrete, Bone, and Shale. J. Am. Ceram. Soc. 2010, 90, 2677–2692. [Google Scholar] [CrossRef]


| Specific Surface Area | Heat Loss | Admixture | Freezing Time | Bending Strength | Compressive Strength | |||
|---|---|---|---|---|---|---|---|---|
| Condensation | Congeal | 3d | 28d | 3d | 28d | |||
| 355 m2/kg | 2.69% | 13.25% | 2.18 h | 2.68 h | 6.2 MPa | 8.6 MPa | 32.1 MPa | 52.8 MPa |
| SO3 | SiO2 | Al2O3 | CaO | Fe2O3 | MgO | Cl− |
|---|---|---|---|---|---|---|
| 2.33% | 20.50% | 5.11% | 62.23% | 5.22% | 4.06% | 0.03% |
| Water Demand | Heat Loss | Water Content | Fineness |
|---|---|---|---|
| 94.5 | 3.83 | 0.15 | 10.8 |
| Component | GS1 (W/C = 0.43) | GS2 (W/C = 0.35) | GS3 (W/C = 0.30) |
|---|---|---|---|
| Cement | 300 | 360 | 425 |
| Water | 170 | 158 | 150 |
| Fine Aggregate | 664 | 634 | 647 |
| Coarse Agg. | 1155 | 1167 | 1173 |
| Fly Ash | 100 | 90 | 75 |
| Total Mass | 2389 | 2409 | 2470 |
| Concentration | Number | 0 d | 30 d | 60 d | 90 d |
|---|---|---|---|---|---|
| 0% | GS1 |  |  |  | 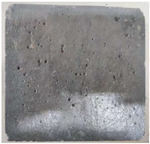 |
| GS2 |  |  | 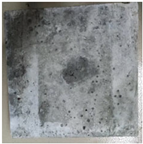 |  | |
| GS3 | 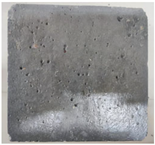 | 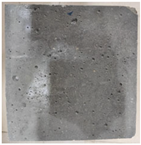 | 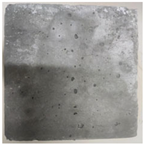 | 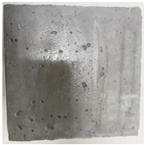 | |
| 5% | GS1 |  | 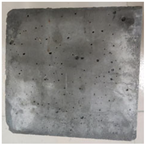 | 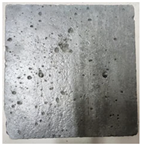 | 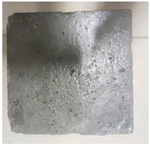 |
| GS2 | 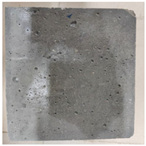 |  | 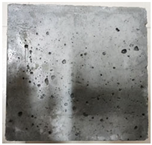 | 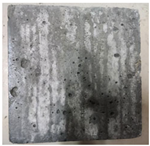 | |
| GS3 | 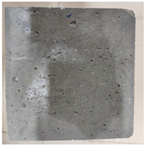 |  | 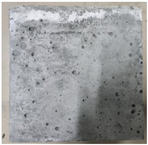 | 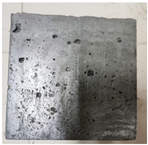 | |
| 8% | GS1 |  | 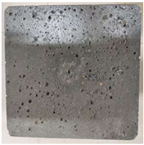 | 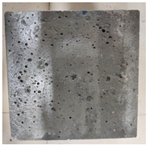 | 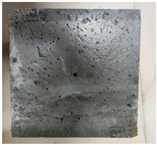 |
| GS2 |  |  |  |  | |
| GS3 |  | 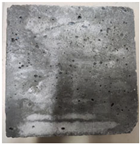 |  |  |
| Phase | K- Means/GPa | Different Erosion Conditions | |||||||||
|---|---|---|---|---|---|---|---|---|---|---|---|
| GS1-0 | GS1-W-30 | GS1-5-30 | GS1-8-30 | GS1-W-60 | GS1-5-60 | GS1-8-60 | GS1-W-90 | GS1-5-90 | GS1-8-90 | ||
| Micropores | E | 11.89 ± 6.00 | 10.7 ± 6.00 | 10.16 ± 10.4 | 10.24 ± 8.60 | 9.42 ± 6.08 | 8.43 ± 8.70 | 7.69 ± 9.40 | 7.26 ± 8.44 | 5.64 ± 7.76 | 5.50 ± 8.40 |
| H | 0.33 ± 0.68 | 0.39 ± 0.40 | 0.78 ± 0.70 | 0.41 ± 0.59 | 0.21 ± 0.49 | 0.31 ± 0.69 | 0.20 ± 0.30 | 0.31 ± 2.50 | 0.24 ± 0.36 | 0.22 ± 0.68 | |
| f | 11.11% | 12.44% | 13.3% | 13.78% | 14.67% | 15.56% | 17.78% | 17.33% | 20% | 21.33% | |
| LD C-S-H | E | 33.66 ± 6.24 | 32.24 ± 4.82 | 33.64 ± 11.8 | 30.50 ± 9.20 | 30.74 ± 8.26 | 29.23 ± 10.40 | 29.43 ± 5.17 | 32.69 ± 9.30 | 26.90 ± 8.60 | 29.12 ± 4.18 |
| H | 1.69 ± 3.20 | 1.39 ± 2.31 | 1.84 ± 0.46 | 1.51 ± 0.90 | 1.50 ± 0.16 | 1.09 ± 0.56 | 1.43 ± 2.50 | 2.24 ± 2.55 | 1.04 ± 1.90 | 1.16 ± 0.74 | |
| f | 32% | 33.33% | 31.11% | 31.56% | 32.44% | 34.20% | 34.22% | 35.11% | 35.56% | 36.45% | |
| HD C-S-H | E | 54.13 ± 4.17 | 42.10 ± 7.20 | 60.52 ± 19.3 | 55.03 ± 13.50 | 47.63 ± 10.87 | 51.52 ± 10.3 | 44.51 ± 11.0 | 52.08 ± 10.50 | 46.64 ± 8.16 | 42.55 ± 8.40 |
| H | 2.14 ± 1.50 | 2.4 ± 1.08 | 3.49 ± 2.40 | 1.78 ± 0.52 | 2.26 ± 0.55 | 2.91 ± 2.30 | 2.92 ± 1.58 | 3.13 ± 2.51 | 2.78 ± 0.72 | 2.80 ± 2.30 | |
| f | 30.22% | 28.44% | 30.67% | 30.22% | 29.78% | 28.44% | 27.56% | 26.67% | 25.78% | 25.34% | |
| CH/ Fine sand | E | 105.02 ± 19.00 | 86.15 ± 5.65 | 86.88 ± 18.6 | 84.38 ± 16.9 | 82.26 ± 16.54 | 79.15 ± 8.75 | 76.24 ± 20.70 | 73.40 ± 12.20 | 68.62 ± 20.60 | 61.14 ± 16.80 |
| H | 5.20 ± 0.96 | 4.71 ± 0.82 | 5.75 ± 1.80 | 3.96 ± 1.87 | 3.31 ± 1.76 | 3.80 ± 1.21 | 3.62 ± 2.52 | 3.71 ± 2.9 | 3.04 ± 1.36 | 3.53 ± 5.10 | |
| f | 26.67% | 25.33% | 24.89% | 24.44% | 23.11% | 21.78% | 20.44% | 20.89% | 18.67% | 16.89% | |
Disclaimer/Publisher’s Note: The statements, opinions and data contained in all publications are solely those of the individual author(s) and contributor(s) and not of MDPI and/or the editor(s). MDPI and/or the editor(s) disclaim responsibility for any injury to people or property resulting from any ideas, methods, instructions or products referred to in the content. |
© 2025 by the authors. Licensee MDPI, Basel, Switzerland. This article is an open access article distributed under the terms and conditions of the Creative Commons Attribution (CC BY) license (https://creativecommons.org/licenses/by/4.0/).
Share and Cite
Sun, Y.; You, M.; Yin, X.; Hou, D.; Li, J.; Zhou, X. Study on the Micro-Mechanism of Corrosion Deterioration of Concrete Under Sulfate Attack Environment. Materials 2025, 18, 2904. https://doi.org/10.3390/ma18122904
Sun Y, You M, Yin X, Hou D, Li J, Zhou X. Study on the Micro-Mechanism of Corrosion Deterioration of Concrete Under Sulfate Attack Environment. Materials. 2025; 18(12):2904. https://doi.org/10.3390/ma18122904
Chicago/Turabian StyleSun, Yuzhou, Mengjie You, Xiaosan Yin, Dongchang Hou, Jimin Li, and Xiangming Zhou. 2025. "Study on the Micro-Mechanism of Corrosion Deterioration of Concrete Under Sulfate Attack Environment" Materials 18, no. 12: 2904. https://doi.org/10.3390/ma18122904
APA StyleSun, Y., You, M., Yin, X., Hou, D., Li, J., & Zhou, X. (2025). Study on the Micro-Mechanism of Corrosion Deterioration of Concrete Under Sulfate Attack Environment. Materials, 18(12), 2904. https://doi.org/10.3390/ma18122904