Author Contributions
Conceptualization, S.B.A., Q.C., E.Y. and D.W.; methodology, S.B.A., Q.C. and E.Y.; software, S.B.A. and Q.C.; validation, S.B.A., Q.C. and D.W.; formal analysis, S.B.A., Q.C., E.Y. and D.W.; investigation, Q.C., E.Y. and D.W.; resources, S.B.A., Q.C., E.Y. and D.W.; data curation, S.B.A., Q.C., E.Y. and D.W.; writing—original draft preparation, S.B.A. and Q.C.; writing—review and editing, E.Y. and D.W.; visualization, S.B.A., Q.C., E.Y. and D.W.; supervision, Q.C.; project administration, Q.C. and S.B.A. All authors have read and agreed to the published version of the manuscript.
Figure 1.
Presents (a–d) Step by Step CPB preparation, (e) required sample for testing process, (f) non-destructive methods and (g) destructive testing method.
Figure 1.
Presents (a–d) Step by Step CPB preparation, (e) required sample for testing process, (f) non-destructive methods and (g) destructive testing method.
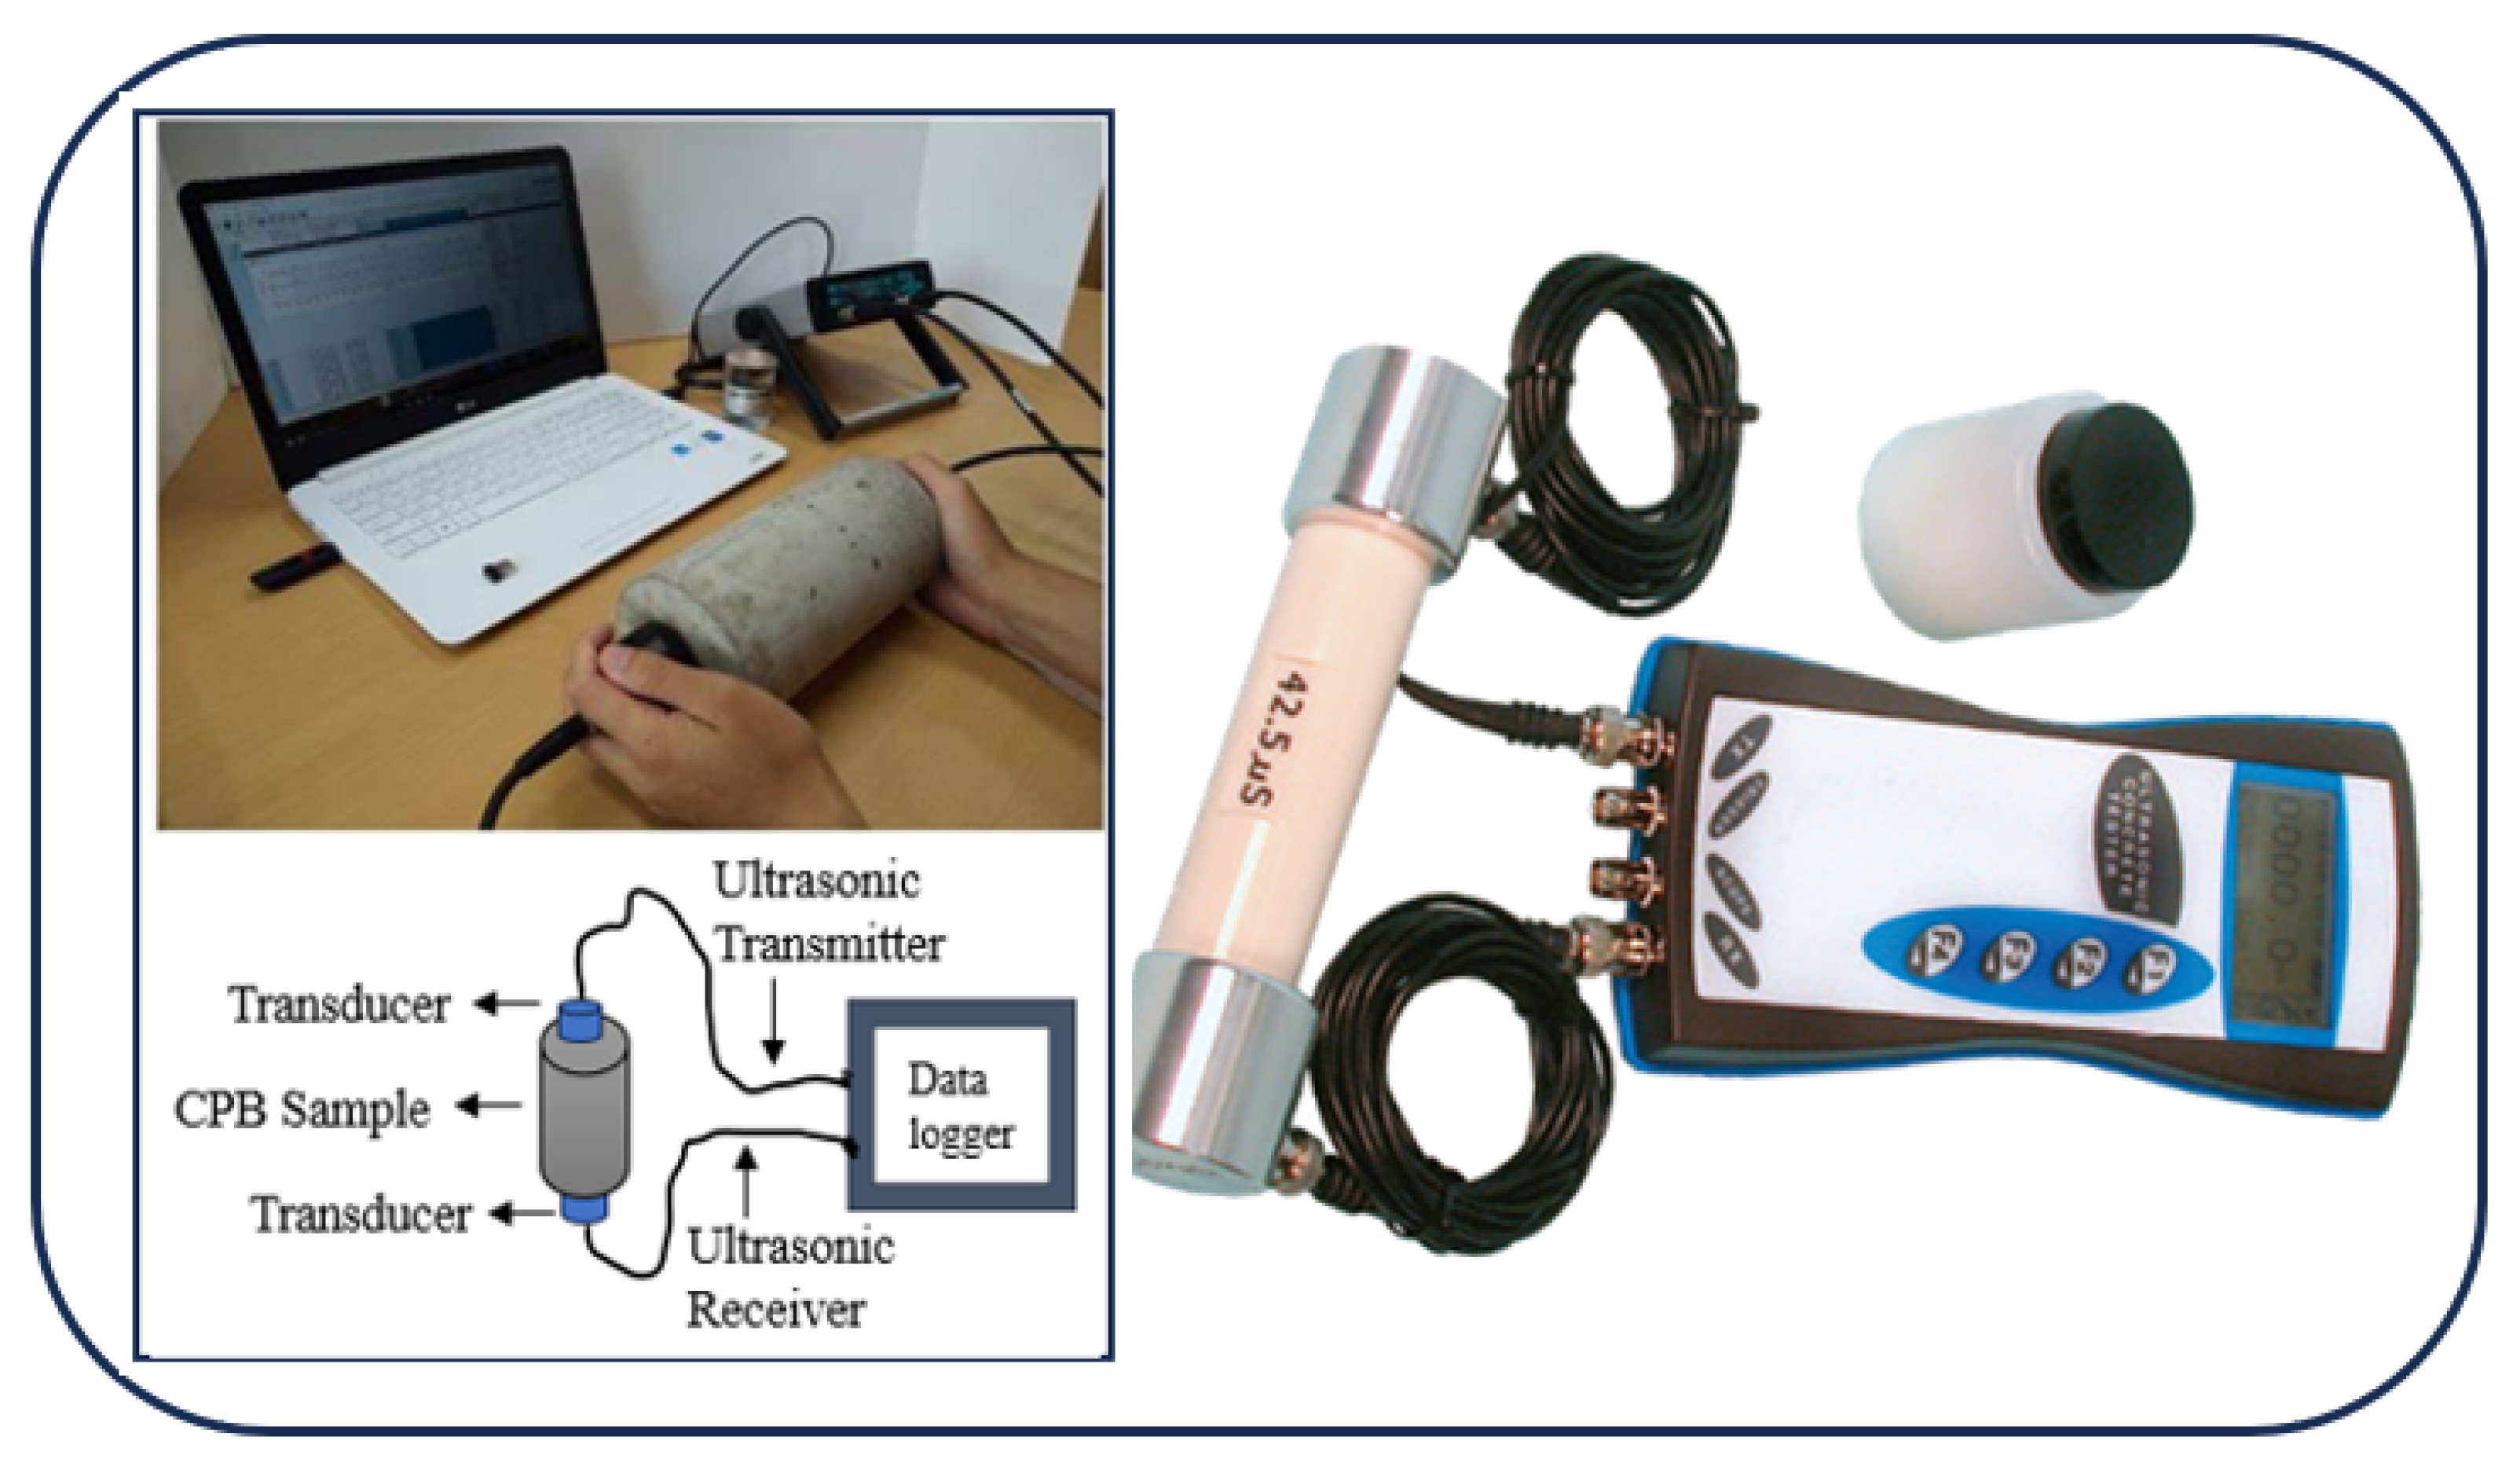
Figure 2.
Image showing UPV Testing Setup as NDT method for CPB sample. It includes an ultrasound transmitter, a transducer for the CPB sample, a data logger, and an ultrasound receiver.
Figure 2.
Image showing UPV Testing Setup as NDT method for CPB sample. It includes an ultrasound transmitter, a transducer for the CPB sample, a data logger, and an ultrasound receiver.
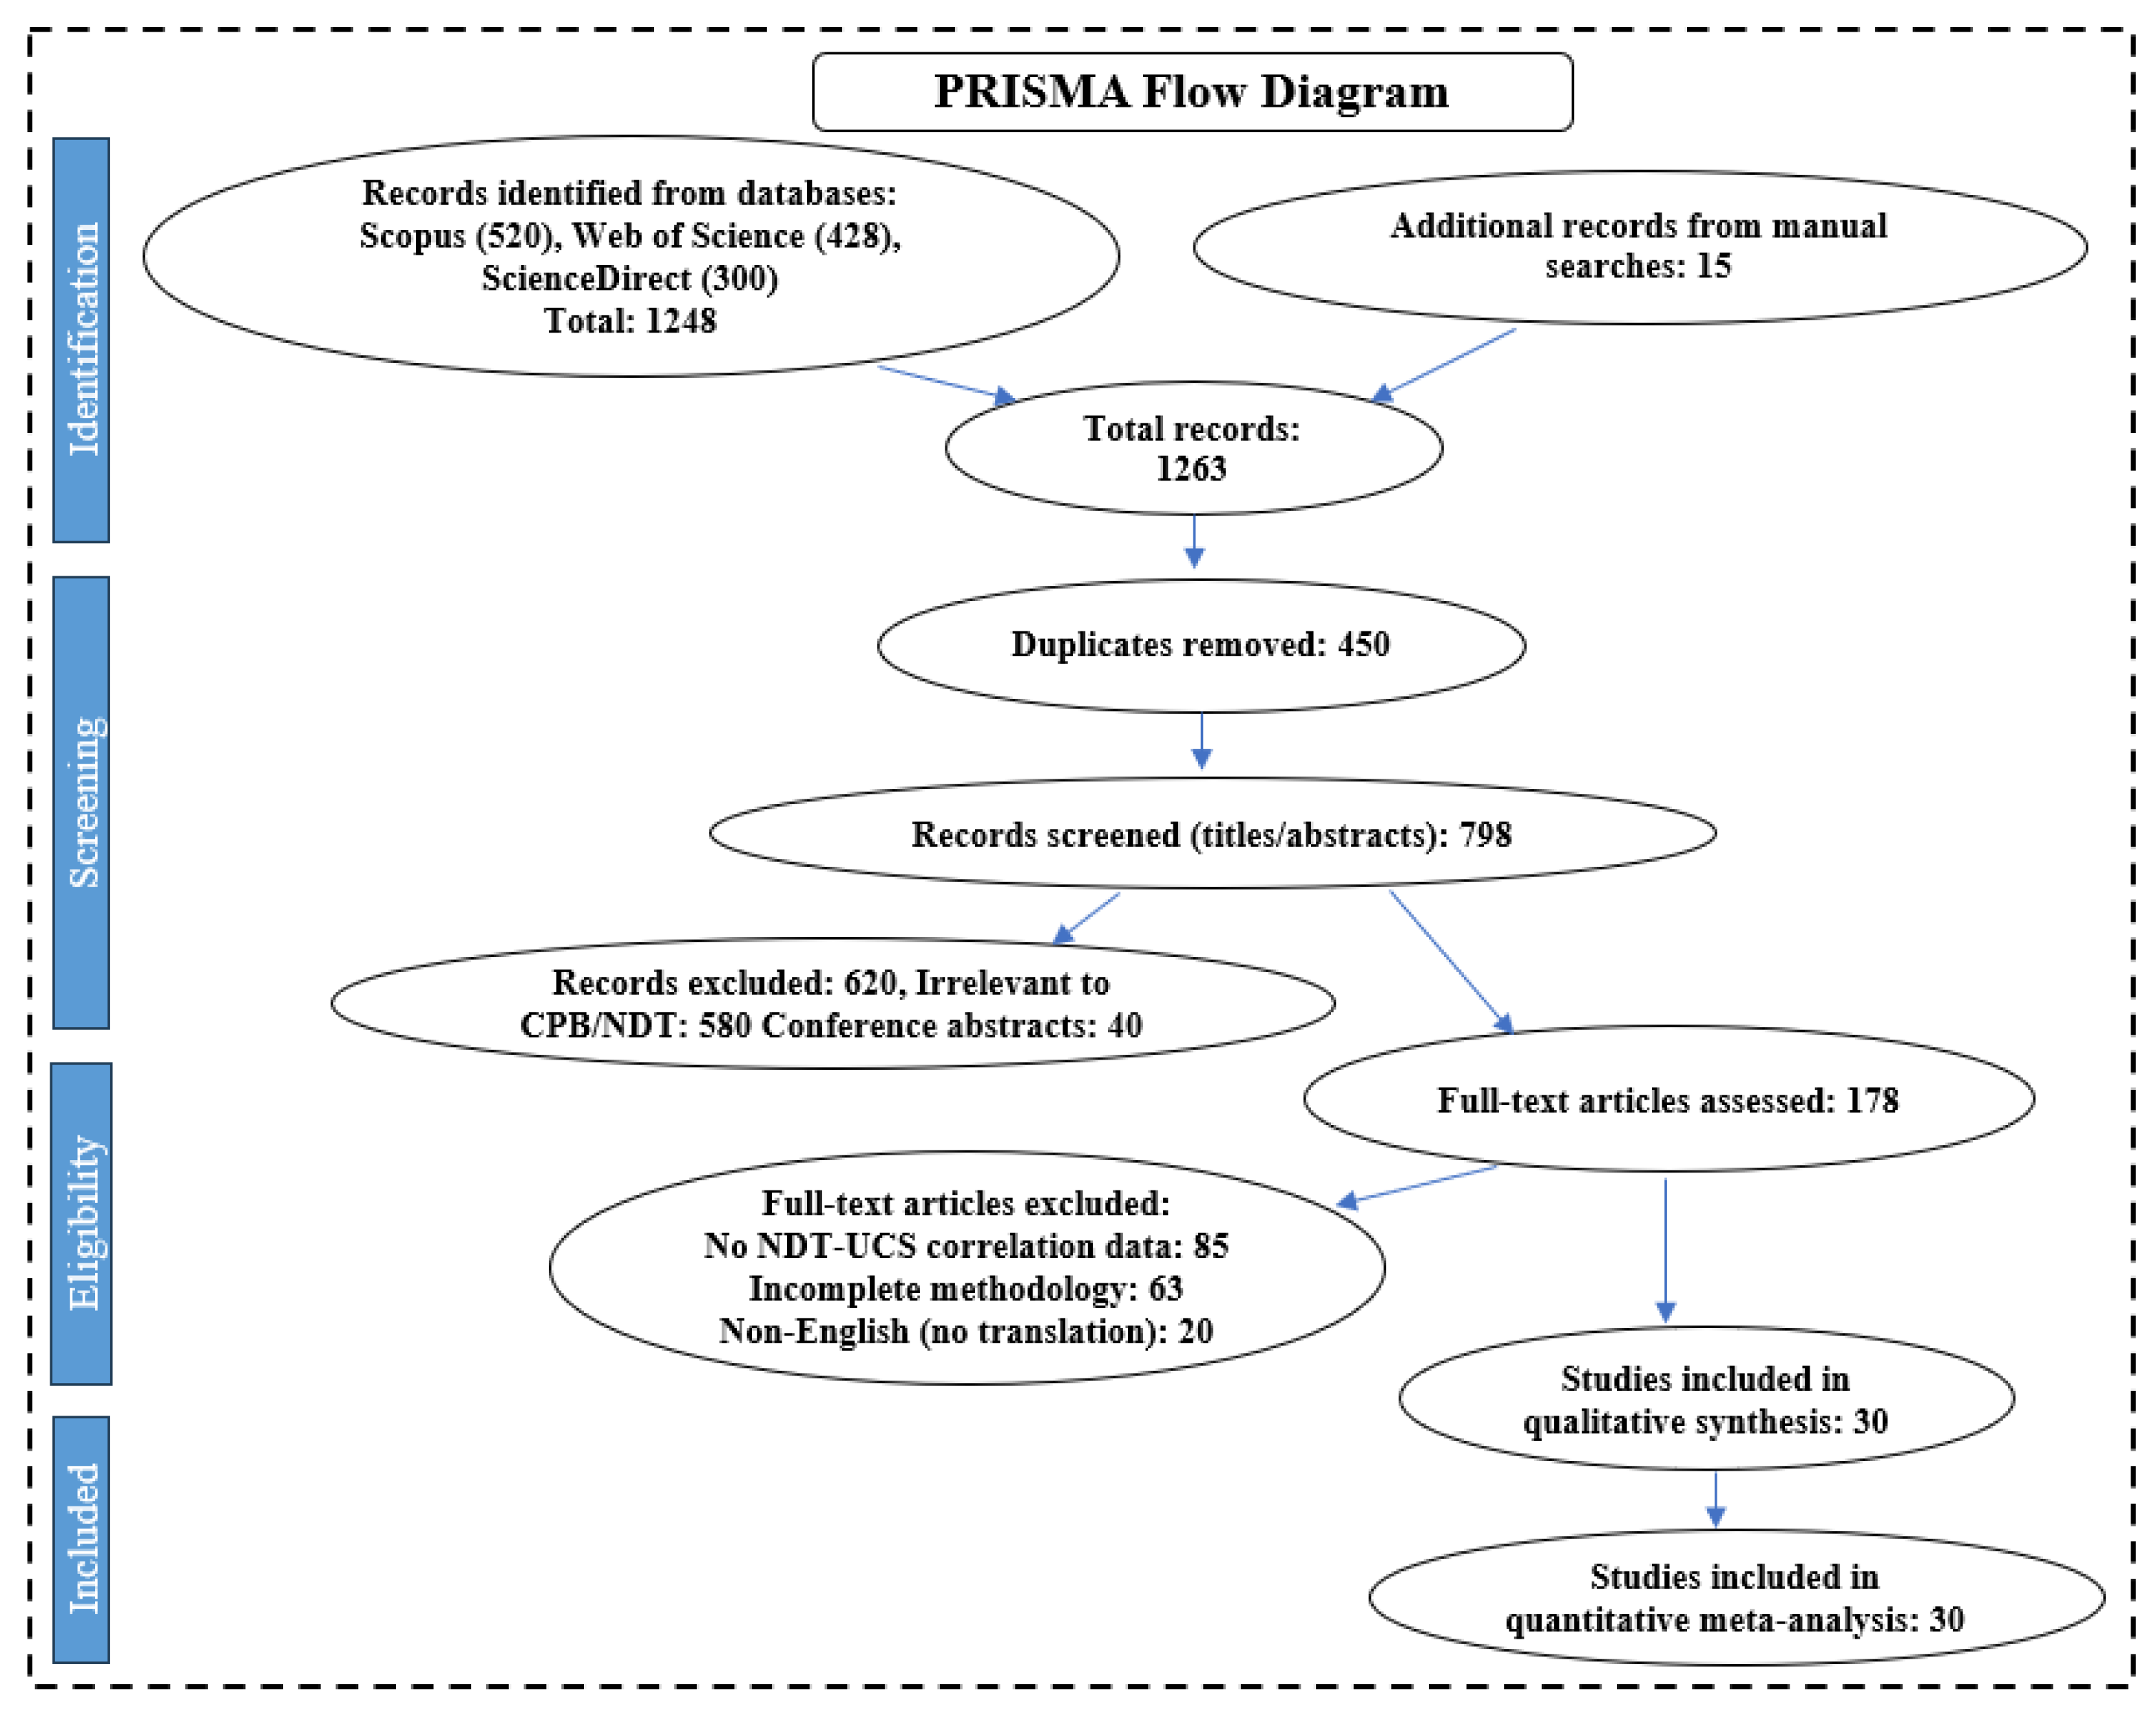
Figure 3.
PRISMA flowchart illustrating the method used to search and select literature systematically. From the 1248 records identified, 30 studies were chosen for the meta-analysis.
Figure 3.
PRISMA flowchart illustrating the method used to search and select literature systematically. From the 1248 records identified, 30 studies were chosen for the meta-analysis.
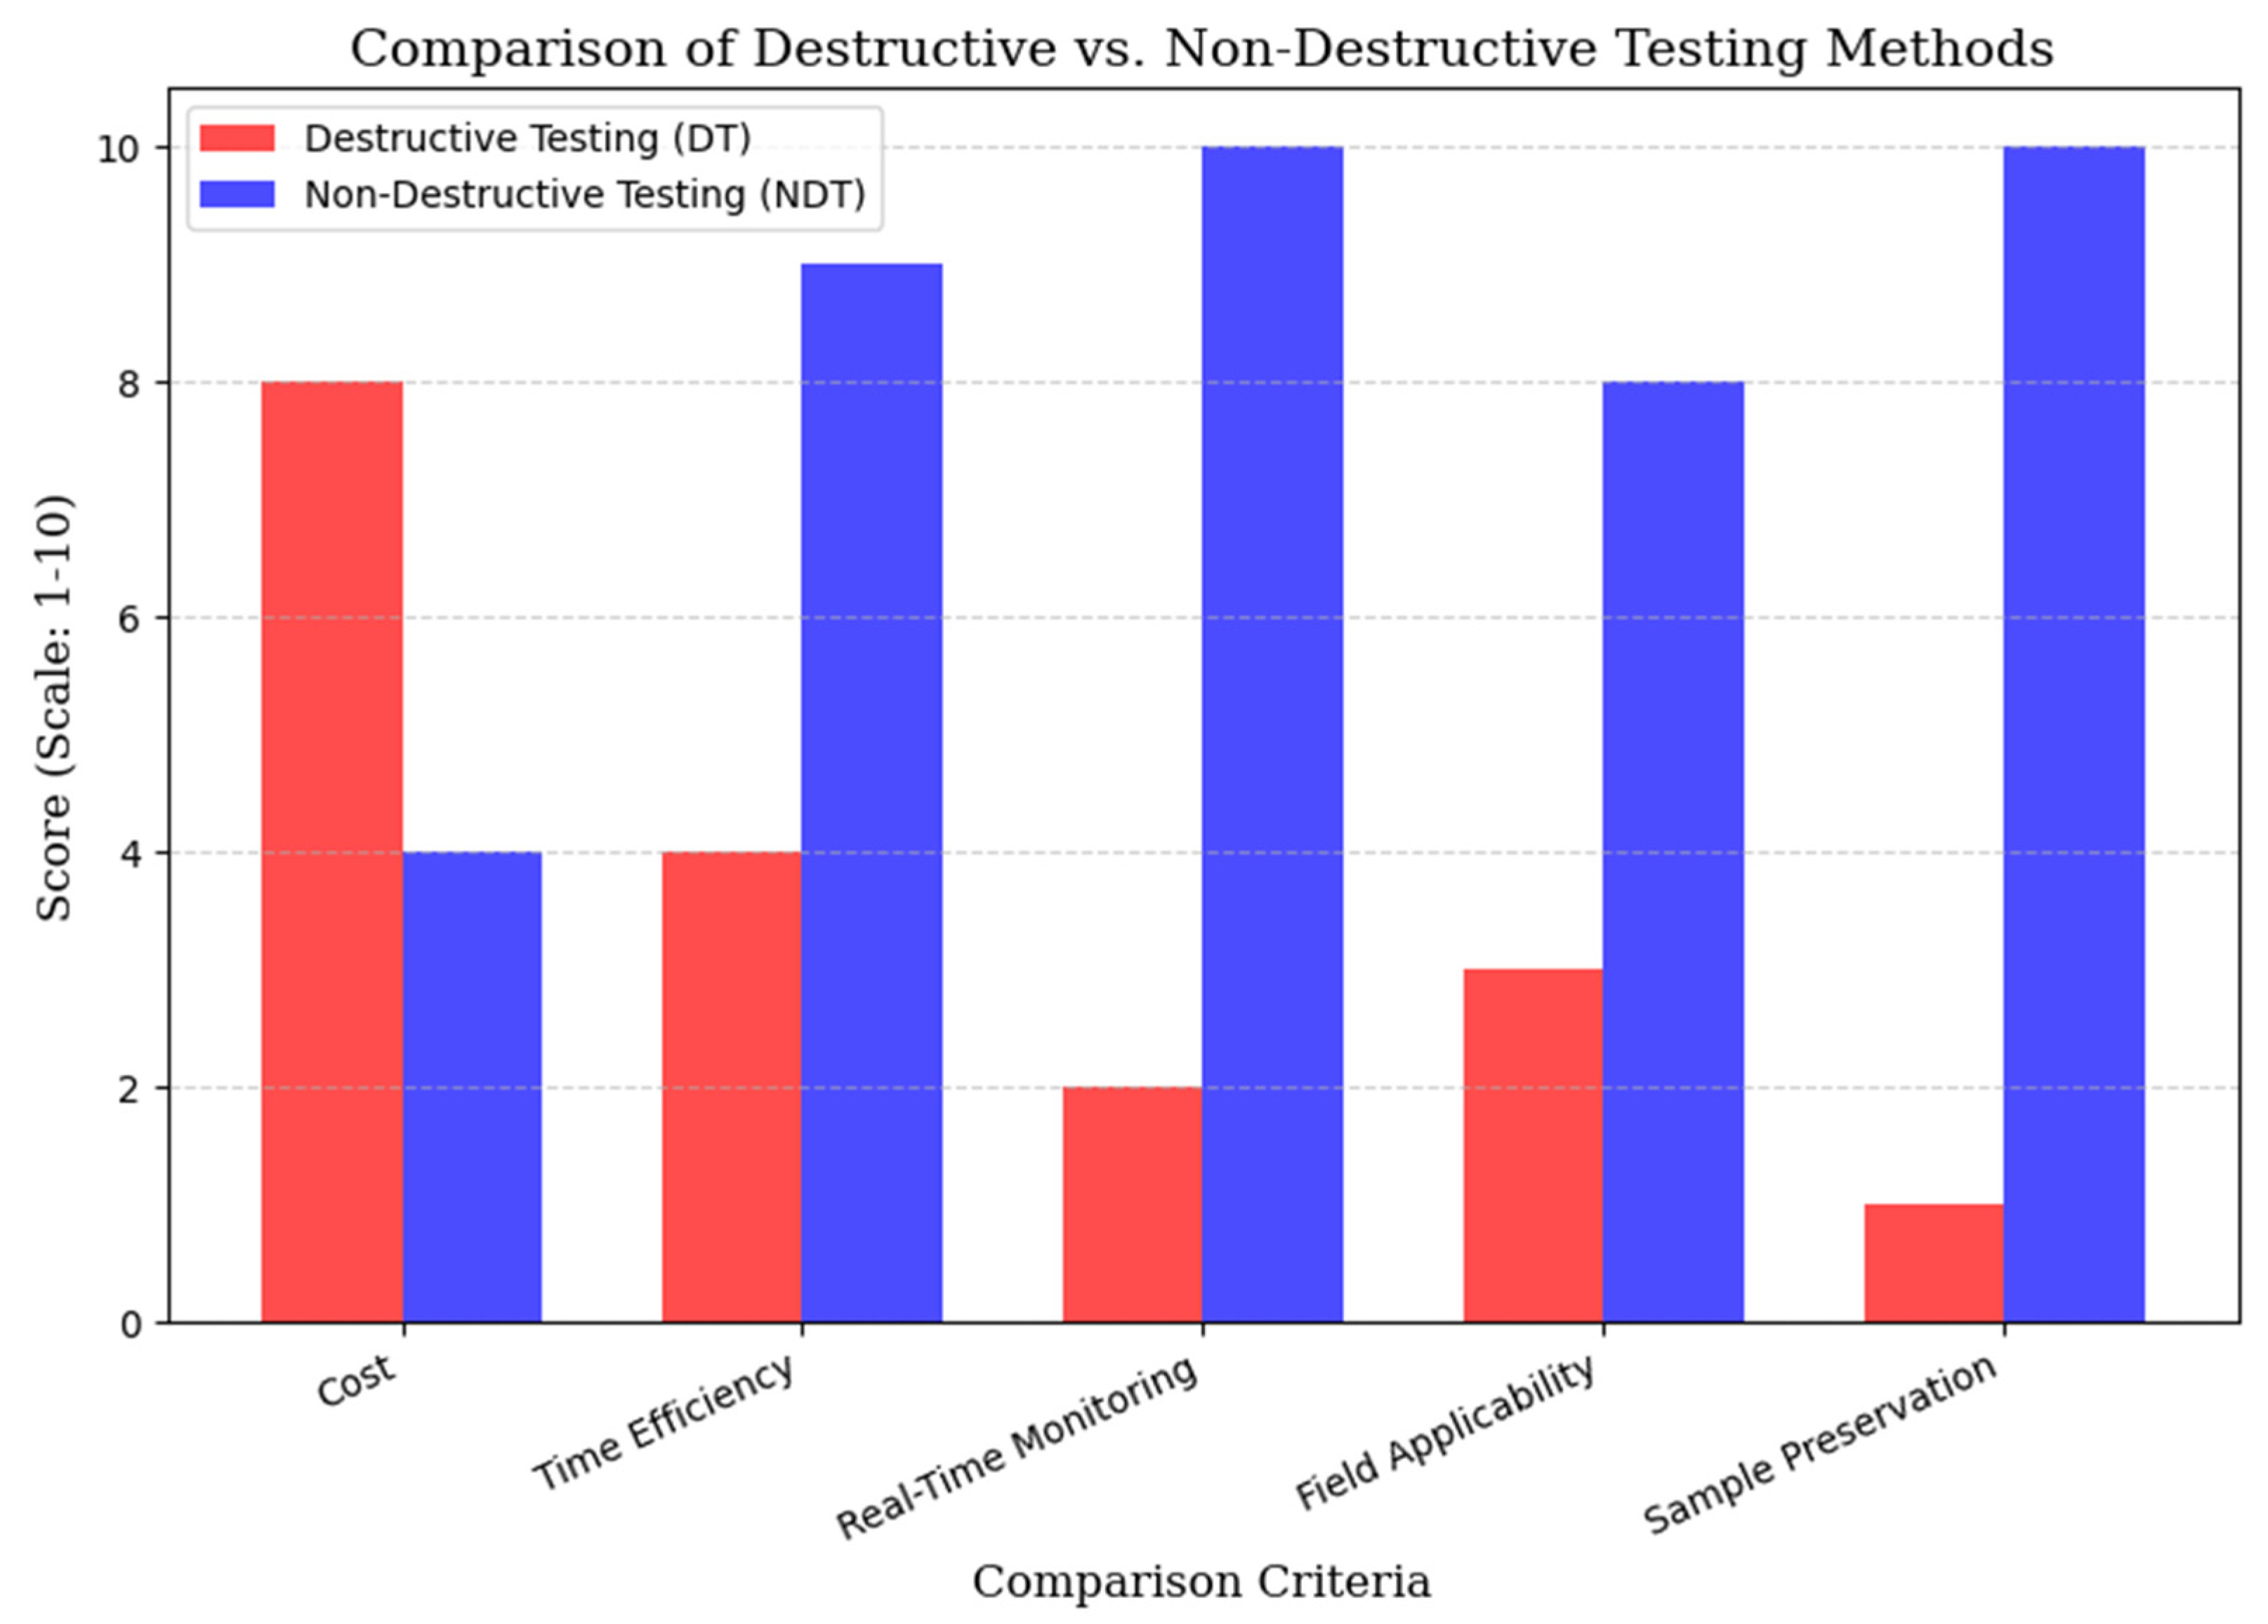
Figure 4.
Bar chart comparing DT and NDT across key assessment criteria. It focuses on important factors like saving resources, reducing costs, and material integrity preservation.
Figure 4.
Bar chart comparing DT and NDT across key assessment criteria. It focuses on important factors like saving resources, reducing costs, and material integrity preservation.
Figure 5.
Scatter plot graph showing the relationship between UPV and UCS across different studies [
13,
16,
24,
53,
74,
75,
76,
77,
78,
79].
Figure 5.
Scatter plot graph showing the relationship between UPV and UCS across different studies [
13,
16,
24,
53,
74,
75,
76,
77,
78,
79].
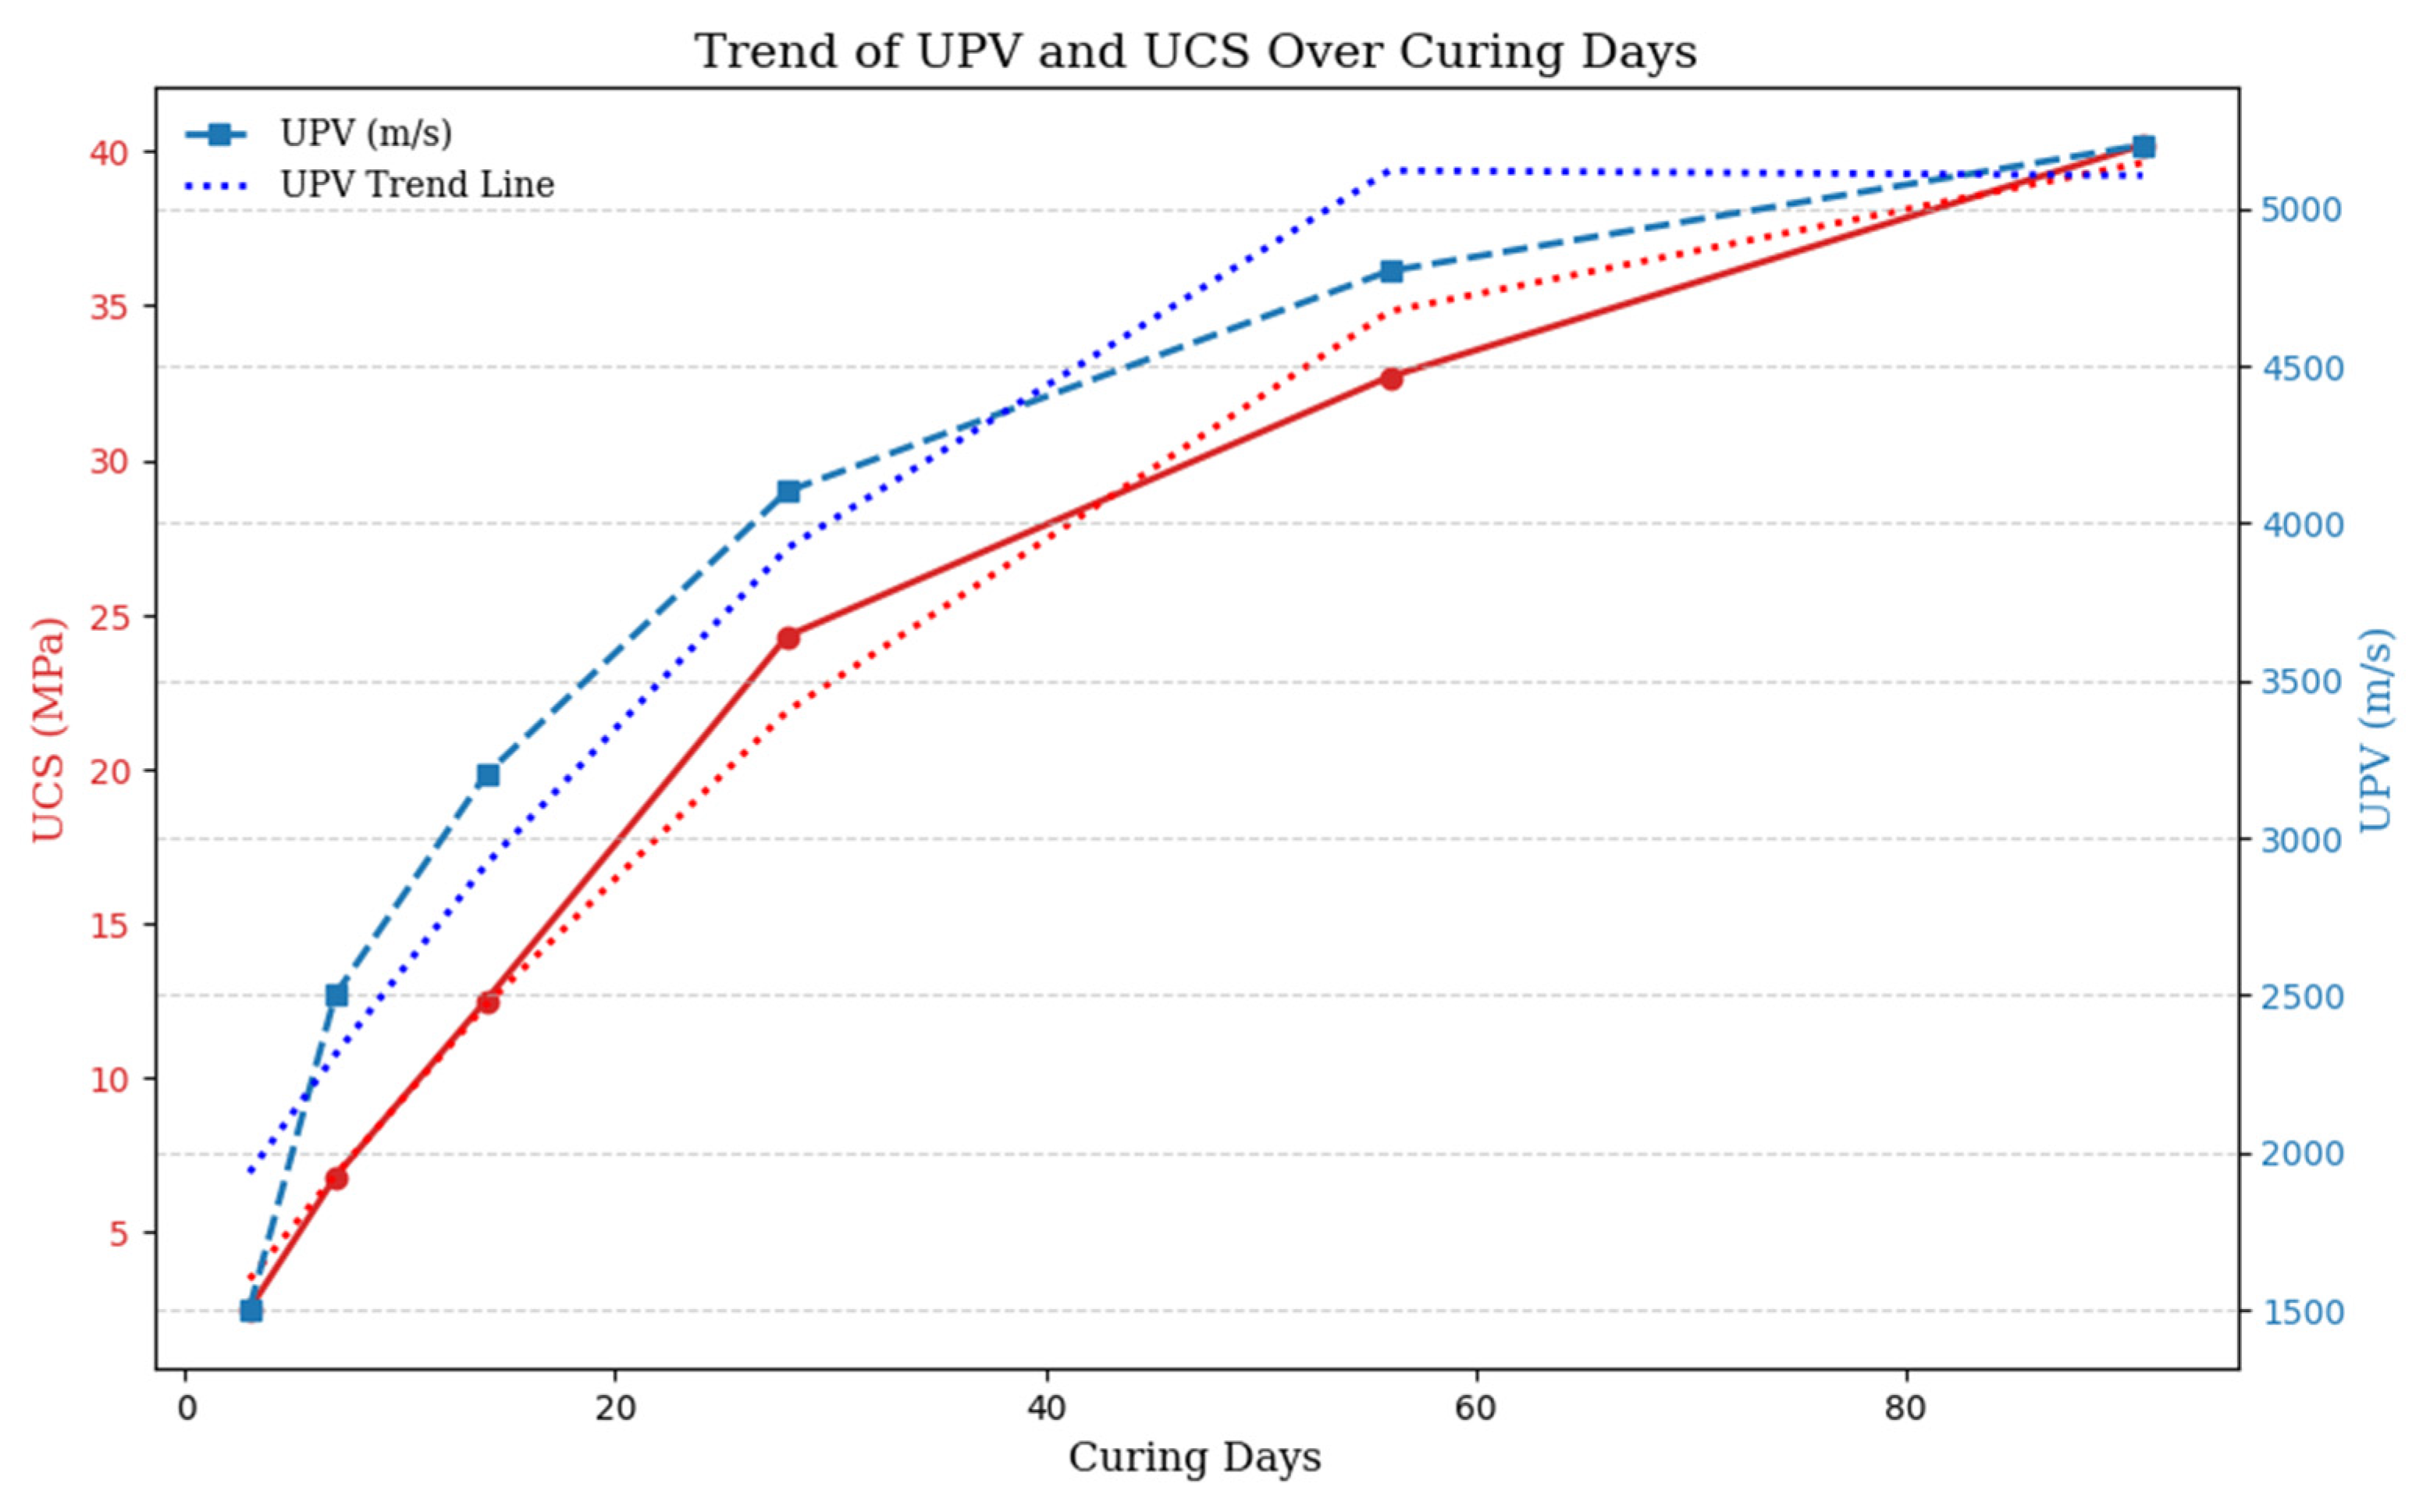
Figure 6.
This figure shows the evolution of UCS (MPa) and UPV (m/s) with curing days. The red dotted line represents the polynomial trend for UCS, while quadratic trend lines (dashed) are fitted for both UCS and UPV, highlighting their increase over time.
Figure 6.
This figure shows the evolution of UCS (MPa) and UPV (m/s) with curing days. The red dotted line represents the polynomial trend for UCS, while quadratic trend lines (dashed) are fitted for both UCS and UPV, highlighting their increase over time.
Figure 7.
Scatter plot graph showing the relationship between ER and UCS across different studies [
25,
60,
80,
81,
82,
83,
84,
85,
86,
87].
Figure 7.
Scatter plot graph showing the relationship between ER and UCS across different studies [
25,
60,
80,
81,
82,
83,
84,
85,
86,
87].
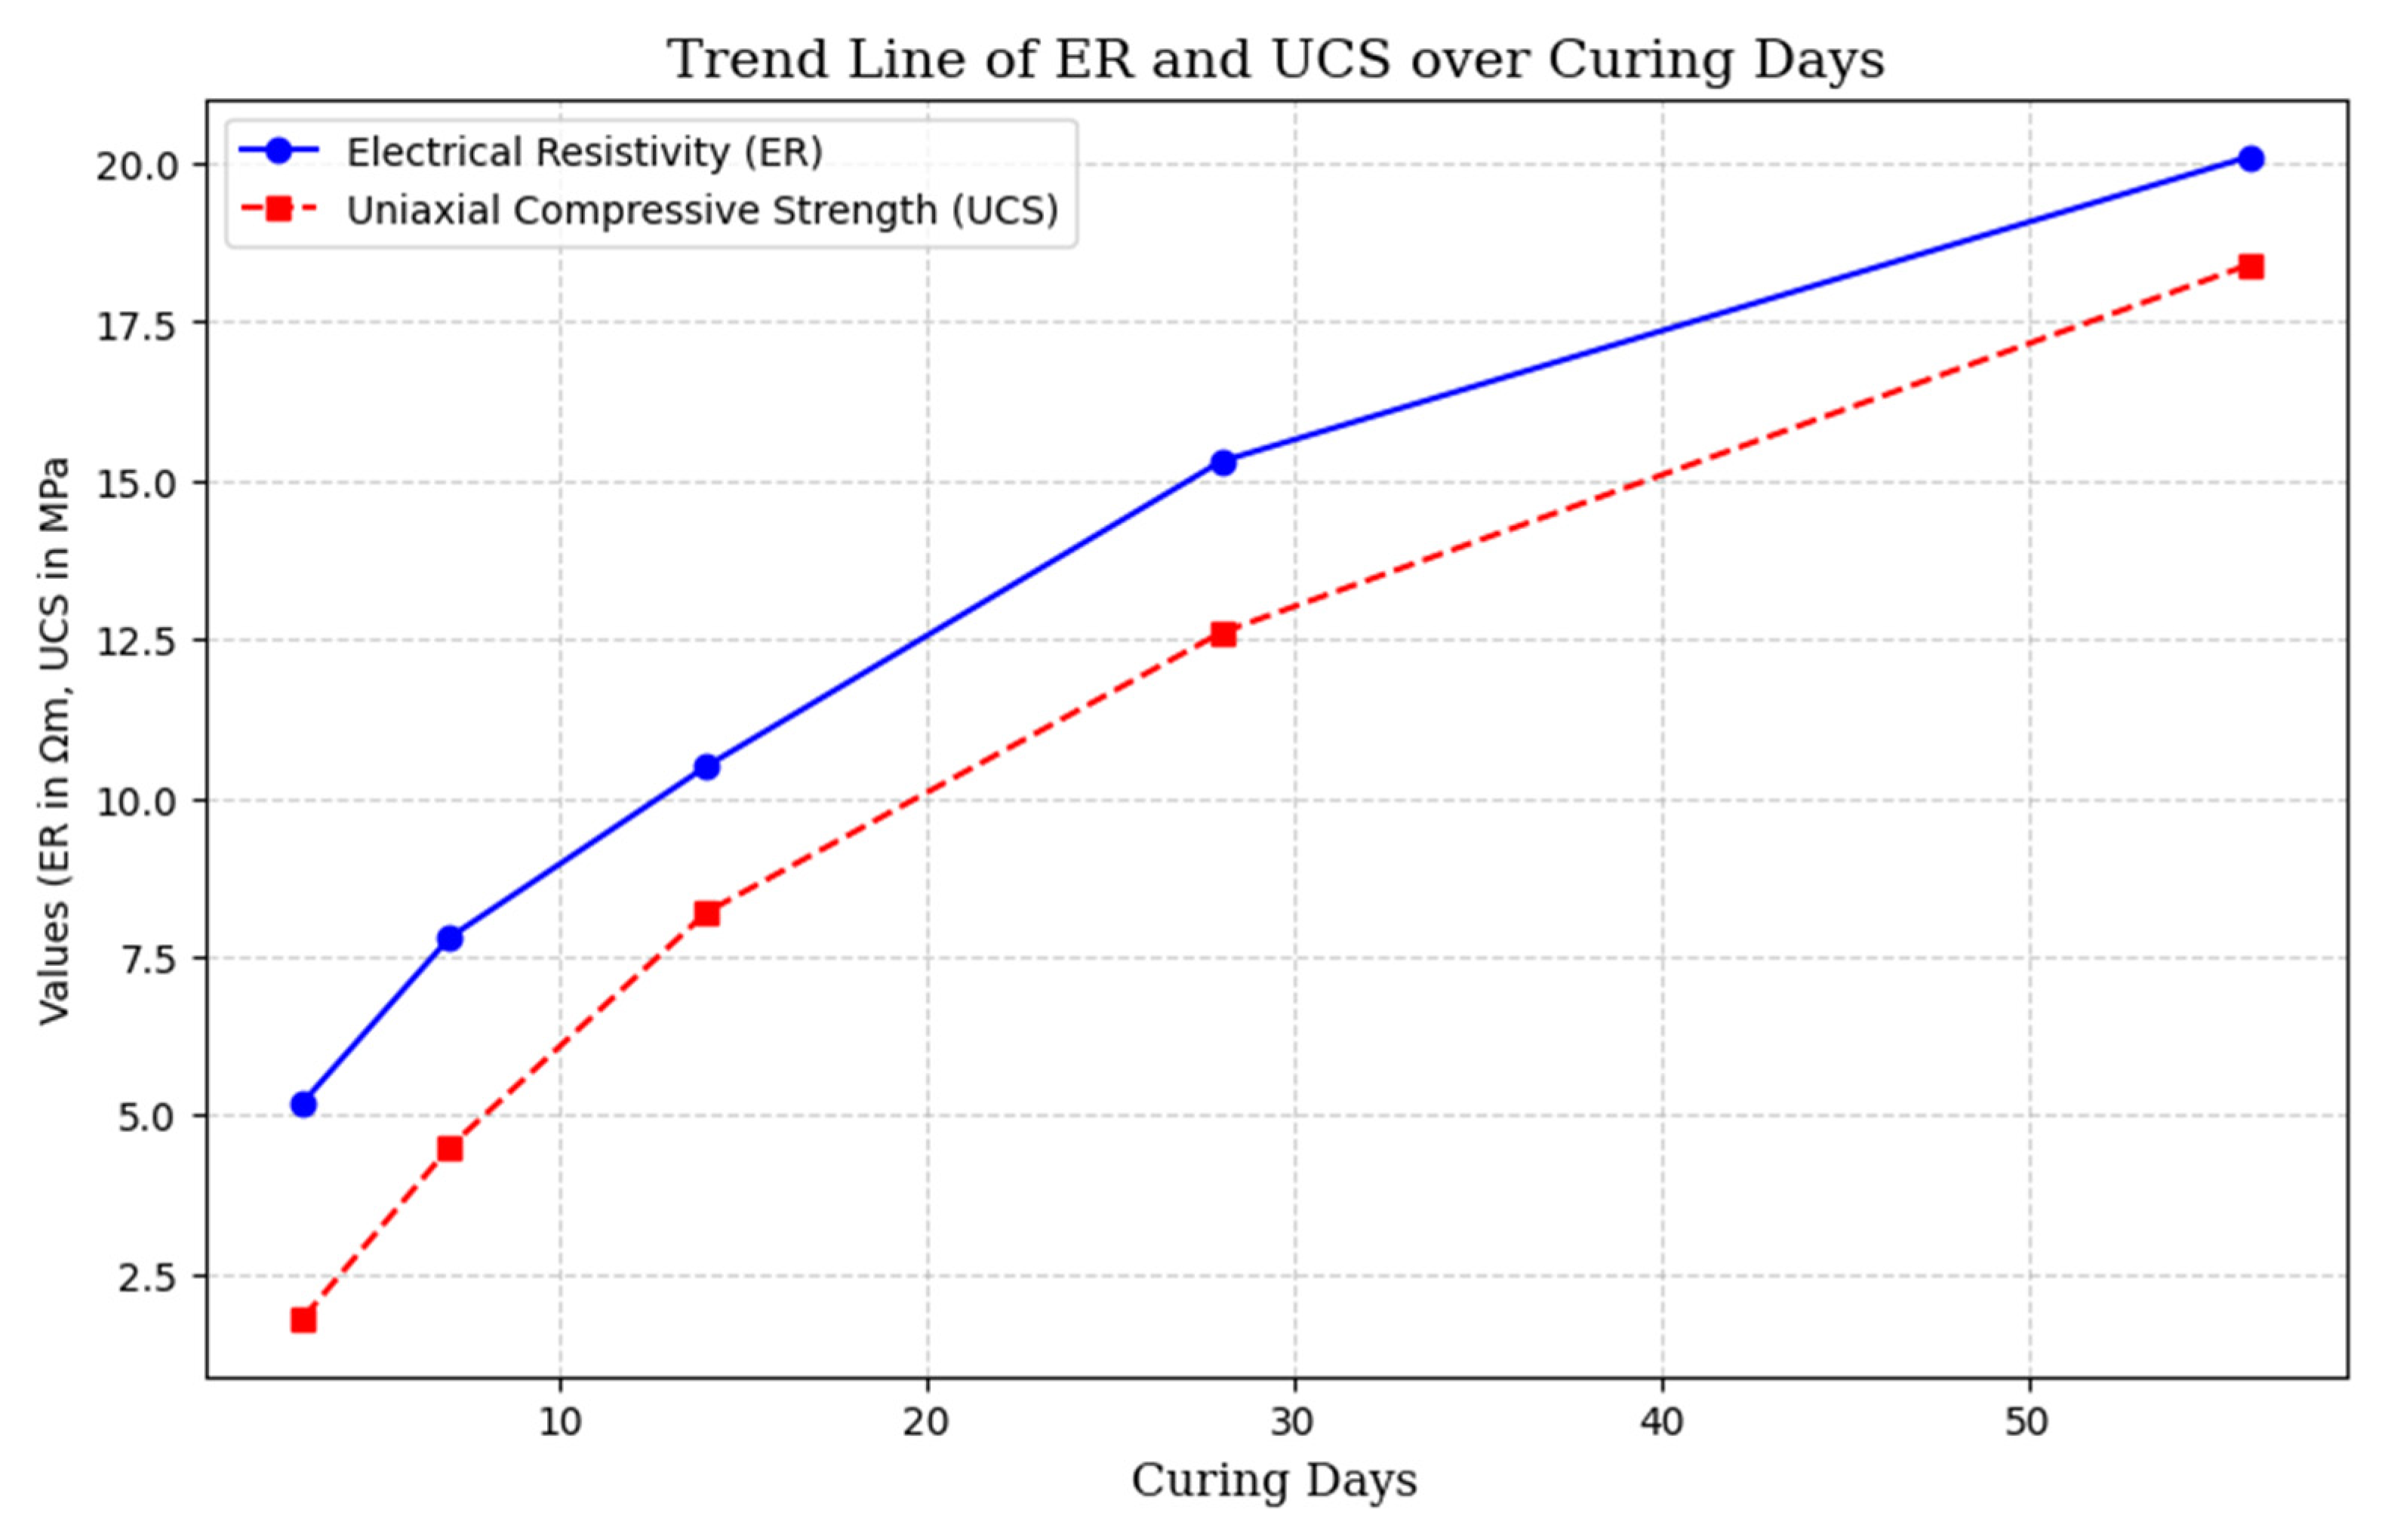
Figure 8.
Present trend line showing how ER and UCS change over curing periods.
Figure 8.
Present trend line showing how ER and UCS change over curing periods.
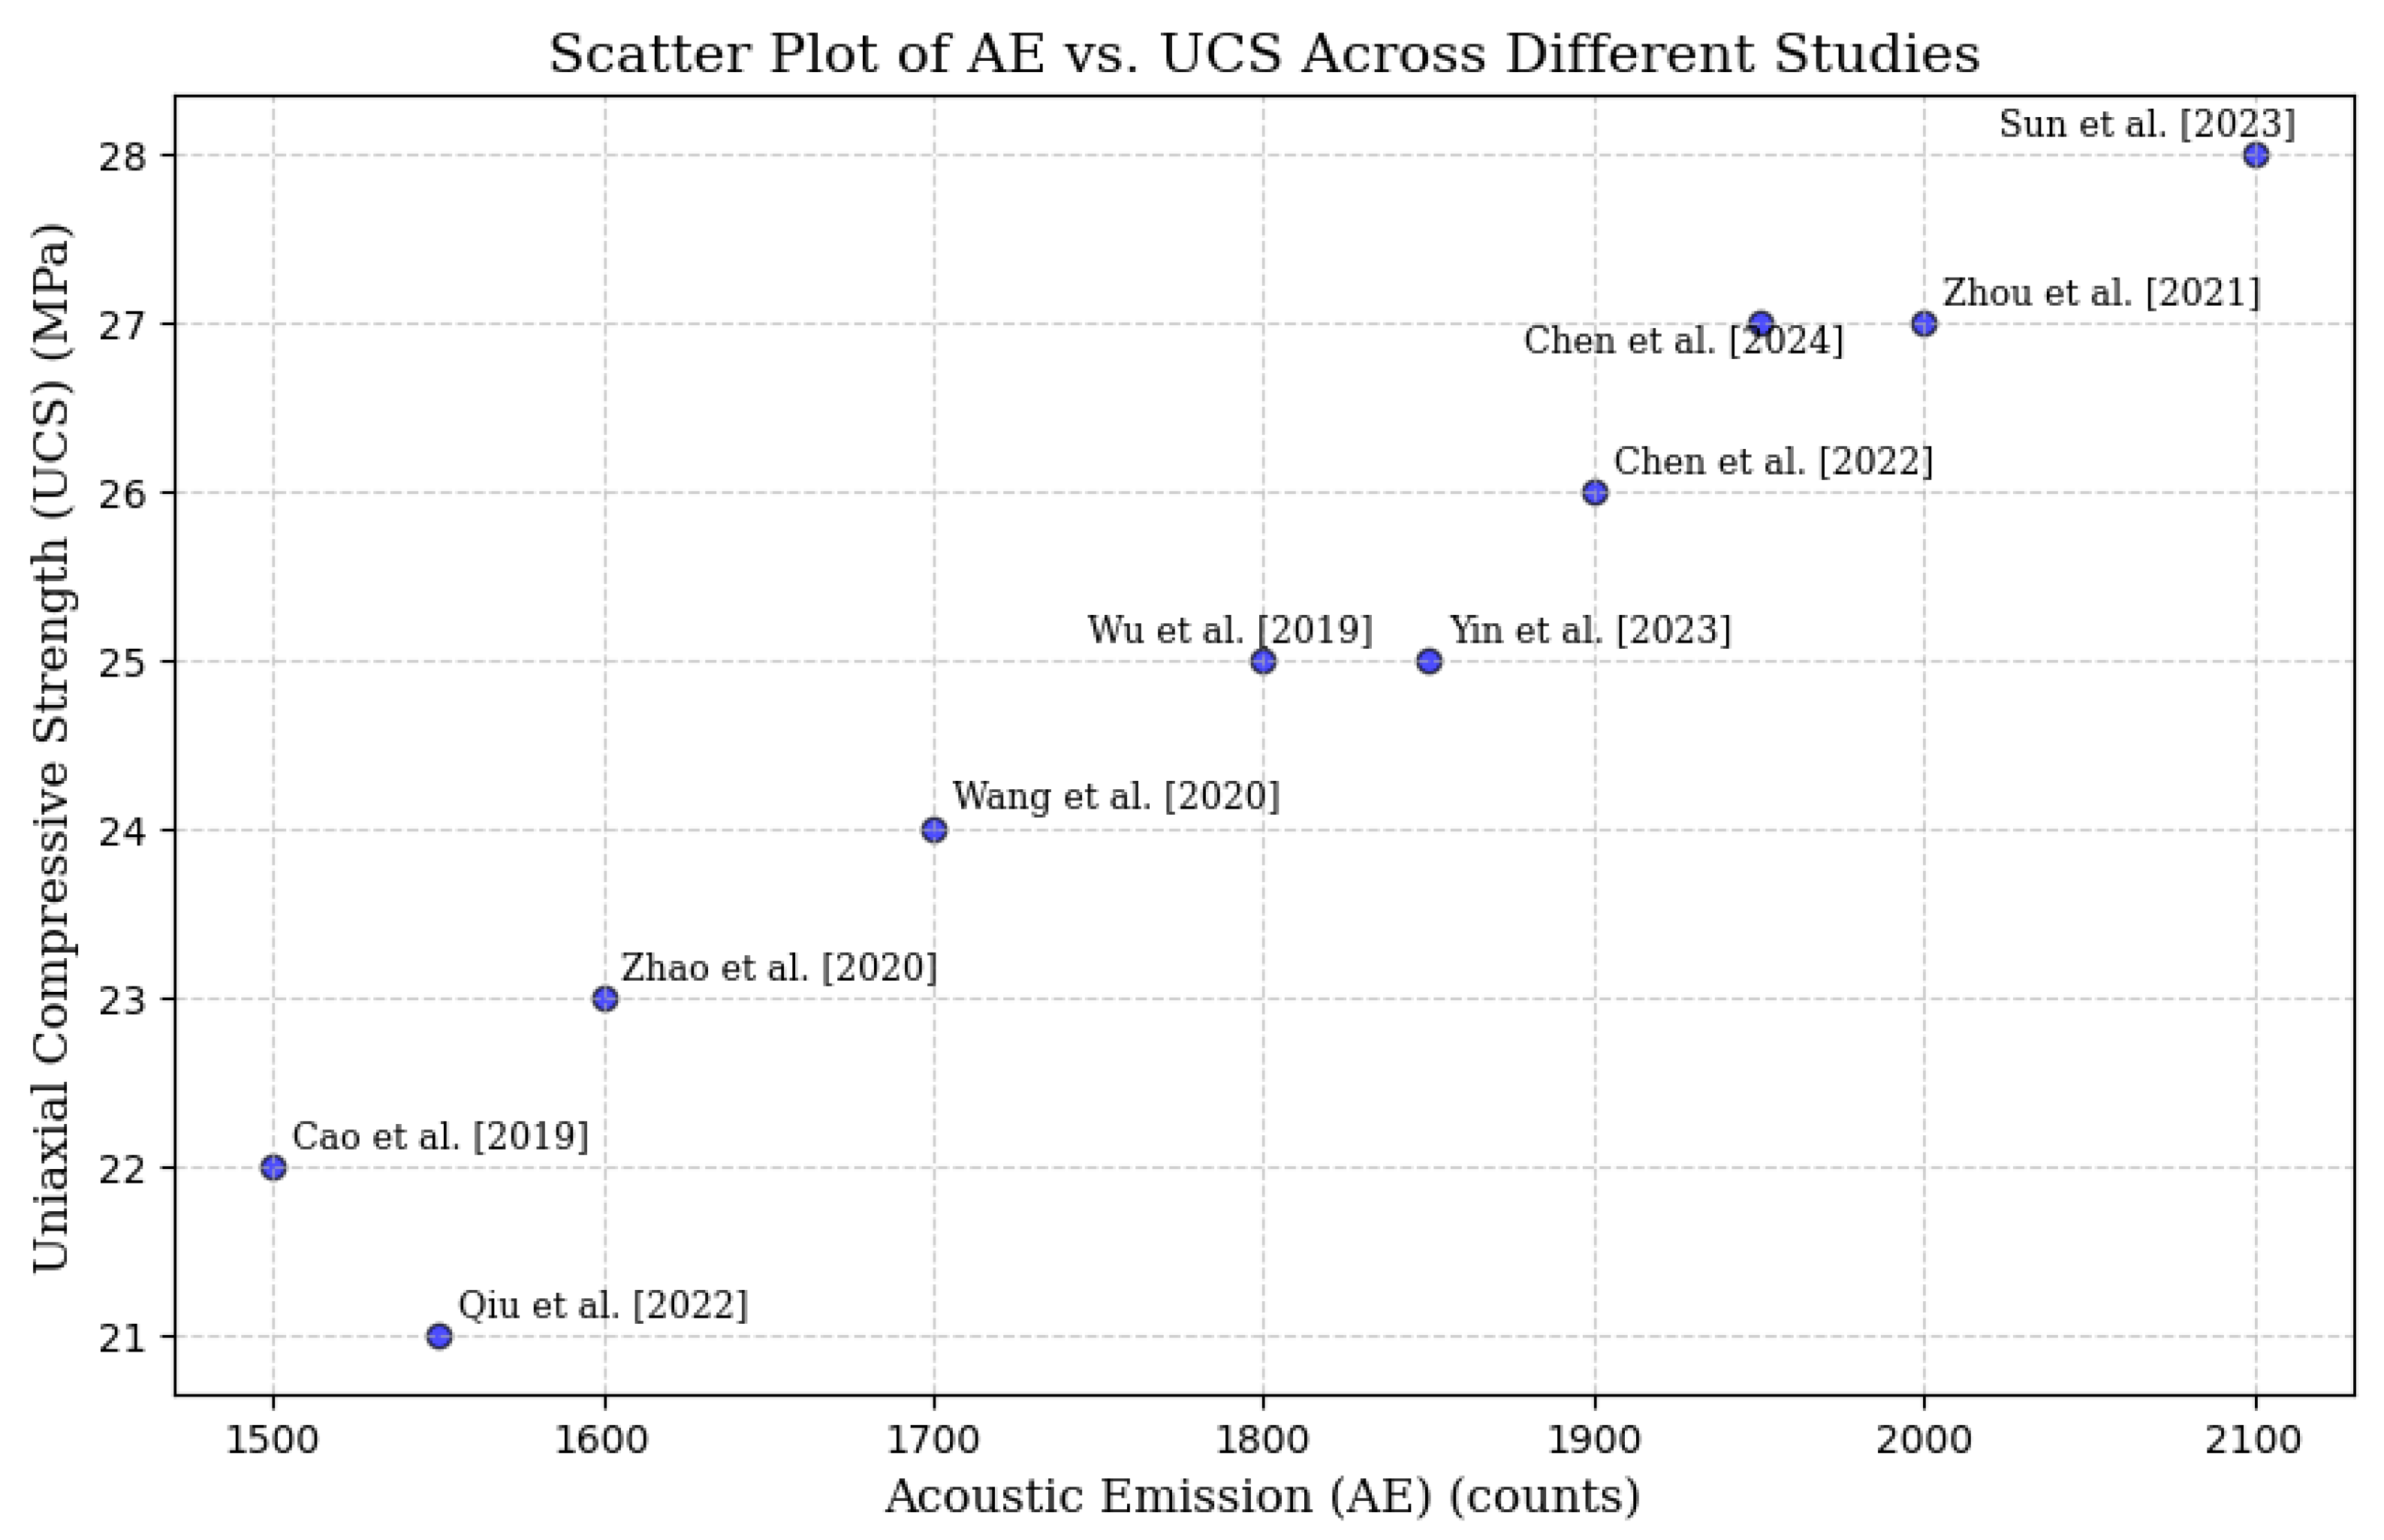
Figure 9.
Scatter plot graph showing the relationship between AE and UCS across different studies [
88,
89,
90,
91,
92,
93,
94,
95,
96,
97].
Figure 9.
Scatter plot graph showing the relationship between AE and UCS across different studies [
88,
89,
90,
91,
92,
93,
94,
95,
96,
97].
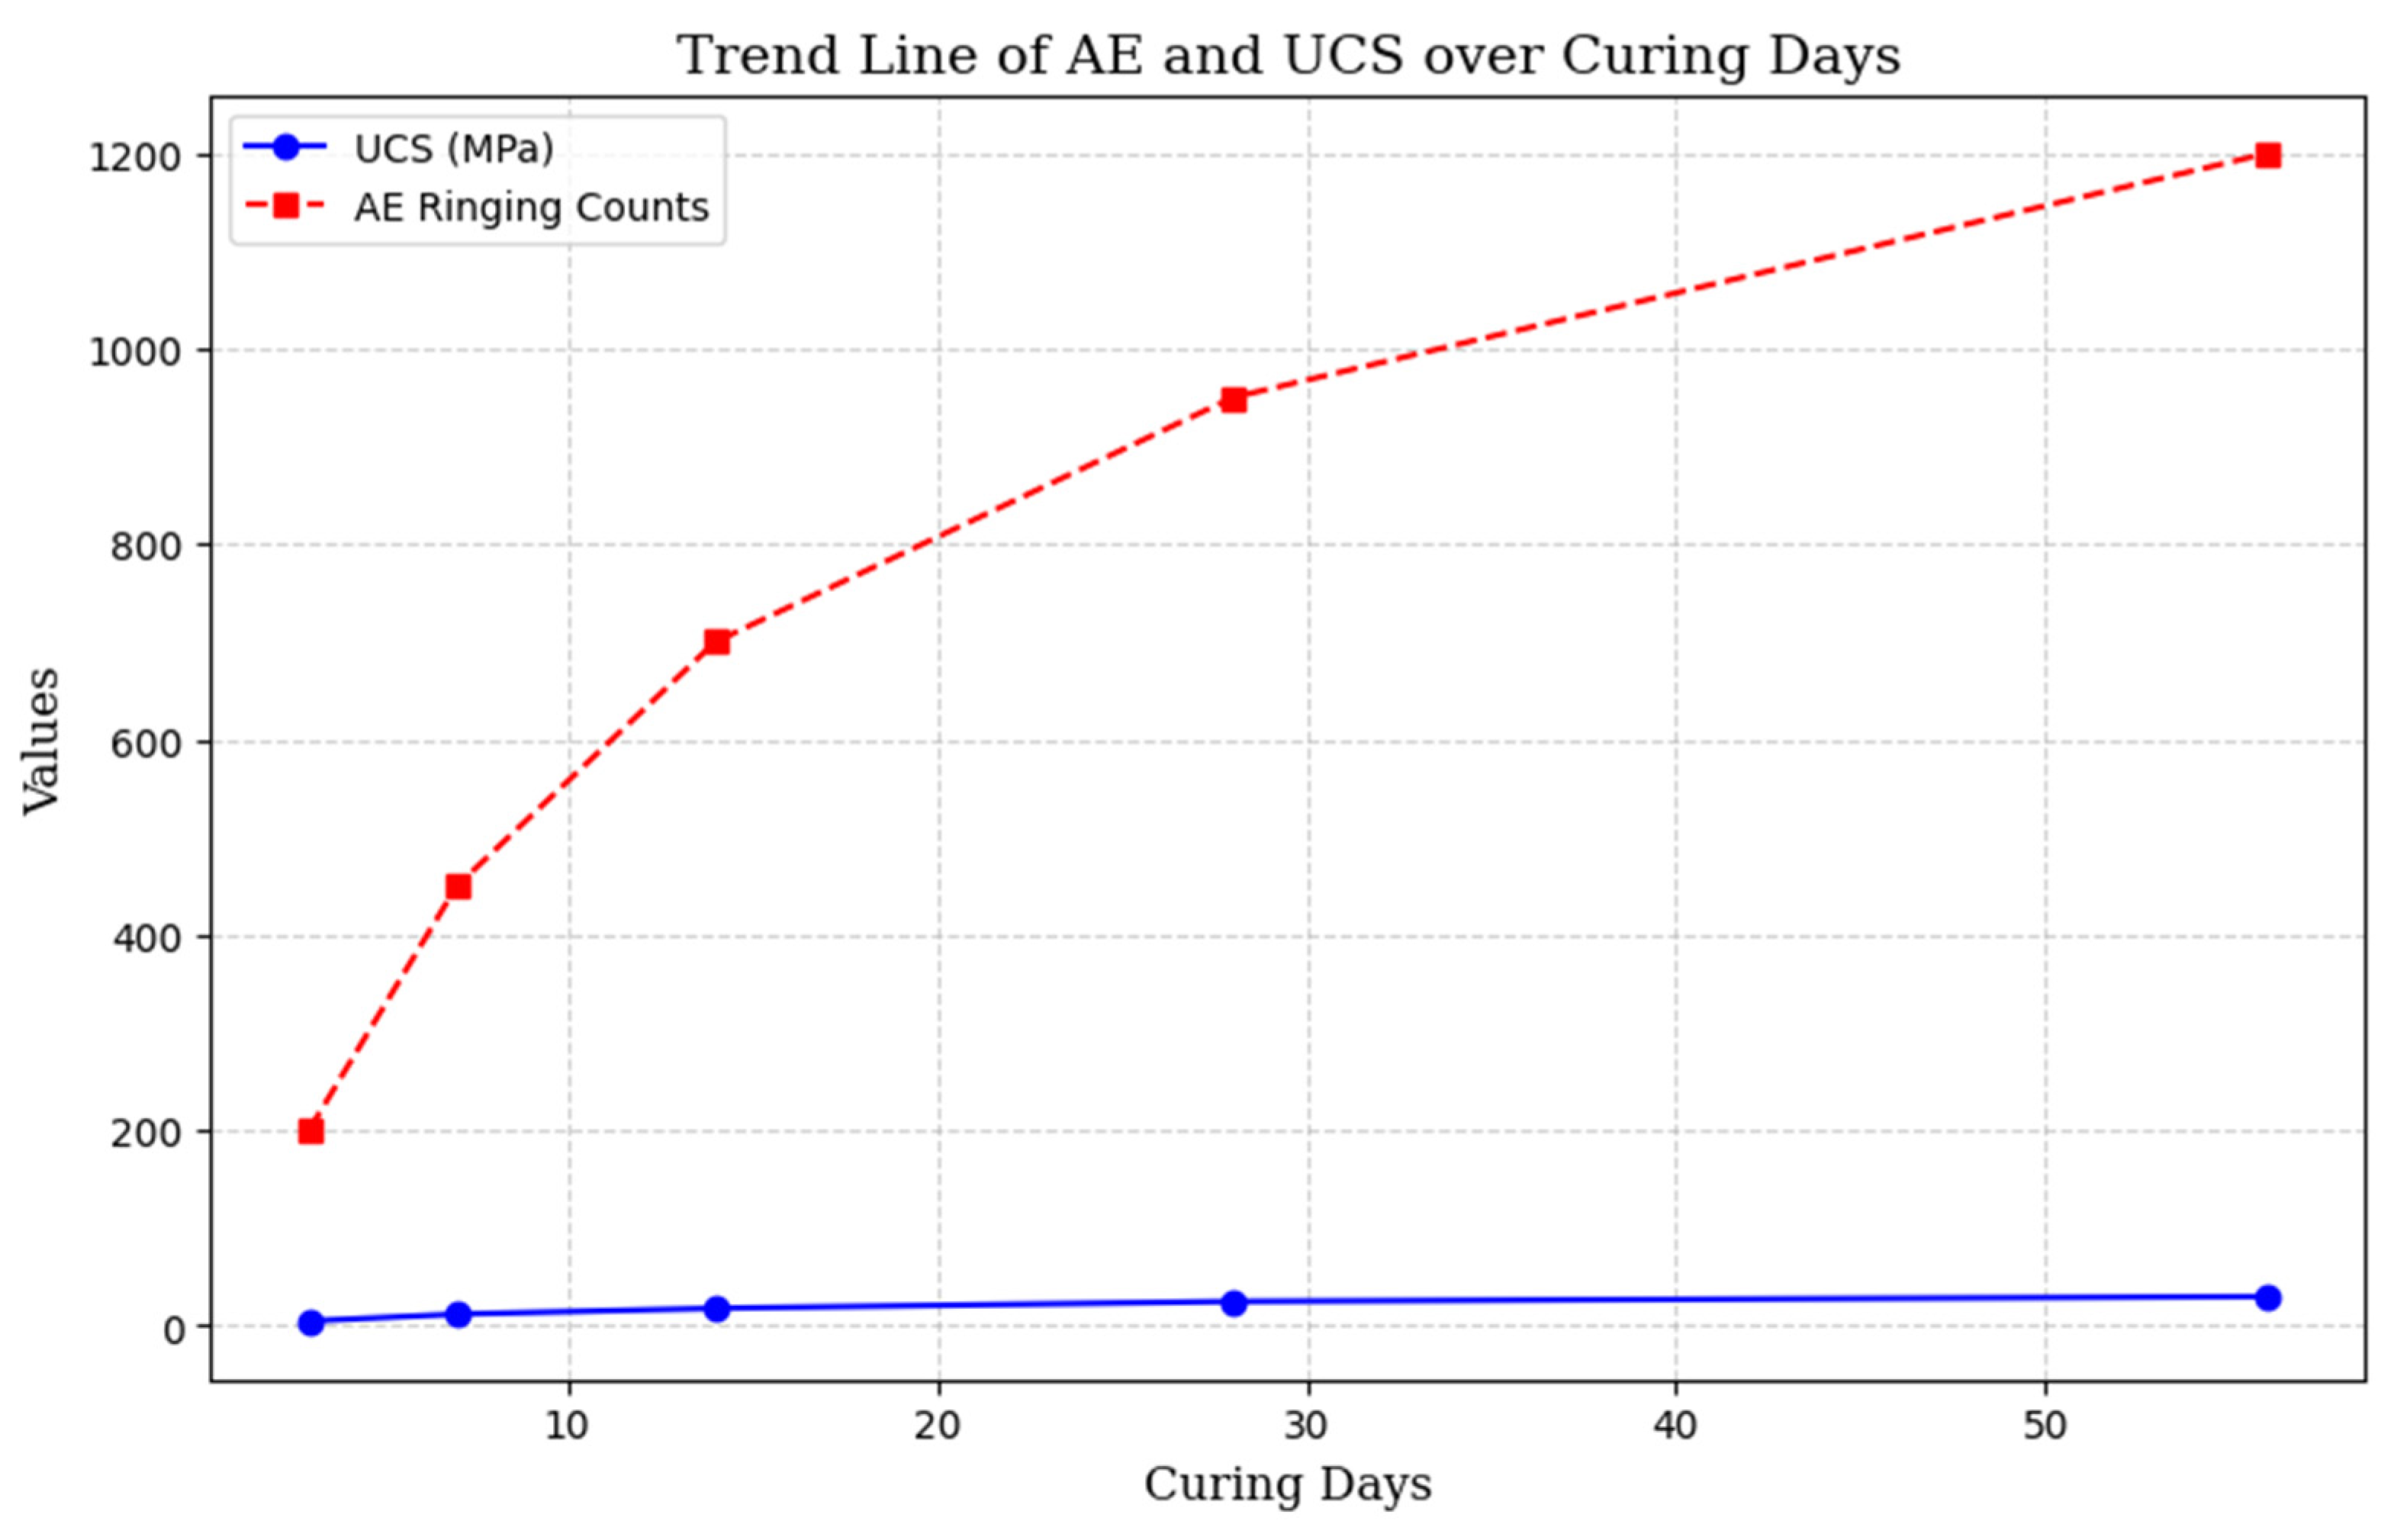
Figure 10.
Present trend line showing how AE and UCS change over curing periods.
Figure 10.
Present trend line showing how AE and UCS change over curing periods.
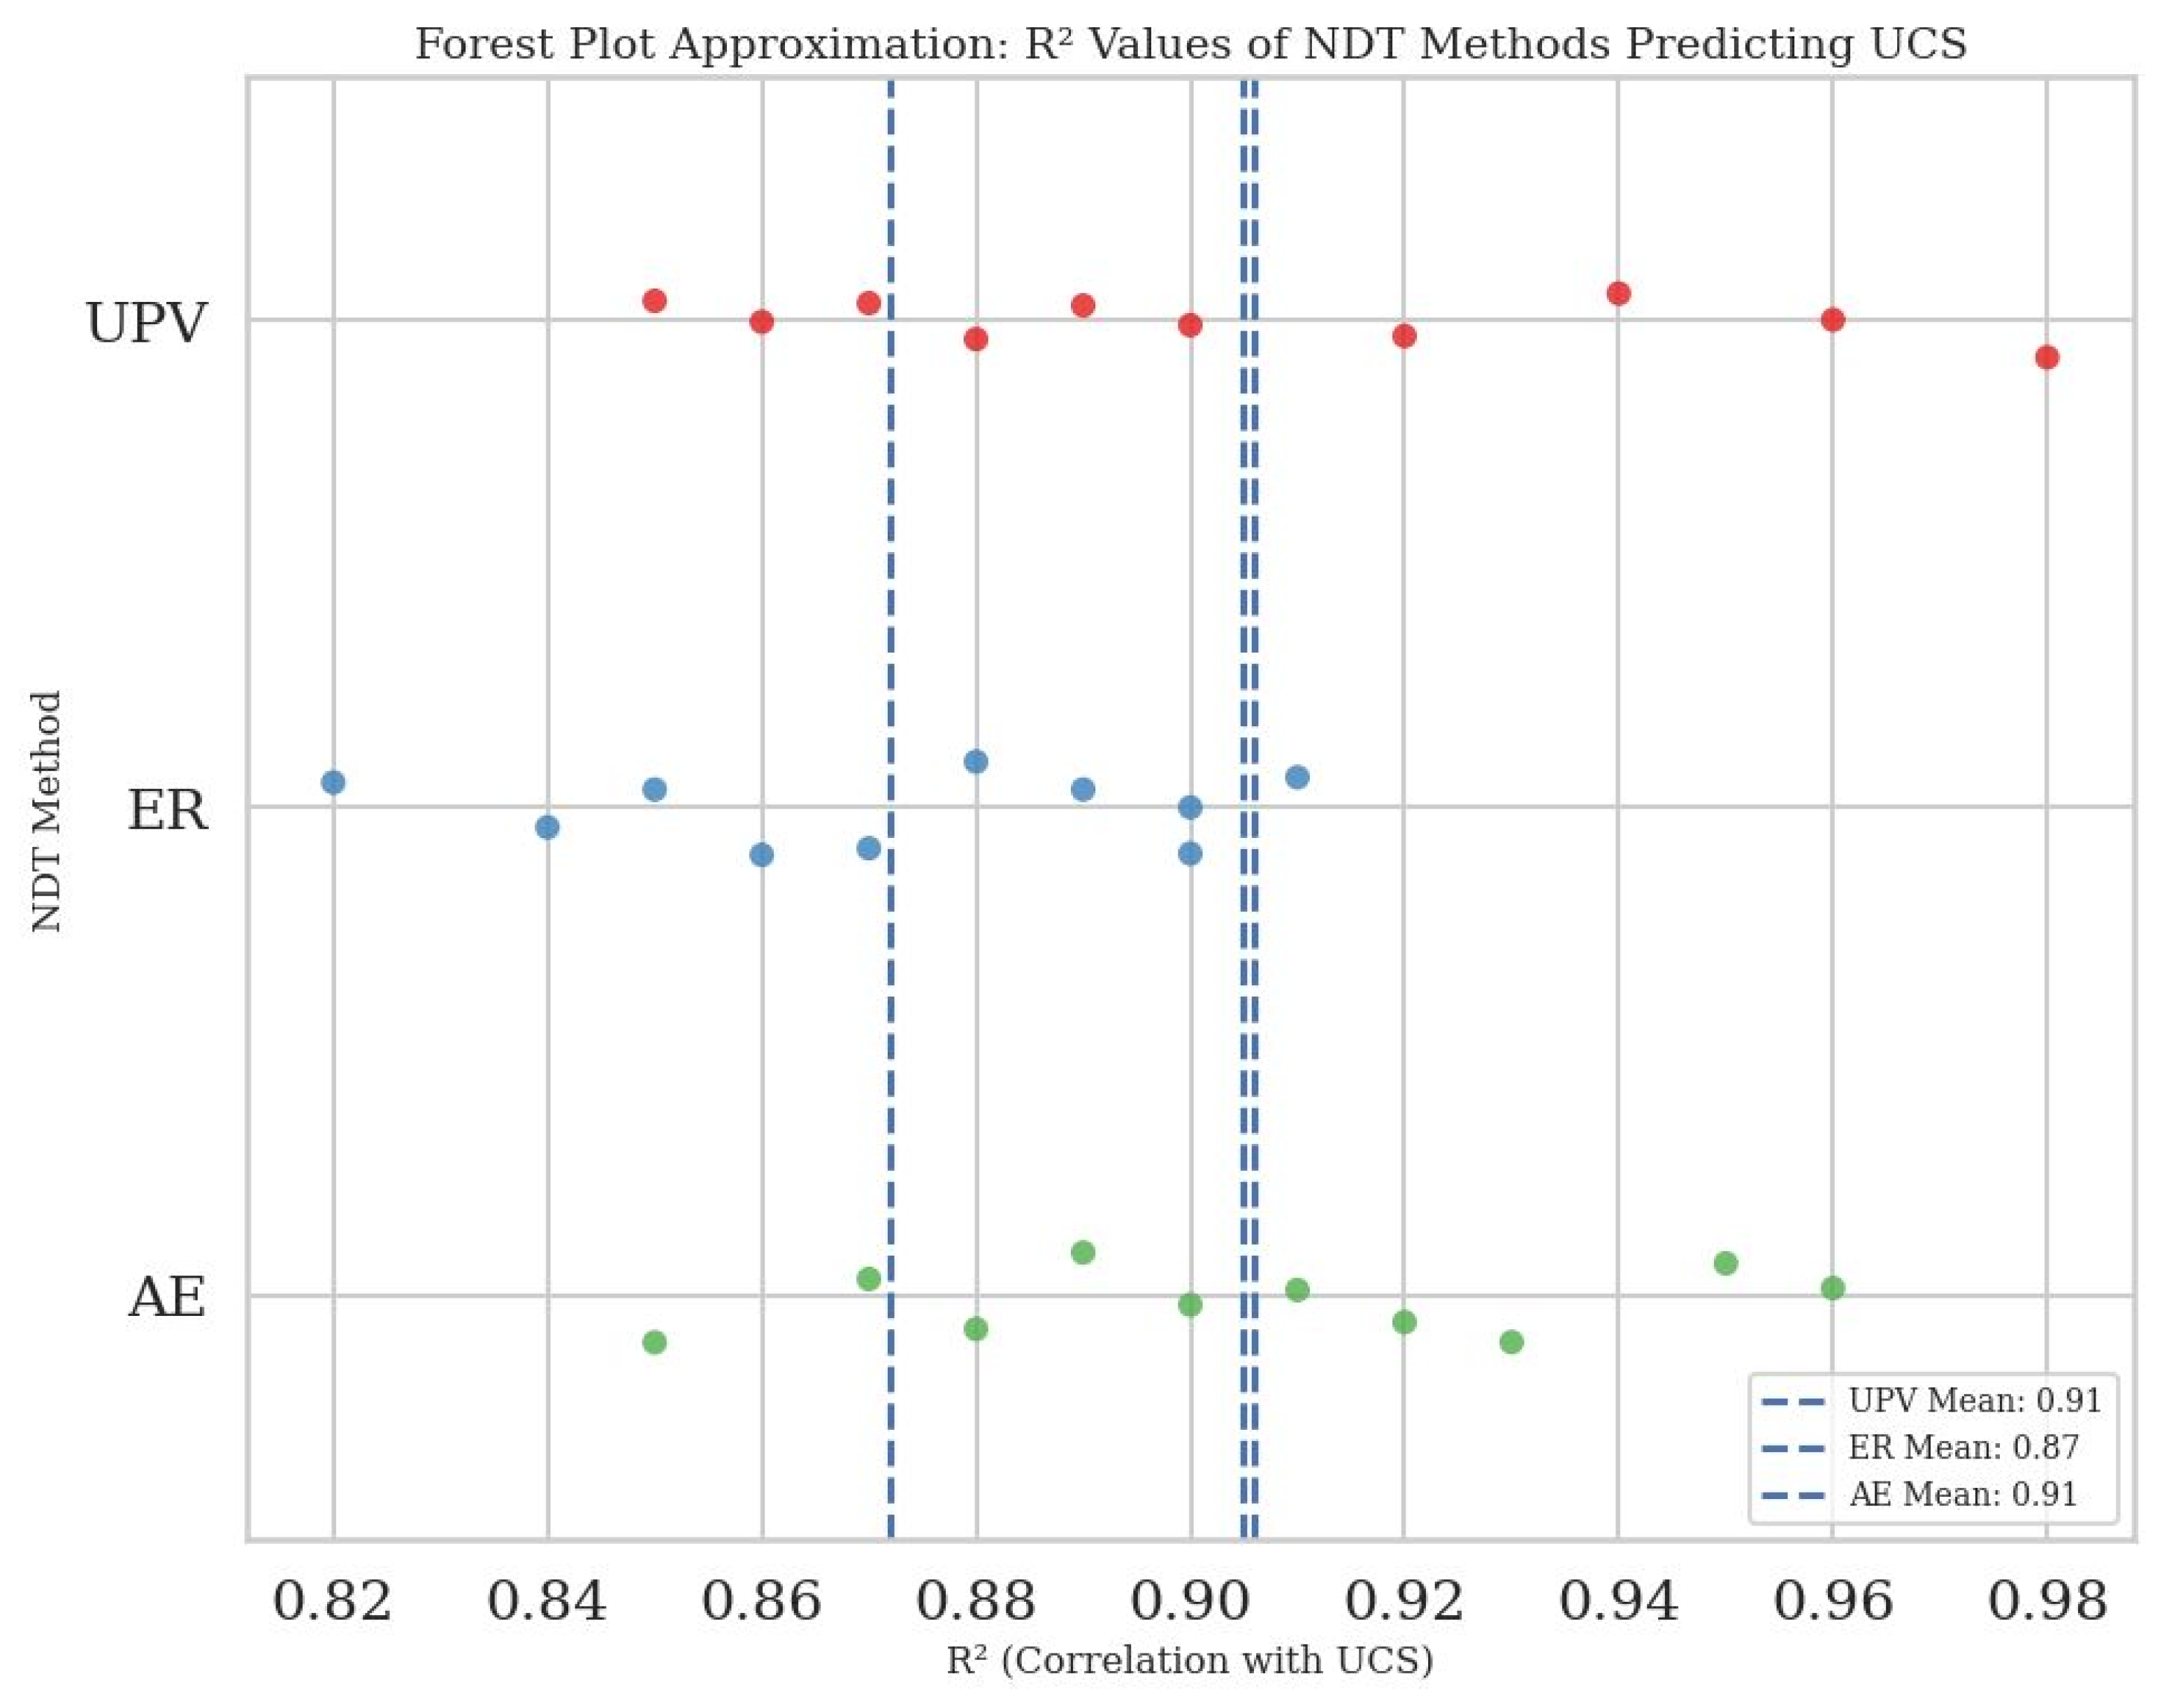
Figure 11.
Forest plot of R2 values between NDT methods and UCS across 30 studies. This figure compares the R² values of NDT methods: UPV (green), AE (red), and ER (blue) in predicting UCS. Each point represents a study’s R², with dashed lines showing the mean R² for each method. AE shows the highest average R² value among the methods.
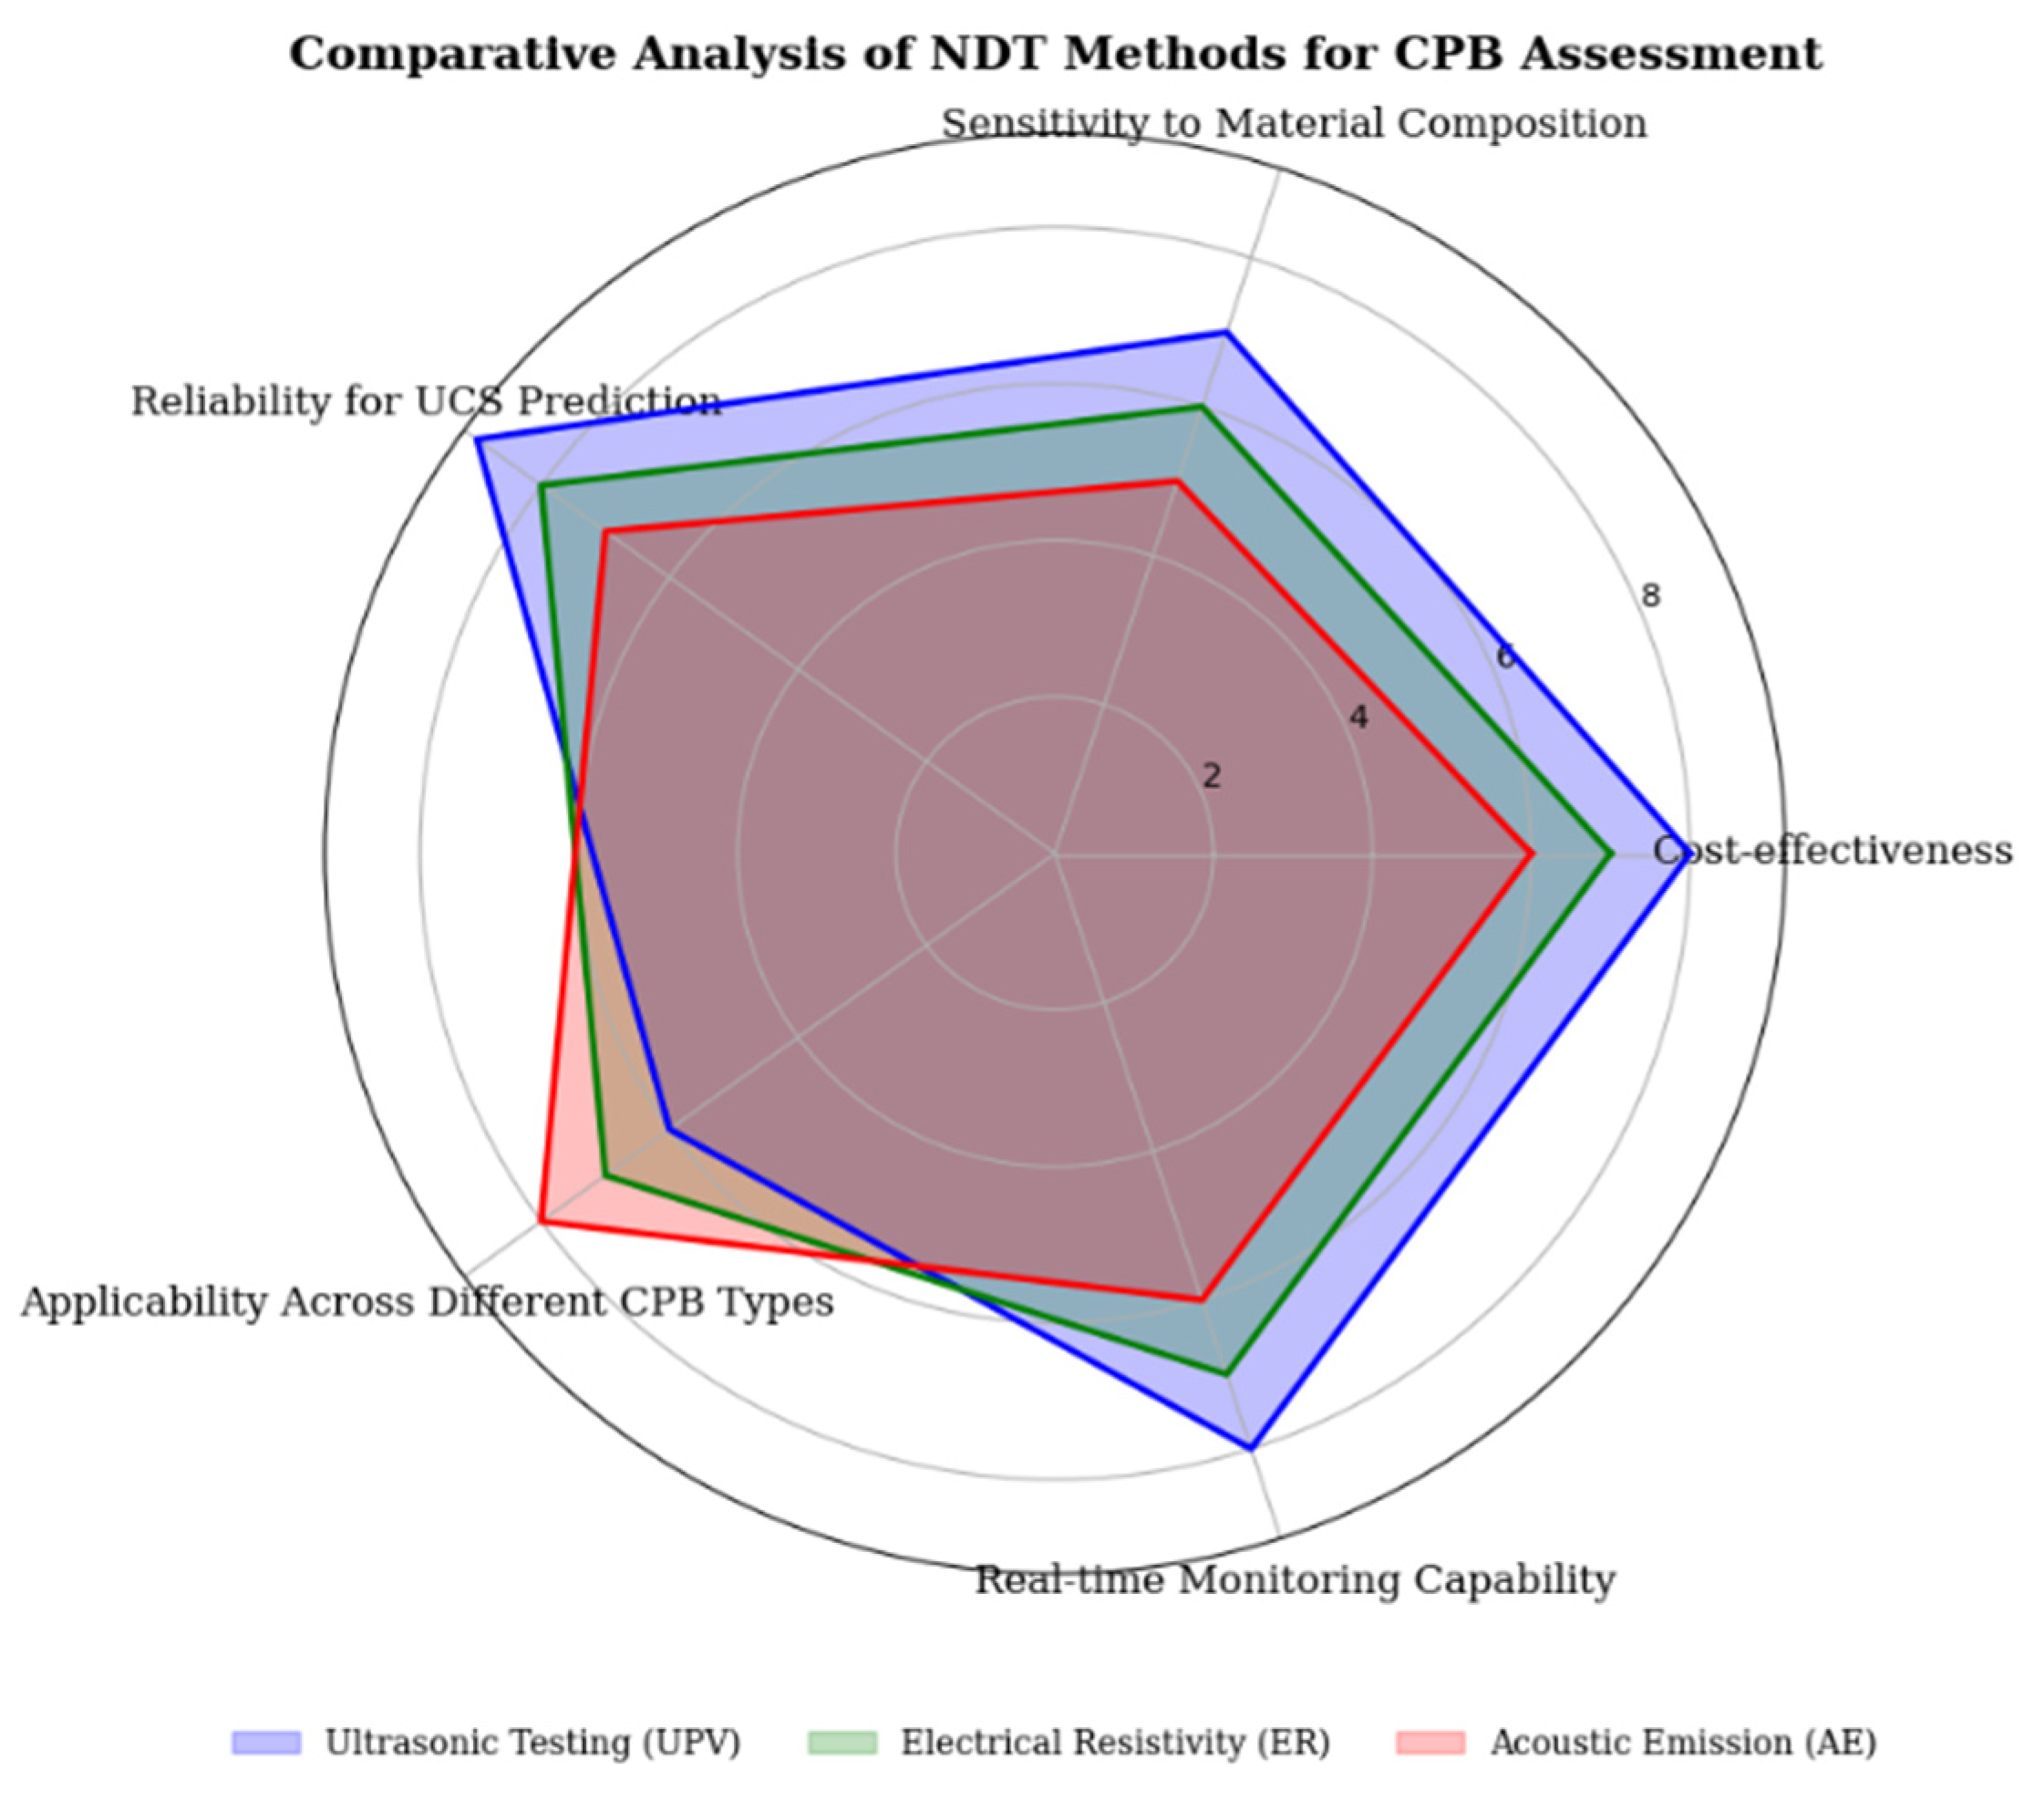
Figure 12.
Radar Chart showing the comparative performance of UPV, ER, and AE across five critical parameters. Higher values indicate better performance in each category. Data extracted from multiple case studies (2020–2024) assessing NDT methods for CPB evaluation.
Figure 12.
Radar Chart showing the comparative performance of UPV, ER, and AE across five critical parameters. Higher values indicate better performance in each category. Data extracted from multiple case studies (2020–2024) assessing NDT methods for CPB evaluation.
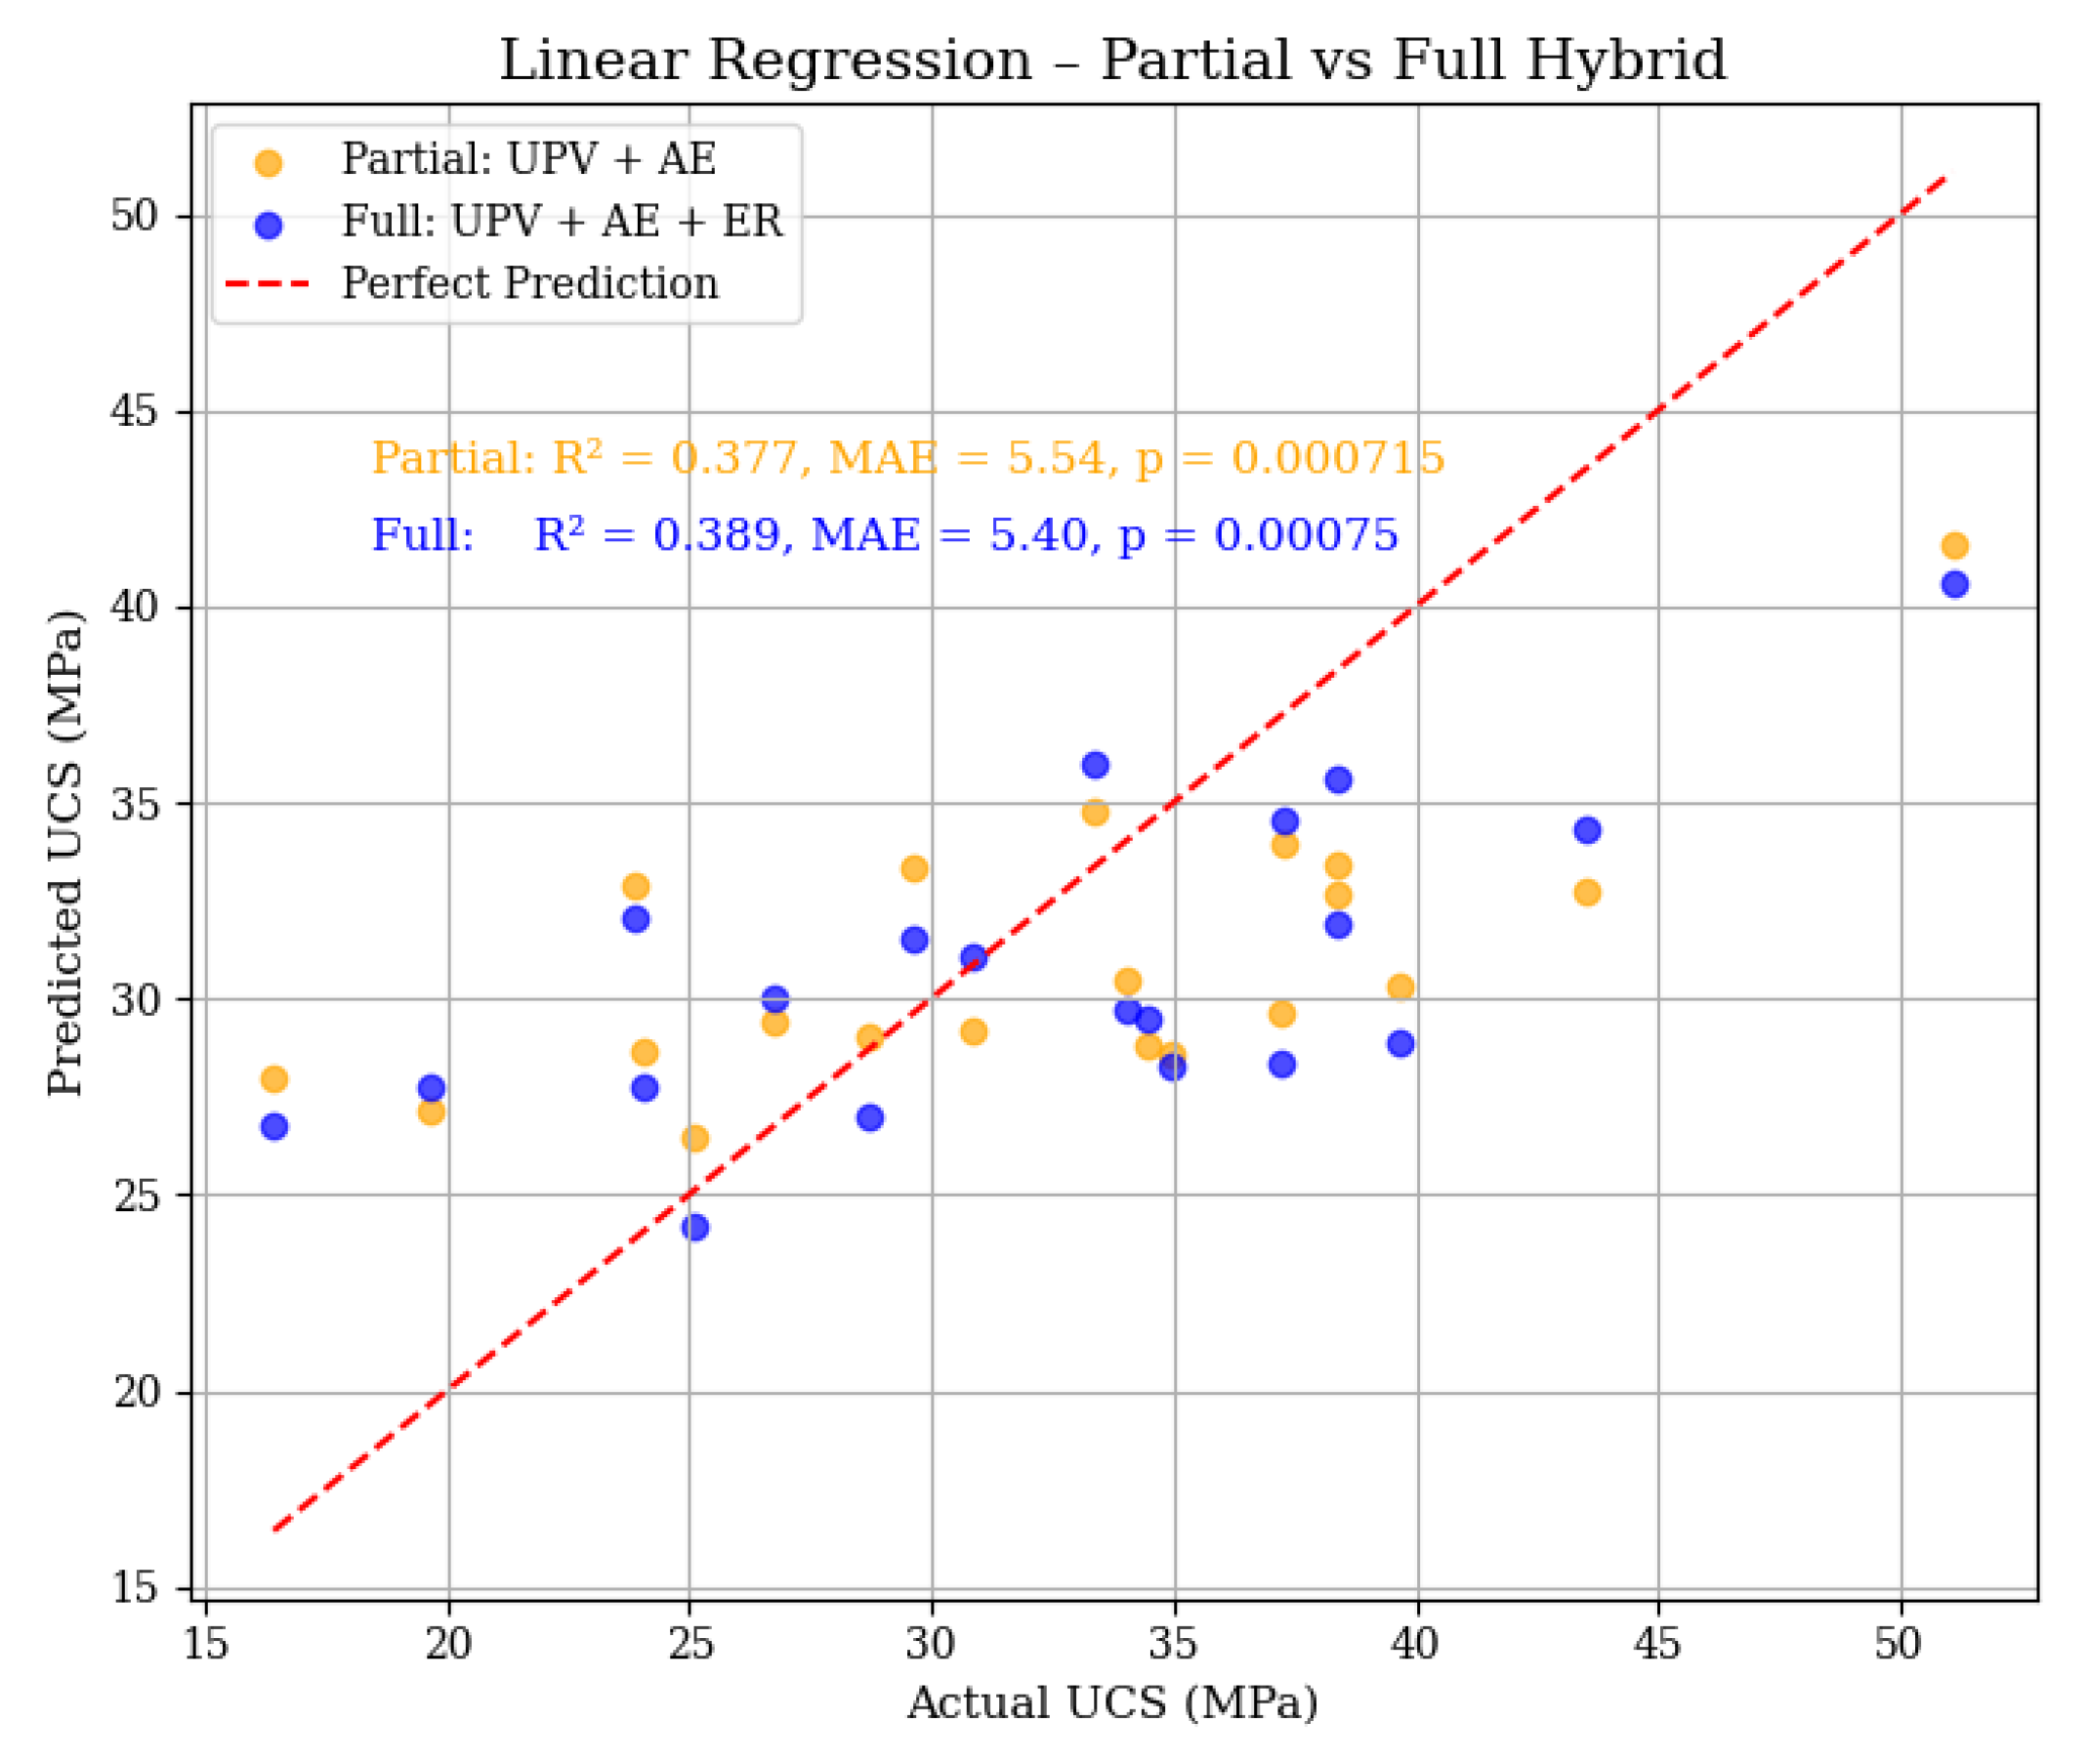
Figure 13.
Actual versus predicted UCS using LR models trained on partial (UPV + AE) and full (UPV + AE + ER) hybrid inputs. The red dashed line represents perfect prediction (y = x). Annotated within the plot are the R2, MAE, and p-values from an auxiliary LR analysis confirming statistical significance. The inclusion of ER improves prediction accuracy modestly.
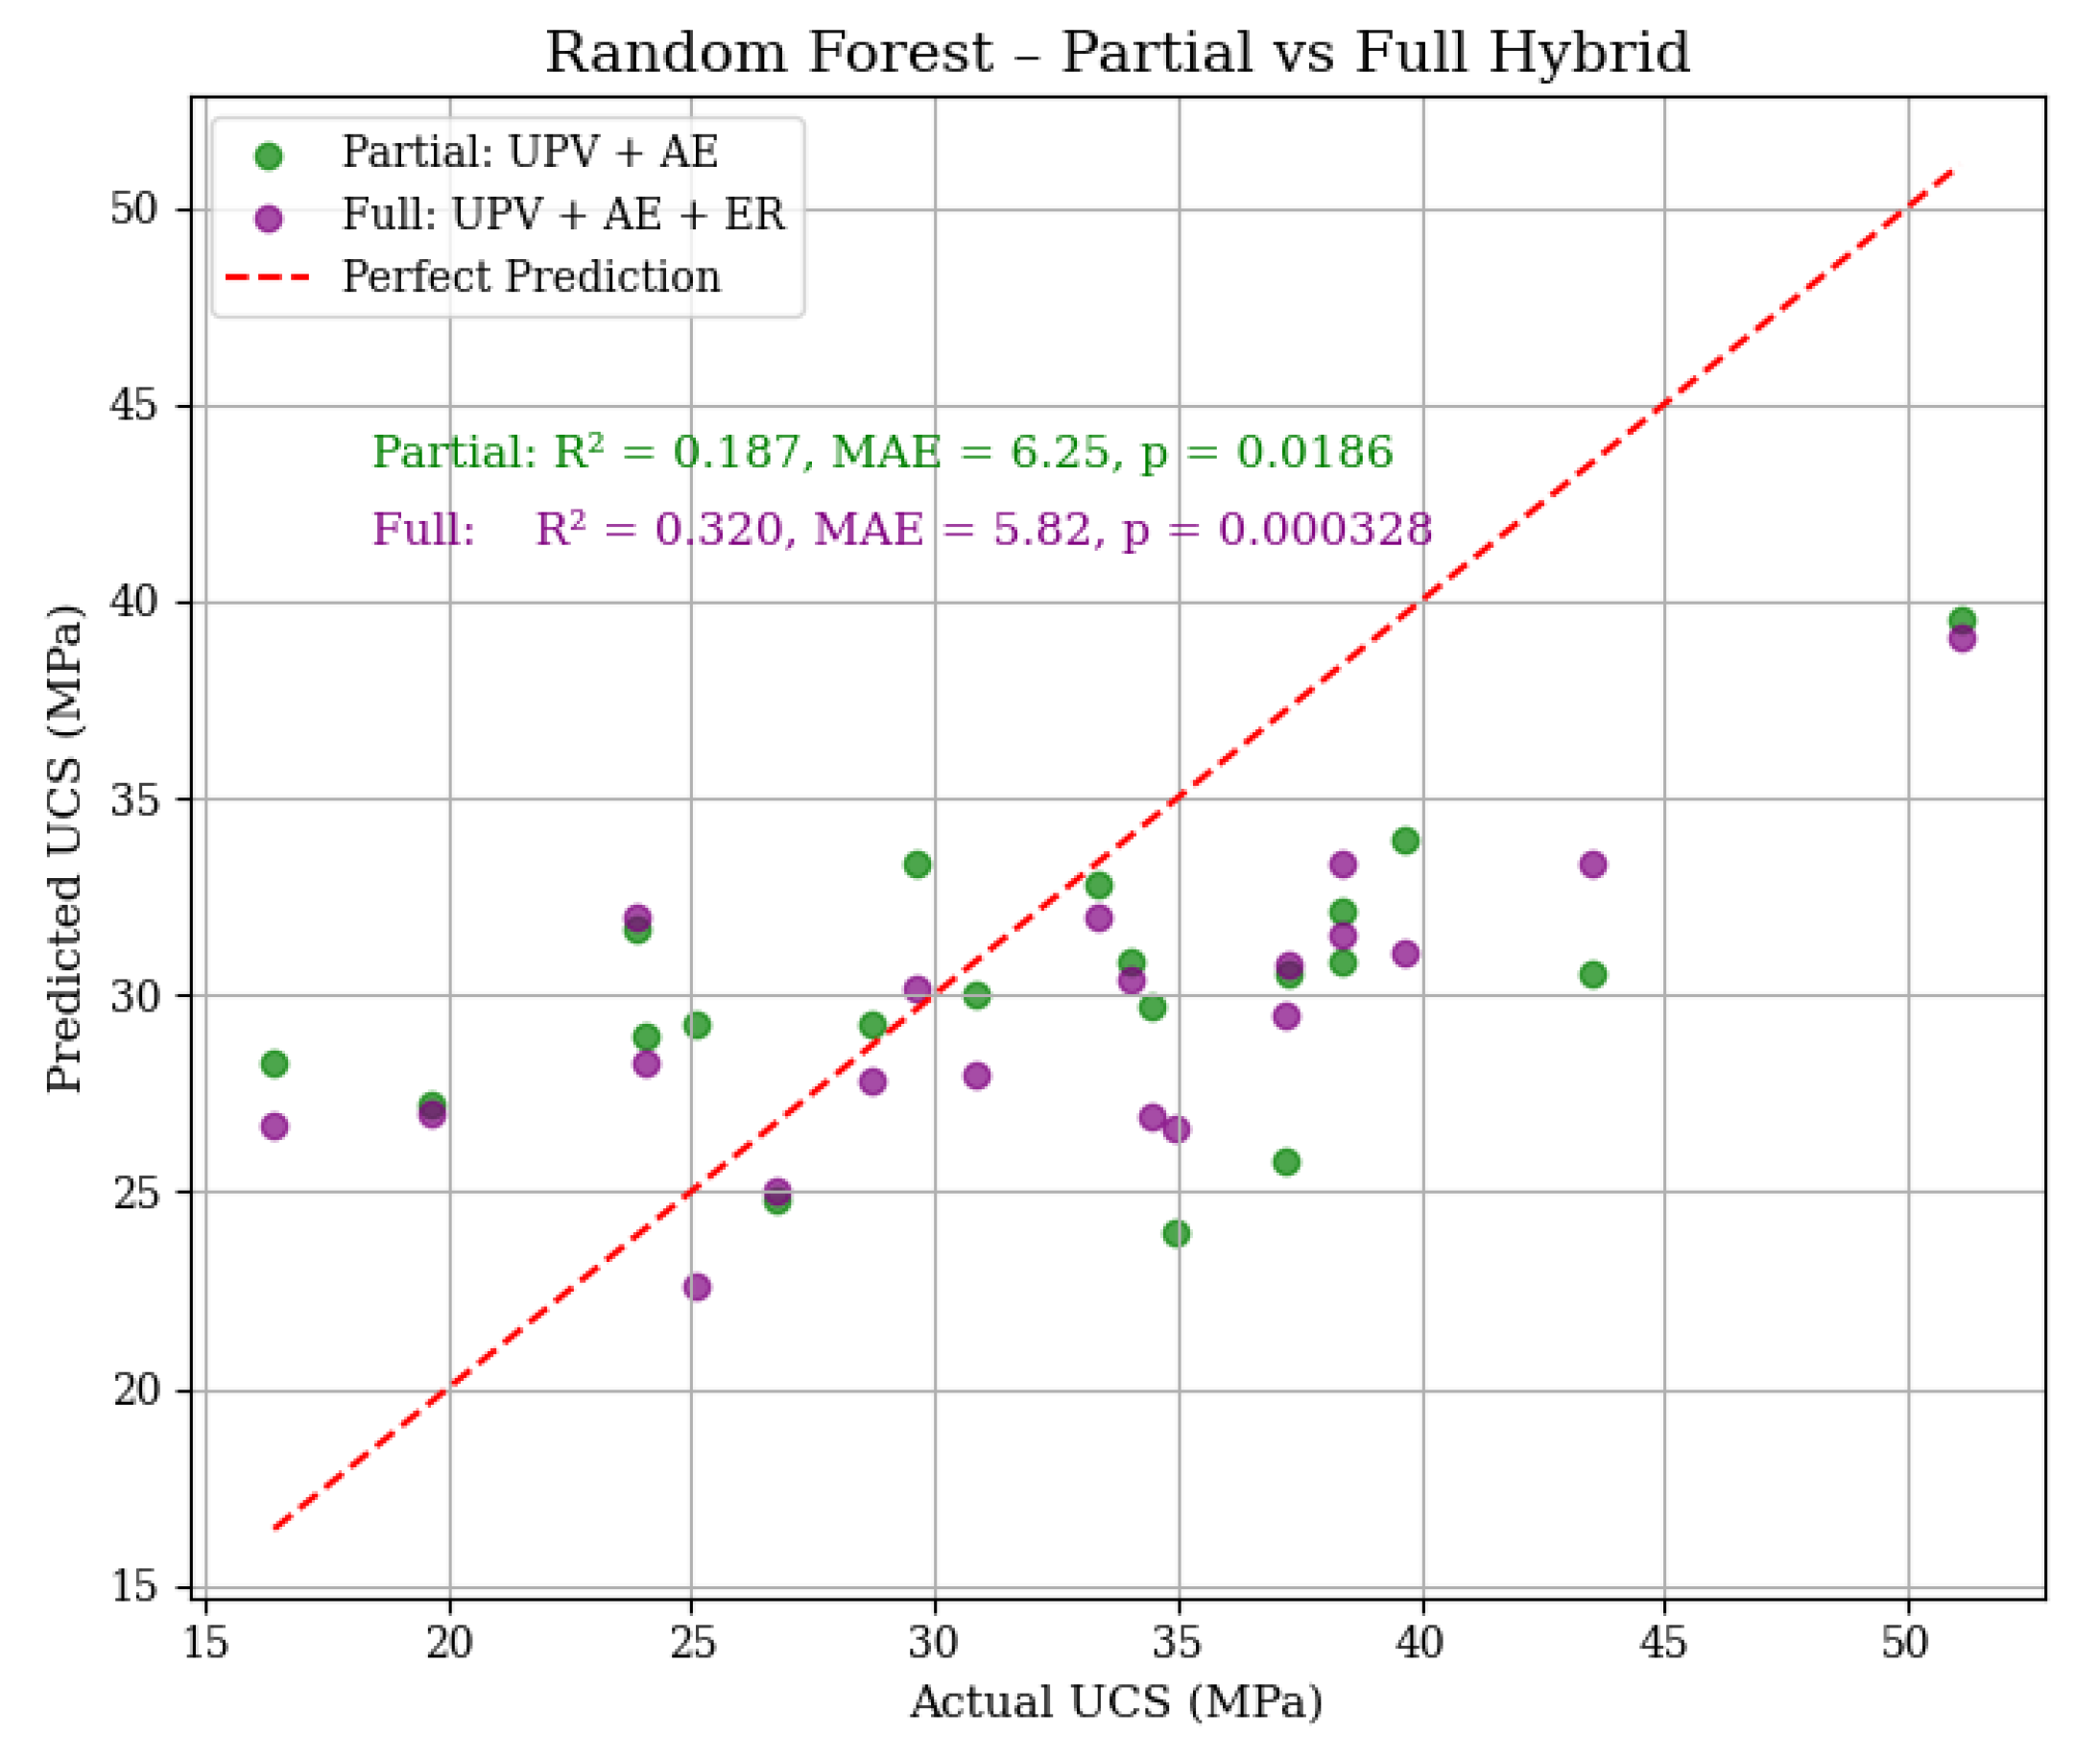
Figure 14.
Actual versus predicted UCS using RF models with partial (UPV + AE) and full (UPV + AE + ER) hybrid inputs. The red dashed line indicates the ideal prediction line. R2, MAE, and p-values are annotated within the plot, showing that the full hybrid model significantly improves prediction accuracy compared to the partial hybrid configuration. These results highlight the advantage of incorporating multiple NDT parameters for more reliable UCS estimation.
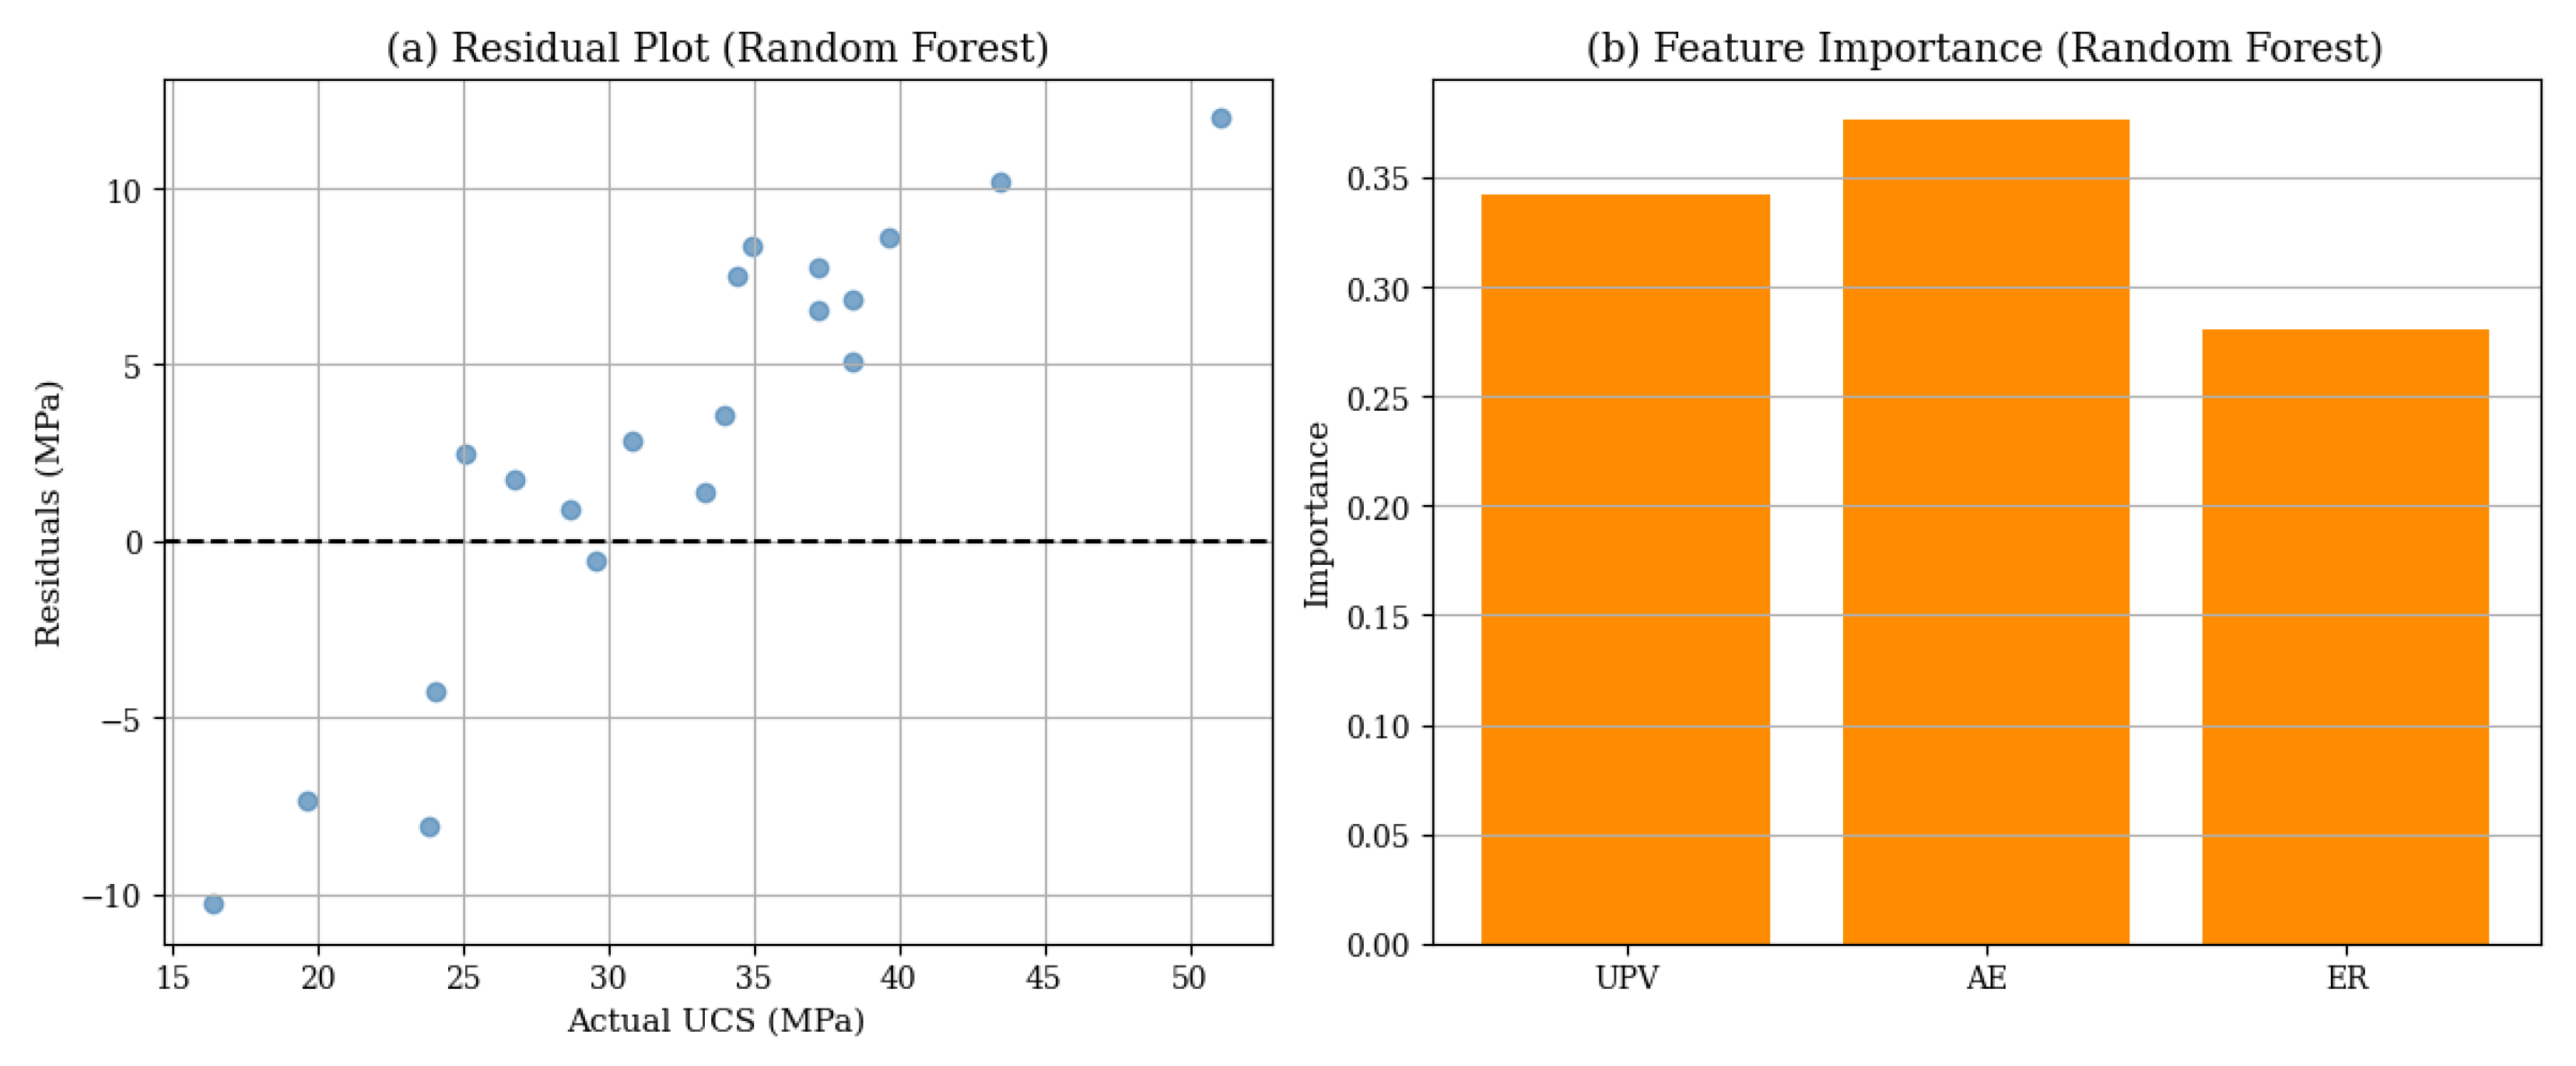
Figure 15.
RF model results using hybrid NDT inputs (UPV, AE, ER), with (a) showing the residual plot and moderate prediction errors around the zero line, and (b) showing the feature importance plot identifying AE and UPV as dominant predictors of UCS.
Figure 15.
RF model results using hybrid NDT inputs (UPV, AE, ER), with (a) showing the residual plot and moderate prediction errors around the zero line, and (b) showing the feature importance plot identifying AE and UPV as dominant predictors of UCS.
Table 1.
Comparison of destructive testing methods for CPB: key characteristics, measured properties, and applications of UCS, Triaxial and Brazilian tests.
Table 1.
Comparison of destructive testing methods for CPB: key characteristics, measured properties, and applications of UCS, Triaxial and Brazilian tests.
| Test | Load Type | Measured Property | Confining Pressure | Typical Use Case |
|---|
| UCS | Uniaxial | Compressive strength (σe) | None (σ2 = σ3 = 0) | Basic strength screening |
| Triaxial | Multiaxial | Shear strength (c, φ) | Controlled (σ2 = σ3 ≠ 0) | Deep mining, slope stability |
| Brazilian | Diametrical | Tensile strength (σt) | None | Crack resistance, brittle materials |
Table 2.
A detailed comparison of DT and NDT methods focusing on how they perform in terms of resources conservation, material integrity preservation and cost-effectiveness.
Table 2.
A detailed comparison of DT and NDT methods focusing on how they perform in terms of resources conservation, material integrity preservation and cost-effectiveness.
| Feature | Destructive Testing | Non-Destructive Testing |
|---|
| Sample Integrity | Destroys samples | Retains specimens for further use |
| Testing Time | Time-consuming | Faster, real-time assessment |
| Cost | High due to multiple samples | Lower operational costs |
| Real-Time Monitoring | Not possible | Possible with UPV, ER, and AE |
| Field Application | Limited to controlled labs | Suitable for both lab and field |
| Data Collection | Single-point data (after failure) | Continuous monitoring possible |
Table 3.
Comparison of UPV and UCS correlation studies, showing the effectiveness of UPV as a non-destructive alternative for UCS prediction across different material types.
Table 3.
Comparison of UPV and UCS correlation studies, showing the effectiveness of UPV as a non-destructive alternative for UCS prediction across different material types.
| Study | Focus Area | Methodology | Key Findings | Conclusion |
|---|
| Yilmaz & Ercikdi [24] | Correlation of UCS and UPV in CPB with different tailings | 180 CPB samples, UCS and UPV testing over 7–56 days, regression analysis | Strong correlation (0.79–0.95) between UCS and UPV, confirming UPV as a UCS predictor | UPV provides a reliable, non-destructive alternative for UCS estimation in CPB |
| Wu et al. [74] | Mechanical performance of cemented gangue backfills using UCS and UPV | 60 CGB samples, UCS and UPV testing over 3–28 days, exponential relationship analysis | High correlation (0.959) between UCS and UPV, with strength growth over time | UPV effectively predicts UCS in cemented gangue backfill without sample damage |
| Xu et al. [75] | Strength and ultrasonic properties of foam-cemented paste backfill | FCPB samples with varying vesicant-binder ratios, UCS and UPV correlation | Linear correlation between UCS and UPV, improving accuracy with lower vesicant ratios | UPV serves as a useful, non-destructive UCS estimator in foam-cemented paste backfill |
| Mendes et al. [76] | Use of UPV as a performance parameter for concrete mixture design | 68 concrete mixtures, UCS and UPV tests at 28 and 91 days, silica fume impact analysis | UPV effectively predicts concrete strength except for high SF content mixtures | UPV is a viable non-destructive indicator of concrete performance and strength |
| Jiang et al. [16] | UPV and UCS relationship in alkali-activated slag (AAS)-based CPB | Various CPB mixtures, UCS and UPV testing at different curing ages, regression modeling | Exponential correlation (R2 > 0.94) between UCS and UPV in AAS-CPB | UPV provides cost-effective, efficient UCS predictions for AAS-CPB |
| Nugroho et al. [77] | Impact of mortar mixture variations on compressive strength and UPV | Examining fine aggregate-cement ratios, UCS and UPV logarithmic correlation analysis | UPV and UCS follow a logarithmic trend, inversely related to porosity | UPV offers real-time assessment of mortar properties for mixture optimization |
| Hong et al. [78] | Compressive strength and UPV correlation in silica fume-blended cement mortars | ISO 679 standard [27]-based testing, SF influence on UCS and UPV correlation | UPV and UCS show an exponential relationship, influenced by SF replacement rate | UPV measurement serves as a practical alternative to destructive UCS testing |
| Sari et al. [13] | Silica fume (SF)-replacement’s impact on UPV and compressive strength in cement mortar | Different SF replacement rates in cement mortar, UCS and UPV correlation analysis | SF substitution significantly influences UCS-UPV correlation, with minor effects on overall trend | UPV remains a strong indicator of UCS across different SF replacement rates |
| Aslam et al. [79] | Mechanical and durability properties of sustainable lightweight concrete with WPA | Concrete with WPA (20–100%), UCS and UPV polynomial regression analysis | UPV decreases with higher WPA, affecting UCS due to increased porosity and reduced density | UPV can effectively assess mechanical integrity of sustainable lightweight concrete |
| Kowsalya et al. [53] | Predicting compressive strength of Fly Ash Cenosphere (FAC) concrete using UPV | FAC concrete, IS 516:2018 [51] and IS 13311-1992 standard [52]-based UCS and UPV testing | UPV exhibits strong exponential correlation (0.91–0.99) with UCS, confirming prediction reliability | UPV provides a non-destructive means of evaluating the compressive strength of FAC concrete |
Table 4.
Comparison of ER and UCS correlation studies, highlighting the sustainability benefits of ER in waste reduction, real-time monitoring, and cost-effective testing.
Table 4.
Comparison of ER and UCS correlation studies, highlighting the sustainability benefits of ER in waste reduction, real-time monitoring, and cost-effective testing.
| Study | Focus Area | Methodology | Key Findings | Conclusion |
|---|
| Xu et al. [80] | Use of ER in CPB geotechnical evaluation | Wenner Four-Electrode method, UCS testing, ASTM G57-06 standards [17] | ER correlated significantly with UCS; rapid early strength gain noted. | ER testing is a cost-effective, time-efficient alternative to UCS. |
| Xu et al. [60] | Predicting UCS through ER in CPB hydration process | CPB samples with varying cement ratios tested for ER and UCS correlation | ER effectively predicted UCS development throughout hydration. | ER can reliably monitor hydration progress and strength in CPB. |
| Liu et al. [81] | Correlation between ER, hydration heat, and UCS | NER and microcalorimetry for resistivity, UCS testing for mechanical assessment | Strong correlation found between ER, hydration heat, and UCS. | Resistivity serves as a strong predictive indicator of UCS and hydration. |
| He et al. [82] | Mechanical behavior of coal waste rock backfills | Compression tests on coal waste rock backfill, ER measured via two-phase and four-phase methods | ER method effectively monitored deformation characteristics of waste rock backfill. | ER testing is a practical tool for monitoring backfill mechanical behavior. |
| Wu et al. [25] | Comparing ER and AE for UCS alternative testing | Analyzed ultrasonic waveforms, electrical conductivity, hydration heat, and ER-UCS correlation | ER and AE provided alternative strength evaluation methods to UCS. | ER complements AE as a real-time UCS testing alternative. |
| Zhu et al. [83] | Evaluating ICPB properties using ER | Investigated microstructure and hydration using NMR, SEM-EDS, and FFRC tests | ER correlated with UCS, capturing hydration and porosity changes. | ER effectively evaluates ICPB properties, including hydration and strength. |
| Lee et al. [84] | Application of ER in cement-based materials | Examined hydration, curing time, water-solid ratios’ impact on ER in cement pastes | ER values increased with hydration and material density, indicating strength evolution. | ER is a viable tool for assessing early-age cement-based materials. |
| Zhang et al. [85] | ER-UCS relationship under varying curing temperatures | CPB specimens cured at 20–60 °C to study hydration effects on ER and UCS | Optimal strength achieved at 40 °C; ER tracked hydration efficiency. | ER testing provides real-time insights into UCS evolution in CPB. |
| Wan et al. [86] | Effect of calcium nitrite on ER-UCS correlation | Studied calcium nitrite impact on hydration and microstructure using ER and UCS tests | Higher ER values indicated denser structure and stronger UCS correlation. | ER reliably predicts UCS, supporting improved mix design strategies. |
| Gholampoor et al. [87] | ER as a tool for early-stage quality of stabilized DS | Monitored hydration and ion concentration using ER, compared with UCS at 28 days | ER provided early prediction of UCS, enabling non-destructive quality assessment. | ER testing enables rapid and non-destructive quality assessment of DS. |
Table 5.
Summary of AE monitoring studies correlating AE signals with UCS in CPB and other materials, highlighting AE as a reliable non-destructive method for tracking damage evolution and material failure.
Table 5.
Summary of AE monitoring studies correlating AE signals with UCS in CPB and other materials, highlighting AE as a reliable non-destructive method for tracking damage evolution and material failure.
| Study | Focus Area | Methodology | Key Findings | Conclusion |
|---|
| Cao et al. [88] | AE monitoring for waste rock CPB under triaxial compression | Triaxial compression tests with AE monitoring; stress–strain behavior analysis | AE activity mirrors UCS failure stages; prepeak quiescence and postpeak calm observed | AE serves as a reliable, real-time alternative to UCS for assessing mechanical strength |
| Wu et al. [89] | AE monitoring as an alternative to UCS for CPB | Uniaxial compression tests with AE21C system; crack activity analysis | AE counts peak at stress maximum; AE activity increases with cement content | AE monitoring effectively captures stress–strain behavior in CPB |
| Wang et al. [90] | Mechanical behavior and AE properties of CPB | PCI-2 AE system with six sensors; stress–strain monitoring during UCS tests | AE ringing count increases with load; AE signals correlate with damage evolution | AE provides insights into crack propagation and structural integrity |
| Zhao et al. [91] | AE analysis of cemented tantalum-niobium tailings backfills | UCS and Brazilian splitting tests; AE signal analysis of stress response | AE peak timing varies with lime-sand ratio; microcrack dynamics analyzed | AE correlates with stress-induced damage and predicts UCS values |
| Zhou et al. [92] | AE for assessing UCS and damage evolution in CPB | UCS tests and AE signal tracking; event rate and energy rate correlation | Strong correlation between AE properties and UCS failure stages | AE enables real-time assessment of CPB failure characteristics |
| Qiu et al. [93] | AE characteristics in cemented rock-tailings backfill | UCS and AE monitoring of cemented rock-tailings backfill with varying compositions | AE parameters like ringing count and cumulative hits track UCS evolution | AE analysis aids in optimizing waste rock content in cemented backfill |
| Chen et al. [94] | AE monitoring under variable angle shear tests | AE monitoring under shear tests at 30°, 45°, and 60° angles | AE energy evolution follows shear angles; stepwise failure at 60° | AE monitoring complements UCS in evaluating shear failure mechanics |
| Sun et al. [95] | AE for Gangue and high water-CPB mechanical assessment | AE monitoring of stress–strain behavior during UCS tests | AE signals correspond to internal damage progression in CPB | AE tracking enhances UCS predictions in gangue-based CPB |
| Yin et al. [96] | AE application in CPB-rock combination failure assessment | AE monitoring with rise time, amplitude, average frequency value analysis | AE b-value and Dr indicator developed for failure prediction | AE b-value and Dr offer robust predictive tools for instability |
| Chen et al. [97] | AE integration with UCS testing for CPB analysis | AE ringing count correlation with UCS stress levels in CPB | AE and UCS tests complement each other for material stability assessment | AE supports non-destructive testing and UCS measurement integration |
Table 6.
Summary of meta-analysis results for NDT methods (UPV, ER, and AE) based on R2 correlation with UCS, showing the predictive strength and variability of each method.
Table 6.
Summary of meta-analysis results for NDT methods (UPV, ER, and AE) based on R2 correlation with UCS, showing the predictive strength and variability of each method.
| NDT Method | Mean (R2) | Range | Insight |
|---|
| UPV | 0.895 | 0.85–0.95 | Strong and consistent predictor of UCS; minimal spread shows reliability. |
| ER | 0.872 | 0.78–0.92 | Slightly lower mean R2 with higher variability due to moisture sensitivity. |
| AE | 0.896 | 0.80–0.96 | Comparable to UPV in strength prediction; shows tight clustering, excellent for crack progression detection. |
| UPV (km/s) | AE (Units) | ER (ohm-m) | UCS (MPa) |
|---|
| 3.149 | 2.221 | 90.44 | 29.638 |
| 3.335 | 7.175 | 112.79 | 42.654 |
| 3.536 | 3.273 | 102.97 | 37.580 |
| …… | …… | ……. | ….... |
Table 8.
LR and RF model performance across different NDT input configurations for UCS prediction.
Table 8.
LR and RF model performance across different NDT input configurations for UCS prediction.
| Model Input | R2 (LR) | MAE (LR) | R2 (RF) | MAE (RF) |
|---|
| UPV only | 0.148 | 6.32 | 0.063 | 5.99 |
| AE only | 0.291 | 5.89 | −0.083 | 7.07 |
| ER only | −0.035 | 6.60 | 0.020 | 6.13 |
| UPV + AE | 0.377 | 5.54 | 0.187 | 6.25 |
| UPV + ER | 0.149 | 6.22 | 0.069 | 6.23 |
| AE + ER | 0.318 | 5.49 | 0.101 | 6.63 |
| UPV + AE + ER | 0.389 | 5.40 | 0.320 | 5.82 |


