1. Introduction
The magnetocaloric effect (MCE) is an adiabatic temperature change in a magnetic material caused by the variation in magnetization state under the action of an external magnetic field [
1]. Since its discovery in the early 20th century, refrigeration technology based on the MCE has attracted extensive attention in the field of science and industry. Compared with conventional gas compression refrigeration technology, magnetic refrigeration technology is not only more energy efficient but also has a lower environmental impact. This advantage makes magnetic refrigeration a promising alternative to traditional refrigeration technologies, especially in applications that require low or very low temperatures, such as medical cryostorage and superconductivity technology. However, to realize the large-scale application and industrialization of magnetic refrigeration technology, the key challenges lie in the selection of magnetic refrigeration materials and the optimization of the MCE.
The ideal magnetic refrigeration material should have a large Δ
SM, a suitable working temperature range, stable mechanical and chemical properties, and low cost and be non-toxic and environmentally friendly. Many types of material have been investigated. Rare earth metal-based materials, e.g., gadolinium and its alloys, are among the earliest research objects in the field of magnetic refrigeration. Gadolinium, in particular, exhibits a significant magnetic entropy change near its Curie temperature (approximately 293 K), making it a classic material for room-temperature magnetic refrigeration [
1]. The discovery of the Gd
5(Si
2Ge
2) [
2] alloy is considered an important breakthrough in the study of magnetic refrigeration materials. This material enhances magnetic refrigeration performance through the coupling of magnetic and lattice structure changes. The Heusler alloy consisting of transition metals (Ni, Mn, and Co) has become another hot spot in the study of magnetic refrigeration due to its significant magnetic lattice coupling effect [
3].
In recent years, rare-earth transition metal perovskite-structured materials (ABO
3) have shown great application potential due to their unique crystal structures and diverse physical properties. The A- and B-site ions in these materials can be adjusted through chemical doping and element substitution to fine-tune their magnetic and thermodynamic properties, such as Curie temperature and the magnetocaloric effect. Among them, RScO
3 (where R represents rare-earth elements, such as Gd, Dy, etc.) [
4] shows unique magnetic and thermodynamic properties, demonstrating significant potential for magnetic refrigeration applications. For example, GdScO
3 has an orthorhombic perovskite structure (Pbnm No. 62), and the 4f
7 electronic configuration of its Gd
3+ ion gives it not only a high magnetic moment, but also suitable Curie temperature, which makes it excellent in magnetic refrigeration applications. Studies have shown that GdScO
3 exhibits a significant Δ
SM up to 39.39 J/kg K near its magnetic transition temperature [
5]. In addition to GdScO
3, DyScO
3 is also an important perovskite material, showing good magnetocaloric properties and potential applications. It is found that the material exhibits strong magnetic anisotropy and an Ising-type antiferromagnetic structure at low temperatures (3.5 K). Under low magnetic fields (10–20 kOe), significant rotational magnetic entropy changes can be obtained by rotating single crystal, indicating that the DyScO
3 single crystal is a potential candidate material for low-field magnetic refrigeration in the liquid helium temperature region [
6]. Furthermore, our previous studies on rare earth-based chromate showed that GdCrO
3 and DyCrO
3 have large MCEs near the phase transition temperature
(2.8–3.9 K) [
7]. Gd
3+ and Dy
3+ ions introduce different critical behaviors, which lead to different dependences of the MCE on the magnetic field. The MCE can also be tuned by co-doping Gd
3+/Dy
3+ with chromate compounds [
8]. These studies demonstrate the significant potential of co-doping with Dy
3+ and Gd
3+ in enhancing magnetocaloric properties. Therefore, it is also worthwhile to systematically study the specific effect of Dy
3+ doping on the magnetocaloric properties of GdScO
3 materials.
In this work, the magnetic properties and MCEs of perovskite structure materials GdScO3, DyScO3, and Dy3+-doped GdScO3 were investigated. The crystal structure and magnetic phase transition were analyzed. The magnetocaloric effect of these materials was analyzed through isothermal magnetization experiments.
3. Results and Discussion
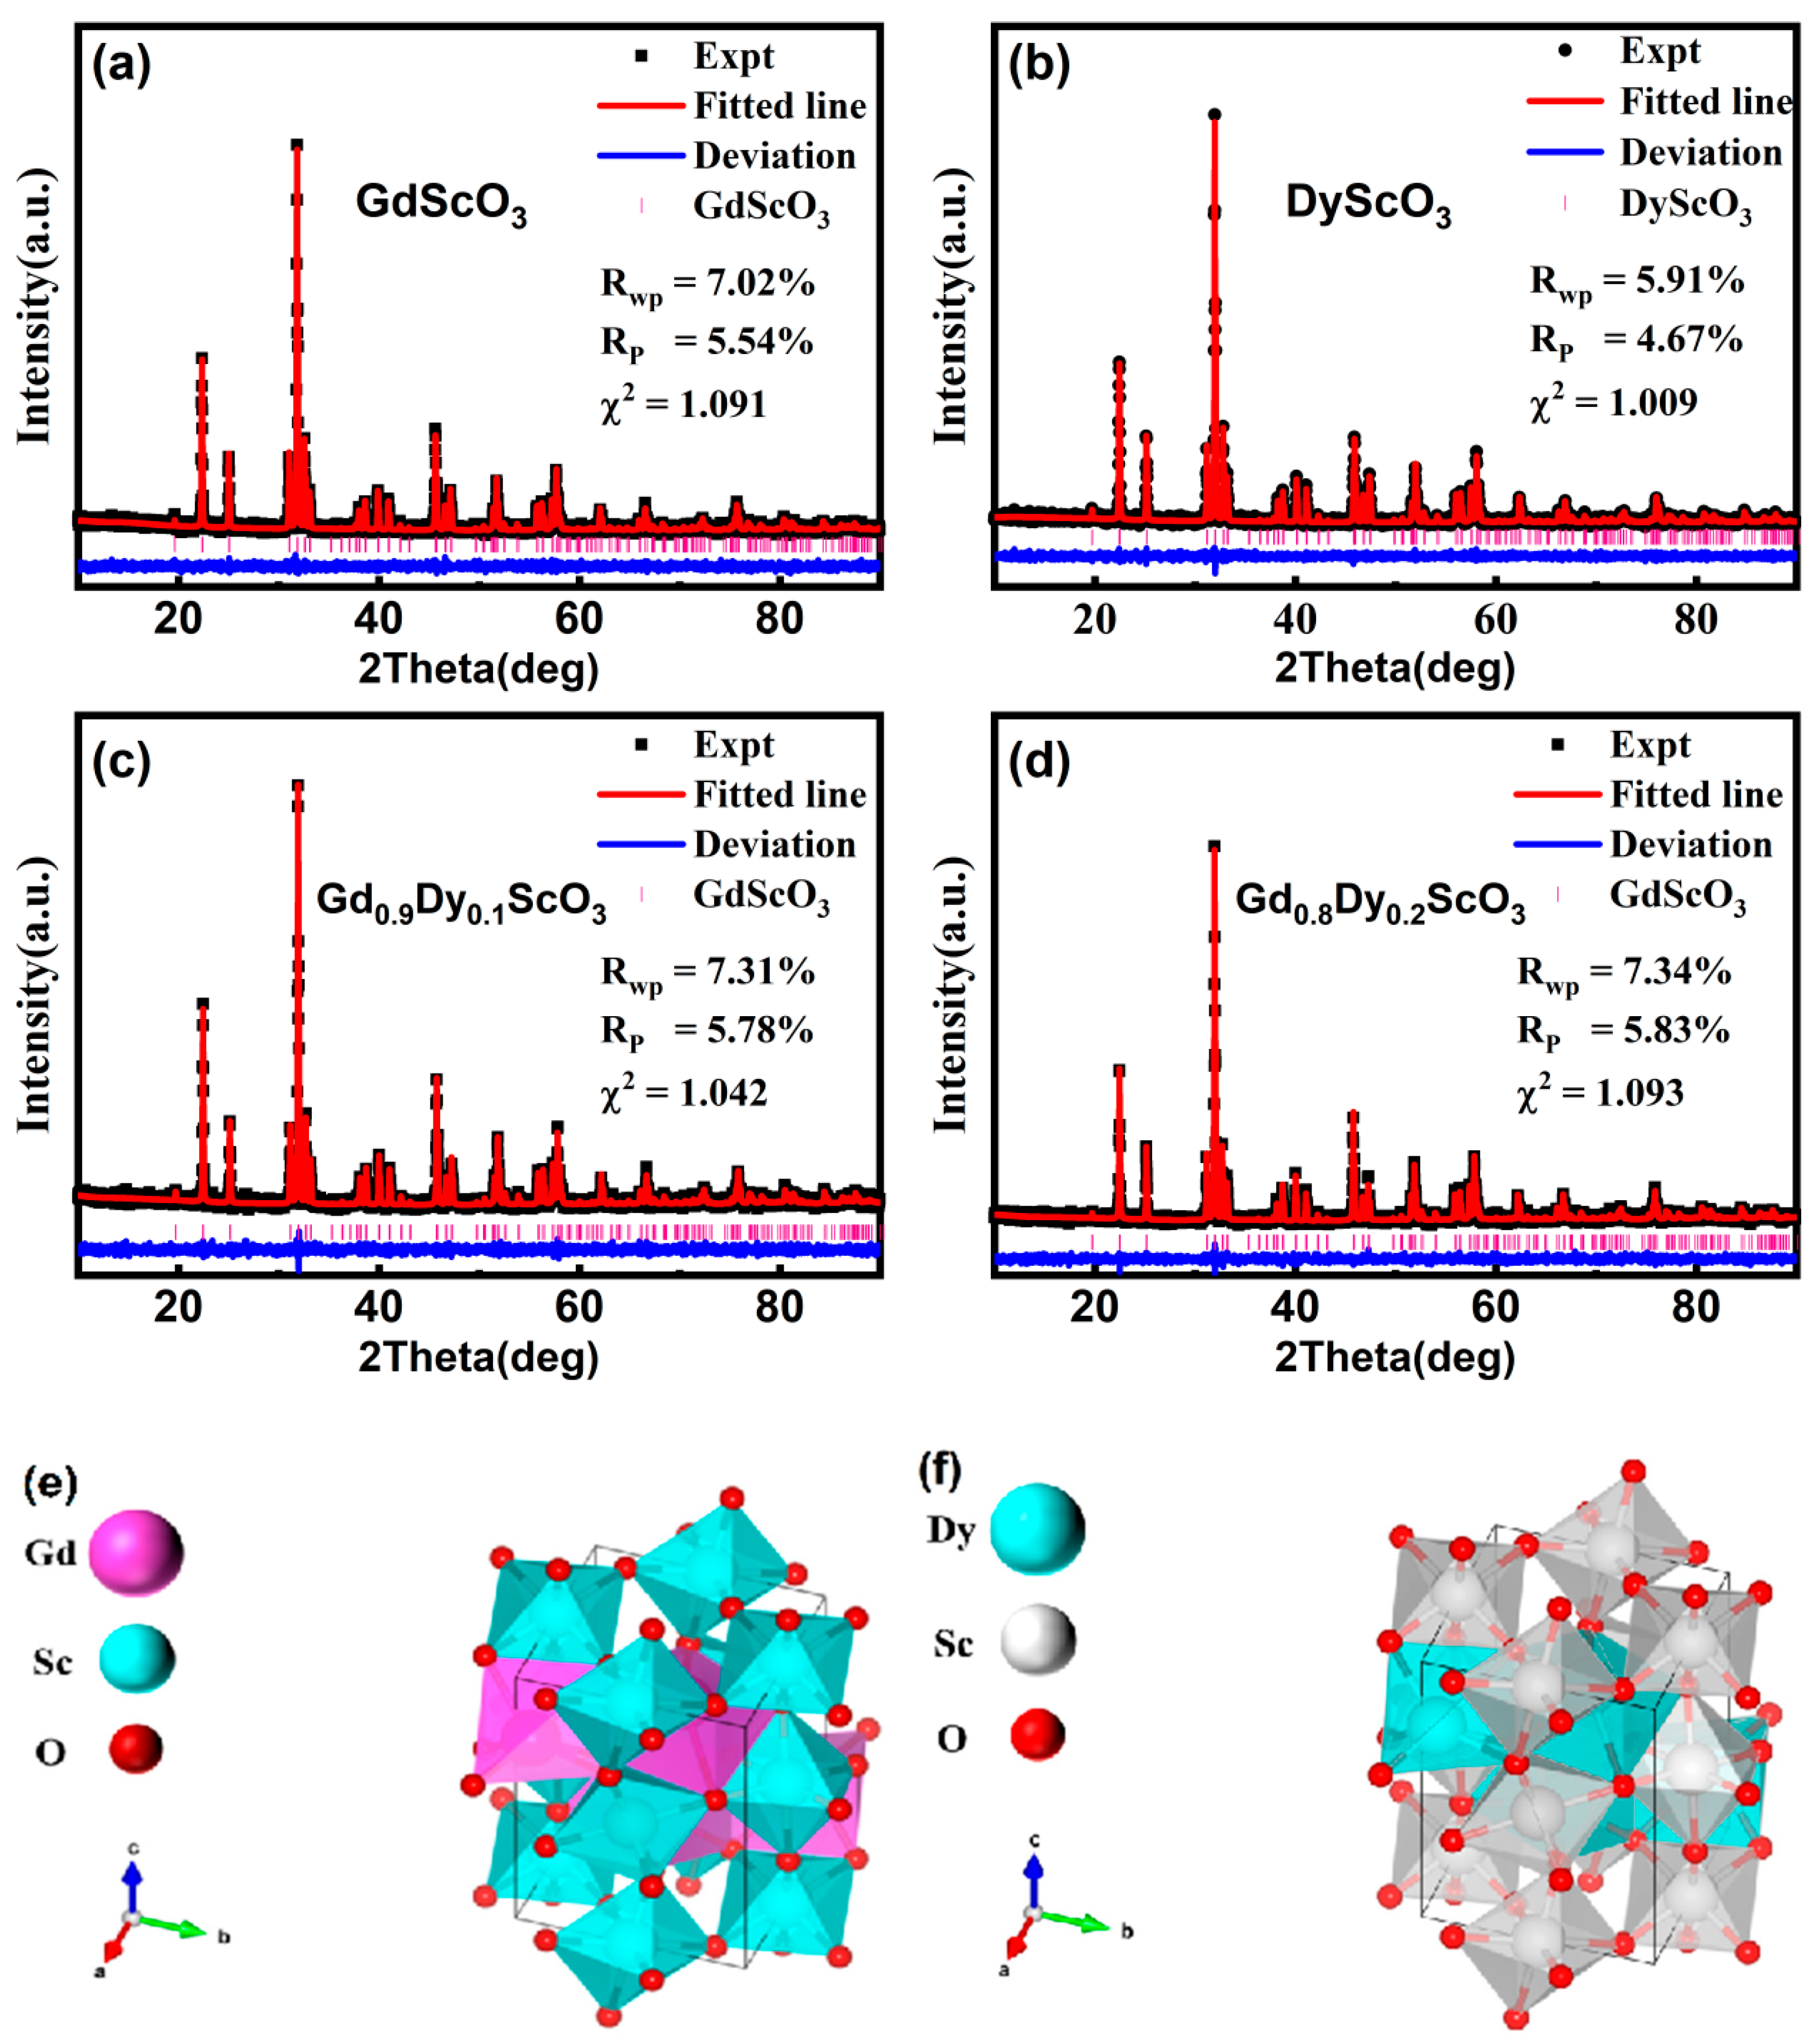
Figure 1 shows the XRD patterns of the four samples. Rietveld refinement of the XRD patterns was performed using software (GSAS-II, revision 5758 (svn)) and fitted to the standard diffraction patterns of GdScO
3 (ICSD #65513) and DyScO
3 (ICSD #99545), respectively. The results show that all samples exhibit an orthorhombic perovskite structure with a space group of Pbnm. No additional impurity peaks were found in the patterns of Gd
0.8Dy
0.2ScO
3 and Gd
0.9Dy
0.1ScO
3. The main diffraction peaks are highly consistent with the fitting curve, and the baseline is smooth without obvious deviation. The small standard errors R
p, R
wp, and χ
2 shown in
Figure 1 indicate the reliability of the refinement results. The lattice parameters were derived from the refinement and listed in
Table 1. These parameters are in good agreement with the results reported in the literature [
9]. With increasing Dy
3+ doping, the lattice parameters of the sample decrease, which is in line with the trend of the substitution of small-sized Dy
3+ ions (0.908 Å) [
10] for Gd
3+ ions (0.938 Å) [
11]. The calculation of grain size is (
) [
12], where
D is the crystallite size,
λ is the wave length of the X-ray,
β is the full width at half maximum of the diffraction peak,
θ is the diffraction angle. The sample shows a polycrystalline structure with an average grain size of 10.58 Å (x = 0), 10.48 Å (x = 0.1), 10.56 Å (x = 0.2), and 17.03 Å (x = 1.0). To further investigate the elemental distributions of Gd
1-xDy
xScO
3 (x = 0, 0.1, 0.2, and 1), SEM and EDS were employed to analyze the microstructures and elemental composition of the samples.
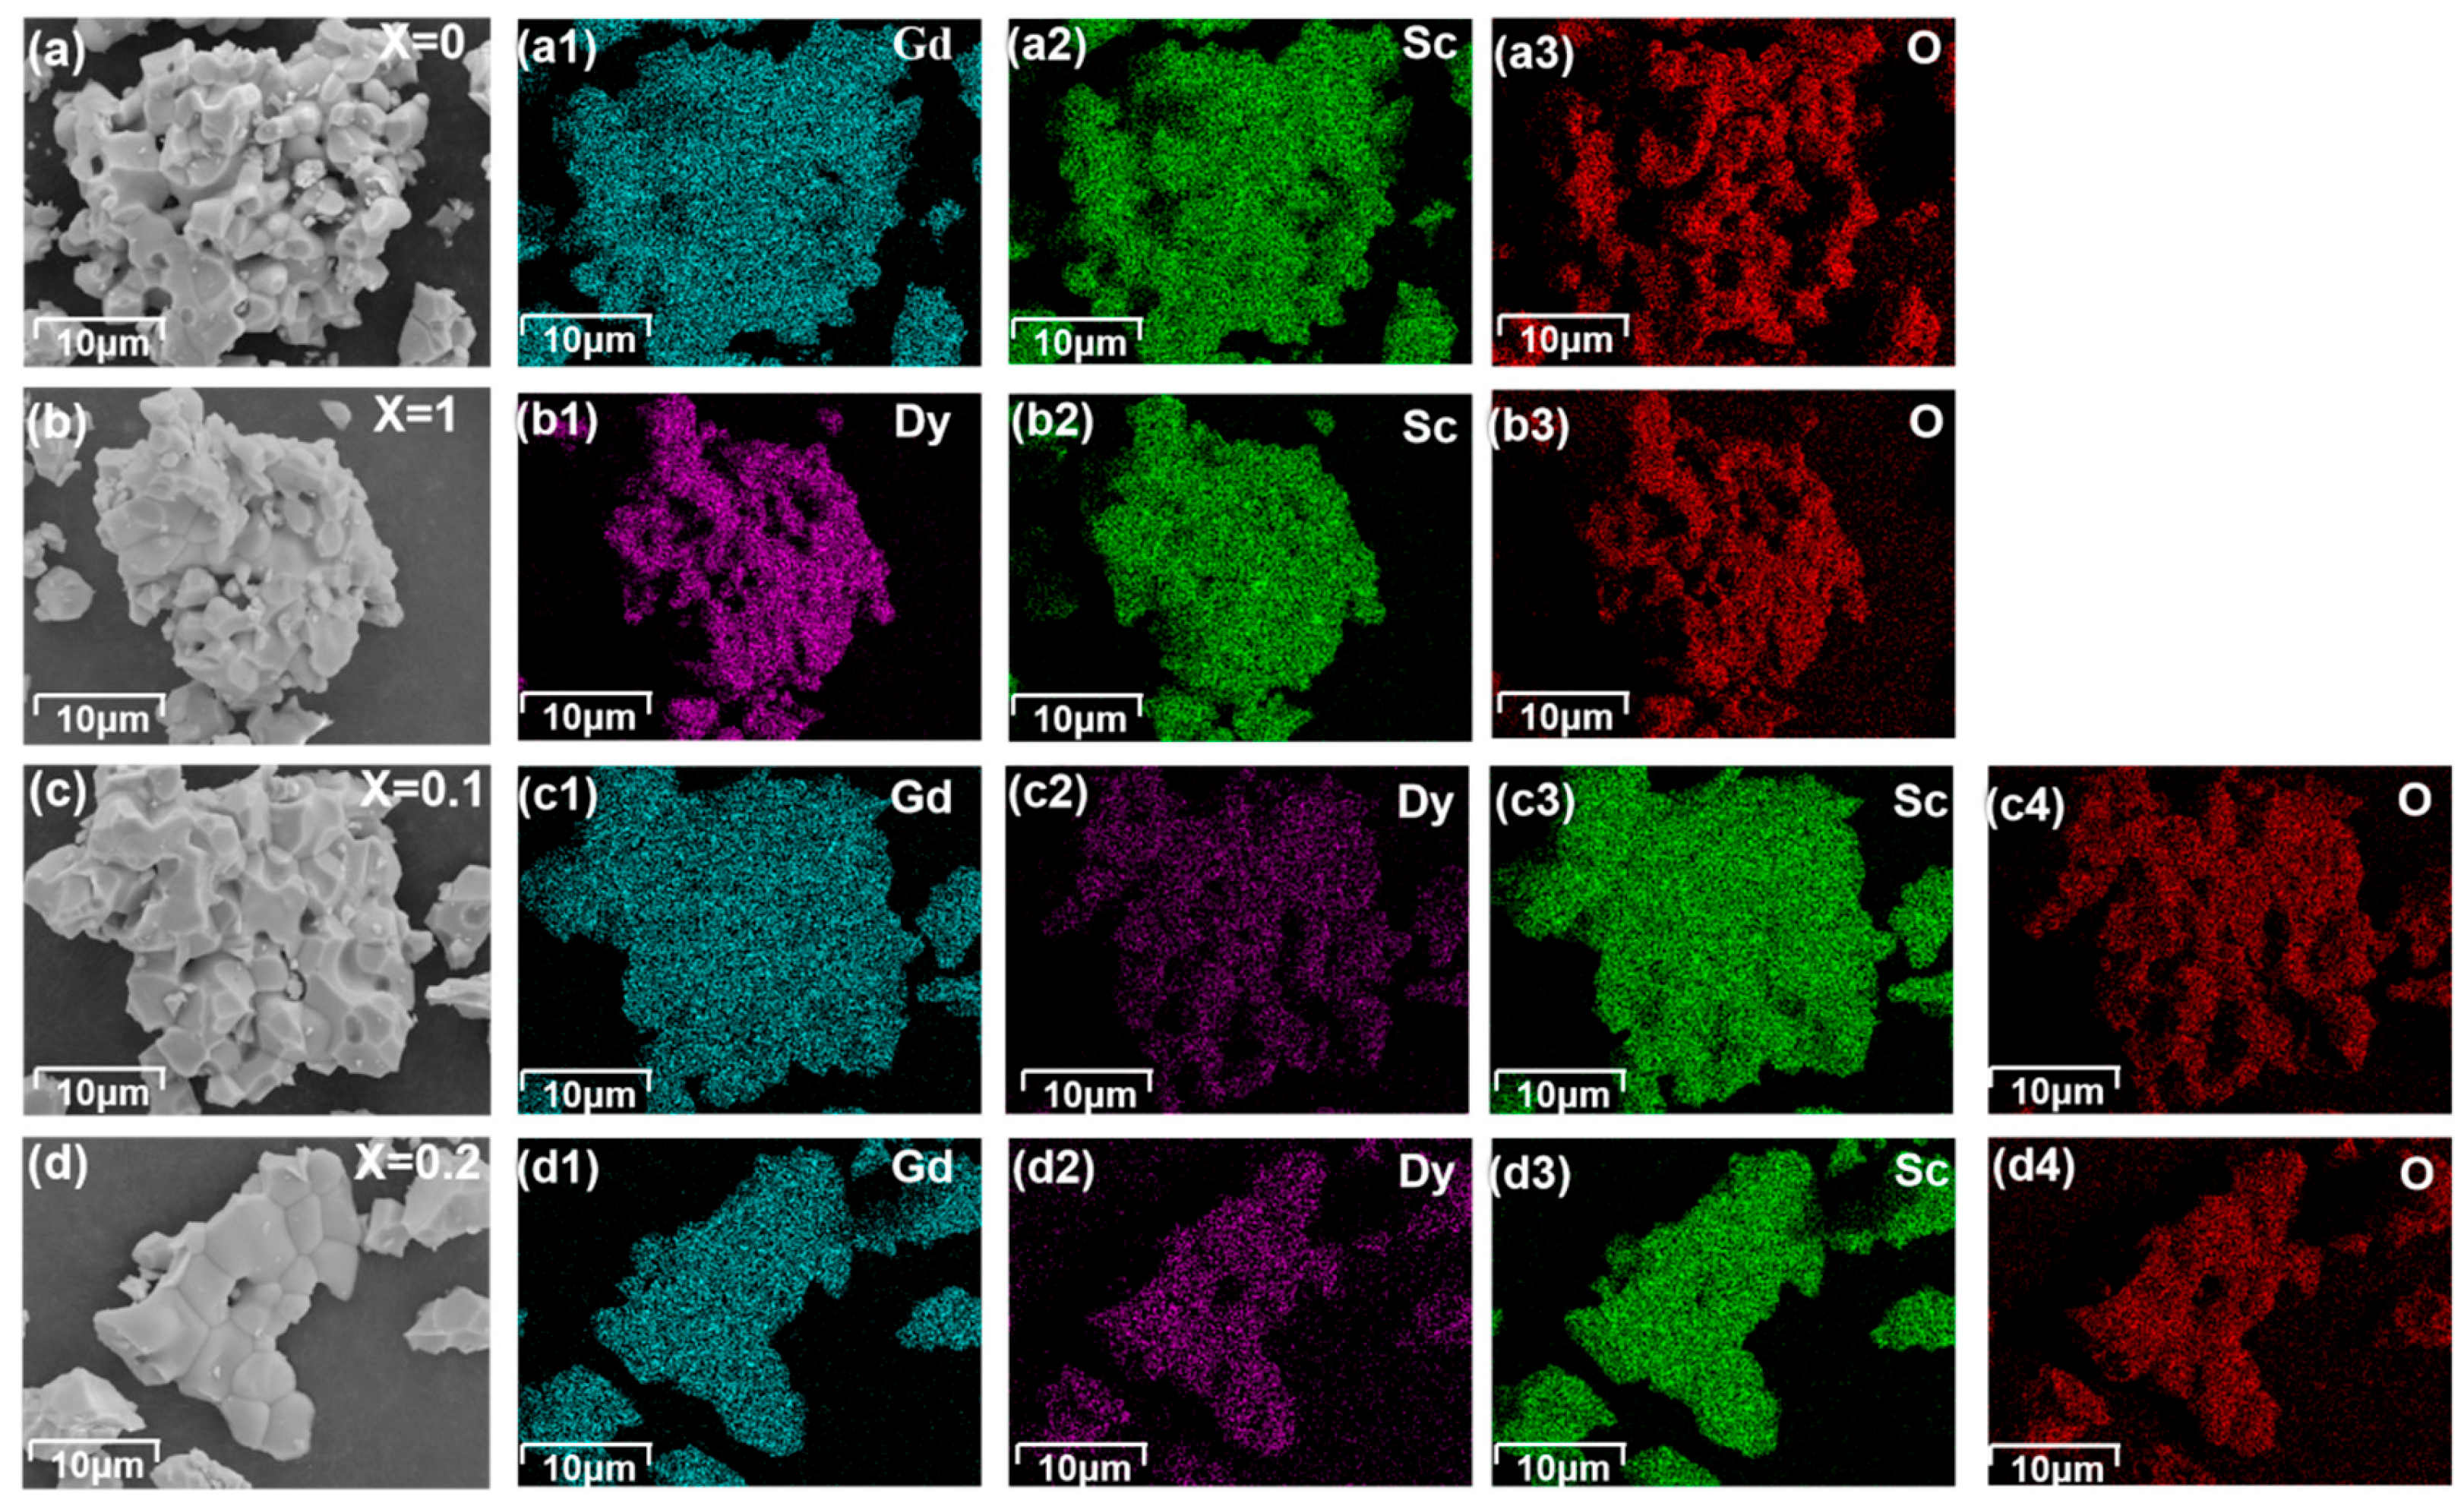
Figure 2 shows the results obtained using the samples with Gd
1-xDy
xScO
3 (x = 0, 0.1, 0.2 and 1). The compounds exhibit relatively homogeneous distributions of Gd and Dy, indicating that Dy doping does not lead to significant phase separation, and a pure phase is formed.
Figure 3 presents the particle sizes of the samples: (a) GdScO
3, (b) DyScO
3, (c) Gd
0.9Dy
0.1ScO
3, and (d) Gd
0.8Dy
0.2ScO
3. The average particle sizes are approximately 2.59 μm, 2.81 μm, 3.89 μm, and 3.85 μm, respectively.
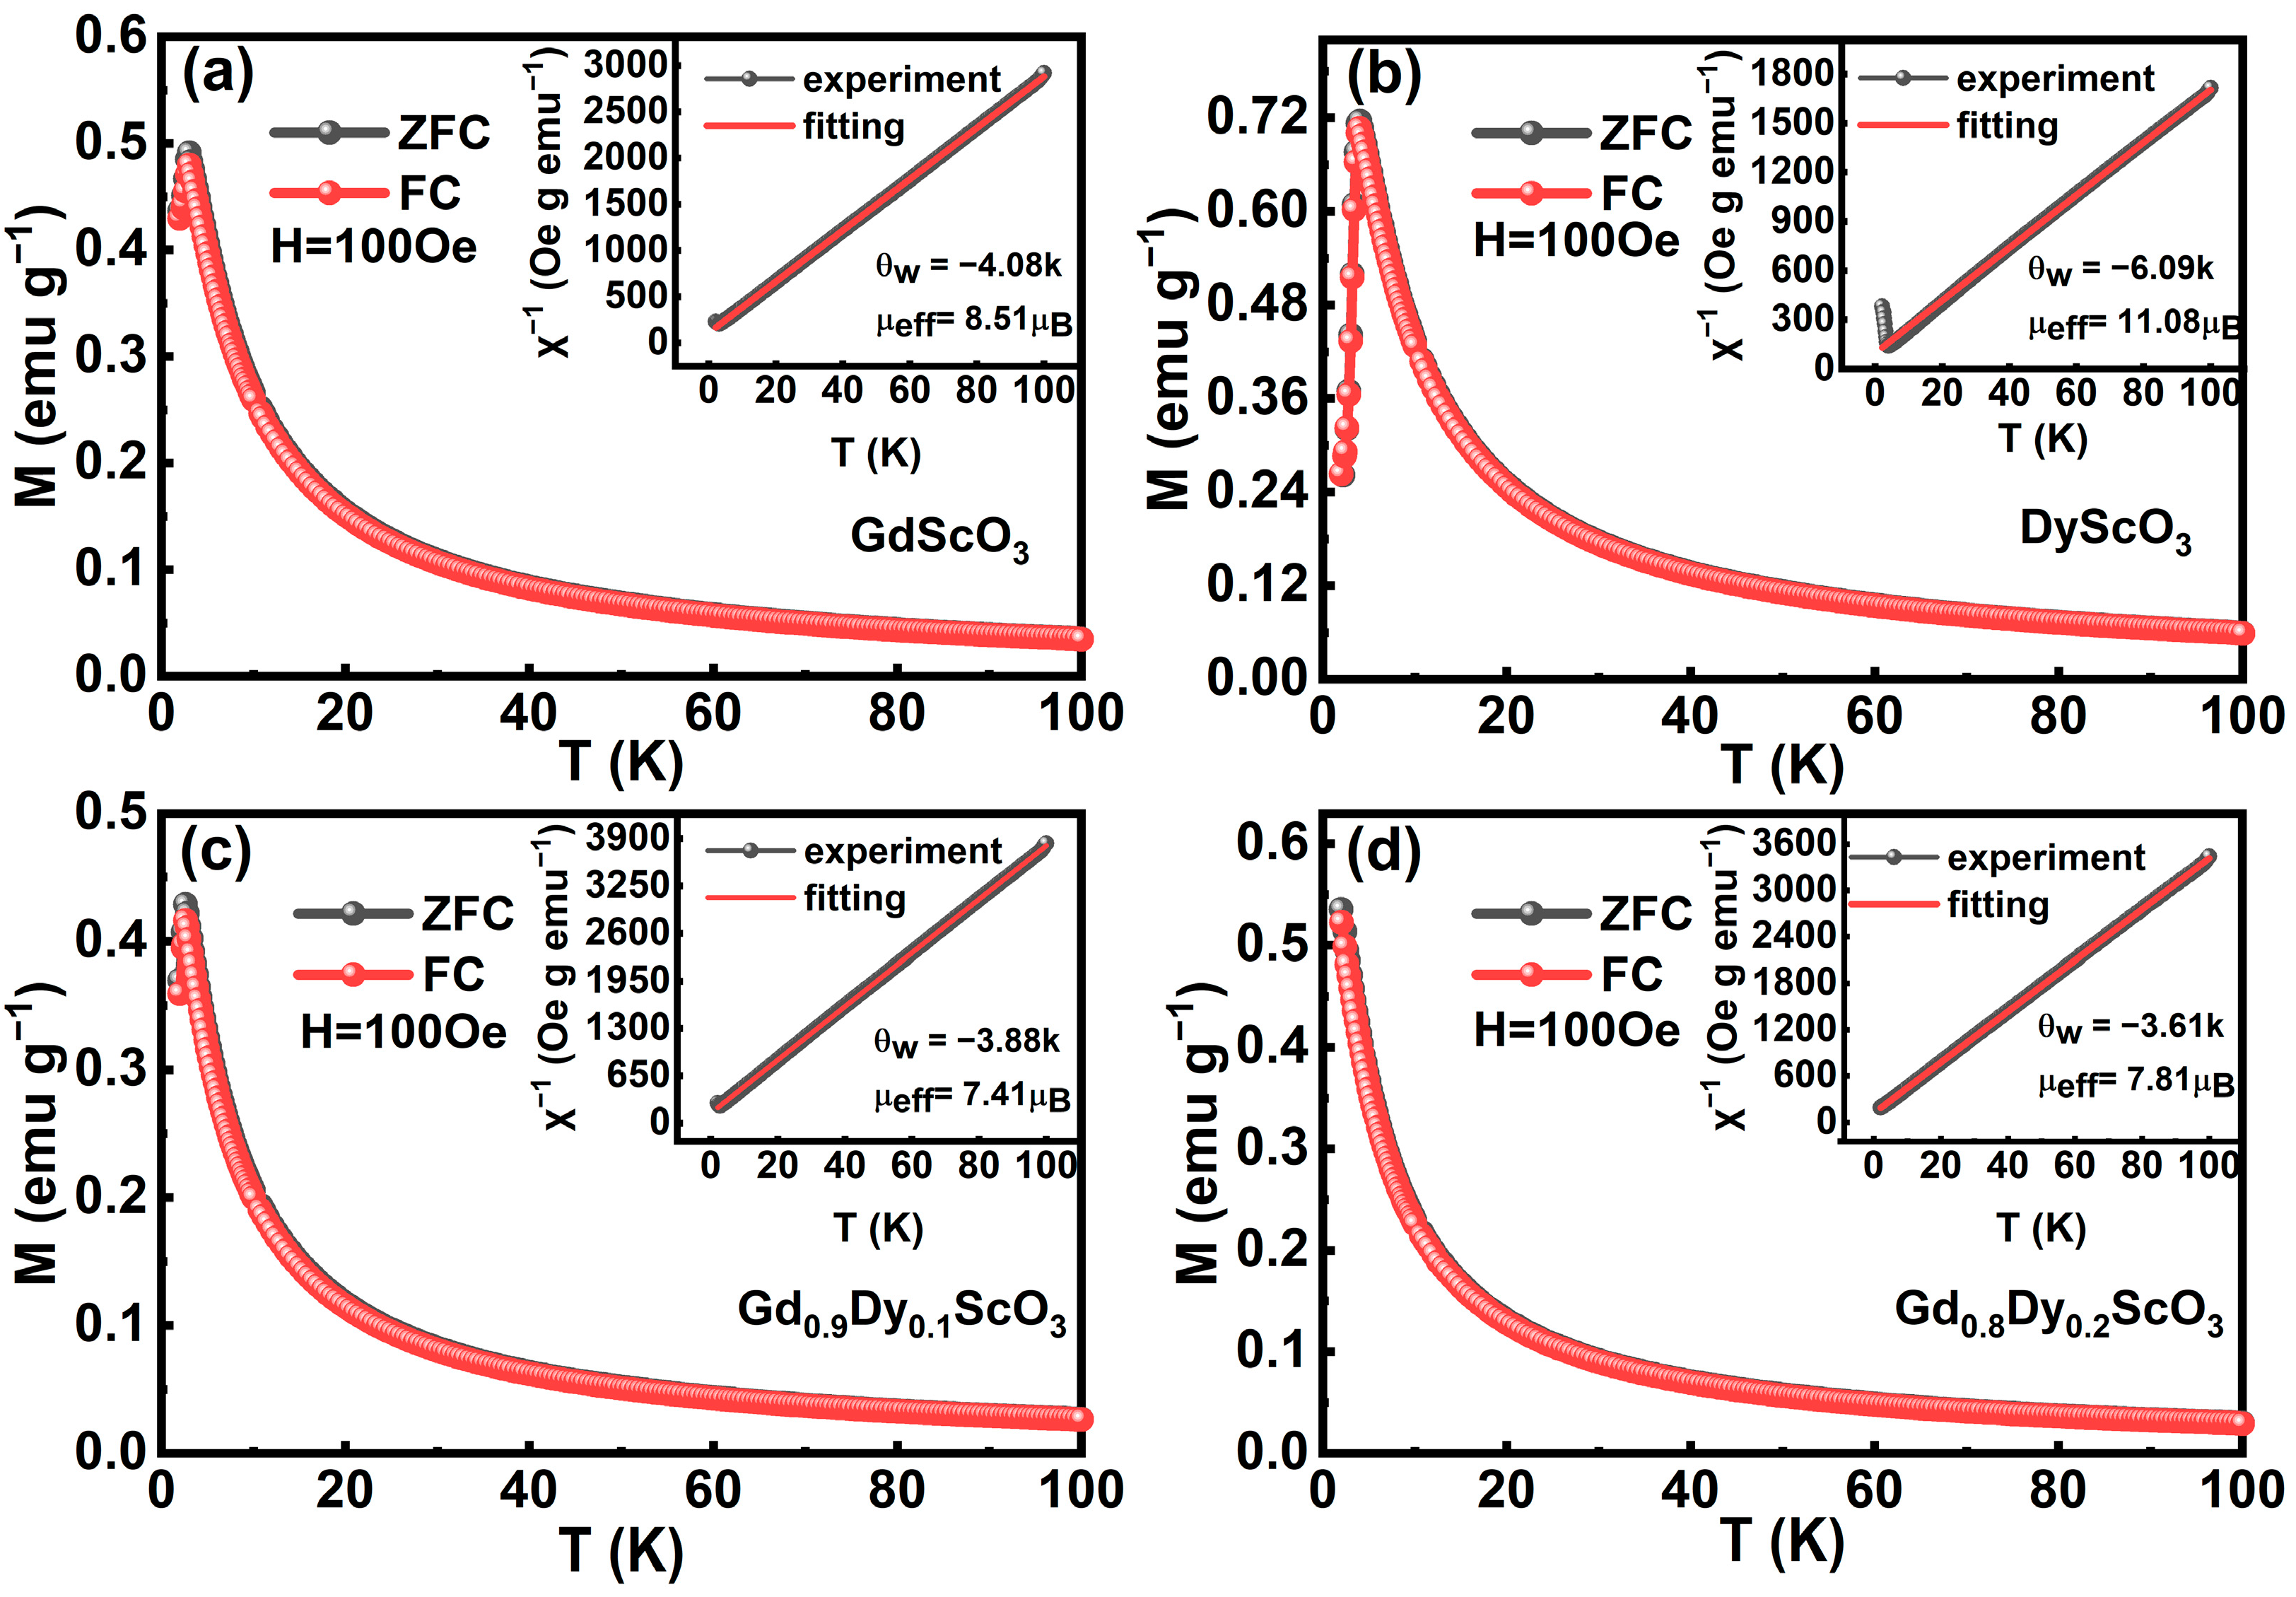
ZFC and FC curves under a 100 Oe magnetic field are shown in
Figure 4. For all samples, magnetization gradually increases with the decrease in temperature, showing typical paramagnetic characteristics. When the temperature further decreases, a peak of magnetization was observed for the samples except Gd
0.8Dy
0.2ScO
3. The temperature dependences of reciprocal magnetic susceptibility are plotted in the insets of
Figure 4a–d. Above the phase transition temperature, the plots follow the Curie–Weiss law and the Curie–Weiss temperature
θp was determined to be −4.08 K, −3.88 K, −3.61 K, and −6.09 K, respectively, indicating antiferromagnetic interaction between rare-earth ions in the samples. The phase transition temperatures (
TN) for the paramagnetic state (PM) to the antiferromagnetic state (AFM) were identified by the presence of hump-shaped anomalies in both ZFC and FC magnetization curves with values of approximately 3 K, 2.8 K and 4 K for GdScO
3, Gd
0.9Dy
0.1ScO
3, and DyScO
3, respectively. For the Gd
0.8Dy
0.2ScO
3 sample, no antiferromagnetic transition was observed due to the limitation of the minimum measurement temperature.
TN of GdScO
3 reflects the antiferromagnetic interaction between Gd
3+-Gd
3+ ions [
4]. It is within the range of the phase transition temperatures of previously reported Gd-based compounds, such as GdAlO
3 (3.87 K) [
13] and GdInO
3 (2.1 K) [
14].
TN of DyScO
3 corresponds to the antiferromagnetic interaction between Dy
3+-Dy
3+ ions. This is consistent with the phase transition temperature of DyAlO
3 at 3.92 K [
15].
The decrease in
TN with increasing Dy
3+ doping content is attributed to the partial destruction of the long-range antiferromagnetic order. The Dy
3+ ion exhibits strong single-ion anisotropy due to its oblate electron cloud of 4f electrons [
16]. The spins lie in the a-b plane and show strong magnetic anisotropy, as reported for the DyScO
3 single crystal in ref. [
6]. Due to the strong magnetic anisotropy of Dy
3+, the magnetic moment is easily influenced by the local crystal field, making it difficult to antiferromagnetically align with the magnetic moment direction of Gd
3+. Dy
3+ ions form localized short-range Dy
3+-Dy
3+ and Gd
3+-Dy
3+ interactions with surrounding ions and partially destroy the long-range antiferromagnetic coupling of Gd
3+-Gd
3+. On the other hand, the local short-range Dy
3+-Dy
3+ interaction could increase a certain net magnetic moment in a small external field above the Néel temperatures when the doping amount of Dy
3+ increases, e.g., x = 0.2 as shown in
Figure 4c. The decrease in the absolute value of the Curie–Weiss temperature from 4.08 K (x = 0) to 3.61 K (x = 0.2) also confirms the weakening of the exchange interaction due to the introduction of Dy
3+.
The effective magnetic moments of GdScO
3, DyScO
3, Gd
0.8Dy
0.2ScO
3, and Gd
0.9Dy
0.1ScO
3 were given by [
13]
where
kB,
NA, and
C are the Boltzmann constant, Avogadro constant, and Curie constant, respectively. The effective magnetic moments of GdScO
3, DyScO
3, Gd
0.8Dy
0.2ScO
3, and Gd
0.9Dy
0.1ScO
3 are 8.51
μB, 11.08
μB, 7.81
μB, and 7.41
μB, respectively. The theoretical magnetic moments of Gd
1-xDy
xScO
3 can be estimated by considering the contribution of Gd
3+ and Dy
3+ since Sc
3+ is a non-magnetic ion. The theoretical magnetic moments of GdScO
3, DyScO
3, Gd
0.8Dy
0.2ScO
3, and Gd
0.9Dy
0.1ScO
3 are 7.94
μB, 10.68
μB, 8.48
μB, and 8.21
μB, respectively.
The exchange interaction coupling can be estimated by using the Curie–Weiss temperatures:
where
S is the spin quantum number,
θp is the Curie–Weiss temperature, and
z is the nearest neighbor number of each spin. In our calculations,
z is taken as 6, based on the crystal structure coordination number of Gd (or Dy) ions. The spin quantum number
S is 7/2 for Gd
3+ and 5/2 for Dy
3+, corresponding to their electronic configurations. The calculation gives
Jex = −0.0449 cm
−1 for GdScO
3, which is closer to the reported Gd
3+-Gd
3+ interaction in GdAlO
3 (
Jex = −0.054 cm
−1) [
13]. The exchange coupling
Jex is −0.0165 cm
−1 in DyScO
3, which is close to the Dy
3+-Dy
3+ exchange coupling between DyAlO
3 compounds reported previously [
17]. Additionally, the magnetic dipolar coupling constant
D using the formula
, where
is the vacuum permeability,
R is the distance between nearest-neighbor magnetic ions. For GdScO
3, with
R = 3.852 Å and
g = 2, the dipolar coupling constant is approximately −0.031 cm
−1. For DyScO
3, with
R = 3.814 Å and
g = 4/3,
D is estimated to be about −0.014 cm
−1. These values are very close to the calculated exchange couplings
Jex, indicating that the dipolar interaction dominates the effective magnetic coupling in these materials. This further implies that the superexchange interaction between rare-earth ions is quite weak, which explains the low magnetic transition temperatures observed.
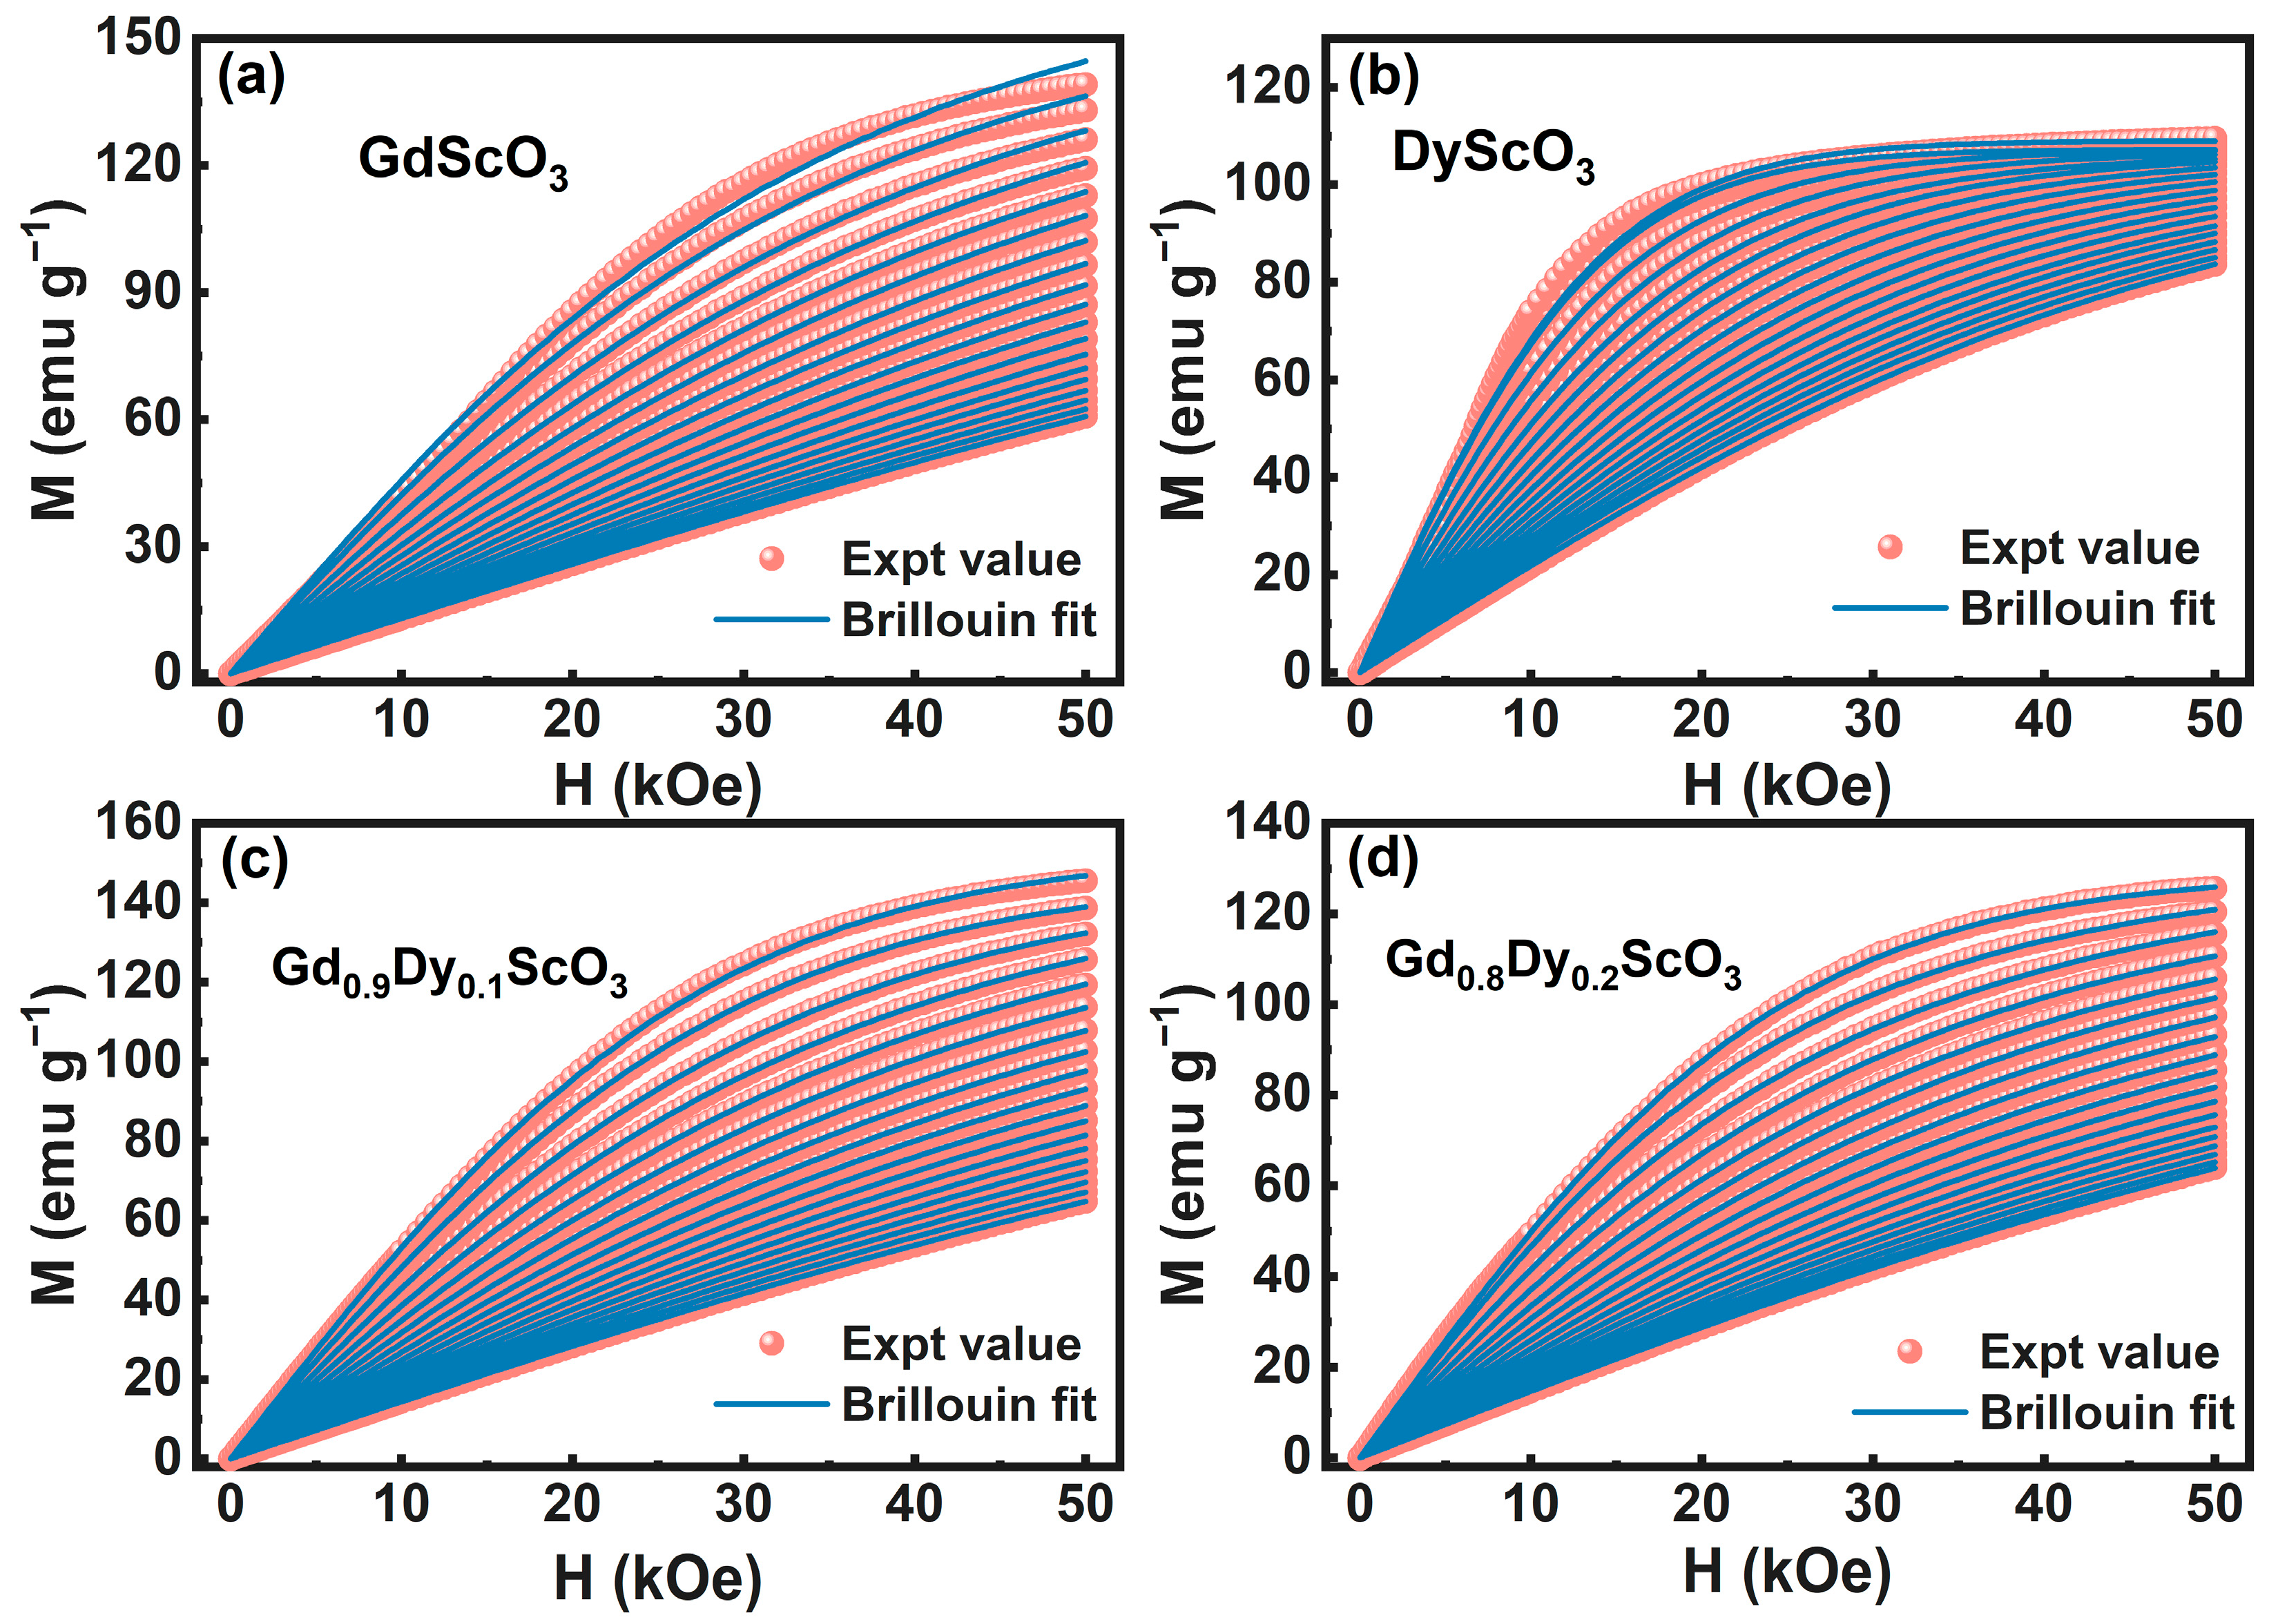
The isothermal magnetization curves are shown in
Figure 5. For GdScO
3 (
Figure 5a), magnetization increases slowly with an increase in the applied magnetic field, and does not reach saturation under high magnetic fields, which is consistent with the characteristics of antiferromagnetic materials. The magnetization value of GdScO
3 is 6.223
μB/f.u. (139.1 emu/g) at a temperature of 2 K and an applied magnetic field of 50 kOe, which is equivalent to 78.4% of the theoretical saturation magnetic moment of Gd
3+ ions (7.94
μB/f.u.). The existence of antiferromagnetic coupling makes it difficult to completely align the spins with the applied magnetic field even at 50 kOe. To analyze the magnetization process in more detail, the differential of
M with respect to
H was performed and the curve is plotted in
Figure 5b. There are two clear abnormal points at 4.1 kOe and 16.4 kOe on the curve. The abnormal point at 4.1 kOe is inferred to be the critical field of spin-flop, which is consistent with the previous report on the single crystal GdScO
3 [
18], in which the critical field of spin-flop is about 4 kOe when the magnetic field is parallel to the [010] crystallographic direction. The peak at 16.4 kOe is related to a spin-flop occurring along certain crystallographic directions, which may induce an AFM state to the ferromagnetic (FM) state. Based on the mean field theory, the strength of the exchange field
HE is deduced to be 30.17 kOe according to
, where
μB is the Bohr magneton,
g is the Landé g-factor,
kB is the Boltzmann constant,
TN = 3 K is the Néel temperature, and
S is the spin quantum number of the magnetic ion. In this work, the values used are
g = 2 and
S = 7/2 for the Gd
3+ ion. The anisotropic field can be calculated using the formula
HSF = (2
HAHE)
0.5 [
19], where
HSF is the value of the spin-flop field.
HA is 0.27 kOe, similar to that of GdCoO
3 synthesized using the sol–gel method, where
HE = 34 kOe and
HA = 0.33 kOe [
19].
The isothermal magnetization curves of Gd
0.9Dy
0.1ScO
3 and Gd
0.8Dy
0.2ScO
3 are shown in
Figure 5e,g, respectively. Both have similar magnetization behavior as that of GdScO
3 but with lower magnetizations of 6.53
μB/f.u. (145.521 emu/g) and 5.64
μB/f.u. (125.46 emu/g), respectively. As discussed previously, the increase in doping content of Dy
3+ reduces the content of Gd
3+, destroys the exchange coupling between Gd
3+ ions, and forms short-range disorder and a short-range local magnetic state. The formed disordered state makes it impossible to align all magnetic moments completely under a high field, leading to a reduction in the net magnetization, and both abnormal points visible in
Figure 5b are no longer visible in
Figure 5f,h.
The isothermal magnetization curves (
M-
H) of DyScO
3 at different temperatures are shown in
Figure 5c. Ferromagnetic-like magnetization behavior at low temperatures is observed. Dy
3+-Dy
3+ weak coupling leads to low stability of the anti-parallel arrangement of Dy
3+ magnetic moments, making it is easier to disturbed in the external field than GdScO
3, which is characterized by a rapid increase in magnetization at low fields and saturation at high fields and low temperatures. The derivative curve at 2 K temperature shows a significant peak, appearing at a magnetic field strength of 5.1 kOe, as shown in
Figure 5d. This peak corresponds to the occurrence of the spin-flop phenomenon, where the magnetic moment in the antiferromagnet jumps from the initial anti-parallel arrangement to a canted antiferromagnetic arrangement state under the applied magnetic field.
In addition, the Brillouin model is employed to fit the
M-
H curve [
18]. The formula of Brillouin model fitting is
where
is the Brillouin function and
. Here,
J is the total angular momentum quantum number of the magnetic ion. In this work,
J = 7/2 is used for Gd
3+ ions. The fitting results are shown in
Figure 6.
Figure 6a,b show a poor fitting effect in the low-temperature part, while the fitting effect in the high-temperature paramagnetic part is good. Since the Brillouin model is more suitable for fitting the magnetic state above the phase transition temperature, the model is not well suited for describing magnetization behavior with long-range-ordered magnetism and complex local environments. On the contrary,
Figure 6c,d show a good overall fitting effect. In the doped samples, due to the high magnetic moment and strong magnetic anisotropy of Dy
3+, the magnetization behavior is closer to the state of short-range disorder and localized ferromagnetism, and the fitting effect of the Brillouin function model is better.
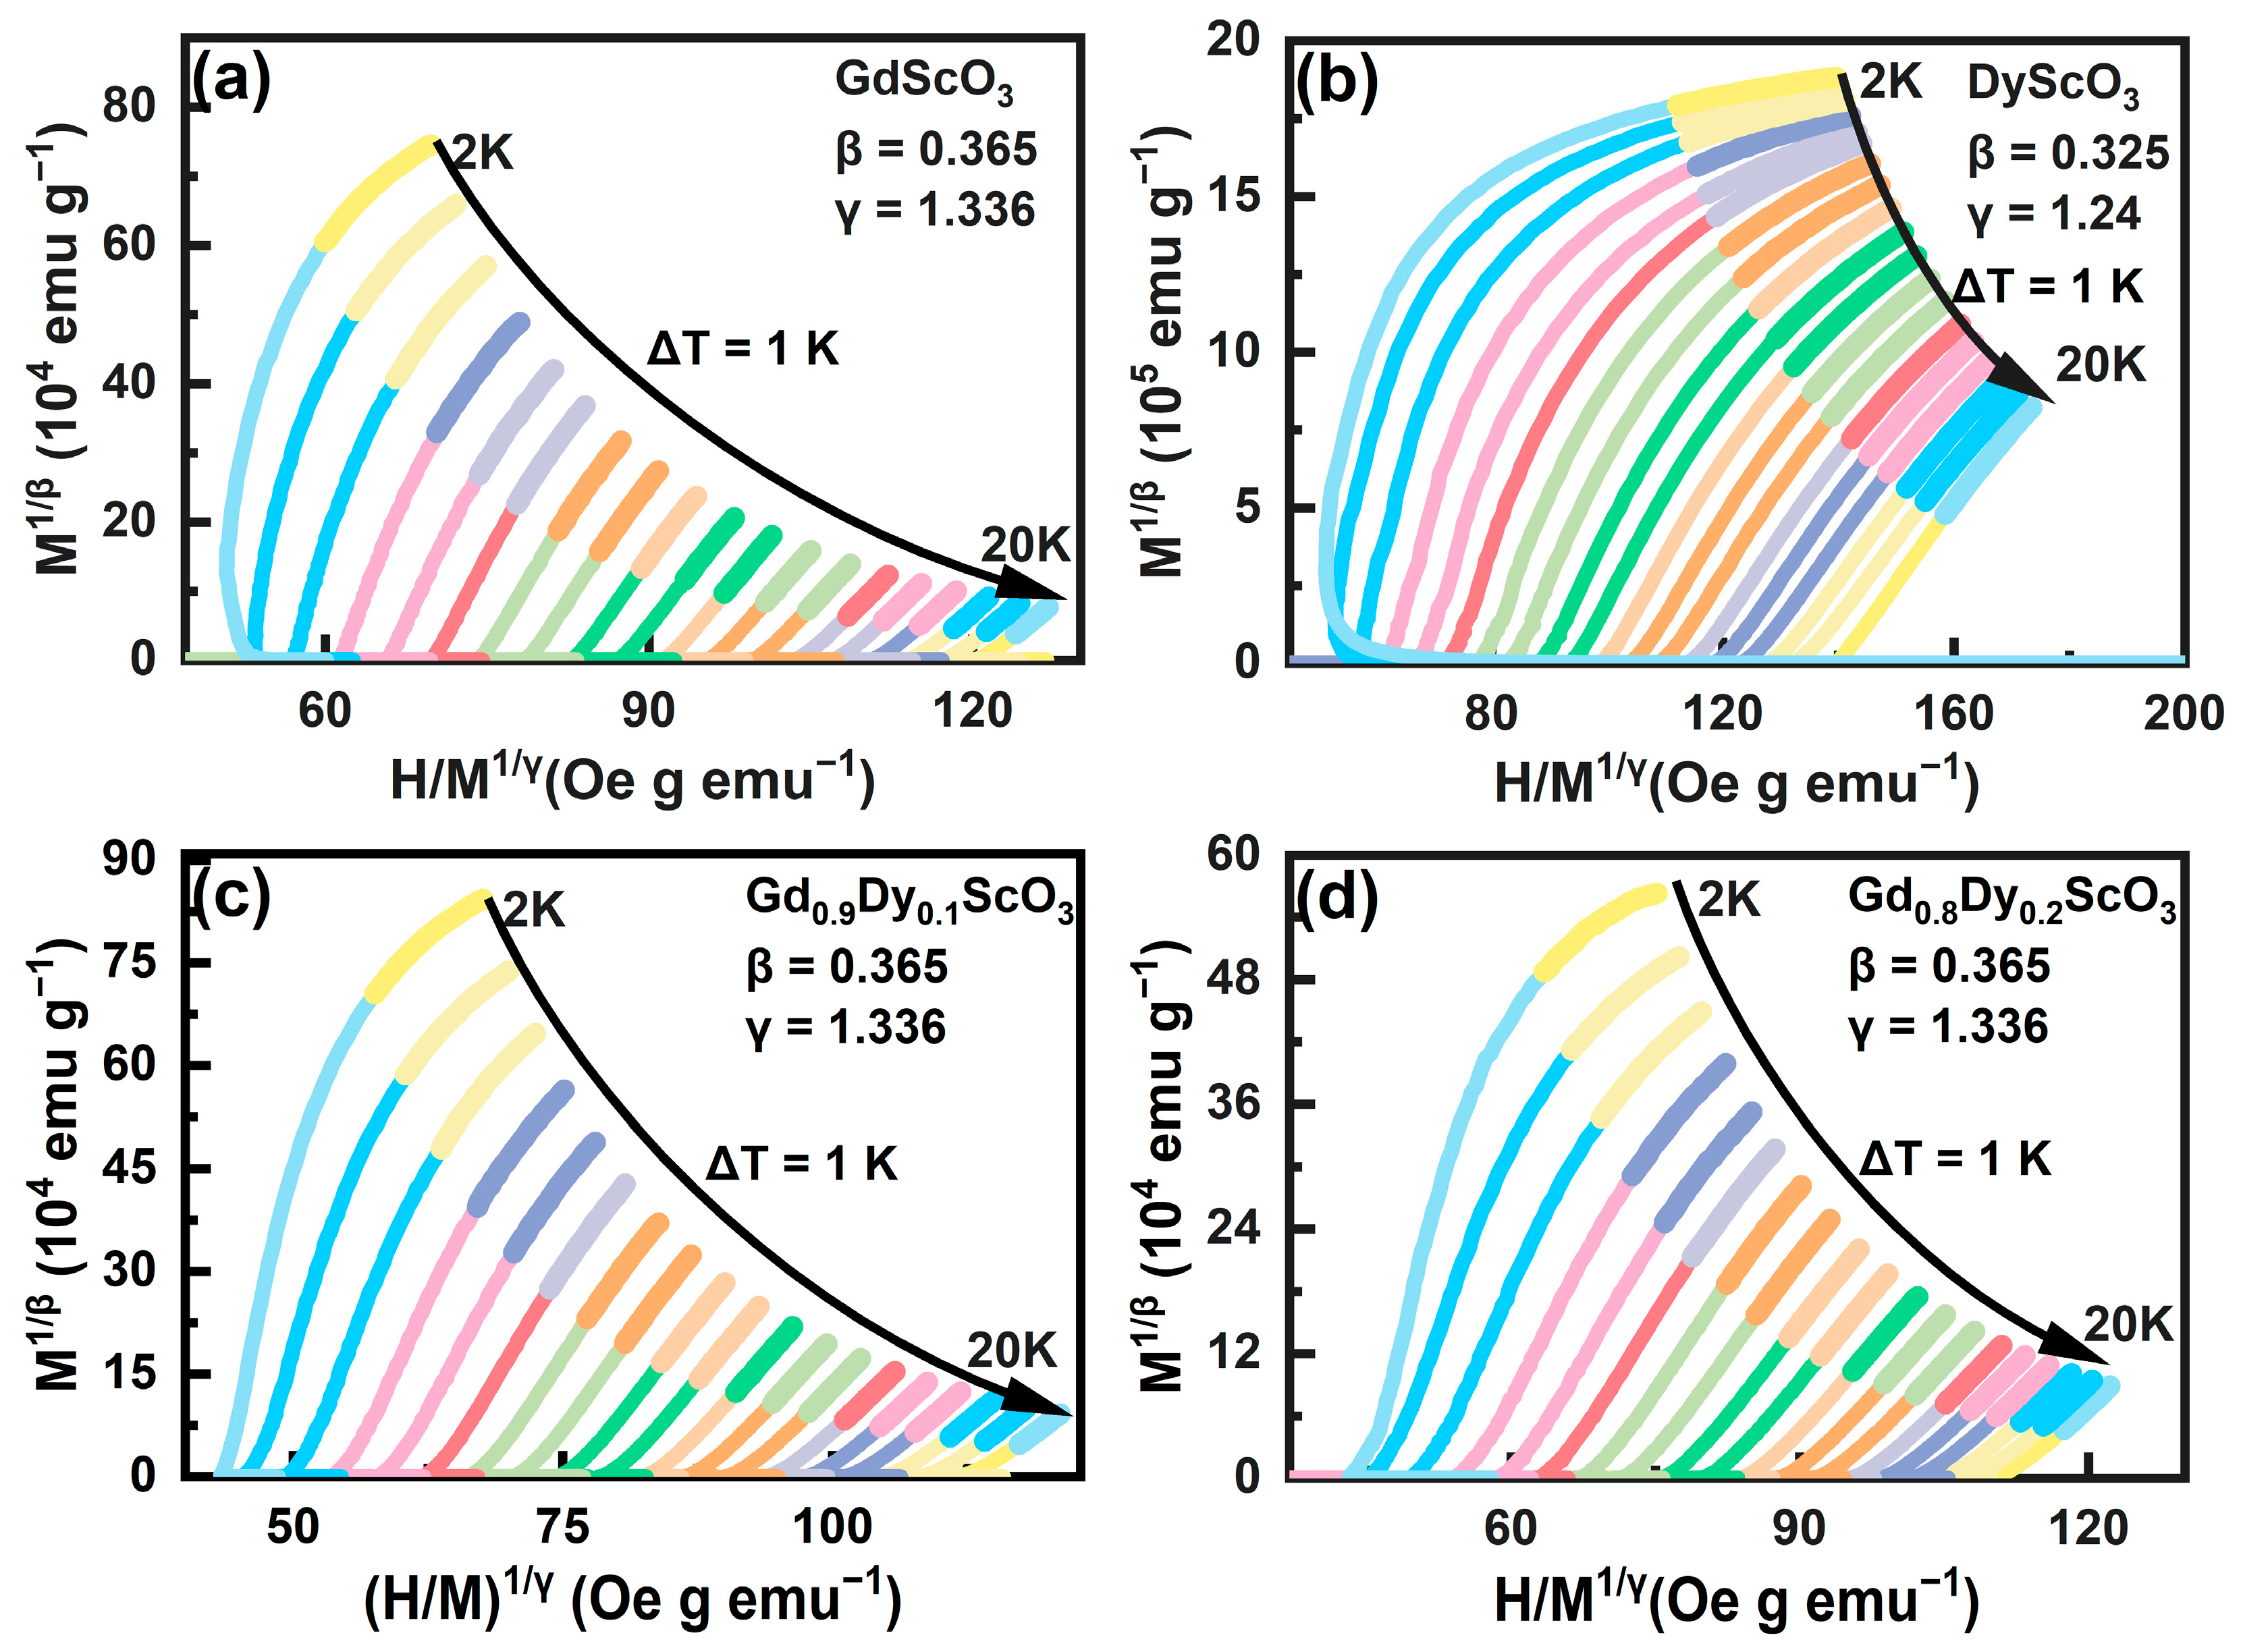
Critical behavior is typically analyzed by fitting the calculated critical parameters derived from the Arrott–Noakes equation [
20]:
Here,
a and
b are treated as constants, while
β and
γ represent the critical behavior parameters. In this analysis, we select critical parameters from various theoretical models to construct the Arrott diagram. The conventional theoretical models include the mean field theory model (
β = 0.5,
γ = 1), three-phase mean field model (
β = 0.25,
γ = 1), 3D-Ising model (
β = 0.325,
γ = 1.24), and 3D-Heisenberg model (
β = 0.365,
γ = 1.336) [
12,
21]. The criterion for identifying appropriate critical parameters is linear parallelism at high fields (i.e., the end area of the curves). For the four samples analyzed in this study, the results are presented in
Figure 7. Among them,
Figure 7a–c show fitting results corresponding to the 3D-Heisenberg model, while
Figure 7d present the fitting results corresponding to the 3D-Ising model. However, from the figure it can be seen that the curves at the ends are not completely parallel, indicating that the samples do not fully conform to the proposed theoretical models; therefore, the critical parameters require further refinement. However, due to the lack of data below 2 K, further refinement of critical parameters, as performed in ref. [
8], could not be carried out. Nevertheless, the 3D-Heisenberg model reveals the existence of short-range interactions in the system, indicating that the doping of a small amount of Dy
3+ ions weakened the long-range order and introduced local magnetism.
Magnetocaloric effects were studied based on the isothermal magnetization curves. Magnetic entropy change can be calculated according to Maxwell’s equation [
22]:
The specific results are shown in
Figure 8. The point is the magnetic entropy change calculated by the actual measurec
M-
H results, and the line graph is the magnetic entropy change calculated by the
M-
H Brillouin model fitting.
Figure 8a shows the magnetic entropy change as function of temperature for the GdScO
3 sample. The magnetic entropy change increases with the increase in the magnetic field, and both reach the maximum value at the phase transition temperature. Under the action of a magnetic field of 50 kOe, the maximum magnetic entropy change (−Δ
) reaches 34.32 J/kg K.
Figure 8b shows the −Δ
curves of the DyScO
3 sample. Compared to GdScO
3, DyScO
3 shows a wider distribution of magnetic entropy change in the whole temperature range. The maximum magnetic entropy change of DyScO
3 under the magnetic field of 50 kOe is significantly lower than that of GdScO
3. This is mainly because the Gd
3+ ion possesses large spin states (
S = 7/2), low magnetic anisotropy, and weak spin–spin interactions, which facilitate larger magnetic entropy change [
23]. The results are shown in
Figure 8c and
Figure 8d, respectively. Specifically, the −Δ
of the sample doped with a Dy
3+ content of 0.1 is 36.03 J/kg K, while the −Δ
of the sample doped with a Dy
3+ content of 0.2 is 29.74 J/kg K. This result shows that the proportion of disordered states in the low-doped sample is low, and the magnetic moment arrangement of the system still has a certain order, which makes the disturbance more significant under a high field, thus releasing more magnetic entropy. In contrast, as the doping content further increases, the long-range antiferromagnetic network is completely destroyed, the arrangement of magnetic moments is more complex and random, and the disturbance efficiency of the external field to the magnetic moment is significantly reduced, resulting in a decrease in magnetic entropy change.
Table 2 lists the phase transition temperatures and −Δ
SM values for certain Gd- and Dy-based oxides for comparison. There exists a difference in −Δ
between polycrystalline and single-crystal samples. In a sample with the same chemical composition, e.g., DyScO
3, the MCE of the polycrystalline form is smaller than that of the single-crystal form [
6]. This phenomenon is also observed in other materials. On the one hand, some single crystals such as DyScO
3 [
6] and GdVO
4 [
24] show anisotropic MCEs depending on the orientation of the applied magnetic field. In a polycrystalline material with the same chemical composition, the crystal orientations randomly distribute across the sample, and thus, MCEs under a certain magnetic field can be roughly treated as an average result of all crystals; therefore, they are smaller than that of single crystals. It is the case that the MCE of the polycrystalline DyScO
3 in this work is smaller than that in Ref. [
6]. On the other hand, there are larger amounts of grain boundaries and interfaces in polycrystalline than in single-crystal samples, where disorder could exist or magnetic interaction could occur. As reported for GdVO
4 nanoparticles by M. Ruan et al. [
25], a certain amount of surface disorder of nanoparticles could be helpful for increasing MCEs, while an aggregation effect of a small gain size is responsible for the decrease in MCEs. In this work, a small amount Dy doping in GdScO
3 slightly improved the MCE of the sample, although its −Δ
was lower than that of GdPO
4 [
26], GdVO
4 [
24], and GdFeO
3 [
27]; the compounds studied in this work still exhibit a moderate magnetocaloric effect, showing their potential for low-temperature magnetic refrigeration.


