
The Prediction of High-Temperature Bulging Deformations in Non-Uniform Welded Tubes and Its Application to Complex-Shaped Tubular Parts

Abstract
1. Introduction
2. Experiments
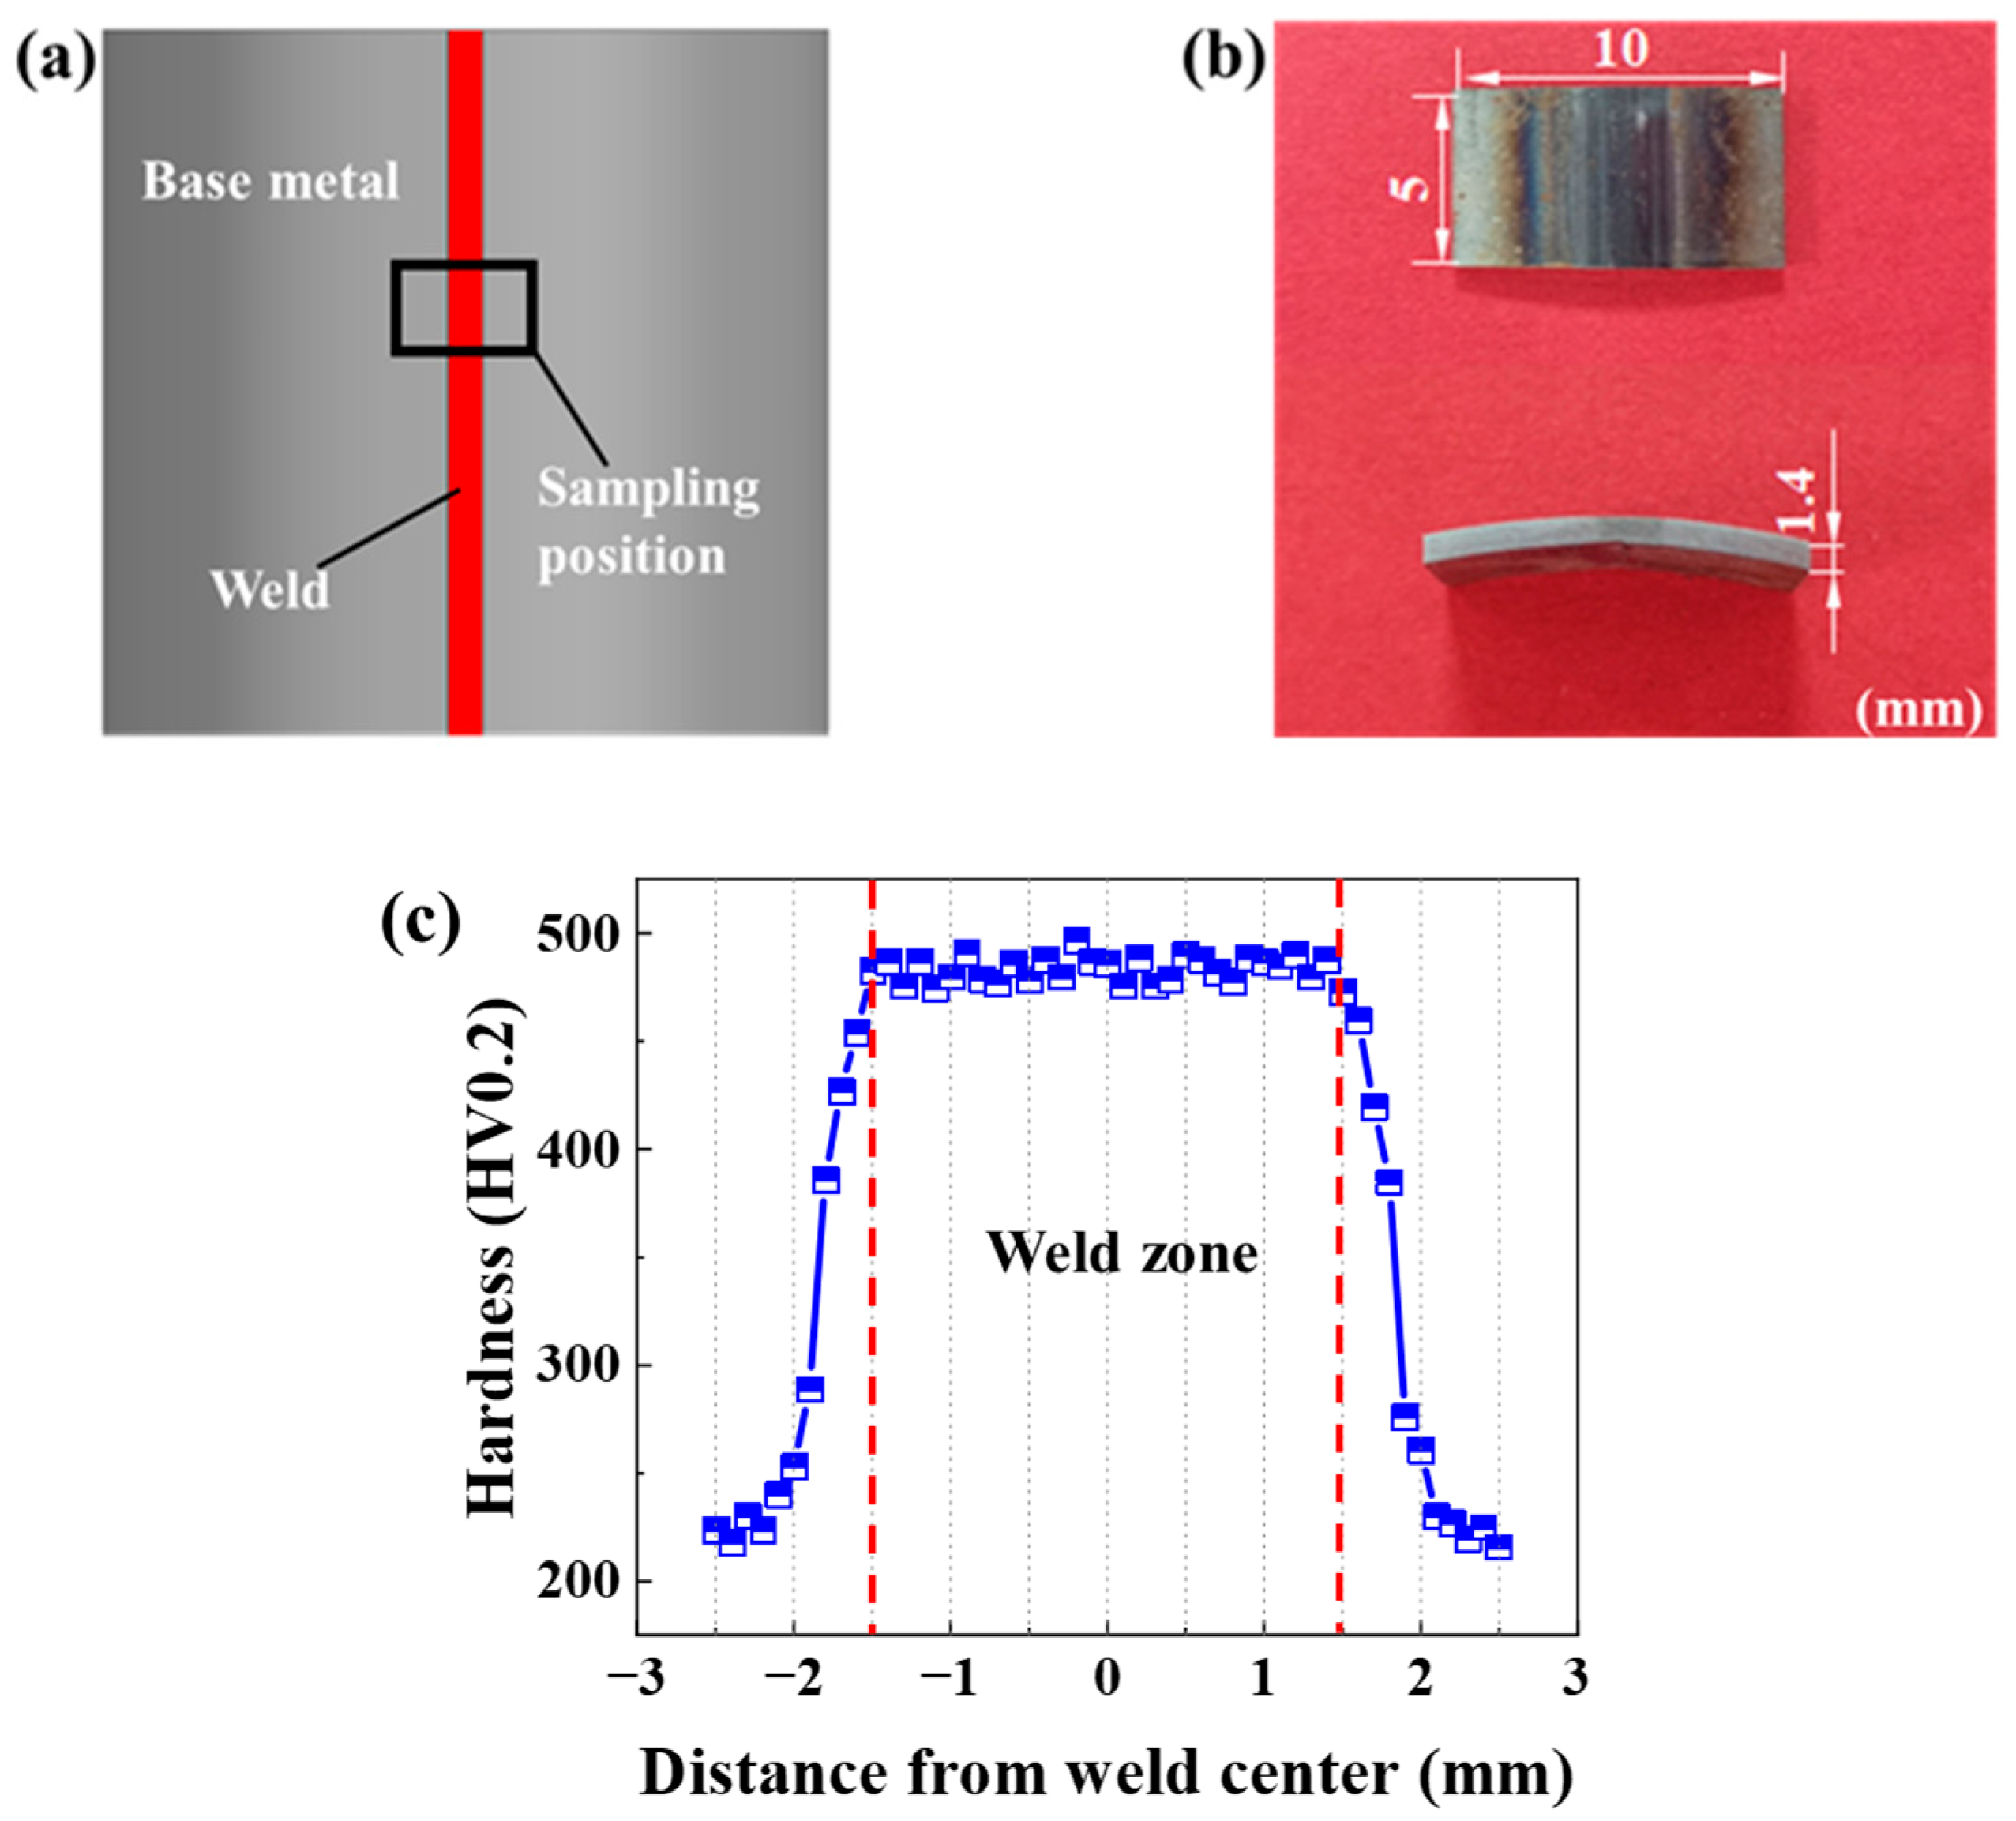
2.1. The Materials
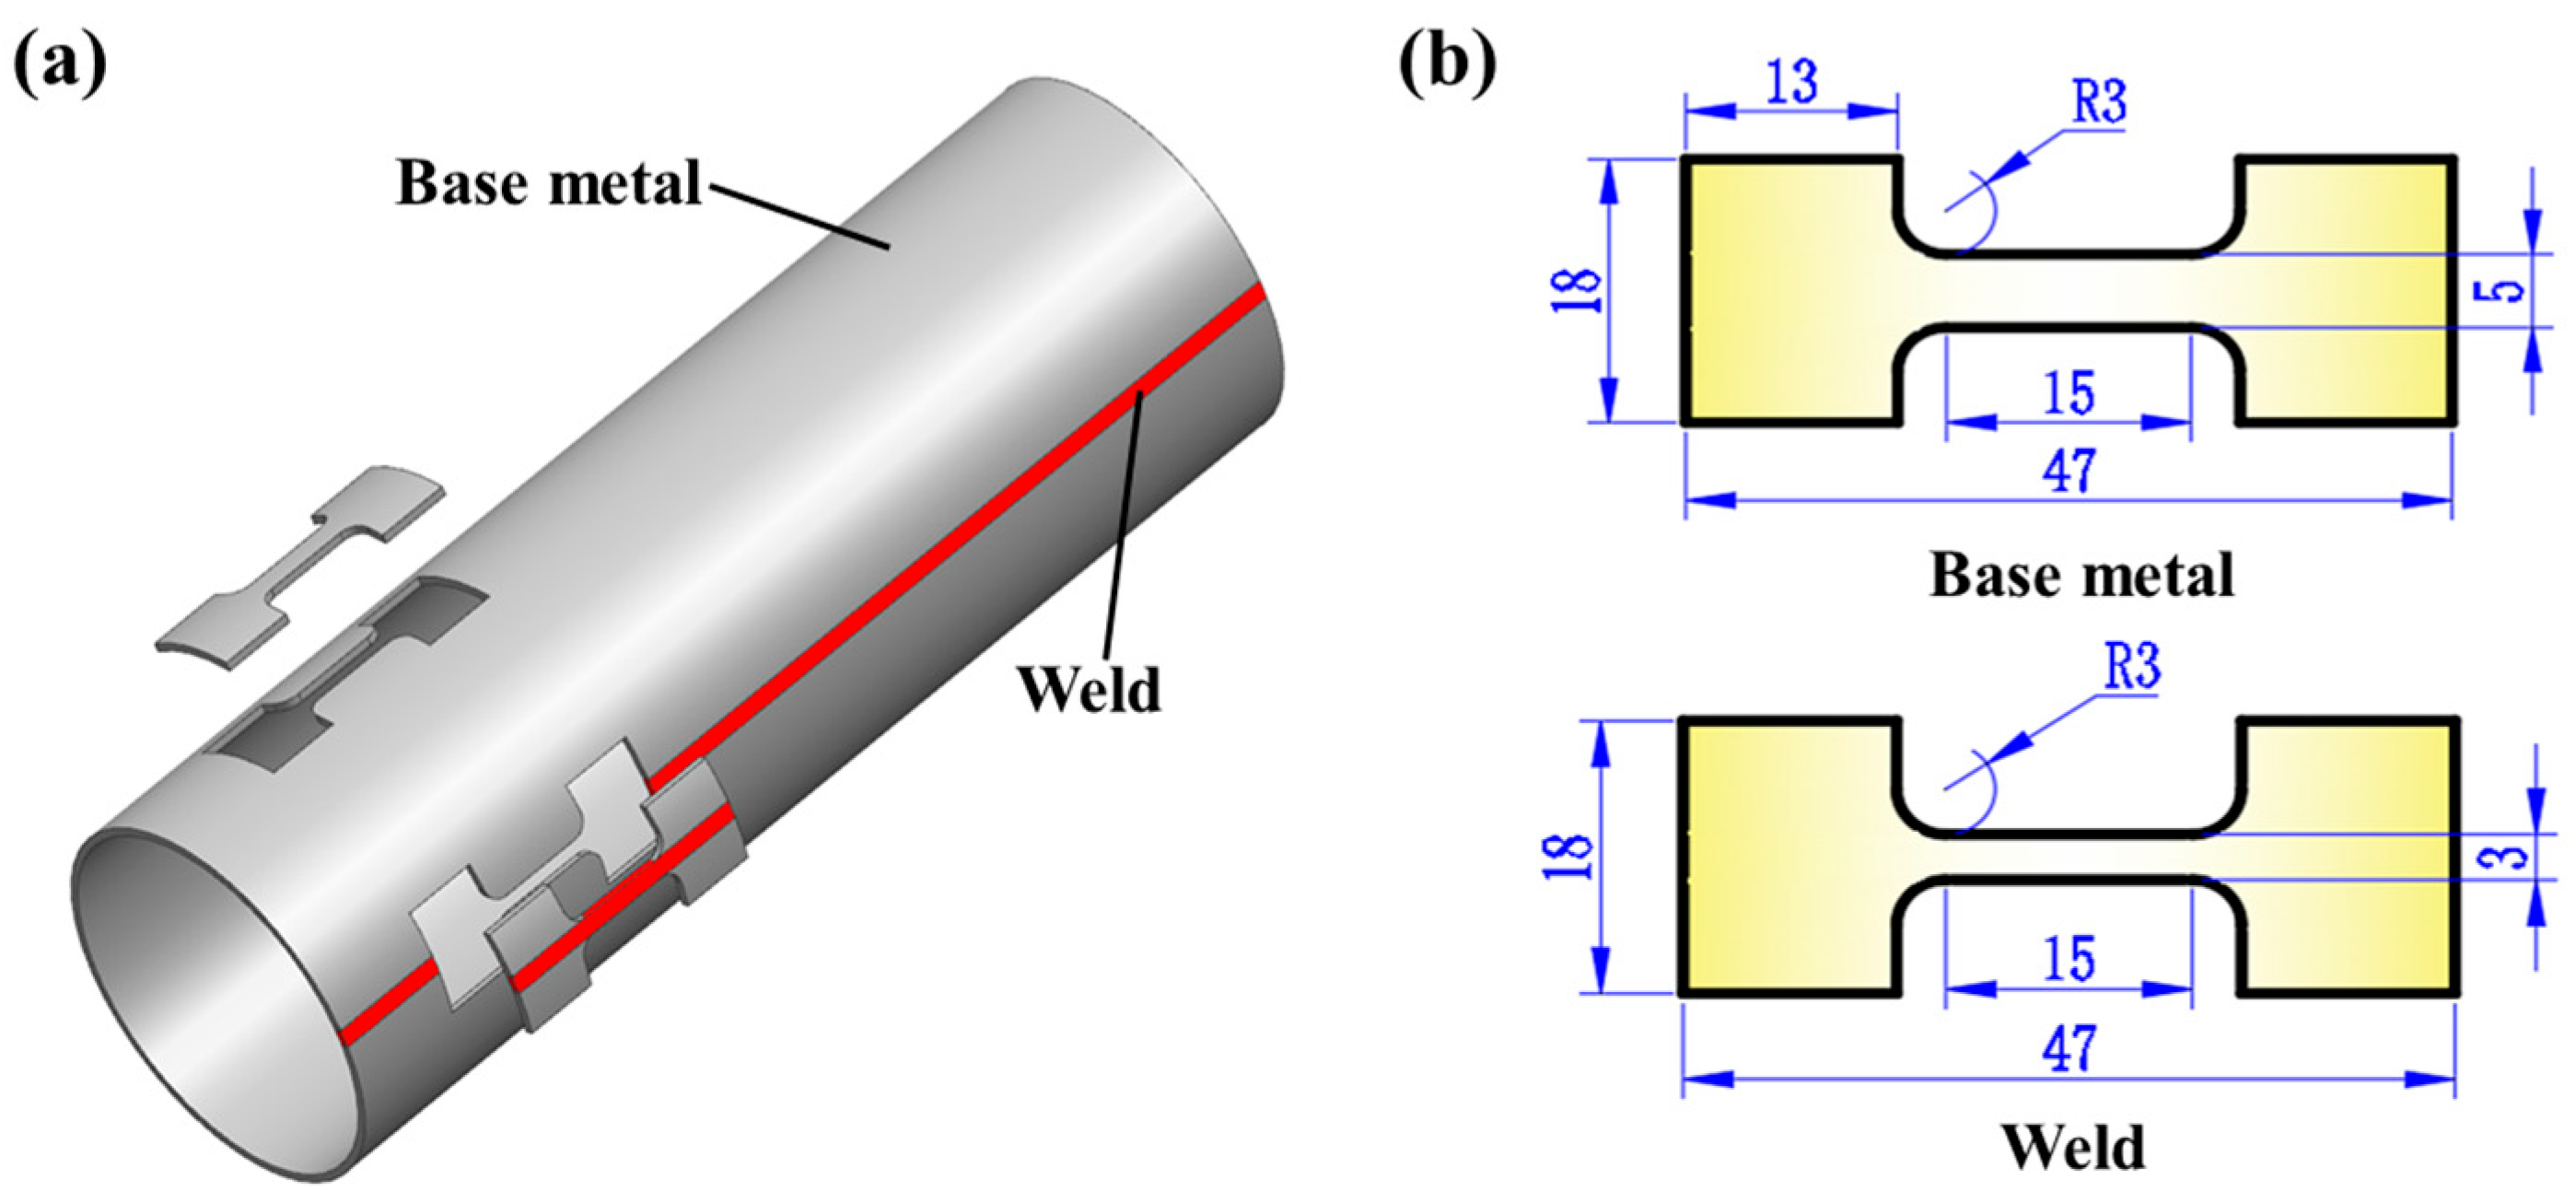
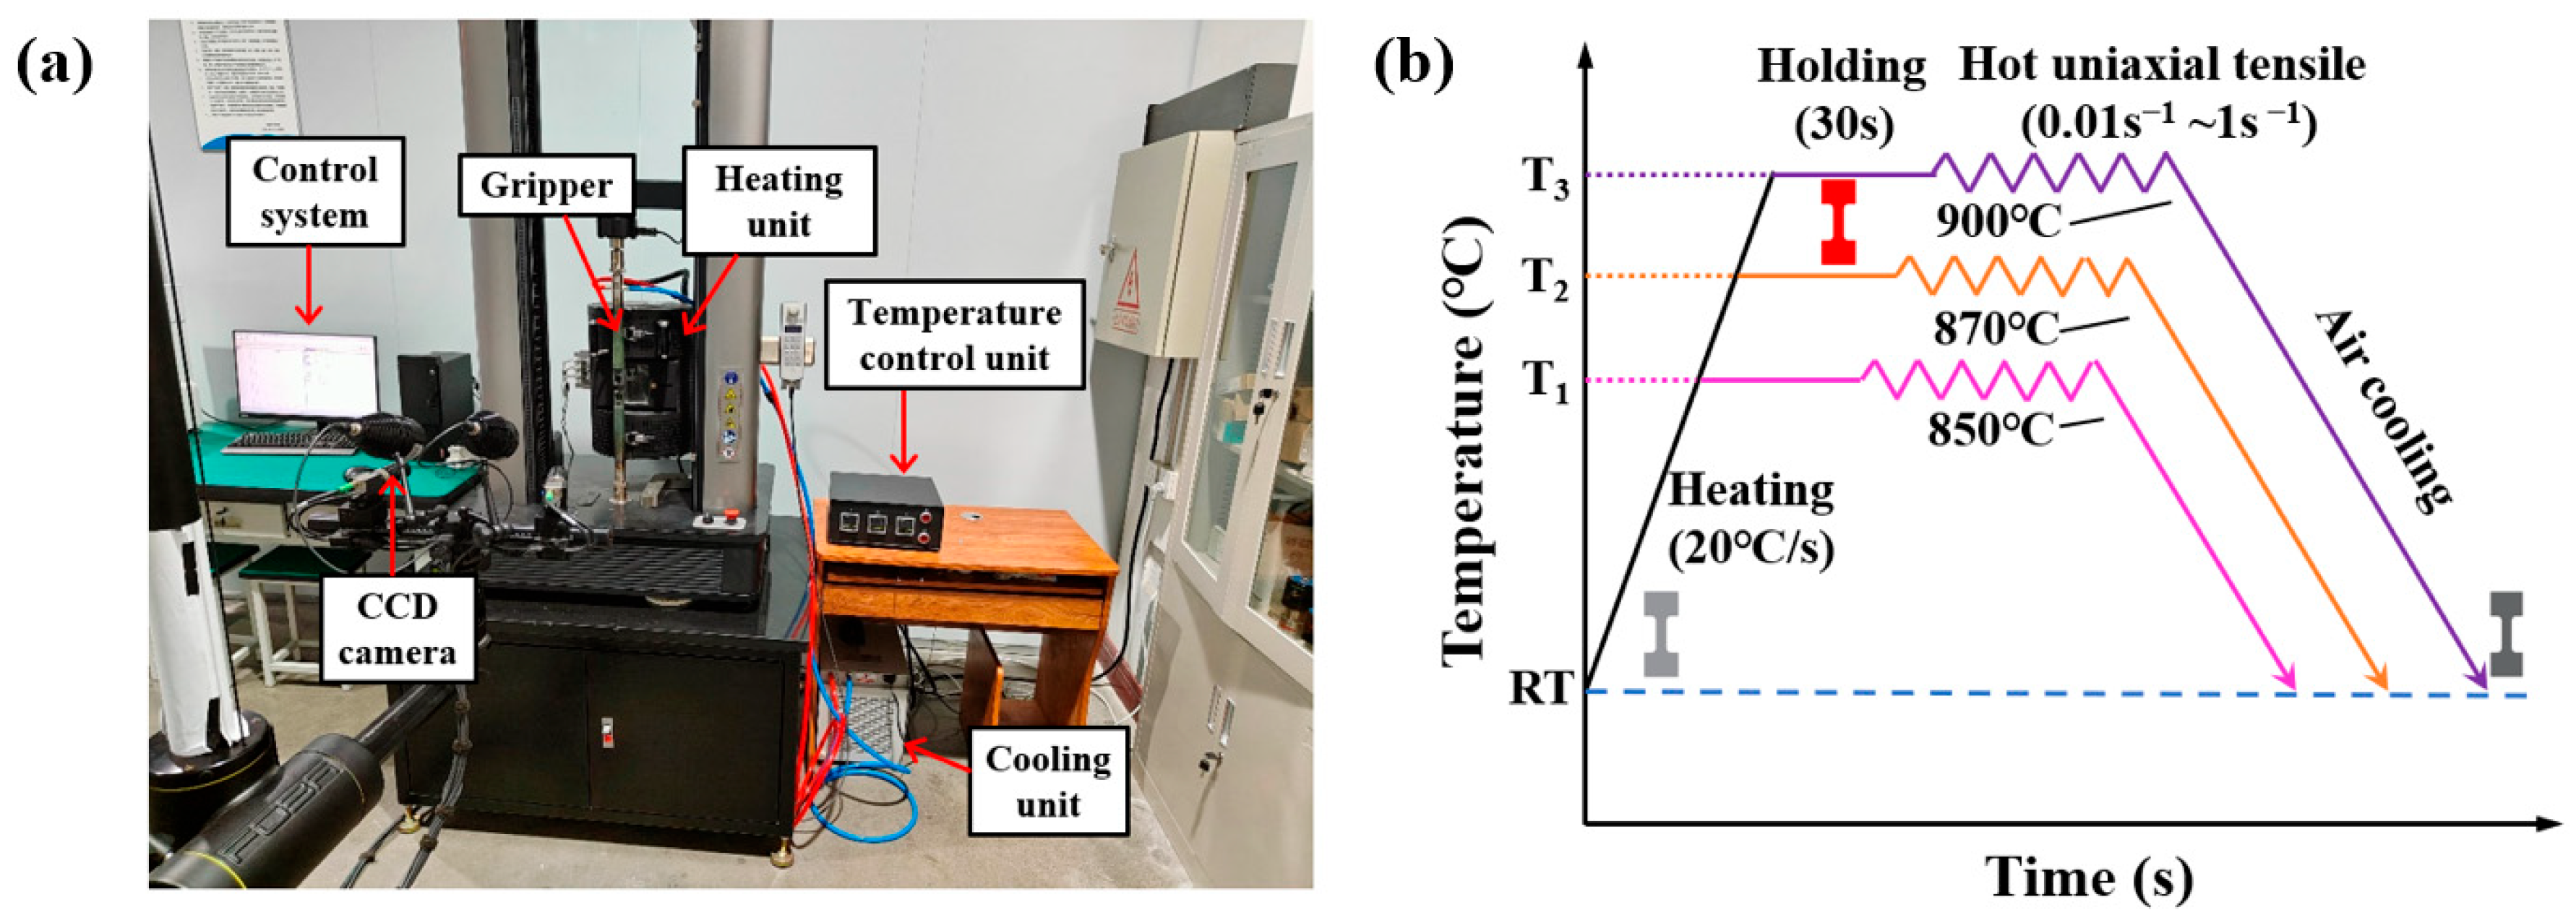
2.2. Hot Uniaxial Tensile Tests
3. Results and Discussion
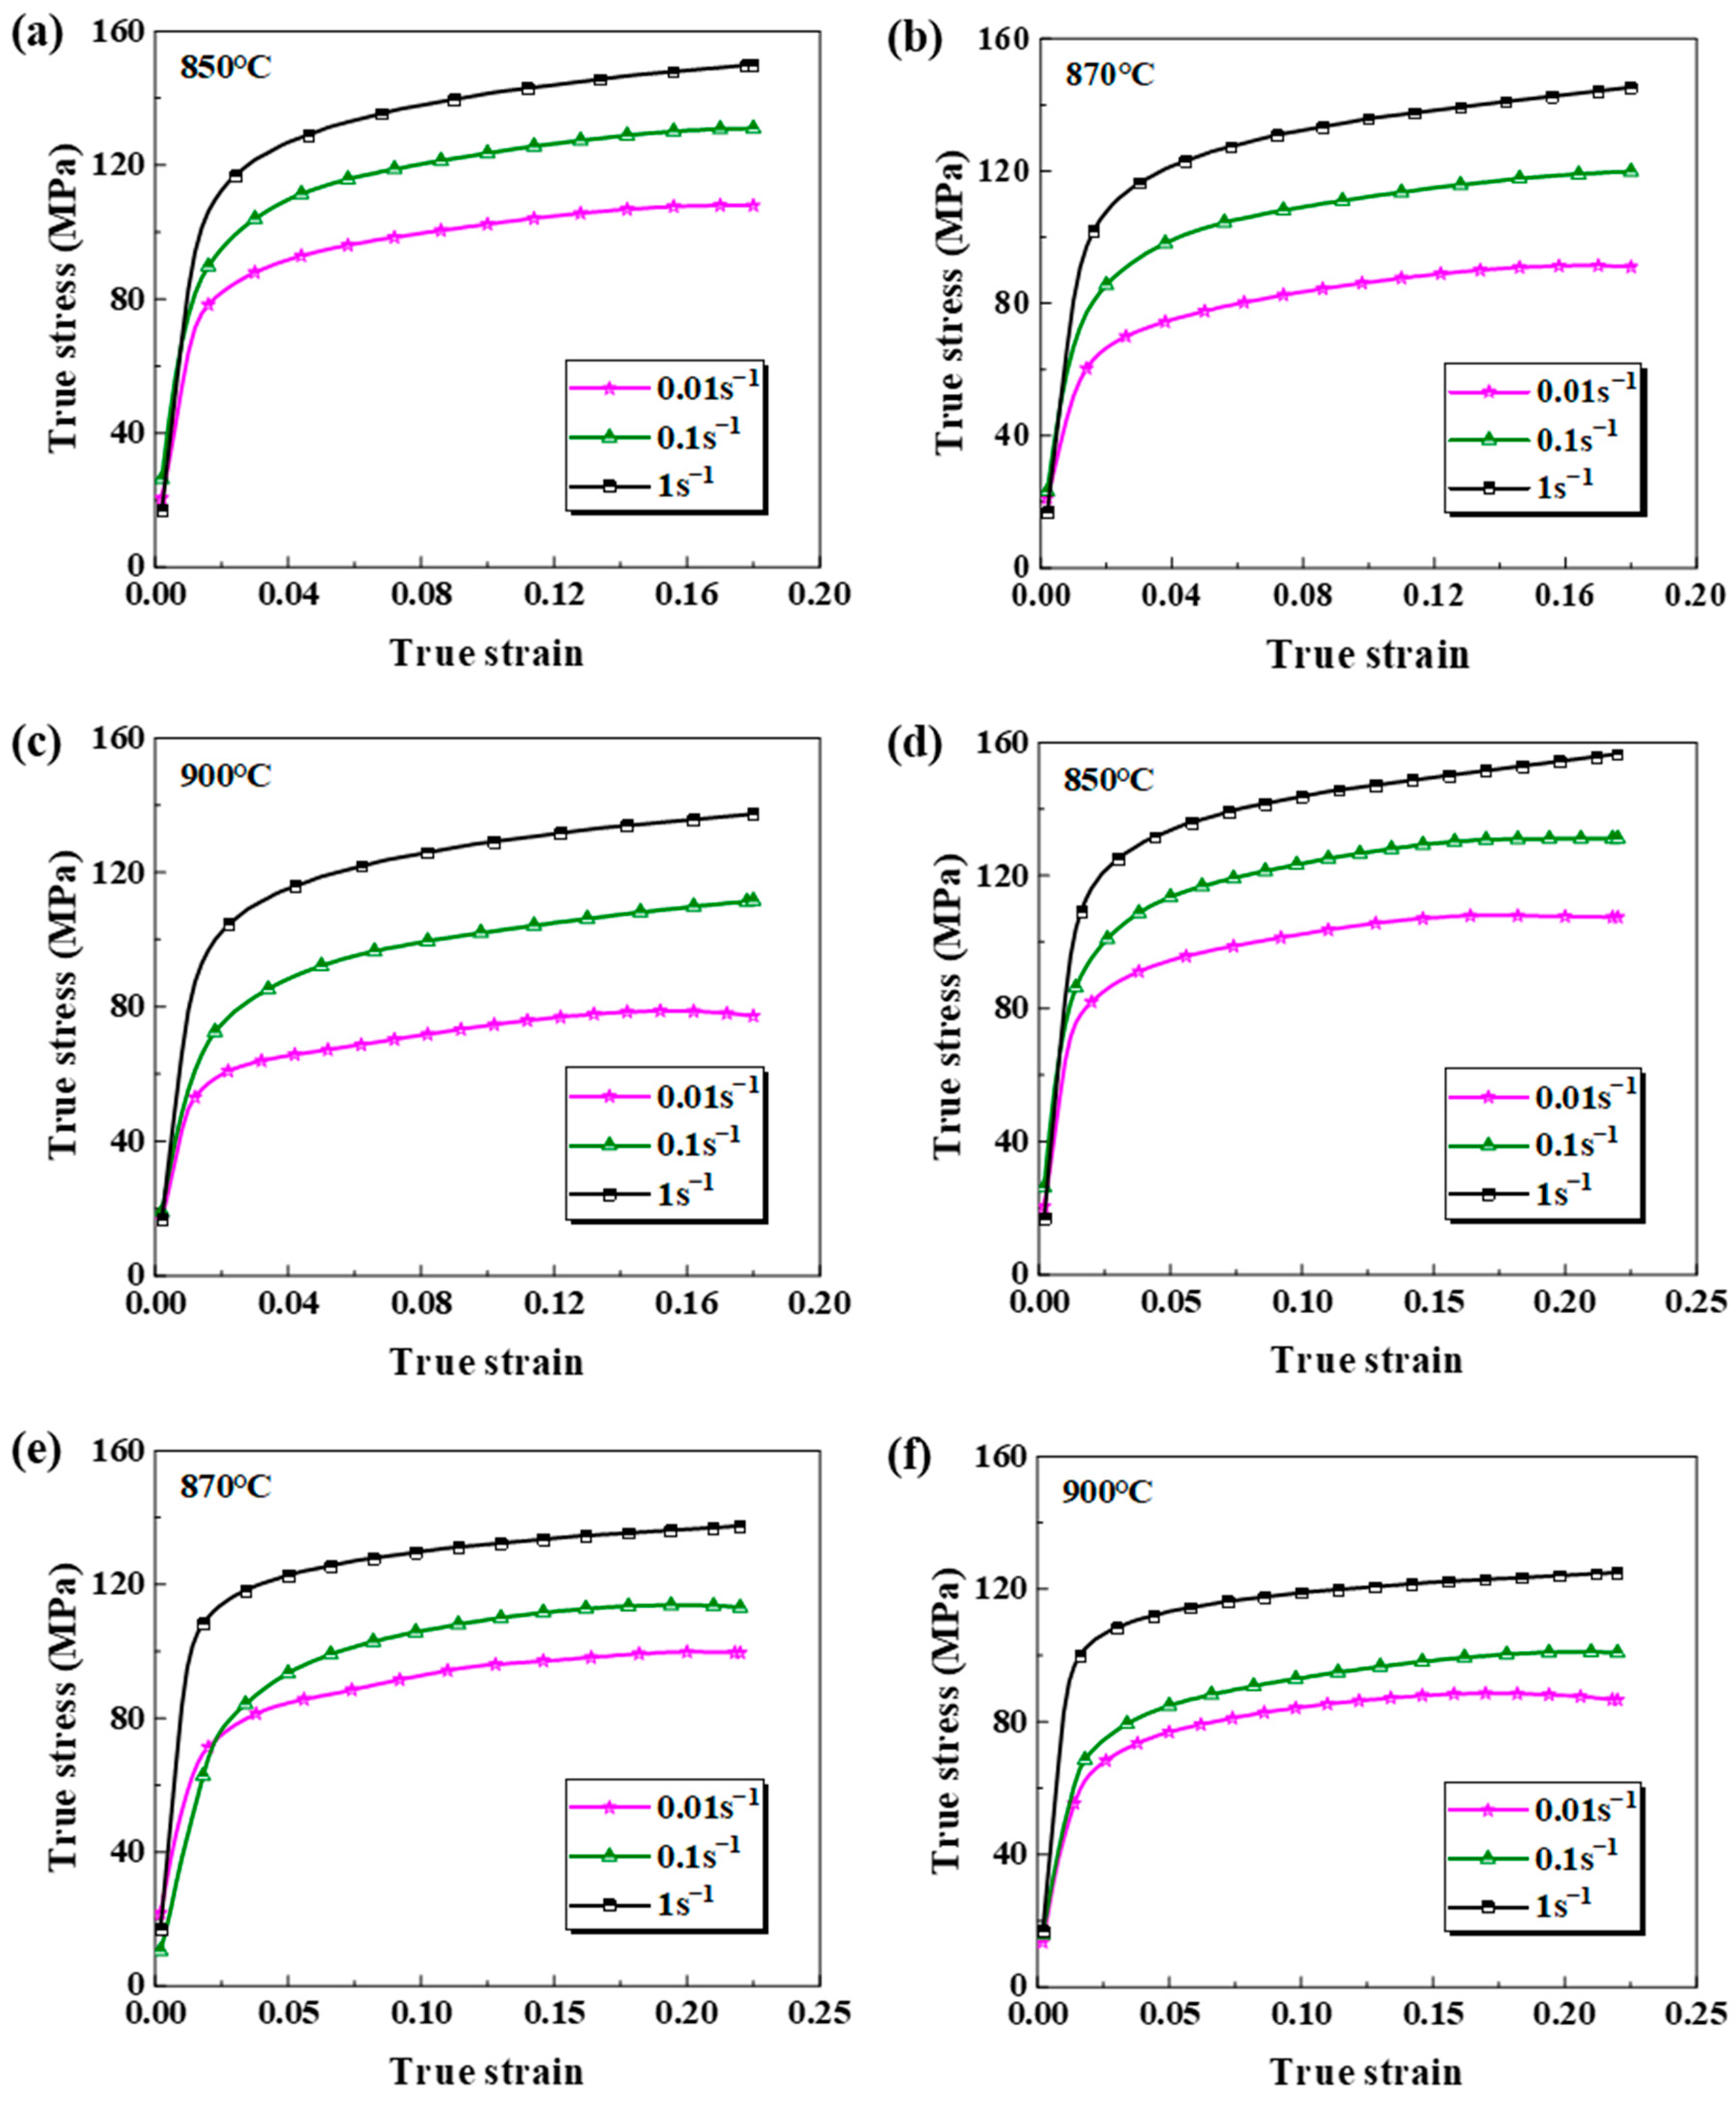
3.1. The Flow Behavior of the Base Metal and the Weld at Elevated Temperature
3.2. The Johnson–Cook Constitutive Model
3.3. The Development of the Modified Johnson–Cook Constitutive Model
4. The Application of the Developed Constitutive Model for Complex Tubular Parts
4.1. Establishing the Experiment and the Simulation Model
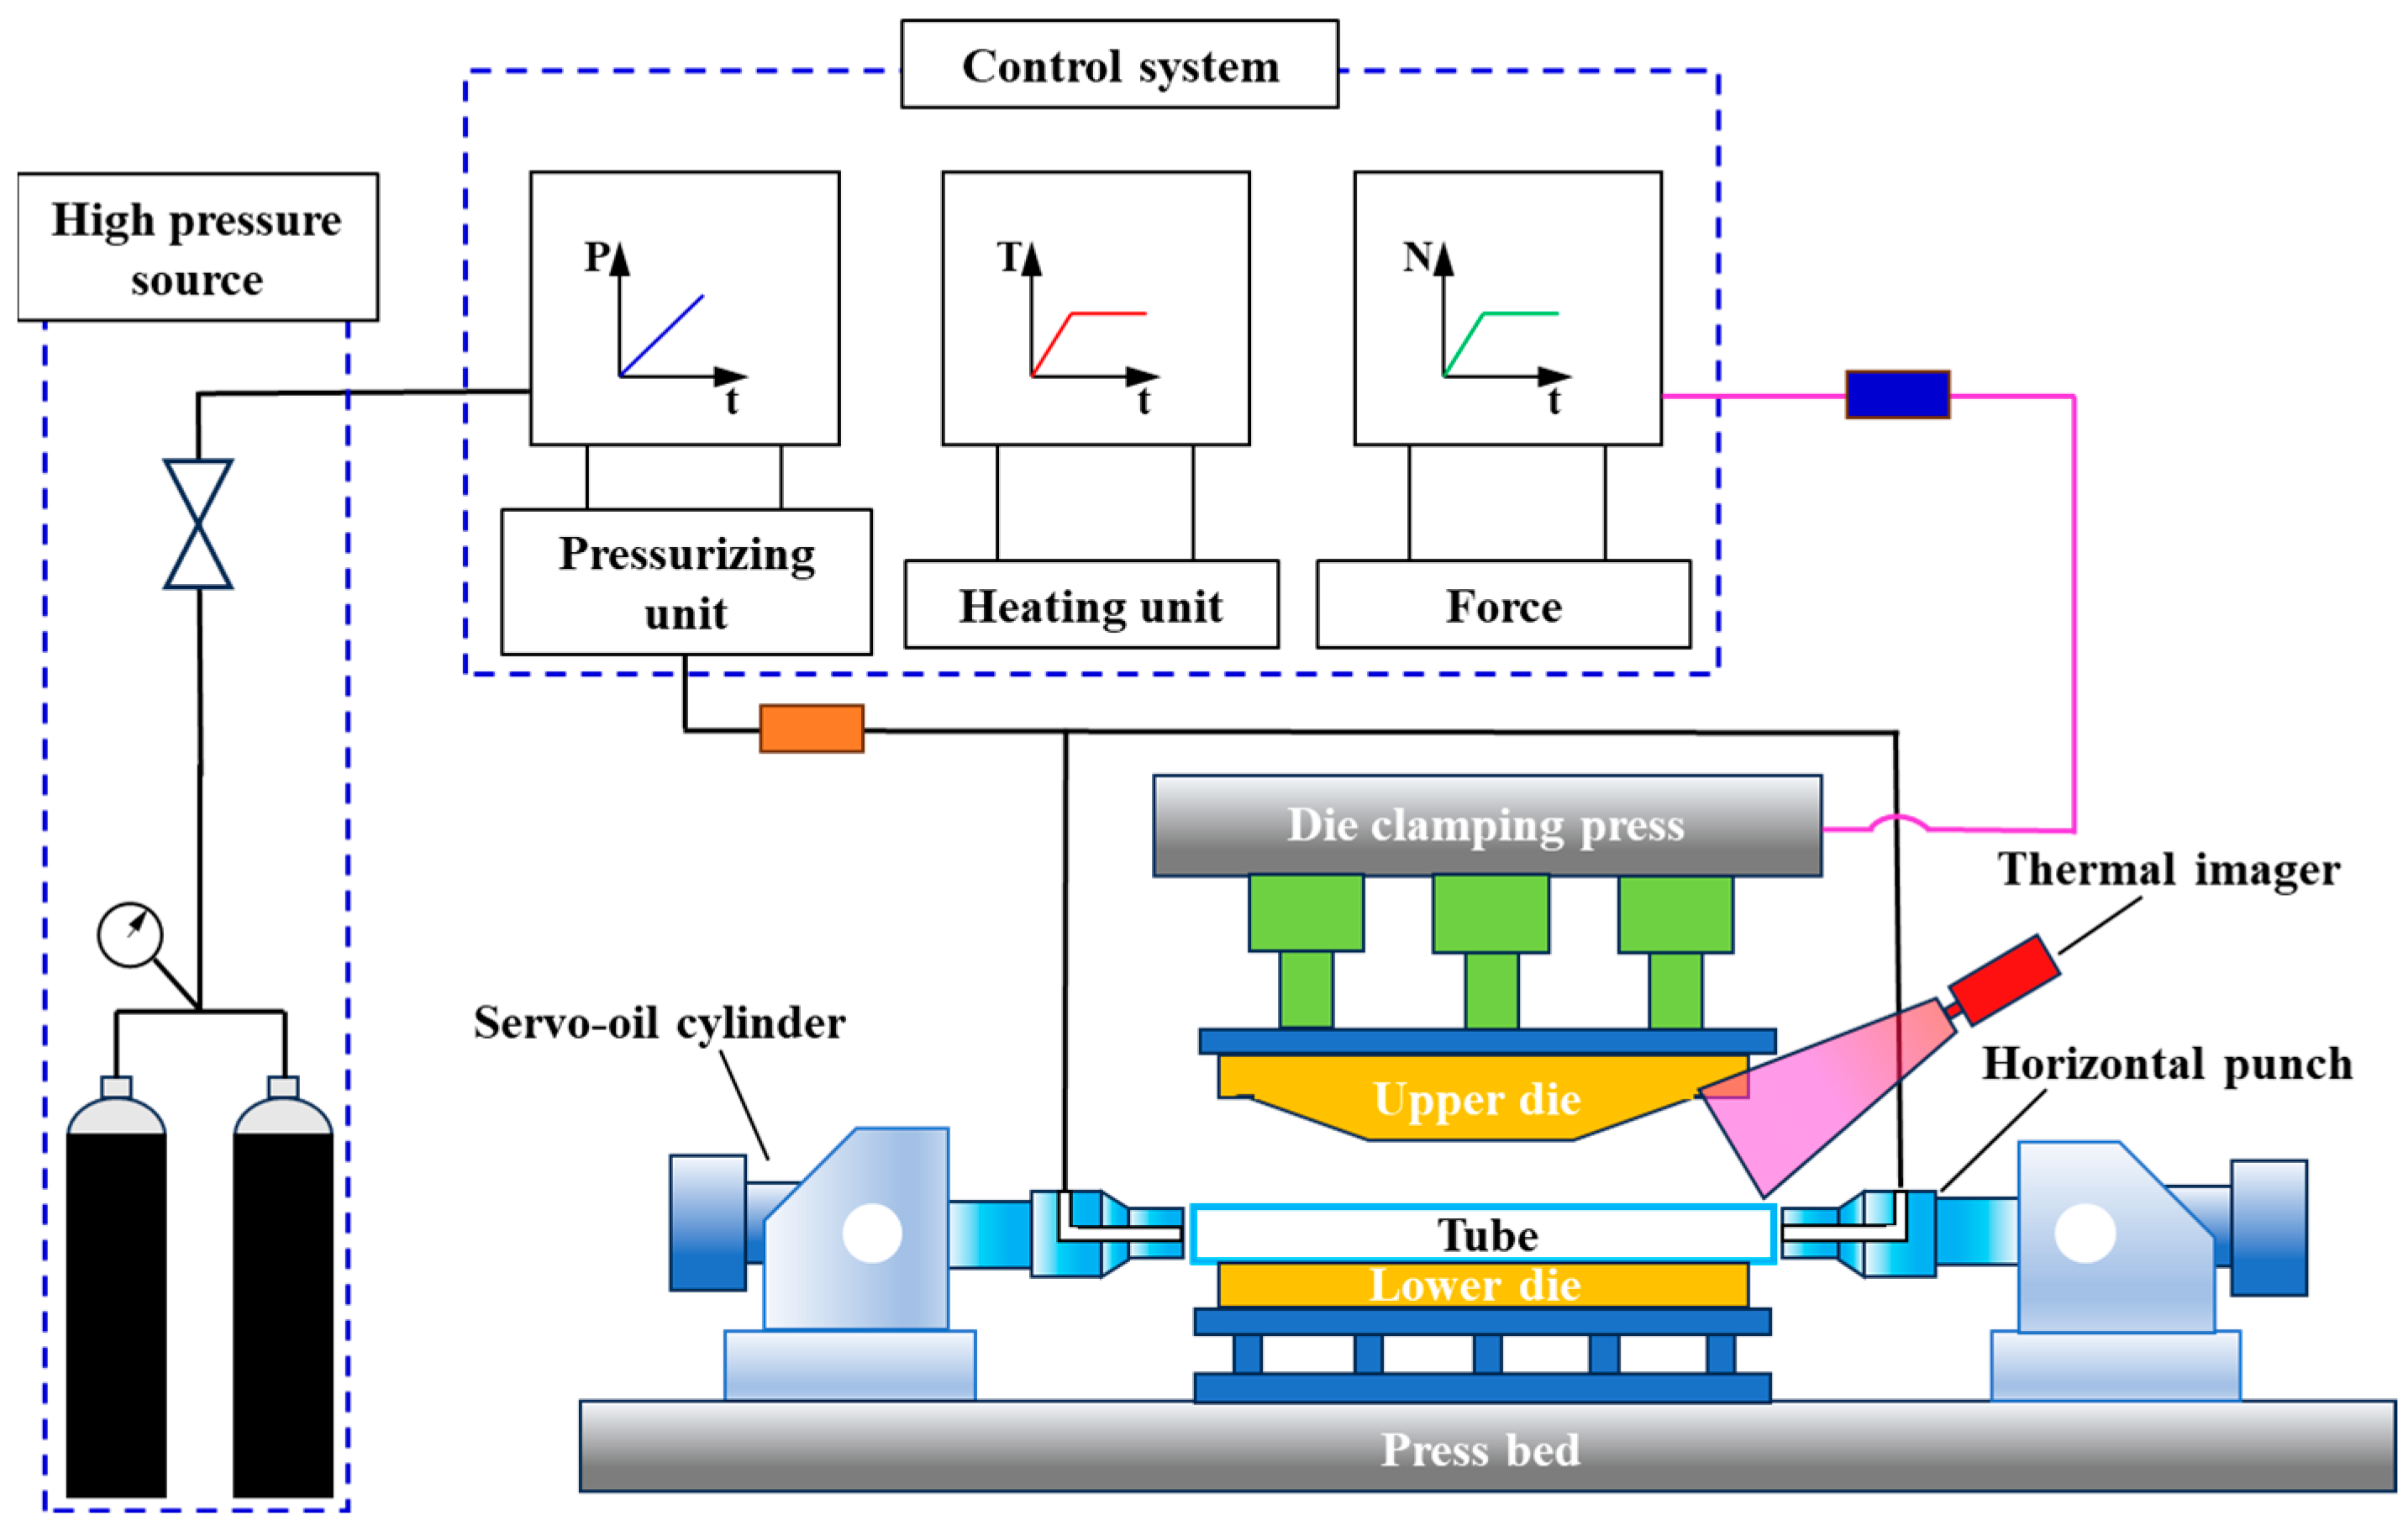
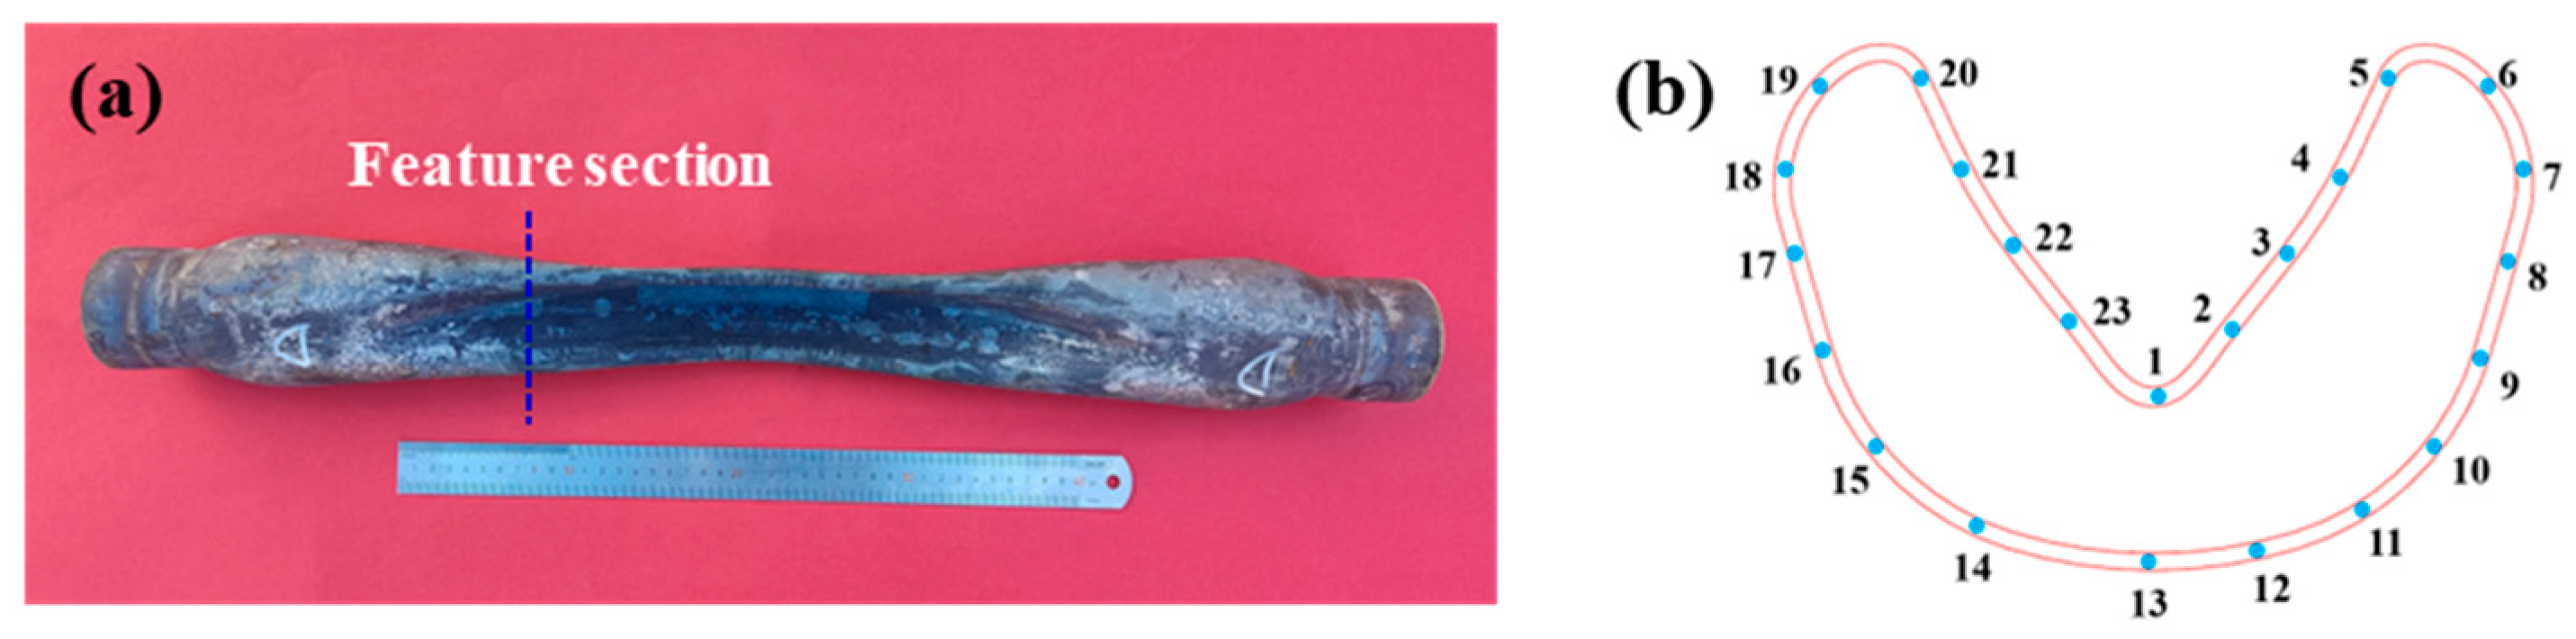
4.1.1. Hot Gas Bulging of Complex-Shaped Tubular Parts
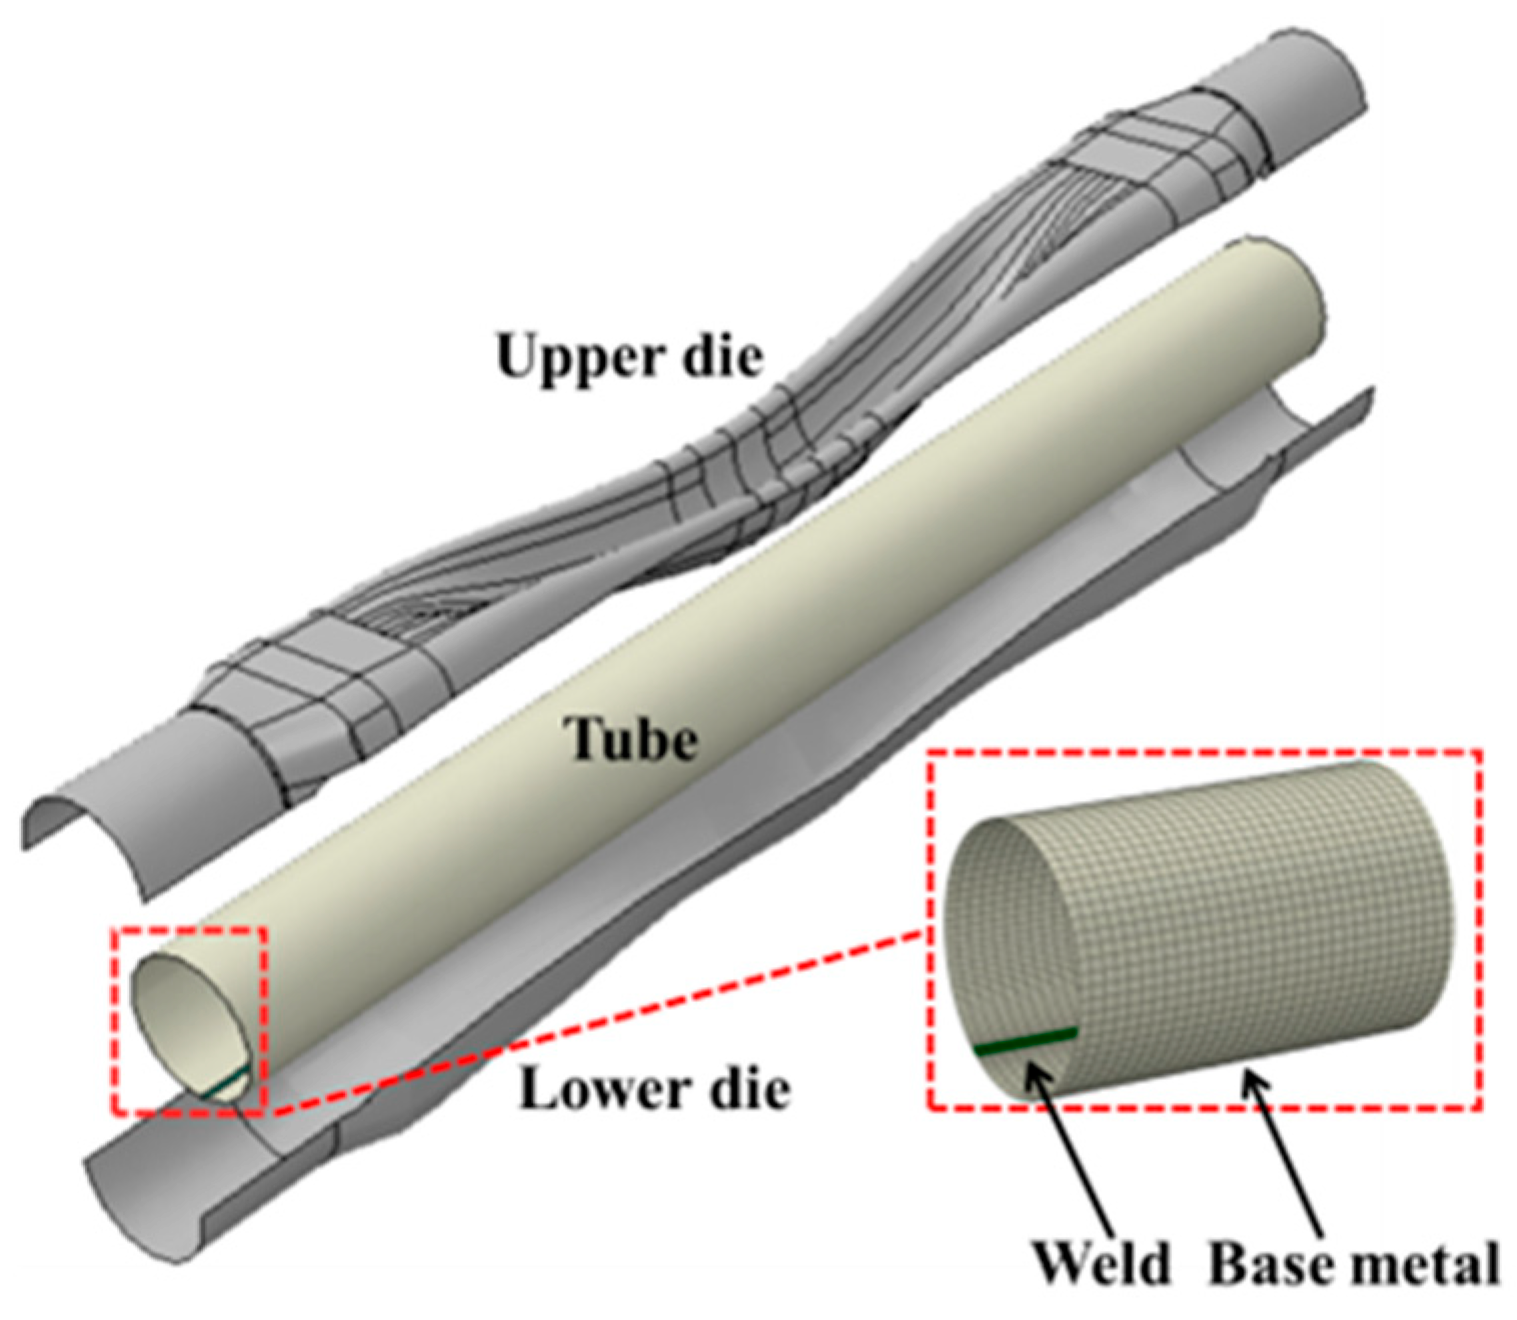
4.1.2. The Finite Element Analysis
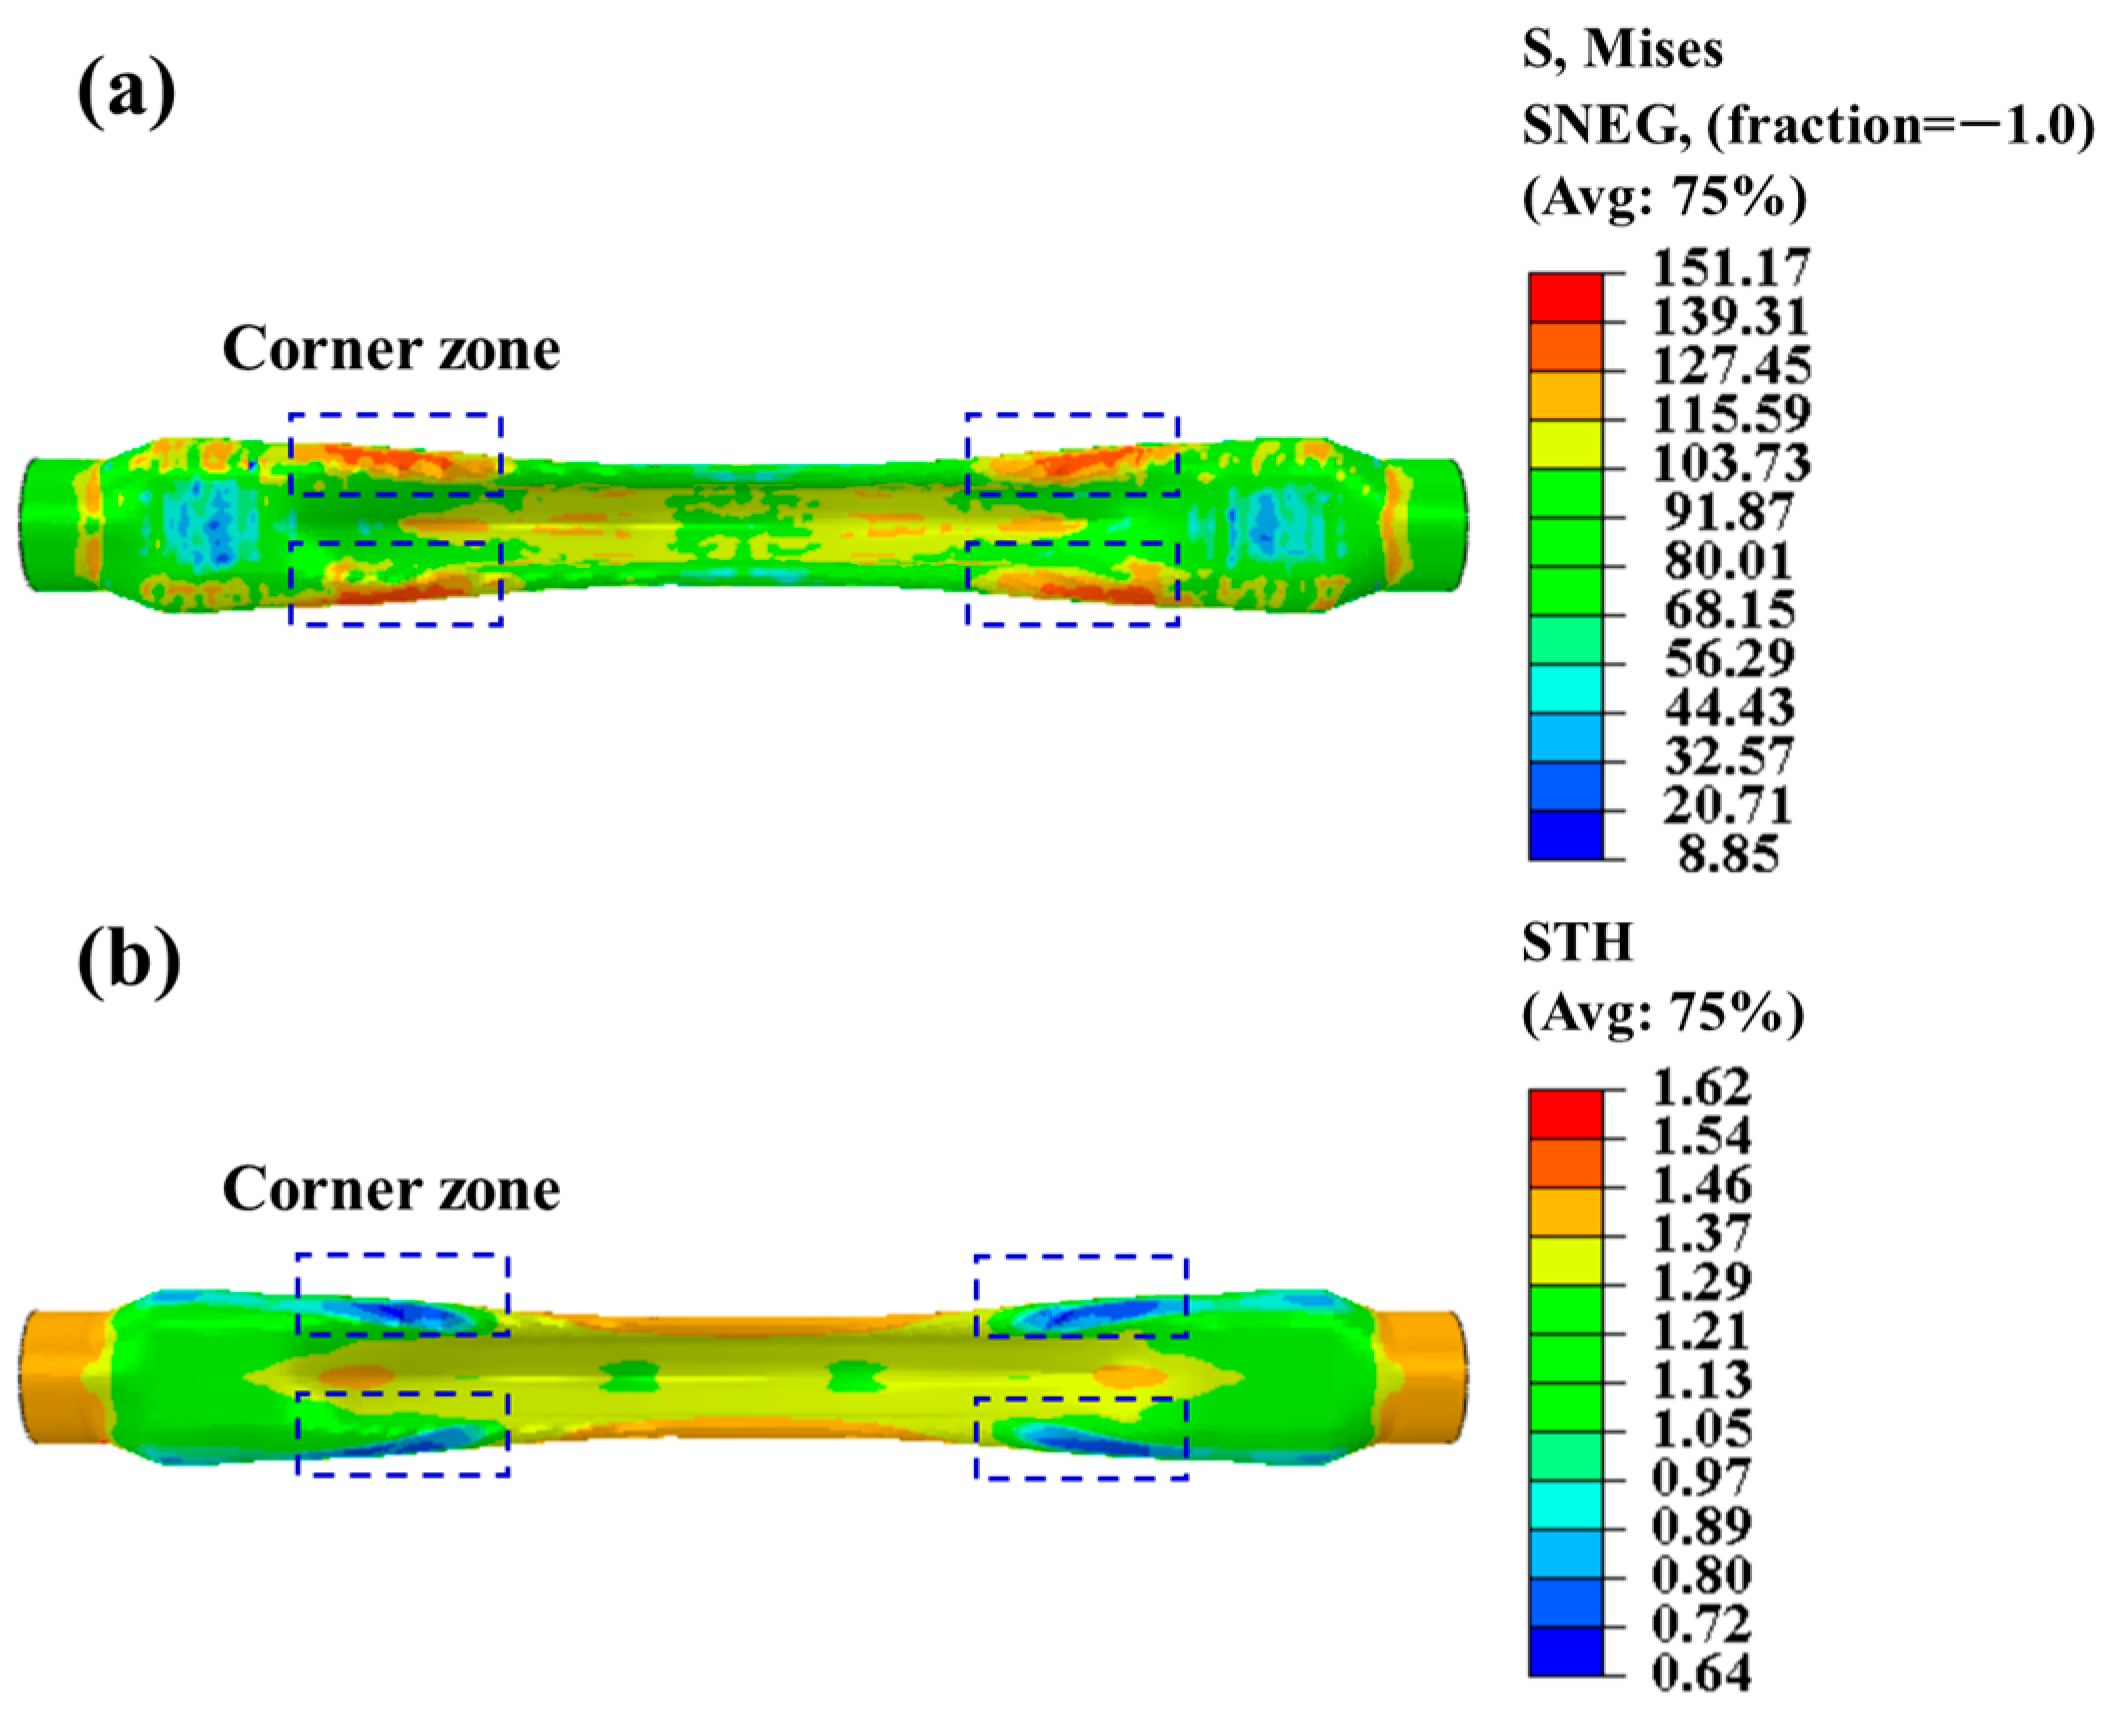
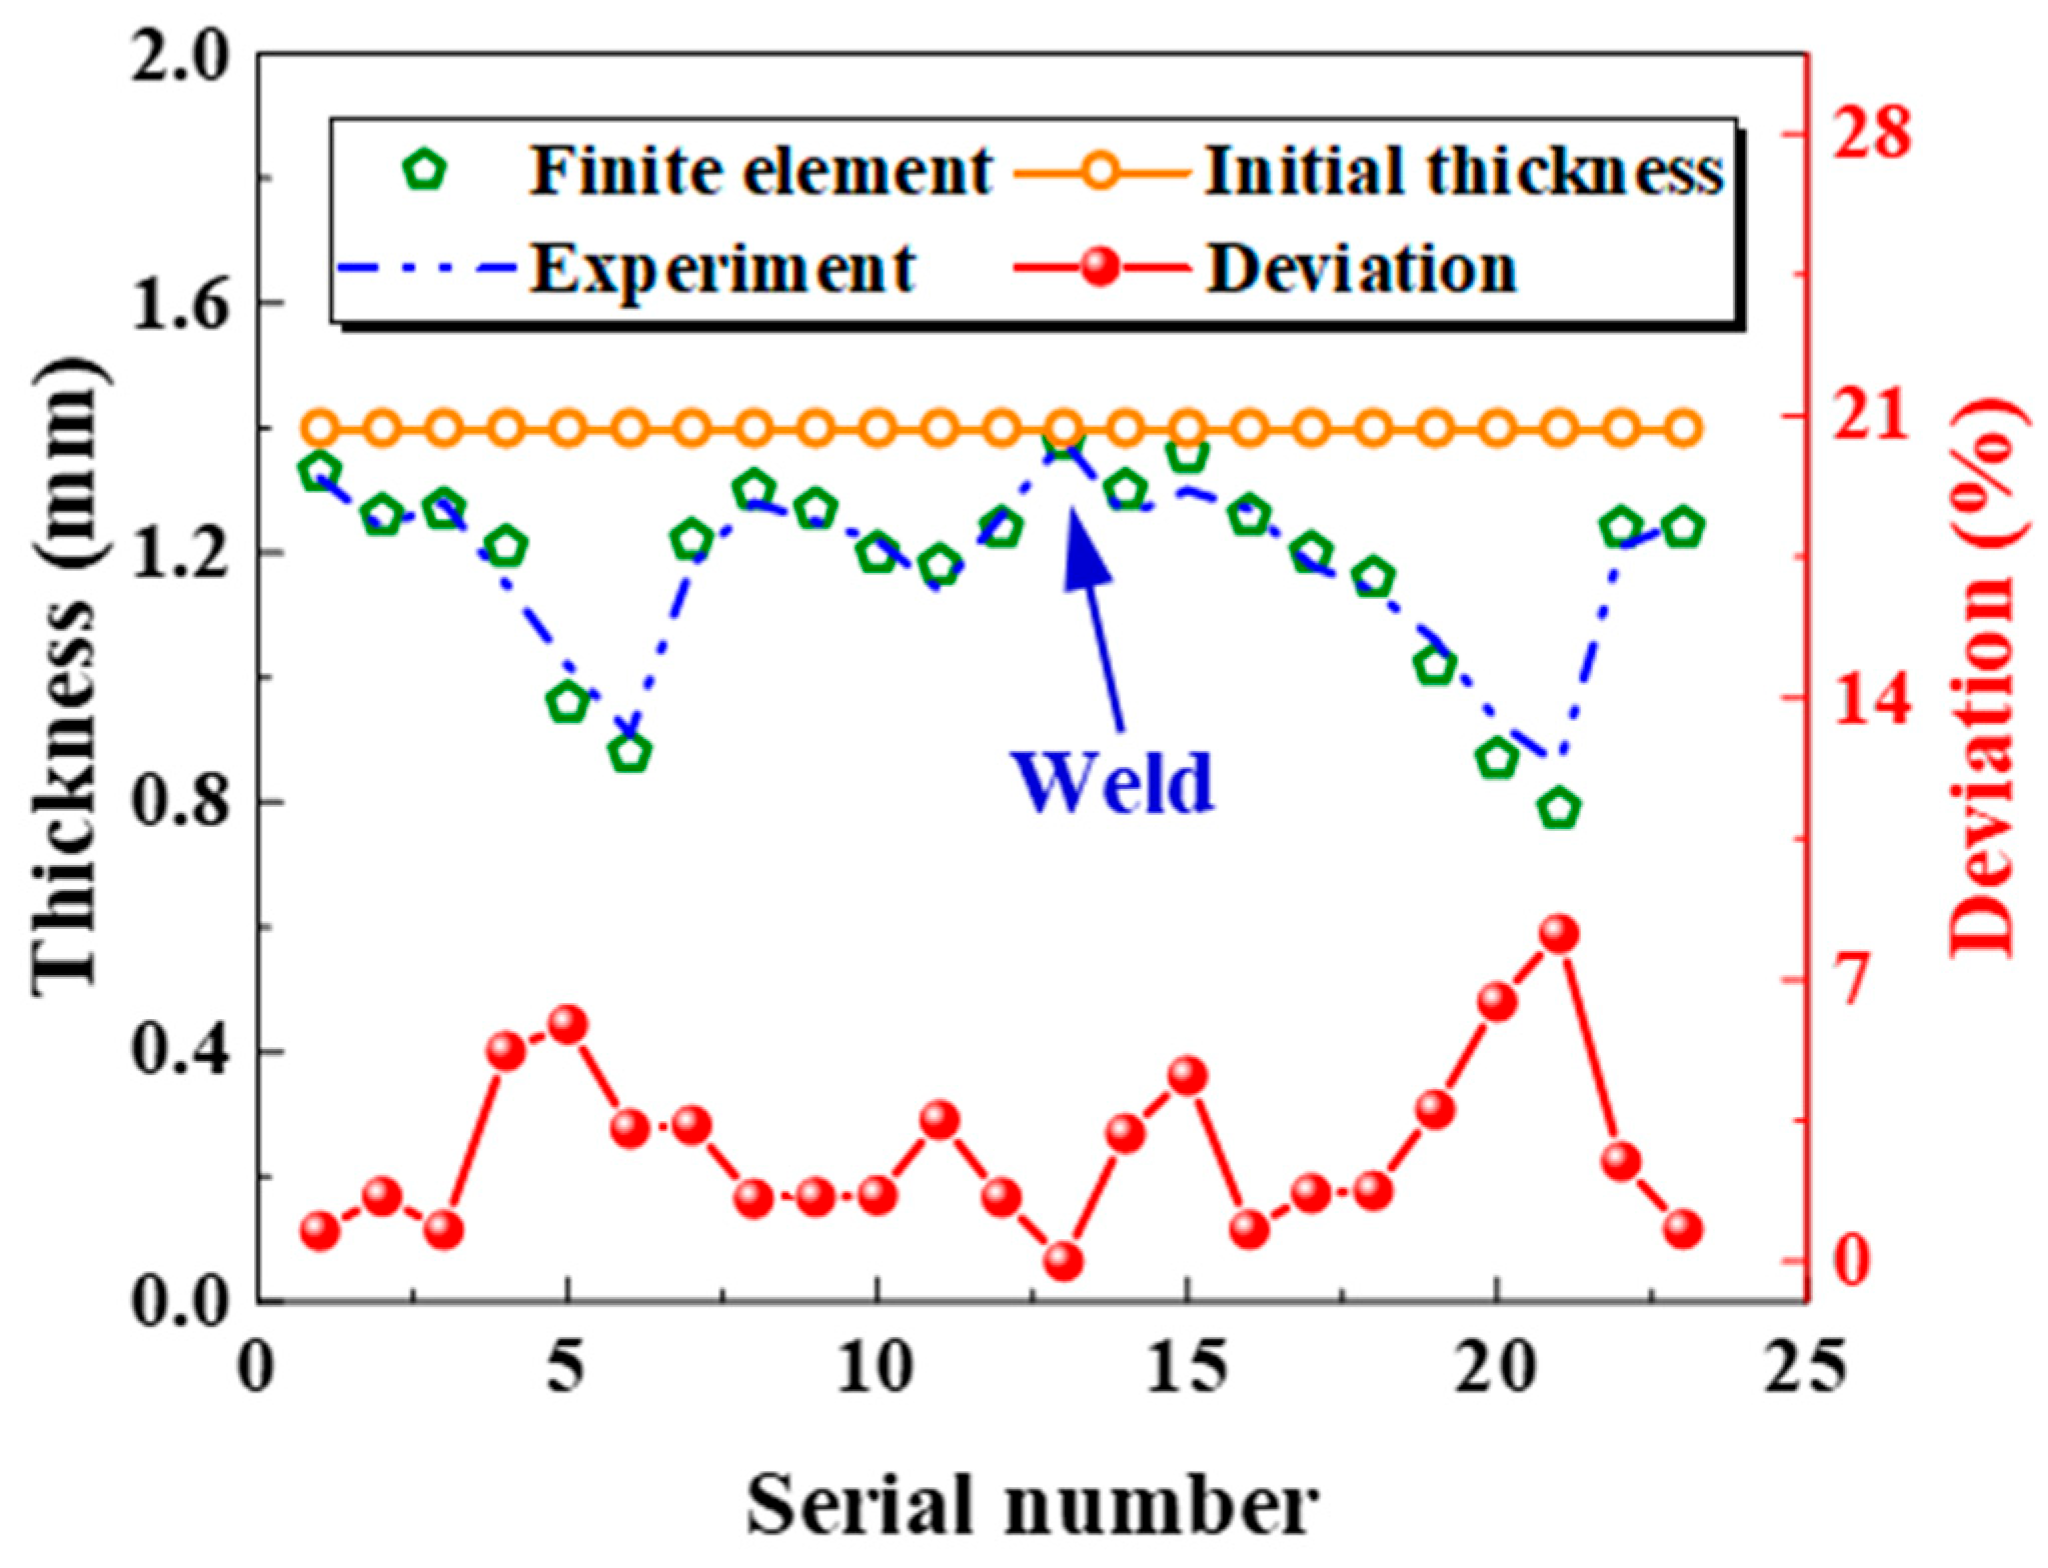
4.2. Prediction of the Wall Thickness Distribution
5. Conclusions
- (1)
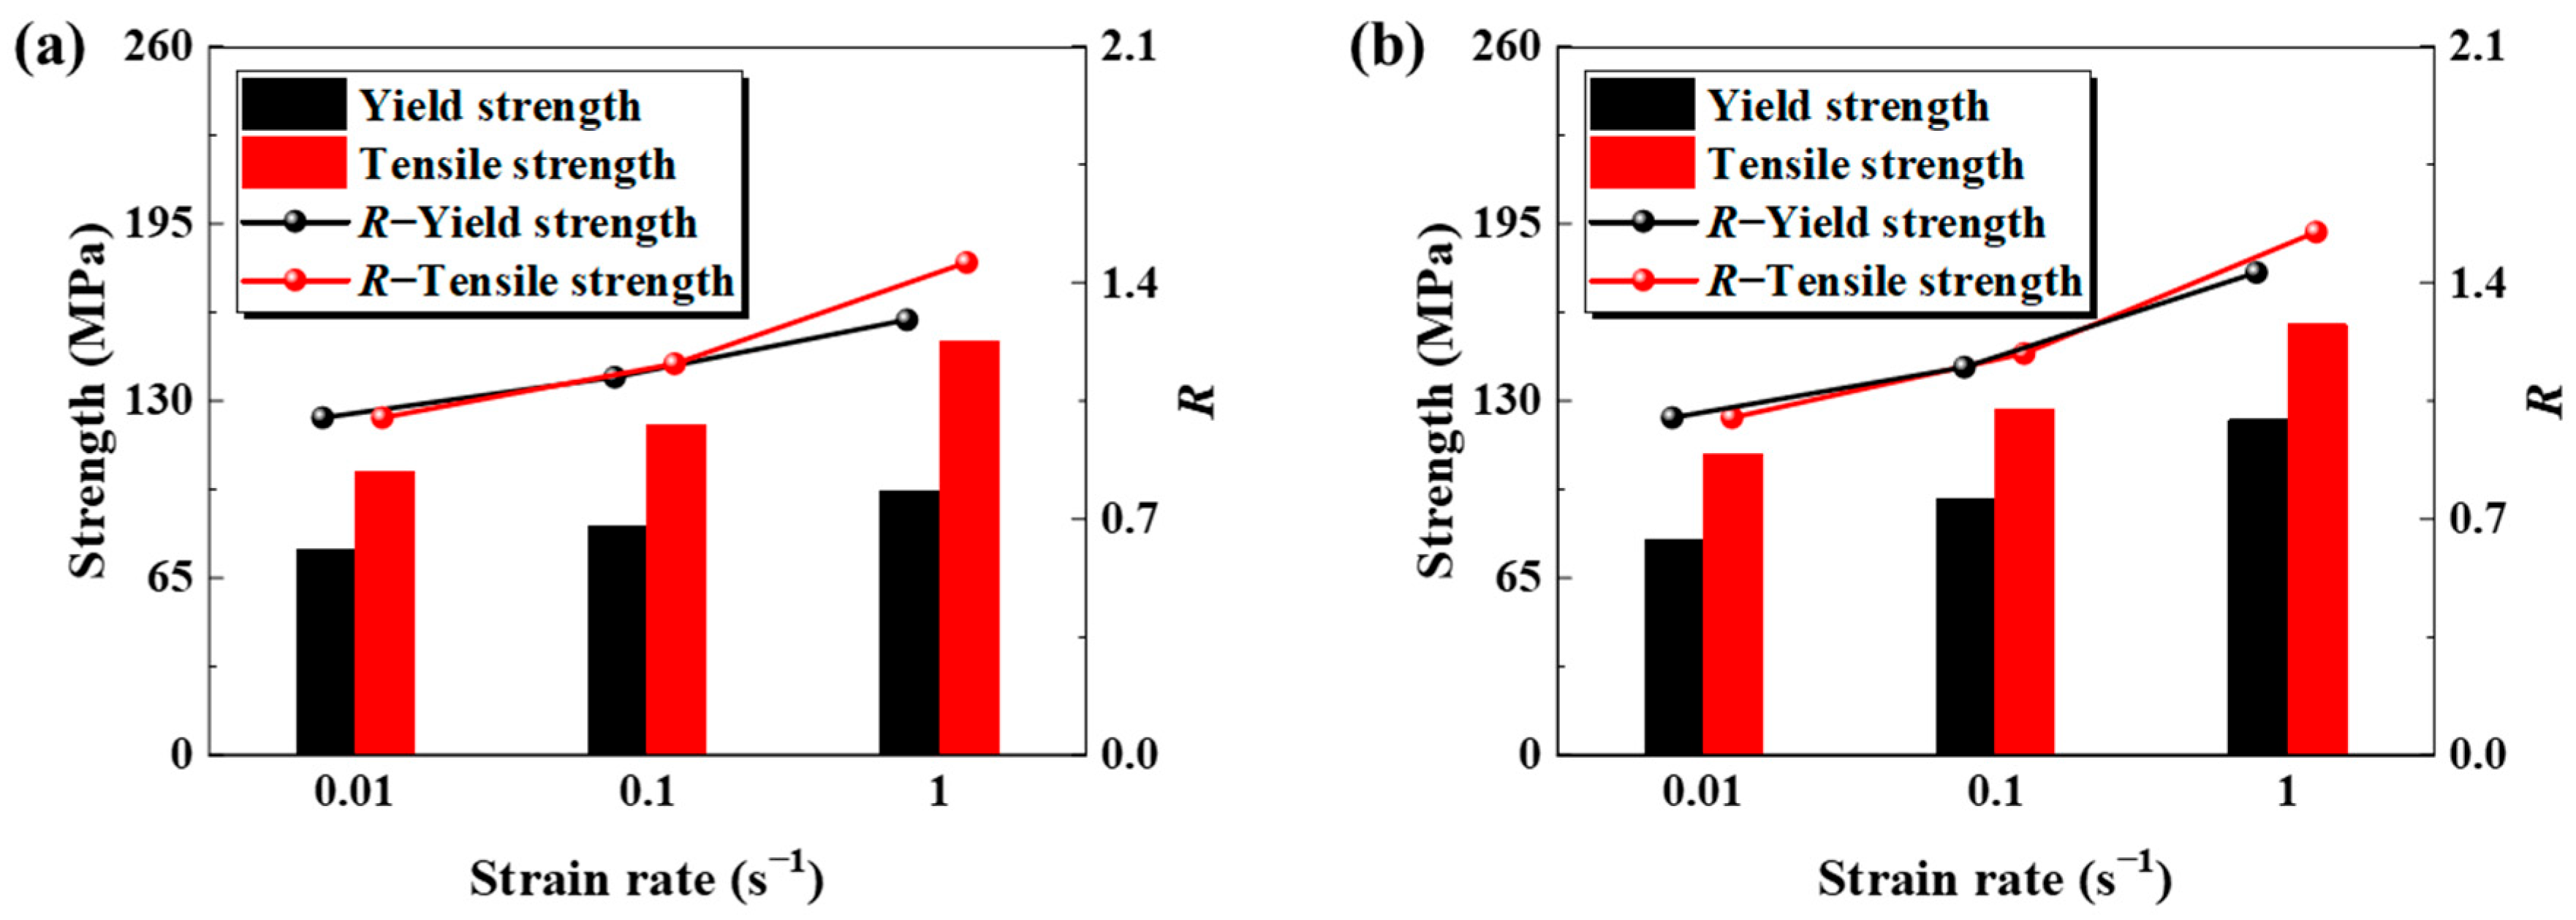
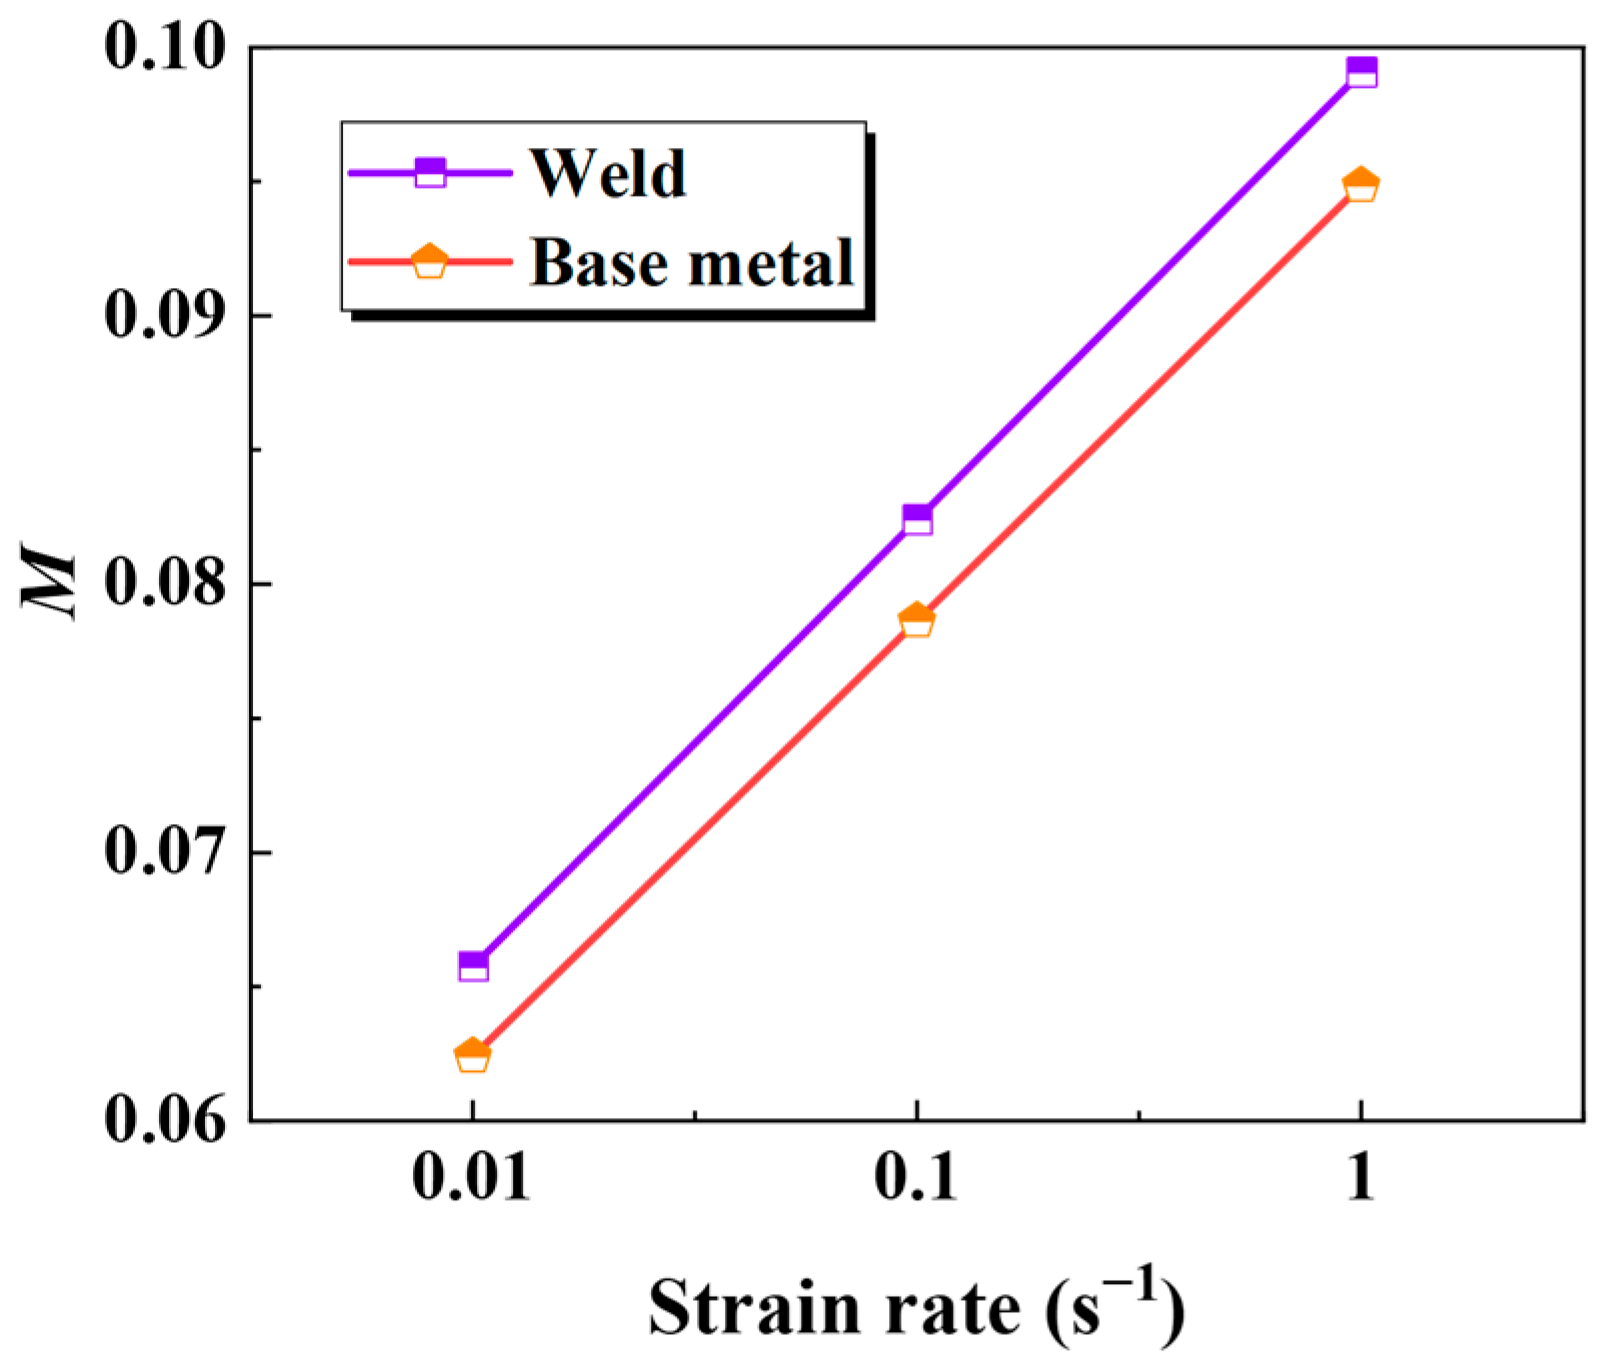
- Under thermal conditions ranging from 850 °C to 900 °C and strain rates spanning 0.01 s−1 to 1 s−1, the base metal and the weld of a PHS1500 non-uniform welded tube demonstrate a progressively higher yield and tensile strength as the strain rates escalate. The yield strength of the weld surpasses that of the base metal by 12.8%, while the tensile strength increases by 3.9%. Furthermore, the tensile strength in the base metal and the weld zone exhibits an approximate 11% higher susceptibility to the strain rate compared to that of the yield strength.
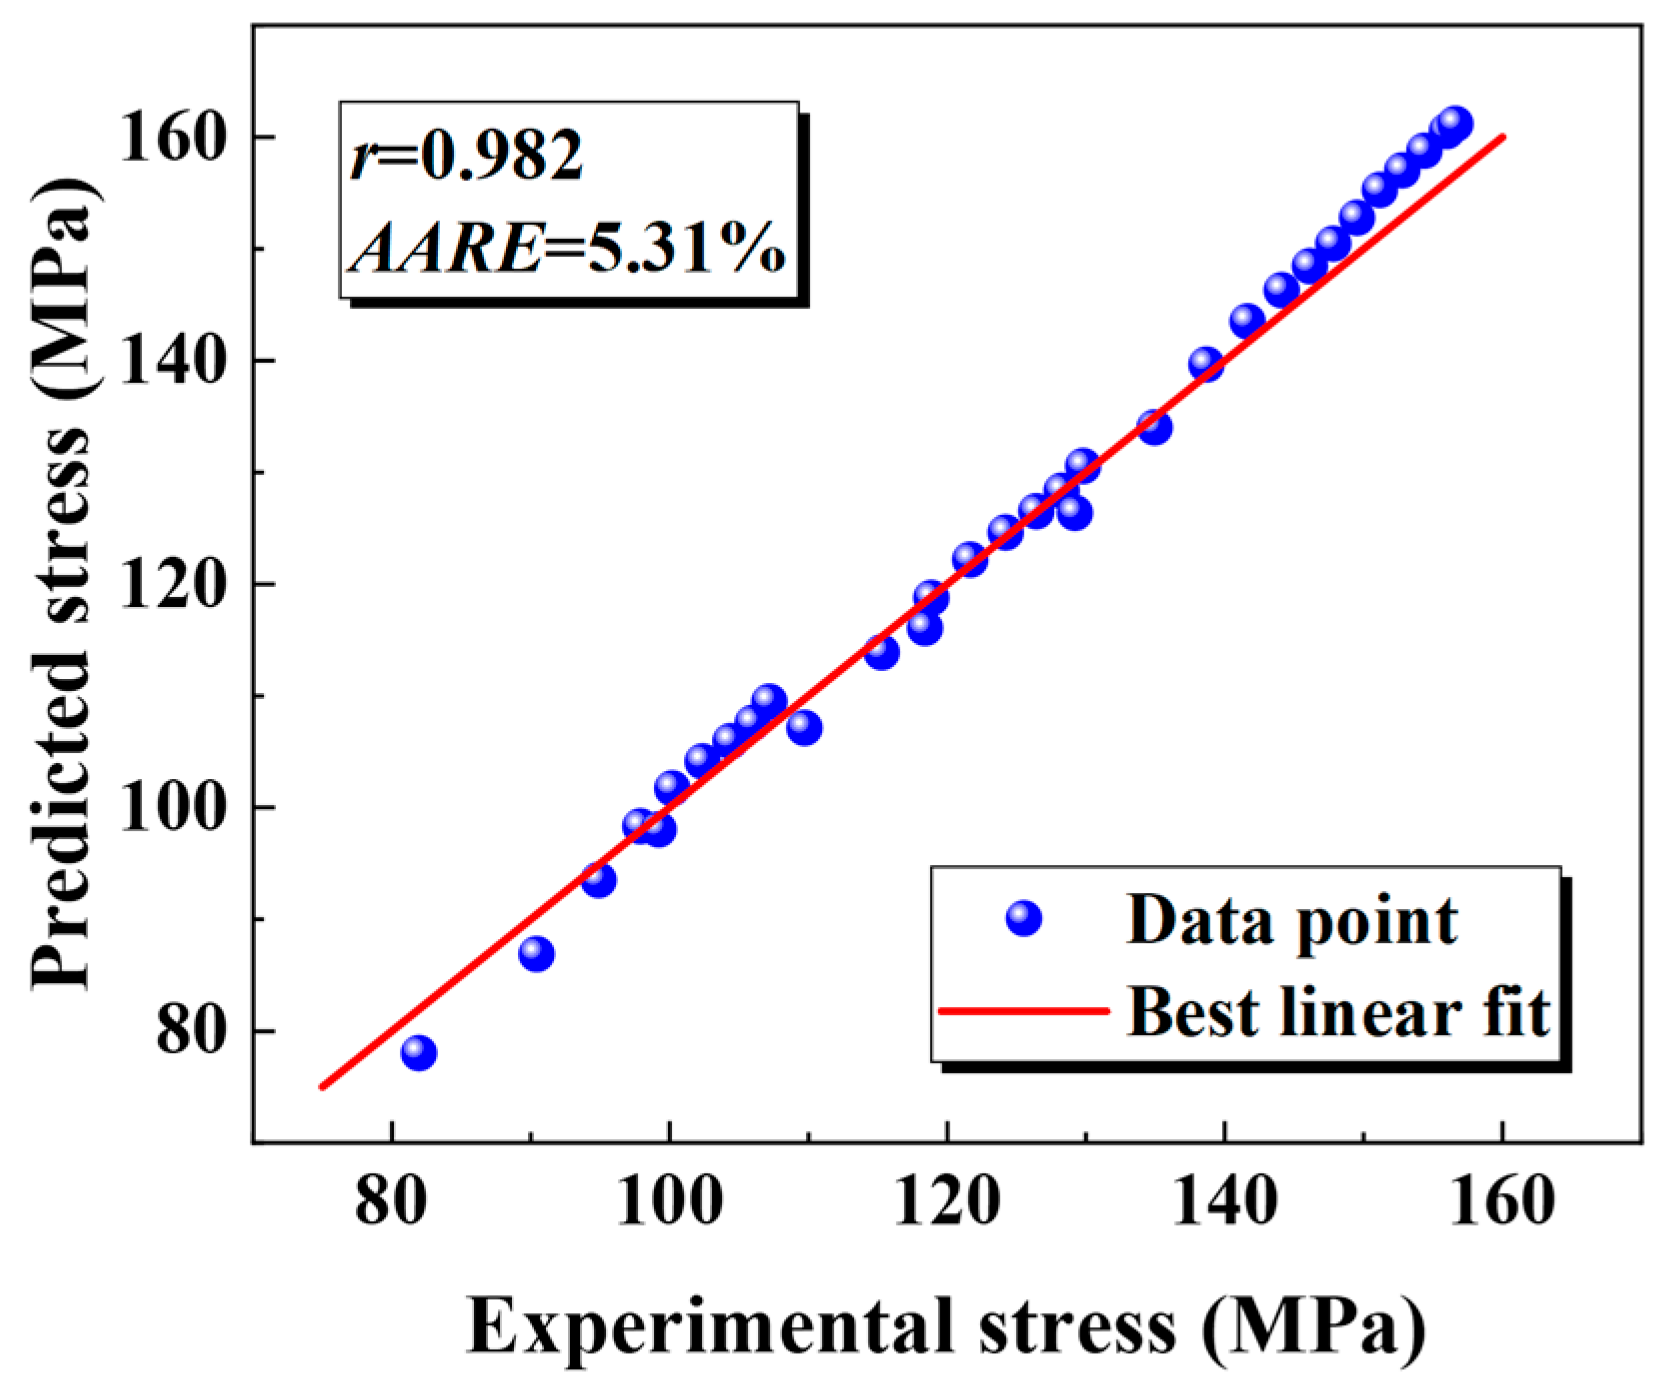
- (2)
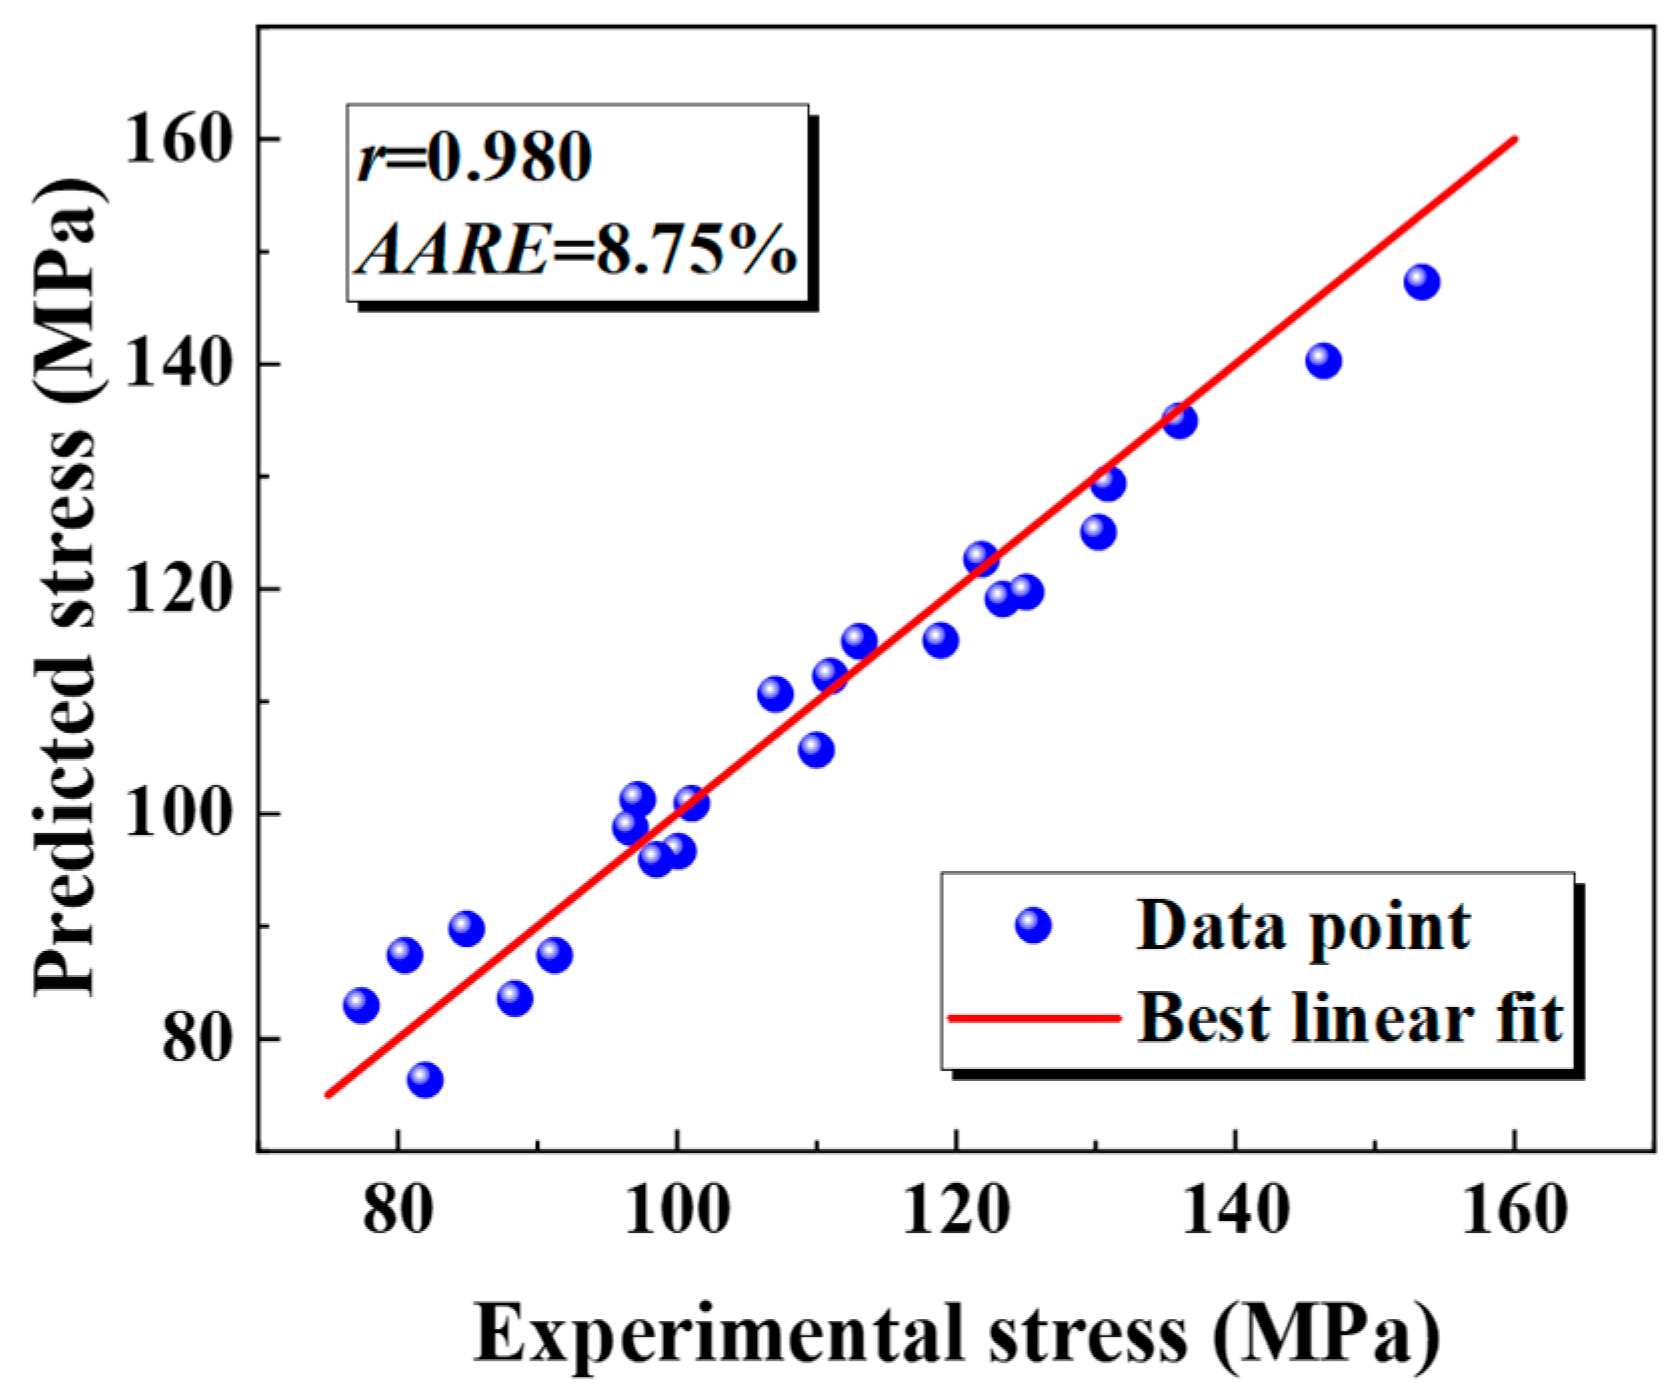
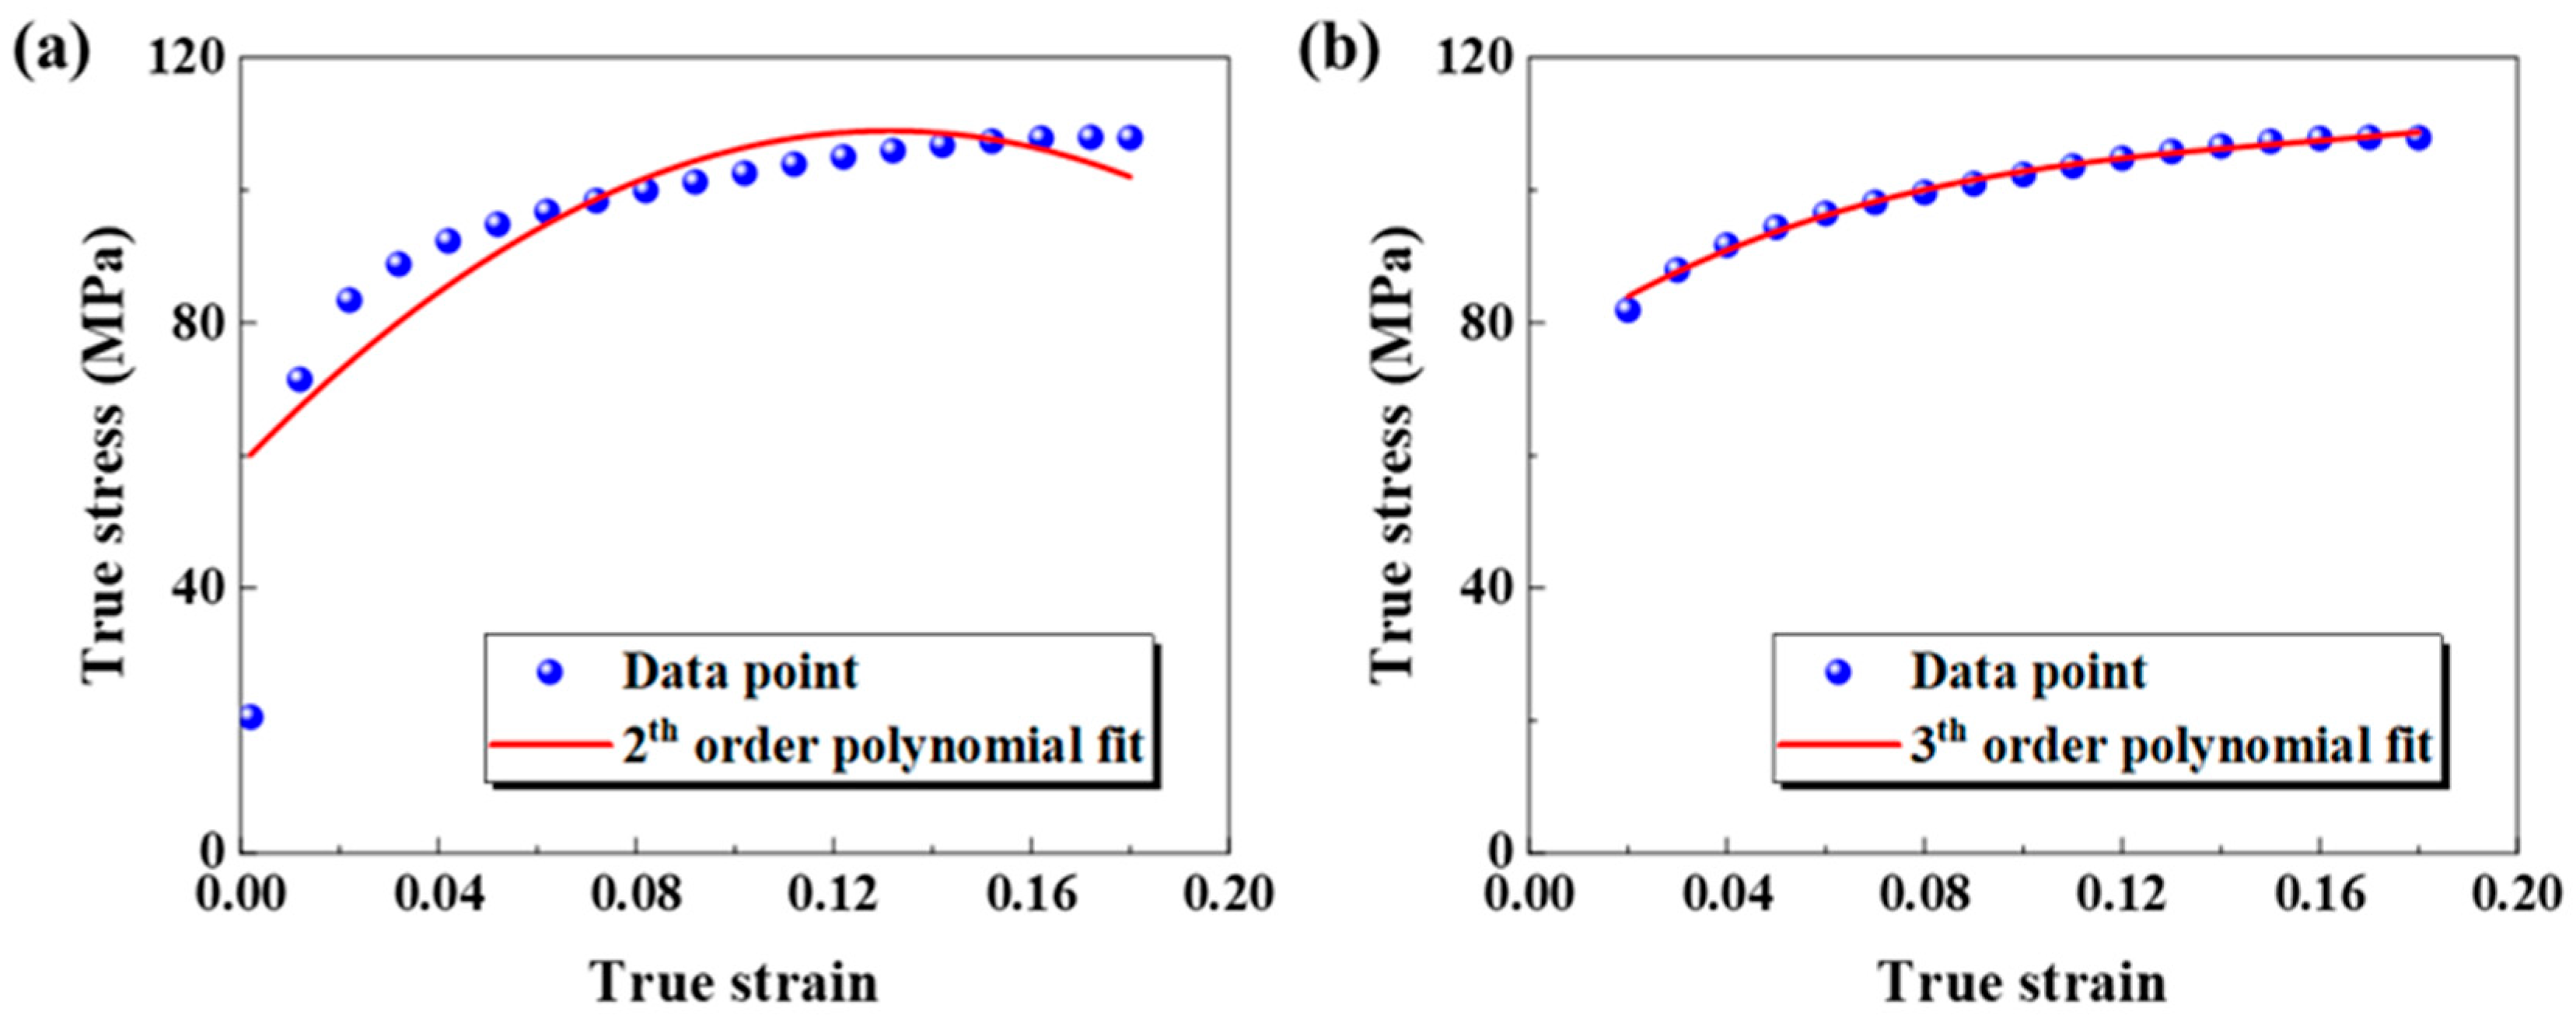
- Utilizing the elevated-temperature flow curve for the base metal and the weld of a PHS1500 welded tube, the JC material model was formulated and modified. The resulting modified model provides a much tighter fit to the data, showing greater accuracy than the original. The new model demonstrates a marked improvement over the traditional one. Specifically, the correlation coefficients for both the base metal and the weld jump from 0.975 and 0.980 to 0.990 and 0.982, respectively. Furthermore, the average relative error is slashed from 10.23% and 8.75% down to a mere 2.23% and 5.31%, showcasing a significant boost in accuracy.
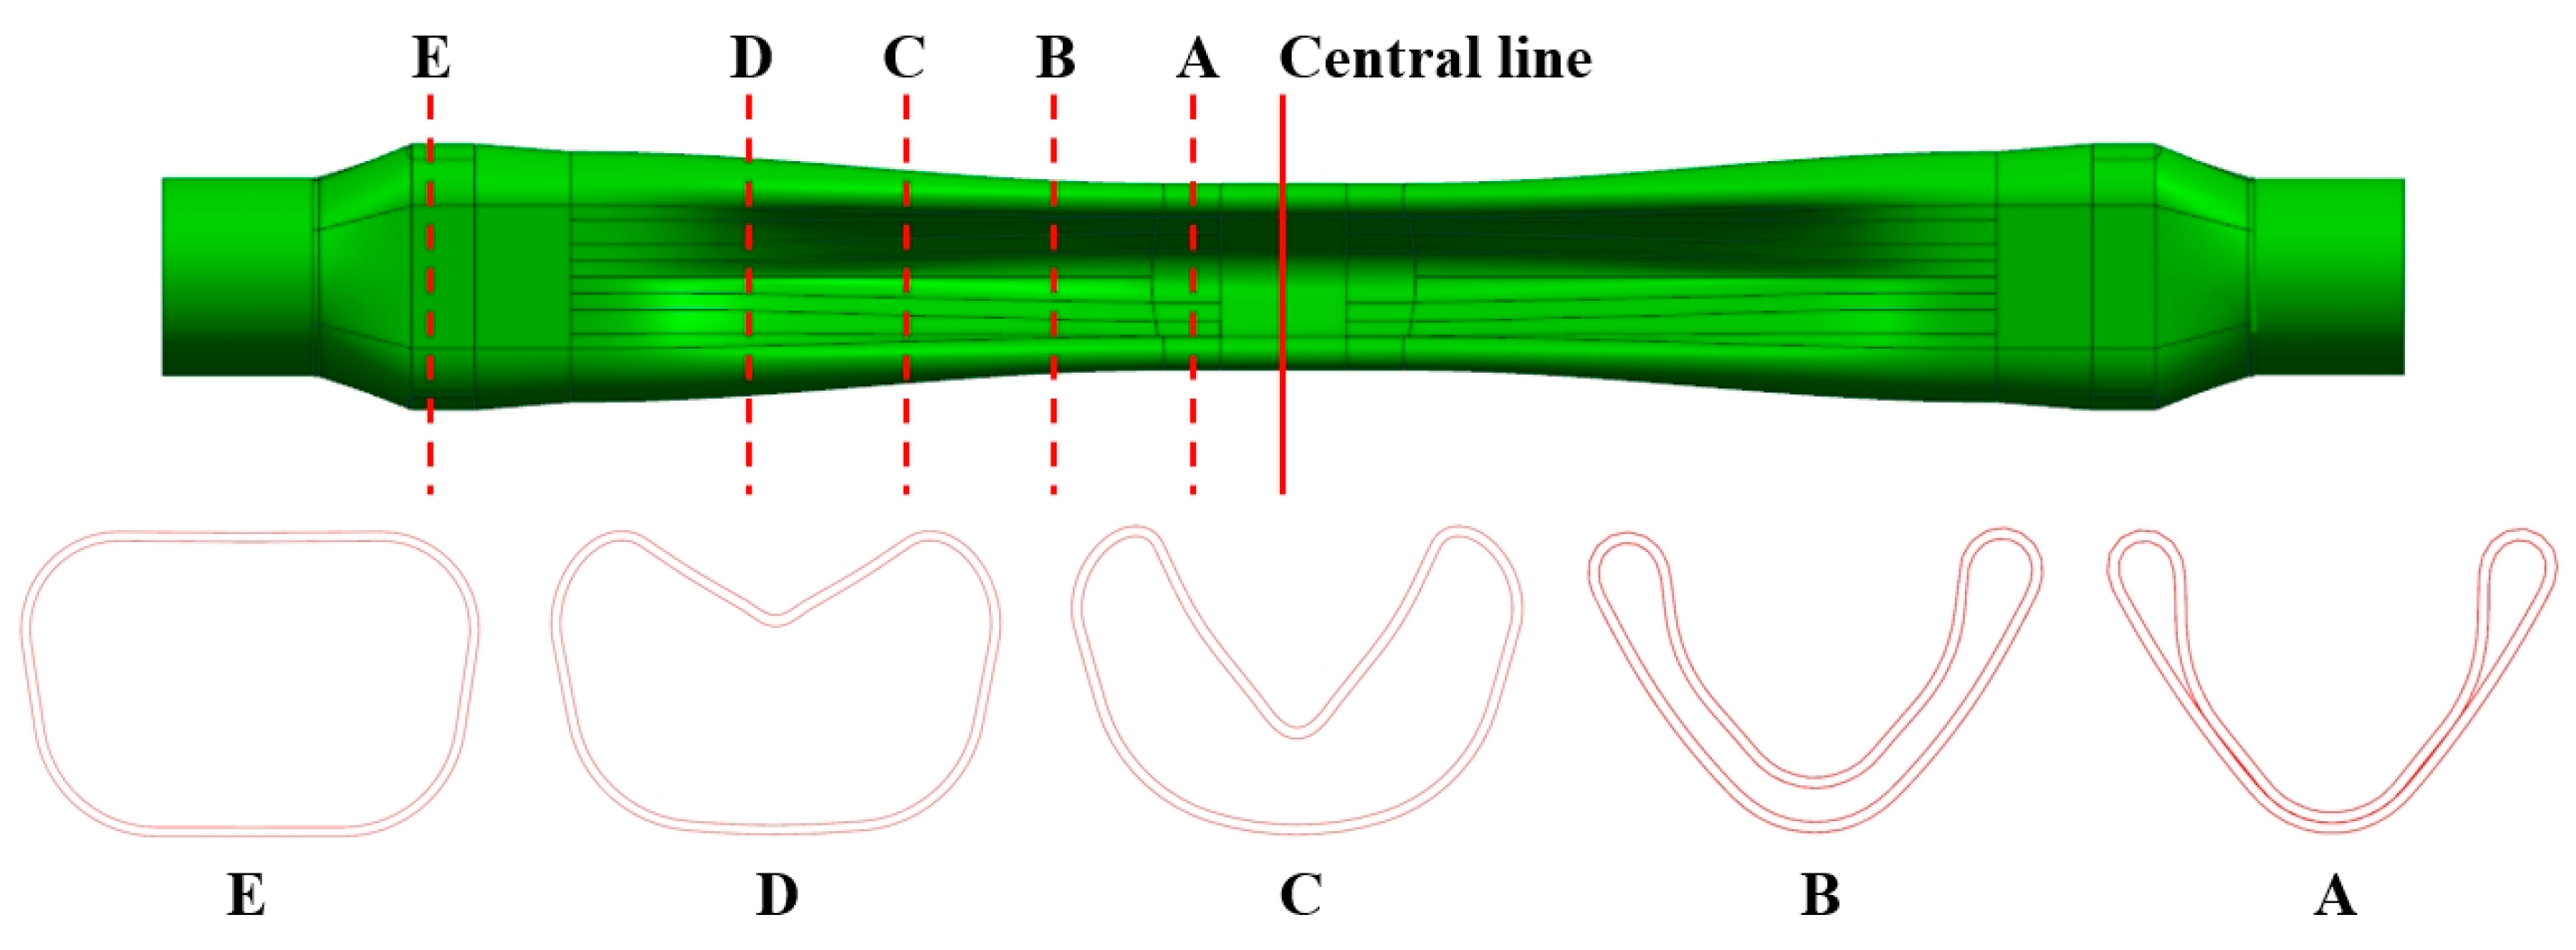
- (3)
- The modified JC constitutive model is applied to a finite element analysis of hot gas bulging of a complex-shaped tubular part. The maximum deviation between the experimental test of the reduction in wall thickness and the simulation analysis of the cross-section of the complex-shaped tube is less than 8%, which proves the accuracy of the modified Johnson–Cook constitutive model. The modified constitutive model is suitable for analyzing the deformation behavior of other hot stamping steels under thermal loading conditions and is not limited to the hot air expansion process.
Author Contributions
Funding
Institutional Review Board Statement
Informed Consent Statement
Data Availability Statement
Conflicts of Interest
References
- Yu, T.; Su, Y.; Li, J.; Fu, H.; Si, Z.; Liu, X. Simulation and microstructural analysis of twin-induced plasticity steel cylinder deep drawing. Materials 2023, 16, 6264. [Google Scholar] [CrossRef]
- Taub, A.I.; Luo, A.A. Advanced lightweight materials and manufacturing processes for automotive applications. MRS Bull. 2015, 40, 1045–1054. [Google Scholar] [CrossRef]
- Bouaziz, O.; Zurob, H.; Huang, M. Driving force and logic of development of advanced high strength steels for automotive applications. Steel Res. Int. 2013, 84, 937–947. [Google Scholar] [CrossRef]
- Li, H.; Lee, C.; Venezuela, J.; Kim, H.J.; Atrens, A. Hydrogen diffusion and hydrogen embrittlement of a 1500 MPa hot-stamped steel 22MnB5 in different austenitizing conditions. Mater. Sci. Eng. A 2024, 897, 146349. [Google Scholar] [CrossRef]
- Schwedler, O.; Zinke, M.; Jüttner, S. Determination of hydrogen input in welded joints of press-hardened 22MnB5 steel. Weld. World 2014, 58, 339–346. [Google Scholar] [CrossRef]
- Taylor, T.; Clough, A. Critical review of automotive hot-stamped sheet steel from an industrial perspective. Mater. Sci. Technol. 2018, 34, 809–861. [Google Scholar] [CrossRef]
- Neugebauer, R.; Schieck, F.; Werner, M. Tube press hardening for lightweight design. In Proceedings of the ASME 2011 International Manufacturing Science and Engineering Conference, Corvallis, OR, USA, 13–17 June 2011; MSEC: New York, NY, USA, 2011; Volume 1, pp. 495–502. [Google Scholar] [CrossRef]
- Ruan, X.; Zhu, H.; Liang, J.; Hu, X.; Xu, Y.; Chen, H.; He, Z. Research on asynchronous quenching behavior of boron steel tubular parts with variable cross-sections in hot gas forming-quenching integrated process. J. Mater. Res. Technol. 2023, 25, 6737–6750. [Google Scholar] [CrossRef]
- Khalfallah, A. Experimental and numerical assessment of mechanical properties of welded tubes for hydroforming. Mater. Des. 2014, 56, 782–790. [Google Scholar] [CrossRef]
- Hashmi, M.S.J. Aspects of tube and pipe manufacturing processes: Meter to nanometer diameter. J. Mater. Process. Technol. 2006, 179, 5–10. [Google Scholar] [CrossRef]
- Gao, S.; Yu, X.; Li, Q.; Sun, Y.; Hao, Z.; Gu, D. Research on dynamic deformation behavior and constitutive relationship of hot forming high strength steel. J. Mater. Res. Technol. 2024, 28, 1694–1712. [Google Scholar] [CrossRef]
- Khan, M.S.; Shahabad, S.I.; Yavuz, M.; Duley, W.W.; Biro, E.; Zhou, Y. Numerical modelling and experimental validation of the effect of laser beam defocusing on process optimization during fiber laser welding of automotive press-hardened steels. J. Manuf. Process. 2021, 67, 535–544. [Google Scholar] [CrossRef]
- Hu, P.; Shi, D.; Ying, L.; Shen, G.; Liu, W. The finite element analysis of ductile damage during hot stamping of 22MnB5 steel. Mater. Des. 2015, 69, 141–152. [Google Scholar] [CrossRef]
- Lin, Y.C.; Chen, X.M.; Liu, G. A modified Johnson-Cook model for tensile behaviors of typical high-strength alloy steel. Mater. Sci. Eng. A 2010, 527, 6980–6986. [Google Scholar] [CrossRef]
- Shin, H.; Yoo, Y.H. Effect of the velocity of a single flying plate on the protection capability against obliquely impacting long-rod penetrators. Combust. Explos. Shock Waves 2003, 39, 591–600. [Google Scholar] [CrossRef]
- Shin, H.; Kim, J.B. A phenomenological constitutive equation to describe various flow stress behaviors of materials in wide strain rate and temperature regimes. J. Eng. Mater. Technol. 2010, 132, 021009. [Google Scholar] [CrossRef]
- Wang, X.; Huang, C.; Zou, B.; Liu, H.; Zhu, H.; Wang, J. Dynamic behavior and a modified Johnson-Cook constitutive model of Inconel 718 at high strain rate and elevated temperature. Mater. Sci. Eng. A 2013, 580, 385–390. [Google Scholar] [CrossRef]
- Fan, X.; Suo, T.; Sun, Q.; Wang, T. Dynamic mechanical behavior of 6061 Al alloy at elevated temperatures and different strain rates. Acta Mech. Solida Sin. 2013, 26, 111–120. [Google Scholar] [CrossRef]
- Roy, M.J.; Maijer, D.M.; Dancoine, L. Constitutive behavior of as-cast A356. Mater. Sci. Eng. A 2012, 548, 195–205. [Google Scholar] [CrossRef]
- Ji, H.; Wen, Y.; Cui, G.; Pei, W.; Xiao, W. Hot-deformation behavior and processing map of 22MnB5 high-strength steel. Mater. Technol. 2023, 57, 367–378. [Google Scholar] [CrossRef]
- Li, H.; He, L.; Zhao, G.; Zhang, L. Constitutive relationships of hot stamping boron steel B1500HS based on the modified Arrhenius and Johnson-Cook model. Mater. Sci. Eng. A 2013, 580, 330–348. [Google Scholar] [CrossRef]
- Ravikiran, K.; Xu, P.; Li, L. A critical review on high-frequency electric-resistance welding of steel linepipe. J. Manuf. Process. 2024, 124, 753–777. [Google Scholar] [CrossRef]
- Veerababu, J.; Goyal, S.; Nagesha, A. Studies on creep-fatigue interaction behavior of Grade 92 steel and its weld joints. Int. J. Fatigue 2021, 149, 106307. [Google Scholar] [CrossRef]
- Liu, S.; Chen, S.; Hou, L.; Zhou, Z. Residual mechanical properties of butt-welded ultra-high-strength steel (Q890 and Q960) after fire exposure. J. Constr. Steel Res. 2024, 219, 108756. [Google Scholar] [CrossRef]
- ASTM E21-17e1; Standard Test Methods for Elevated Temperature Tension Tests of Metallic Materials. ASTM International: West Conshohocken, PA, USA, 2017.
- Liu, S.; Ai, S.; Long, M.; Feng, Y.; Zhao, J.; Zhao, Y.; Gao, X.; Chen, D.; Ma, M. Evolution of microstructures and mechanical properties of Nb-V alloyed ultra-high strength hot stamping steel in austenitizing process. Materials 2022, 15, 8197. [Google Scholar] [CrossRef]
- Liu, G.L.; You, Z.Y.; Cheng, W.L.; Luo, L.; Yu, H.; Wang, L.F.; Li, H.; Cui, Z.Q.; Wang, J.H. Hot deformation behavior and resultant microstructural evolution of dilute Mg-Bi-Sn-Mn alloy during hot compression. J. Mater. Res. Technol. 2023, 26, 2815–2829. [Google Scholar] [CrossRef]
- Liu, G.L.; You, Z.Y.; Cheng, W.L.; Luo, L.; Yu, H.; Wang, L.F.; Li, H.; Cui, Z.Q.; Wang, J.H. Constitutive equation and dynamic recovery mechanism of high strength cast Al-Cu-Mn alloy during hot deformation. Mater. Today Commun. 2022, 33, 104199. [Google Scholar] [CrossRef]
- Johnson, G.R.; Cook, W.H. Fracture characteristics of three metals subjected to various strains, strain rates, temperatures and pressures. Eng. Fract. Mech. 1985, 21, 31–48. [Google Scholar] [CrossRef]
- Larour, P.; Bäumer, A.; Dahmen, K.; Bleck, W. Influence of strain rate, temperature, plastic strain, and microstructure on the strain rate sensitivity of automotive sheet steels. Steel Res. Int. 2013, 84, 426–442. [Google Scholar] [CrossRef]
- Cai, J.; Wang, K.; Zhai, P.; Li, F.; Yang, J. A modified Johnson-Cook constitutive equation to predict hot deformation behavior of Ti-6Al-4V alloy. J. Mater. Eng. Perform. 2015, 24, 32–44. [Google Scholar] [CrossRef]
- Quan, G.Z.; Zhan, Z.Y.; Zhang, L.; Wu, D.S.; Luo, G.C.; Xia, Y.F. A study on the multi-phase transformation kinetics of ultra-high-strength steel and application in thermal-mechanical-phase coupling simulation of hot stamping process. Mater. Sci. Eng. A 2016, 673, 24–38. [Google Scholar] [CrossRef]


| C | Si | Mn | P | S | Al | B |
|---|---|---|---|---|---|---|
| 0.23 | 0.15 | 1.36 | 0.012 | 0.002 | 0.05 | 0.0018 |
| A | B | C | n | m |
|---|---|---|---|---|
| 75 | 117.085 | 0.09153 | 0.669 | 0.963 |
| Forming Temperature (°C) | Bulging Pressure (MPa) | Rate of Pressurization (MPa/s) |
|---|---|---|
| 870 | 15 | 1, 2, 3, 4 |
| Temperature (°C) | 25 | 150 | 250 | 400 | 600 | 900 |
| Thermal conductivity (W/m/°C) | 31 | 32 | 36 | 41 | 44 | 45 |
| Temperature (°C) | 25 | 150 | 250 | 400 | 600 | 900 |
| Specific heat capacity (W/m/°C) | 469 | 470 | 473 | 474 | 776 | 1023 |
| Temperature (°C) | 25 | 150 | 250 | 400 | 600 | 900 |
| Thermal conductivity (W/m/°C) | 20 | 23 | 24 | 26 | 28 | 31 |
Disclaimer/Publisher’s Note: The statements, opinions and data contained in all publications are solely those of the individual author(s) and contributor(s) and not of MDPI and/or the editor(s). MDPI and/or the editor(s) disclaim responsibility for any injury to people or property resulting from any ideas, methods, instructions or products referred to in the content. |
© 2025 by the authors. Licensee MDPI, Basel, Switzerland. This article is an open access article distributed under the terms and conditions of the Creative Commons Attribution (CC BY) license (https://creativecommons.org/licenses/by/4.0/).
Share and Cite
Zhang, Z.; Lin, Y.; Ruan, X.; Liang, J.; Wang, T.; Wang, J.; He, Z. The Prediction of High-Temperature Bulging Deformations in Non-Uniform Welded Tubes and Its Application to Complex-Shaped Tubular Parts. Materials 2025, 18, 2882. https://doi.org/10.3390/ma18122882
Zhang Z, Lin Y, Ruan X, Liang J, Wang T, Wang J, He Z. The Prediction of High-Temperature Bulging Deformations in Non-Uniform Welded Tubes and Its Application to Complex-Shaped Tubular Parts. Materials. 2025; 18(12):2882. https://doi.org/10.3390/ma18122882
Chicago/Turabian StyleZhang, Zhenyu, Yanli Lin, Xianggang Ruan, Jiangkai Liang, Tianyu Wang, Junzhuo Wang, and Zhubin He. 2025. "The Prediction of High-Temperature Bulging Deformations in Non-Uniform Welded Tubes and Its Application to Complex-Shaped Tubular Parts" Materials 18, no. 12: 2882. https://doi.org/10.3390/ma18122882
APA StyleZhang, Z., Lin, Y., Ruan, X., Liang, J., Wang, T., Wang, J., & He, Z. (2025). The Prediction of High-Temperature Bulging Deformations in Non-Uniform Welded Tubes and Its Application to Complex-Shaped Tubular Parts. Materials, 18(12), 2882. https://doi.org/10.3390/ma18122882