Highlights
- The effects of porosity and pore size on the axial compressive properties of RAC were analyzed;
- The strength and strength reduction were linearly related to porosity and exponentially related to pore size;
- The elastic modulus and modulus reduction were linearly related to porosity and exponentially related to pore size;
- The damage degree to strength and elastic modulus was greater for the combination of small pore size and high porosity than for that of large pore size and low porosity.
Abstract
Pores of different sizes and quantities are formed during the molding process of recycled aggregate concrete (RAC). However, few studies have examined the individual and combined effects of porosity and mesoscale pore size (pore size) on the axial compressive mechanical properties of RAC. In this study, the influence of porosity and pore size on the axial compressive mechanical behavior of RAC was examined by incorporating expanded polystyrene (EPS) particles to create prefabrication of pores. Additionally, crack development influenced by pores was analyzed using high-energy X-ray computed tomography (CT). Gray correlation analysis was employed to quantify the influence of pore size and porosity on compressive mechanical parameters. Furthermore, the combined effects of pore characteristics were assessed by introducing damage variables. It was shown that the compressive strength, strength reduction, elastic modulus, and modulus reduction exhibited linear correlations with porosity and exponential correlations with pore size. Cracks within the specimen predominantly propagate through the pores or along their edges. The influence of porosity on both strength and elastic modulus is more substantial than that of pore size. Moreover, the deterioration in mechanical properties is more pronounced when small pore size is coupled with high porosity, compared to the combination of large pore size and low porosity.
1. Introduction
Recycled aggregates (RAs) are obtained from construction and demolition waste (CDW) through crushing, washing, and screening processes [1]. The survey data indicate that replacing natural aggregates (NAs) with recycled aggregates (RAs) in engineering projects offers significant advantages in resource utilization and environmental protection [2]. For example, RAs produced from CDW can reduce non-renewable energy consumption by 58% and greenhouse gas emissions by 65% compared to NAs [3]. Moreover, long-term costs can be reduced by 40% [4]. Additionally, using RAs for pavement construction can result in cost savings of approximately 0.5 GBP/m2 [5]. RAC, as a typical heterogeneous porous material, can develop internal pores due to the air introduced during the mixing process and the evaporation of water during molding [6]. Factors such as construction techniques, vibration levels, and maintenance conditions can also contribute to the formation of pores [7,8,9]. Jivkov et al. [10] employed X-ray computed tomography to generate three-dimensional reconstructions of concrete, revealing a significant number of pores at both micro- and meso-scales. The presence of these pores inevitably has an impact on the mechanical properties [11,12] and durability [13,14] of concrete materials.
In recent years, relevant studies have been conducted to investigate the impact of pores properties on the mechanical properties of concrete. However, both experimental and numerical simulation studies have primarily focused on natural aggregate concrete (NAC) systems. The existing literature [15,16,17] indicates that due to differences in material systems, significant variations exist in the quantitative relationships between pore parameters and mechanical performance across different types of concrete. Therefore, whether the conclusions established for NAC can be directly applied to RAC still requires further validation.
Since pores mostly exist at the meso-scale, meso-scale numerical simulations have become a widely adopted method among researchers. Most of these studies regard concrete as a four-phase composite material, comprising aggregate, mortar, interfacial transition zone, and pores, and analyze the influence of pores on the mechanical properties of concrete materials by establishing a meso-scale model [18]. For example, Zhang et al. [19] demonstrated that aggregate content and porosity significantly influence the axial compressive properties of concrete and that the rate of crack propagation within the specimen is inverse to porosity. Wang et al. [20] investigated the influence of the spatial and size distribution of circular-like stochastic pores on the fracture behavior of concrete based on multiple fractal theory, finding that these stochastic circular pores induce distinct splitting tensile crack patterns. Zhang et al. [21] embedded zero-thickness cohesive elements into the finite element model and assigned them to the traction-detachment criterion to analyze the influences of aggregate volume content and porosity on the axial compressive parameters and the fracture process of concrete. Peng et al. [22] investigated the fracture behavior of notched beams and found that the distribution of pores and aggregates can induce crack bifurcation. The extent of bifurcation is closely related to the aggregate interface, aggregate composition, and pore distribution. Wang et al. [23] constructed circular and elliptical pores and analyzed the influences of pore distribution and volume content on axial tensile fracture properties, finding that porosity can significantly reduce the axial tensile strength of specimens. These studies have revealed the significant role of porosity in determining mechanical properties. However, most of the work has focused solely on the individual effects of porosity, with insufficient attention paid to pore size and the combined effects of pore size and porosity. Moreover, most of these studies have remained at a qualitative level in analyzing how pore structure influences mechanical properties. However, in reality, hardened concrete contains pores of varying sizes and quantities [24]. Porosity and pore size, as independent yet interrelated parameters, exert a coupled influence on the mechanical behavior of materials that cannot be overlooked. In addition, these mesoscale simulation studies have primarily focused on NAC, while there remains a significant lack of mesoscale simulation research on the mechanisms by which pore structure influences RAC. The primary reason for this gap is the scarcity of experimental data required to support the establishment and validation of such simulations. In summary, there is a clear need for quantitative experimental research to elucidate the influence of pores on the mechanical properties and failure modes of RAC.
To address these issues, this study achieved quantitative control of the initial porosity and pore size by adjusting the particle size and mass of EPS particles. Specimens with four porosity levels (2%, 4%, 6%, and 8%) and five pore size ranges (0.3–0.5 mm, 0.5–1 mm, 1–2 mm, 2–3 mm, and 3–5 mm) were prepared and subjected to axial compression tests to quantitatively analyze the influence of porosity and pore size on axial compressive performance. Additionally, using a self-developed high-energy X-ray CT, the development of cracks in RAC containing initial defects after compression was investigated, revealing the influence of pores on crack propagation at the mesoscale. Furthermore, grey correlation theory was employed to compare and evaluate the relative influence of porosity and pore size on the axial compressive strength and elastic modulus of RAC. Finally, damage variables were introduced to reveal the coupled effects of porosity and pore size. The research results not only provide experimental evidence for the validity of the mesoscale simulation analysis of RAC with defects but also offer important references for the design and engineering applications of RAC materials.
2. Materials and Methods
This study aims to examine the effect of porosity and pore size on the macroscopic axial compression mechanical properties of RAC. Porosity values ranging from 0–8% were considered, with four commonly used levels (2%, 4%, 6%, and 8%) selected from existing studies [16]. It is worth noting that inherent pores are inevitably present in RAC. Chen et al. [25] reported that the porosity of micrometer-sized pores in RAC is approximately 2.3%. Based on this value and the designed porosity introduced, the expected total porosity of the specimens was estimated. The expected total porosities corresponding to design porosities of 2%, 4%, 6%, and 8% were approximately 4.3%, 6.3%, 8.3%, and 10.3%, respectively. Skarżyński et al. [26] investigated the distribution of pores in three cross-sections of concrete specimens using high-precision X-ray computed tomography. The results showed that the pore diameters ranged from 0–4 mm, where the pores with a diameter between 0.25–2.03 mm accounted for approximately 75% of the total pore area. Based on this, in this paper, a pore size of 0.3–5 mm was chosen, with five distinct pore size categories: 0.3–0.5 mm, 0.5–1 mm, 1–2 mm, 2–3 mm, and 3–5 mm. Six specimens were prepared for each set of test conditions [27], totaling 126 specimens. In accordance with the Chinese standard GB/T 50081-2019 [28], the maximum and minimum values were excluded from each set of six data points, and the average of the remaining four data points was calculated to reduce the influence of extreme values on the experimental results, thereby ensuring the reliability of the data.
2.1. Materials and Mix Design
All coarse aggregates used were RAs, with particle sizes ranging from 5–25 mm. Table 1 shows the physical properties of RAs. The fine aggregate was natural river sand, and the water was tap water. The P.C 42.5 compound silicate cement was used, and all the cement properties comply with the Chinese standard GB175-2023 [29]. Polycarboxylic acid-based liquid high-performance water reducer was used. According to the recommended dosage range provided in the product manual (0.3–1.0% by mass of the cementitious materials), an initial dosage of 0.3% was selected. The dosage was subsequently increased in increments of 0.04% until the target slump range of 120 ± 10 mm was reached. The final dosage of the water reducer was determined to be 0.42%, which resulted in a measured slump of 124 mm. The mix design for the baseline RAC is shown in Table 2. This reference mix contains no EPS particles and has a porosity of 0%. It serves as the baseline for comparative analyses with samples of varying porosities and pore sizes, aiming to assess the impact of pore parameters on mechanical properties.

Table 1.
Physical properties of RAs.

Table 2.
Mix proportion of RAC (kg/m3).
2.2. Fabrication and Testing of Specimens
Currently, two commonly used methods are employed to create initial defects within concrete specimens: the incorporation of air-entraining agents [30] during mixing and the addition of EPS particles [31] to simulate initial pores. However, it is difficult to control the content and size of the pores introduced by using air-entraining agents [32]. To quantitatively analyze the effect of pores on the mechanical properties of RAC, initial pores were prefabricated using EPS particles in this paper. The EPS particles used are shown in Figure 1. They are composed of a stable polymeric foam derived from polystyrene and exhibit pronounced surface hydrophobicity and low density, with an internal porosity exceeding 95%. Their intrinsic mechanical strength is negligible. They were factory-produced and categorized into five particle size ranges: 0.3–0.5 mm, 0.5–1 mm, 1–2 mm, 2–3 mm, and 3–5 mm. For quantitative analysis and graphical representation, the median value of each range (i.e., approximately 0.4 mm, 0.75 mm, 1.5 mm, 2.5 mm, and 4.0 mm) was used as the representative particle size.
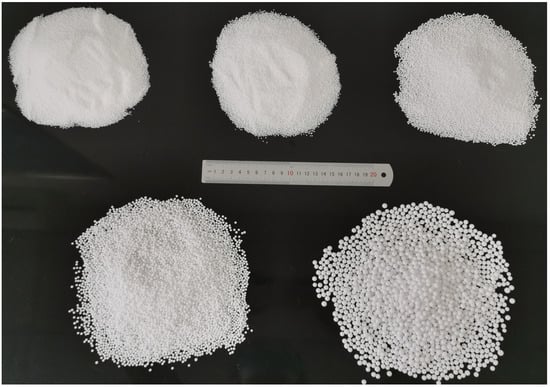
Figure 1.
EPS particles of different sizes.
The mass of EPS particles required for each condition was calculated using Equation (1). Due to the low density of EPS particles, an electronic balance with an accuracy of 0.0001 g and a glass beaker were used to weigh the EPS particles. The weighed EPS particles were then placed into a plastic bag for storage and use. It is important to note that the “porosity” in this study refers to the designed porosity, which is artificially created by incorporating different masses of EPS particles. This designed porosity does not account for the inherent porosity of RAC. Therefore, the actual total porosity of RAC is higher than the designed porosity specified in this study.
where is the mass of EPS particles, kg; is the volume of concrete, m3; and is the density of EPS particles, kg/m3.
To make the EPS particles better dispersed inside the RAC, the EPS particles were first pretreated. Some sand was wetted with water and then mixed with EPS particles so that it could be uniformly wrapped in the wet sand. Meanwhile, the method of making cement mortar first was used to utilize the cohesive property of the slurry to encapsulate the EPS particles [33], thus preventing excessive uplift of the EPS particles.
The scheme of sample preparation was as follows.
- (1)
- Prepare the required water and fine sand for the specimen. Take a portion of the fine sand and wet it with water. Add all the EPS particles to the wet sand and mix thoroughly to ensure that the EPS particles are evenly coated by the wet sand.
- (2)
- Add the remaining sand and cement sequentially to the concrete mixer and dry mix for 1.5 min.
- (3)
- Add 60% of the water and all of the water-reducing agent to the concrete mixer, then mix for 1.5 min to form a slurry-like cement mortar.
- (4)
- Add the mixture of EPS particles and wet sand from the first step to the concrete mixer, and mix for 1.5 min.
- (5)
- Add RAs and the remaining water to the concrete mixer, and mix for 3 min.
Then, the mixture was poured into the plastic mold with the dimensions of 100 mm × 100 mm × 300 mm and vibrated on a concrete magnetic vibration table for 20~22 s. The EPS particles vibrated on the surface were scraped back into the mold using a spatula. The surface of the specimen was then gradually leveled by tapping around the mold with a rubber mallet. Afterward, the specimen’s surface was covered with a layer of cling film (Figure 2a). The specimens were unmolded after being placed in the laboratory environment for 24 h. Subsequently, the unmolded specimens were placed in the standard curing room for curing (Figure 2b).
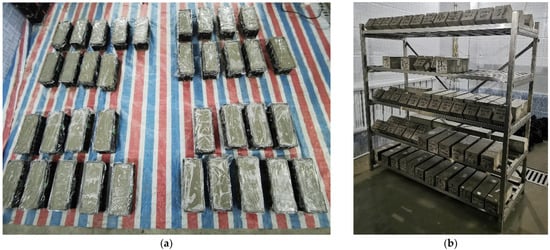
Figure 2.
The process of specimen production: (a) specimens covered with cling film; (b) curing of specimens.
To verify the effectiveness of this process, a portion of the specimen was broken. To enhance the visibility of the EPS particles, the broken surface was wetted with water (Figure 3). It can be observed that the EPS particles within the sample exhibit a dispersed pattern with no obvious aggregation, closely resembling the naturally formed “initial pore” state. However, this observation is primarily based on qualitative judgment and has not yet been quantified using image analysis or porosity measurements.
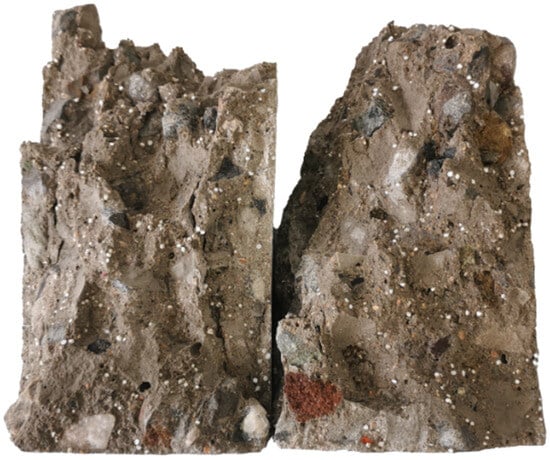
Figure 3.
Dispersion of EPS particles inside the RAC specimen.
The experimental setup is shown in Figure 4. The experimental procedure followed the method by Xiao et al. [34]. Axial compression tests were conducted using an electro-hydraulic servo testing machine under displacement-controlled loading at a rate of 0.2 mm/min. The axial load was automatically recorded by the testing system during loading, while axial deformation was simultaneously measured using two LVDT sensors mounted at both sides of the specimen. Stress–strain curves for prismatic specimens were recorded. The peak load calculated axial compressive strength, and the slope of the line from the origin to 40% of the peak stress determined the modulus of elasticity.
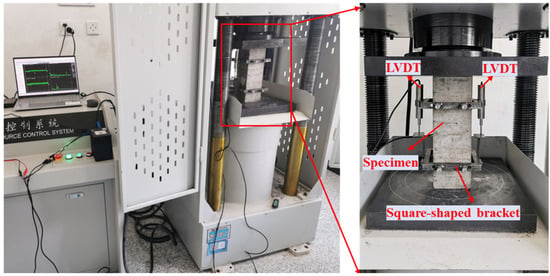
Figure 4.
Test equipment.
In addition, calculations were performed for strength reduction and elastic modulus reduction. The definitions of strength reduction and elastic modulus reduction are given by Equation (2) and Equation (3), respectively. Prior to the formal test [35], a pre-compression test was conducted to prevent the test results from being affected by leaving a gap between the test machine’s indenter and the specimen.
where is the strength of RAC with different porosities or pore sizes, and denotes the strength of RAC without prefabricated pores ().
where represents the elastic modulus of RAC with different porosities or pore sizes, and denotes the elastic modulus of RAC without prefabricated pores ().
2.3. High-Energy X-Ray CT Scanning
To further investigate the influence of pores on crack development in RAC under loading, the specimen after axial compression was scanned using a self-developed high-energy X-ray CT (Figure 5). The equipment can be switched between energy levels of 6 MeV and 9 MeV, thus enabling the scanning of large-sized specimens. In addition, considering the wide variety of specimens, a specimen with a pore diameter of 2–3 mm and a porosity of 8% was selected for scanning, based on considerations of crack development and the scanning resolution of the high-energy X-ray CT system. The scanning parameters for this equipment are provided in Table 3. During the scanning process, the specimen remained stationary while the detector and X-ray source performed a full 360° scan around it.
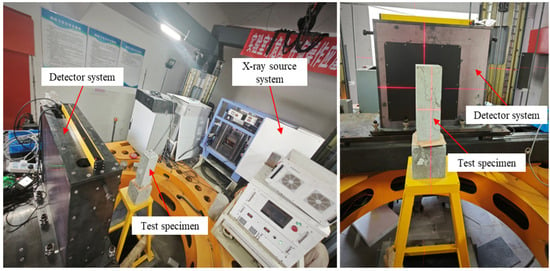
Figure 5.
High-energy X-ray CT scanning process.

Table 3.
High energy X-ray CT scanning parameters.
3. Results
3.1. Damage Patterns of RAC with Prefabricated Pores
Figure 6 shows the damage morphology of RAC with initial pores at different pore sizes under axial compressive loading. It can be observed that smaller pore sizes result in a higher number of surface cracks in RAC, and there are some fine and dense cracks. Conversely, with larger pore sizes, the number of surface cracks decreases, and penetrating diagonal cracks are more likely to form when the specimen is damaged. This is due to the presence of pores, which cause stress concentrations in both the pores and adjacent weak zones, thereby becoming potential crack initiation sites. When the porosity is the same, large pores are larger in size but fewer in number compared to small pores. When the specimen is subjected to external loading to produce cracks and propagate inside the specimen, the existence of large pores makes the cracks propagate with less resistance, making it more likely for cracks to connect between the pores. As a result, the overall number of cracks decreases, which makes it more likely to form a through-crack and ultimately leading to the failure of the RAC [36].
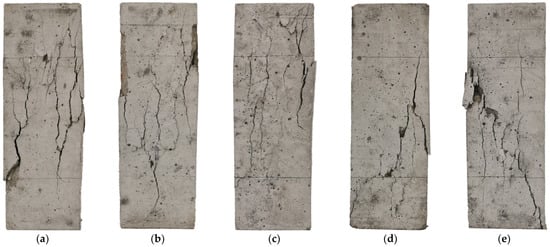
Figure 6.
Damage patterns of RAC specimens with various pore sizes (): (a) 0.3–0.5 mm; (b) 0.5–1 mm; (c) 1–2 mm; (d) 2–3 mm; (e) 3–5 mm.
3.2. Effect of Porosity on Macromechanical Properties of RAC
Axial compressive strength is one of the most intuitive mechanical indicators to study the degree of destruction of RAC by porosity. Currently, many studies quantitatively analyze the relationship between strength and porosity in concrete materials. Most of these studies propose prediction formulas based on semi-empirical equations, such as linear [17,37], exponential [38], logarithmic [15], and power functions [39]. However, unlike ordinary concrete, RAC is special in that it is made from RAs that partially or completely replace NAs. Figure 7 shows the comparison between RAs and NAs. It can be observed that the surfaces of the RAs are not only covered with a layer of old mortar but also contain natural pores. From an experimental perspective, developing an empirical formula that correlates porosity with the strength of RAC is crucial for its further application in construction projects. Therefore, the relationship between strength, strength reduction, and porosity of RAC was quantitatively analyzed. The fitting results are shown in Figure 8 and Figure 9. The fitting equations indicate that there is a linear relationship between the strength, strength reduction, and porosity of RAC. As shown, under the same pore sizes, the axial compressive strength decreases with the increase in the porosity, while strength reduction increases, reaching a maximum value of 34.02%.
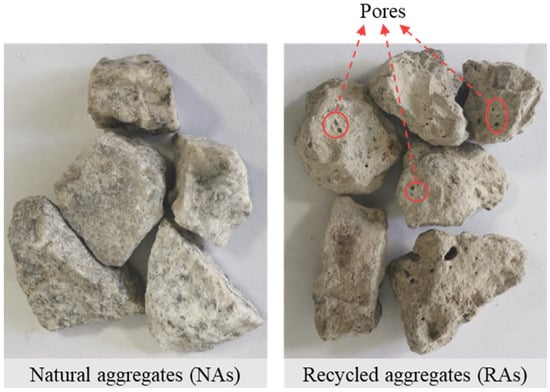
Figure 7.
Comparison between NAs and RAs.
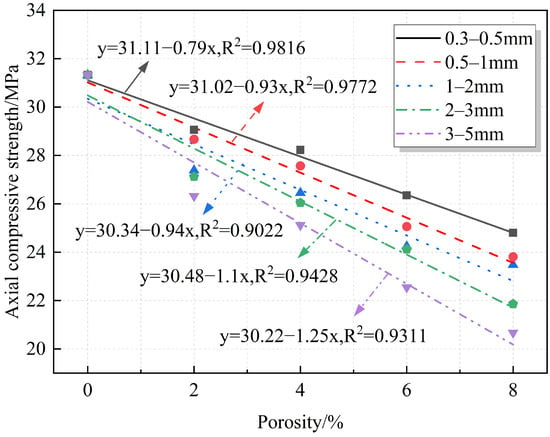
Figure 8.
Fitted relationship between porosity and axial compressive strength.
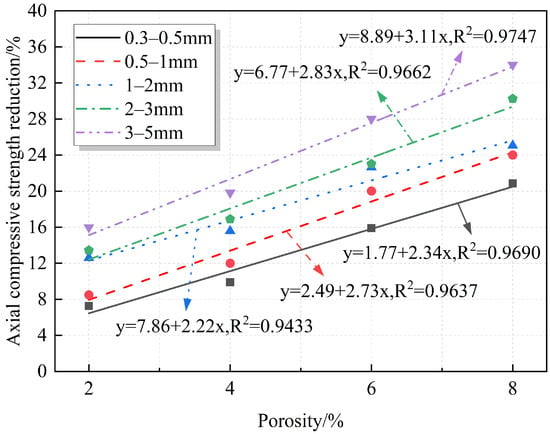
Figure 9.
Fitted relationship between porosity and axial compressive strength reduction.
The elastic modulus measures the ability of a material to resist elastic deformation and is strongly correlated with both the elastic modulus and surface characteristics of the aggregates [40]. Therefore, due to the porous properties of RAs, the elastic modulus of RAC specimens is affected not only by the internal porosity of the specimen but also by the RAs. Figure 7 shows that pores of different sizes are distributed on the crushed RAs from the actual project. Therefore, it is necessary to study the relationship between the elastic modulus of RAC and porosity from an experimental perspective.
The relationships between elastic modulus, modulus reduction, and porosity are quantified and plotted in Figure 10 and Figure 11, respectively. The elastic modulus and elastic modulus reduction exhibit a linear relationship with porosity. The figures show that the elastic modulus gradually decreases with increasing porosity, with the reduction reaching a maximum of 21.45%. This is because, despite the porous surface of RAs, their elastic modulus remains high compared to that of the prefabricated pores. The elastic modulus of the prefabricated pores, which are composed of air, is very small or even almost negligible. Therefore, the introduction of prefabricated pores weakens the mortar properties and reduces the overall stiffness of the specimen.
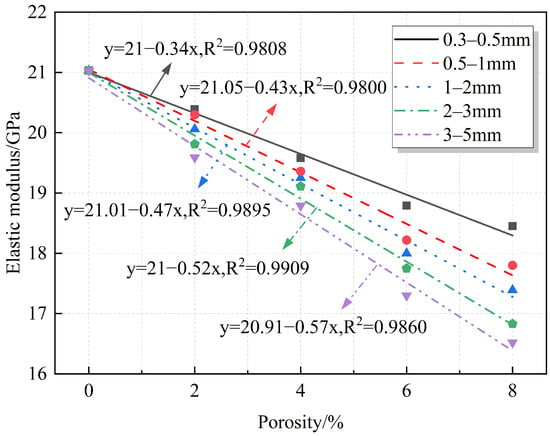
Figure 10.
Fitting relationship between porosity and elastic modulus.
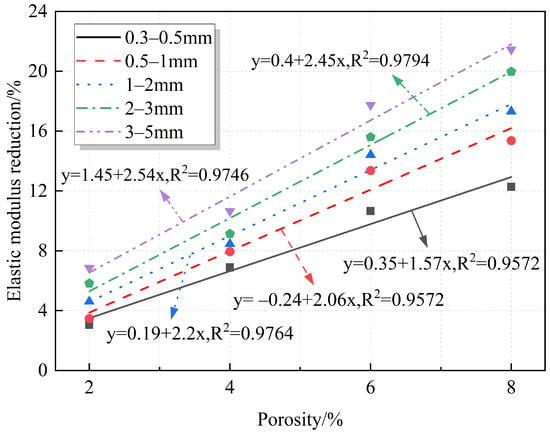
Figure 11.
Fitting relationship between porosity and elastic modulus reduction.
Within the porosity range studied in this research (2–8%), the prefabricated pores are predominantly isolated and randomly distributed, without forming interconnected large pores or macroscopic crack networks. Therefore, the weakening effect of porosity on mechanical properties is uniform and gradual, rather than leading to sudden failure. Consequently, macroscopic mechanical parameters such as axial compressive strength and elastic modulus exhibit an approximately linear decreasing trend with increasing porosity.
3.3. Effect of Pore Size on Macromechanical Properties of RAC
A quantitative analysis of the relationships between pore size and compressive strength and strength reduction is provided, with the results summarized in Figure 12 and Figure 13. At the same porosity, the strength decreases gradually with increasing pore size, and the strength reduction increases accordingly. The fitting equations reveal an exponential relationship between pore size and both axial compressive strength and strength reduction. From Figure 13, for the same porosity, the strength reduction increases with the increase in pore size, but the increase gradually slows down. This indicates that the compressive strength is more sensitive to small pore sizes, and the decrease in compressive strength is more obvious in the range of small pore sizes. For example, when the porosity is 8% and the pore sizes are 0.3–0.5 mm and 0.5–1 mm, the decrease in the compressive strength is 20.85% and 24%, respectively. When the pore size is 3–5 mm, the strength reduction is 34.02%. At this point, the average pore size increased by 10 times and 5.33 times, respectively, while the compressive strength reduction only increased by 1.63 times and 1.42 times, respectively. The strength reduction does not show the same proportion with the increase in pore size increase and a large difference between the two. This may be because, at the same porosity, the smaller the pore size, the larger the number of pores, which are more likely to be distributed in the weak zones between the mortar and the aggregate, or at the interfaces between the old and new mortar, resulting in a more sensitive change of the strength at smaller pore sizes.
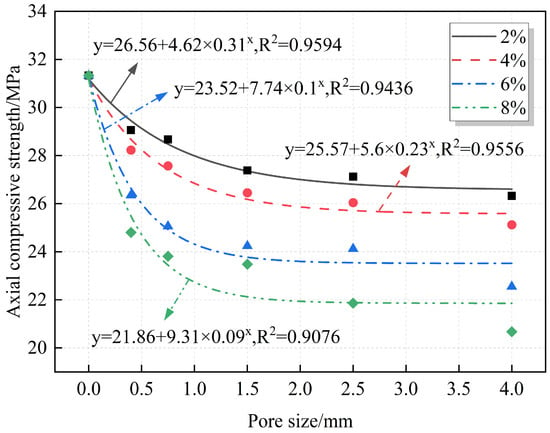
Figure 12.
Fitting relationship between pore size and axial compressive strength.
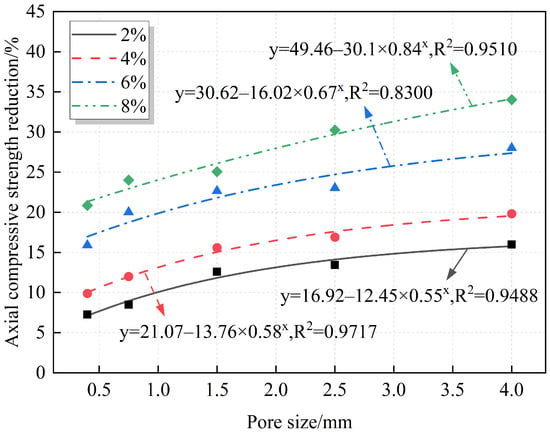
Figure 13.
Fitting relationship between pore size and axial compressive strength reduction.
A quantitative analysis of the relationships between the elastic modulus, modulus reduction, and pore size is summarized in Figure 14 and Figure 15. The fitting results indicate that both the elastic modulus and modulus reduction follow an exponential relationship with pore size. Under the same porosity, the elastic modulus decreases gradually as pore size increases, while the modulus reduction increases with pore size.
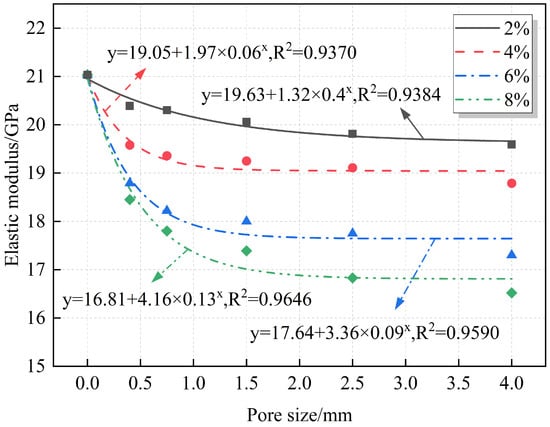
Figure 14.
Fitting relationship between pore size and elastic modulus.
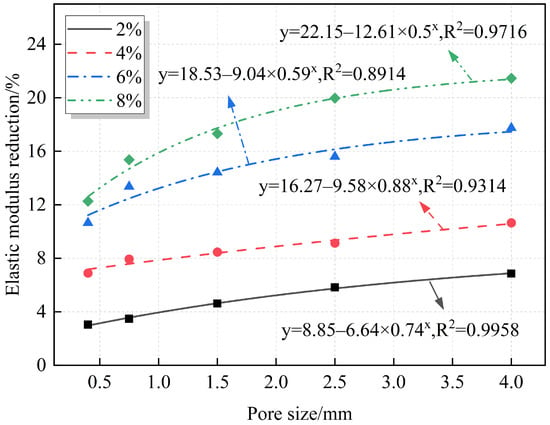
Figure 15.
Fitting relationship between pore size and elastic modulus reduction.
The relationship between pore size and mechanical properties exhibits a distinct nonlinear characteristic. This nonlinear behavior primarily arises from the enhanced local stress concentration effect at pore edges. As pore size increases, stress concentration in the pore edge regions intensifies, making cracks more likely to form and propagate along the pore edges. These phenomena reflect the typical nonlinear evolution mechanism of local damage, ultimately leading to an exponential decline in macroscopic mechanical properties such as axial compressive strength and elastic modulus with increasing pore size.
3.4. CT Scanning Results
Figure 16 presents the scanned images of different longitudinal sections of RAC with prefabricated pores. In the figure, d represents the distance of any longitudinal section from the bottom surface of the specimen. The figure shows that the distribution of prefabricated pores in the different longitudinal sections is relatively uniform, confirming the effectiveness of the pore prefabrication method used in this study. Additionally, although the distribution of cracks varies across the longitudinal sections, the cracks in all sections predominantly propagate through the pores or along their edges. This suggests that the presence of pores not only creates weak points within the RAC but also significantly alters its internal stress distribution, thereby affecting the crack propagation path and accelerating the degradation of its macroscopic mechanical properties.
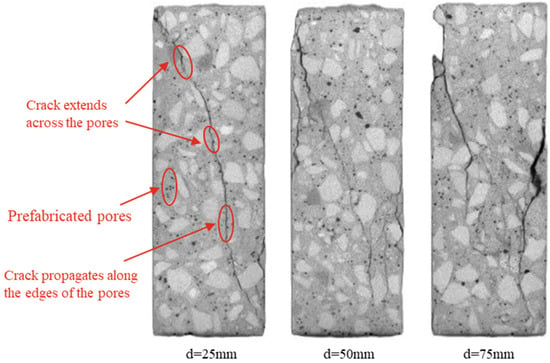
Figure 16.
CT images of longitudinal sections at with pore size of 2–3 mm.
4. Correlation Analysis of Pore Structure and Macroscopic Mechanical Parameters Based on Gray Correlation Theory
According to Section 3.2 and Section 3.3, the effects of porosity and pore size on the macro-mechanical parameters were analyzed separately, and both have a strong influence on these parameters. However, it remains unclear which of the two exerts a greater influence. Gray correlation analysis (GCA) is a branch of gray system theory. GCA finds the degree of similarity or dissimilarity of the development trend of each influencing factor through quantitative methods, obtains the mathematical relationship between these factors, and identifies the most significant ones [41]. The advantage of GCA lies in its ability to accurately assess the correlation between factors using minimal data and simpler calculations [42]. Therefore, in this section, GCA is applied to analyze the degree of correlation between porosity, pore size, and macroscopic mechanical parameters, specifically focusing on the compressive strength and the elastic modulus, and the degree of influence is quantitatively evaluated. The calculation steps for GCA are as follows:
- (1)
- We identify the reference and comparison sequences.
The data sequence reflecting the behavioral characteristics of the system is defined as the reference sequence , which can be represented by Equation (4).
The sequence composed of factors affecting the behavioral characteristics of the system is defined as the comparison sequence , which can be represented by Equation (5).
- (2)
- The initial value transformation method [43] is used to obtain and . We nondimensionalize the reference sequence and comparison sequence , respectively, as shown in Equations (6) and (7).
- (3)
- We calculate the absolute difference between and as shown in Equation (8).
- (4)
- We calculate the gray correlation coefficient as shown in Equation (9).
- (5)
- We calculate the degree of gray correlation as shown in Equation (10).
Based on the above theory, the compressive strength and elastic modulus are taken as the reference sequence, respectively. The strength is denoted as , and the elastic modulus is denoted as . Porosity and pore size are taken as the comparison sequences, with porosity denoted as and pore size as . The gray correlation of porosity and pore size on the macro-mechanical parameters is illustrated in Figure 17. The gray correlation of porosity and pore size with axial compressive strength are 0.7688 and 0.6458, respectively, while the gray correlation with the elastic modulus are 0.7719 and 0.6467, respectively. Porosity and pore size have a significant effect on both strength and elastic modulus. While most studies [44,45,46] focus on the weakening effect of porosity on the mechanical properties of materials, the results of this study confirm the influence of pore size. Therefore, in addition to considering total porosity, the influence of pore size on the macroscopic mechanical properties should also receive attention. In addition, the influence of porosity on both the strength and modulus of elasticity of RAC was significantly greater than that of pore size.
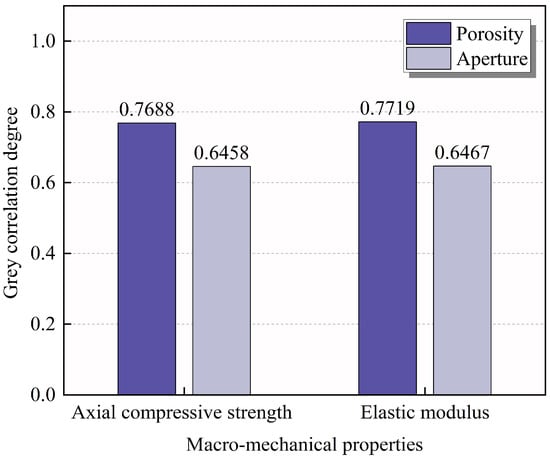
Figure 17.
Grey correlation degree of pore structure properties with compressive strength and elastic modulus.
5. Combined Effect of Porosity and Pore Size
The response of the macroscopic mechanical properties reflect the degree of deterioration within the concrete material [47]. Damage mechanics theory can be applied to investigate the macro-mechanical degradation of concrete, which results from the formation and growth of internal defects under external forces. The damage variable can be used to describe the effect of internal cracks, pores, and other damage on the macro-mechanical parameters, thereby quantitatively characterizing the degree of material deterioration. To further analyze the combined effect of porosity and pore size, this section introduces the damage variable , . The variable is used to characterize the degree of damage to the macroscopic mechanical parameters of the material at different porosities and pore sizes. When = 1, the material is fully damaged. When = 0, the material is undamaged. The damage degree of compressive strength and elastic modulus are illustrated in Equations (11) and (12), respectively.
where represents the strength of RAC with prefabricated pores, and represents the strength of the RAC without prefabricated pores.
where represents the elastic modulus of RAC with prefabricated pores, and represents the elastic modulus of RAC without prefabricated pores.
To further analyze the combined effect of porosity and pore size on the mechanical properties, the changes in compressive strength and elastic modulus under the influence of both factors are shown in Figure 18 and Figure 19, respectively. Additionally, the relationships between the combined effect of porosity and pore size on the strength and elastic modulus damage degree of RAC are plotted according to Equations (11) and (12), as shown in Figure 20 and Figure 21. According to Figure 18 and Figure 20, it can be found that when considering the combined effects of pore size and porosity, the axial compressive strength reaches its minimum value when both porosity and pore size are high. In this case, the compressive strength decreases most significantly, and the degree of damage to strength reaches its maximum value of 0.3403. The simultaneous increase in both porosity and pore size significantly negatively affects compressive strength. Furthermore, the degree of compressive strength damage is higher for the combination of small pore size and high porosity than for the combination of large pore size and low porosity. For example, when the pore size is 0.3–0.5 mm and the porosity is 8%, the damage degree of compressive strength is 0.2084. In contrast, when the pore size is 3–5 mm and the porosity is 2%, the damage degree of compressive strength is 0.1599.
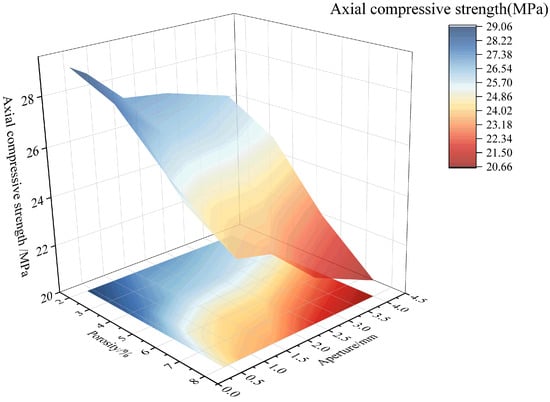
Figure 18.
Combined effect of porosity and pore size on axial compressive strength.
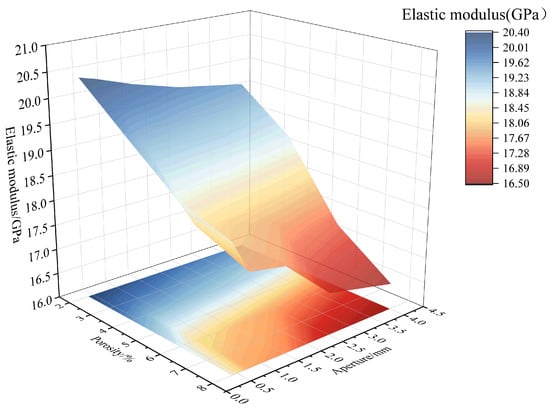
Figure 19.
Combined effect of porosity and pore size on elastic modulus.
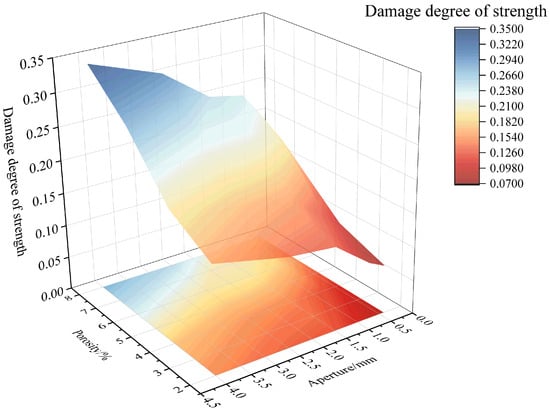
Figure 20.
Combined effect of porosity and pore size on damage degree of strength.
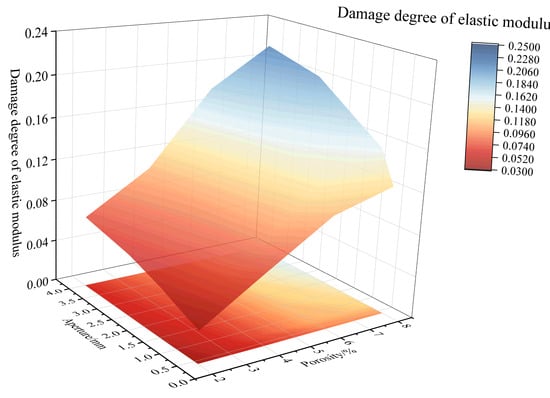
Figure 21.
Combined effect of porosity and pore size on damage degree of elastic modulus.
Observing Figure 19 and Figure 21, considering the combined effect of porosity and pore size, as the porosity and pore size increase, the decrease in the elastic modulus becomes more significant, and the degree of damage to the elastic modulus increases. At the combination of high porosity and large pore size, the elastic modulus reaches its minimum value, and the damage degree of the elastic modulus reaches its maximum value of 0.2145. Furthermore, the elastic modulus damage degree is higher for the combination of small pore size and high porosity than for the combination of large pore size and low porosity. For example, when the pore size is 0.3–0.5 mm and the porosity is 8%, the elastic modulus damage degree is 0.1227. In contrast, when the pore size is 3–5 mm and the porosity is 2%, the elastic modulus damage degree is 0.0685.
6. Conclusions
This study investigates the influences of porosity and pore size on the mechanical properties of RAC through axial compression tests. A quantitative analysis was conducted to explore the relationships between porosity, pore size, and macro-mechanical parameters. The crack development influenced by pores was analyzed using high-energy X-ray CT. The influences of porosity and pore size on these macro-mechanical properties were evaluated using gray correlation analysis. Additionally, the combined effect of porosity and pore size on the macro-mechanical performance was assessed in terms of the degree of damage. The key findings are as follows:
- (1)
- The strength decreases as porosity and pore size increase, while the strength reduction increases. The strength reduction reaches a maximum of 34.02% when the porosity is 8% and the pore size is 3–5 mm. In addition, both the axial compressive strength and its reduction exhibit a linear relationship with the porosity and an exponential relationship with the pore size.
- (2)
- The elastic modulus of RAC decreases as porosity and pore size increase, while the reduction in elastic modulus increases. The elastic modulus reduction reaches a maximum of 21.45% when the porosity is 8% and the pore size is 3–5 mm. In addition, both the elastic modulus and its reduction exhibit a linear relationship with the porosity and an exponential relationship with the pore size.
- (3)
- CT images reveal that cracks within the specimen predominantly propagate through the pores or along their edges.
- (4)
- Gray correlation analysis reveals that both porosity and pore size significantly influence the strength and elastic modulus. The effects of porosity on strength and elastic modulus are notably greater than those of pore size.
- (5)
- When the porosity is 8% and the pore size is 3–5 mm, i.e., under the combined effect of high porosity and large pore size, the degrees of damage to both the strength and elastic modulus of RAC reach their maximum values, which are 0.3403 and 0.2145, respectively. The simultaneous increase in both porosity and pore size has a significant negative impact on the macro-mechanical properties. Furthermore, the damage to strength and elastic modulus is greater with the combination of small pore size and high porosity than with the combination of large pore size and low porosity.
Author Contributions
Conceptualization, C.Z. and B.W.; methodology, C.Z.; validation, J.L., T.Y. and Z.Z.; data curation, C.Z.; writing—original draft preparation, C.Z.; writing—review and editing, C.Z. and E.Z.; supervision, E.Z.; funding acquisition, E.Z. All authors have read and agreed to the published version of the manuscript.
Funding
This research was funded by the National Natural Science Foundation of China, grant number 52172335.
Institutional Review Board Statement
Not applicable.
Informed Consent Statement
Not applicable.
Data Availability Statement
The original contributions presented in the study are included in the article. Further inquiries can be directed to the corresponding author.
Conflicts of Interest
The authors declare no conflicts of interest.
References
- Wijayasundara, M.; Mendis, P.; Crawford, R.H. Integrated assessment of the use of recycled concrete aggregate replacing natural aggregate in structural concrete. J. Clean. Prod. 2018, 174, 591–604. [Google Scholar] [CrossRef]
- Wang, B.; Yan, L.; Fu, Q.; Kasal, B. A comprehensive review on recycled aggregate and recycled aggregate concrete. Resour. Conserv. Recycl. 2021, 171, 105565. [Google Scholar] [CrossRef]
- Hossain, M.; Poon, C.; Lo, I.; Cheng, J. Comparative environmental evaluation of aggregate production from recycled waste materials and virgin sources by LCA. Resour. Conserv. Recycl. 2016, 109, 67–77. [Google Scholar] [CrossRef]
- Ohemeng, E.A.; Ekolu, S.O. Comparative analysis on costs and benefits of producing natural and recycled concrete aggregates: A South African case study. Case Stud. Constr. Mater. 2020, 13, e00450. [Google Scholar] [CrossRef]
- Silva, R.; De Brito, J.; Dhir, R. Use of recycled aggregates arising from construction and demolition waste in new construction applications. J. Clean. Prod. 2019, 236, 117629. [Google Scholar] [CrossRef]
- Zhou, S.; Sheng, W.; Wang, Z.; Yao, W.; Huang, H.; Wei, Y.; Li, R. Quick image analysis of concrete pore structure based on deep learning. Constr. Build. Mater. 2019, 208, 144–157. [Google Scholar] [CrossRef]
- Kumar, R.; Bhattacharjee, B. Porosity, pore size distribution and in situ strength of concrete. Cem. Concr. Res. 2003, 33, 155–164. [Google Scholar] [CrossRef]
- Talaat, A.; Emad, A.; Kohail, M. Environmental impact assessment for performance-oriented geopolymer concrete research. J. Mater. Civ. Eng. 2023, 35, 04022370. [Google Scholar] [CrossRef]
- Xiao, J.; Lv, Z.; Duan, Z.; Zhang, C. Pore structure characteristics, modulation and its effect on concrete properties: A review. Constr. Build. Mater. 2023, 397, 132430. [Google Scholar] [CrossRef]
- Jivkov, A.P.; Engelberg, D.L.; Stein, R.; Petkovski, M. Pore space and brittle damage evolution in concrete. Eng. Fract. Mech. 2013, 110, 378–395. [Google Scholar] [CrossRef]
- Gu, X.; Hong, L.; Wang, Z.; Lin, F. A modified rigid-body-spring concrete model for prediction of initial defects and aggregates distribution effect on behavior of concrete. Comput. Mater. Sci. 2013, 77, 355–365. [Google Scholar] [CrossRef]
- Cui, W.; Liu, M.M.; Song, H.F.; Guan, W.; Yan, H.M. Influence of initial defects on deformation and failure of concrete under uniaxial compression. Eng. Fract. Mech. 2020, 234, 107106. [Google Scholar] [CrossRef]
- Lu, J.X.; Shen, P.L.; Zheng, H.B.; Zhan, B.J.; Ali, H.A.; He, P.P.; Poon, C.S. Synergetic recycling of waste glass and recycled aggregates in cement mortars: Physical, durability and microstructure performance. Cem. Concr. Compos. 2020, 113, 103632. [Google Scholar] [CrossRef]
- Wang, J.; Zhang, J.; Cao, D. Pore characteristics of recycled aggregate concrete and its relationship with durability under complex environmental factors. Constr. Build. Mater. 2021, 272, 121642. [Google Scholar] [CrossRef]
- Li, L.G.; Feng, J.J.; Zhu, J.; Chu, S.H.; Kwan, A.K.H. Pervious concrete: Effects of porosity on permeability and strength. Mag. Concr. Res. 2021, 73, 69–79. [Google Scholar] [CrossRef]
- Liu, Y.; Wang, G.; Yang, T.; Qiao, H.; Yu, L.; Ren, T.J.S.R. Study on the effect of porosity and aperture on the damage characterization of rock-filled concrete (RFC). Sci. Rep. 2024, 14, 28764. [Google Scholar] [CrossRef]
- Zhang, G.; Wei, X.; Yang, Z.; Gu, Y.; Wang, M. Influence of mesoscopic initial pore defects on mechanical properties of concrete. J. Build. Mater. 2024, 27, 425–431. [Google Scholar] [CrossRef]
- Chen, H.; Xu, B.; Mo, Y.; Zhou, T. Behavior of meso-scale heterogeneous concrete under uniaxial tensile and compressive loadings. Constr. Build. Mater. 2018, 178, 418–431. [Google Scholar] [CrossRef]
- Zhang, L.; Sun, X.; Xie, H.; Feng, J. Three-dimensional mesoscale modeling and failure mechanism of concrete with four-phase. J. Build. Eng. 2023, 64, 105693. [Google Scholar] [CrossRef]
- Wang, J.; Wang, M.; Tao, J. The effects of stochastic circular pores on splitting tensile behavior of concrete based on the multifractal theory. Fractal Fract. 2023, 7, 507. [Google Scholar] [CrossRef]
- Zhang, L.; Xie, H.; Feng, J. Mesoscale modeling and failure mechanism of concrete considering pore structures and actual aggregate shapes. Constr. Build. Mater. 2022, 353, 129133. [Google Scholar] [CrossRef]
- Peng, C.; Li, G.D.; Jin, F.; Zhao, Z.M. Research and application of random aggregate model in determining the fracture behavior of four-point bending beam with notch. Constr. Build. Mater. 2019, 202, 276–289. [Google Scholar] [CrossRef]
- Wang, X.F.; Yang, Z.J.; Yates, J.R.; Jivkov, A.; Zhang, C. Monte Carlo simulations of mesoscale fracture modelling of concrete with random aggregates and pores. Constr. Build. Mater. 2015, 75, 35–45. [Google Scholar] [CrossRef]
- Xie, C.; Wang, Q.; Li, S.; Hui, B. Relations of pore fractral dimension to pore structure and compressive strength of concrete under different water to binder ratio and curing condition. Bull. Chin. Ceram. Soc. 2015, 34, 3695–3702. [Google Scholar] [CrossRef]
- Chen, Y.; Ning, Y.; Chen, X.; Xuan, W.; Guo, Y. Materials, Experimental investigation on the effect of curing condition and admixture on meso-structure of recycled aggregate concrete based on X-ray CT. Int. J. Concr. Struct. Mater. 2023, 17, 11. [Google Scholar] [CrossRef]
- Skarżyński, Ł.; Tejchman, J. Experimental investigations of fracture process in concrete by means of X-ray micro-computed tomography. Strain 2016, 52, 26–45. [Google Scholar] [CrossRef]
- Sánchez-Mendieta, C.; Galán-Díaz, J.J.; Martinez-Lage, I.J.J.O.B.E. Relationships between density, porosity, compressive strength and permeability in porous concretes: Optimization of properties through control of the water-cement ratio and aggregate type. J. Build. Eng. 2024, 97, 110858. [Google Scholar] [CrossRef]
- GB/T 50081-2019; Standard for Test Methods of Concrete Physical and Mechanical Properties. National Standard of the People’s Republic of China: Beijing, China, 2019.
- GB175-2023; Common Portland Cement. National Standard of the People’s Republic of China: Beijing, China, 2023.
- Li, W.; Gao, H.; Zhang, X.; Liu, J.; Ma, Y. Numerical and experimental investigation on the effects of mesostructures on the mechanical behavior and failure pattern in concrete. Constr. Build. Mater. 2022, 327, 127005. [Google Scholar] [CrossRef]
- Gao, Y.; Sun, H. Influence of initial defects on crack propagation of concrete under uniaxial compression. Constr. Build. Mater. 2021, 277, 122361. [Google Scholar] [CrossRef]
- Chen, Y.; Al-Neshawy, F.; Punkki, J. Investigation on the effect of entrained air on pore structure in hardened concrete using MIP. Constr. Build. Mater. 2021, 292, 123441. [Google Scholar] [CrossRef]
- Dixit, A.; Pang, S.D.; Kang, S.H.; Moon, J. Lightweight structural cement composites with expanded polystyrene (EPS) for enhanced thermal insulation. Cem. Concr. Compos. 2019, 102, 185–197. [Google Scholar] [CrossRef]
- Xiao, J.; Zhang, K.; Akbarnezhad, A. Variability of stress-strain relationship for recycled aggregate concrete under uniaxial compression loading. J. Clean. Prod. 2018, 181, 753–771. [Google Scholar] [CrossRef]
- Zhao, M.Z.; Geng, Y.; Wang, Y.Y.; Hu, J.X. Compounding effect and an expanded theoretical model for recycled coarse and fine aggregate concretes under uniaxial loading. Constr. Build. Mater. 2022, 320, 126226. [Google Scholar] [CrossRef]
- Zhang, S.; Cao, K.; Wang, C.; Wang, X.; Deng, G.; Wei, P. Influence of the porosity and pore size on the compressive and splitting strengths of cellular concrete with millimeter-size pores. Constr. Build. Mater. 2020, 235, 117508. [Google Scholar] [CrossRef]
- Zhong, R.; Wille, K. Compression response of normal and high strength pervious concrete. Constr. Build. Mater. 2016, 109, 177–187. [Google Scholar] [CrossRef]
- Chindaprasirt, P.; Hatanaka, S.; Mishima, N.; Yuasa, Y.; Chareerat, T. Effects of binder strength and aggregate size on the compressive strength and void ratio of porous concrete. Int. J. Min. Met. Mater. 2009, 16, 714–719. [Google Scholar]
- Deo, O.; Neithalath, N. Compressive behavior of pervious concretes and a quantification of the influence of random pore structure features. Mater. Sci. Eng. A 2010, 528, 402–412. [Google Scholar] [CrossRef]
- Li, L.S.; Li, H.J.; Yang, Z.Q.; Shi, H.N.; Dong, H.L. Control method and prediction model for concrete elastic modulus based on coarse aggregate. Mater. Rep. 2024, 1–29. [Google Scholar] [CrossRef]
- Zhou, M.; Dong, W. Grey correlation analysis of macro-and micro-scale properties of aeolian sand concrete under the salt freezing effect. Structures 2023, 58, 105551. [Google Scholar] [CrossRef]
- Su, A.; Yin, H. Grey correlation analysis of asphalt-aggregate adhesion with high and low-temperature performance of asphalt mixtures. Case Stud. Constr. Mater. 2024, 21, e03765. [Google Scholar] [CrossRef]
- Song, W.; Zhang, M.; Wu, H. Gray correlation analysis between mechanical performance and pore characteristics of permeable concrete. J. Build. Eng. 2024, 86, 108793. [Google Scholar] [CrossRef]
- Chen, C.; Zhang, Q.; Keer, L.M.; Yao, Y.; Huang, Y. The multi-factor effect of tensile strength of concrete in numerical simulation based on the Monte Carlo random aggregate distribution. Constr. Build. Mater. 2018, 165, 585–595. [Google Scholar] [CrossRef]
- Zhang, Y.; Xia, X.; Wu, Z.; Zhang, Q. The effect of initial defects on overall mechanical properties of concrete material. Comput. Mater. Contin. 2020, 62, 413–442. [Google Scholar] [CrossRef]
- Vu, V.H.; Tran, B.V.; Le, B.A.; Nguyen, H.Q. Prediction of the relationship between strength and porosity of pervious concrete: A micromechanical investigation. Mech. Res. Commun. 2021, 118, 103791. [Google Scholar] [CrossRef]
- Li, Y.; Guo, H.; Zhou, H.; Li, Y.; Chen, J. Damage characteristics and constitutive model of concrete under uniaxial compression after Freeze-Thaw damage. Constr. Build. Mater. 2022, 345, 128171. [Google Scholar] [CrossRef]
Disclaimer/Publisher’s Note: The statements, opinions and data contained in all publications are solely those of the individual author(s) and contributor(s) and not of MDPI and/or the editor(s). MDPI and/or the editor(s) disclaim responsibility for any injury to people or property resulting from any ideas, methods, instructions or products referred to in the content. |
© 2025 by the authors. Licensee MDPI, Basel, Switzerland. This article is an open access article distributed under the terms and conditions of the Creative Commons Attribution (CC BY) license (https://creativecommons.org/licenses/by/4.0/).