3.1. MD
3.1.1. Basic Principles of MD
MD is a computational simulation technique grounded in classical mechanics, designed to model many-body systems composed of numerous interacting particles. This method assumes that each particle within the system adheres to Newton’s laws of motion under the influence of a classical force field. By calculating the positions and interactions of particles, the specified initial conditions such as initial positions, velocities, and temperature are incorporated into the equations of Newtonian mechanics to determine the velocities and positional coordinates of particles at any given time point in the simulated system [
14]. The fundamental principle underlying MD lies in the numerical integration of Newton’s equations of motion, which enables the simulation of molecular system dynamics. Newton’s second law is expressed as
F(
X) =
ma =
, where
m represents the particle’s mass,
a is acceleration,
F is the force acting on the particle, and
p is the particle’s momentum. This paper investigates the mapping between the diffusion characteristics of WMA-R and the high-/low-temperature performance of mixtures based on MD.
There are many algorithms for solving Newton’s equations of motion, including the Verlet algorithm, velocity-Verlet algorithm, leap-frog algorithm, Gear predictor-corrector method, integration algorithms, and Beeman algorithm. Commonly used integration algorithms include:
Verlet algorithm: This offers high computational efficiency and achieves good accuracy with low computational cost, but performs less precisely in handling high-frequency vibrational modes.
Leap-frog algorithm: This second-order accuracy method is suitable for large-scale system simulations but shows weaker adaptability to complex systems compared to higher-order algorithms.
Velocity-Verlet algorithm: Known for its fast computation speed, high accuracy, and good stability, it is widely used in current applications.
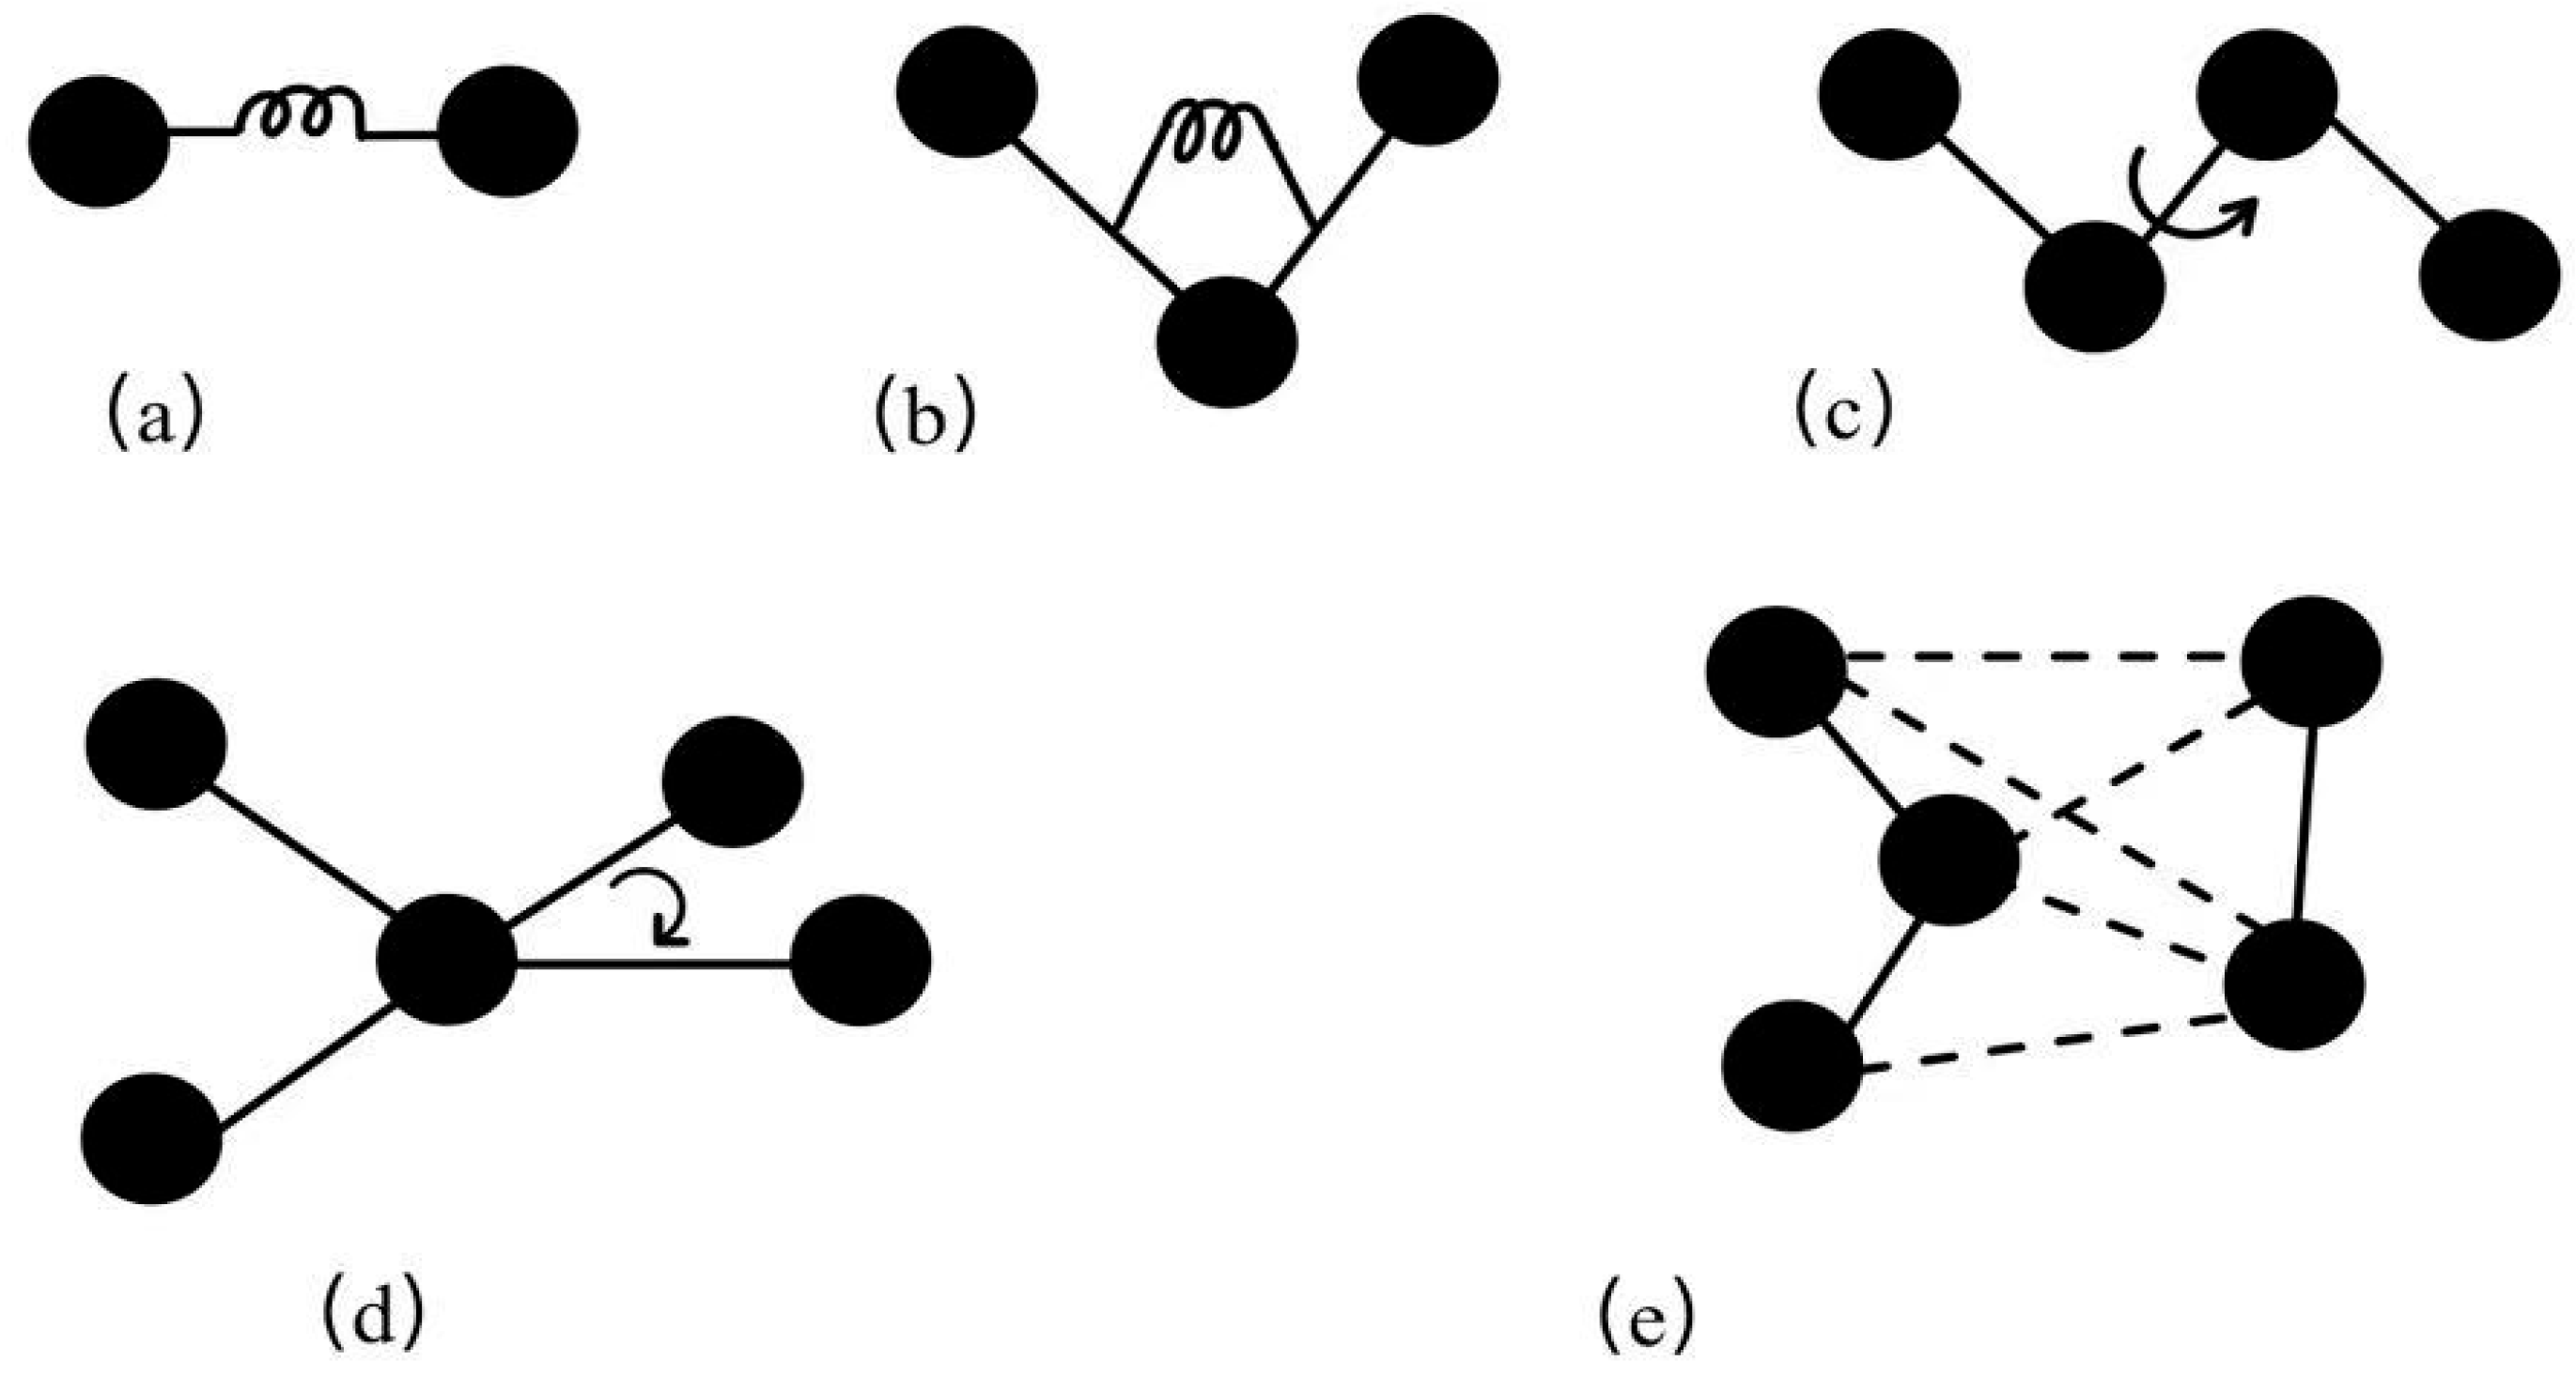
A molecular force field is a mathematical model describing intermolecular interactions. Most molecular force fields describe the effects of various interaction forces on molecular potential energy through potential energy functions, including bonded and non-bonded interactions. Bonded interactions consist of bond stretching energy, angle bending energy, and dihedral torsion energy. Non-bonded interactions include van der Waals energy, electrostatic interaction energy, and hydrogen bonding energy [
15]. These energy terms are illustrated in
Figure 3. Force field parameters are typically derived from experiments and quantum mechanical calculations, to describe entire classes of molecules with reasonable accuracy [
16].
The choice of force field is critical as it determines the strength and range of intermolecular interactions. Common force fields in simulation software include the COMPASS force field, COMPASS II force field, Dreiding force field, Universal force field, CVFF, PCFF, and GAFF, each applicable to different simulation environments. In this study, the aged SBS asphalt model was optimized under the COMPASS II force field, and the COMPASS force field was selected to geometrically optimize the constructed WMA-R molecules.
An ensemble is a collection of numerous identical, independent systems under specific macroscopic conditions, each existing in different microscopic states but exhibiting identical macroscopic properties. Common ensembles include Canonical ensemble (NVT), Microcanonical ensemble (NVE), Isothermal-Isobaric ensemble (NPT), Isobaric-Isoenthalpic ensemble (NPH), and Grand Canonical ensemble (µVT). Among these, the first three are most frequently employed. Based on this, the NVT ensemble and NPT ensemble were used to perform kinetic optimization on the molecular models.
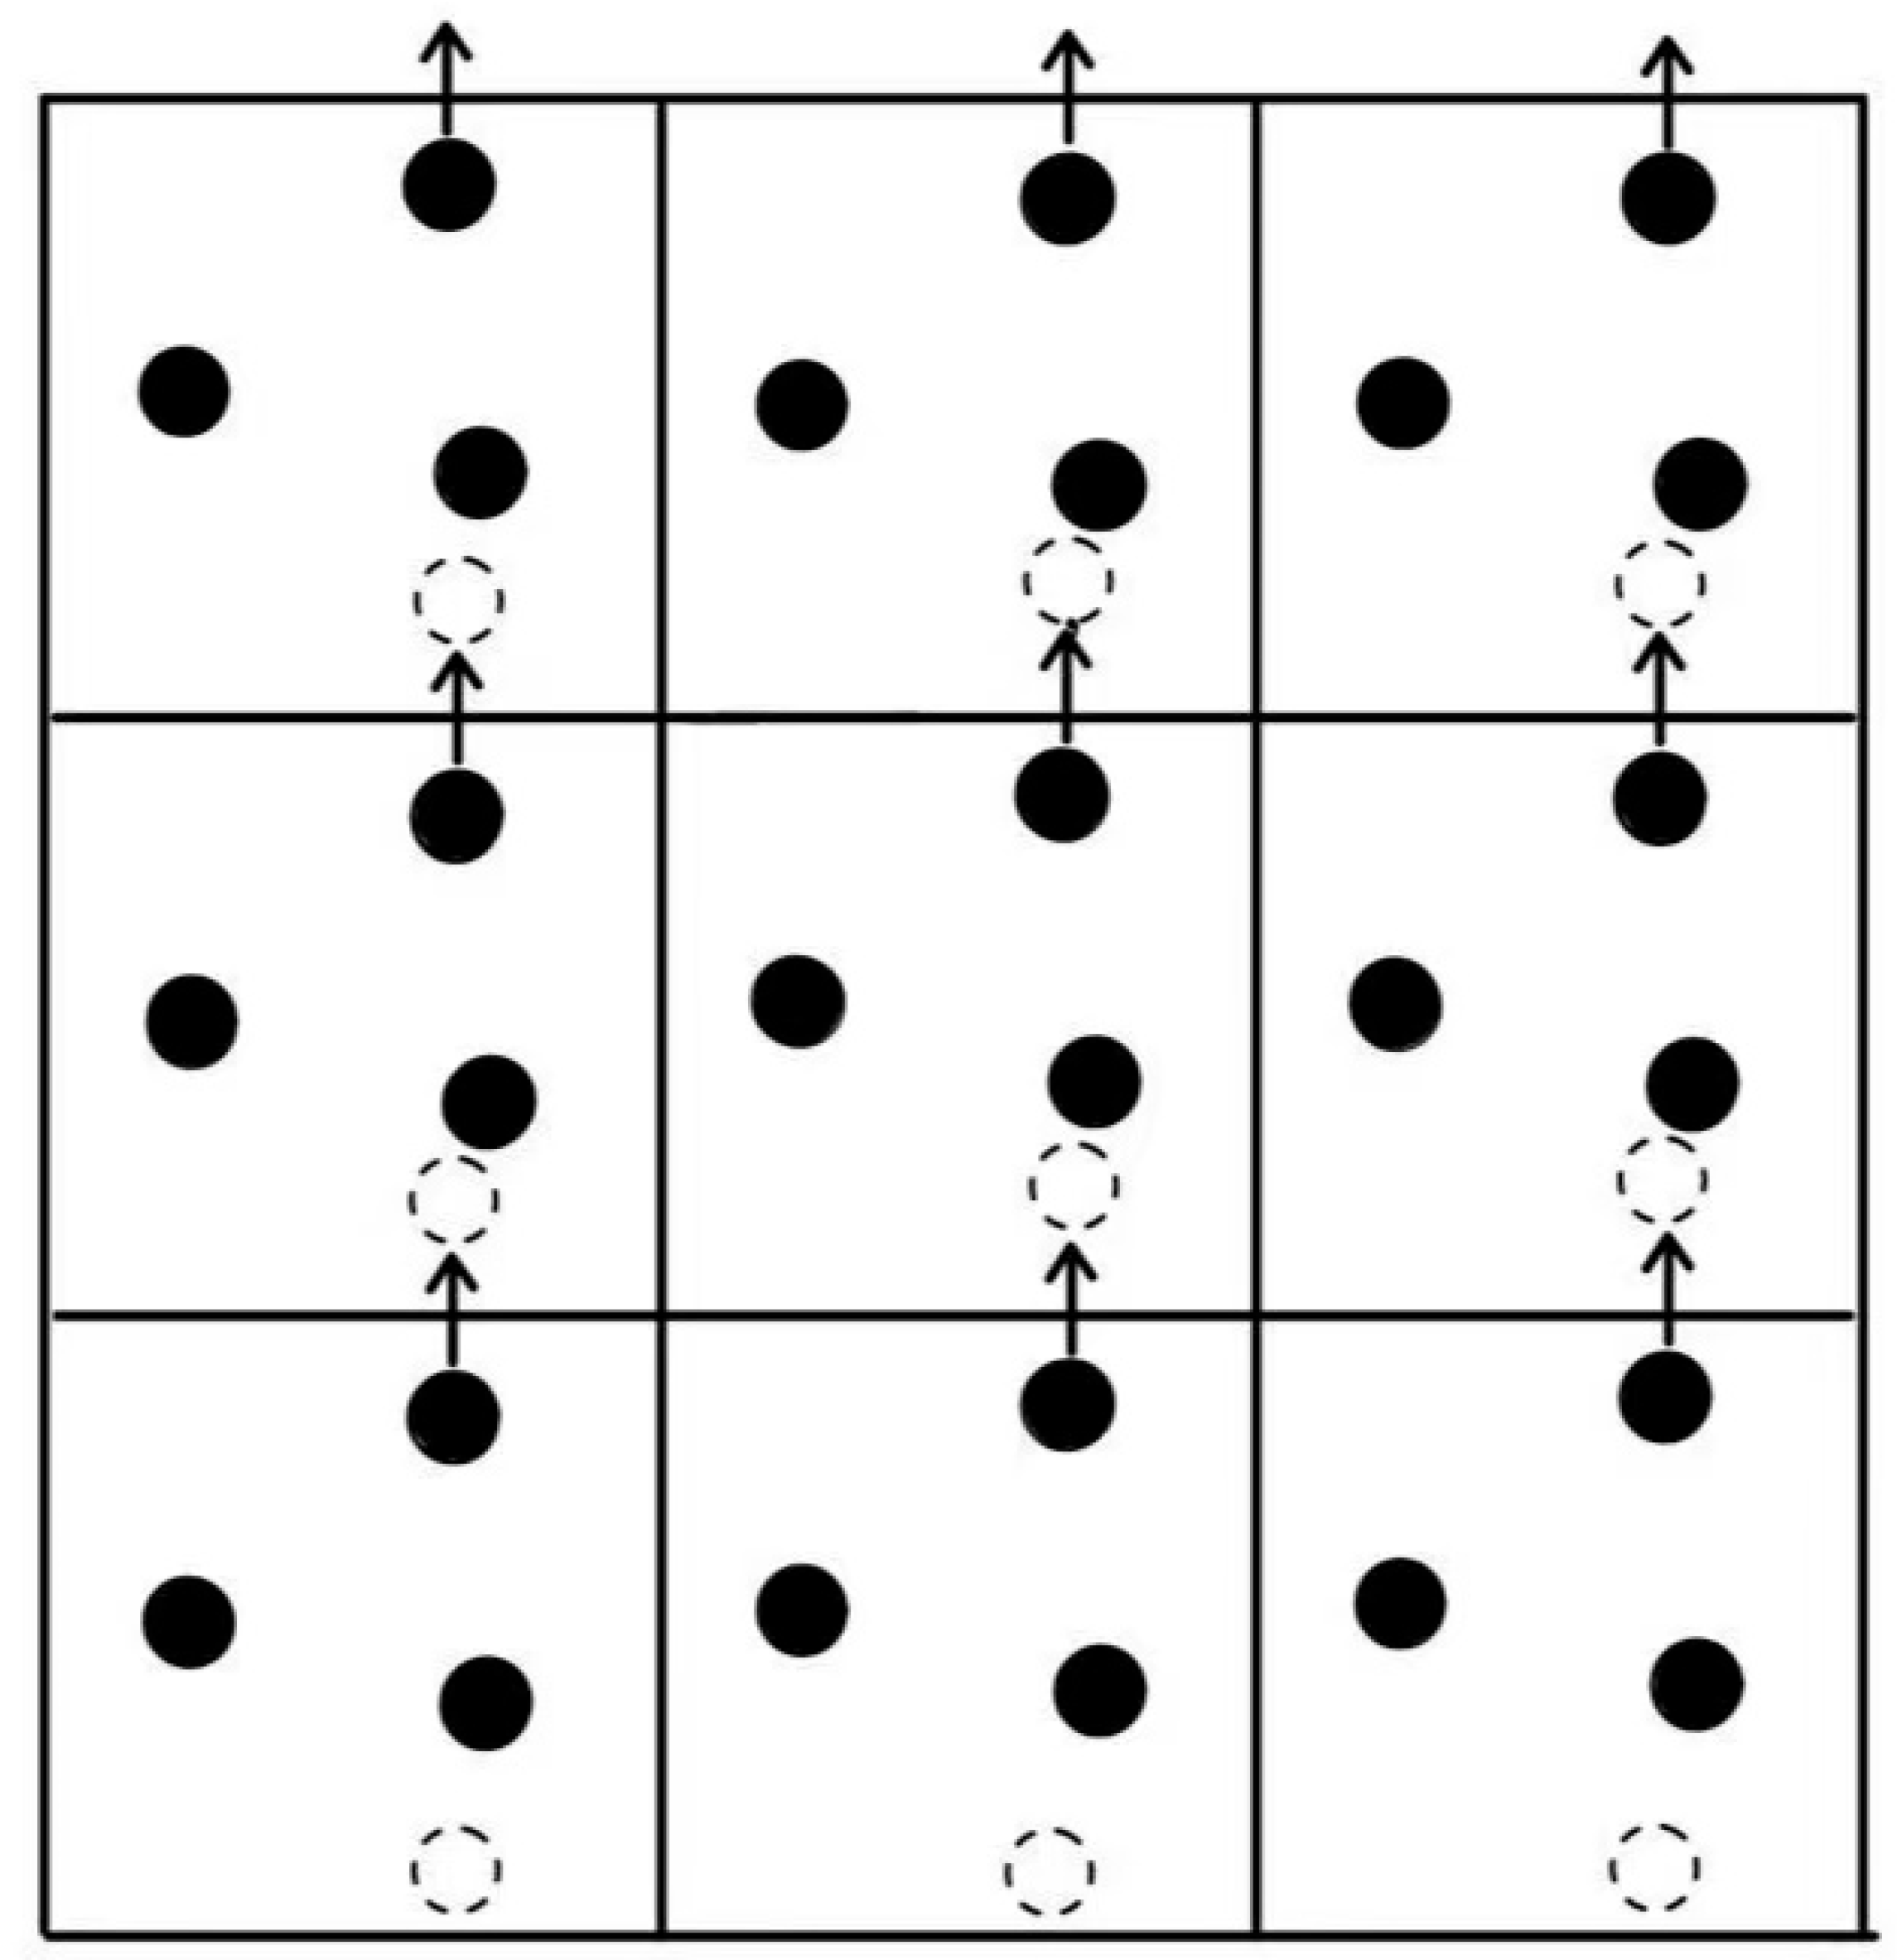
Molecular dynamics simulations face challenges handling massive particle quantities, where boundary conditions provide effective solutions. Boundary conditions mainly divide into periodic and non-periodic types. Periodic boundary conditions, one of the most prevalent approaches, are particularly suitable for simulating infinite systems. By treating the simulation domain as a repeating unit, particles reaching boundaries instantly reappear on the opposite side. This method effectively minimizes boundary effects in large-scale system simulations, with
Figure 4 clearly illustrating its mechanism. Conversely, non-periodic boundary conditions prohibit particle re-entry once they exit the simulation domain.
In this study, MD was employed to establish molecular models of aged SBS asphalt and biomimetic-based warm-mix regenerant, aiming to investigate the diffusion characteristics of the warm-mix regenerant in aged asphalt and reveal the diffusion behavior of the regenerant in asphalt and its interactions with asphalt components at the molecular scale.
3.1.2. Establishment of SBS Asphalt Molecules and the Biomimetic-Based Warm-Mix Regenerant Model
The theory of the colloidal structure of asphalt starts from the migration of chemical components. It is believed that after asphalt aging, the migration of components will lead to more of some components and less of other components. Inconsistent proportions between the components will lead to a reduced performance of asphalt roads. If the components can be adjusted by adding regenerators, the asphalt will restore its original properties. The compatibility theory of asphalt regeneration is based on chemical thermodynamics and believes that the compatibility of each component in the asphalt colloid system will decrease. The increase in the difference in solubility parameters between components will lead to the aging of asphalt. If a certain biomimetic-based warm-mix regenerant can be added to reduce its solubility parameters, the asphalt can recover or even exceed its original properties.
According to the above two theories, aging asphalt regeneration means better-dispersing asphaltene in aromatic and saturated parts under the action of colloids, forming a stable colloidal structure, and the rheological properties of asphalt being changed, so that the asphalt performance meets the requirements of quality indicators [
18]. That is, mix the soft components rich in aromatic parts into aged bitumen in a certain proportion to create a new and more reasonable bitumen component. According to the asphalt colloid structure theory, based on the research on aging performance and grade classification, appropriate regeneration methods are selected for the aging degree of recovered asphalt. While improving the rheology performance of regenerated asphalt, the amount of cementitious materials on the old asphalt pavement should be increased as much as possible [
19]. The method is based on component harmony and compatibility theory as the theoretical basis. The specific measures usually involve the addition of new asphalt materials and regenerators.
This study adopts an SBS-modified asphalt model and the experimental results of the four-component content are shown in
Table 8.
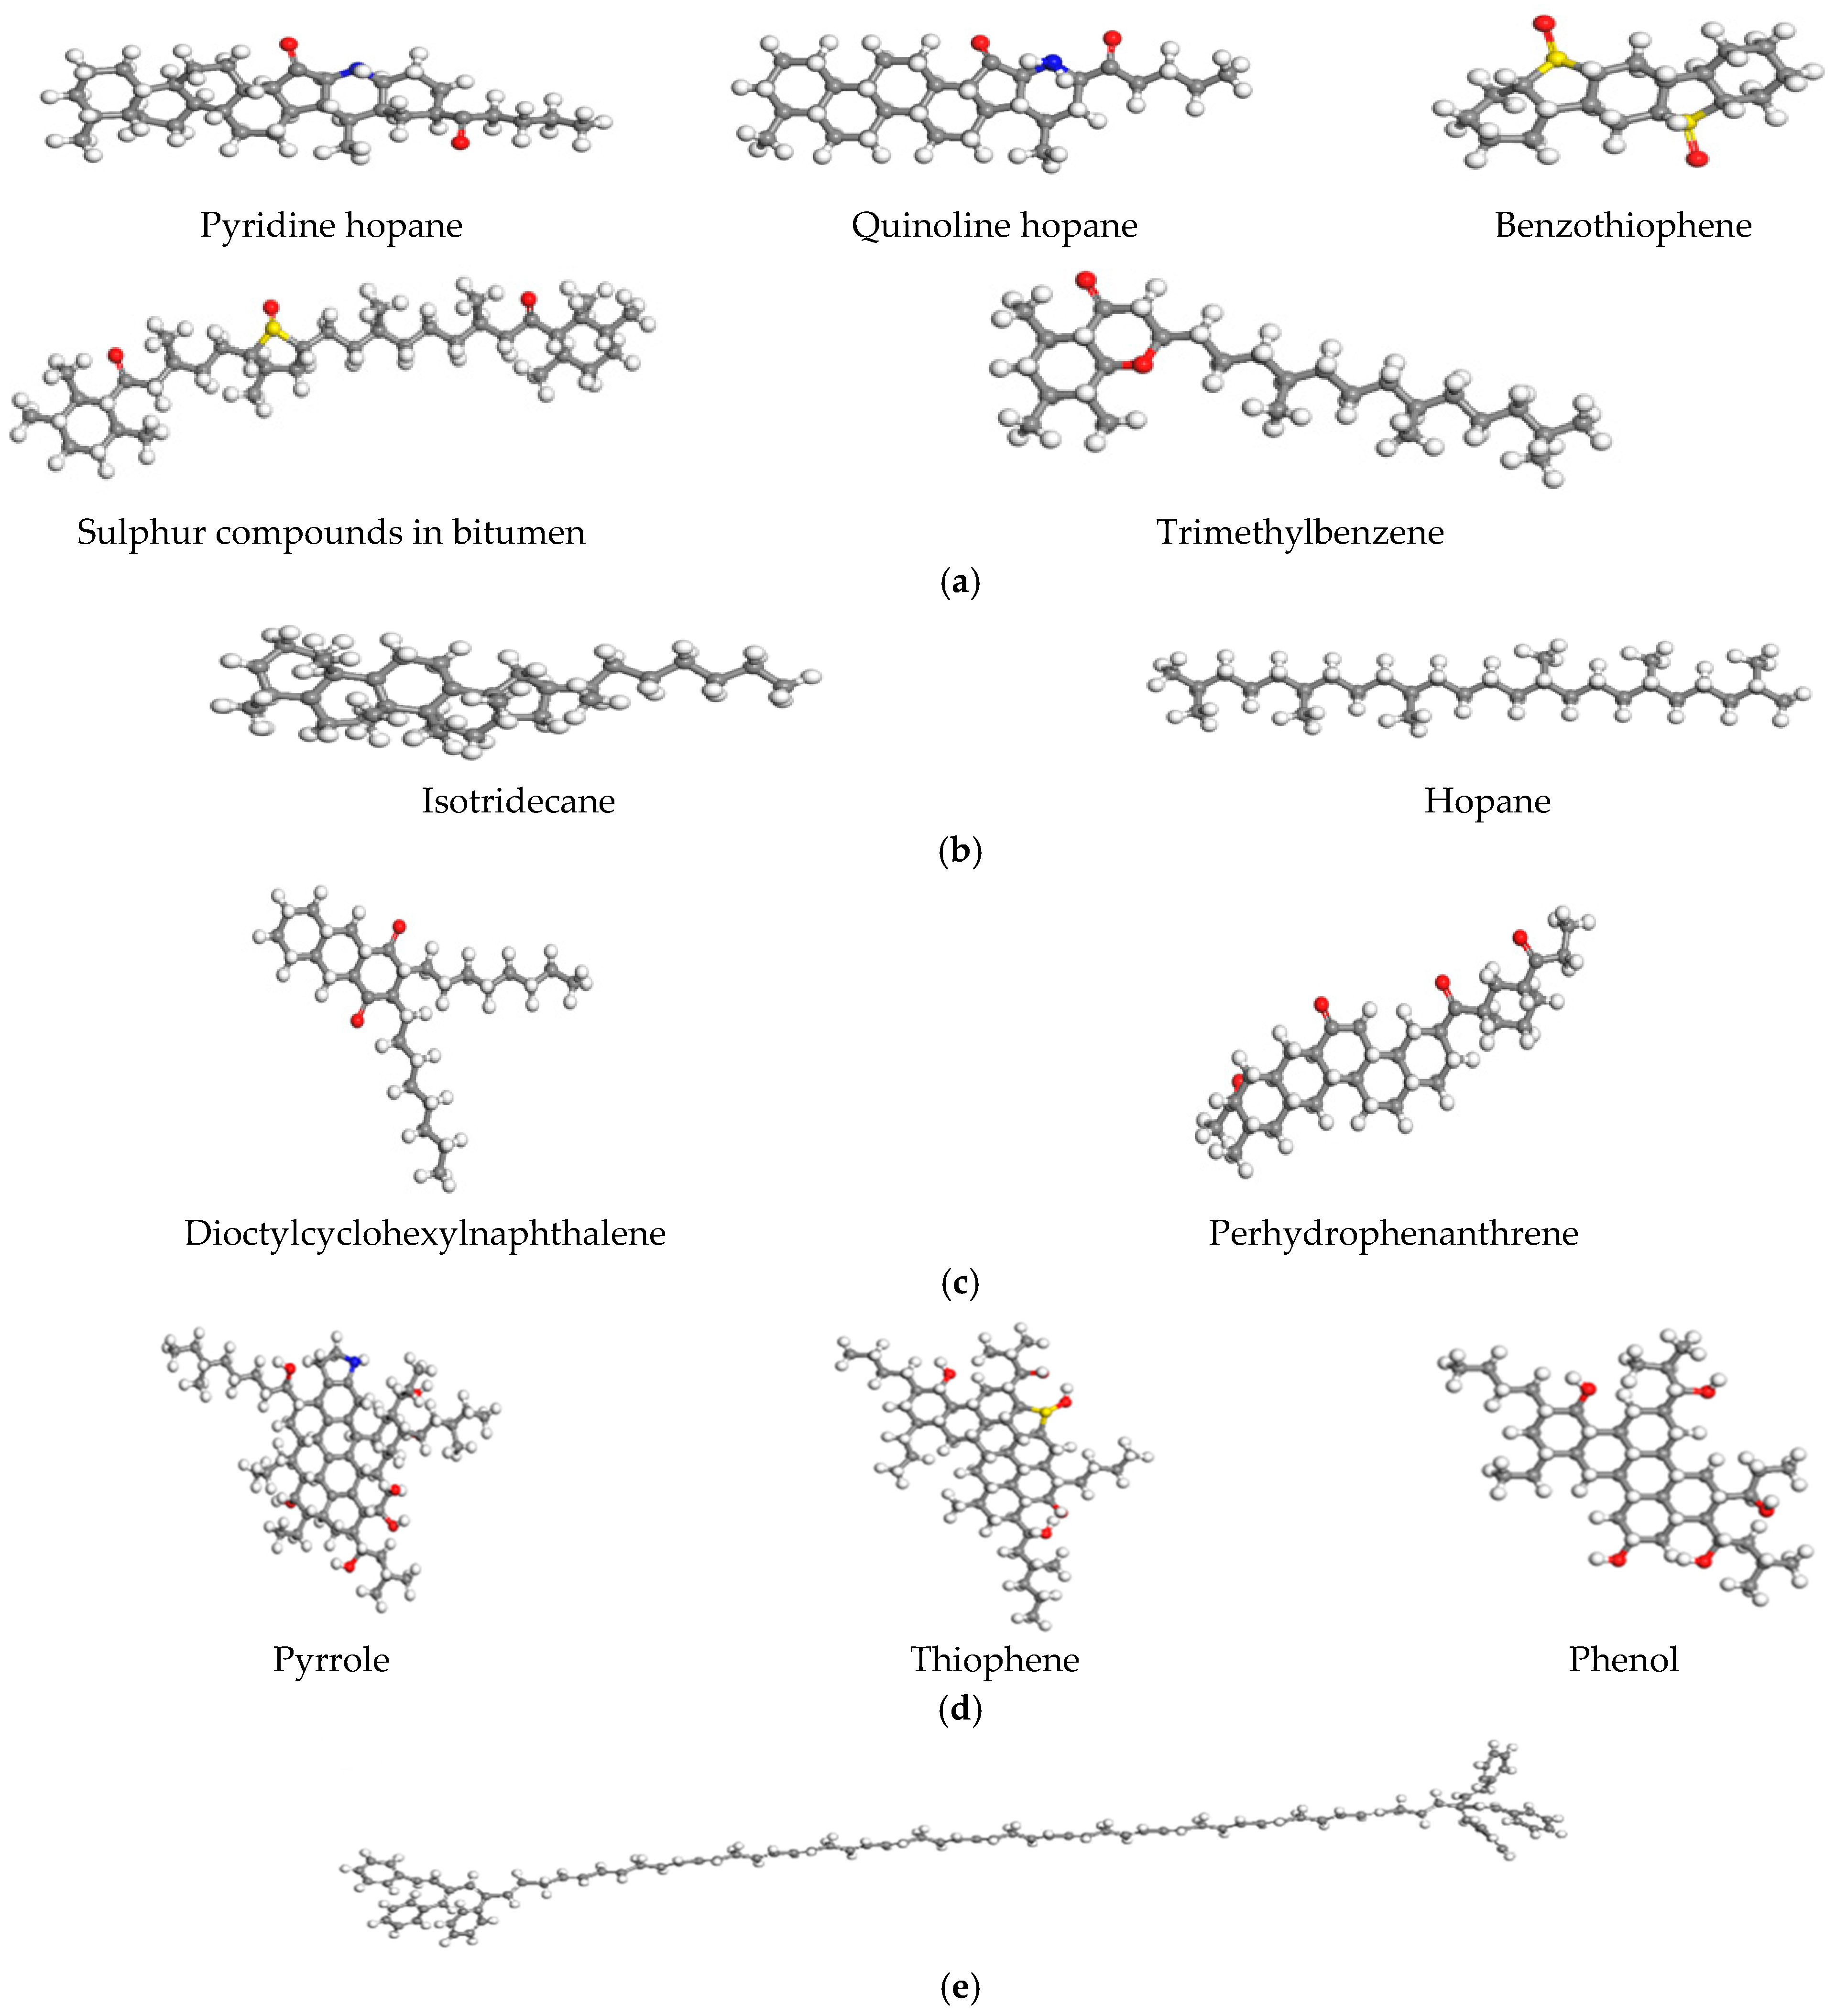
To more accurately reflect the micro-properties of asphalt materials, the molecular structures of each component are shown in
Figure 5. In the following figure, the red, blue, and yellow parts represent oxygen atoms, nitrogen atoms, and sulfur atoms, respectively. Due to the limitations of computer capabilities, this project will control the number of atoms in the matrix asphalt model. Therefore, it is impossible to directly convert equally based on the macro data of the four components of matrix asphalt during modeling, so this project will be adjusted by manual trial calculation. This project constructed the SBS-aged asphalt molecular model under the premise that the overall molecular mass of the control model is similar and the proportion of the four components obtained by manual calculation is similar to the actual experimental results.
To make the system model closer to the real material, the structure optimization is performed through Geometry Optimization in the Forcite module and the energy convergence is set to be sufficient. Then, under the Compass II force field, the structure is annealed 10 cycles to cross the energy barrier to find the global optimal low-energy conformation. Finally, under the NPT and NVT ensembles, the asphalt model is brought to an equilibrium state and the asphalt is relaxed and balanced as shown in
Figure 6.
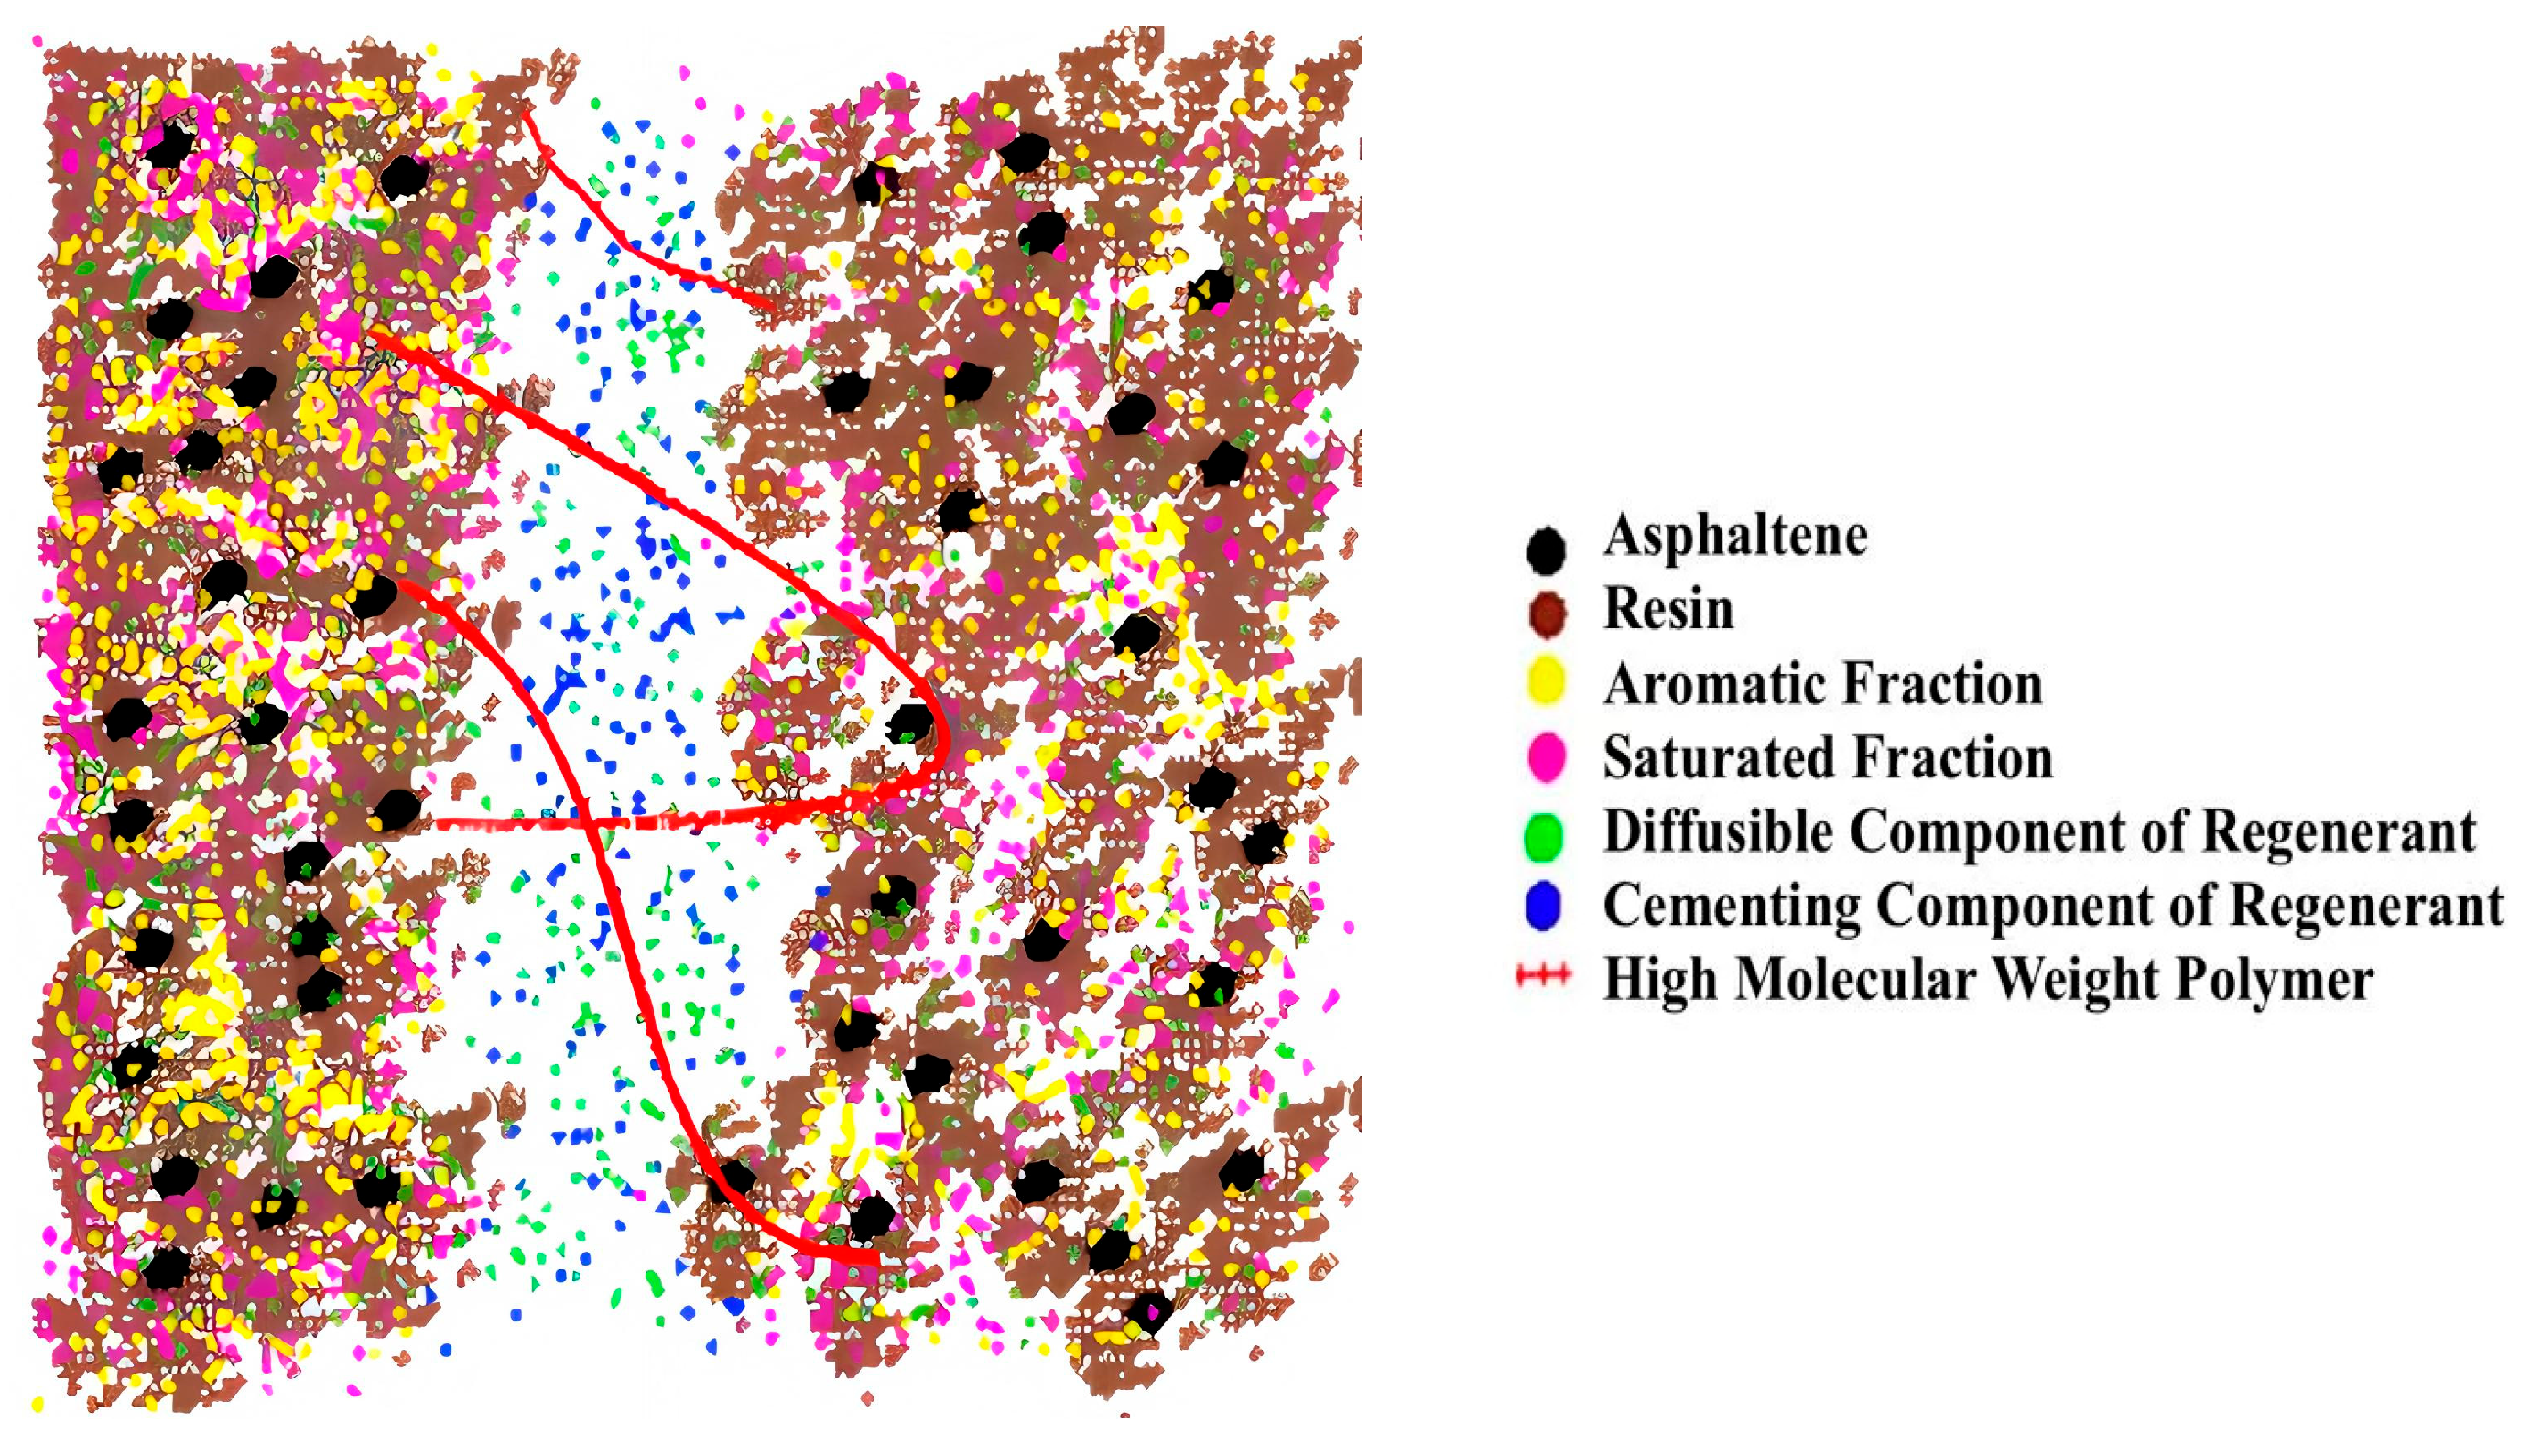
The Amorphous Cell module of MS 2019 was used to construct a molecular model of the effect of biomimetic-based warm-mix regenerant with three-dimensional periodic boundary conditions, as shown in
Figure 7. The specific operation is as follows: assemble a biomimetic-based warm-mix regenerant chain with asphalt molecules, calculate the mass fraction of the module, and determine the dosage of the biomimetic-based warm-mix regenerant to be 6%.
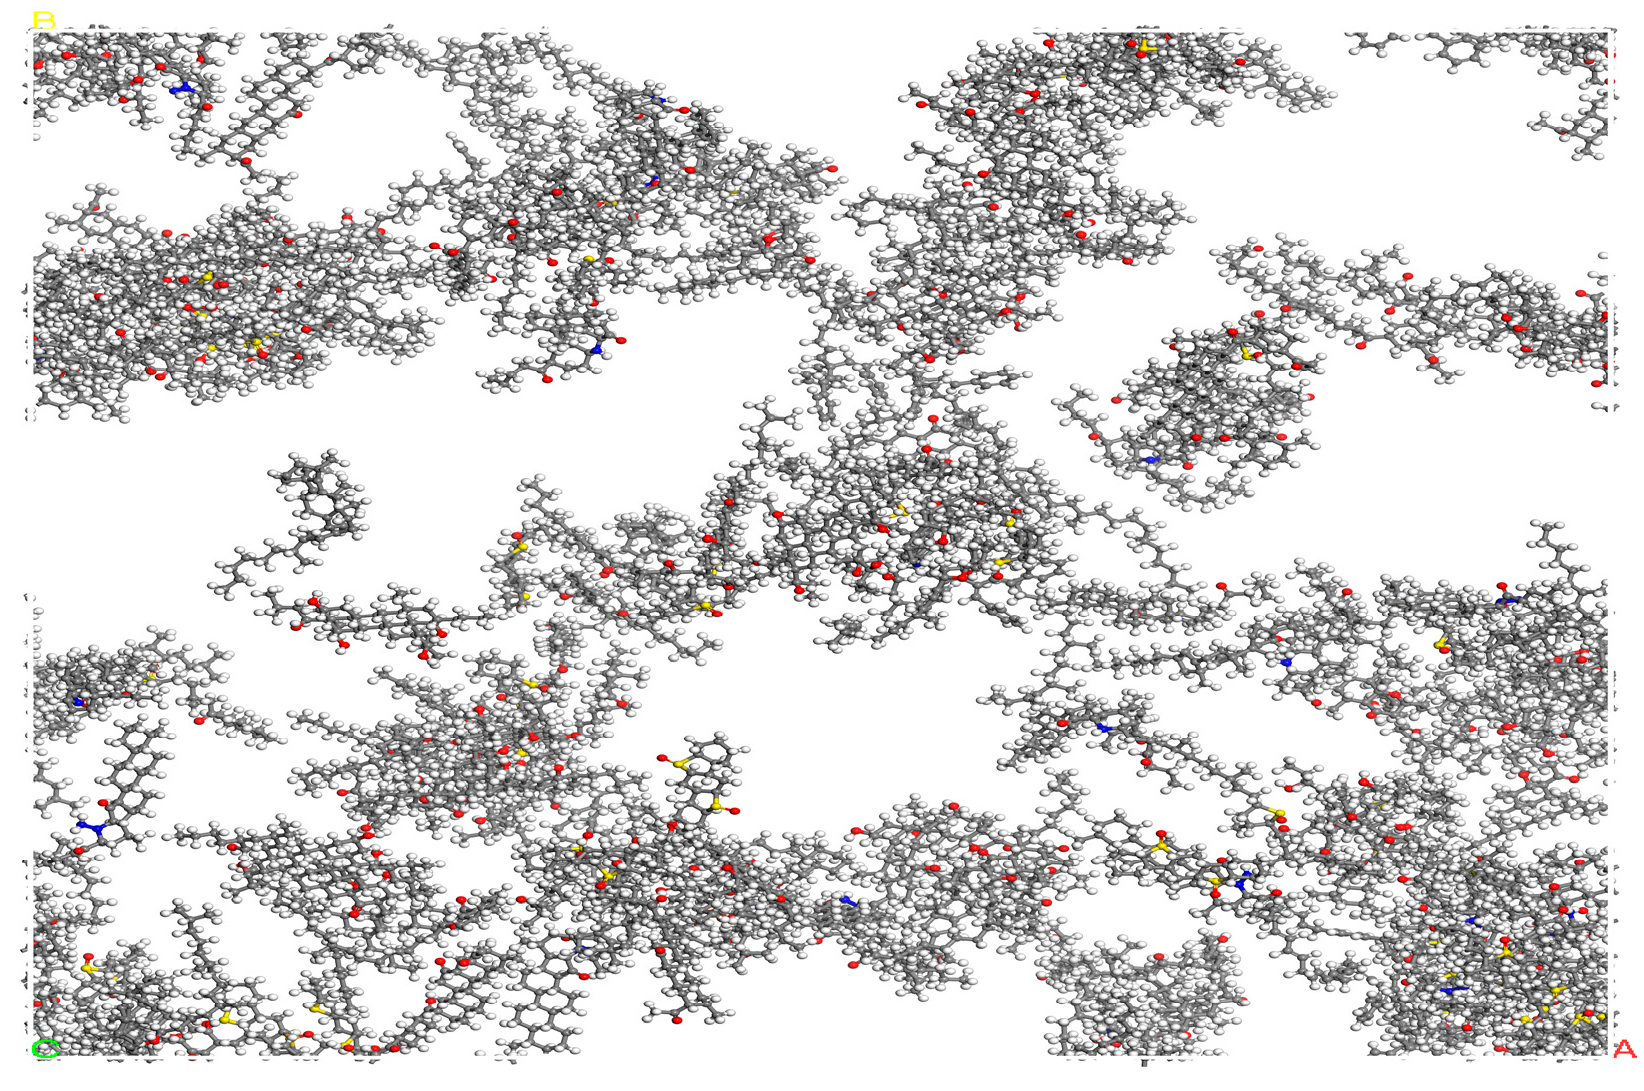
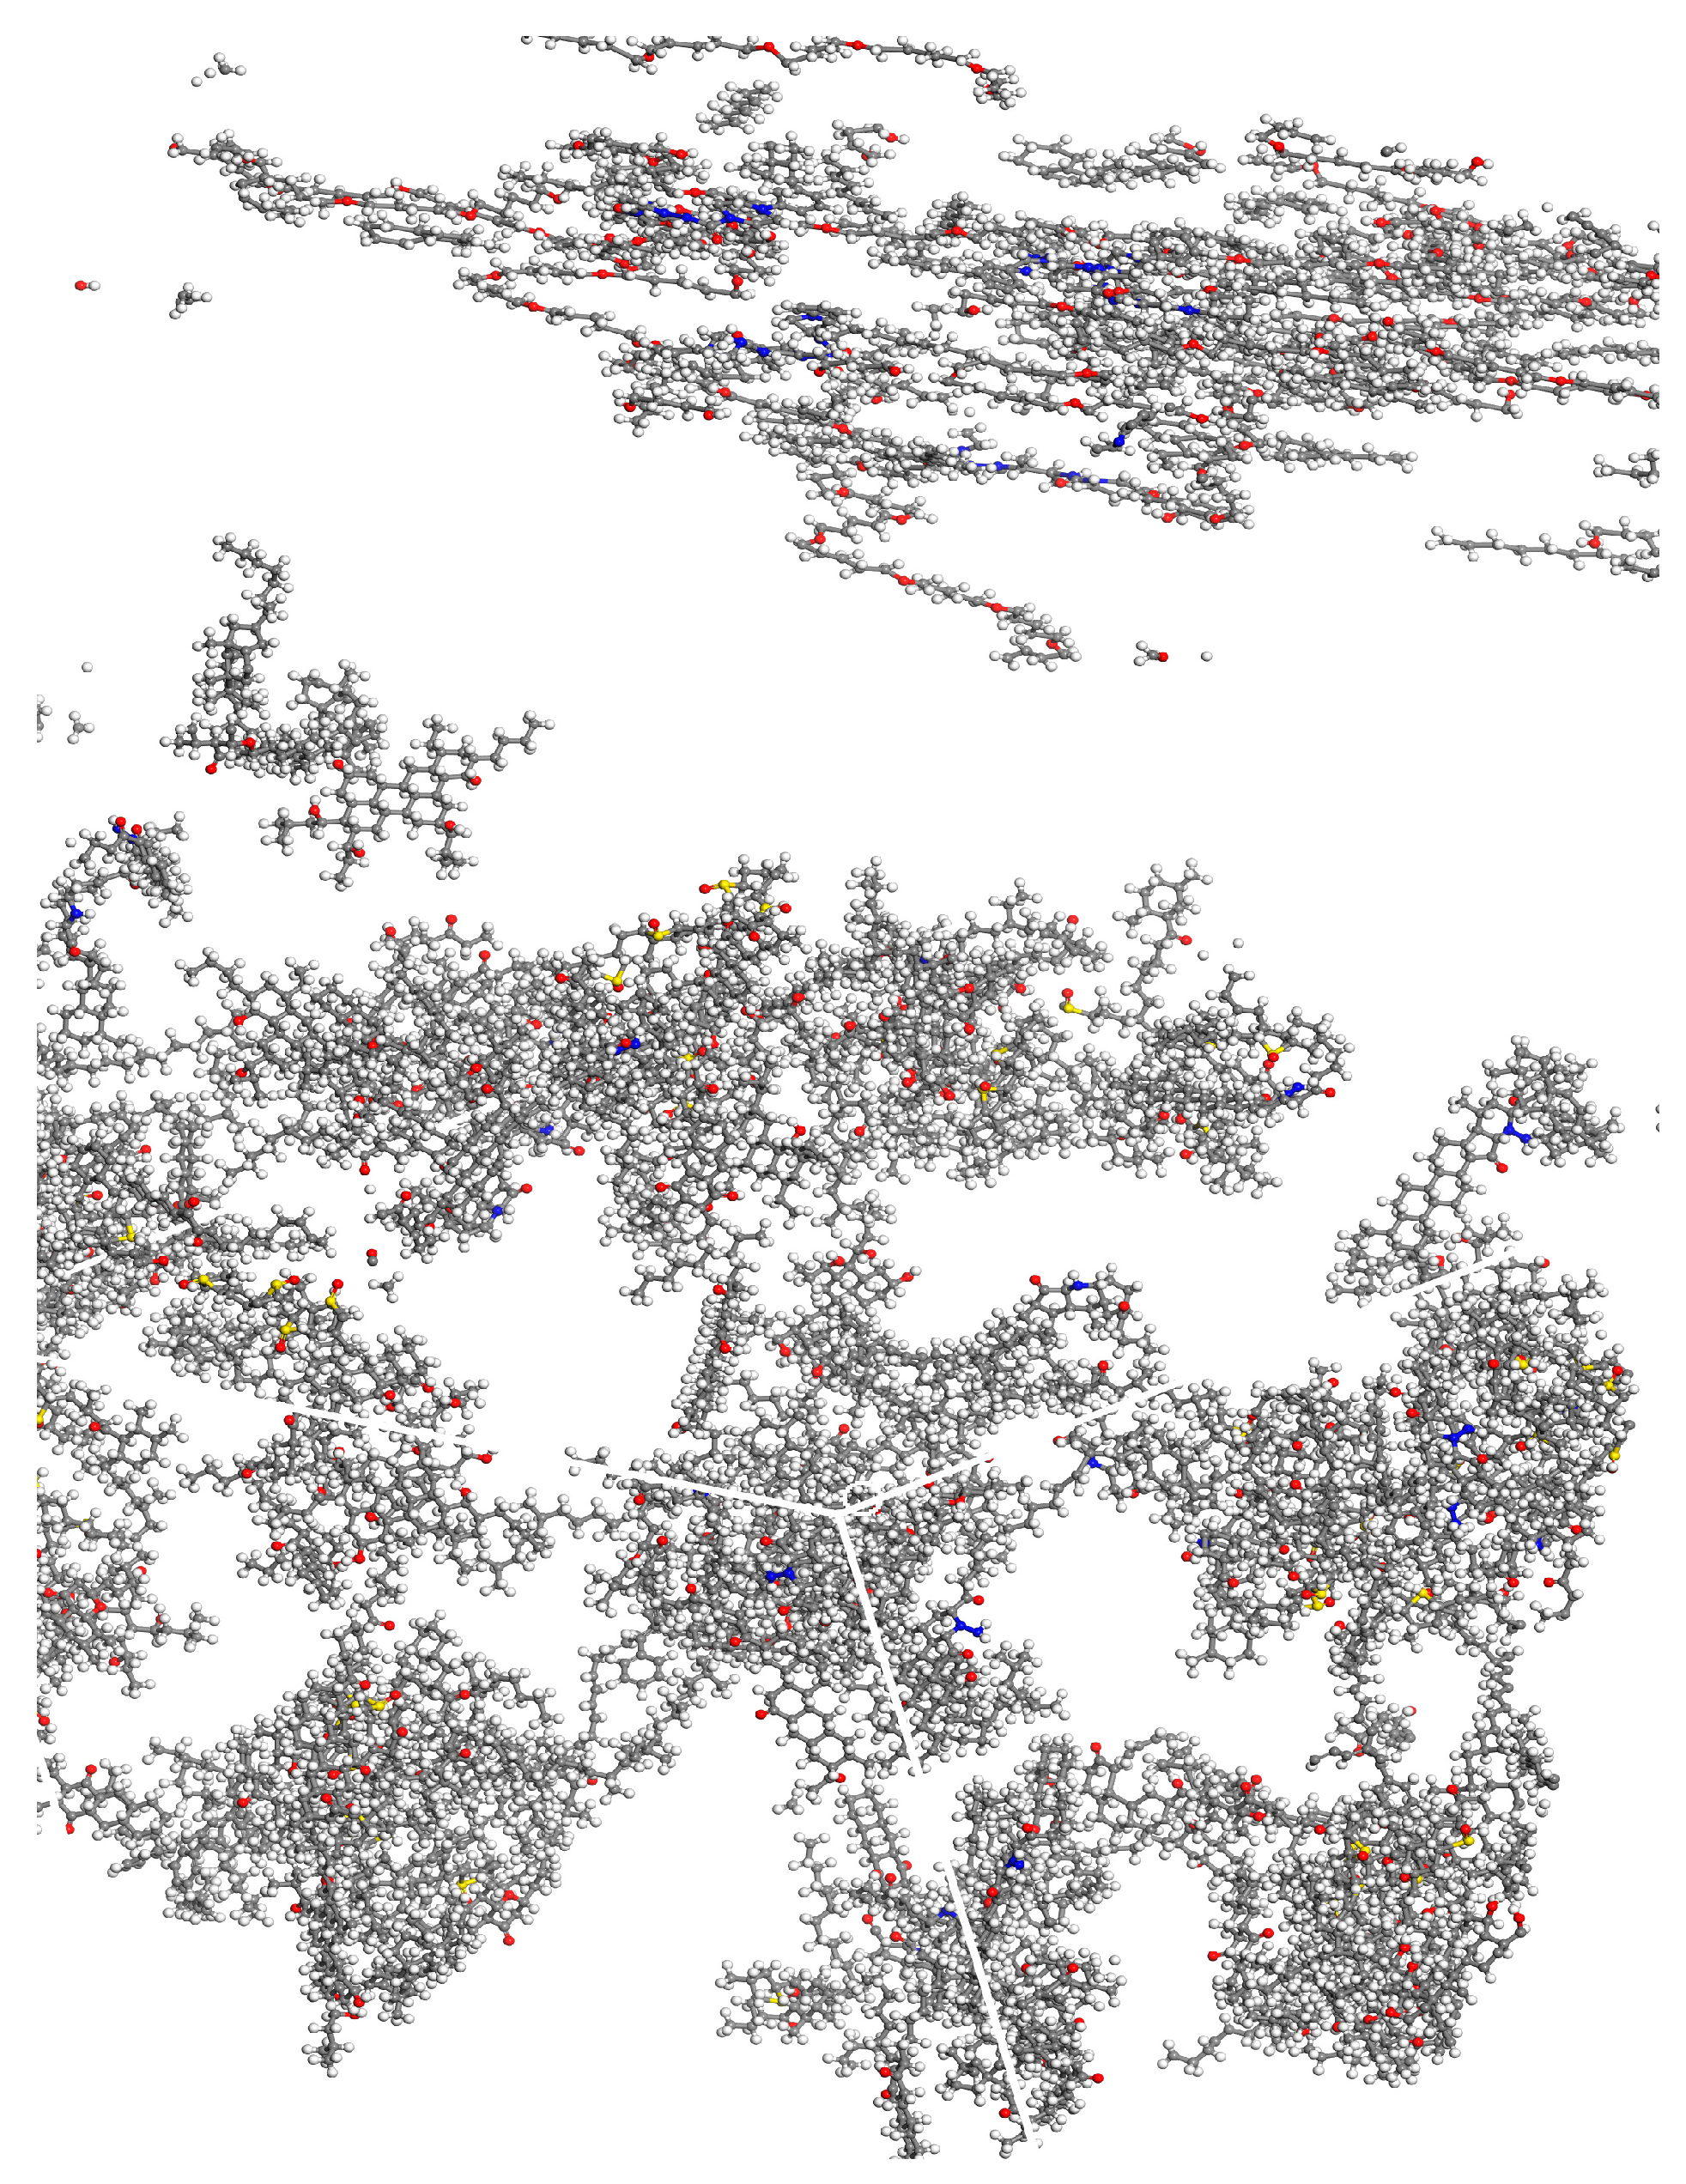
Finally, the molecular model of the biomimetic-based warm-mix regenerant is obtained as shown in
Figure 8 and
Figure 9. The upper part of
Figure 8 represents Biomimetic-based warm-mix regenerant and the lower part represents Aged asphalt.
Then, geometric optimization was performed on the constructed WMA-R molecules, and the COMPASS force field was selected, with 100,000 iterations. Van der Waals forces were calculated by the atom-based method and the electrostatic interactions were calculated by the Ewald method. When the system energy drops and stabilizes, annealing is performed within the temperature range of 300–500 K and the number of iteration steps is set to 50,000 steps.
To make the molecular model stable in energy and volume, kinetic optimization of the molecular model that completes annealing is also required. The molecular dynamics optimization process is as follows: first, the constant temperature and constant volume (NVT) ensemble is selected for 200 ps dynamic calculations. This step is to simulate the diffusion in bitumen; then the constant temperature and constant pressure (NPT) ensemble is performed for 200 ps dynamic calculations; finally, the constant temperature and constant volume (NVT) ensemble is performed to gradually stabilize the system energy, and finally, a more stable WMA-R model is obtained. During the entire simulation process 298 K temperature is selected, Andersen is selected for the temperature controller, and Berendsen is selected for the pressure controller.
3.1.3. Mean Square Displacement and the Diffusion Coefficient of Asphalt
Mean square displacement (MSD) refers to the average distance between the position of molecule I after moving over time relative to the reference position and can be used to evaluate the degree of diffusion of the molecule. The mean square displacement is linearly related to time. The larger the mean square displacement per unit of time, the faster the diffusion speed of the molecule, and the greater the diffusion coefficient of the molecule. Mean square displacement can characterize the average distance between molecules of different components of biomimetic-based warm-mix regenerant diffused in aged asphalt. Fitting the mean square displacement curve within a fixed period can be used to study the diffusion rate of different components of biomimetic-based warm-mix regenerant in aged asphalt [
20].
In the Forcite module, the simulation process is carried out under the NPT ensemble of molecular quantity, pressure, and temperature constant [
21], setting the pressure to atmospheric pressure (0.1 MPa), ensuring that the diffusion of the biomimetic-based warm-mix regenerant components in aged asphalt is carried out in the atmospheric environment. Set the simulation time of diffusion to 120 ps to ensure that the correlation coefficient of the mean square displacement fitting curve of different components of the biomimetic-based warm-mix regenerant is at a high level. The high- and low-temperature performance of the WMA-R was evaluated by a rutting test and low temperature bending test. Therefore, the simulated temperature was set to 263 K and 333 K. The mean square displacement curves of the biomimetic-based warm-mix regenerant components at these two temperatures were analyzed. Finally, the mean square displacement curves of the biomimetic-based warm-mix regenerant components were linearly fitted to obtain the diffusion coefficient of the biomimetic-based warm-mix regenerant in aged asphalt. Finally, the diffusion coefficient of the aged asphalt was compared with the diffusion coefficient of the biomimetic-based warm-mix regenerant in aged asphalt. Considering that asphalt aging is mainly based on aromatic and saturated diffusion rates, see Equation (1) to calculate the diffusion coefficient.
Among them, D is the diffusion coefficient, t is the time, and k is the slope of the mean square displacement and time. According to Formula (1), the diffusion coefficients of aged asphalt and regenerated asphalt were calculated at two temperatures: 263 K and 333 K.
3.3. Research on Energy Consumption and Carbon Emission of Warm-Mix Recycled Asphalt Mixture
Conventional hot-mix asphalt mixtures generate a series of toxic gases during mixing, paving, and compaction, causing significant impacts on the natural environment. In this project, the carbon emission factor method (using unit carbon emissions as the measurement indicator) was adopted. Based on the carbon emission factors provided by the Intergovernmental Panel on Climate Change (IPPC) and using the Life Cycle Analysis (LCA) method, the construction of asphalt pavements was divided into four stages: raw material production, raw material transportation, mixture production, and mixture construction. By establishing a carbon emission model during asphalt construction, quantitative analyses were conducted on the carbon emissions of operations in each stage.
For calculation convenience and unified measurement indicators, it was finally determined that the carbon emissions generated from the production and use of 1 ton of asphalt mixture would serve as the carbon emission measurement indicator (CMI) for each link in all stages, with the total carbon emissions from the production and use of 1 ton of asphalt mixture as the overall CMI for asphalt mixtures.
The raw material production for WMA-R pavements includes the production of recycled old materials (RAP), new asphalt, and new aggregates. An evaluation model for the production stage was established to obtain the total carbon emissions and energy consumption for this stage. The calculation of old material production is shown in Equation (4).
In the formula, M1, H1, P, and W0 represent the emission amount of a certain greenhouse gas (kg), fuel consumption per operating hour of the milling machine (L/h), carbon emission factor of unit volume diesel, and the amount of old material produced by the milling machine per hour (t/h).
The model for the raw material transportation stage adopts the transportation distance method and the calculation is shown in Equation (5):
In the formula, M2, S1, L, and P denote the emission amount of greenhouse gases (MJ), fuel consumption per kilometer during comprehensive vehicle transportation (kg), average transportation distance of the vehicle (km), and carbon emission factory.
Considering the application of thermodynamics principles and based on the laws of heat transfer and energy conservation, the fuel consumption during the mixing process of asphalt mixtures is calculated as shown in Equations (6) and (7):
For Equation (6)
mac,
ma,
ca, Δ
ta,
η1, and
λ1 represent the diesel consumption for asphalt production (kg), mass of asphalt (kg), specific heat capacity of asphalt (MJ/(kg·°C)), heating temperature increment of asphalt (°C), efficiency of diesel combustion energy transferred to asphalt (%), and energy consumption coefficient of diesel (MJ/kg).
For Equation (7) mgz, mg, mw, cg, cw, Δtg, Δtw, λ2, η2, and η3 represent heavy oil consumption for aggregate production (kg), mass of aggregate (t), mass of water (t), specific heat capacity of aggregate (MJ/(kg·°C)), specific heat capacity of water (MJ/(kg·°C)), heating temperature increment of aggregate (°C), heating temperature increment of water (°C), energy consumption coefficient of heavy oil (MJ/kg), heavy oil combustion efficiency (%), and drum heat exchange efficiency (%).
The gas emission amount M32 from material heating is obtained by multiplying the fuel consumption for heating asphalt and aggregates calculated by Equation (8) with the carbon emission factor, as shown in Equation (8):
In the formula, M32, m, and P represent the emission amount of a certain greenhouse gas (kg), fuel consumed for heating asphalt and aggregates (kg), and the emission factor of a certain greenhouse gas per unit fuel.
The total emission amount of a certain greenhouse gas in the mixing stage is shown in Equation (9).
The mixture construction stage mainly includes the paving and compaction stages, with the main emission sources being energy consumption of mechanical equipment and high-temperature emissions. The calculation is shown in Equation (10):
In the formula, M41, S4, W4, and P represent the emission amount of a certain greenhouse gas (kg), fuel consumption per operating hour of the paver (L/h), amount of mixture paved per hour by the paver in practice (t/h), and carbon emission factor.

 and
and 


