3. Results and Discussion
Figure 1 presents the XRD patterns of Cu
1−xNi
xFeS
2 powders synthesized via MA. All samples exhibited a single-phase tetragonal structure consistent with the standard chalcopyrite phase (PDF# 01-075-6866), indicating successful formation without the presence of detectable secondary phases. Despite the partial substitution of Cu
+ by Ni
2+, the chalcopyrite structure was preserved, suggesting that Ni was successfully incorporated into the lattice without exceeding the solubility limit within the examined doping range. The observed broadening of diffraction peaks across all samples can be attributed to the severe plastic deformation, grain refinement, and internal strain induced by the high-energy impacts during MA. This behavior is typical for mechanically alloyed materials. Notably, the solubility limit for Ni in the Cu
1−xNi
xFeS
2 system was not reached up to x = 0.08. This is particularly significant when compared with previously reported solubility limits for other dopants in chalcopyrite structures. For instance, Ge et al. [
16,
18,
19] reported solubility limits of x = 0.08 for Ag, x = 0.02 for Cd, and x = 0.08 for In in Cu
1−xAg
xFeS
2, Cu
1−xCd
xFeS
2, and Cu
1−xIn
xFeS
2, respectively, synthesized via encapsulated melting. In each case, exceeding the solubility limit resulted in the appearance of secondary phases such as Ag
2S, FeS
2/CdS, and CuInS
2. Similarly, Xie et al. [
20] observed a solubility limit of x = 0.03 for Zn in Cu
1−xZn
xFeS
2 synthesized by vacuum melting, with ZnS forming at higher doping levels. Berthebaud et al. [
21] also reported a solubility limit of x = 0.08 for Co in Cu
1−xCo
xFeS
2 prepared via cold pressing and solid-state reaction, but multiple secondary phases including CoS
2 emerged at x = 0.1. In comparison, the Ni-doped CuFeS
2 samples in the present study maintained a single-phase chalcopyrite structure up to x = 0.08 without any secondary phases, even under the high-energy conditions of MA. This suggests that Ni has a relatively broad solubility range within the CuFeS
2 lattice and that MA is an effective synthesis technique for promoting dopant incorporation while suppressing secondary phase formation. Furthermore, the absence of secondary phases even at the highest doping level confirms the thermodynamic compatibility and structural stability of Ni within the chalcopyrite matrix.
The XRD analysis was conducted on bulk Cu
1−xNi
xFeS
2 samples consolidated via the HP of the MA powders, and the results are presented in
Figure 2. The diffraction patterns of all sintered specimens were consistent with the tetragonal chalcopyrite structure, with no evidence of secondary phases, indicating that the structural integrity of the chalcopyrite phase was preserved throughout the HP process. This outcome demonstrates that the applied HP conditions were thermodynamically and kinetically favorable for stabilizing the single-phase chalcopyrite structure, even in the presence of Ni substitution, which can potentially lead to phase separation in other doped systems. Moreover, the XRD patterns revealed the noticeable sharpening of diffraction peaks compared to the as-milled powders. This peak sharpening is indicative of increased crystallinity and grain coarsening due to the high-temperature sintering, which facilitates atomic diffusion and grain boundary migration. Additionally, the reduction in peak broadening suggests the partial relaxation of microstrain and a decrease in crystal defects introduced during MA.
Table 1 summarizes the relative densities and lattice parameters of the Cu
1−xNi
xFeS
2 samples synthesized by mechanical alloying followed by hot pressing (MA–HP). The relative density was calculated based on the theoretical density of chalcopyrite (4.3 gcm
−3) [
24], with all samples exhibiting high relative densities in the range of 98.3–99.3%. These values indicate that the HP process was highly effective in achieving dense compaction, with minimal porosity across all compositions. The lattice parameters of undoped CuFeS
2 were measured as a = 0.5292 nm and c = 1.0438 nm, yielding a tetragonal axial ratio c/a = 1.9724 [
23]. Upon the substitution of Cu
+ by Ni
2+, a systematic contraction of the lattice was observed: the a-axis decreased from 0.5291 to 0.5287 nm, the c-axis from 1.0435 to 1.0418 nm, and the c/a ratio slightly declined from 1.9722 to 1.9705. This reduction in both lattice parameters and tetragonality can be attributed to the smaller ionic radius of Ni
2+ (69 pm) [
25] relative to that of Cu
+ (74 pm) [
26], confirming the successful incorporation of Ni into the Cu sites of the chalcopyrite structure. These results are in agreement with previous studies. For instance, Ge et al. [
16,
18] observed an increase in lattice parameters when larger ions such as In
+ and Ag
+ were substituted at Cu sites in Cu
1−xIn
xFeS
2 and Cu
1−xAg
xFeS
2, due to their larger ionic radii compared to Cu
+. In contrast, Xie et al. [
20] reported that, in Cu
1−xZn
xFeS
2, lattice constants increased only up to the solubility limit of Zn and then plateaued due to the formation of antisite defects involving Fe and Cu, in line with the atomic radius trend (Fe < Cu < Zn). Furthermore, Aliyev et al. [
27] found that the substitution of Fe
3+ by Ni
2+ in chalcopyrite did not result in significant changes in lattice constants, highlighting that the site of substitution critically affects the structural response. Therefore, the observed contraction in lattice parameters in the present study clearly supports the substitution of Cu
+ by Ni
2+, and not Fe
3+, within the chalcopyrite lattice.
Figure 3 presents the fractured surface morphologies of the hot-pressed Cu
1−xNi
xFeS
2 samples, as observed via SEM. The images reveal well-consolidated microstructures across all compositions, consistent with the high relative densities shown in
Table 1, confirming the effectiveness of the HP process in achieving dense bulk materials. Notably, no apparent microstructural anomalies or secondary phases were observed with increasing Ni content up to x = 0.08, indicating that Ni incorporation did not compromise the phase stability of the chalcopyrite matrix. This aligns with the XRD results, which showed no secondary phase formation, thereby confirming the high solubility of Ni within the Cu sublattice under the applied synthesis conditions. Crystallite sizes, derived from Rietveld refinement analysis, showed a significant decrease from 85 nm at x = 0.04 to 36 nm at x = 0.08. This trend suggests that Ni doping introduces localized lattice strain or disorder within the CuFeS
2 structure, which can suppress grain growth during sintering. The ionic radius mismatch between Ni
2+ and Cu
+ likely contributes to lattice distortion, thereby hindering crystallite coarsening and promoting grain refinement.
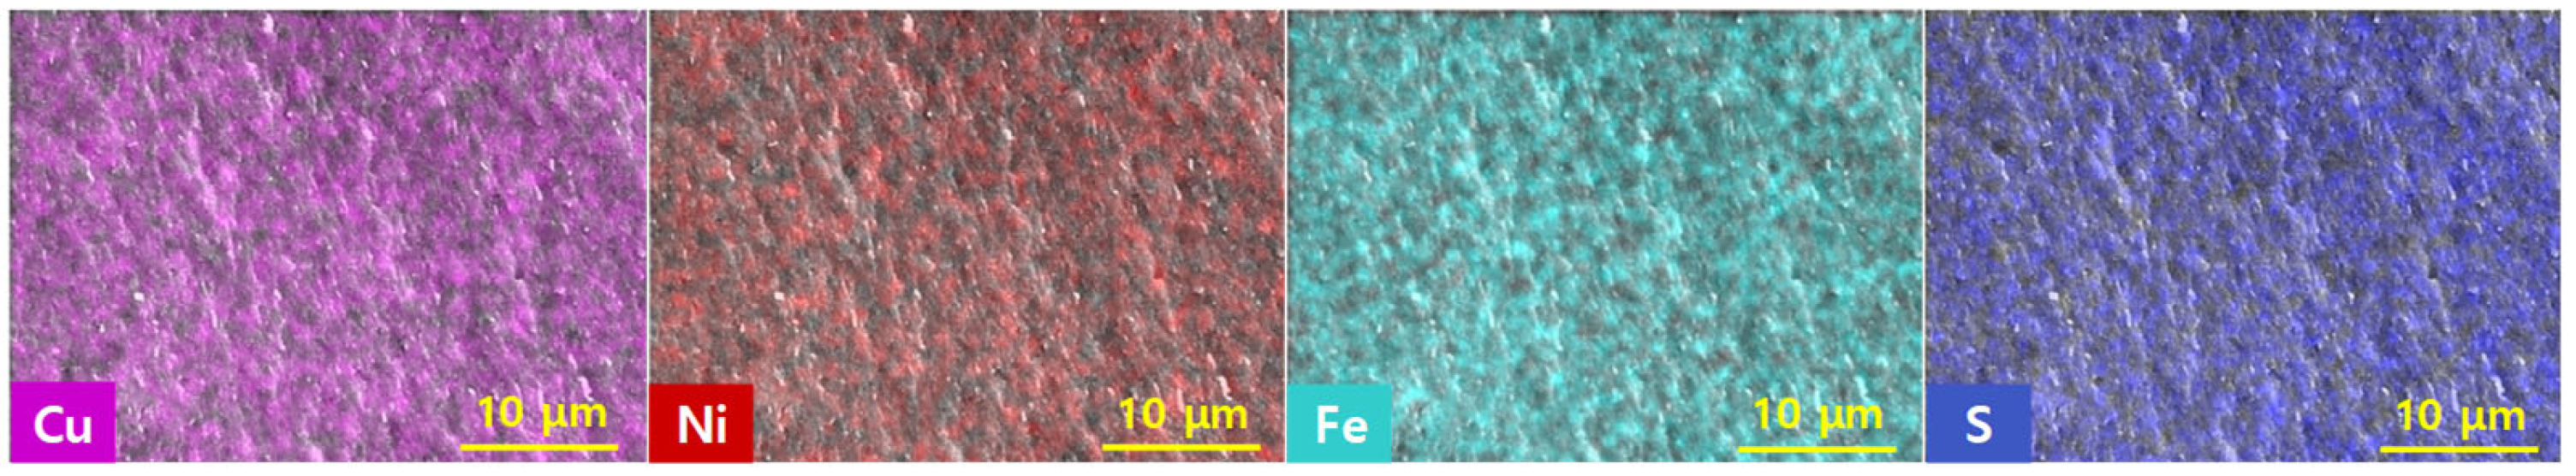
Figure 4 shows the two-dimensional EDS elemental maps for the Cu
0.96Ni
0.04FeS
2 sample, providing insight into the spatial distribution of Cu, Ni, Fe, and S within the chalcopyrite matrix. The EDS maps confirm a homogeneous distribution of all constituent elements, indicating that Ni was uniformly incorporated into the lattice without any observable segregation or clustering. This compositional uniformity stands in contrast to the common issues associated with conventional high-temperature melting techniques, where elements with high vapor pressures—particularly sulfur—can volatilize, and dopants such as Ni may segregate due to insufficient diffusion or rapid cooling rates. These challenges often lead to inhomogeneous elemental distributions, secondary phase formation, and compromised thermoelectric performance. The use of mechanical alloying followed by hot pressing in this study effectively mitigated these issues. Mechanical alloying ensures the thorough mixing and alloying of the starting powders at room temperature, thereby minimizing volatilization losses. Subsequent high-temperature hot pressing promotes densification while maintaining compositional uniformity. The uniform elemental distribution achieved via this solid-state synthesis route highlights the advantage of MA–HP for producing phase-pure, compositionally homogeneous thermoelectric materials.
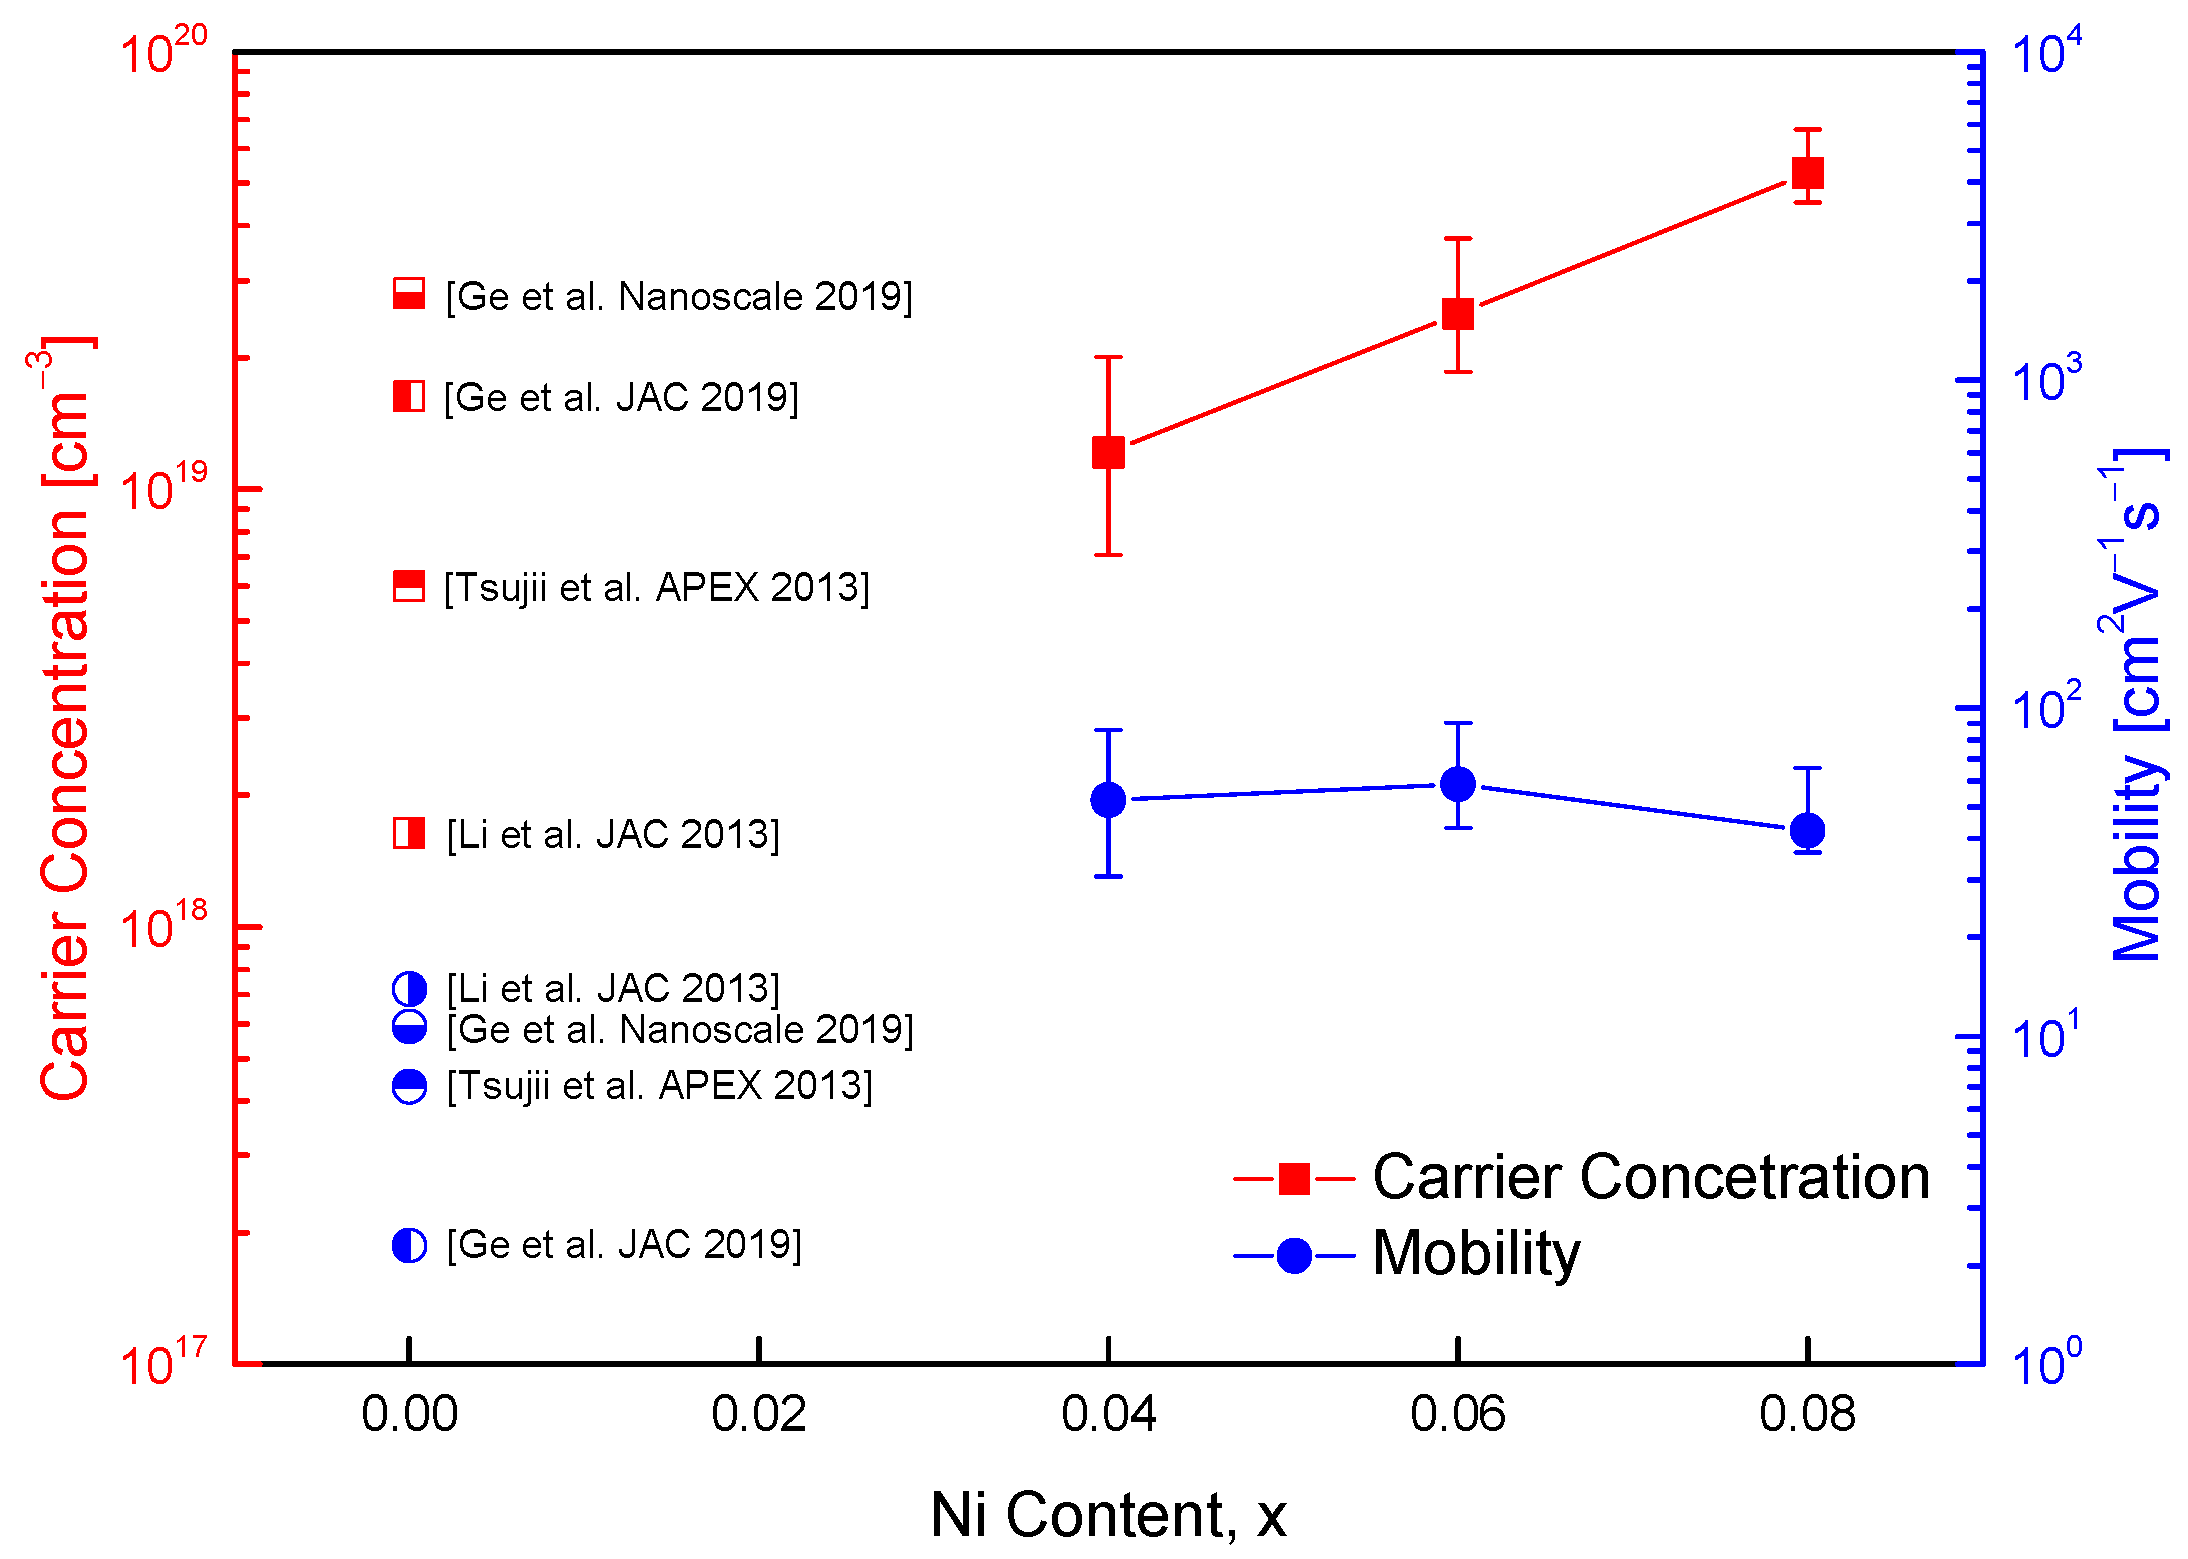
Figure 5 illustrates the carrier concentration and Hall mobility of Cu
1−xNi
xFeS
2 samples, indicating the influence of Ni substitution on charge transport properties. For context, data from undoped CuFeS
2 reported in previous studies [
9,
10,
18,
19] are also included for comparison. CuFeS
2 is known to exhibit intrinsic n-type semiconducting behavior due to native defects such as sulfur vacancies and antisite defects. Substitution of divalent Ni
2+ for monovalent Cu
+ introduces additional electrons, thereby increasing the electron carrier concentration. In this study, the carrier concentration increased from 7.8 × 10
18 cm
−3 for Cu
0.96Ni
0.04FeS
2 to 1.4 × 10
19 cm
−3 for Cu
0.92Ni
0.08FeS
2. These values are consistent with previously reported carrier concentrations for undoped CuFeS
2, which typically range between 1.6 × 10
18 and 1.6 × 10
19 cm
−3 [
9,
10,
18,
19], confirming the effectiveness of Ni doping in enhancing electron concentration. In comparison, Ge et al. [
18] reported a maximum carrier concentration of 3.7 × 10
18 cm
−3 for Ag-doped CuFeS
2, where Ag
+ substitutes for Cu
+. This relatively modest increase is due to the isovalent nature of Ag and Cu, which limits the generation of additional charge carriers. On the other hand, Cd
2+ doping at the Cu site, as reported by Ge et al. [
19], led to a much higher carrier concentration of up to 2.1 × 10
20 cm
−3, owing to the aliovalent substitution introducing a significant number of excess electrons. However, such high doping levels can also lead to increased defect scattering and reduced mobility. In the current study, a slight decrease in Hall mobility was observed with increasing Ni content: from 33.5 cm
2V
−1s
−1 for Cu
0.96Ni
0.04FeS
2 to 23.5 cm
2V
−1s
−1 for Cu
0.92Ni
0.08FeS
2. This reduction is attributed to increased impurity scattering introduced by Ni dopants, which disrupt the periodic potential and hinder carrier transport. Nonetheless, these mobility values remain significantly higher than those reported in the literature for both undoped and doped CuFeS
2 systems, which generally range from 2.3 to 13.9 cm
2V
−1s
−1 [
9,
10,
18,
19]. The relatively high mobility observed in this study may be due to improved microstructural homogeneity, as evidenced by the dense microstructure and uniform element distribution. Furthermore, the moderate doping levels and well-controlled MA–HP synthesis likely minimized the formation of defect clusters or secondary phases that typically degrade mobility.
Figure 6 illustrates the temperature dependence of electrical conductivity for Cu
1−xNi
xFeS
2 (x = 0.04–0.08). All samples exhibited semiconducting behavior, with electrical conductivity increasing with rising temperature. This behavior indicates thermally activated charge transport, where thermal excitation promotes electrons across the bandgap into the conduction band, thereby enhancing the electrical conductivity. Ni doping led to an overall increase in electrical conductivity, attributed to the substitution of Ni
2+ for Cu
+. This aliovalent substitution introduces additional electrons, increasing the carrier concentration. However, no significant difference in electrical conductivity was observed between x = 0.06 and x = 0.08. This plateau likely results from the competing effects of increased carrier concentration and enhanced carrier scattering at higher doping levels, which reduce carrier mobility. Among the compositions, Cu
0.92Ni
0.08FeS
2 exhibited the highest electrical conductivity, reaching 2.5
10
4 Sm
−1 at 723 K. Compared to prior studies, the electrical conductivity achieved in this work is notable. Ge et al. [
16] reported an increase in electrical conductivity in Cu
1−xIn
xFeS
2 from 0.3 × 10
4 Sm
−1 (x = 0) to 1.9 × 10
4 Sm
−1 (x = 0.08) at 723 K. Similarly, Ge et al. [
18,
19] found that Ag and Cd doping also enhanced conductivity, with values of 2.0 × 10
4 Sm
−1 at 323 K for Cu
0.88Ag
0.12FeS
2 and 1.3 × 10
4 Sm
−1 at 300 K for Cu
0.92Cd
0.08FeS
2. However, these doped systems exhibited degenerate semiconductor behavior, characterized by decreasing electrical conductivity with increasing temperature—a behavior associated with metal-like conduction due to a high carrier concentration. A similar degenerate trend was observed by Xie et al. [
20] in Zn-doped Cu
1−xZn
xFeS
2, where the electrical conductivity increased with Zn doping up to 3.0 × 10
4 Sm
−1 at 300 K, but decreased to 1.5 × 10
4 Sm
−1 at 630 K. Berthebaud et al. [
21] also reported behavior associated with metallic conduction in Co-doped Cu
1−xCo
xFeS
2, where the electrical resistivity decreased with temperature. In contrast, the present study’s Ni-doped samples clearly exhibit semiconducting behavior, even at high carrier concentrations. This discrepancy is intriguing and suggests that the electronic structure of Ni-doped chalcopyrite differs from that of other metal-doped chalcopyrites. Based on the carrier concentration range shown in
Figure 5, degenerate behavior would typically be expected. However, the persistence of semiconducting behavior, marked by an increase in conductivity with temperature, suggests that intrinsic excitations significantly influence charge transport at elevated temperatures. Ni doping likely shifts the Fermi level closer to the conduction band minimum, enhancing electron population. At higher temperatures, intrinsic excitation across the bandgap could become significant, resulting in a rapid increase in electron concentration and electrical conductivity. This hypothesis is supported by the sharp rise in conductivity observed at elevated temperatures, particularly for Cu
0.92Ni
0.08FeS
2. In thermoelectric materials, the onset of intrinsic excitation is typically accompanied by a decrease in the absolute value of the Seebeck coefficient. Thus, further insights into this behavior can be gained by correlating electrical conductivity with the temperature dependence of the Seebeck coefficient, as discussed in the subsequent sections.
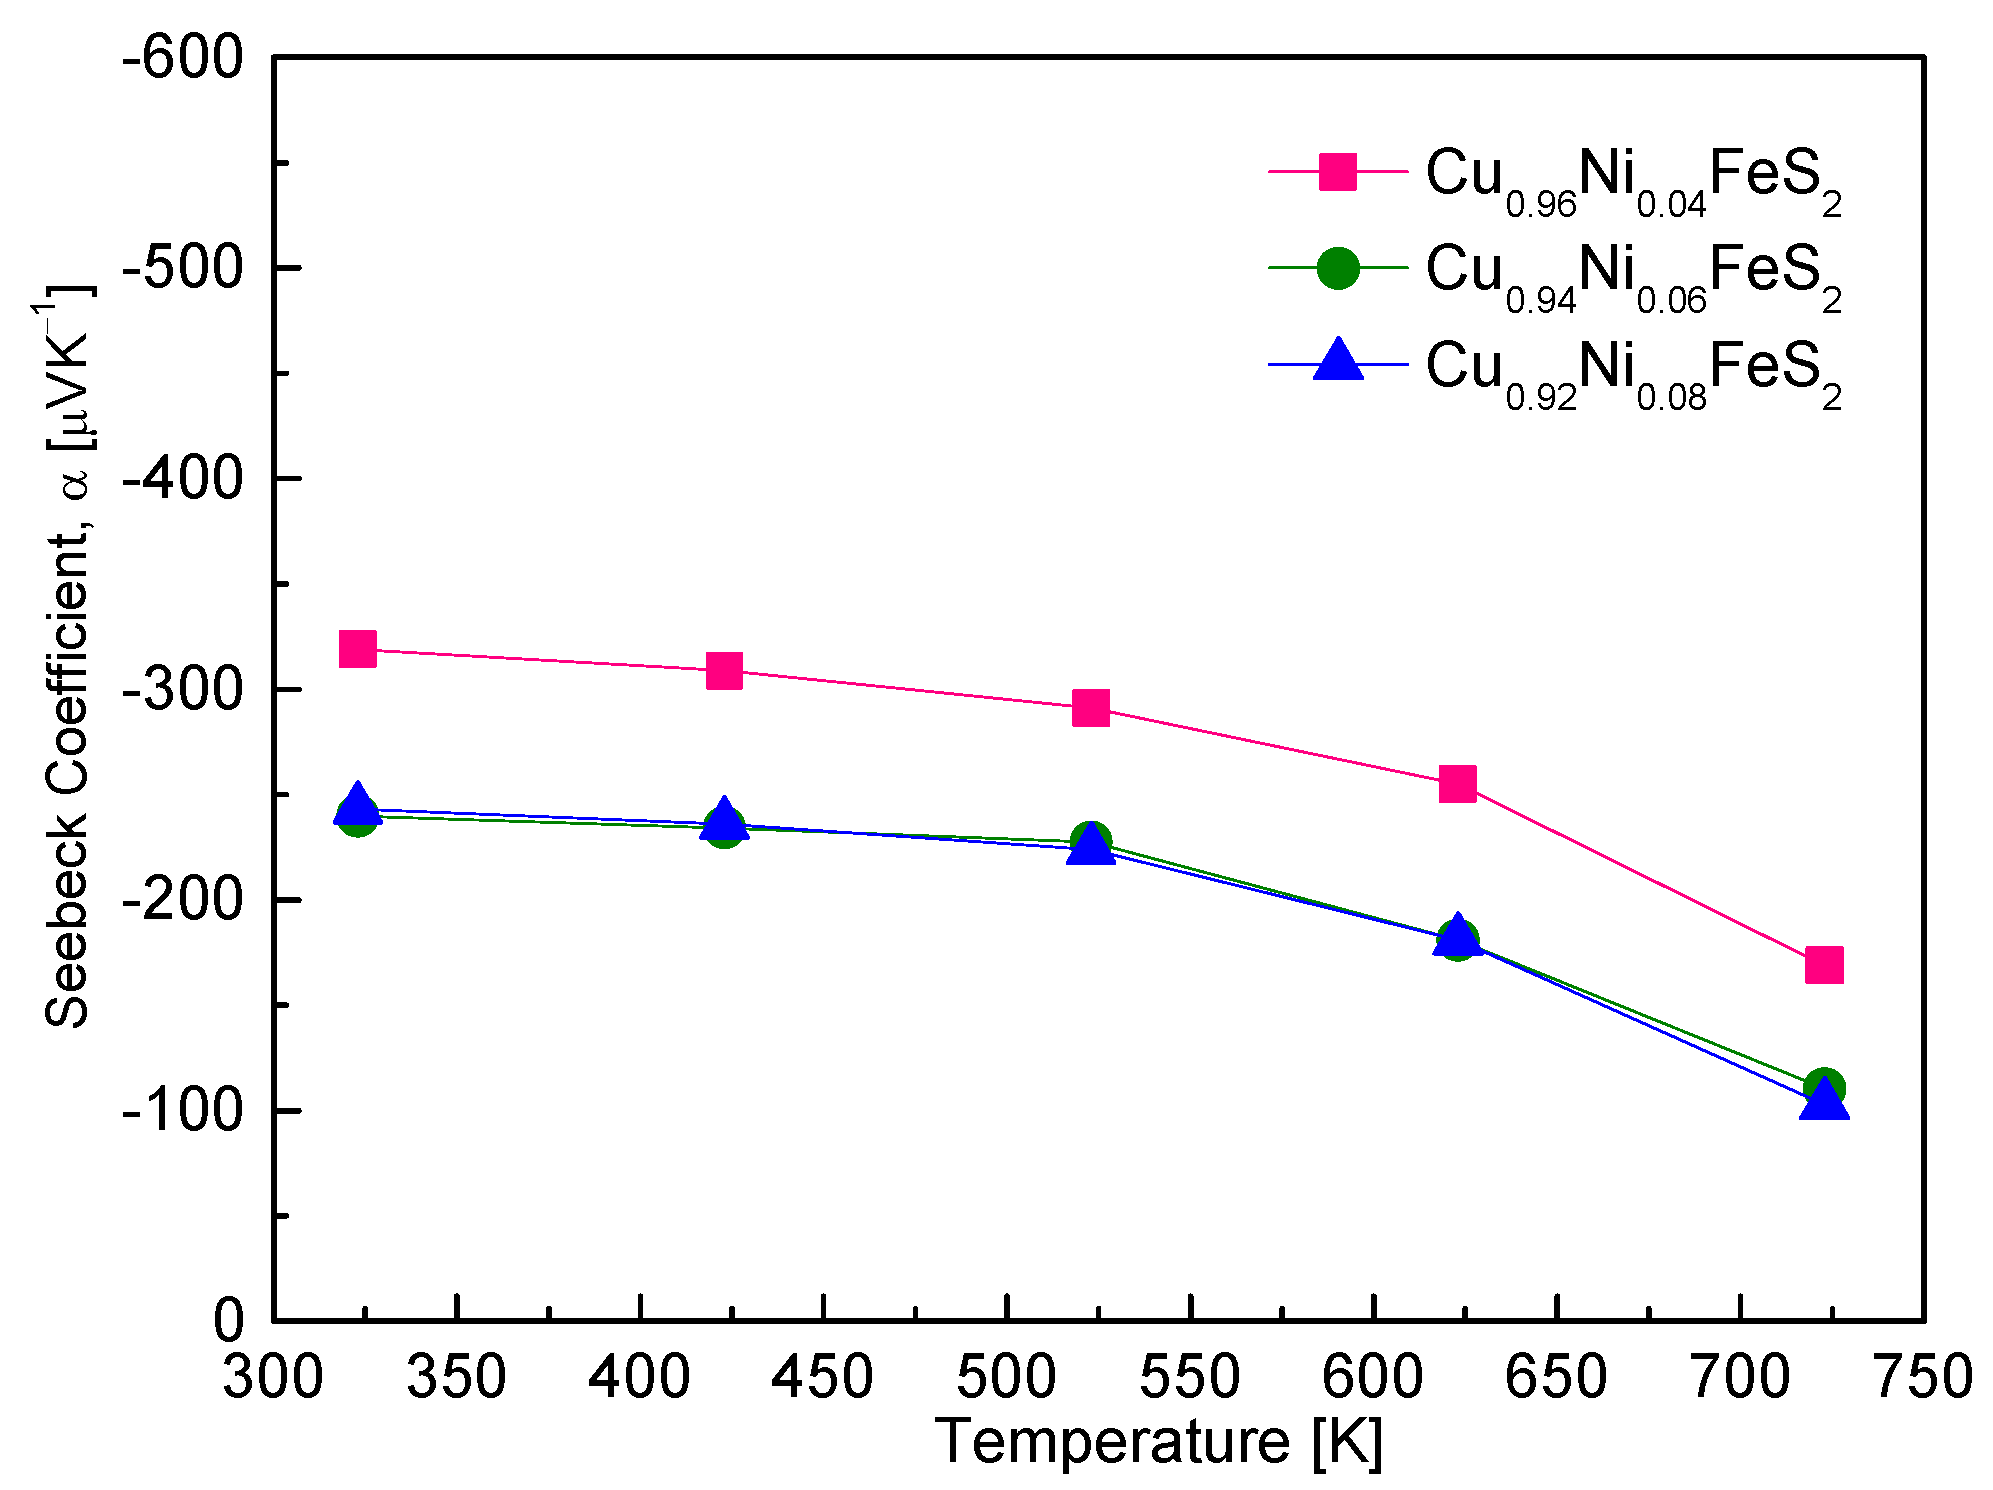
Figure 7 presents the temperature-dependent Seebeck coefficient of Cu
1−xNi
xFeS
2 samples. All samples exhibited negative Seebeck coefficients across the entire measured temperature range (323–723 K), confirming their n-type semiconducting behavior. The origin of this behavior lies in the substitution of Ni
2+ for Cu
+, which introduces excess electrons and increases the electron carrier concentration, as expected from the following relation [
20]: α = (8/3)π
2k
B2e
−1h
−2m*T(π/3n)
2/3, where k
B denotes the Boltzmann constant, e denotes the electron charge, h denotes the Planck constant, m
⁎ denotes the effective mass of the carriers, and n denotes the carrier concentration [
20]. According to this relationship, the Seebeck coefficient is inversely related to the carrier concentration and directly proportional to the temperature and effective mass. In this study, Cu
0.96Ni
0.04FeS
2 demonstrated the largest absolute values of the Seebeck coefficient, ranging from −319 to −169 μVK
−1, depending on temperature. As Ni content increased, the absolute Seebeck coefficient systematically decreased due to the enhanced carrier concentration. This is consistent with the inverse relationship between the Seebeck coefficient and carrier concentration predicted by the above equation. Furthermore, all Ni-doped samples exhibited a decline in the absolute value of the Seebeck coefficient with increasing temperature, particularly above ~573 K. This trend suggests the occurrence of intrinsic excitation, where thermal energy promotes a significant number of electrons from the valence band to the conduction band, thereby increasing the total carrier concentration and reducing the Seebeck coefficient. The presence of intrinsic transitions also explains the positive temperature dependence of electrical conductivity observed in
Figure 6. While degenerate semiconductors often exhibit metallic behavior (decreasing conductivity with increasing temperature), the onset of intrinsic conduction can reverse this trend. The correlation between the rapid decline in Seebeck coefficient and the increase in electrical conductivity at high temperatures strongly supports this interpretation. Ge et al. [
18] found that Cu
1−xAg
xFeS
2 showed a decrease in the absolute value of α with increasing Ag content, attributed to bandgap narrowing and a resulting reduction in the effective mass of electrons. Similarly, Xie et al. [
20] reported that, in Cu
1−xZn
xFeS
2, the Seebeck coefficient decreased with increasing Zn content, reaching −70 μVK
−1 at 630 K for Cu
0.9Zn
0.1FeS
2, suggesting a complex interplay between enhanced carrier concentration and changes in effective mass due to Zn doping. Berthebaud et al. [
21] and Lefevre et al. [
22] also observed decreasing Seebeck coefficients with increasing doping levels of Co and Mn, respectively, when doped at the Cu site. These results confirm that metal cation substitution at the Cu site induces n-type conductivity in chalcopyrite and increases the carrier concentration, leading to a reduced absolute value of the Seebeck coefficient. The magnitude of Seebeck coefficient is therefore governed not only by carrier concentration but also by factors like the effective mass and the onset of intrinsic transitions at elevated temperatures.
Figure 8 presents the power factor (PF) of Cu
1−xNi
xFeS
2, which serves as a critical indicator of thermoelectric performance by combining electrical conductivity and the Seebeck coefficient. In the Ni-doped samples, the PF exhibited a peak within the temperature range of 523–623 K, with Cu
0.96Ni
0.04FeS
2 achieving the highest value of 0.50 mWm
−1K
−2 at 623 K. Interestingly, PF values decreased with increasing Ni content, indicating that while Ni doping initially enhances carrier concentration and thereby electrical conductivity, excessive Ni content may lead to detrimental effects such as enhanced charge carrier scattering or a sharp reduction in the Seebeck coefficient. When compared to undoped CuFeS
2 [
18], which showed lower PF values of 0.45 mWm
−1K
−2 at 323 K and 0.25 mWm
−1K
−2 at 723 K, the Ni-doped composition demonstrated superior performance in the high-temperature region. This suggests that Ni doping effectively boosts thermoelectric efficiency at elevated temperatures, where the conductivity gain compensates for the Seebeck loss. A comparative analysis with other dopants provides further insight into the relative efficacy of Ni doping. Ge et al. [
16,
18,
19] reported significantly higher PF values for other metal substitutions in CuFeS
2, including 0.74 mWm
−1K
−2 for Cu
0.96In
0.04FeS
2, 0.95 mWm
−1K
−2 for Cu
0.88Ag
0.12FeS
2, and 0.43 mWm
−1K
−2 for Cu
0.92Cd
0.08FeS
2. Among these, Ag doping yielded the highest PF, most likely due to its dual role in enhancing carrier mobility and inducing favorable modifications in the electronic band structure. In contrast, while Cd doping yielded PF values slightly lower than those for Ni at high temperature, it still showed a comparable enhancement over the undoped material. Moreover, Xie et al. [
20] reported a peak PF of 0.97 mWm
−1K
−2 at 300 K for Cu
0.96Zn
0.04FeS
2—almost double that of the Ni-doped sample at its highest point. This remarkable performance was attributed to a combination of increased electrical conductivity and an enhanced effective mass of charge carriers due to Zn doping. However, as the temperature increased to 630 K, the PF declined to 0.81 mWm
−1K
−2, still outperforming the Ni-doped composition. This indicates that Zn doping not only improves PF at room temperature but retains relatively high performance across a broader temperature range. Additionally, Berthebaud et al. [
21] found that Cu
0.96Co
0.04FeS
2 exhibited a PF of 0.62 mWm
−1K
−2 at 370 K, further underscoring that alternative dopants like Co can offer better low-to-mid temperature PF performance than Ni. The superior PF observed with In, Ag, and Zn doping in other studies suggests that Ni doping, while moderately effective, does not optimize the electronic band structure or carrier scattering mechanisms as effectively as these elements. Overall, although Ni doping improves the PF of CuFeS
2, especially in the higher-temperature region, it is less effective compared to other metal dopants.
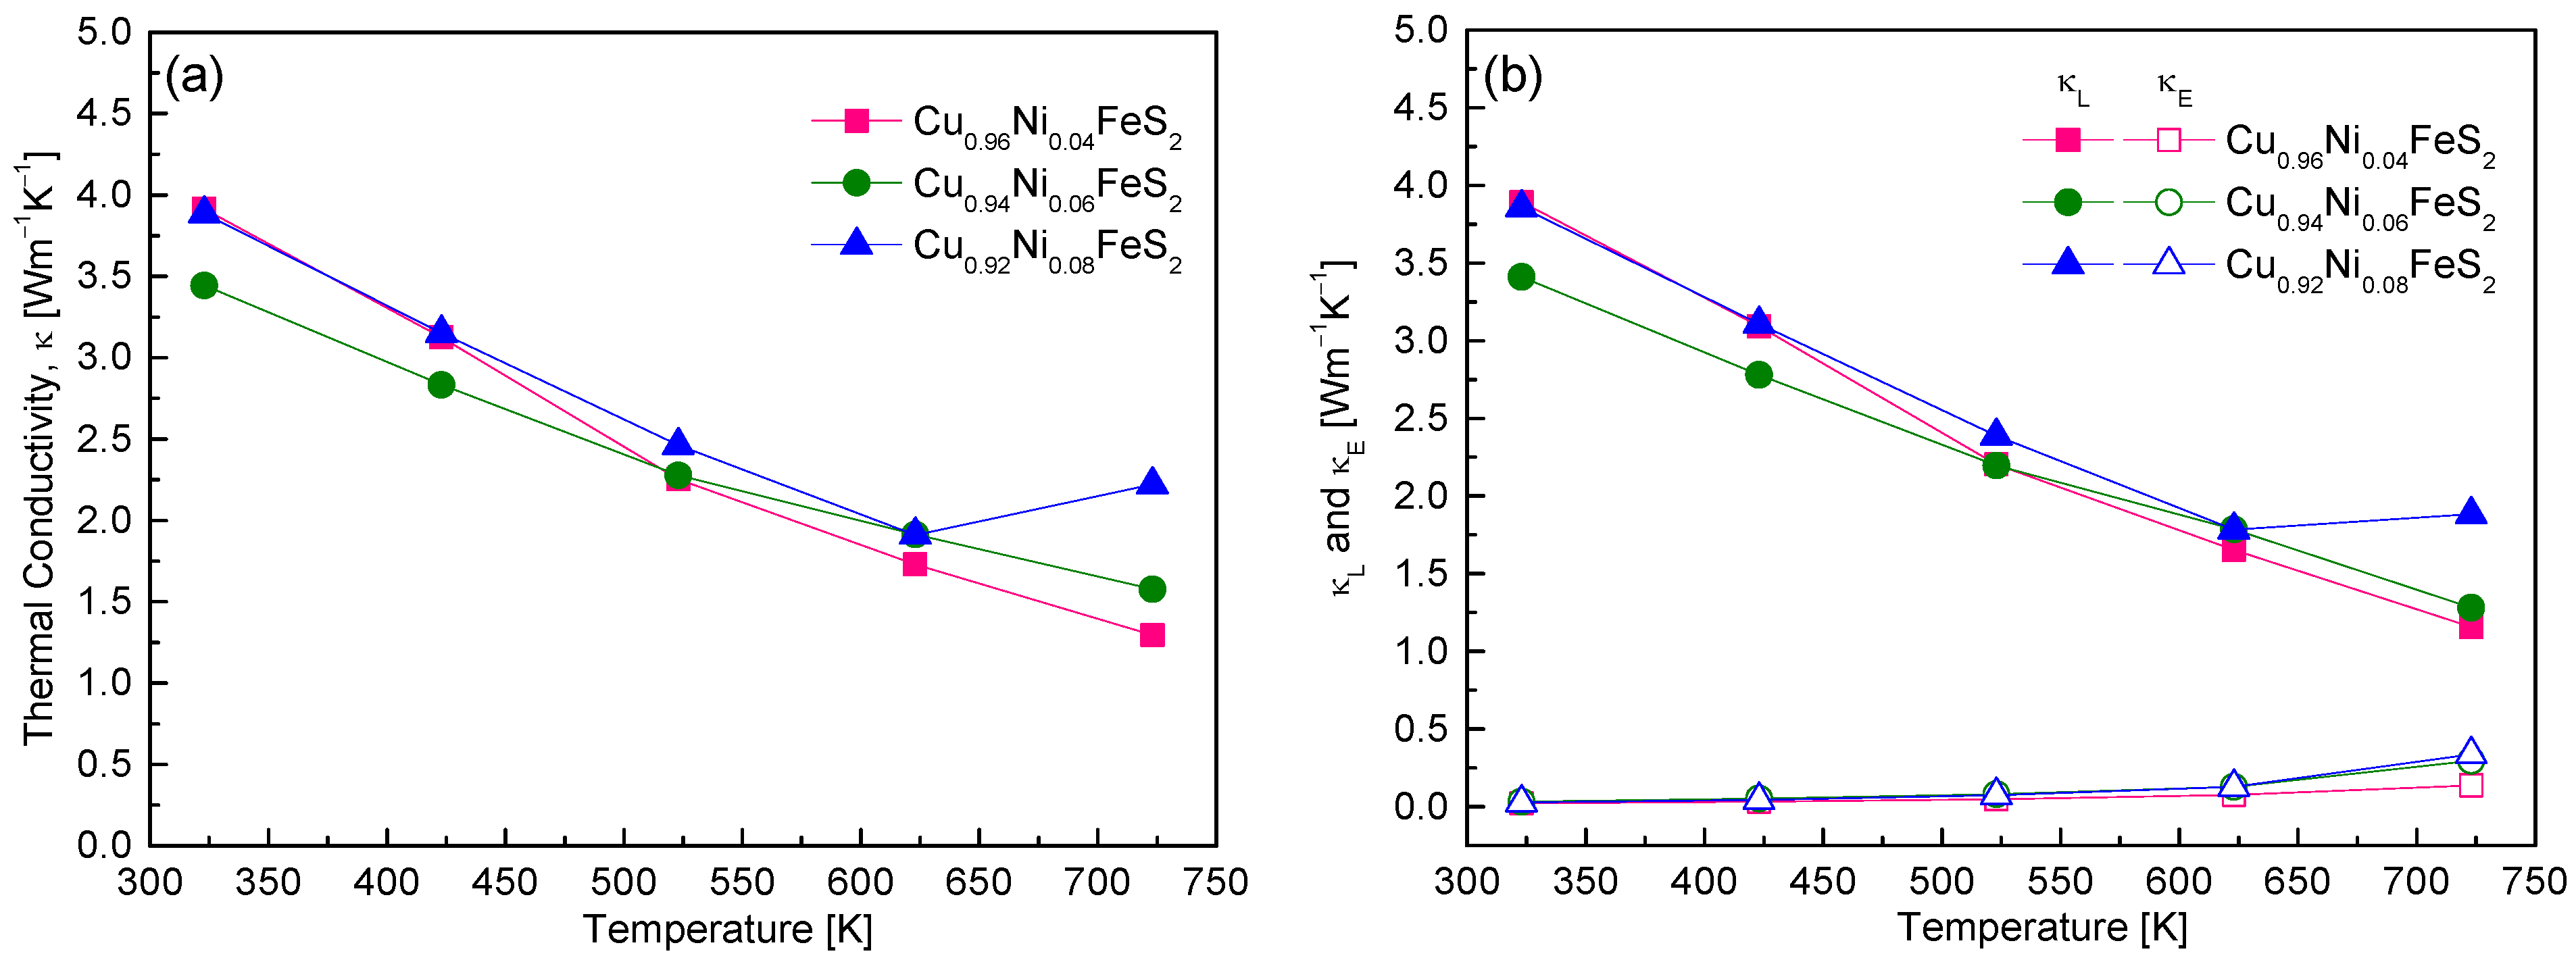
Figure 9 presents the thermal conductivity behavior of Cu
1−xNi
xFeS
2, highlighting the impact of Ni doping on phonon and electronic transport properties. Across all compositions, the total thermal conductivity decreased with the increase in temperature, a typical characteristic of crystalline semiconductors where Umklapp phonon–phonon scattering becomes dominant at elevated temperatures [
18]. Among the samples, Cu
0.96Ni
0.04FeS
2 exhibited the lowest thermal conductivity of 1.29 Wm
−1K
−1 at 723 K, which is slightly lower than the previously reported minimum value of 1.32 Wm
−1K
−1 for undoped CuFeS
2 [
7,
16]. To better understand the origins of this reduction, the total thermal conductivity was separated into electronic (κ
E) and lattice (κ
L) contributions (
Figure 9b). The electronic thermal conductivity was estimated using the Wiedemann–Franz law (κ
E = LσT), where the Lorenz number L was calculated via the single parabolic band model [
18]. Subtracting κ
E from the total thermal conductivity yielded κ
L. The results showed that κ
E was significantly lower than κ
L for all doping levels, confirming that thermal transport in Cu
1−xNi
xFeS
2 is predominantly governed by phonons. This aligns with the findings of Lefevre et al. [
22], who reported that, in doped chalcopyrites, the lattice contribution is the major component of the thermal conductivity, and the influence of doping on κ
E is generally minor. Interestingly, κ
E did increase with higher Ni doping, consistent with the observed rise in carrier concentration and electrical conductivity. For instance, the κ
E value for Cu
0.92Ni
0.08FeS
2 reached 0.34 Wm
−1K
−1 at 723 K. Nonetheless, even at this level, it remained well below κ
L, reaffirming the phonon-dominated nature of thermal transport. The temperature and composition trends of κ
L followed those of total κ, indicating that Ni atoms substituted at Cu sites acted as efficient phonon-scattering centers. This phonon scattering is likely due to mass and strain field fluctuations introduced by the Ni dopants, which disrupt the regular lattice vibrations and impede heat transport. Cu
0.96Ni
0.04FeS
2 achieved the lowest κₗ value of 1.16 Wm
−1K
−1 at 723 K. However, in Cu
0.92Ni
0.08FeS
2, κ
L slightly increased above 623 K, which is attributed to bipolar conduction—a phenomenon where both electrons and holes contribute to thermal transport at high temperatures—counteracting the typical phonon scattering-induced decline. When compared to other doped chalcopyrites, Ni-doped CuFeS
2 exhibits moderately low thermal conductivity. Ge et al. [
16] achieved a significantly lower κ
L of 0.79 Wm
−1K
−1 at 723 K for Cu
0.92In
0.08FeS
2, approaching the theoretical minimum of 0.74 Wm
−1K
−1. This reduction is attributed to the strong phonon-scattering effect of In atoms. Similarly, Ge et al. [
18] showed that Ag doping reduced κ
L to 1.2 Wm
−1K
−1 in Cu
0.88Ag
0.12FeS
2 due to the mass contrast introduced by Ag atoms. Ge et al. [
19] reported that secondary phases such as FeS
2 and CdS formed in Cu
0.92Cd
0.08FeS
2 also served as phonon-scattering centers, reducing κ to ~1 Wm
−1K
−1. In contrast, Xie et al. [
20] found that, in Cu
1−xZn
xFeS
2, Zn atoms and ZnS nanoparticles provided less effective scattering, resulting in a higher minimum κ of ~2 Wm
−1K
−1 for Cu
0.92Zn
0.08FeS
2. In the present study, Ni doping in chalcopyrite effectively reduces thermal conductivity primarily through enhanced phonon scattering, though its impact is somewhat less pronounced than that achieved by In, Ag, or Cd doping. Nonetheless, it presents a balanced approach by simultaneously maintaining acceptable electronic transport properties, making it a viable strategy for thermoelectric performance optimization in chalcopyrite systems.
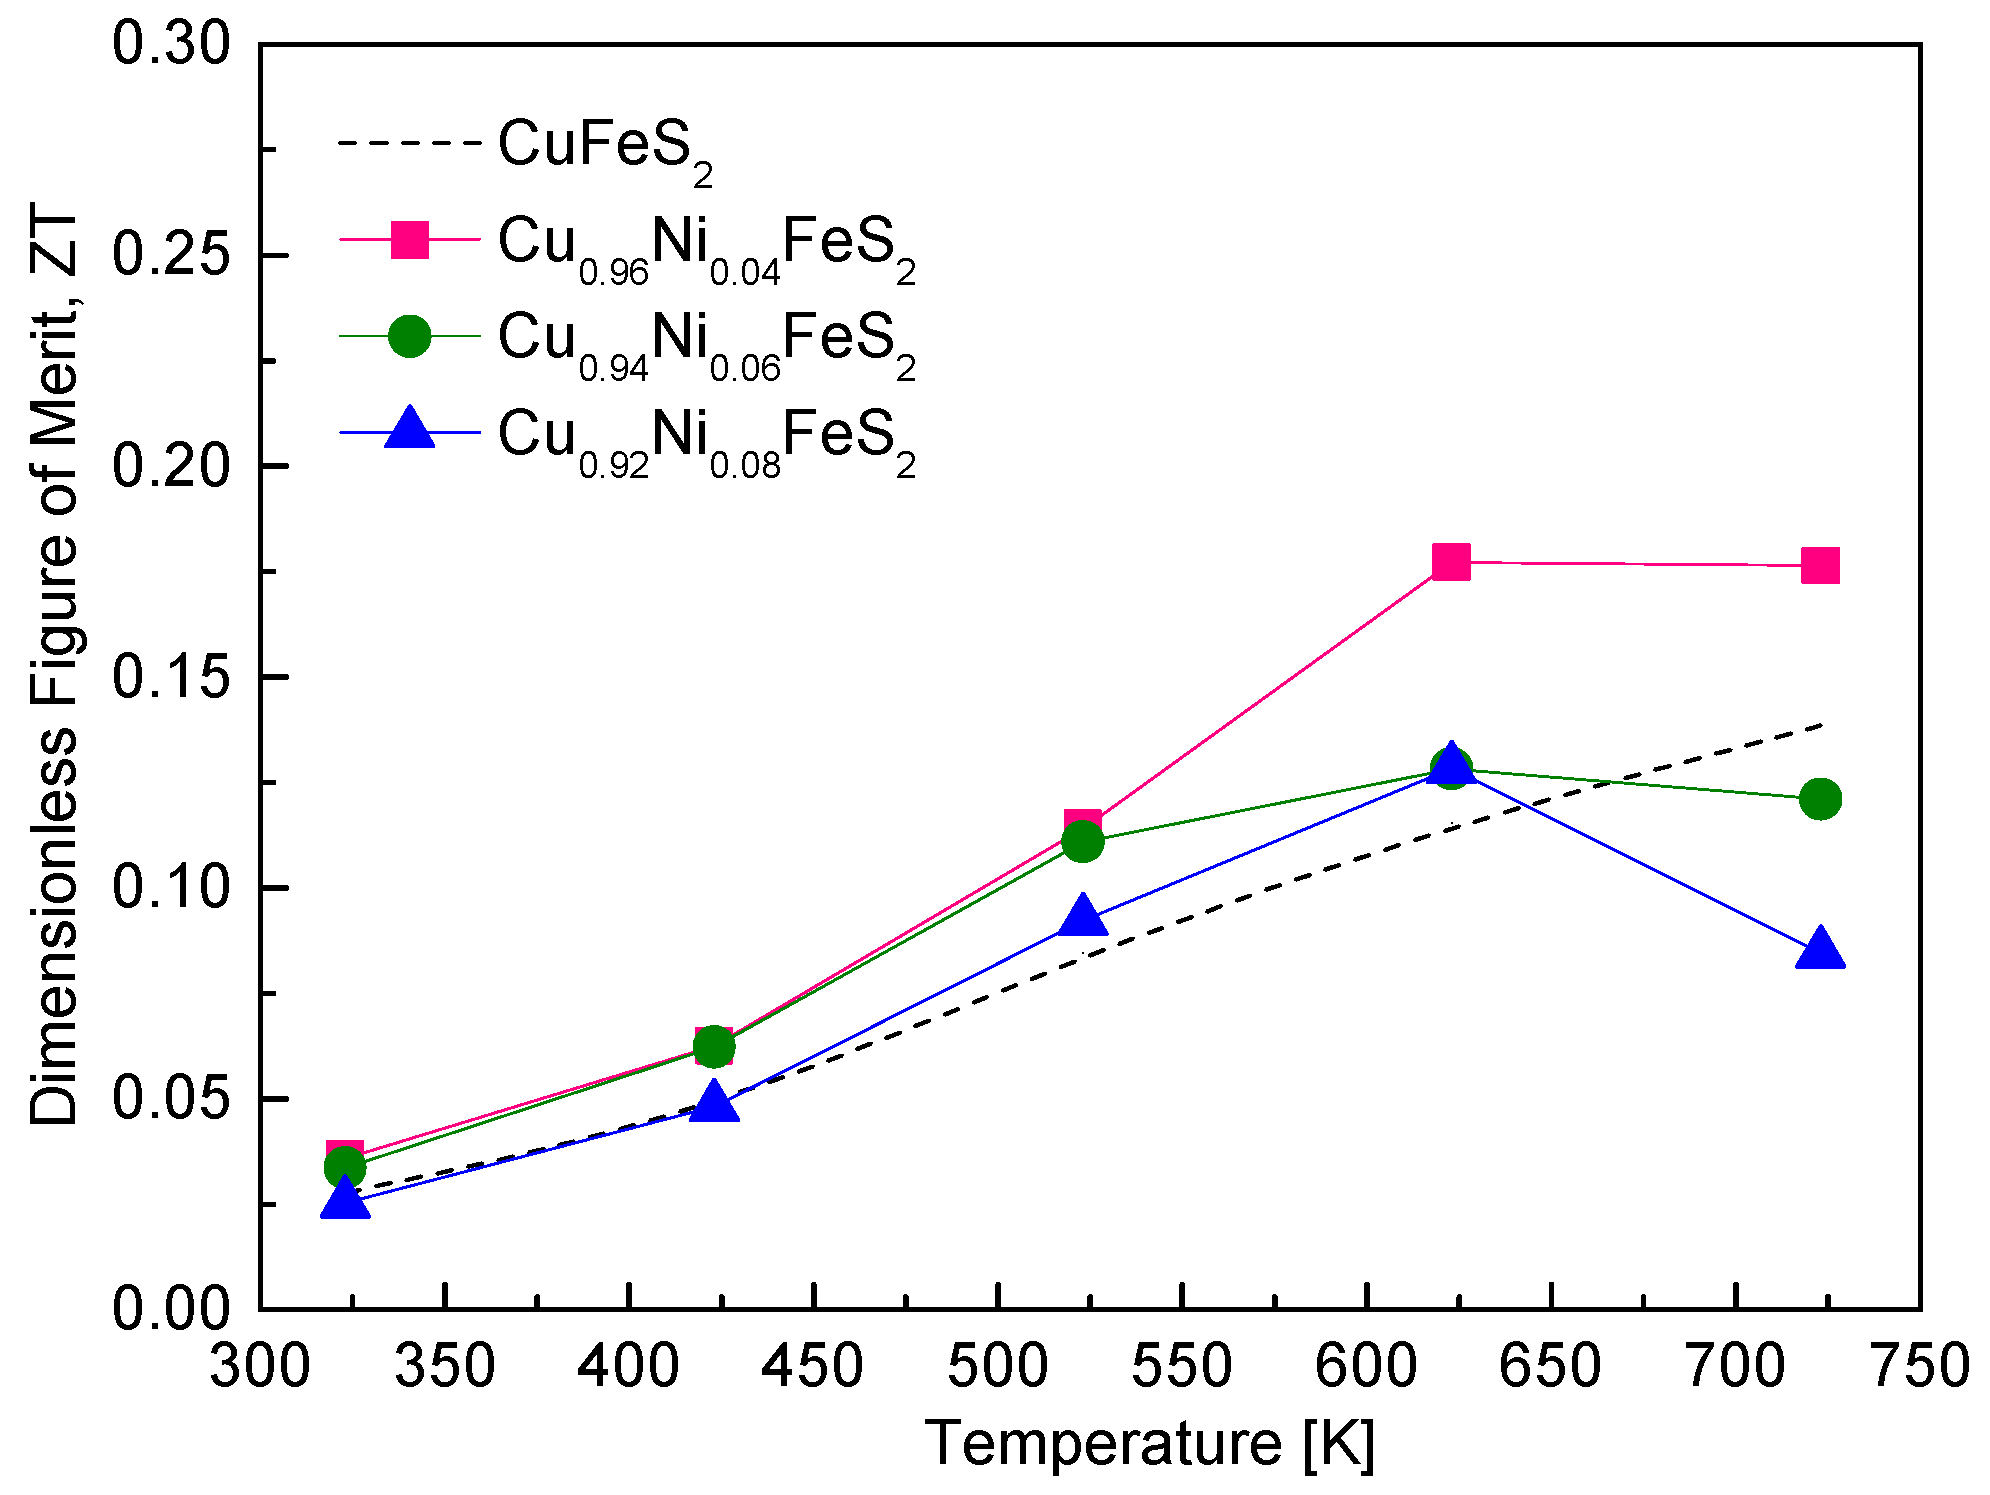
Figure 10 illustrates the thermoelectric figure of merit (ZT) of Cu
1−xNi
xFeS
2 as a function of temperature. The ZT values for all samples increased with the rising temperature due to the enhanced power factor and reduced lattice thermal conductivity at elevated temperatures. Among the compositions, Cu
0.96Ni
0.04FeS
2 exhibited the highest ZT value of 0.18 in the temperature range of 623–723 K, representing a moderate improvement over undoped CuFeS
2, which has a ZT of 0.14 at 723 K [
18]. This enhancement reflects the beneficial effect of Ni doping, where increased electrical conductivity, due to higher carrier concentration, compensates for the slight reduction in the Seebeck coefficient and contributes to improved PF and ultimately higher ZT. However, increasing the Ni doping level beyond 4 at.% (i.e., x > 0.04) led to a decrease in ZT, primarily due to a drop in the power factor. Although higher doping levels enhanced electrical conductivity further, the accompanying reduction in the Seebeck coefficient and the onset of bipolar conduction at high temperatures negatively impacted the thermoelectric efficiency. When compared to other doped CuFeS
2-based chalcopyrites, the ZT values achieved in this study are modest. For instance, Ge et al. [
16,
18] reported significantly higher ZT values of 0.36 at 723 K for Cu
0.92In
0.08FeS
2 and 0.32 at 600 K for Cu
0.88Ag
0.12FeS
2. These compositions were synthesized using the melting–grinding–spark plasma sintering (SPS) process, which is known to produce dense, fine-grained microstructures that are effective at scattering phonons, thus lowering thermal conductivity and enhancing ZT. Xie et al. [
20] achieved a ZT of 0.26 at 630 K for Cu
0.92Zn
0.08FeS
2, synthesized using melting followed by plasma-activated sintering (PAS). Notably, even though the Zn solubility limit was x = 0.03, excess Zn led to the formation of ZnS nanoparticles, which acted as efficient phonon-scattering centers and reduced lattice thermal conductivity, boosting ZT. Similarly, Berthebaud et al. [
21] observed a ZT of 0.22 at 675 K for Cu
0.94Co
0.06FeS
2 prepared by a combination of cold pressing, solid-state reaction, and SPS, further emphasizing the role of process-induced microstructural control in improving thermoelectric performance. Ge et al. [
19] demonstrated the highest reported ZT among these studies, achieving a value of 0.39 at 723 K for Cu
0.92Cd
0.08FeS
2. This remarkable enhancement was attributed to the introduction of multi-scale defects via a complex synthesis route involving melting, quenching, annealing, high-energy ball milling, and PAS. These multi-scale defects were highly effective in scattering a broad spectrum of phonons, significantly lowering lattice thermal conductivity while preserving good electrical transport. Additionally, Lefevre et al. [
22] reported a ZT of 0.20 at 623 K for Cu
0.97Mn
0.03FeS
2, synthesized using melting–annealing–SPS. They proposed that d-shell spin disorder scattering, introduced by Mn atoms, played a crucial role in improving ZT by disrupting phonon transport without severely affecting carrier mobility.


