3.1. Deformation Behavior Analysis
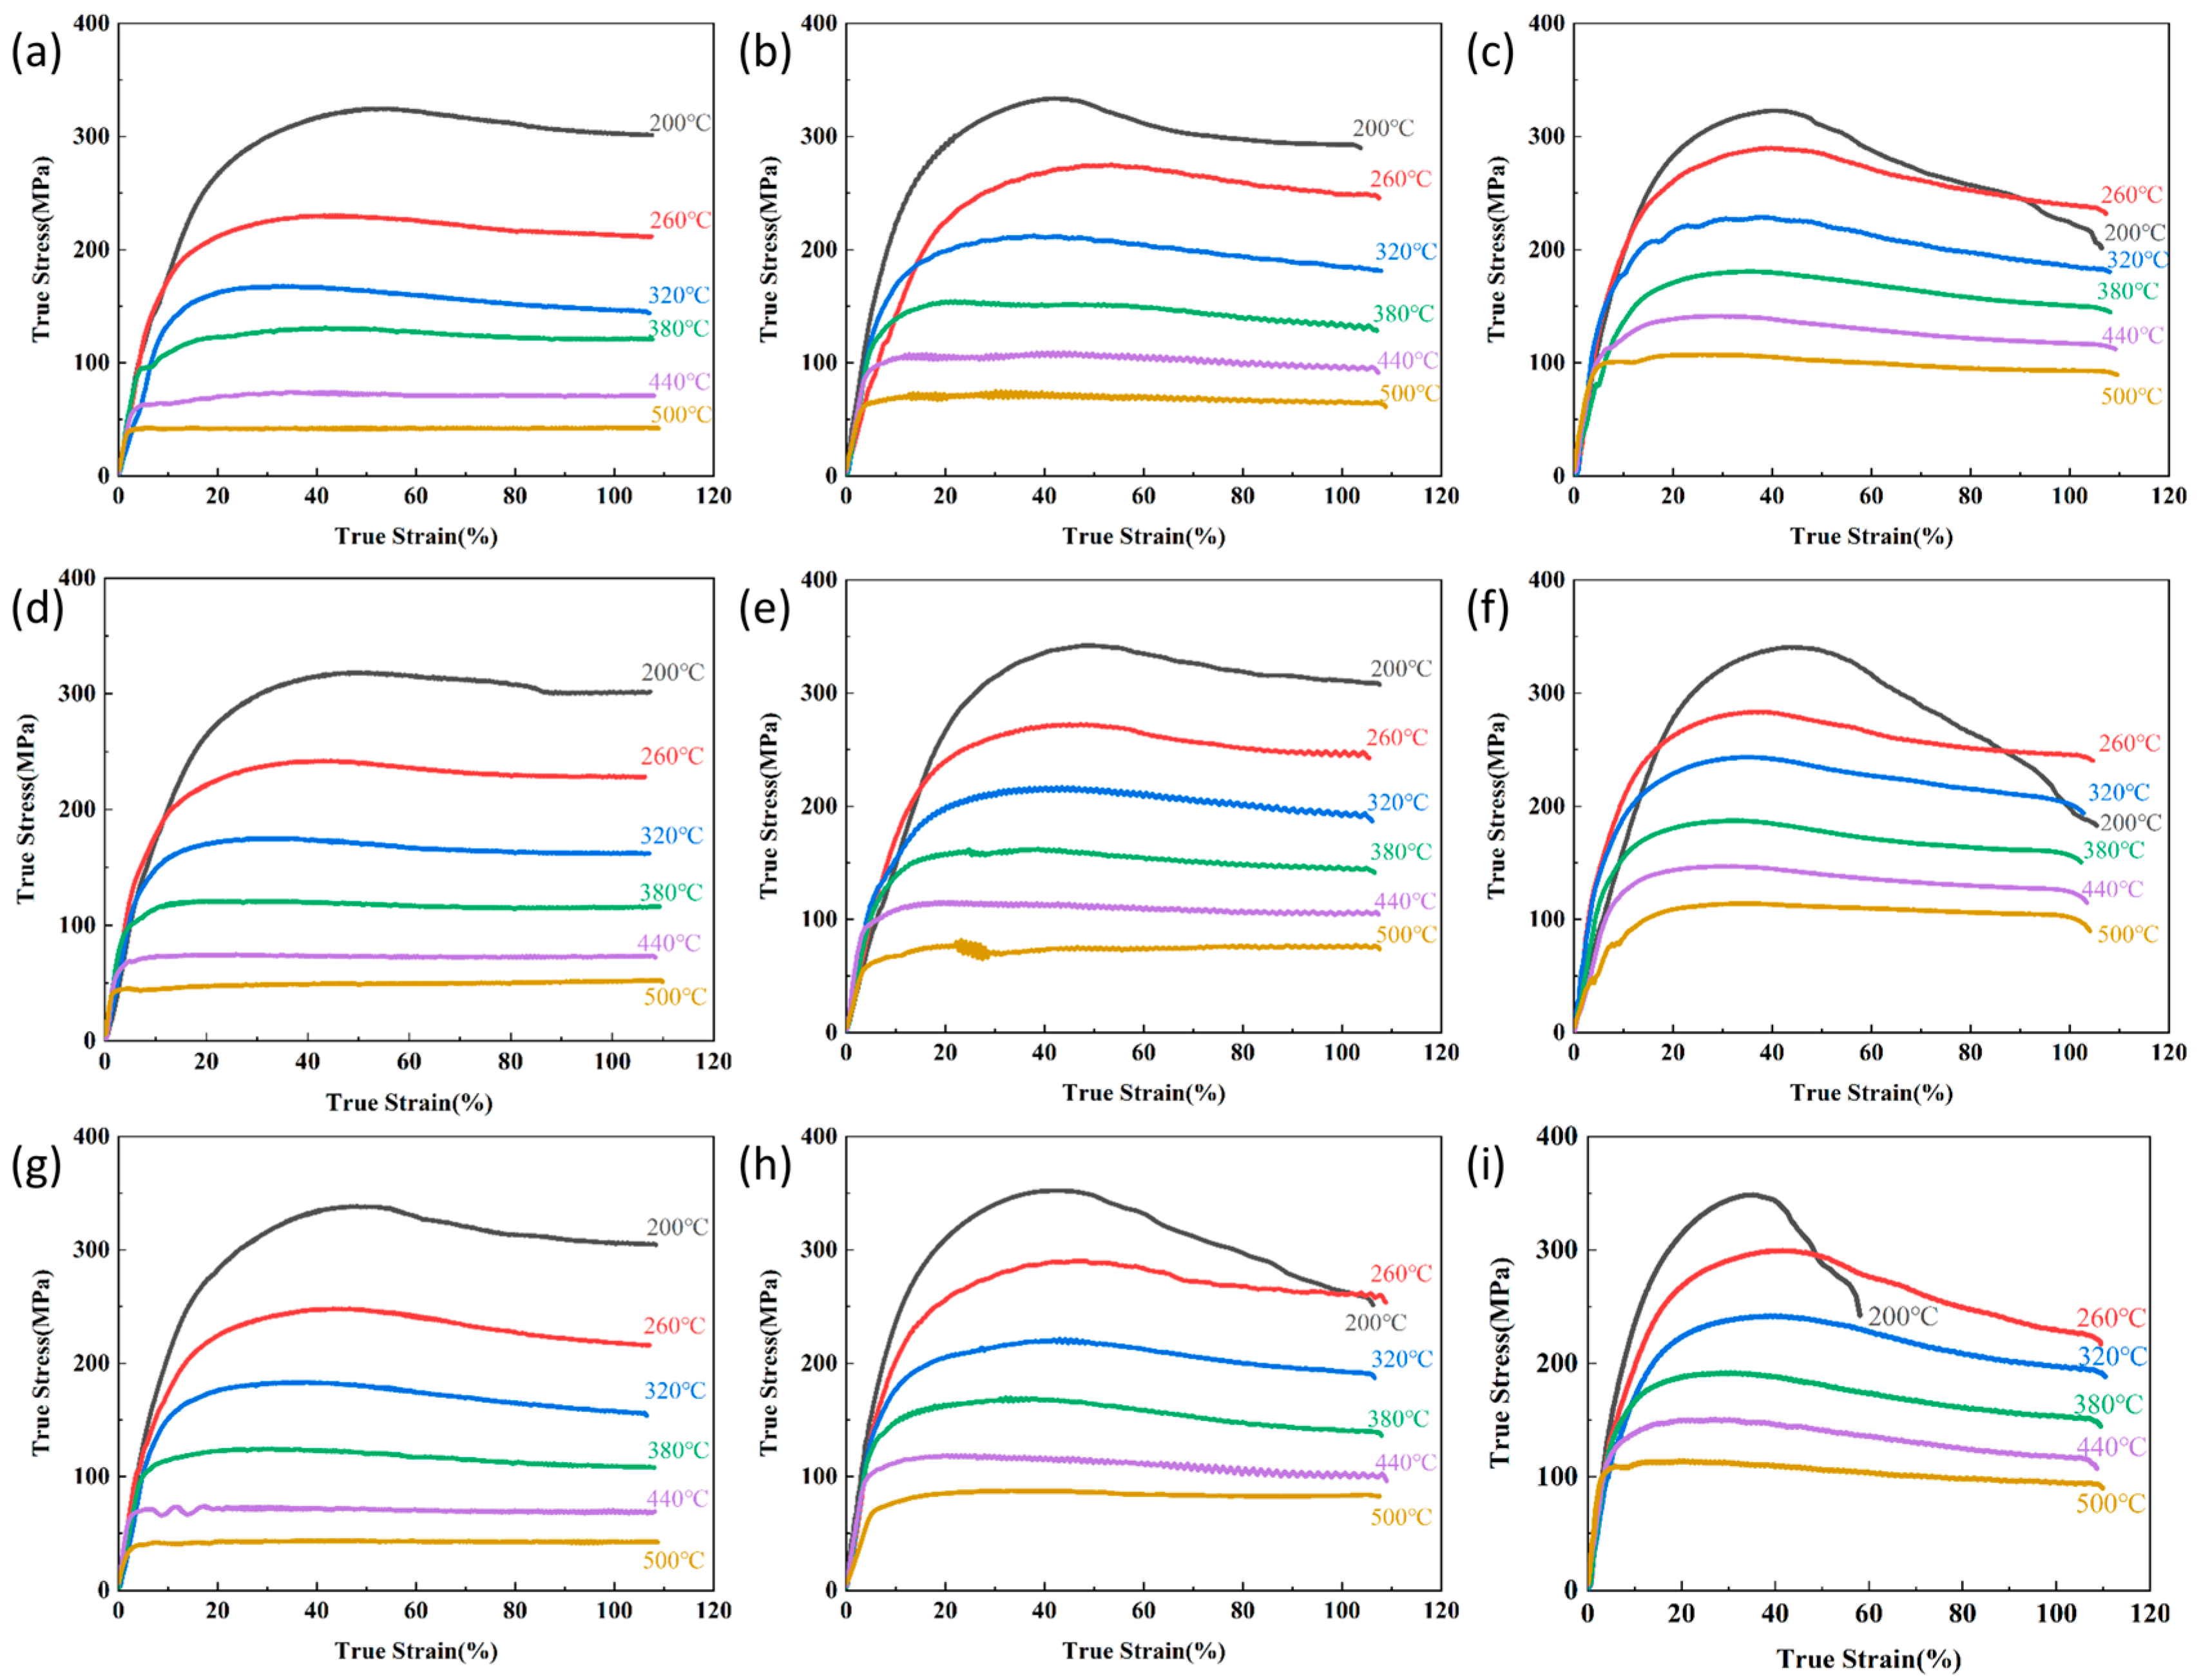
The thermal simulation experiments for the flow stress curves are shown in
Figure 2, which illustrate variations in the Mg content, temperature, and strain rate. The curves show a rapid initial stress increase due to dominant work hardening. Under external loading, accelerated dislocation multiplication forms high-density dislocation cell structures, and the obstruction of subsequent dislocation motion leads to sharp rises in deformation resistance [
10]. As deformation progresses, accumulated stored energy activates dynamic recovery (DRV) processes through dislocation climb and annihilation. The rearrangement of dislocations into lower-energy configurations reduces entanglement density, partially counteracting work hardening effects and decelerating stress growth. Under high-temperature/low-strain-rate conditions, enhanced thermal activation enables extensive dislocation reorganization through dynamic recrystallization (DRX). During DRX, strain-free grains nucleate, significantly reducing deformation resistance through pronounced softening [
11]. This transition from DRV to DRX-dominated mechanisms results in substantially slower stress accumulation rates.
Post-peak stress behavior exhibits three distinct patterns: (1) stress stabilization under continued strain, indicating dynamic equilibrium between work hardening and softening (predominant at high temperatures/low strain rates, e.g., 500 °C/0.05 s−1); (2) flow stress reduction until deformation completion, suggesting sustained dominance of dynamic softening over hardening or microcrack-induced stress relaxation; and (3) yield fracture termination.
Notably, the flow curves in
Figure 2 still show a gradual transition to steady-state flow at high temperatures, which is characteristic of partial DRX occurring alongside dominant DRV.
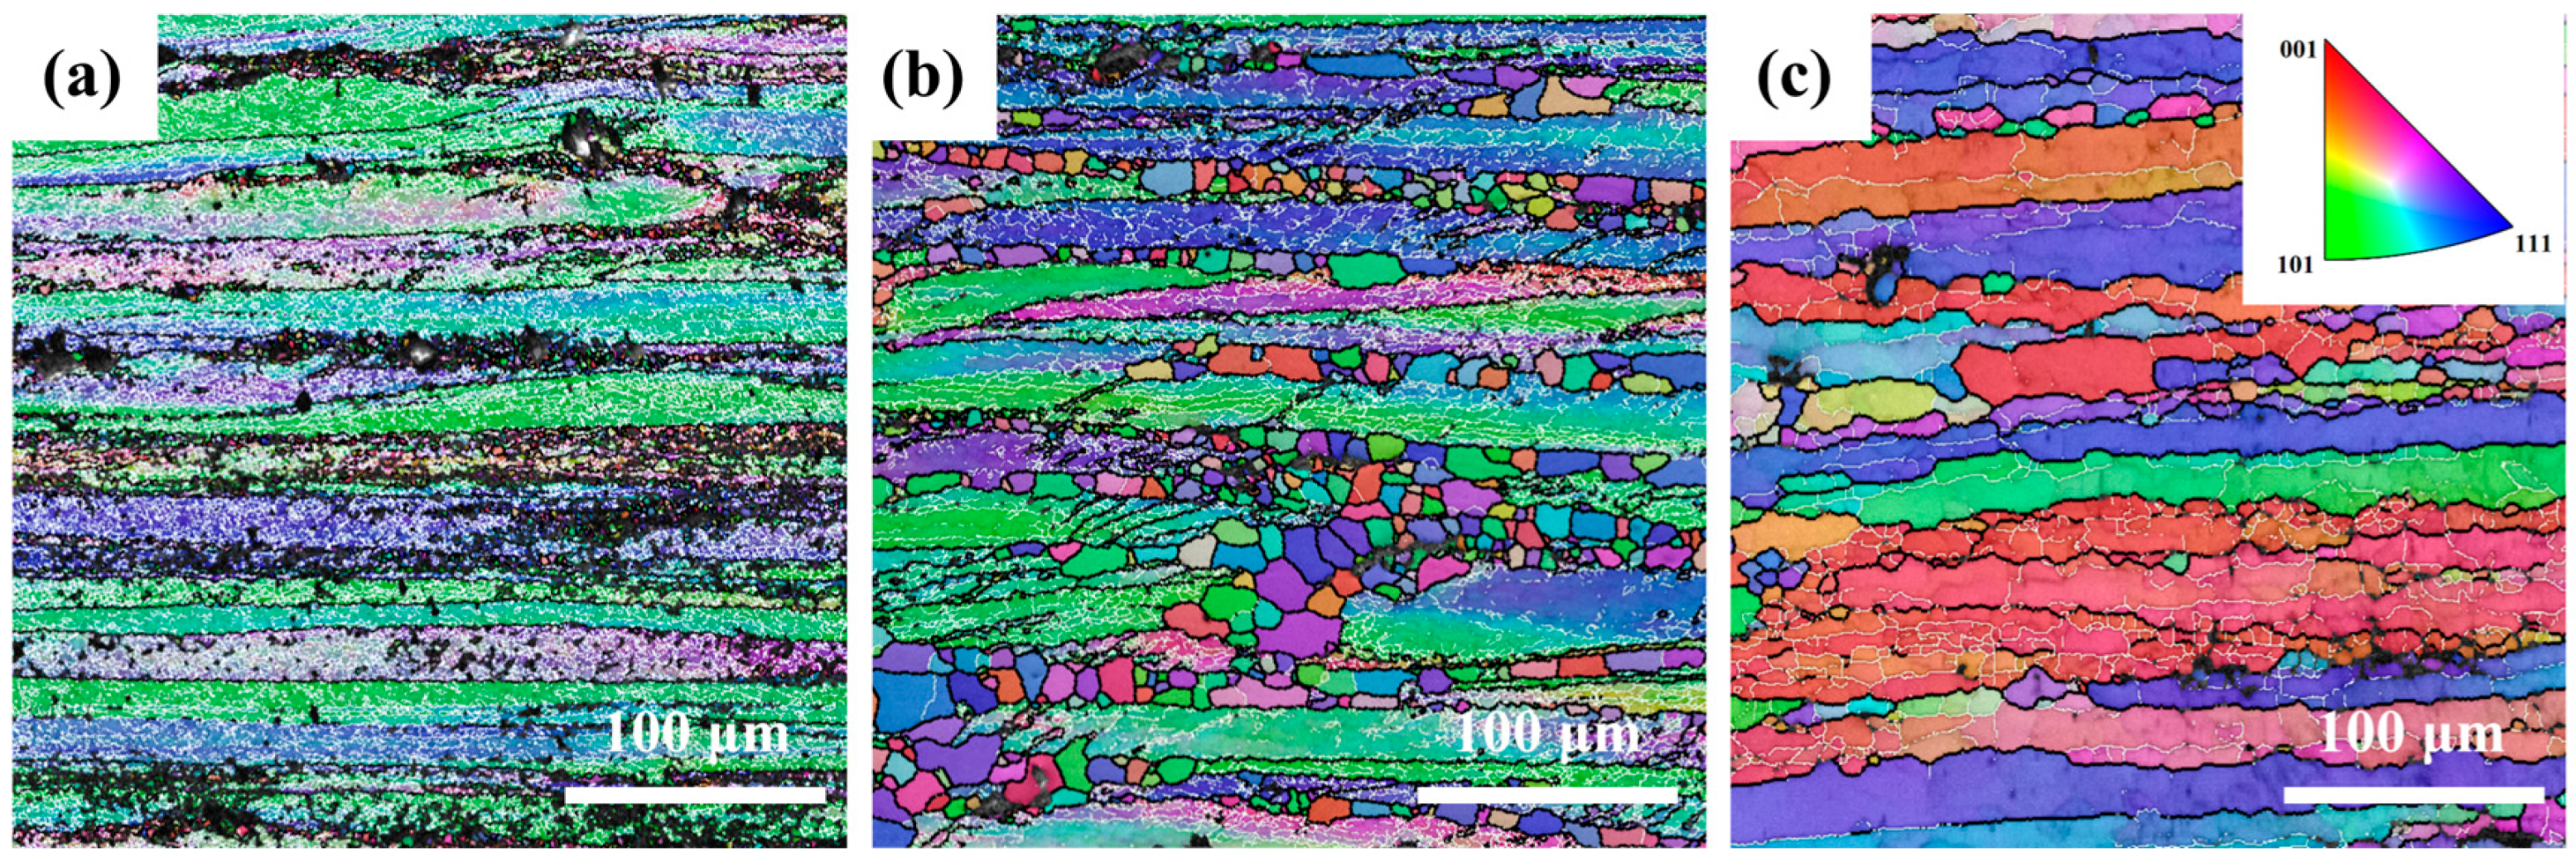
Figure 3 shows inverse pole figure (IPF) maps of the Mg4.0-5383 alloy deformed at 0.5 s
−1 under 320 °C, 380 °C, and 500 °C (from left to right). Black and white lines indicate high-angle (>15°) and low-angle (2–15°) grain boundaries, respectively. Geometrically necessary dislocation (GND) density maps derived from EBSD data (
Figure 4) highlight localized strain accumulation zones (bright green regions) with significant orientation gradients and high stored energy.
The recrystallization temperature of the 5383 aluminum alloy is ~260 °C. During deformation at 320 °C, the microstructure primarily consists of elongated deformed grains containing numerous subgrain boundaries (indicated by white lines), with only a few recrystallized grains emerging along grain boundaries. The extensive bright green regions in the GND density maps (
Figure 4) reveal exceptionally high residual dislocation density, confirming the dominant work hardening mechanisms and significant stored strain energy at this temperature. At 380 °C, the microstructure exhibits a mixed morphology of recovered deformed grains and larger recrystallized grains. The reduced residual dislocation density suggests the activation of dynamic recovery (DRV) processes, where dislocation climb and rearrangement reduce entanglement density, thereby mitigating work hardening effects. At 500 °C, the microstructure demonstrates characteristic continuous dynamic recrystallization (CDRX) features, with serrated grain boundaries and intragranular recrystallization nuclei. Simultaneously, geometrically dynamic recrystallization (GDRX) is presented as brick-like grain structures. The alignment of bright green GND density patterns with subgrain boundaries indicates enhanced dislocation reorganization into dislocation cells at higher temperatures. These cells progressively evolve into high-angle grain boundaries through dislocation absorption, ultimately forming recrystallized grains and inducing dynamic softening [
12].
Table 3 shows that at constant strain rates, the peak flow stress of 5383 alloys decreases significantly with increasing temperature across all Mg contents. This temperature dependence is attributed to three primary mechanisms: (1) Enhanced atomic thermal motion at elevated temperatures weakens interatomic bonding and activates additional slip systems, thereby reducing deformation energy requirements. (2) Thermal activation promotes dislocation rearrangement through dynamic recovery, while accelerated grain boundary migration facilitates dynamic recrystallization nucleation and growth, collectively lowering dislocation density. (3) The dissolution of Mg-rich Al
8Mg
5 precipitates above critical temperatures reduces dislocation pinning effects, further decreasing flow stress [
13].
Figure 5 displays the microstructural evolution of the Mg5.0 alloy at 440 °C under increasing strain rates (left to right). All conditions exhibit elongated banded structures with abundant subgrain boundaries (white lines), confirming DRV dominance. At 0.05 s
−1, numerous recrystallized grains are observed. With the strain rate increasing to 0.5 s
−1, the band thickness decreases while retaining smaller recrystallized grains. At 5 s
−1, further band refinement occurs with extensive subgrain boundaries and minimal recrystallization. Corresponding GND density maps (
Figure 6) demonstrate the progressive expansion of high-dislocation-density regions (bright green) with an increasing strain rate, indicating accumulated residual dislocations. This phenomenon is attributed to the rapid accumulation of high stress within materials due to high strain rates. When the stress exceeds the critical value for dislocation multiplication, even if the nucleation process is limited by time constraints, mechanisms such as double-crossing slip and climb-up can still operate efficiently under high stress, rapidly increasing the dislocation density through multiplication rather than nucleation. Additionally, at high strain rates, dislocations move at inconsistent speeds, making it easier for dislocation accumulation to occur and for complex entanglement structures to form at obstacles like grain boundaries and second-phase particles. These structures hinder further dislocation movement and annihilation, leading to dislocations being retained in the material.
At constant deformation temperatures, peak flow stress increases substantially with the strain rate with various Mg contents. This strain rate sensitivity originates from two synergistic effects: (1) Reduced deformation duration limits dislocation mobility and the completion of DRV, preserving work-hardened structures. (2) Insufficient time for DRX nucleation and growth prior to deformation termination suppresses dynamic softening mechanisms. These combined effects result in sustained high dislocation density and consequently elevated flow stress [
14,
15].
Across all temperature–strain rate conditions, peak stress increases with the Mg content. This peak stress corresponds to the balance between work hardening and dynamic softening. The solid solution strengthening effect arises from the atomic size mismatch between Mg solutes and Al matrix atoms, which induces significant lattice distortion. A higher Mg content increases this distortion, creating stronger dislocation barriers and consequently higher flow stress. Additionally, Mg segregation leads to dislocation pinning via Cottrell atmospheres, effectively suppressing the dislocation climb and annihilation processes necessary for DRV. These combined effects prolong the dominance of work hardening while inhibiting DRX, thereby driving the increase in peak stress with the Mg content.
Notably, post-peak stress reduction becomes more pronounced with higher Mg concentrations. This phenomenon correlates with Mg’s dual role in solid solution strengthening and its interaction with iron-rich phases (Al6(Fe,Mn)). An elevated Mg content increases residual dislocation density while modifying the size and distribution of iron-rich phases. The resulting dislocation network provides abundant nucleation sites for DRX through orientation gradient accumulation at grain boundaries. Concurrently, enhanced dislocation pinning at secondary phases creates localized stress concentrations that accelerate DRX initiation. These coordinated effects promote intensive dynamic softening that overcomes prior work hardening, leading to significant stress reduction during the post-peak stress stage.
3.2. Establishment of Constitutive Equations
The Arrhenius model [
16], which is widely used to describe the relationship between the strain rate, deformation temperature, and flow stress under high-temperature deformation and to characterize the stress–strain curve as increasing and then decreasing, can be expressed for all stress conditions as follows:
It can be further categorized for different strains as follows:
The Zener–Hollomon parameter (referred to as the Z-parameter) proposed by Zener and Hollomon [
17] can characterize the effect of the deformation temperature and strain rate on strain stress.
where
are the material parameters, and
=
/
is the strain rate (s
−1);
is the flow stress (MPa);
is the gas constant (kJ/(mol·K));
is the activation energy of deformation (kJ/mol); and
is the activation energy of deformation (K). By using the three Arrhenius model equations, it is possible to comprehensively and accurately predict flow stresses of thermal deformation.
Substituting Equation (4) into Equation (1) yields
Taking logarithms on both sides of Equations (1)–(3) and (5), the following four equations are obtained:
Equation (6) is partially differentiated with respect to 1/T, and the thermal deformation activation energy equation is obtained using the final calculation:
represents the ln
− ln
curve slope of the average value, and
represents the ln
−
curve slope of the average value, respectively. For ln
− ln
and ln
−
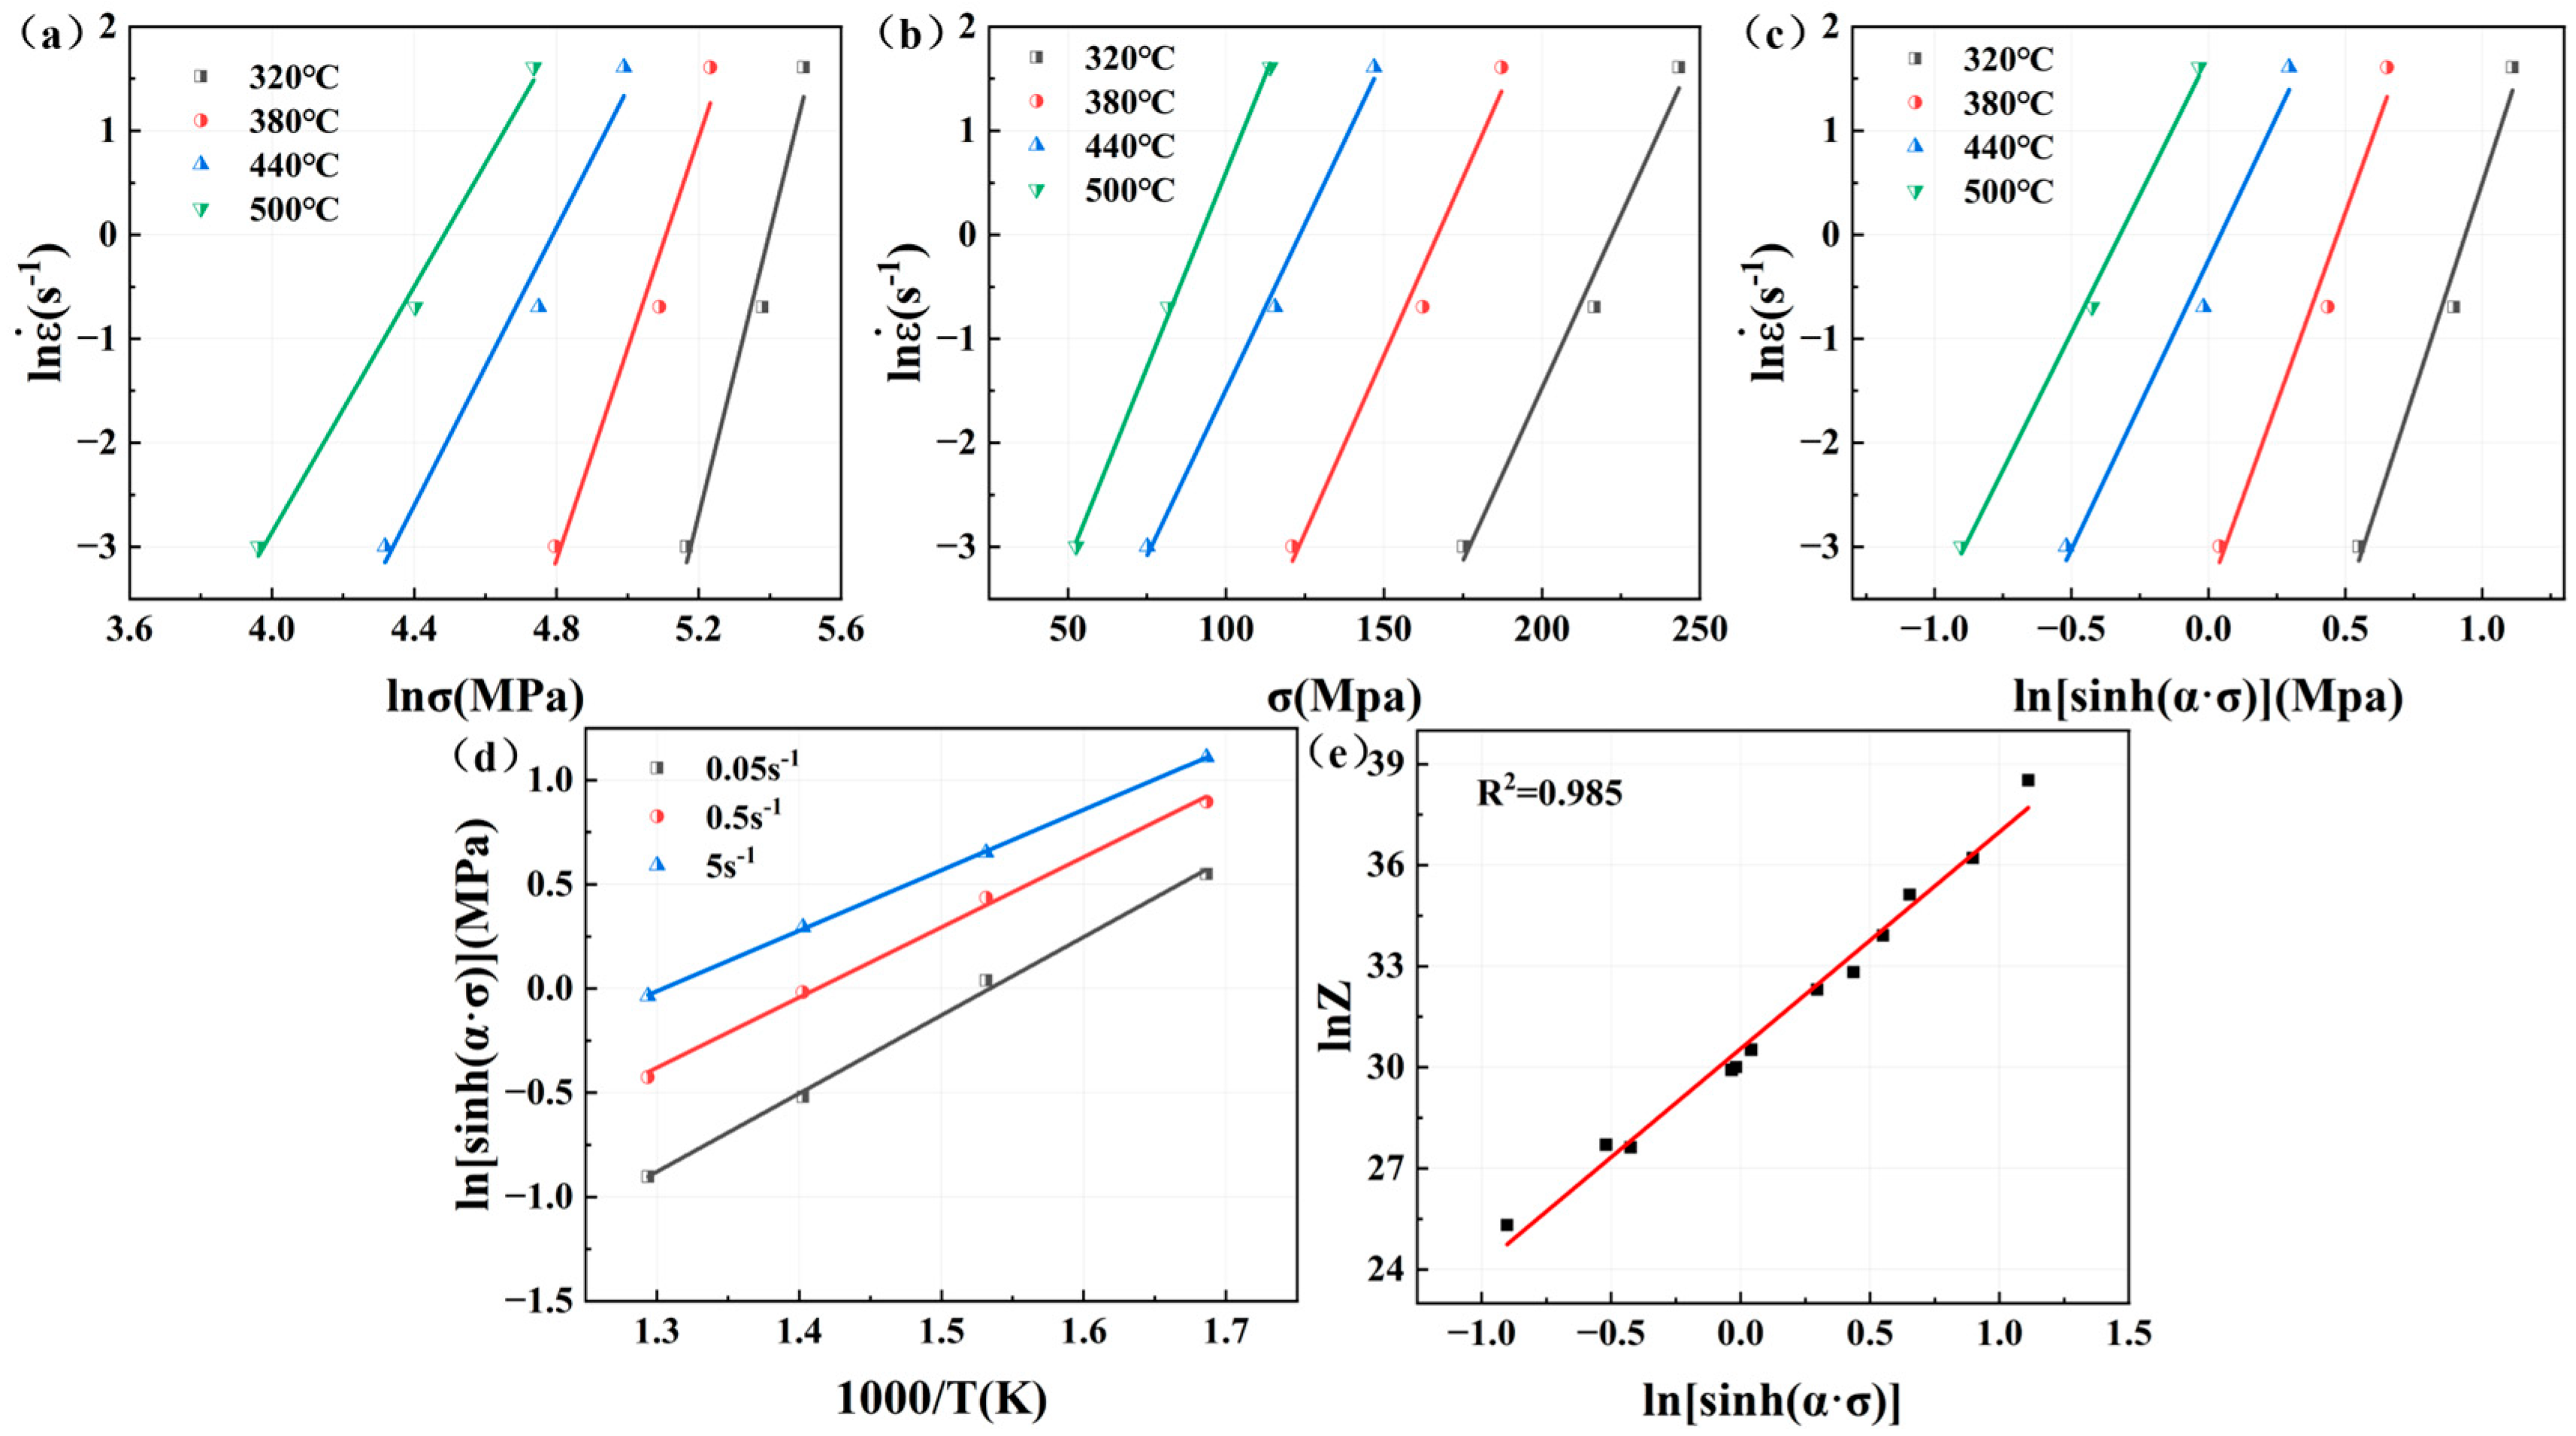
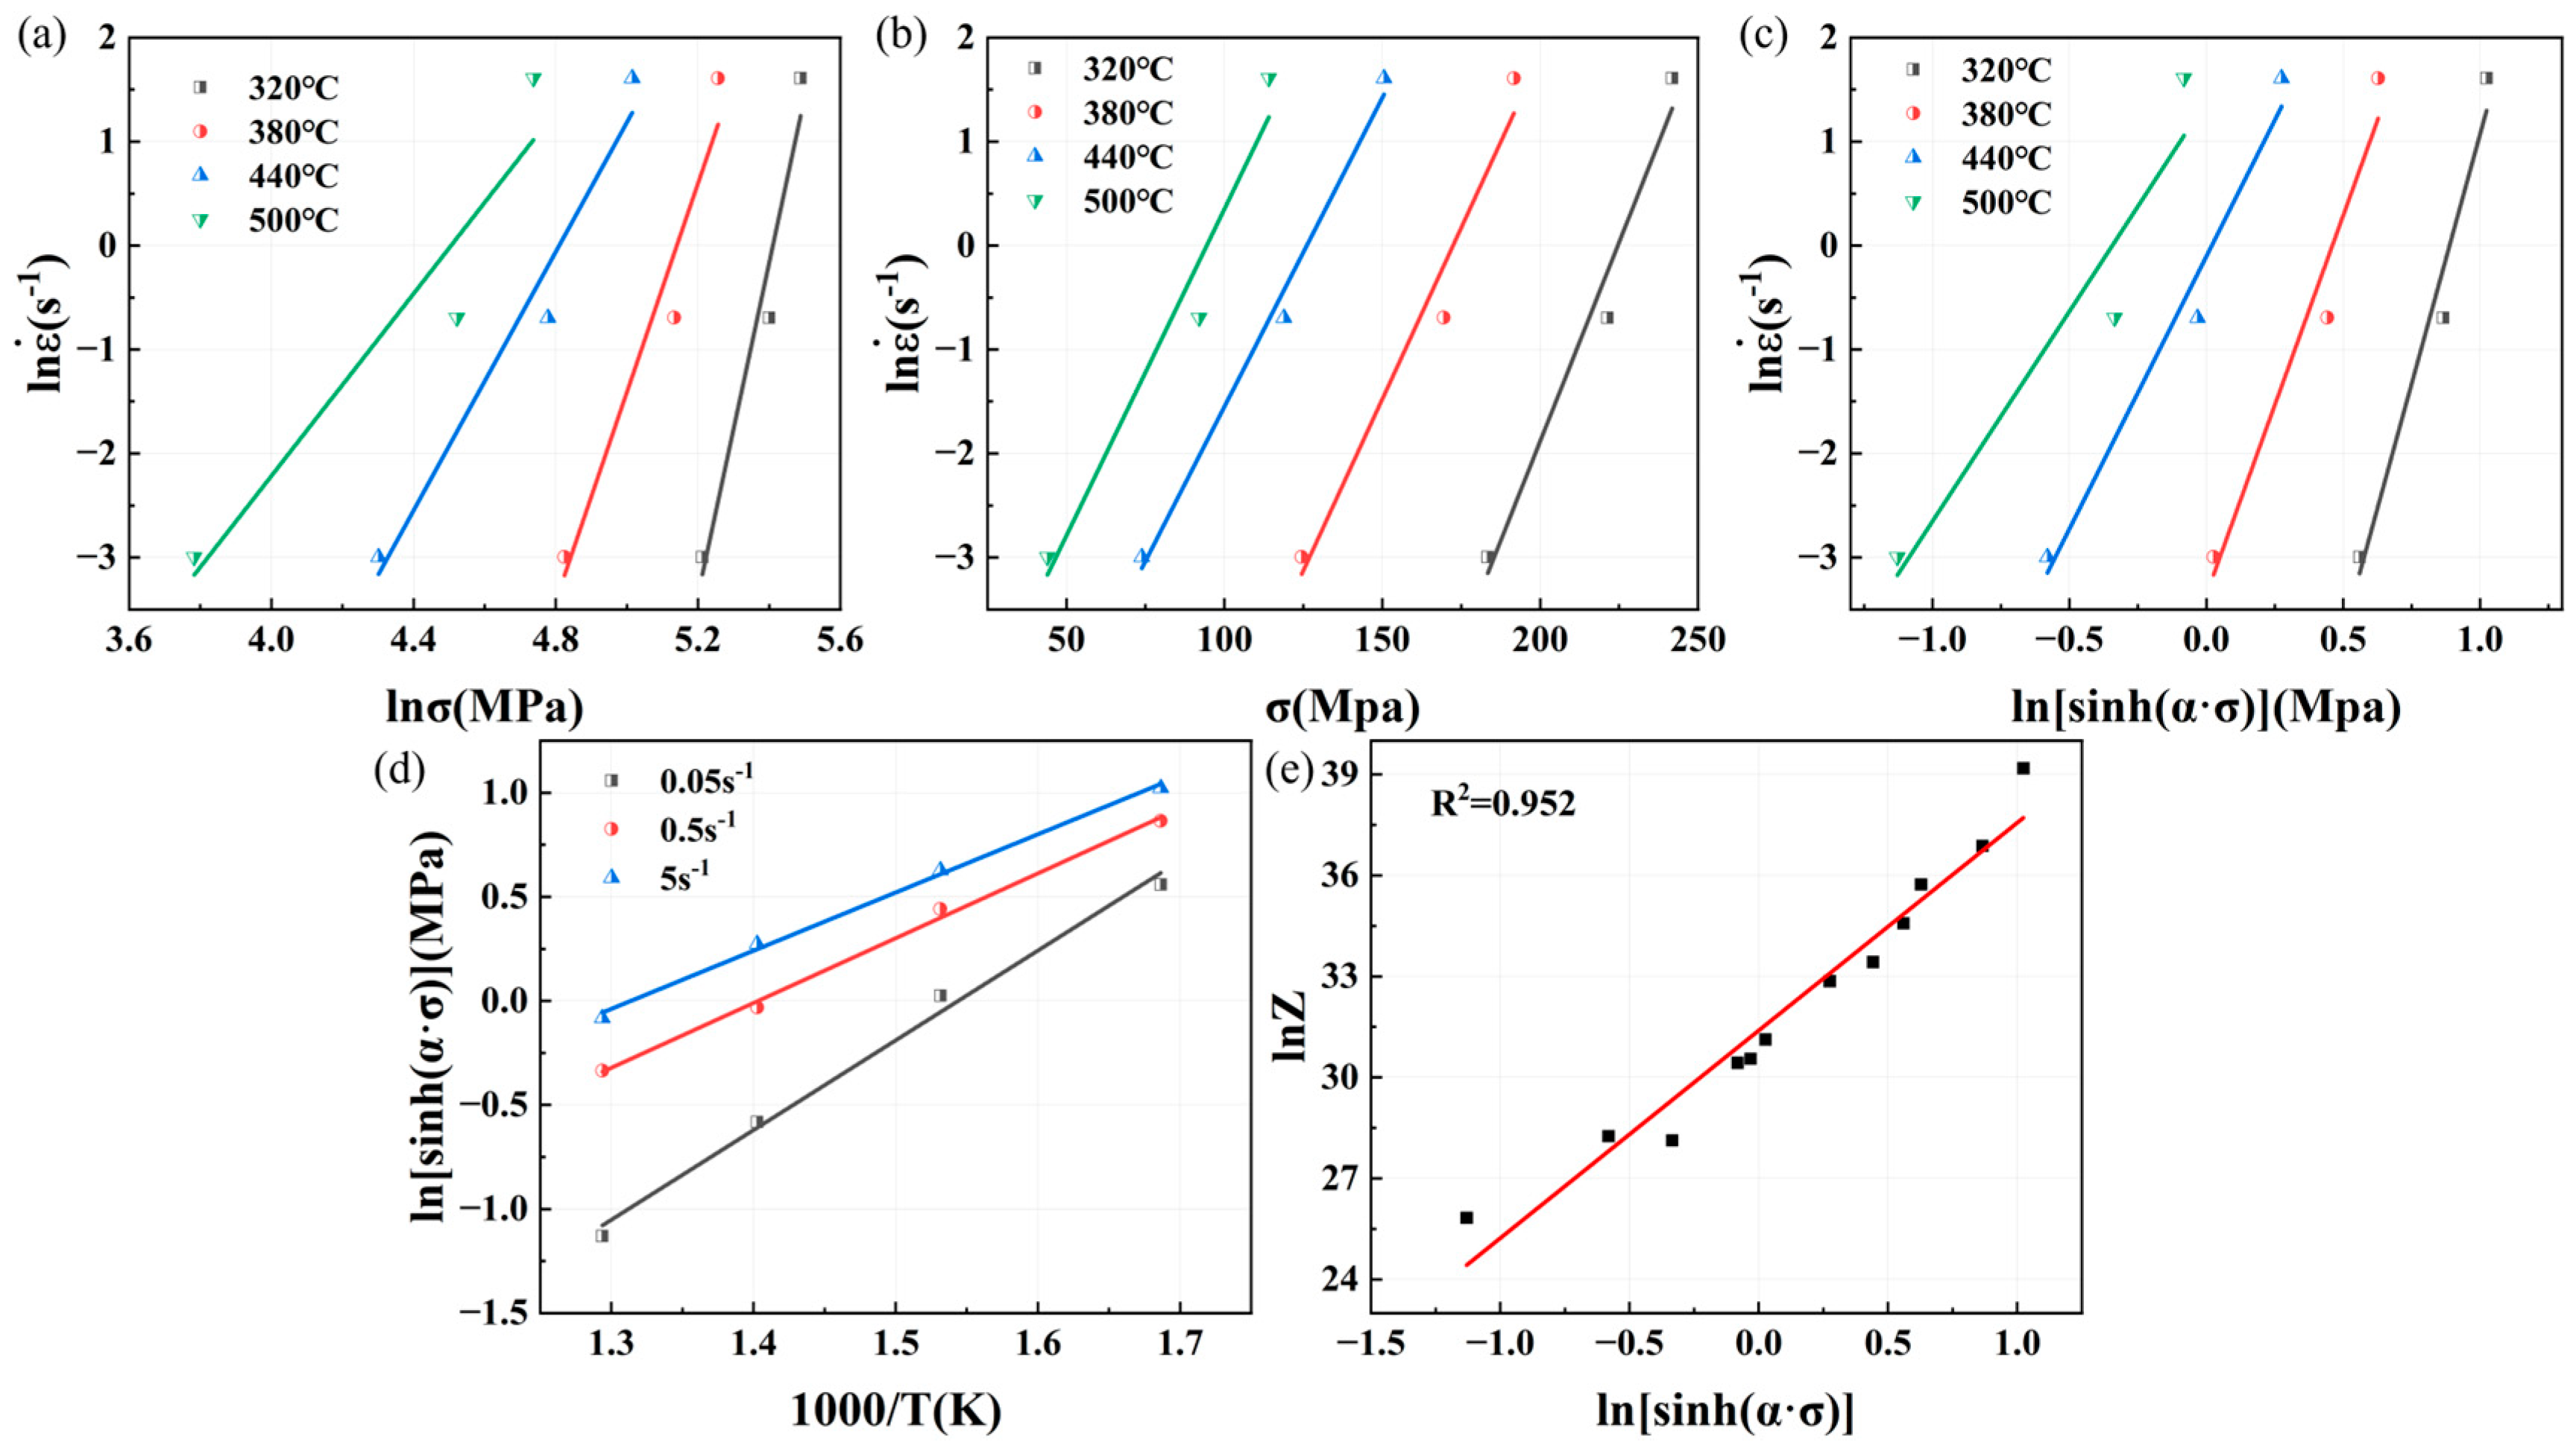
relationship curves, as shown in
Figure 7a,b, an
value of 9.0871 and a
value of 0.06834 can be obtained, with
=
/
= 0.007521.
From Equation (9), it can be seen that there is a linear relationship between
and
;
− 1/
also has a linear relationship.
is the average value of the slope of the
−
curve;
is the average value of the slope of
− 1/
curve. The relationship curve of
−
is shown in
Figure 7c, and the value of
is 6.5501; the curve of
− 1/
is shown in
Figure 7d, and the value of
is 3.3424. Combined with the value of
,
=
= 182.01 kJ/mol. By substituting the value of
into Equation (4) to calculate the value of
with different deformation parameters, such as
, as shown in
Figure 7e, we can get the value of
, which is 1.8567 × 10¹³. In summary, the constitutive equation of Mg4.0-5383 aluminum alloy is
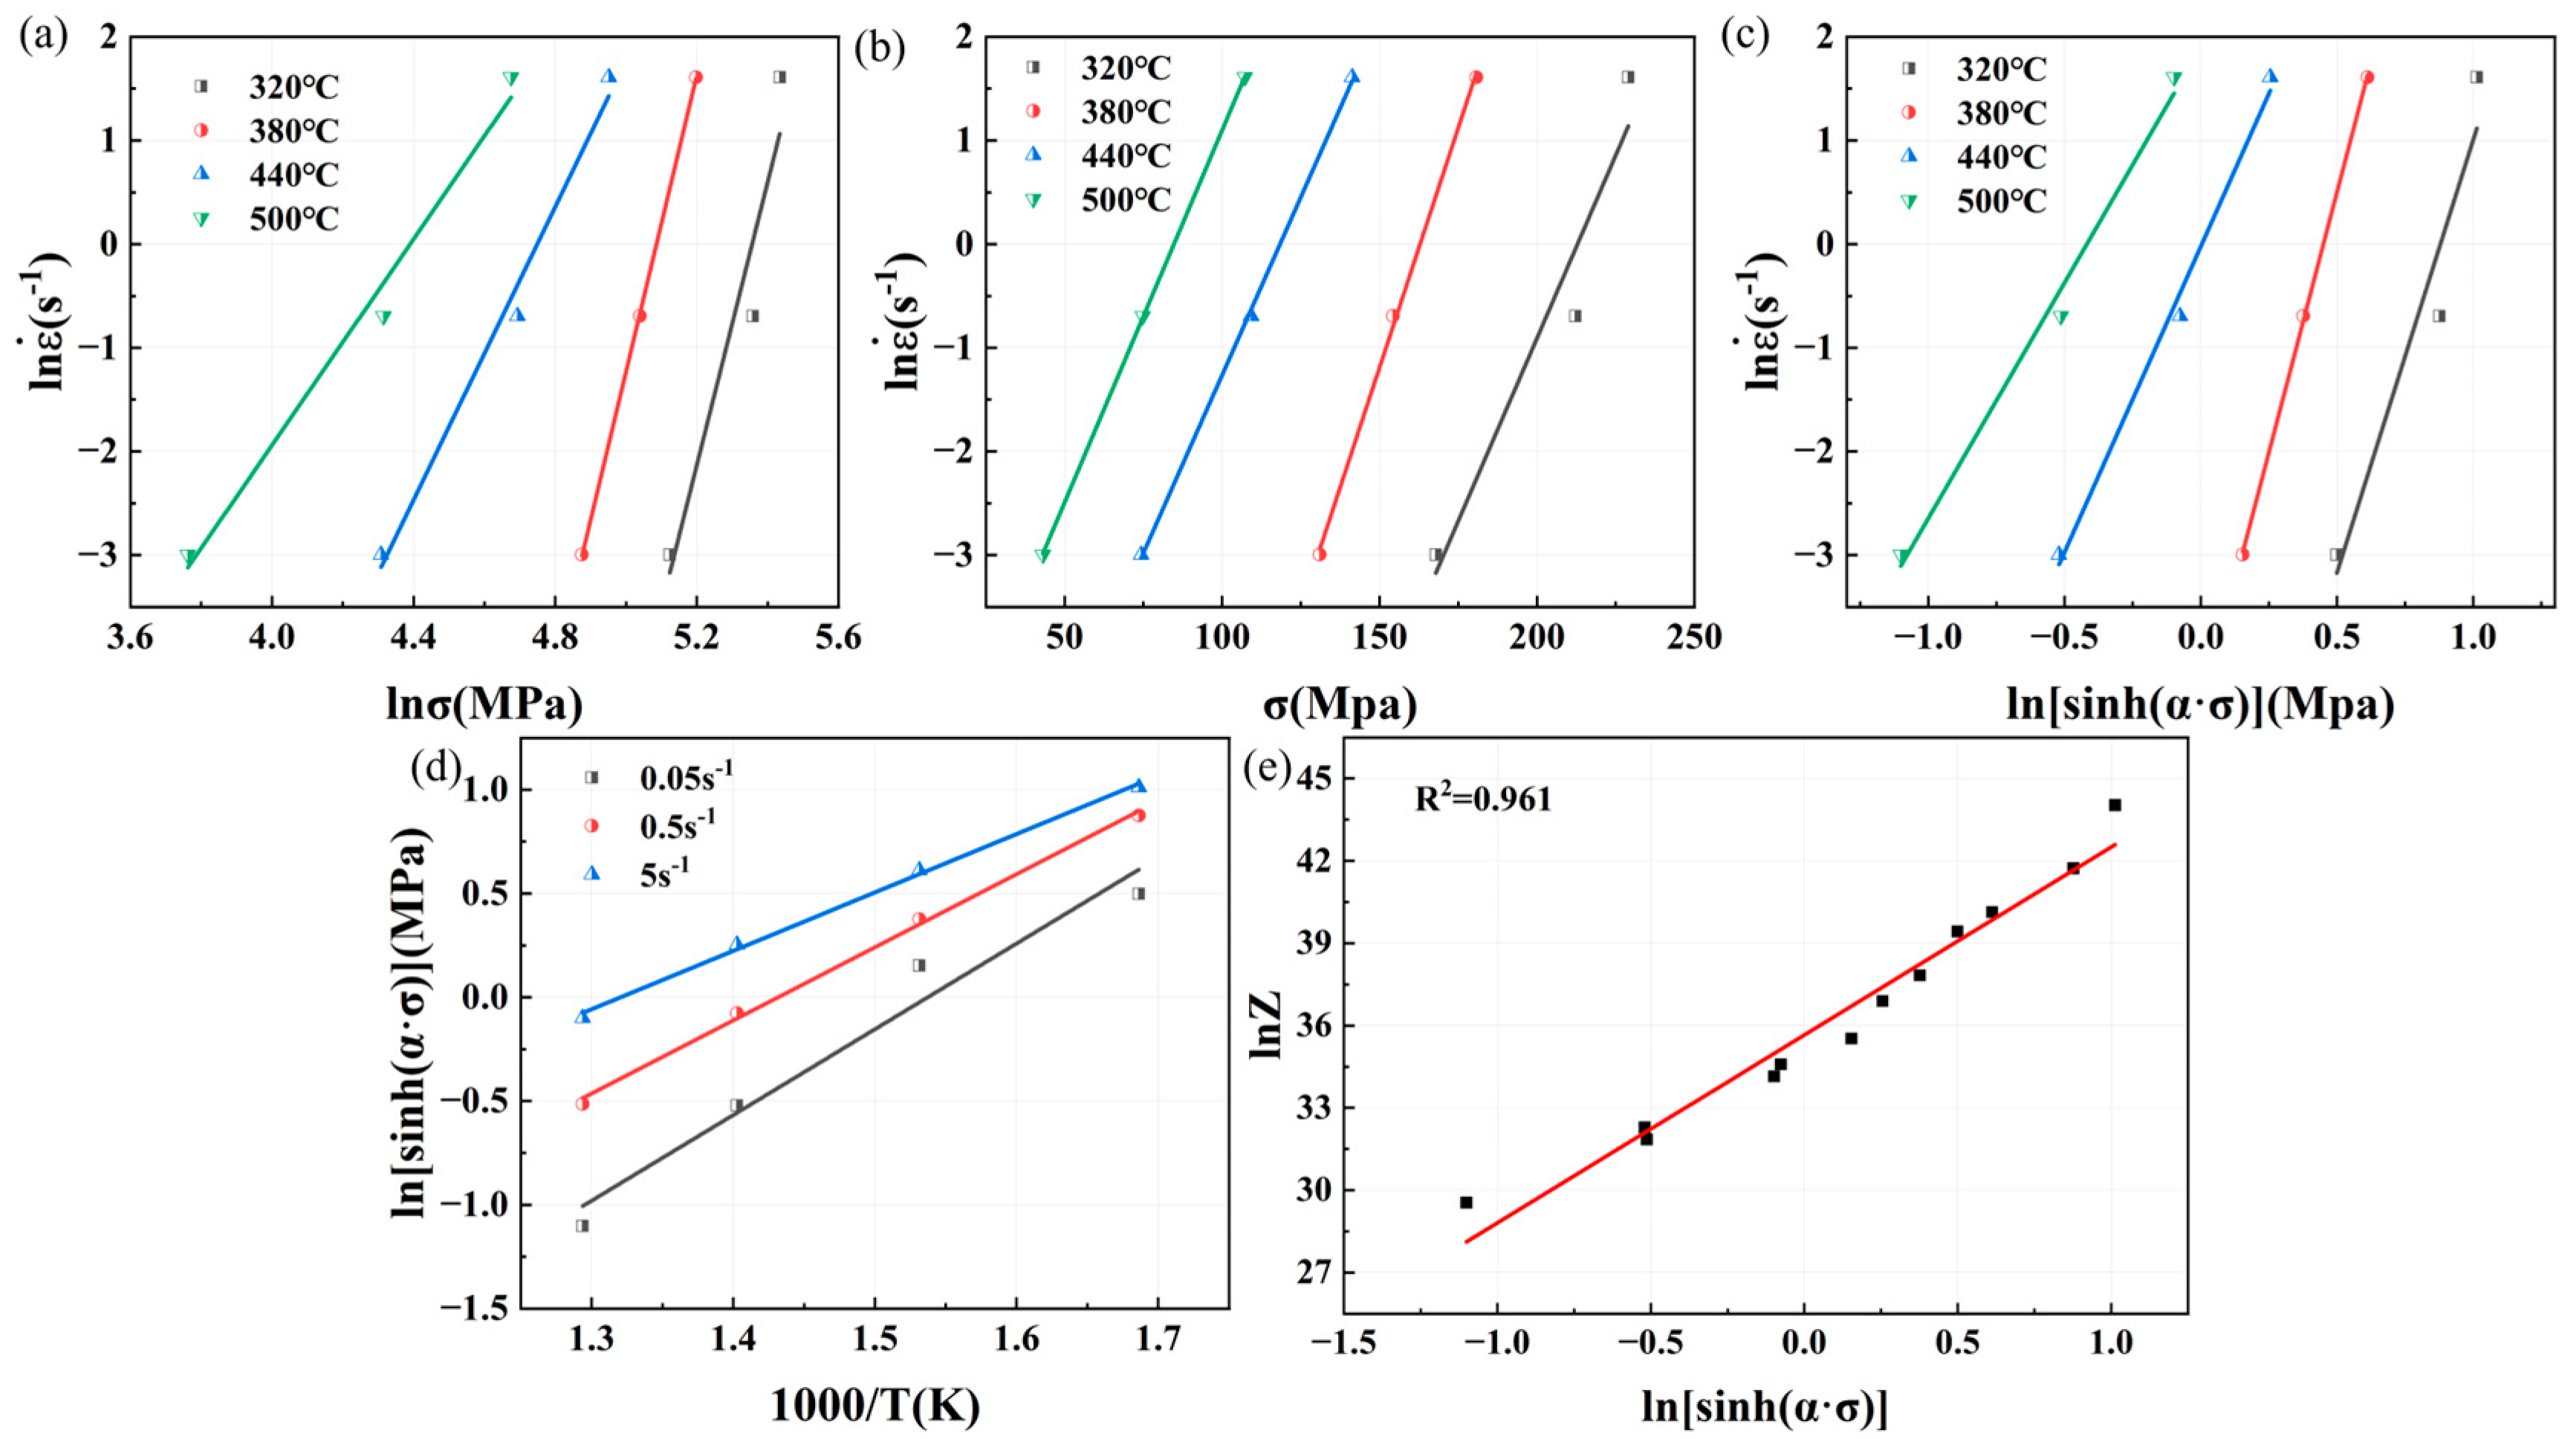
Similarly, the relationship curves between peak stress, strain rate, and deformation temperature of Mg4.5-5383 aluminum alloys and Mg5.0-5383 aluminum alloys can be obtained as shown in
Figure 8 and
Figure 9. And then we can determine that the
value of Mg4.5 is 9.1545,
is 0.06618,
is 0.007229,
is 6.5394,
is 3.4081,
=
= 185.2841 kJ/mol, and
is 4.3206 × 10¹³; additionally, the
value of Mg5.0 is 9.9986,
is 0.07587,
0.007588,
is 7.2109,
is 3.4892,
=
= 209.1821 kJ/mol, and
is 3.0625 × 10¹⁵.
The constitutive equation of Mg4.5-5383 aluminum alloys is
The constitutive equation of Mg5.0-5383 aluminum alloys is
During the thermal processing of 5383 aluminum alloys, deformation resistance increases with a higher Mg content, mainly due to the solid solution hardening effect. This study identifies a threshold at 5 wt.% Mg, where the hot deformation activation energy jumps to 209 kJ/mol. The enhanced solid solution strengthening induces two factors: (1) elevated deformation stress, which promotes serrated grain boundary formation through constrained boundary migration, and (2) stress concentrations along these serrated boundaries, which facilitate void/crack nucleation [
18], creating drag effects on dislocation motion. These dual mechanisms suppress dynamic recovery (dislocation rearrangement and annihilation) while promoting DRX initiation. The energy-intensive nature of DRX, which requires new grain boundary formation, directly accounts for the observed increase in activation energy.
3.3. Analysis of 3D Thermal Processing Diagrams
A thermal processing map was constructed by superimposing power dissipation and plastic instability maps based on the dynamic materials model (DMM) proposed by Prasad [
19].This analytical tool effectively reveals the correlation between microstructural evolution and processing parameters during hot deformation, providing guidance for optimizing thermal processing conditions [
20,
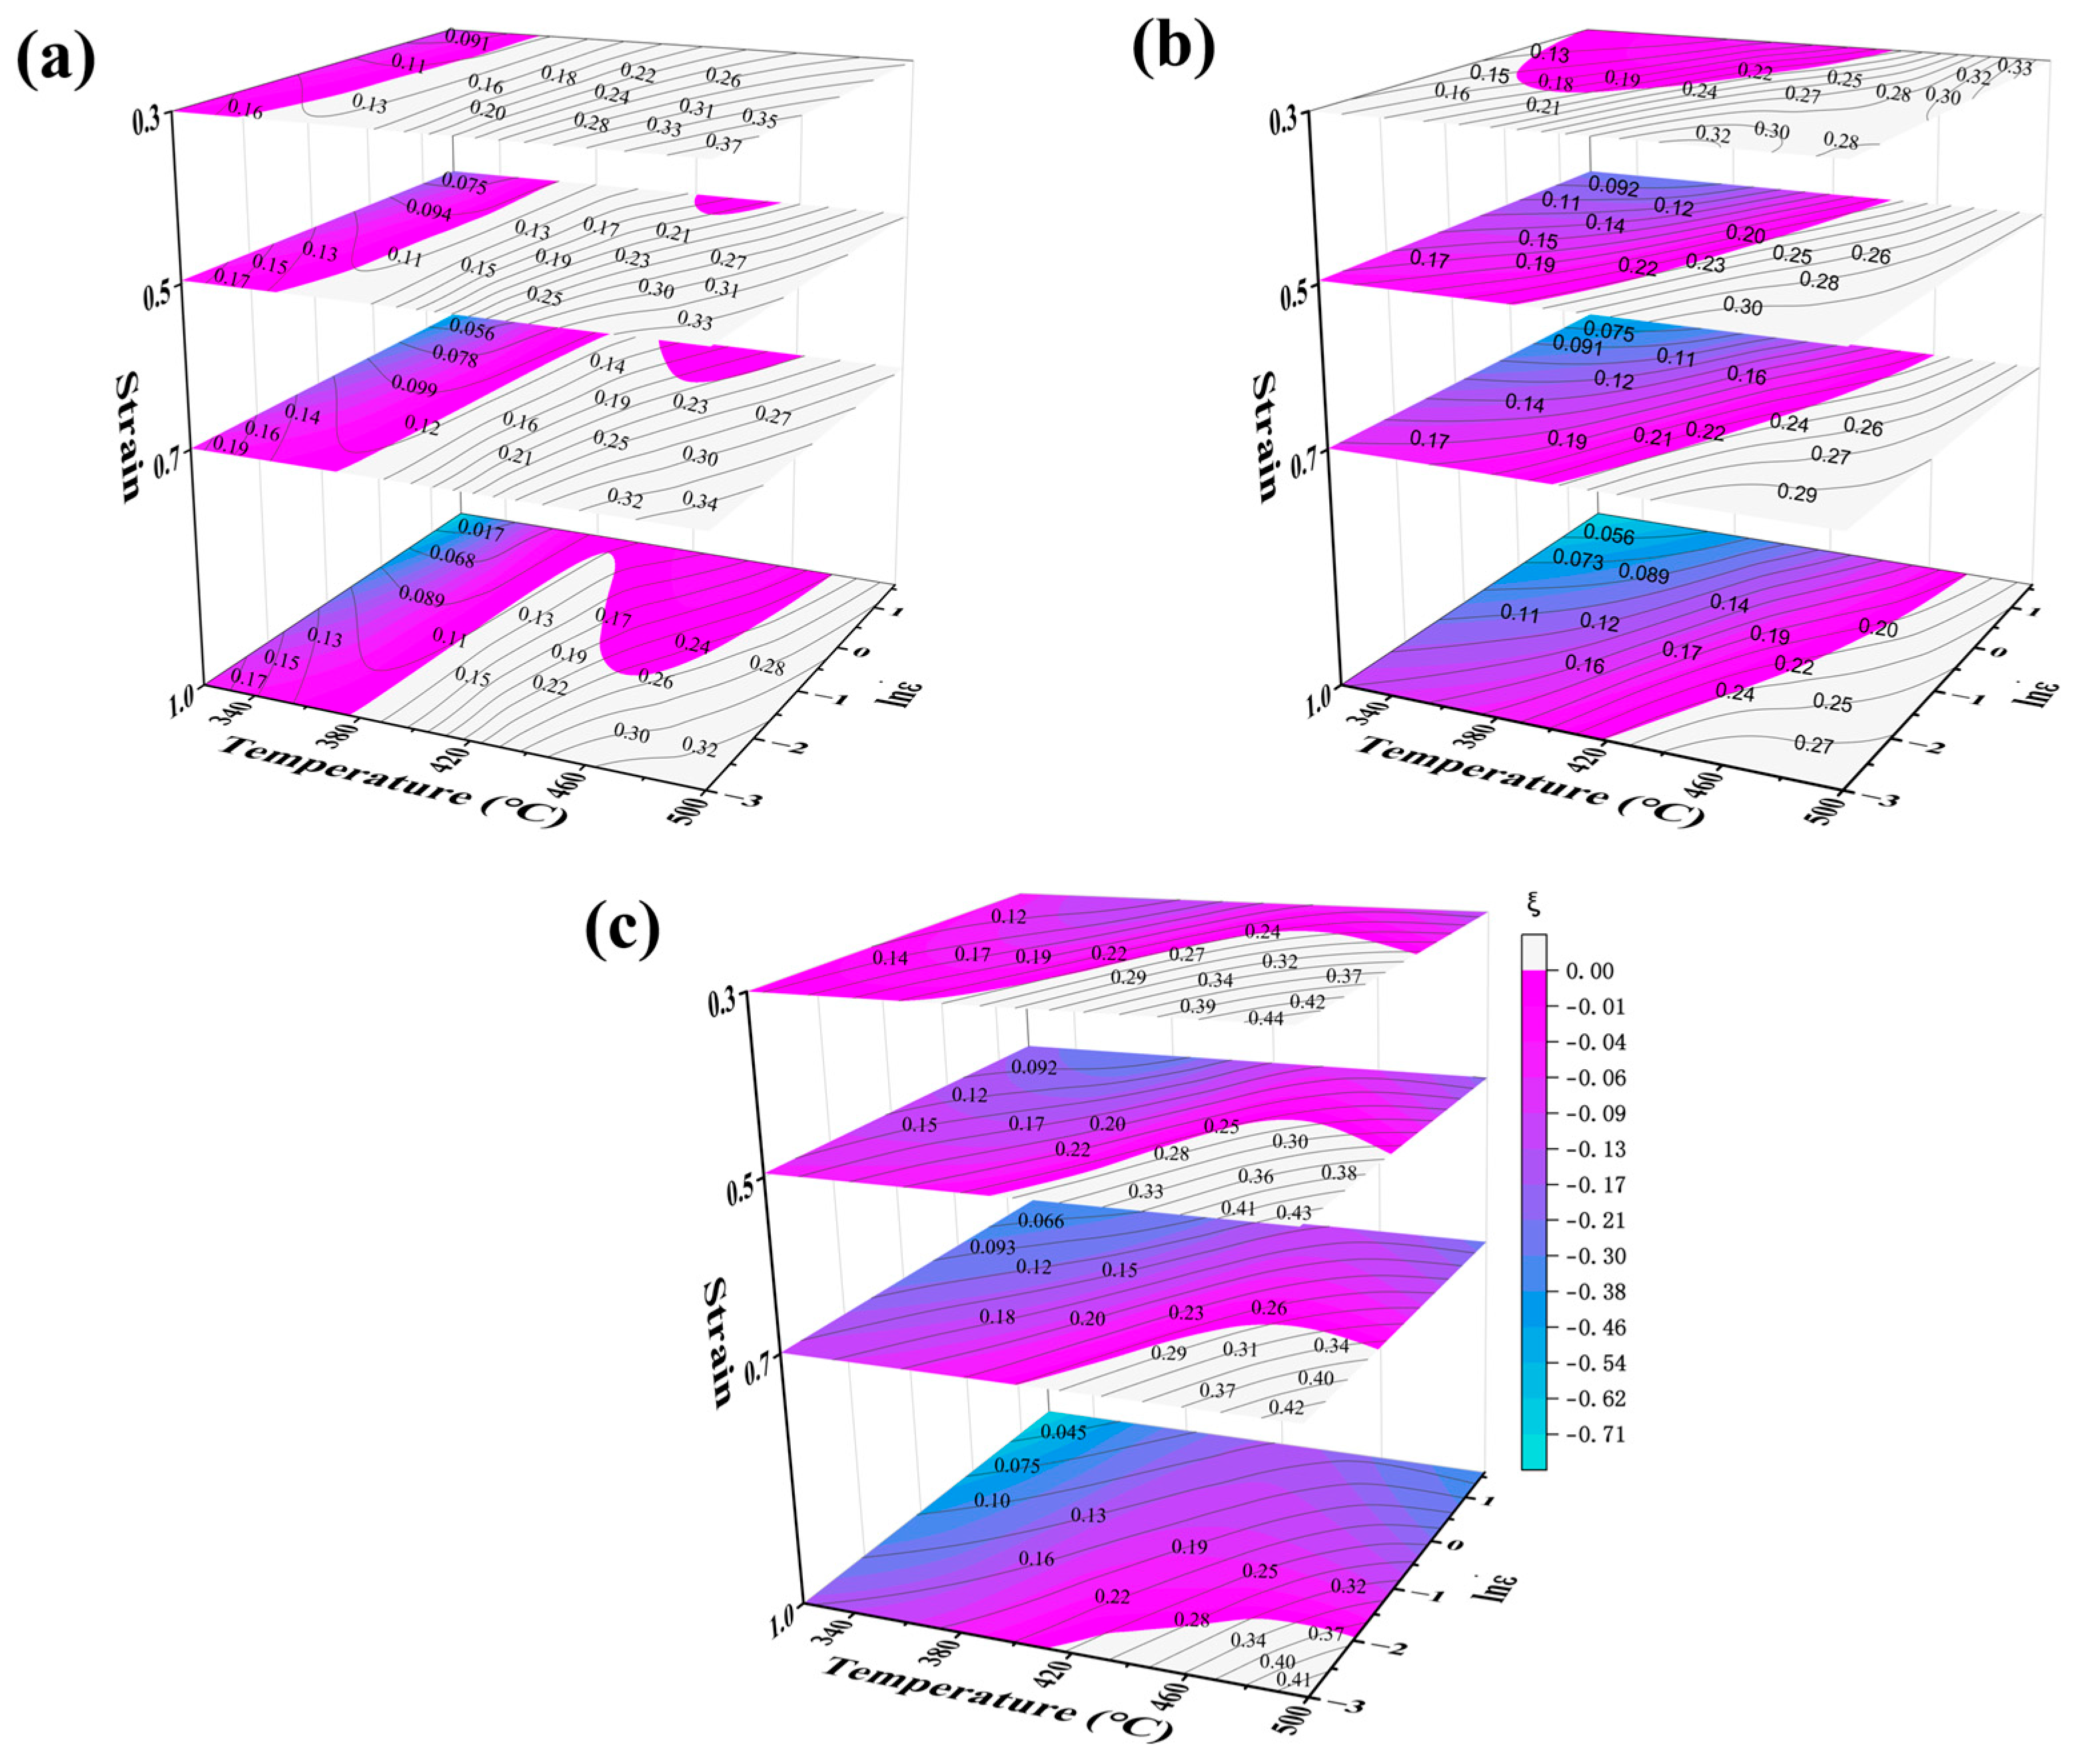
21]. To characterize the hot workability of 5383 aluminum alloy under varying strains, we extend conventional 2D processing maps to three-dimensional representations incorporating strain evolution. These 3D maps quantitatively visualize material power dissipation and instability domains within the parameter space of temperature, strain rate, and strain.
Figure 10 presents the 3D thermal processing maps for the Mg4.0, Mg4.5, and Mg5.0 variants. The black contour lines denote power dissipation efficiency (η%), while the blue-purple gradients indicate instability regions (ξ < 0). The maps encompass complete processing windows: strain (0.3~1.0), temperature (320~500 °C), and strain rate (0.05~5 s
−1).
Figure 10 shows that the safe region for the full-strain hot working of Mg4.0-5383 aluminum alloy is 390~500 °C with a strain rate of 0.05~0.4 s
−1; for Mg4.5, it is 420~500 °C with a strain rate of 0.05~0.4 s
−1; and for Mg5.0, it is 420~500 °C with a strain rate of 0.05~0.16 s
−1. The progressive narrowing of stable regions with an increasing Mg content demonstrates enhanced processing sensitivity to strain rate variations.
As shown in
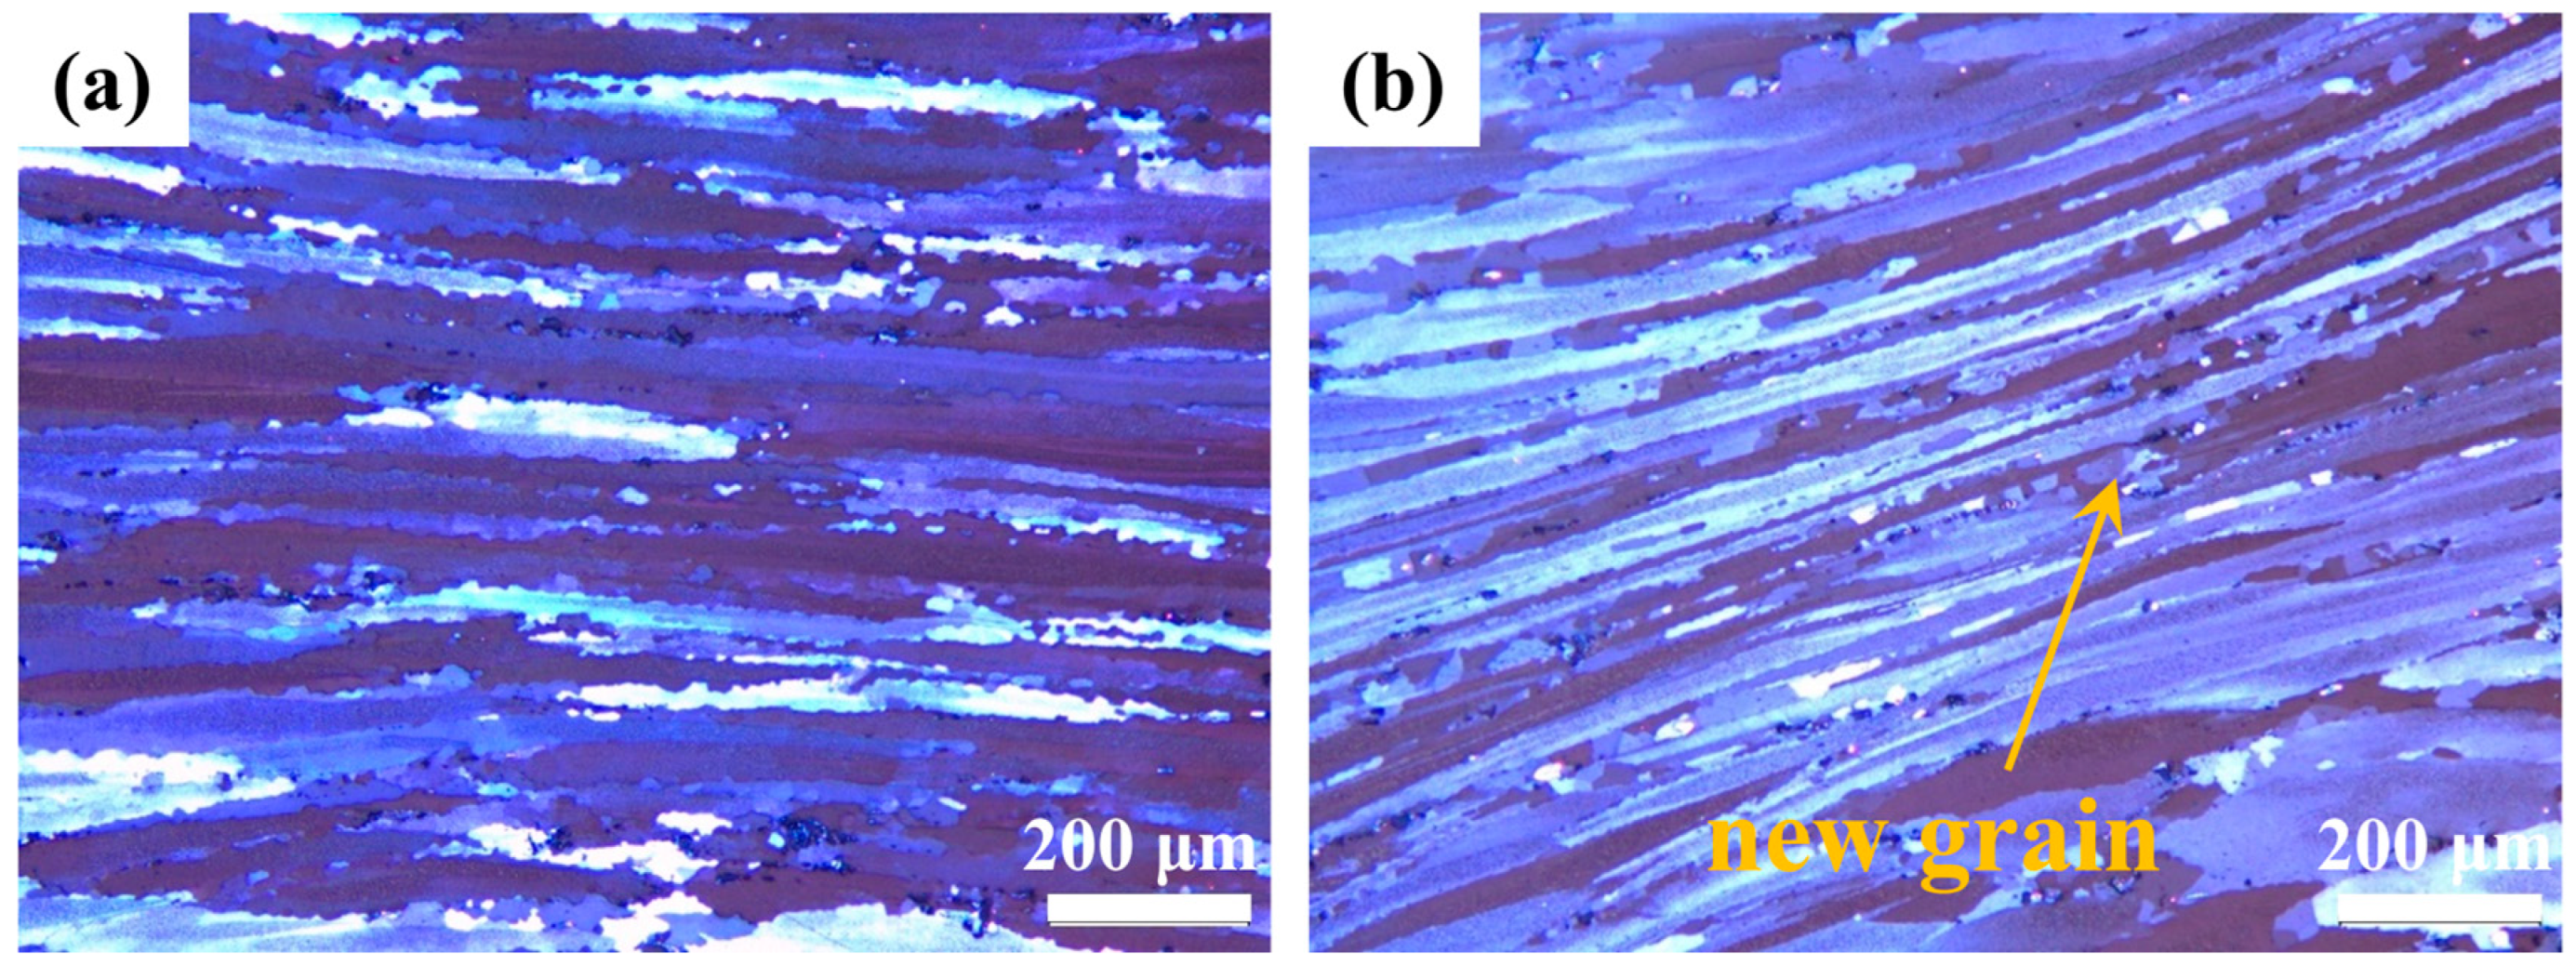
Figure 11, the safe processing zones exhibit characteristic dynamically recovered structures featuring elongated fibrous grains with serrated grain boundaries. DRX increases the continuous chain-like structure of fine equiaxed grains nucleated through the grain boundary. In contrast,
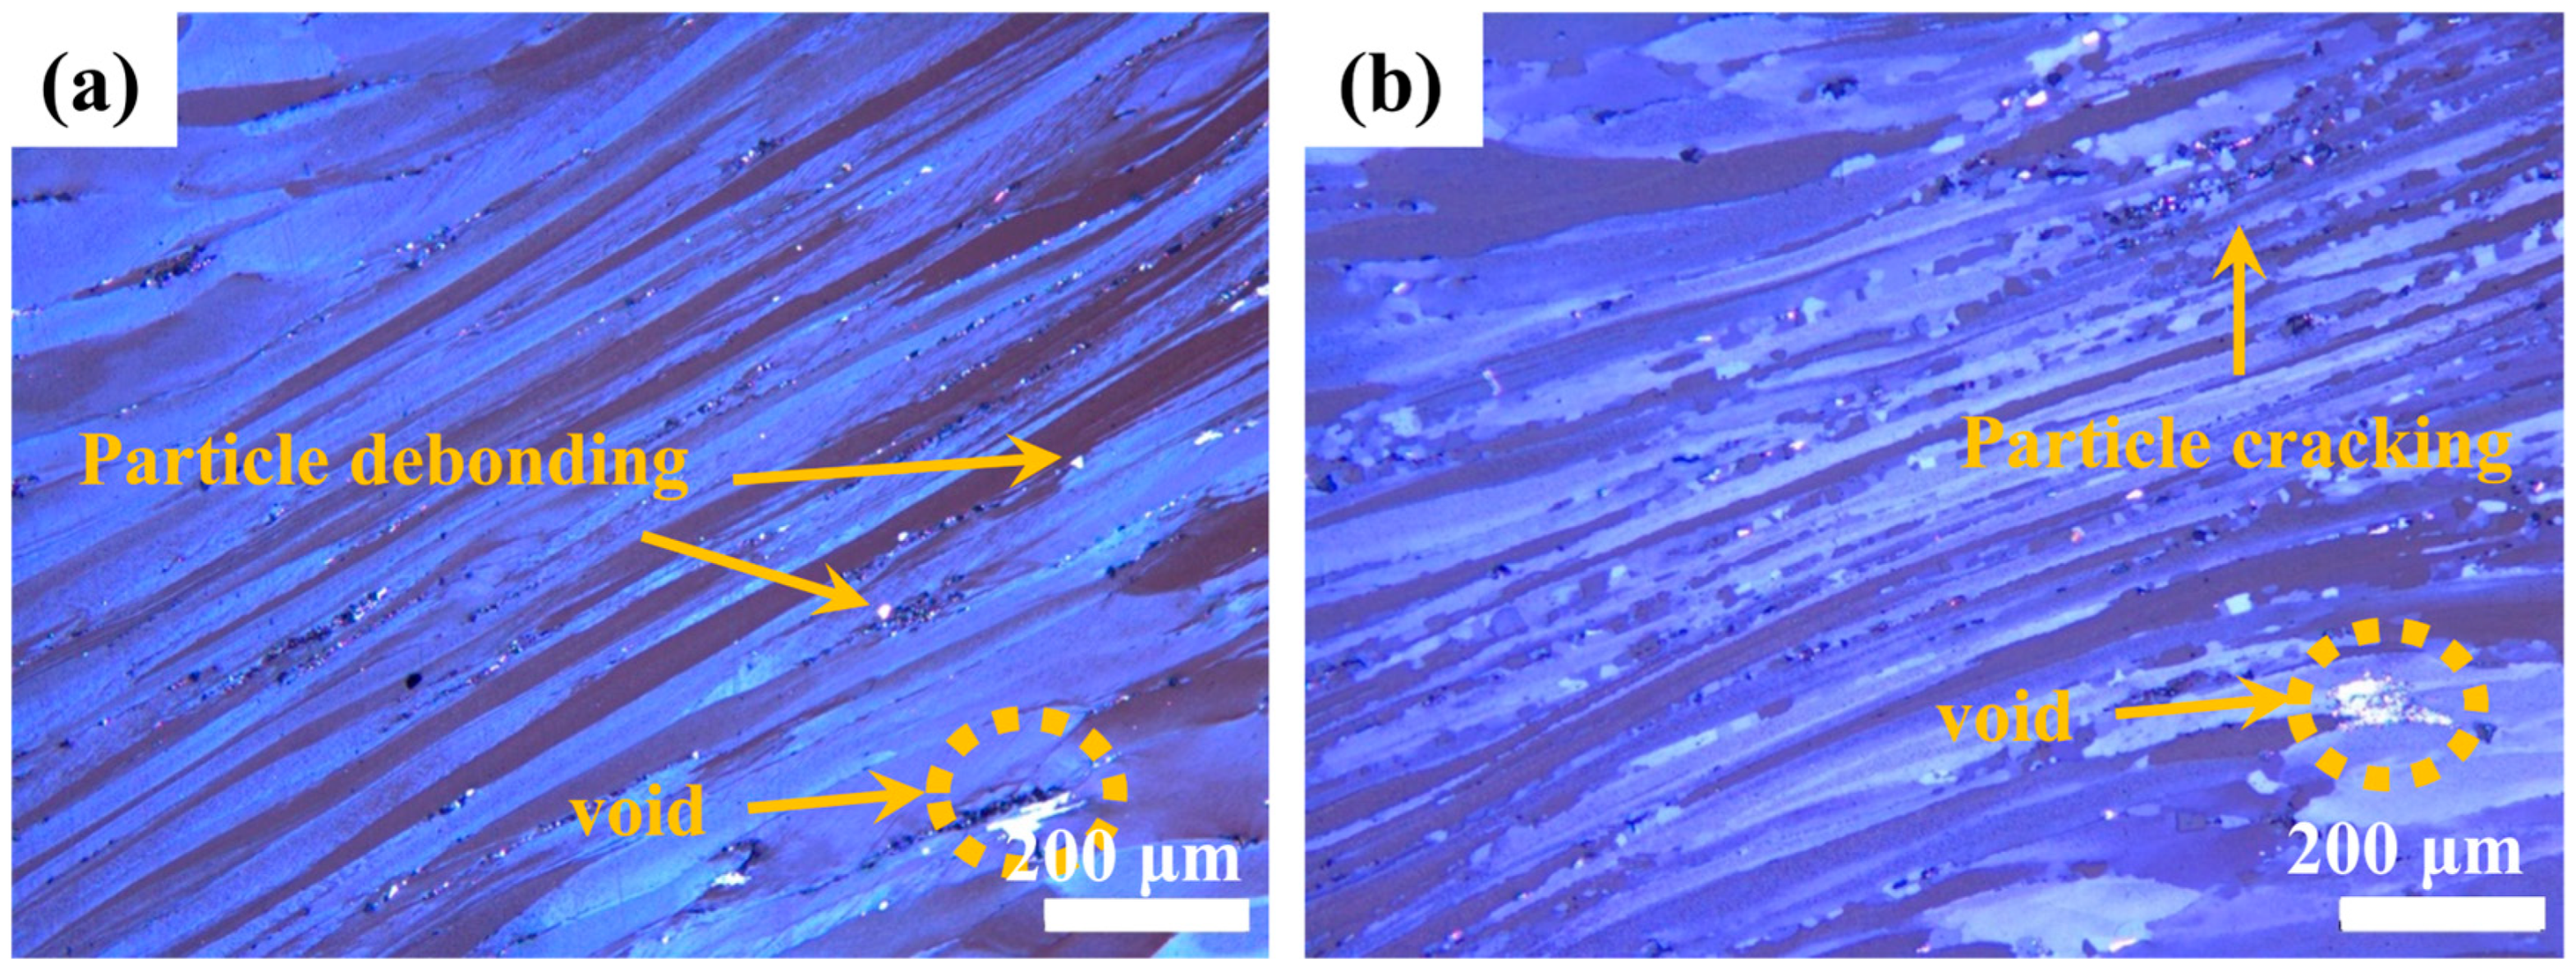
Figure 12 reveals microstructural instabilities characterized by localized shear bands and void formation through iron-rich phase debonding. These defect-containing regions reduce thermal performance and are thus unsuitable for thermal processing.
The three-dimensional thermal processing maps of 5383 aluminum alloys with varying Mg contents reveal several results. Firstly, at a constant strain rate, increasing the temperature or decreasing the strain rate markedly enhances the power dissipation factor. In high-temperature environments, the resistance to dislocation motion is diminished, allowing dislocations to continuously consume energy through slip rearrangement or annihilation. Moreover, elevated temperatures facilitate DRX and eliminate microscopic defects, such as dislocation plugging, thereby further improving energy dissipation efficiency. Low strain rates provide ample time for DRX and grain growth. Secondly, the peak power dissipation gradually decreases with increasing strain. This is attributed to the increased dislocation pile-up, which hampers energy consumption through rearrangement or annihilation and consequently reduces the energy dissipation efficiency of the DRV and DRX processes. Thirdly, the expansion of the destabilization region with increasing strain is closely linked to DRX. Under high-strain conditions, the stored energy generated by dislocation accumulation can serve as a driving force for DRX. However, abnormal grain growth and localized softening of recrystallized grains can significantly compromise the thermal processing stability of the material. Additionally, increased dislocation buildup can lead to localized stress concentrations, which contribute to the formation of microcracks and voids, thereby accelerating the material destabilization process.
According to the three-dimensional thermal processing maps of 5383 aluminum alloys with different Mg contents, the following statements can be made: First, the safe processing region diminishes as the Mg content increases. The safe processing region of Mg4.0-5383 encompasses the largest area, accounting for more than half of the total area up to a strain of 0.7. In contrast, the safe processing region of Mg5.0-5383 occupies only 8% of the area at a strain of 1.0. Second, the peak power dissipation for Mg4.0 and Mg5.0-5383 aluminum alloys is consistently located in the high-temperature, low-strain-rate region (near 500 °C and 0.05 s−1) across different strains. However, for Mg4.5-5383 aluminum alloys, the peak power dissipation appears in this region only when the strain reaches a value of 0.5 or higher. Third, under the same deformation conditions, the peak power dissipation increases with a rising Mg content, with values of 35% for Mg4.0-5383, 39% for Mg4.5-5383, and 47% for Mg5.0-5383.
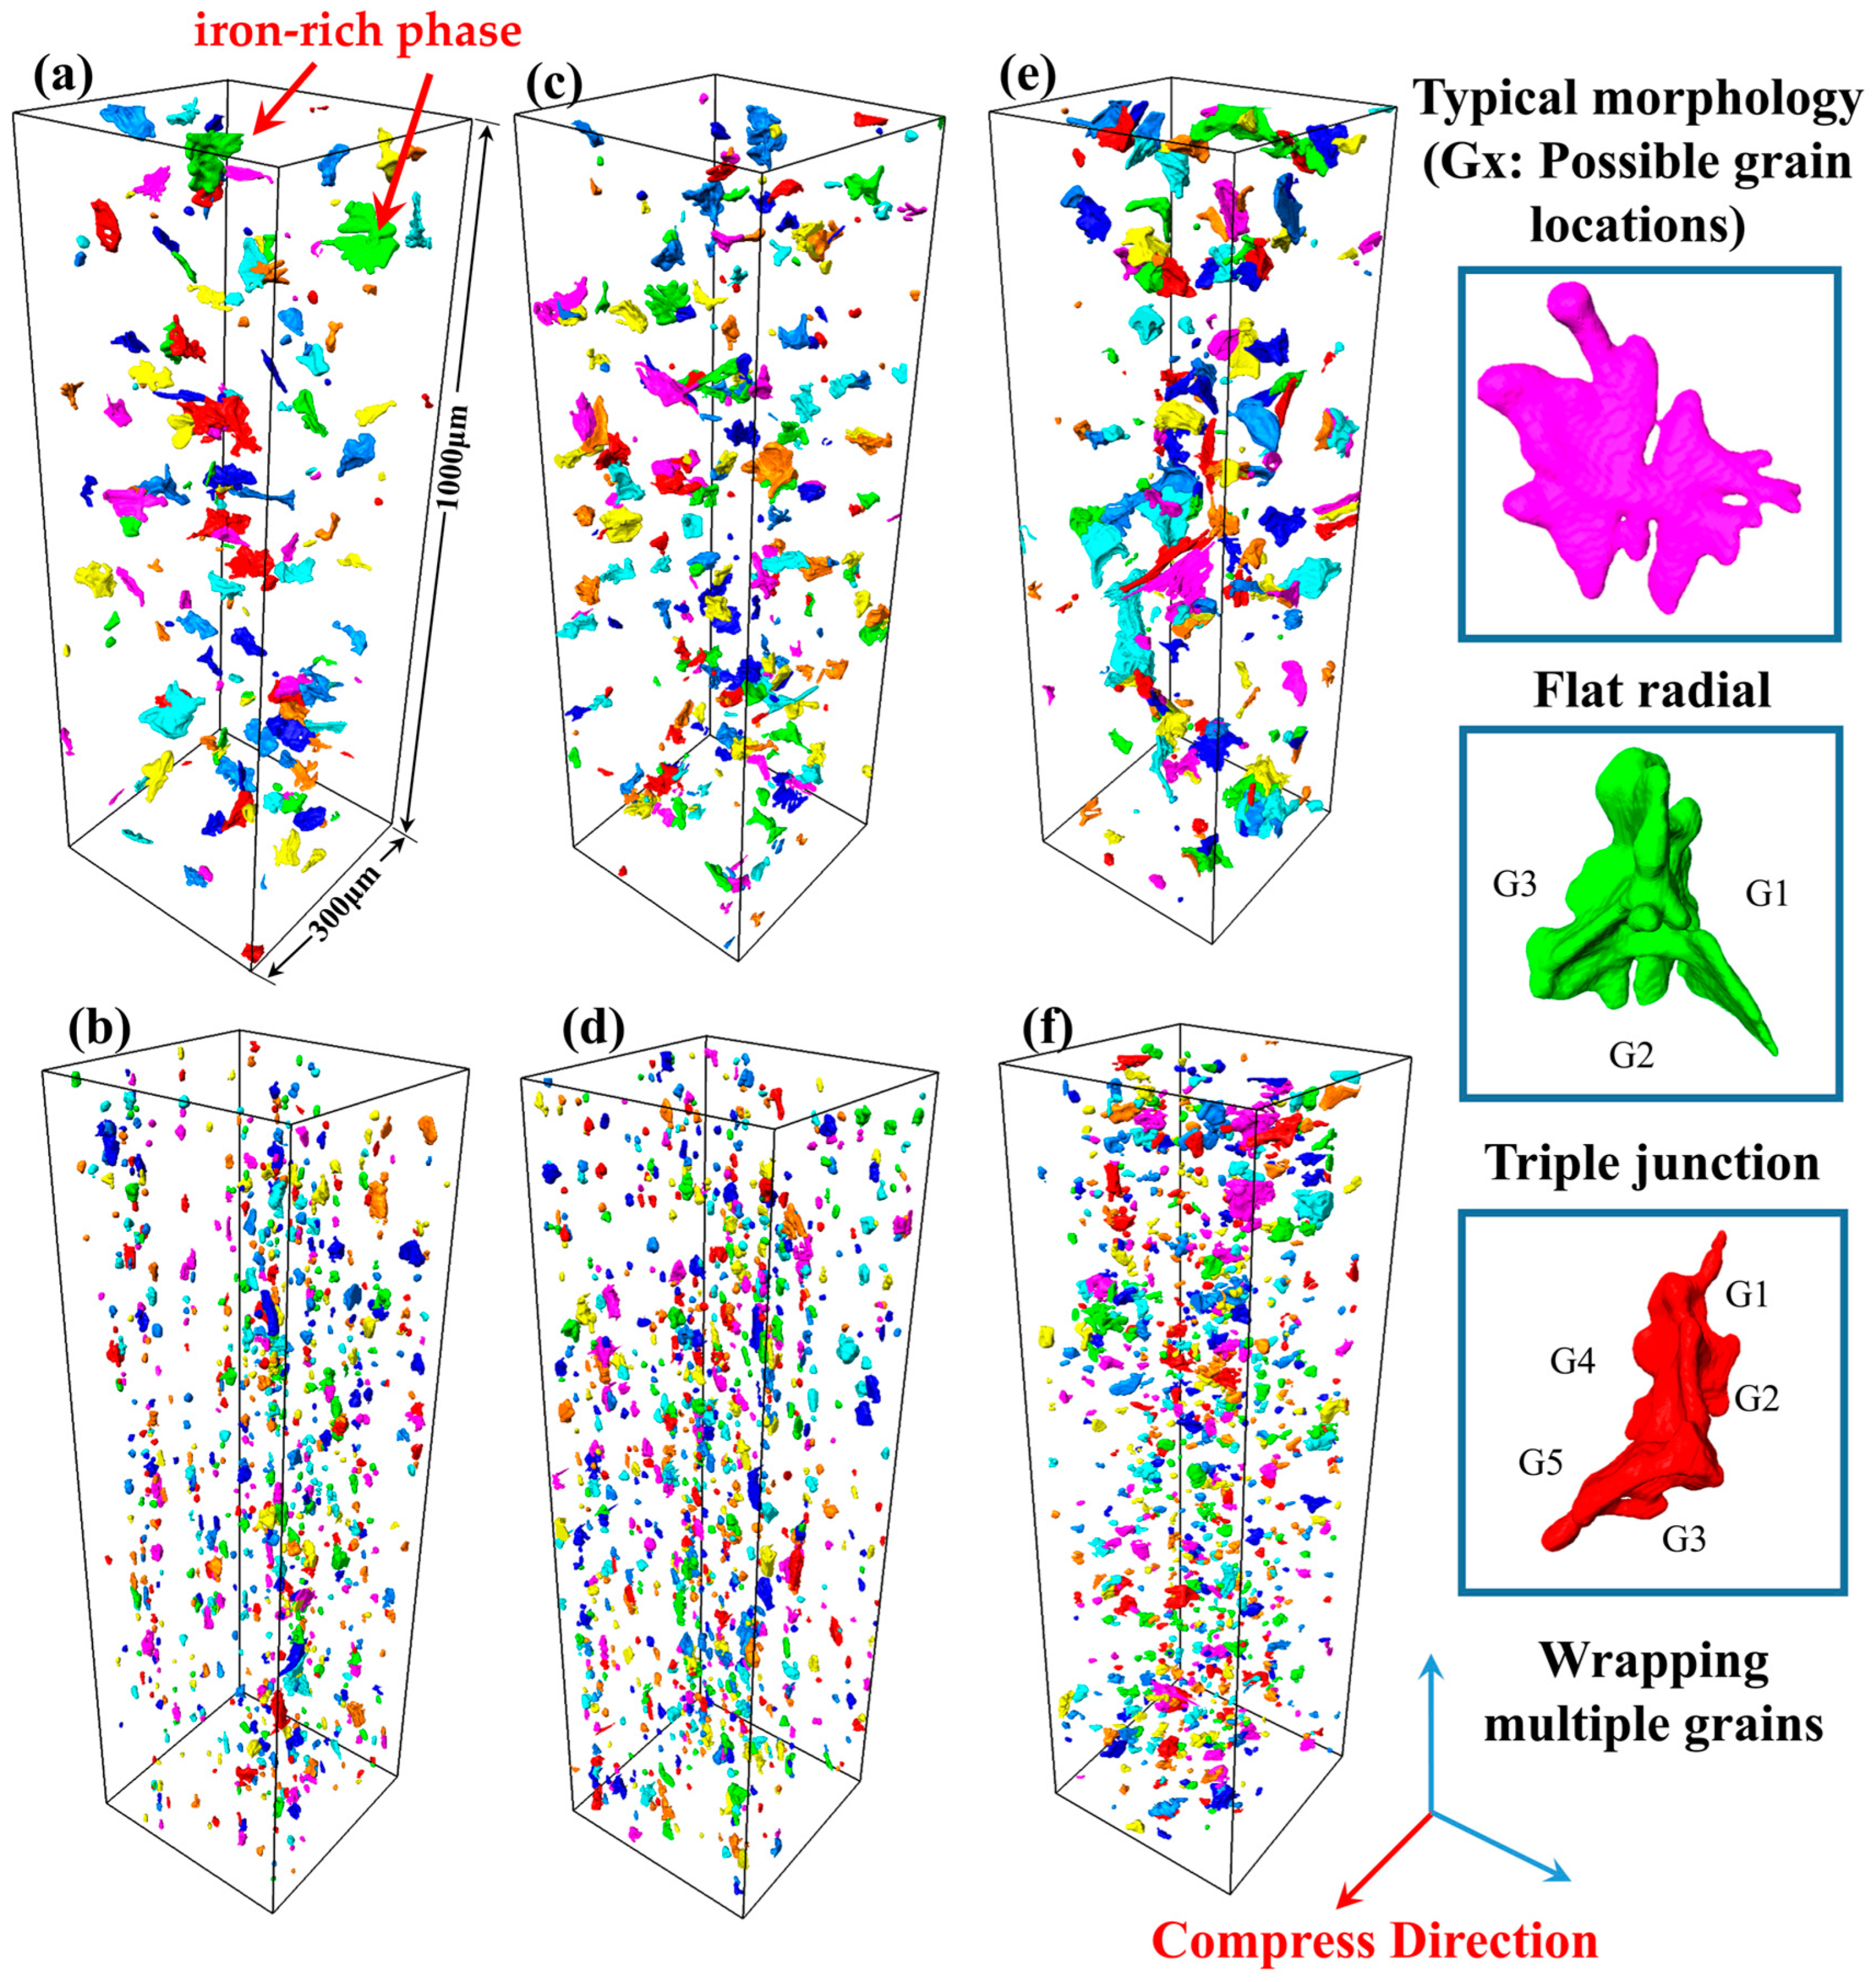
In order to visually and quantitatively analyze the effect of Mg on the thermal processing of 5383 aluminum alloys, the 3D morphology and distribution of Fe/Mn intermetallic compounds are investigated using SR-CT.
Figure 13a,c,e show the 3D morphology and distribution of the iron-rich phase with the increase in the Mg content before thermal deformation. It can be observed that most of the iron-rich phases before deformation are distributed as irregular particles, and the volumes of the iron-rich phases are slightly larger in the three typical areas: flat and dendritic outward radiation, a triangular distribution at the junction of the three grains, and a complex structure wrapped around multiple grains. The average size and volume of the Al
6(Fe,Mn) iron-rich phases increase with the Mg content.
Figure 13b,d,f show the changes in the 3D morphology and distribution of the iron-rich phase with the increase in the Mg content after compression deformation. After roll deformation, the iron-rich phase is distributed along the rolling direction according to a certain orientation, and the crushed iron-rich phase is distributed along the grain boundaries between the narrow and long bands of deformed grains. At this time, there is no longer a larger iron-rich phase in Mg4.0, and the morphology of the iron-rich phase is close to smaller spherical particles scattered near the long grain boundaries. But with an increase in the Mg content, the larger iron-rich phase can still be observed in Mg5.0. The average size and unit volume of the iron-rich phase increase with the increase in the Mg content after deformation, the same as what was observed before deformation.
It can be seen that the Mg content has a significant effect on the morphology of the iron-rich phase and the hot working properties of the alloy. In the casting process, for Mg-containing iron-rich intermetallic compounds, magnesium is an essential component in both the crystallization nucleation stage and the growth stage. During the nucleation stage, as an alloying element, magnesium may participate in the formation of iron-rich phase nuclei, promoting nucleation by reducing the nucleation energy barrier. In the growth stage, magnesium continues to be incorporated into the lattice of iron-rich phases as a constituent element or regulates crystal growth kinetics by influencing interfacial diffusion rates. In this process, magnesium is not only a chemical component of Mg-containing iron-rich phases, but its concentration may also affect the precipitation path, size, and distribution of these phases, thereby significantly impacting the properties of aluminum alloys [
22], and the high Mg content leads to the saturation of Mg elements in the matrix α-Al, which significantly increases the diffusion resistance of Mg elements from the iron-rich phase to the matrix. This diffusion inhibition effect hinders the dissolution of the Fe-rich phase in the homogenization process, which ultimately leads to the increase in its size with the increase in the Mg content. During thermal deformation, these large, hard iron-rich phases increase the stress concentration and severely limit the metal flow properties. Therefore, compared to the other two aluminum alloys with lower Mg contents, higher temperatures (≥420 °C) and lower strain rates (≤0.16s
−1) are required to ensure the deformation of the Mg5.0-5383 aluminum alloy, which directly results in the smallest processing safety region over the full strain range in its 3D thermal processing diagram. So, the safe deformation region decreases with the increase in the Mg content.
Figure 14 shows the IPF maps of 5383 alloys with varying Mg contents deformed at 440 °C/0.05 s
−1. All variants exhibit elongated banded structures, with Mg5.0 showing significantly higher recrystallized grain density. The white boxes in
Figure 14a–c highlight recrystallization nucleation around secondary phases, which is observed across all compositions but is the most pronounced in Mg5.0. As shown in
Figure 15, increasing the Mg content elevates the residual dislocation density while simultaneously enlarging the Fe-rich phase size and volume fraction. This dual effect creates abundant nucleation sites for recrystallization, explaining the enhanced DRX observed in Mg5.0 (
Figure 15c) under these deformation conditions. The intensified microstructural evolution (dislocation rearrangement/grain boundary migration) consumes additional energy, so Mg5.0 exhibits the highest value of power dissipation in the thermal processing diagrams.
