
Early Hydration Characteristics and Kinetics Model of Ordinary Portland Cement-Calcium Sulfoaluminate Cement Composites


Abstract
1. Introduction
2. Materials and Methods
2.1. Experimental Materials
2.2. Sample Preparation
2.3. Testing Methods
2.3.1. Hydration Heat Analysis
2.3.2. Phase Analysis
2.3.3. Microstructural and Pore Structure Analysis
2.4. Hydration Kinetic Model
3. Results and Discussion
3.1. Hydration Heat Evolution Characteristics
Failure Pattern
3.2. Hydration Product Composition and Phase Evolution
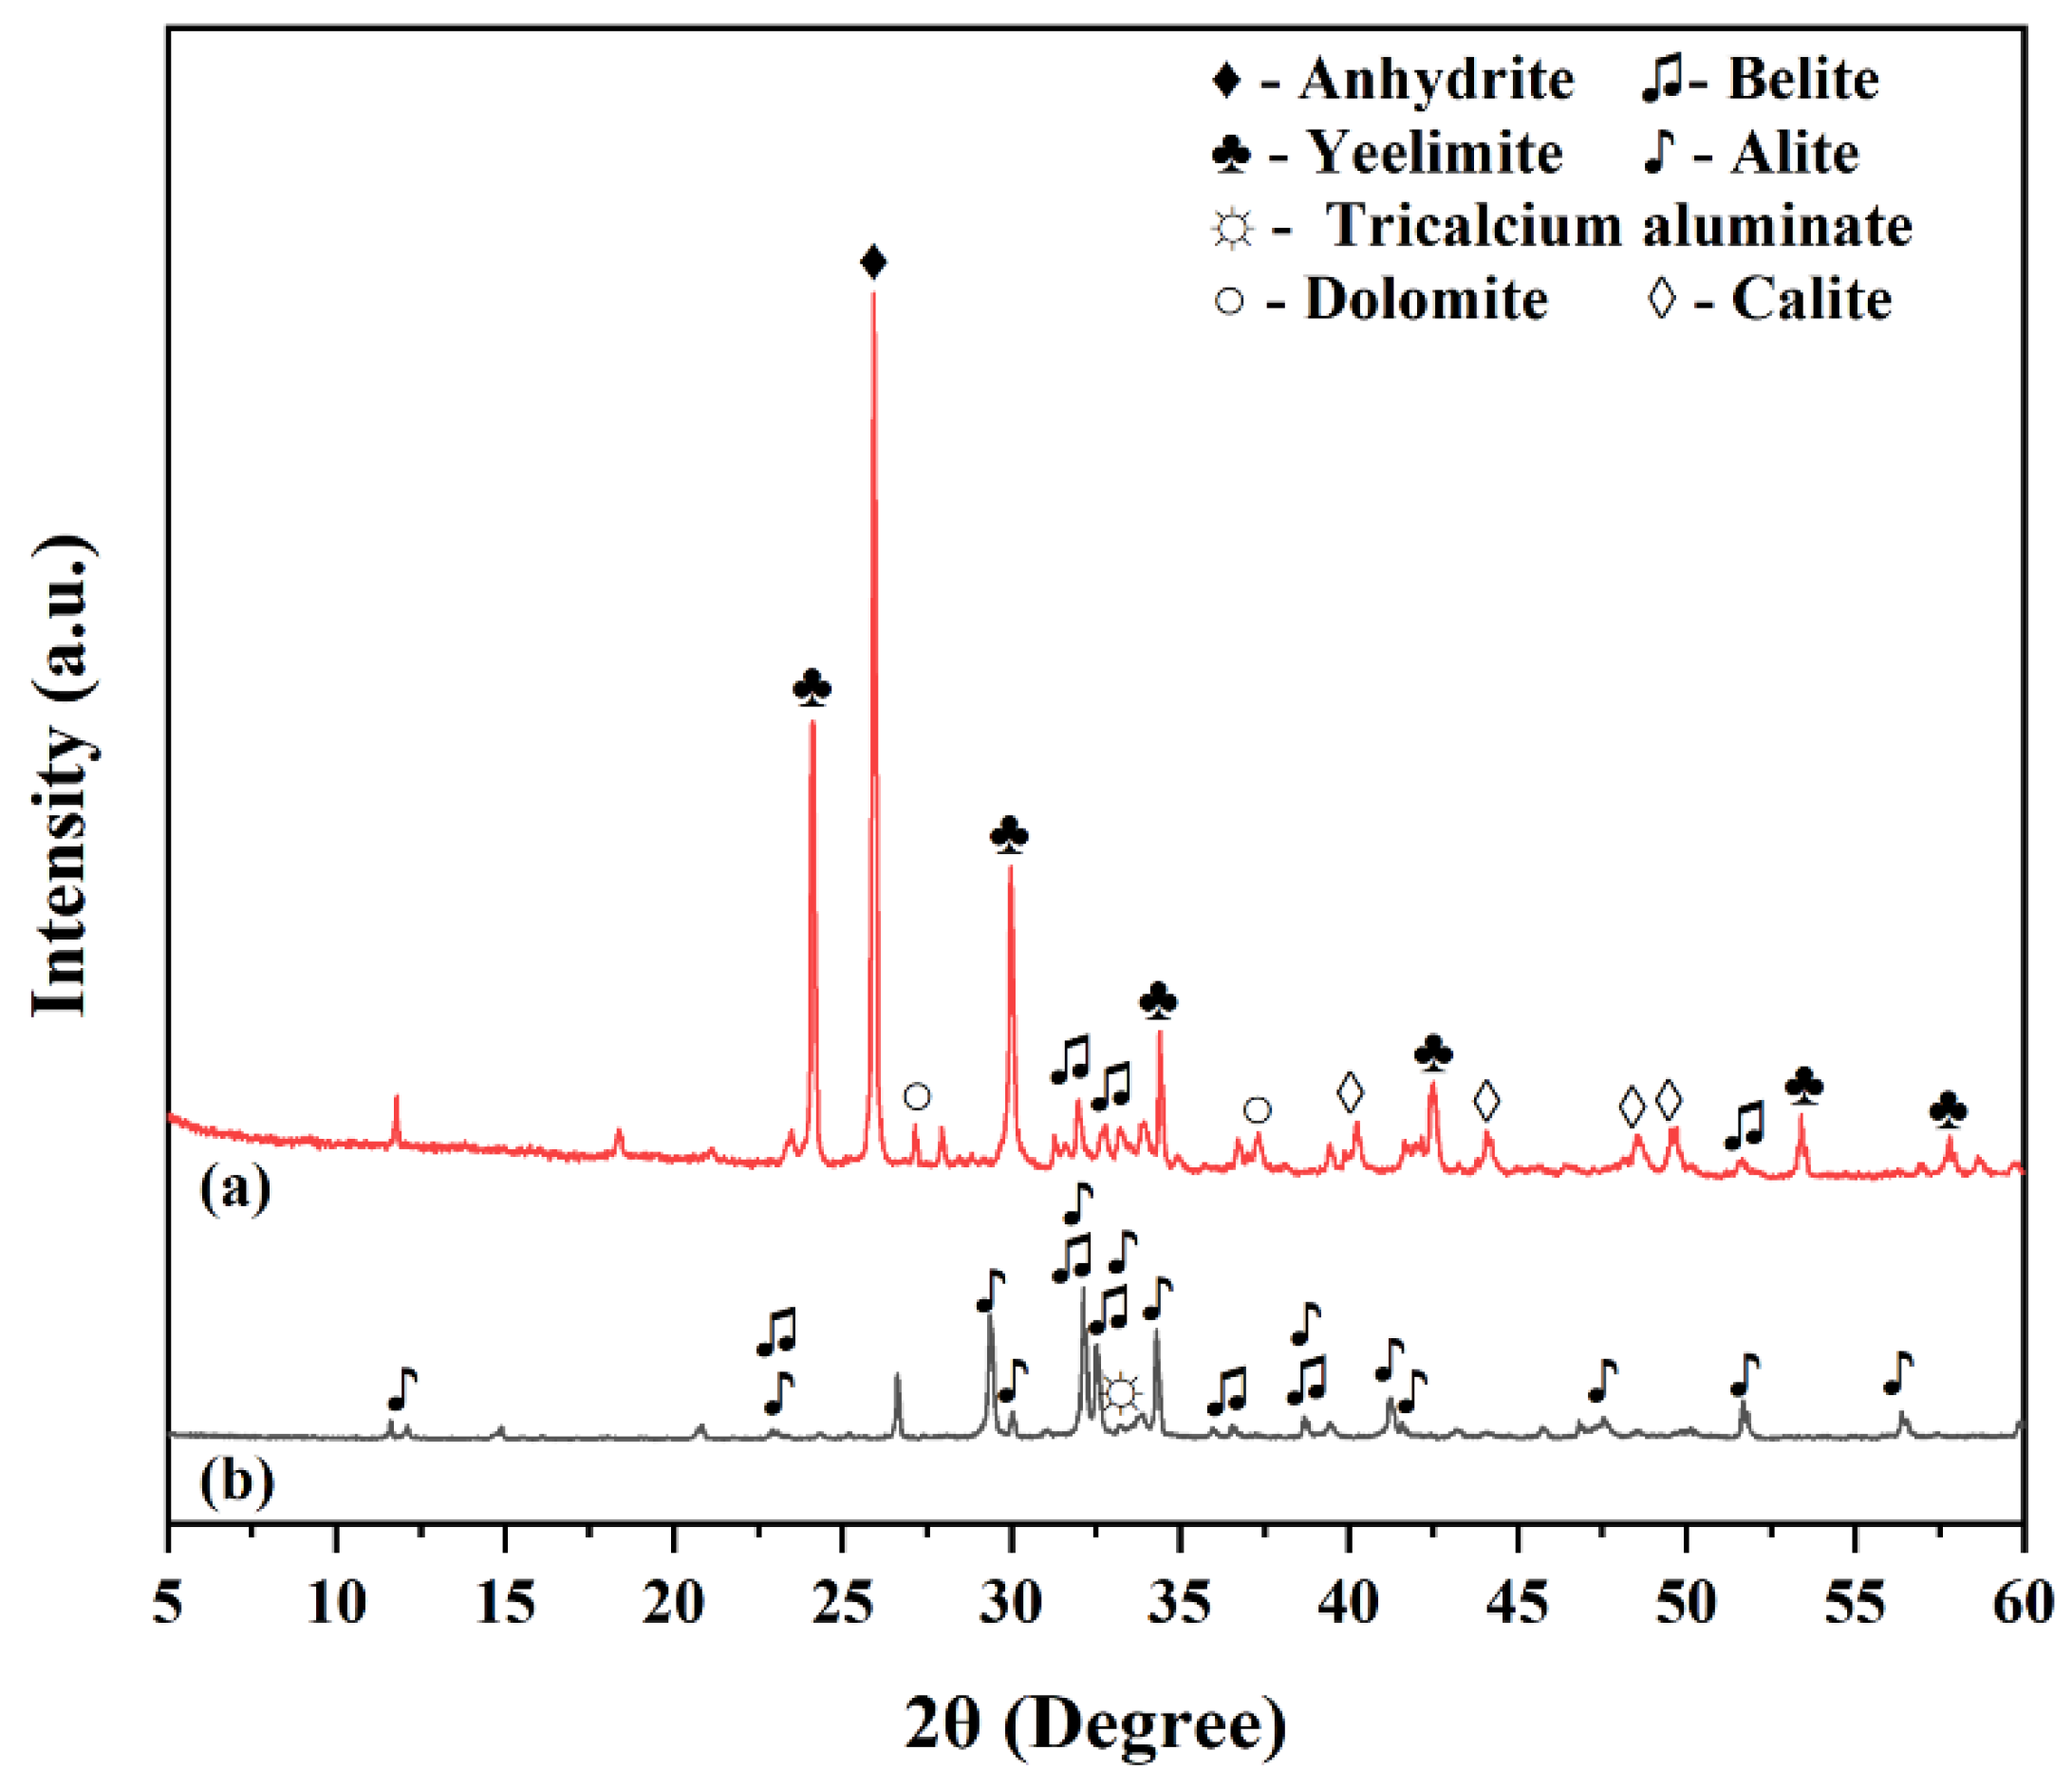
3.2.1. XRD Analysis
3.2.2. FT-IR Analysis
3.2.3. TG-DTG Analysis
3.3. Microstructural and Pore Structure Characteristics
3.3.1. SEM Observations and EDS Analysis
3.3.2. MIP Analysis
3.4. Hydration Kinetic Model and Parameter Analysis
4. Conclusions
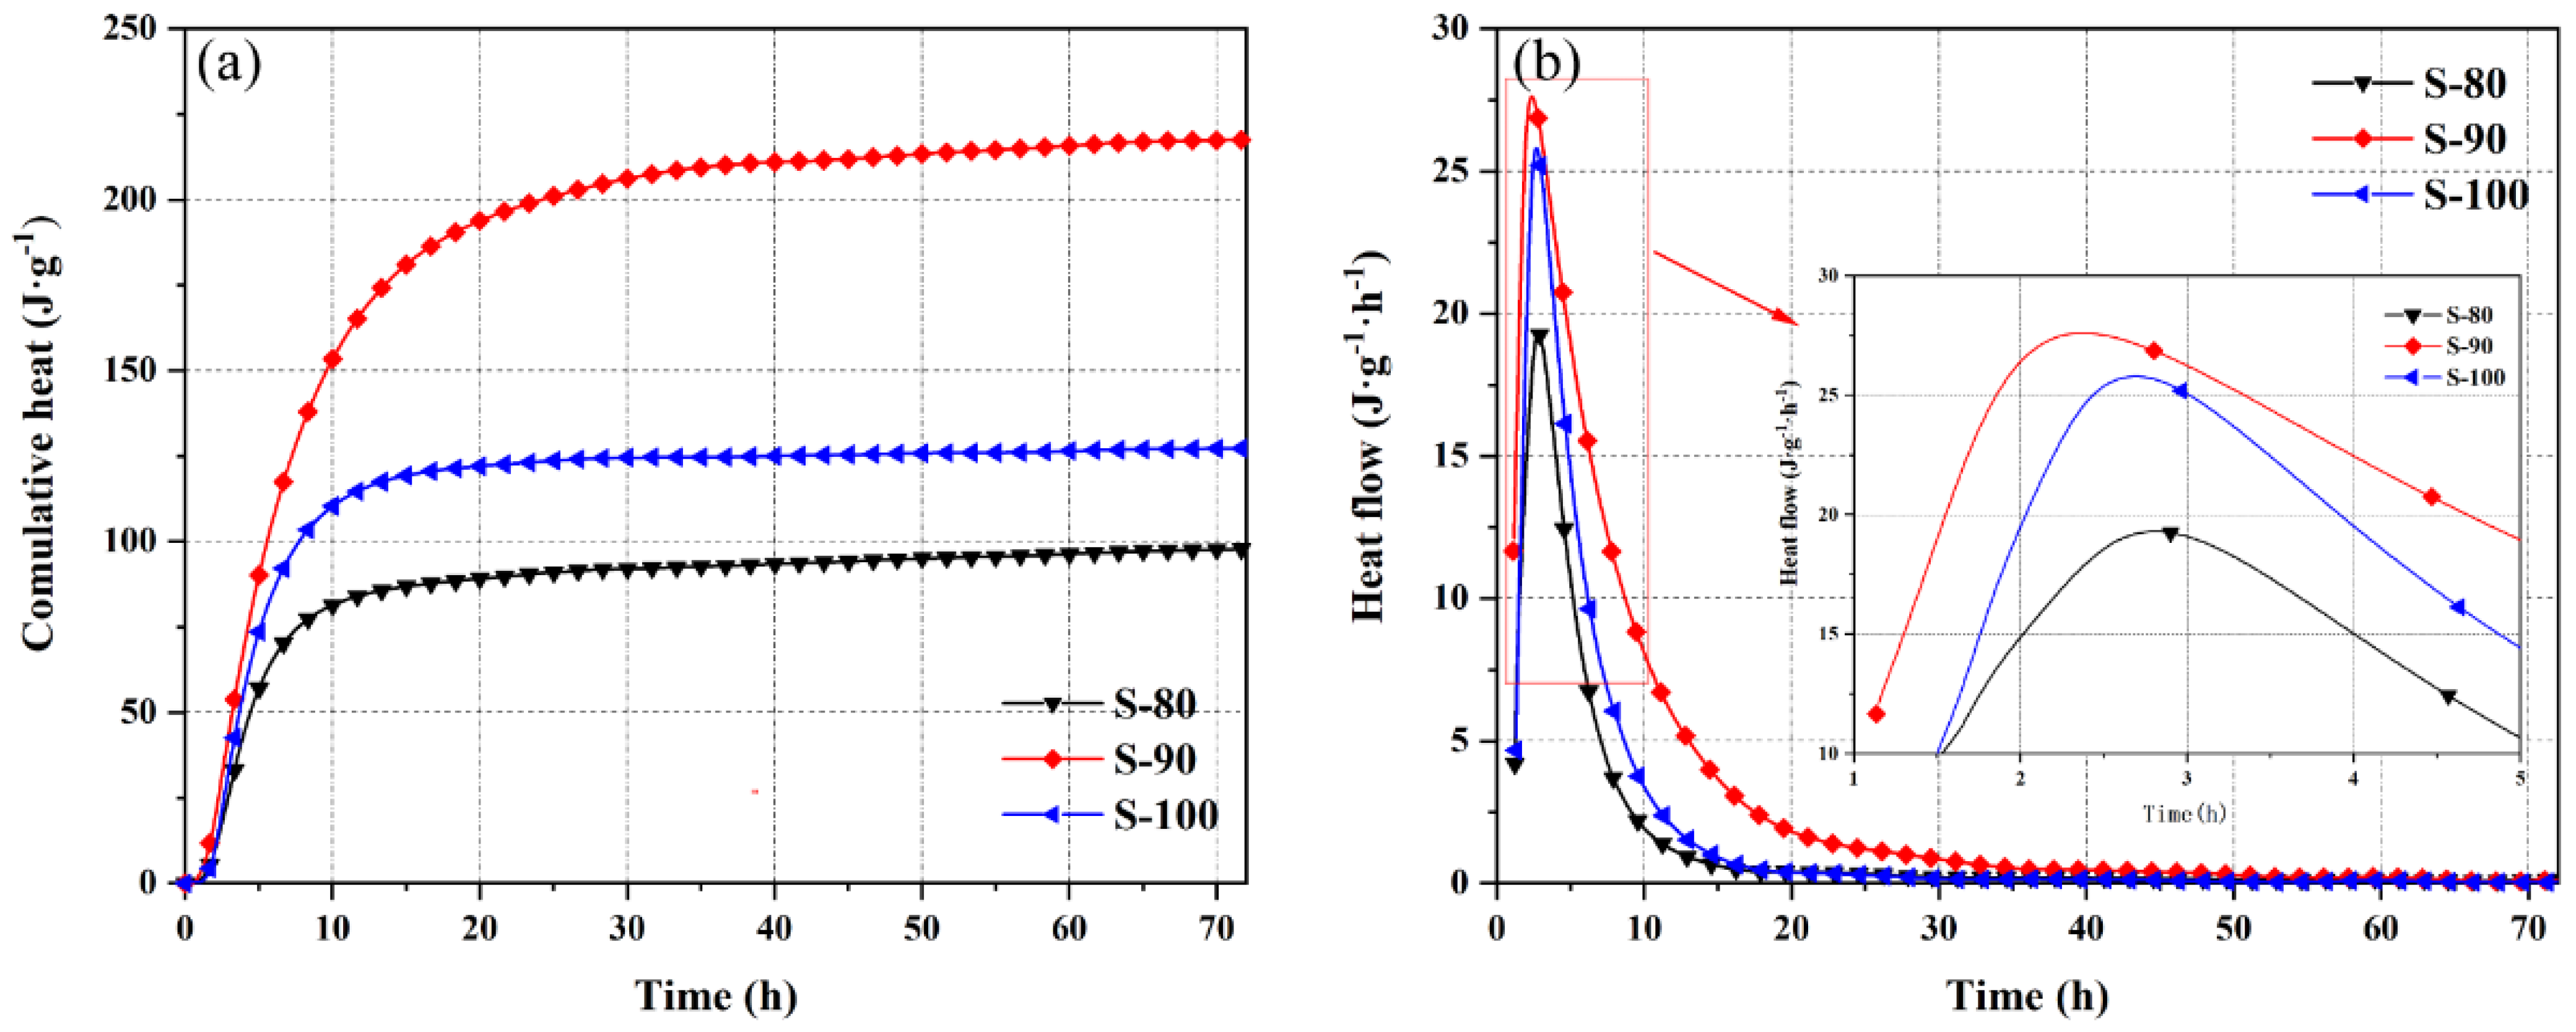
- Threshold effects of admixture content on hydration processes. In the P area, the CSA content shows a dual “optimization-inhibition” effect on hydration. A 10% CSA content (P-10) provides nucleation sites through ye’elimite and induces rapid ettringite nucleation via calcium hydroxide. This significantly increases the 3-day cumulative hydration heat (a 63.8% increase compared to pure OPC) and advances the peak heat release rate (by 4.3 h). The nucleation and growth rate constant k_1^’ increases by 22% compared to P-00. However, a 20% CSA content (P-20) inhibits the hydration of OPC silicate minerals due to imbalanced calcium hydroxide supply and excessive sulfate ions, leading to an 18.6% reduction in cumulative hydration heat compared to P-10.In the S area, a 10% OPC content (S-90) increases system alkalinity through free lime, promoting the hydration pathway of ye’elimite to shift from the “AH_3 type” (without CH participation) to the “AFt type” (induced by CH). This results in a 71.0% increase in 3-day cumulative hydration heat compared to pure CSA (S-100). But a 20% OPC content (S-80) causes a delayed peak heat release rate and reduced hydration degree due to ion concentration imbalance and steric hindrance between mineral particles.
- Hydration product formation and mineral interaction mechanisms. In the P area, a 10% CSA content promotes the hydration of OPC’s tricalcium aluminate and belite, leading to increased formation of C-S-H gel and slender ettringite crystals. However, a higher CSA content (20%) causes excessive consumption of calcium hydroxide, shifting ye’elimite hydration to form unstable AH3 gel and inhibiting silicate mineral hydration. In the S area, free lime from OPC creates an alkaline environment that facilitates ettringite (AFt) formation during ye’elimite hydration. Yet, the early hydration of OPC’s tricalcium aluminate and belite is suppressed, meaning ye’elimite hydration mainly relies on externally introduced free lime rather than in-situ generated calcium hydroxide. As OPC content increases in the S area, the promotion of ye’elimite hydration toward the AFt type first strengthens and then weakens.
- Zonal differences in pore structure evolution. In the P area, CSA promotes dense packing of hydration products, resulting in most probable pore sizes below 100 nm. A 10% CSA content significantly reduces cumulative pore volume and refines the pore structure. In the S area, the rapid hydration and expansive properties of CSA lead to most probable pore sizes in the 340–440 nm range, with macropores (2000–8000 nm) present. While OPC incorporation inhibits macropores larger than 1000 nm in the S area, excessive hydration heat in samples like S-90 prevents significant optimization of cumulative pore volume (similar to pure CSA sample S-100), reflecting competitive effects of alkalinity and hydration heat on pore structure.
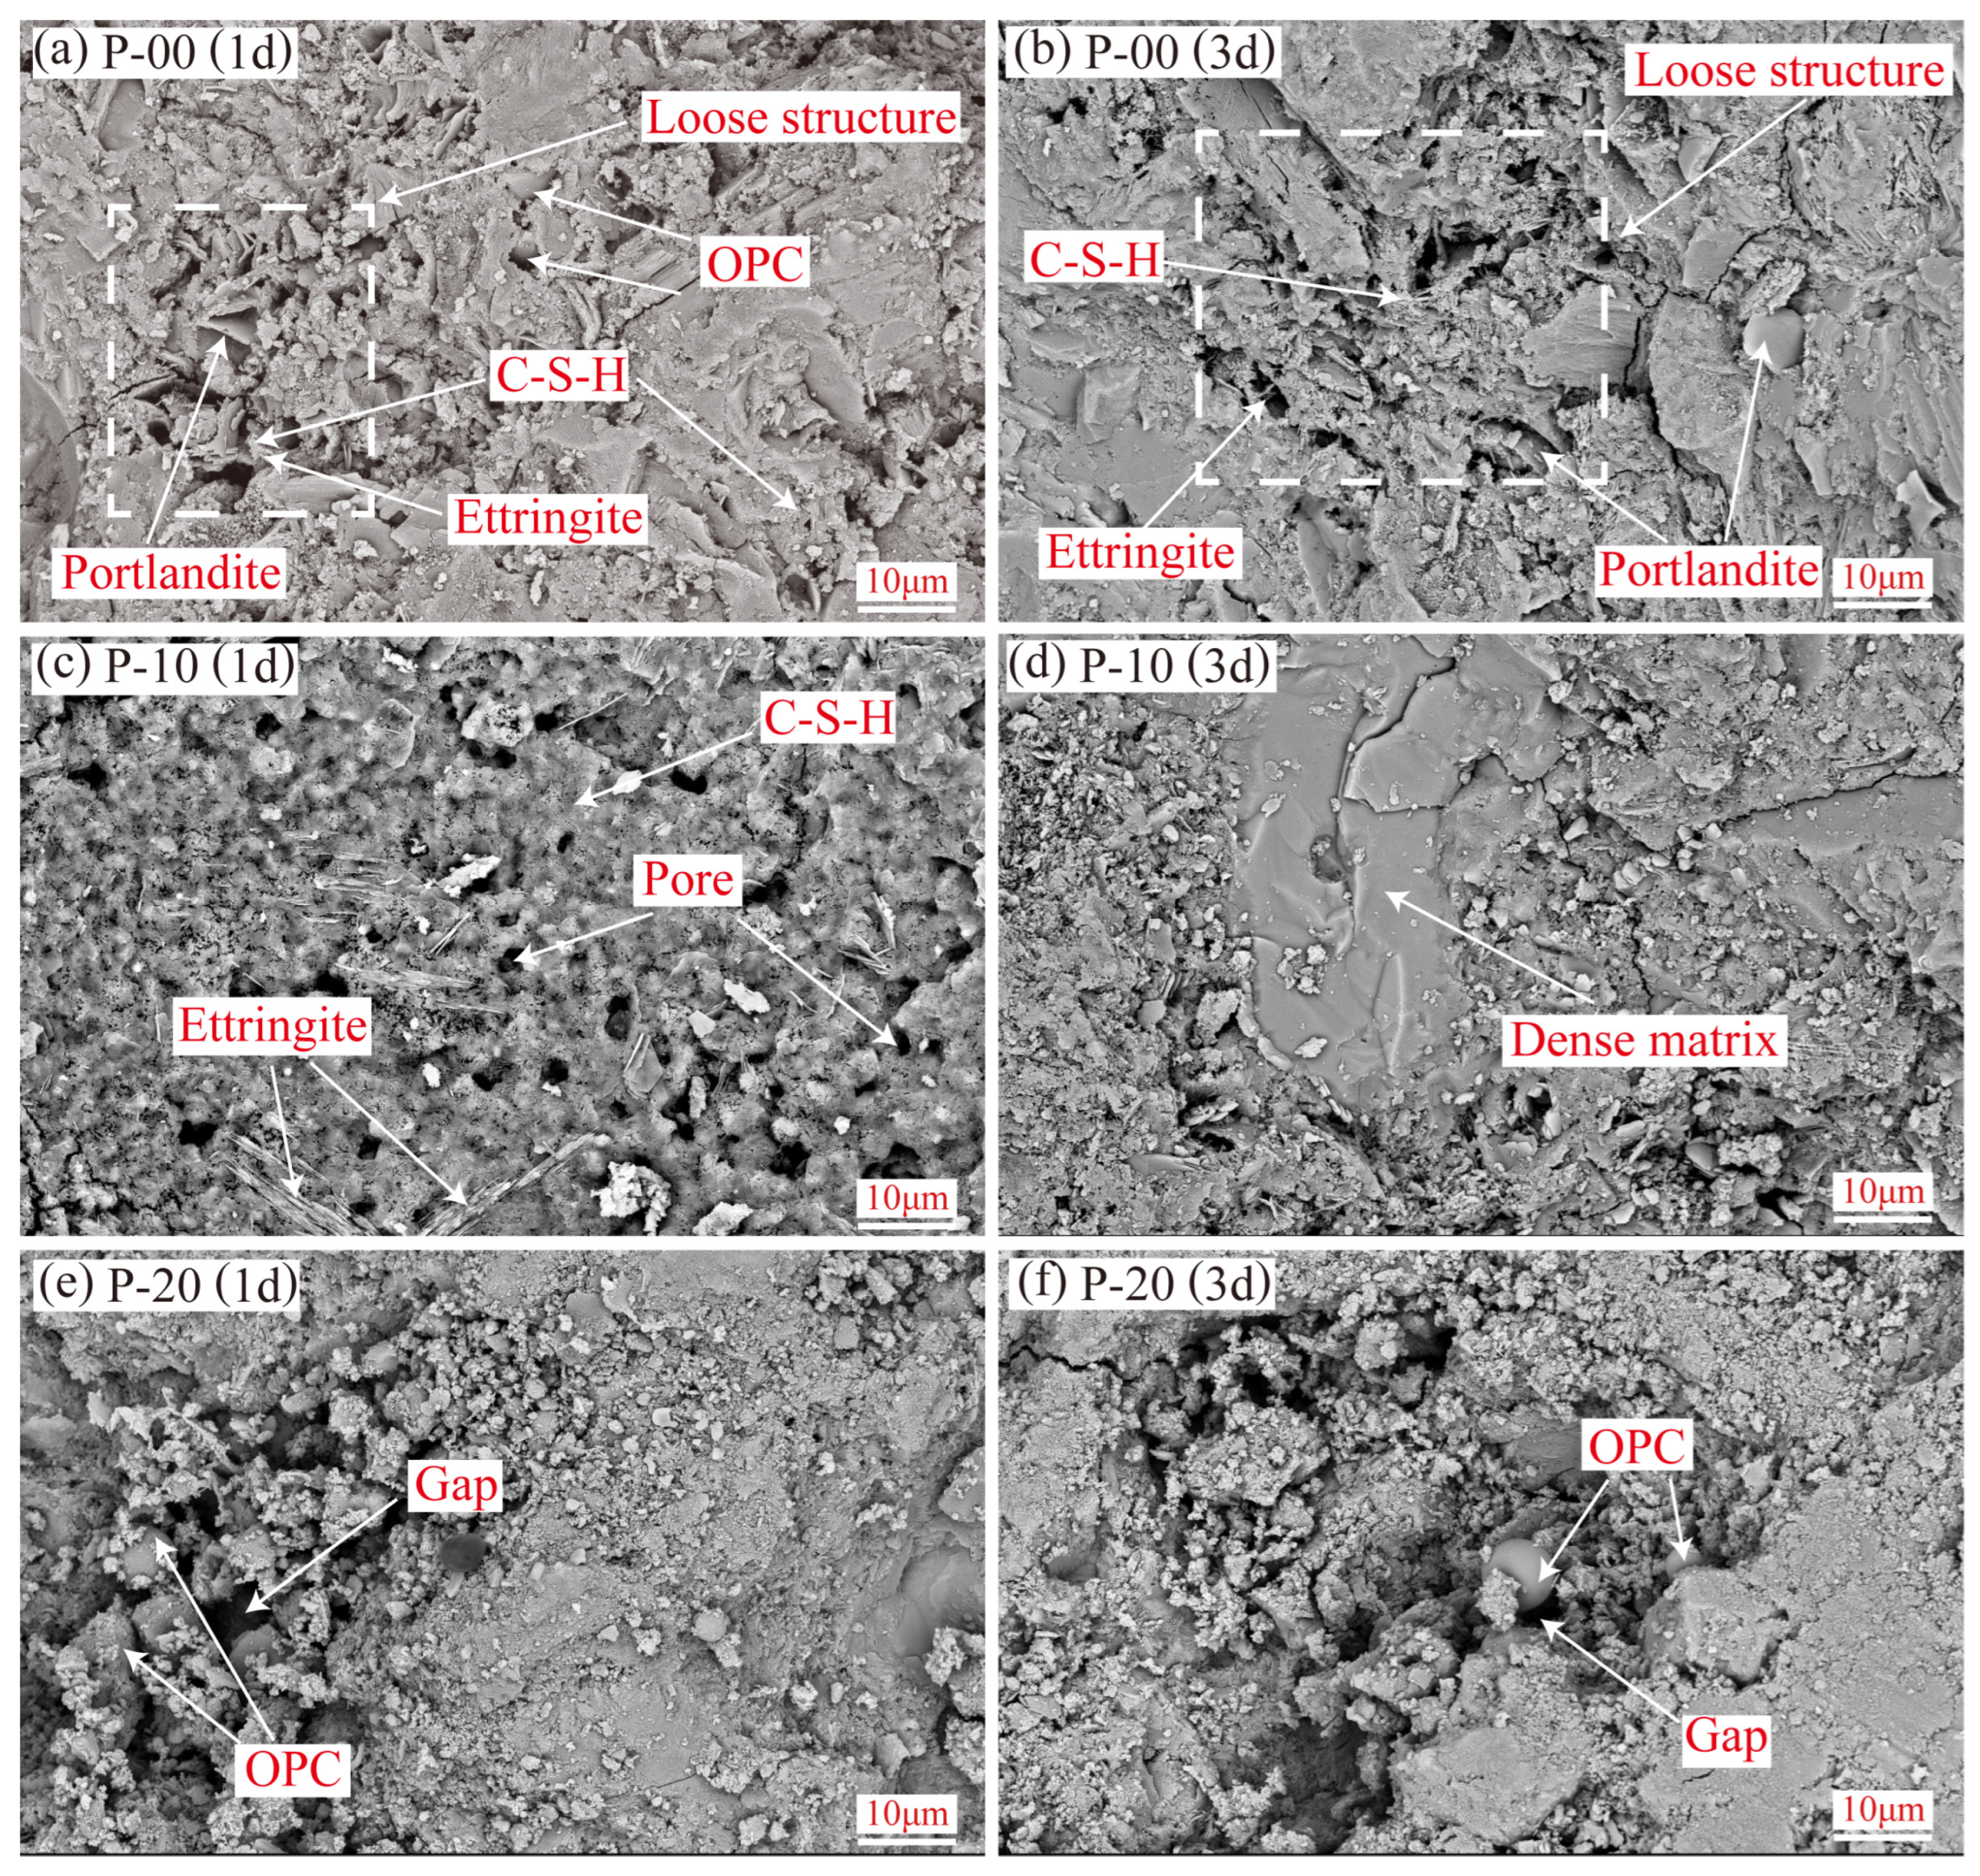
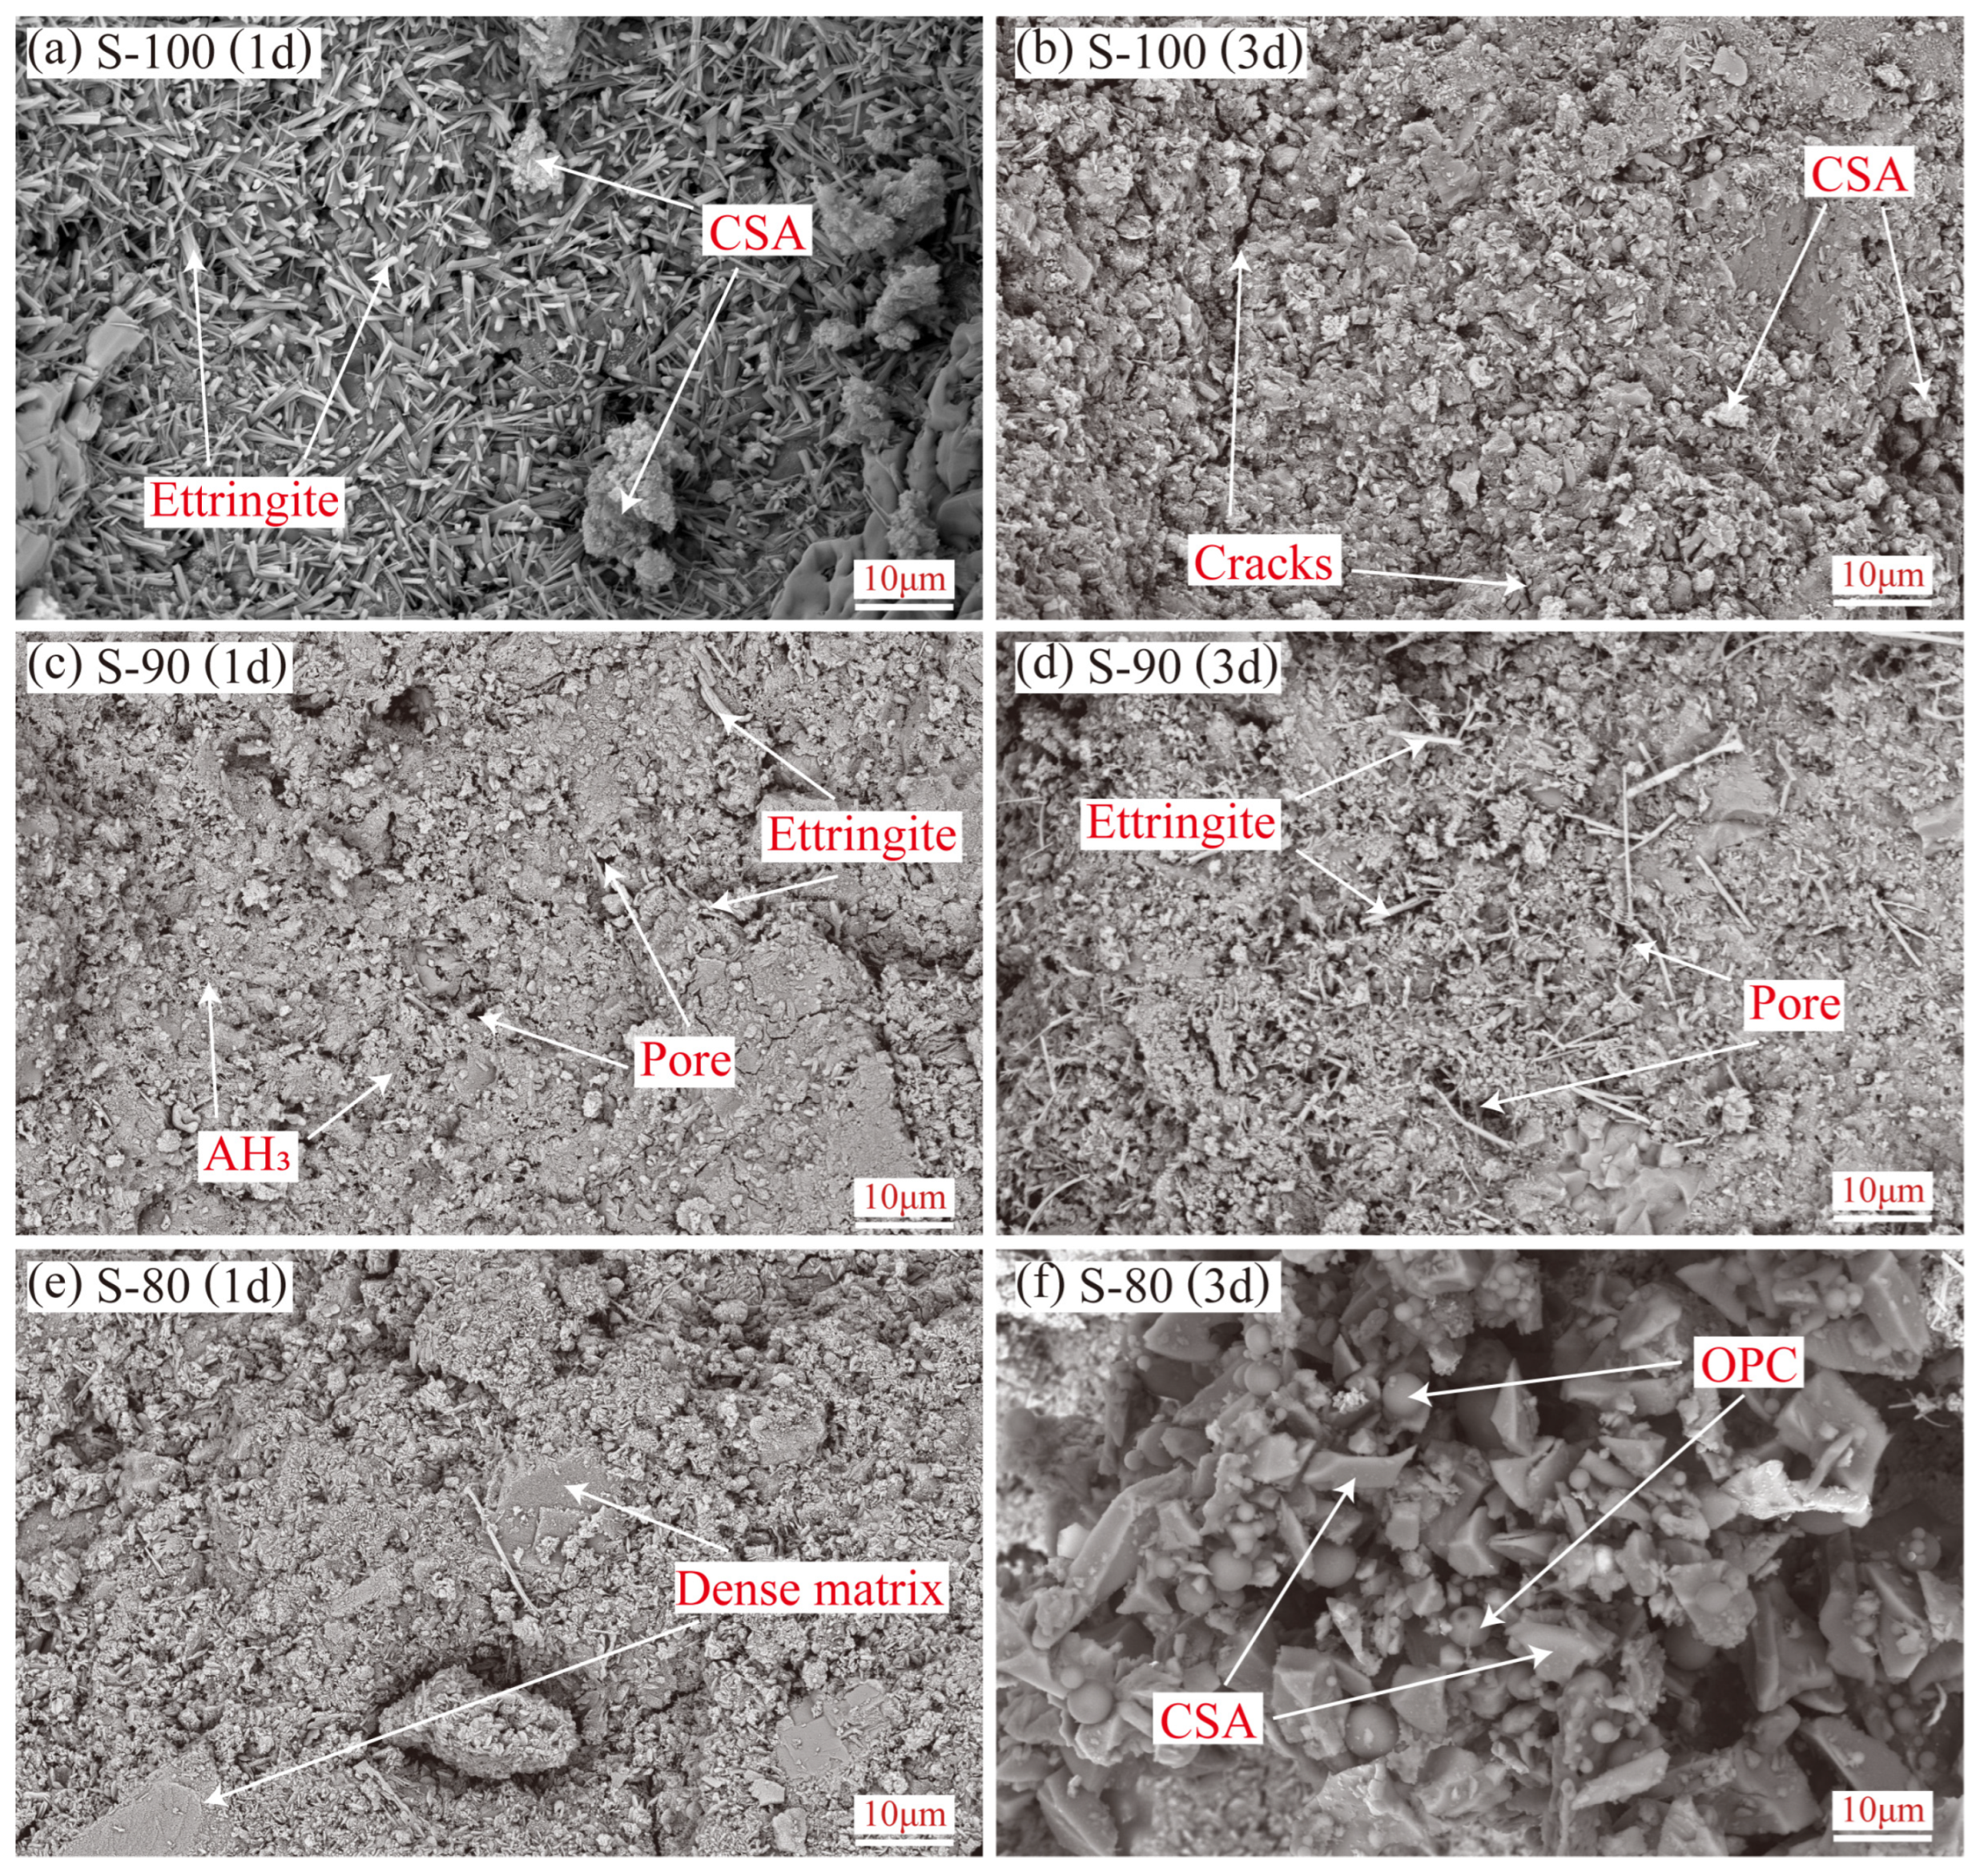
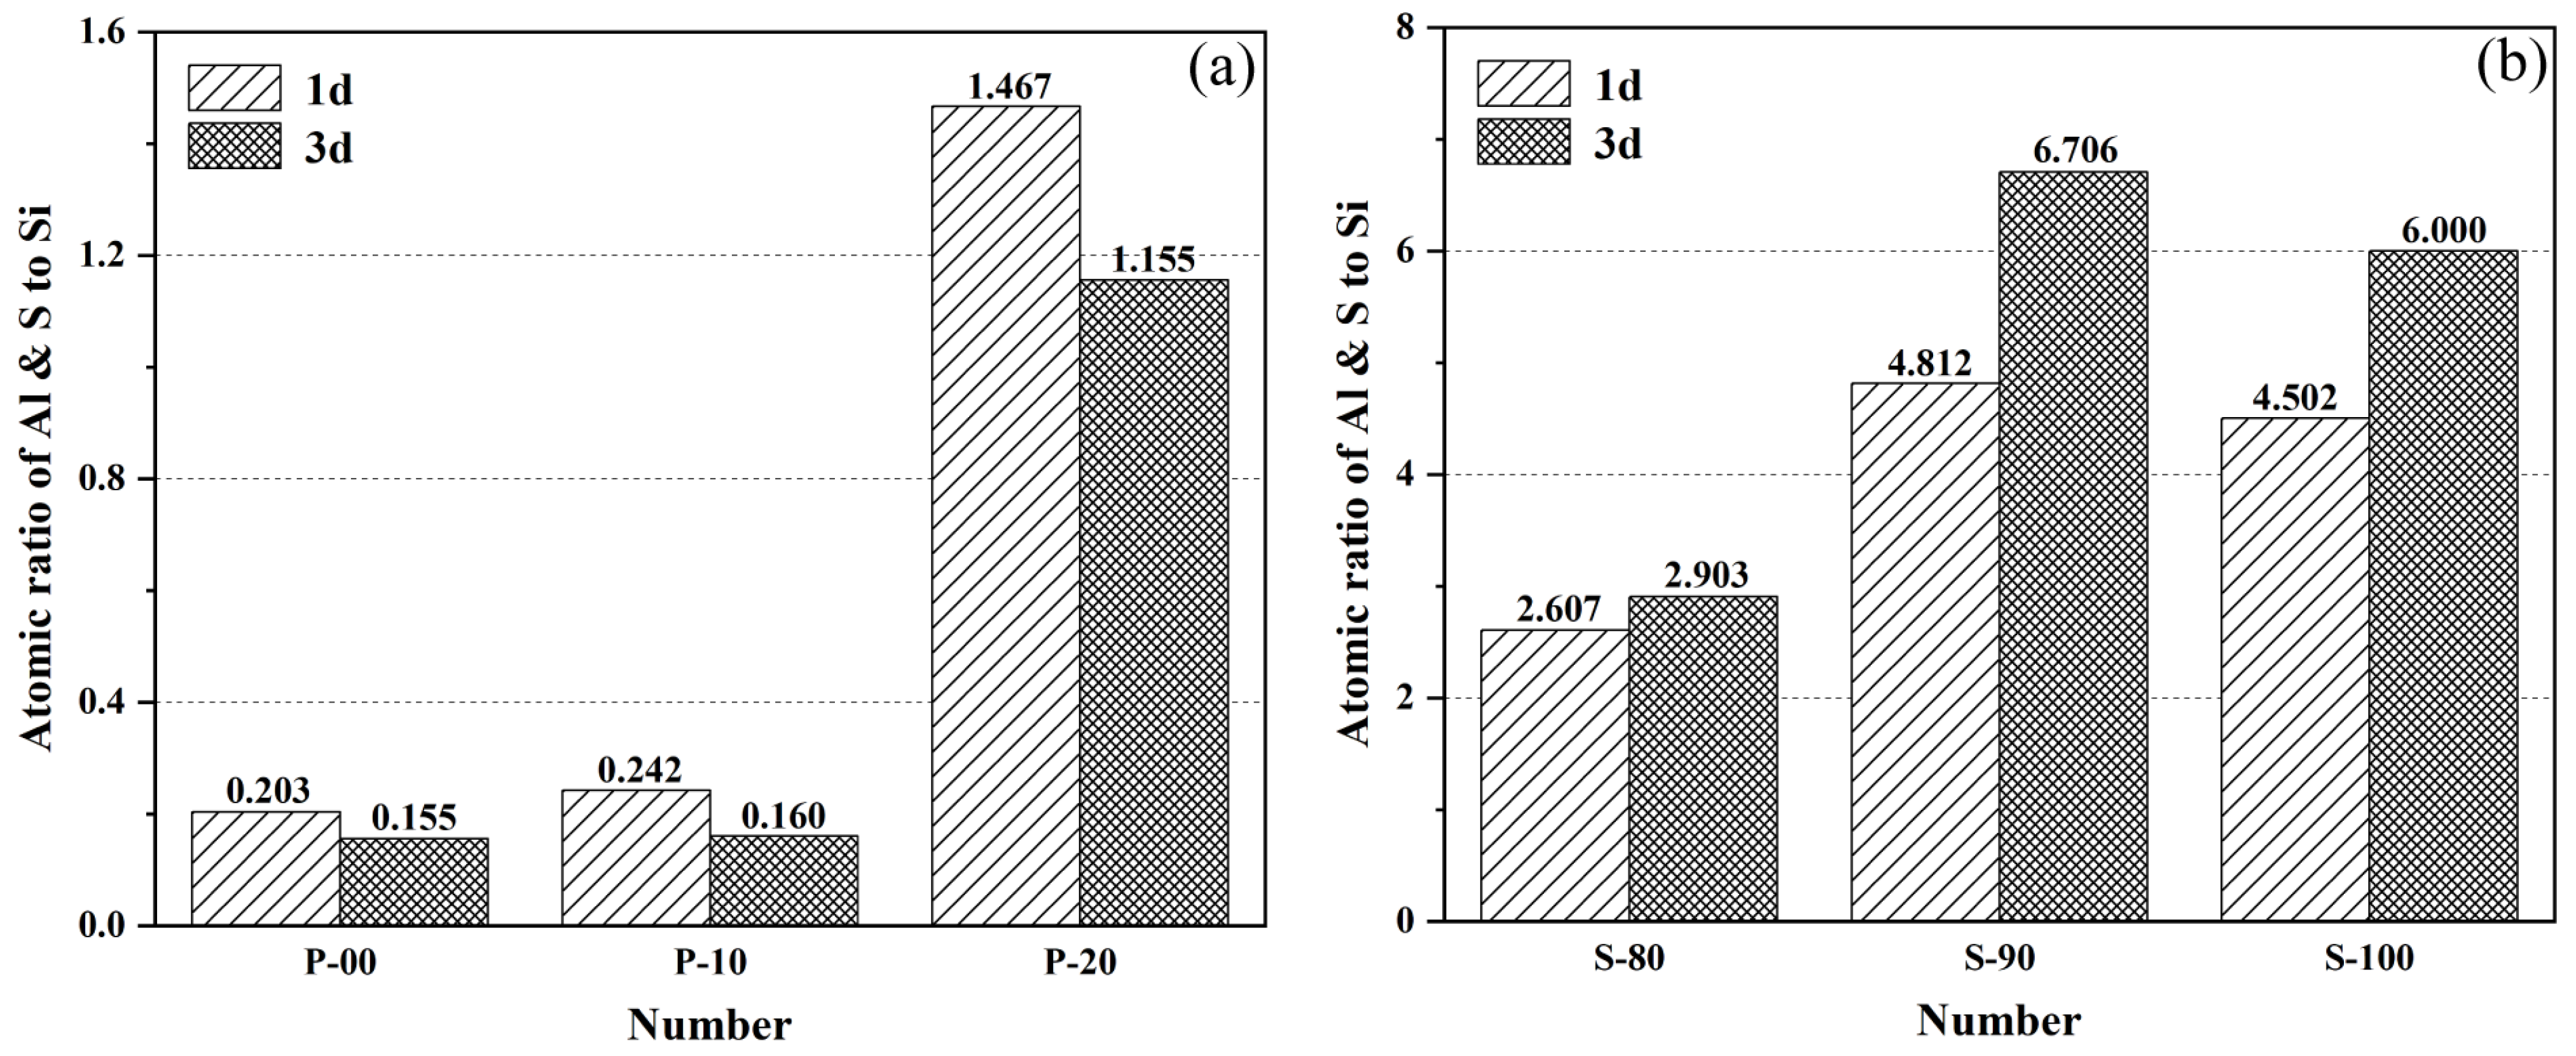
- Microstructural characteristics and elemental distribution. At 1-day hydration, P-10 forms a uniform C-S-H gel matrix, which becomes highly dense at 3 days with ettringite exhibiting one-dimensional oriented growth. In contrast, P-20 shows numerous unhydrated OPC particles and interparticle voids due to suppressed hydration. In S-90, ettringite evolves from short rod-shaped to slender crystals with age, indicating alkalinity-promoted AFt-type hydration, but excessive hydration heat leads to a porous internal structure. In S-80, rapidly formed early hydration products hinder ion diffusion, leaving abundant unhydrated particles in pores at 3 days. Dynamic evolution of Al/Si and S/Si atomic ratios from EDS quantitatively validates Si enrichment in the P area (due to C-S-H gel formation) and relative enrichment of aluminum and sulfur in the S area (reflecting differences in ye’elimite hydration pathways).
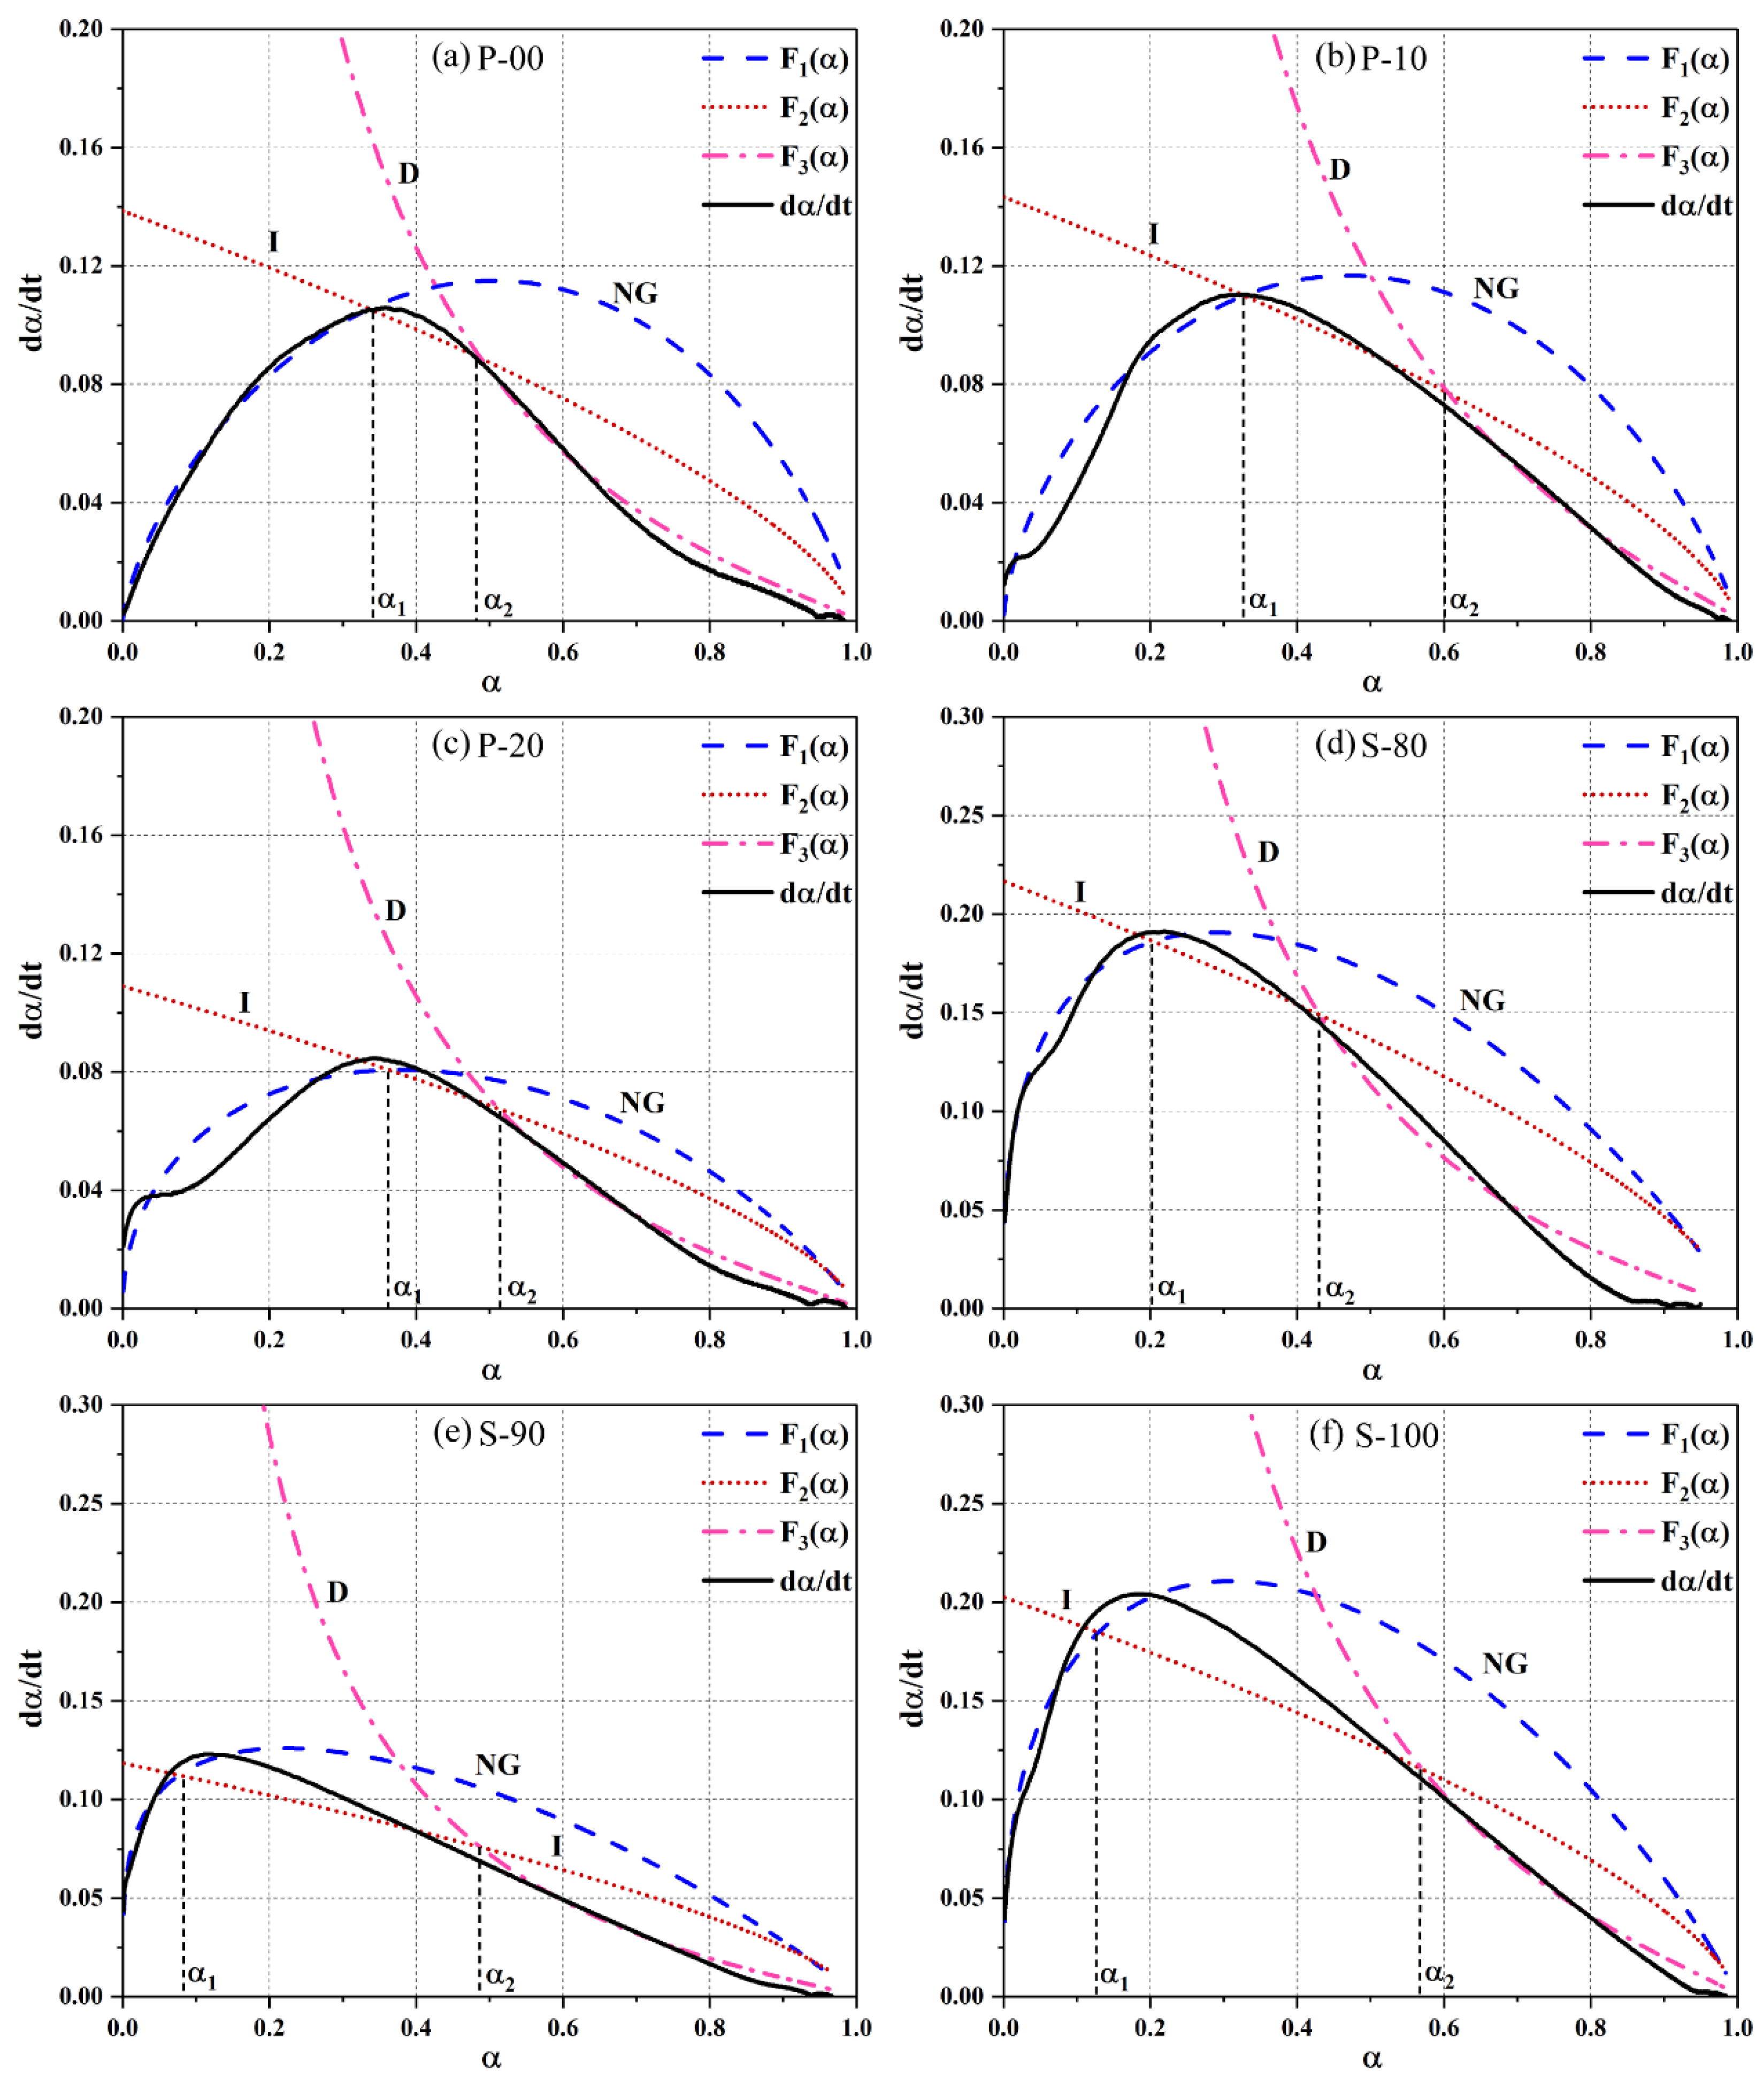
- Hydration kinetic model and parameter characteristics. The Krstulović–Dabić model shows that in the P area, CSA increases nucleation sites, causing the nucleation and growth (NG) process to shift from three-dimensional to two-dimensional growth (crystal growth constant n decreases from 3.3750 to 1.9055) and enhances interfacial reaction (I) and diffusion (D) rates (increased and ), with P-10 exhibiting optimal kinetic performance. In the S area, OPC suppresses early nucleation of ye’elimite through alkalinity regulation ( decreases by 38.2% compared to S-100) and prolongs the diffusion process (D). S-90 relies on a slow diffusion mechanism, leading to a 32-h heat release deceleration stage. Model parameters align with microstructural and heat release behaviors, though slight deviations in simulating the S area’s interfacial reaction process require in-situ XRD to track ye’elimite decomposition kinetics.
Author Contributions
Funding
Institutional Review Board Statement
Informed Consent Statement
Data Availability Statement
Acknowledgments
Conflicts of Interest
References
- Cho, S.; Suh, H.; Kim, G.; Liu, J.; Li, P.; Bae, S. Microstructural phase evolution and strength development of low-lime calcium silicate cement (CSC) paste incorporating ordinary Portland cement under an accelerated carbonation curing environment. Constr. Build. Mater. 2024, 411, 134248. [Google Scholar] [CrossRef]
- Oke, J.A.; Abuel-Naga, H.; Leong, E.C. De-carbonizing in construction using supplementary cementitious materials and accelerated carbonation technique—A review. Int. J. Geotech. Eng. 2024, 18, 392–413. [Google Scholar] [CrossRef]
- de Melo, J.V.S.; Trichês, G. Study of the influence of nano-TiO2 on the properties of portland cement concrete for application on road surfaces. Road Mater. Pavement Des. 2018, 19, 1011–1026. [Google Scholar] [CrossRef]
- Shen, X.; Guo, S.; Li, W.; Lu, C.; Zhang, K.; Wang, M.; Wen, Z. Research Status on Hydration and Properties of Low-Heat Portland Cement. Bull. Chin. Ceram. Soc. 2023, 42, 383–392. (In Chinese) [Google Scholar] [CrossRef]
- Liu, S.; Wei, L.; Zhou, S.; Zhao, S.; Guan, X.; Wang, L. Research Development of High-strength Low-calcium Portland Cement. Bull. Chin. Ceram. Soc. 2014, 33, 553–557. (In Chinese) [Google Scholar] [CrossRef]
- Aliabdo, A.A.; Elmoaty, A.E.M.A.; Mohamed, M.F. Permeability indices and corrosion resistance of geopolymer and portland cement concretes. Mag. Concr. Res. 2017, 70, 595–609. [Google Scholar] [CrossRef]
- Chen, J.J.; Sorelli, L.; Vandamme, M.; Ulm, F.-J.; Chanvillard, G. A coupled nanoindentation/SEM-EDS study on low water/cement ratio portland cement paste: Evidence for C–S–H/Ca(OH)2 nanocomposites. J. Am. Ceram. Soc. 2010, 93, 1484–1493. [Google Scholar] [CrossRef]
- Comin-Chiaramonti, L.; Cavalleri, G.; Sbaizero, O.; Comin-Chiaramonti, P. Crystallochemical comparison between portland cements and mineral trioxide aggregate (MTA). J. Appl. Biomater. Biomech. 2009, 7, 171–178. [Google Scholar]
- Zhang, H.; Su, Y.; Yang, Z.; Zhang, X. Early hydration process of the cement–lime system. Ce/Papers 2018, 2, 125–129. [Google Scholar] [CrossRef]
- Lai-Guo, W.; Ling-Chao, L.U.; Xin, C. Development of composite cement materials on portland and sulphoaluminate minerals. J. Shandong Inst. Build. Mater. 2004, 18, 24–27. [Google Scholar]
- Tang, X.; Zhan, S.; Xu, Q.; He, K. Mechanical Performance and Chloride Penetration of Calcium Sulfoaluminate Concrete in Marine Tidal Zone. Materials 2023, 16, 2905. [Google Scholar] [CrossRef] [PubMed]
- Lu, L.; Wang, S.; Cheng, X. Effect of admixture on sulfate resistance of alite-barium calcium sulphoaluminate cement mortar. Procedia Eng. 2012, 27, 237–243. [Google Scholar] [CrossRef]
- Li, J.; Huang, J.; Yang, M.; Wang, L.; Ma, J. Study on Workability and Early Compression Strength of OPC-SAC Concrete. Constr. Technol. 2017, 46, 69–72+85. (In Chinese) [Google Scholar]
- Huo, G.; Jiang, X.; Sun, X.; Li, H.; Shi, H. Performance of high-belite calcium sulfoaluminate cement subjected to hydrochloric acid and sulfuric acid. Front. Mater. 2024, 10, 1282919. [Google Scholar] [CrossRef]
- Zhang, P.; Li, Y.; Wang, W.; Wen, D.; Xiao, W. Modification of Sulpho—Aluminate Cement and Its Application in Electrical Ceramic Cement Compo. Insul. Surge Arresters 2018, 5, 221–225. (In Chinese) [Google Scholar] [CrossRef]
- Liu, X.C.; Li, Y.J. Research on the Composite Properties of Alite-Sulphoaluminate Cement and Portland Cement. Cement 1998, 2, 11–13. (In Chinese) [Google Scholar]
- Wang, F.S.; Yang, H.Y. Experimental Research on Composite Sulphoaluminate Cement. Shandong Build. Mater. 1997, 6, 6–8. (In Chinese) [Google Scholar]
- Wang, Z.; Lan, W.; Jia, Z.; Lin, M.; Li, D. Research on the Mechanical Properties of Composite Grouting Materials Based on Ordinary Portland–Sulphoaluminate Cement. Buildings 2024, 14, 3492. [Google Scholar] [CrossRef]
- Mehta, P.K.; Klein, A. Investigations on the Hydration Products in the System 4 CAO-3AL203-SO3-CASO4-CAO-H20; Highway Research Board Special Report; The National Academies of Sciences, Engineering, and Medicine: Washington, DC, USA, 1966. [Google Scholar]
- Gastaldi, D.; Bertola, F.; Irico, S.; Paul, G.; Canonico, F. Hydration behavior of cements with reduced clinker factor in mixture with sulfoaluminate binder. Cem. Concr. Res. 2021, 139, 106261. [Google Scholar] [CrossRef]
- Bertola, F.; Gastaldi, D.; Irico, S.; Paul, G.; Canonico, F. Influence of the amount of calcium sulfate on physical/mineralogical properties and carbonation resistance of CSA-based cements. Cem. Concr. Res. 2022, 151, 106634. [Google Scholar] [CrossRef]
- Gastaldi, D.; Canonico, F.; Capelli, L.; Bianchi, M.; Telesca, A.; Valenti, G.L. Hydraulic behaviour of calcium sulfoaluminate cement alone and in mixture with Portland cement. In Proceedings of the 13th International Congress on the Chemistry of Cement, Madrid, Spain, 8 July 2011. [Google Scholar]
- Marchi, M.; Costa, U. Influence of the calcium sulphate and w/c ratio on the hydration of calcium sulfoaluminate cement. In Proceedings of the 13th International Congress on the Chemistry of Cement, Madrid, Spain, 3–8 July 2011. [Google Scholar]
- Kuzel, H.-J. Initial hydration reactions and mechanisms of delayed ettringite formation in portland cements. Cem. Concr. Compos. 1996, 18, 195–203. [Google Scholar] [CrossRef]
- Cui, H.; Wang, C.; Zhang, G.; Zhang, K.; Fu, X.; Bai, Y.; Zheng, Y.; Qi, Y.; Liu, Z. Preparation and hydration mechanism of composite cementitious materials based on iron and steel solid waste. Alex. Eng. J. 2024, 103, 343–352. [Google Scholar] [CrossRef]
- Chang, J.; Zhang, Y.; Shang, X.; Zhao, J.; Yu, X. Effects of amorphous AH3 phase on mechanical properties and hydration process of C4A3S¯-CS¯H2-CH-H2O system. Constr. Build. Mater. 2017, 133, 314–322. [Google Scholar] [CrossRef]
- Pelletier, L.; Winnefeld, F.; Lothenbach, B. The ternary system portland cement–calcium sulphoaluminate clinker–anhydrite: Hydration mechanism and mortar properties. Cem. Concr. Compos. 2010, 32, 497–507. [Google Scholar] [CrossRef]
- Trauchessec, R.; Mechling, J.-M.; Lecomte, A.; Roux, A.; Le Rolland, B. Hydration of ordinary portland cement and calcium sulfoaluminate cement blends. Cem. Concr. Compos. 2015, 56, 106–114. [Google Scholar] [CrossRef]
- Zhang, J.; Li, G.; Ye, W.; Chang, Y.; Liu, Q.; Song, Z. Effects of ordinary portland cement on the early properties and hydration of calcium sulfoaluminate cement. Constr. Build. Mater. 2018, 186, 1144–1153. [Google Scholar] [CrossRef]
- Kondo, R.; Kodama, M. On the hydration kinetics of cement. Semento Gijutsu Nenpo 1967, 21, 77–82. [Google Scholar]
- Johnson, W.A. Reaction kinetics in process of nucleation and growth. Trans. Trans. Am. Inst. Min. Metall. Eng. 1939, 135, 416–458. [Google Scholar]
- Krstulović, R.; Dabić, P. A conceptual model of the cement hydration process. Cem. Concr. Res. 2000, 30, 693–698. [Google Scholar] [CrossRef]
- Zhang, J.; Wang, X.; Jin, B.; Zhang, X.; Li, Z.; Guan, X. Effect of superplasticizers on hydration kinetics of ultrafine sulfoaluminate cement-based grouting material. Thermochim. Acta 2021, 703, 178988. [Google Scholar] [CrossRef]
- Iqbal, M.A.; Sahar, U.U.; Bahrami, A.; Yaseen, N.; Siddique, I. Development of Sugarcane Bagasse Ash Blended Cementitious Composites Reinforced with Carbon Nanotubes and Polypropylene Fibers. J. Compos. Sci. 2024, 8, 94. [Google Scholar] [CrossRef]
- Meng, T.; Hong, Y.; Wei, H.; Xu, Q. Effect of nano-SiO2 with different particle size on the hydration kinetics of cement. Thermochim. Acta 2019, 675, 127–133. [Google Scholar] [CrossRef]
- Li, Y.; Guo, Y.; Lyu, Z.; Wei, X. Investigation of the effect of waterborne epoxy resins on the hydration kinetics and performance of cement blends. Constr. Build. Mater. 2021, 301, 124045. [Google Scholar] [CrossRef]
- Yang, M.; Chen, L.; Lai, J.; Osman, A.I.; Farghali, M.; Rooney, D.W.; Yap, P.-S. Advancing environmental sustainability in construction through innovative low-carbon, high-performance cement-based composites: A review. Mater. Today Sustain. 2024, 26, 100712. [Google Scholar] [CrossRef]
- Zhang, G.; Xia, H.; Wang, H.; Song, L.; Niu, Y.; Cao, D.; Chen, H. Early hydration characteristics and kinetics model of cement pastes containing internal curing materials with different absorption behaviors. Constr. Build. Mater. 2023, 383, 131412. [Google Scholar] [CrossRef]
- Knudsen, T. On particle size distribution in cement hydration. In Proceedings of the International Congress on the Chemistry of Cement Paris; Editions Septima: Paris, France, 1980; pp. 1–170. [Google Scholar]
- Martinelli, E.; Koenders, E.A.B.; Caggiano, A. A numerical recipe for modelling hydration and heat flow in hardening concrete. Cem. Concr. Compos. 2013, 40, 48–58. [Google Scholar] [CrossRef]
- Pepe, M.; Lima, C.; Martinelli, E. Early-age properties of concrete based on numerical hydration modelling: A parametric analysis. Materials 2020, 13, 2112. [Google Scholar] [CrossRef]
- Allen, A.J.; Thomas, J.J. Analysis of C–S–H gel and cement paste by small-angle neutron scattering. Cem. Concr. Res. 2007, 37, 319–324. [Google Scholar] [CrossRef]
- Li, D.D. Infrared spectroscopic study of sulfoaluminate cement. J. Chin. Ceram. Soc. 1984, 12, 119–125. [Google Scholar]
- Pelletier-Chaignat, L.; Winnefeld, F.; Lothenbach, B.; Müller, C.J. Beneficial use of limestone filler with calcium sulphoaluminate cement. Constr. Build. Mater. 2012, 26, 619–627. [Google Scholar] [CrossRef]
- Zajac, M.; Hoock, S.; Stabler, C.; Haha, M.B. Effect of hydration kinetics on properties of compositionally similar binders. Cem. Concr. Res. 2017, 101, 13–24. [Google Scholar] [CrossRef]
- Li, G.; He, T.; Hu, D.; Shi, C. Effects of two retarders on the fluidity of pastes plasticized with aminosulfonic acid-based superplasticizers. Constr. Build. Mater. 2012, 26, 72–78. [Google Scholar] [CrossRef]
- Scrivener, K.; Ouzia, A.; Juilland, P.; Mohamed, A.K. Advances in understanding cement hydration mechanisms. Cem. Concr. Res. 2019, 124, 105823. [Google Scholar] [CrossRef]
- Goetz-Neunhoeffer, F.; Neubauer, J.; Schwesig, P. Mineralogical characteristics of ettringites synthesized from solutions and suspensions. Cem. Concr. Res. 2006, 36, 65–70. [Google Scholar] [CrossRef]
- Chen, I.A.; Hargis, C.W.; Juenger, M.C.G. Understanding expansion in calcium sulfoaluminate–belite cements. Cem. Concr. Res. 2012, 42, 51–60. [Google Scholar] [CrossRef]
- Zhang, Y.; Wang, S.; He, S.; Hao, X. Analysis of factors influencing the temperature field variation in mass concrete during hydration heat release. Case Stud. Therm. Eng. 2023, 52, 103737. [Google Scholar] [CrossRef]
- Li, P.; Gao, X.; Wang, K.; Tam, V.W.Y.; Li, W. Hydration mechanism and early frost resistance of calcium sulfoaluminate cement concrete. Constr. Build. Mater. 2020, 239, 117862. [Google Scholar] [CrossRef]
- Li, P.; Li, W.; Yu, T.; Qu, F.; Tam, V.W.Y. Investigation on early-age hydration, mechanical properties and microstructure of seawater sea sand cement mortar. Constr. Build. Mater. 2020, 249, 118776. [Google Scholar] [CrossRef]
- Gomes, S.D.C.; Zhou, J.L.; Li, W.; Qu, F. Recycling of raw water treatment sludge in cementitious composites: Effects on heat evolution, compressive strength and microstructure. Resour. Conserv. Recycl. 2020, 161, 104970. [Google Scholar] [CrossRef]
- Odler, I.; Colán-Subauste, J. Investigations on cement expansion associated with ettringite formation. Cem. Concr. Res. 1999, 29, 731–735. [Google Scholar] [CrossRef]


| Cement | SiO2 (%) | Al2O3 (%) | Fe2O3 (%) | CaO (%) | MgO (%) | SO3 (%) | Others (%) |
|---|---|---|---|---|---|---|---|
| OPC | 18.60 | 5.40 | 2.80 | 59.50 | 2.90 | 4.80 | 6.00 |
| CSA | 11.59 | 27.67 | 1.58 | 45.43 | 2.52 | 8.70 | 2.51 |
| Series | Number | CSA | OPC | Water | Reducer |
|---|---|---|---|---|---|
| P | P-00 | 0 | 1500 | 450 | 3 |
| P-10 | 150 | 1350 | 450 | 3 | |
| P-20 | 300 | 1200 | 450 | 3 | |
| S | S-80 | 1200 | 300 | 450 | 3 |
| S-90 | 1350 | 150 | 450 | 3 | |
| S-100 | 1500 | 0 | 450 | 3 |
| Object | Method | Property | Parameters |
|---|---|---|---|
| Fresh paste | Isothermal calories calorimetry | Hydration heat | Heat flow and cumulative heat |
| Hydration product | FT-IR, XRD, TG | Composition, phase, content | / |
| Hardened paste | MIP | Pore structure | Pore size distribution, total pore volume |
| Hydration kinetics | Krstulović–Dabić model | Hydration mechanism | |
| Hardened paste | SEM | Microstructure analysis and elemental distribution | / |
| Hardened paste | EDS | Atomic ratio of Al and S to Si | Atomic concentration percentage of Al, S, Si |
| Area | Number | Weight Loss/wt% | Content of Products/wt% | |||||
|---|---|---|---|---|---|---|---|---|
| AFt | AH3 | Ca(OH)2 | AFm | AFt | AH3 | Ca(OH)2 | ||
| P | P-00 | 4.47 | - | 3.08 | 2.64 | 12.76 | - | 12.65 |
| P-10 | 4.79 | - | 2.35 | 3.19 | 13.67 | - | 9.68 | |
| P-20 | 4.99 | - | 0.78 | 2.95 | 14.26 | - | 3.19 | |
| S | S-80 | 8.67 | 1.3 | - | 3.64 | 24.78 | 3.75 | - |
| S-90 | 8.36 | 1.36 | - | 3.27 | 23.89 | 3.93 | - | |
| S-100 | 8.52 | 1.36 | - | - | 24.36 | 3.93 | - | |
| Area | Number | Knudsen Equations | r2 | Qmax |
|---|---|---|---|---|
| P | P-00 | 1/Q = 0.00843 + 0.0169/(t − t0) | 0.99872 | 118.62 |
| P-10 | 1/Q = 0.00518 + 0.00387/(t − t0) | 0.99833 | 193.05 | |
| P-20 | 1/Q = 0.00634 + 0.00679/(t − t0) | 0.99943 | 157.73 | |
| S | S-80 | 1/Q = 0.0097 + 0.03779/(t − t0) | 0.99100 | 103.09 |
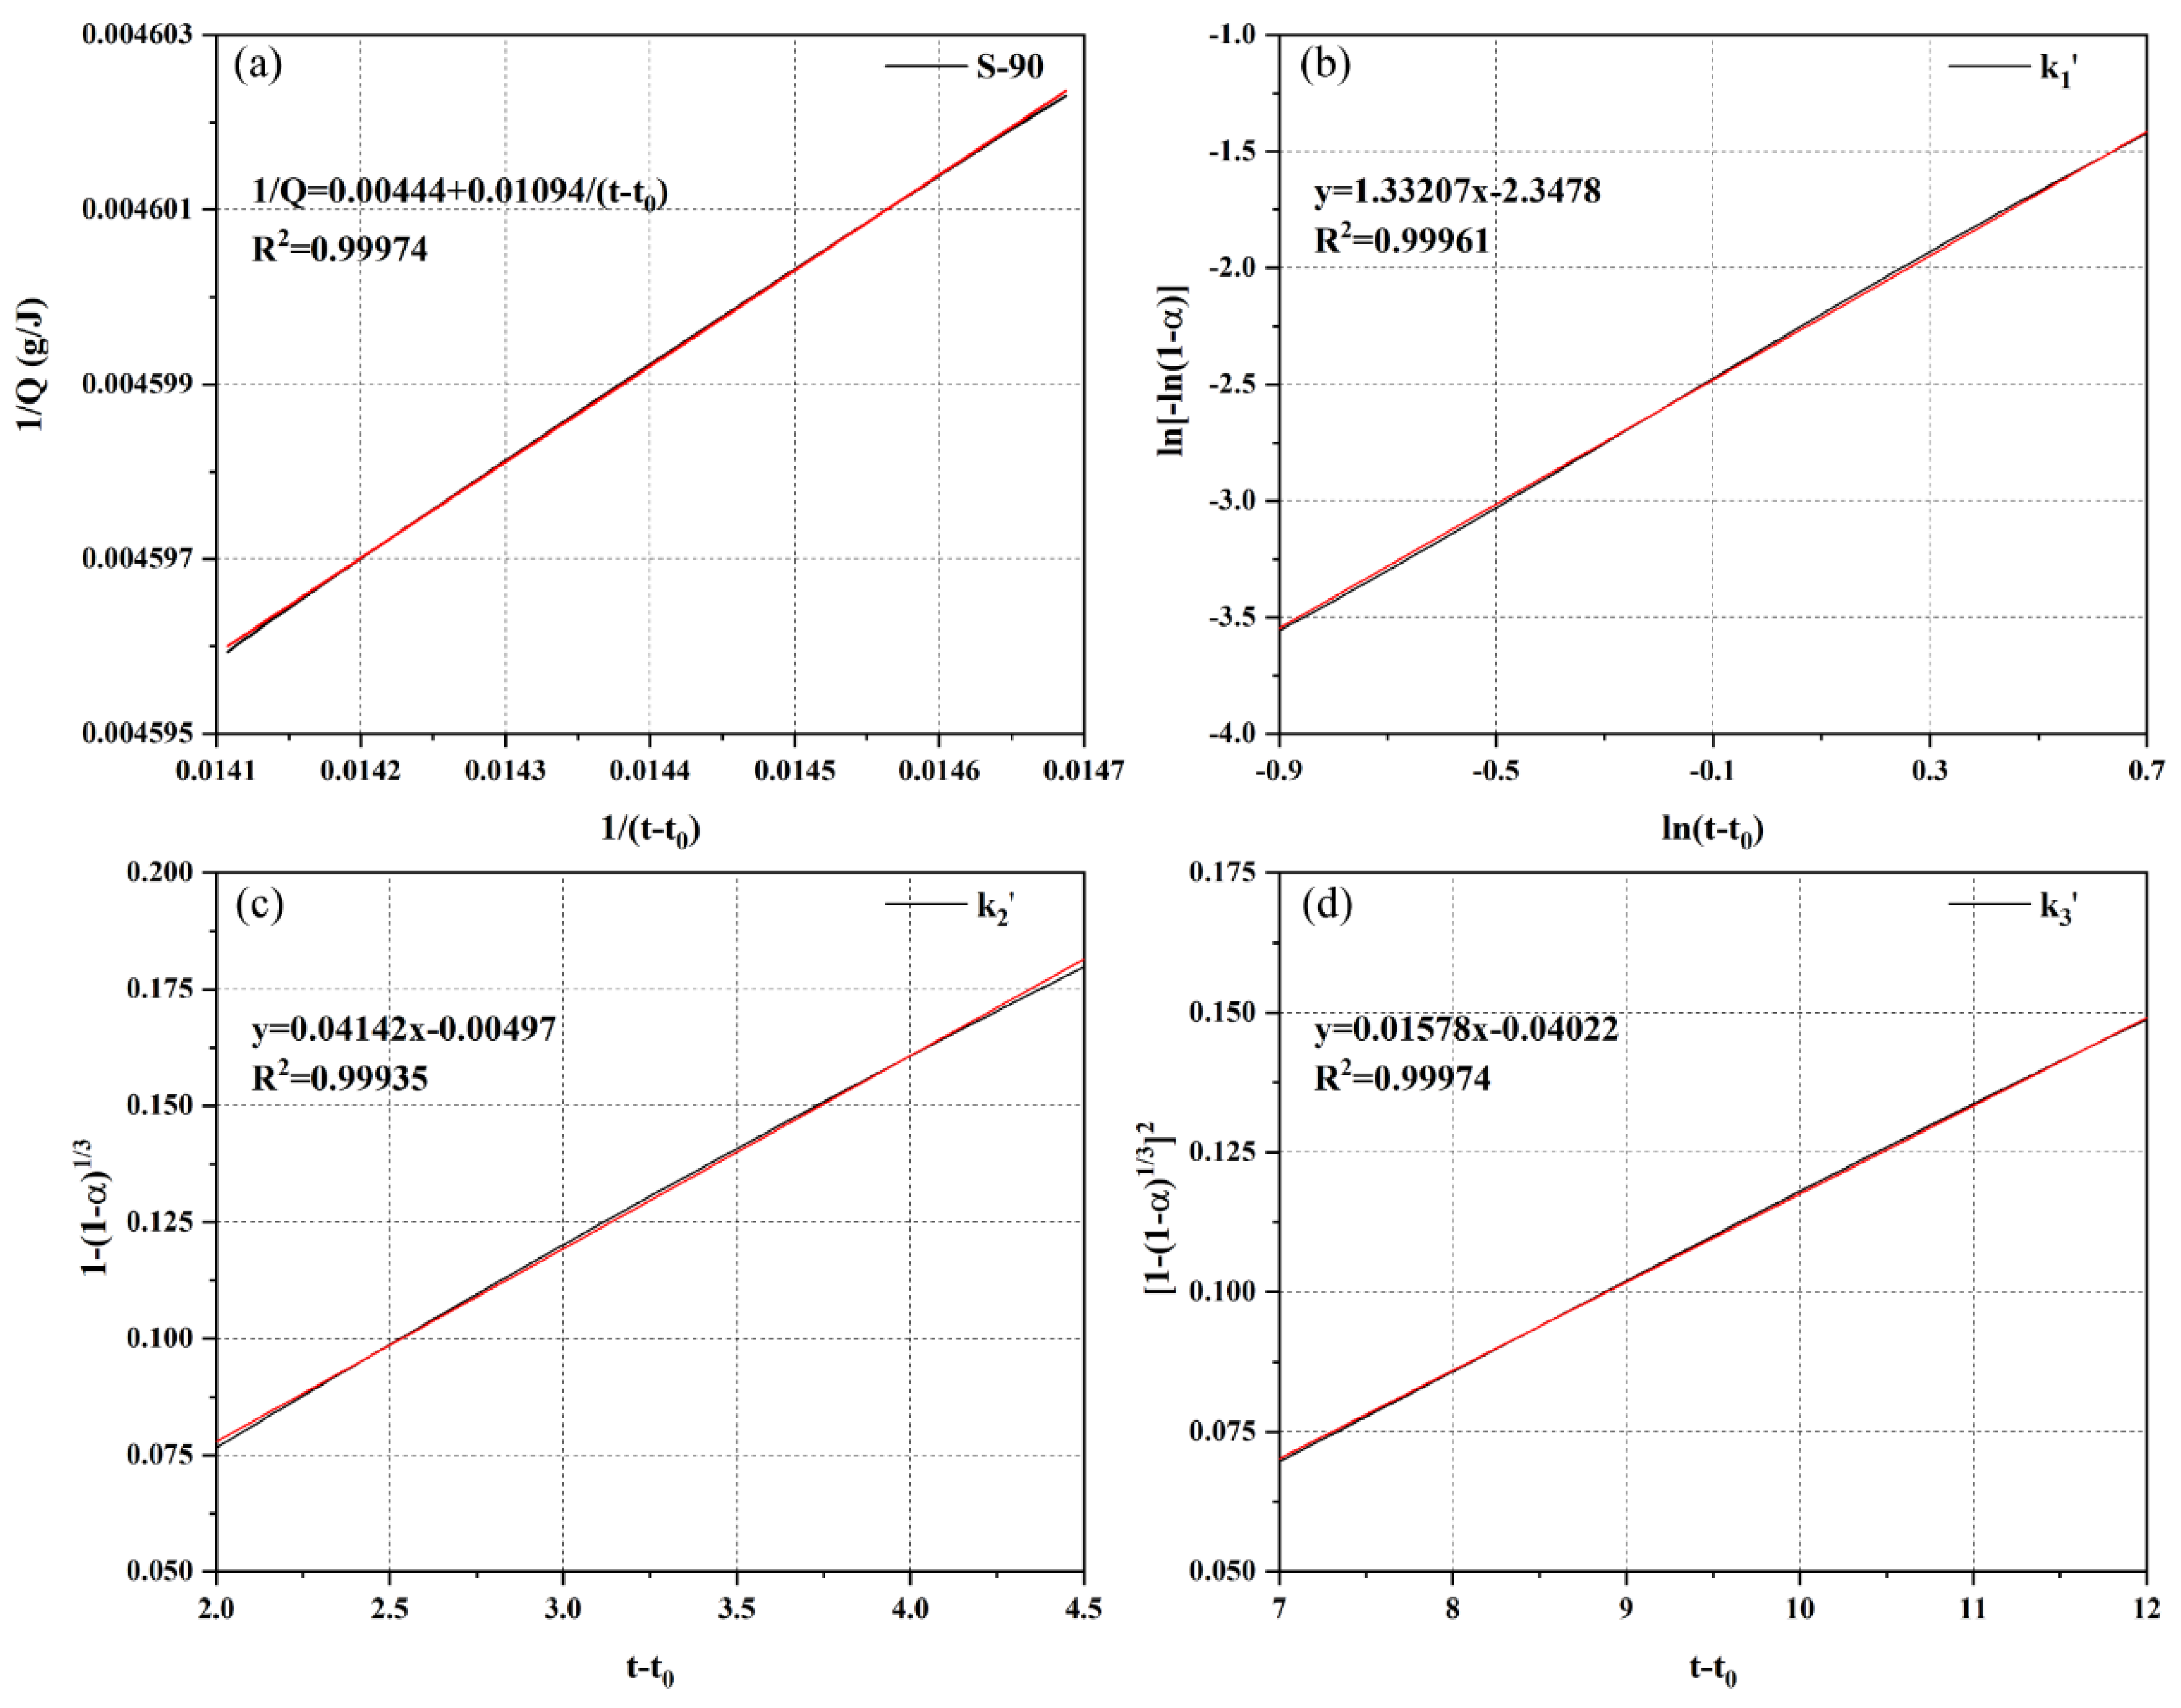
| S-90 | 1/Q = 0.00444 + 0.01094/(t − t0) | 0.99974 | 225.23 | |
| S-100 | 1/Q = 0.00773 + 0.00918/(t − t0) | 0.99887 | 129.37 |
| Area | Number | n | α1 | α2 | α2 − α1 | |||
|---|---|---|---|---|---|---|---|---|
| P | P-00 | 3.3750 | 0.08825 | 0.04620 | 0.01851 | 0.33593 | 0.48862 | 0.15269 |
| P-10 | 2.7286 | 0.10768 | 0.04777 | 0.02551 | 0.32749 | 0.60618 | 0.27869 | |
| P-20 | 1.9055 | 0.09705 | 0.04633 | 0.02548 | 0.36307 | 0.53265 | 0.16958 | |
| S | S-80 | 1.5165 | 0.25515 | 0.06224 | 0.02474 | 0.20380 | 0.43077 | 0.22697 |
| S-90 | 1.3321 | 0.17161 | 0.04142 | 0.01578 | 0.07655 | 0.48761 | 0.41106 | |
| S-100 | 1.5860 | 0.27774 | 0.06751 | 0.03316 | 0.12919 | 0.57065 | 0.44146 |
Disclaimer/Publisher’s Note: The statements, opinions and data contained in all publications are solely those of the individual author(s) and contributor(s) and not of MDPI and/or the editor(s). MDPI and/or the editor(s) disclaim responsibility for any injury to people or property resulting from any ideas, methods, instructions or products referred to in the content. |
© 2025 by the authors. Licensee MDPI, Basel, Switzerland. This article is an open access article distributed under the terms and conditions of the Creative Commons Attribution (CC BY) license (https://creativecommons.org/licenses/by/4.0/).
Share and Cite
Chen, J.; Xie, B.; Lu, Z.; He, S.; Ma, S. Early Hydration Characteristics and Kinetics Model of Ordinary Portland Cement-Calcium Sulfoaluminate Cement Composites. Materials 2025, 18, 2559. https://doi.org/10.3390/ma18112559
Chen J, Xie B, Lu Z, He S, Ma S. Early Hydration Characteristics and Kinetics Model of Ordinary Portland Cement-Calcium Sulfoaluminate Cement Composites. Materials. 2025; 18(11):2559. https://doi.org/10.3390/ma18112559
Chicago/Turabian StyleChen, Jincai, Bo Xie, Zhongyu Lu, Shaohua He, and Shuqian Ma. 2025. "Early Hydration Characteristics and Kinetics Model of Ordinary Portland Cement-Calcium Sulfoaluminate Cement Composites" Materials 18, no. 11: 2559. https://doi.org/10.3390/ma18112559
APA StyleChen, J., Xie, B., Lu, Z., He, S., & Ma, S. (2025). Early Hydration Characteristics and Kinetics Model of Ordinary Portland Cement-Calcium Sulfoaluminate Cement Composites. Materials, 18(11), 2559. https://doi.org/10.3390/ma18112559